Embed Size (px)
Citation preview

11/8/07 1
Topology-Based Parameter Identification forDecoupling Material Structure-Process-Property
Relationships
Ian Tolle1,3,Xinqun Huang1,3, Yvonne A. Akpalu2,3, Lealon Martin1,3
11/8/07
1) Department of Chemical and Biological Engineering, Rensselaer Polytechnic Institute
2) Department of Chemistry and Chemical Biology, Rensselaer Polytechnic Institute
3) Rensselaer Nanotechnology Center
11/8/07 2
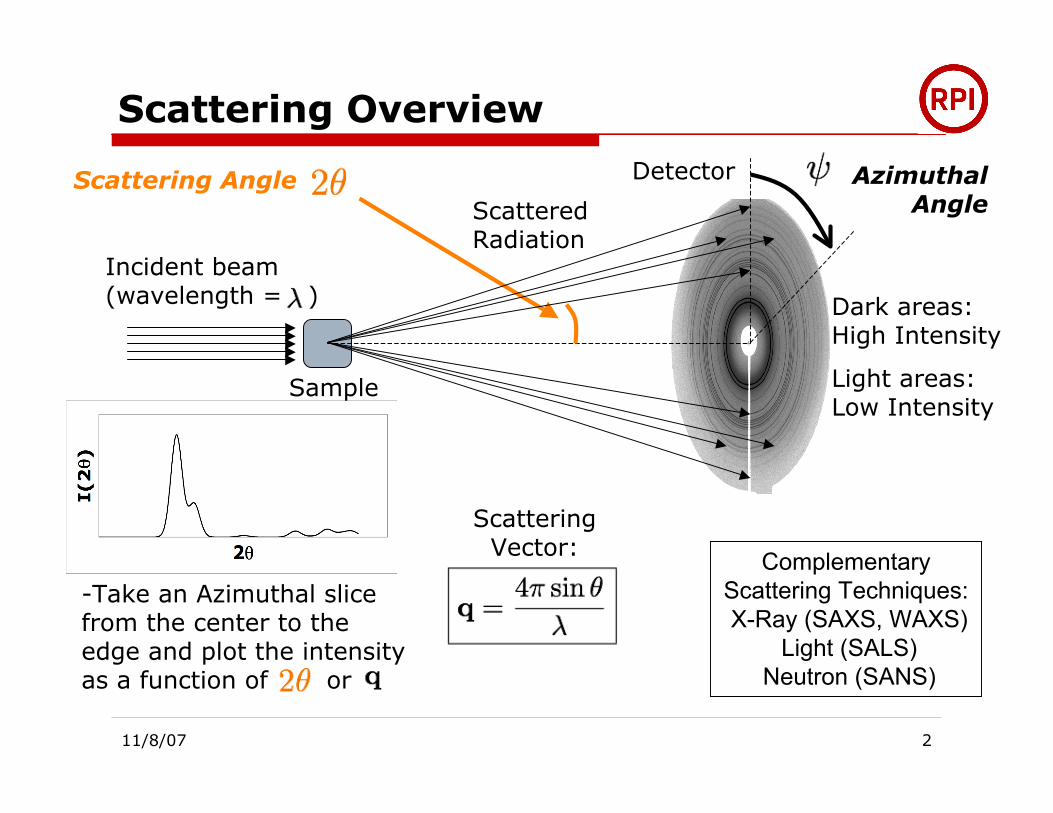
Scattering Overview
Incident beam(wavelength = )
Sample
ScatteredRadiation
DetectorScattering Angle AzimuthalAngle
Dark areas:High Intensity
Light areas:Low Intensity
-Take an Azimuthal slicefrom the center to theedge and plot the intensityas a function of or
ScatteringVector: Complementary
Scattering Techniques: X-Ray (SAXS, WAXS)
Light (SALS) Neutron (SANS)
11/8/07 3
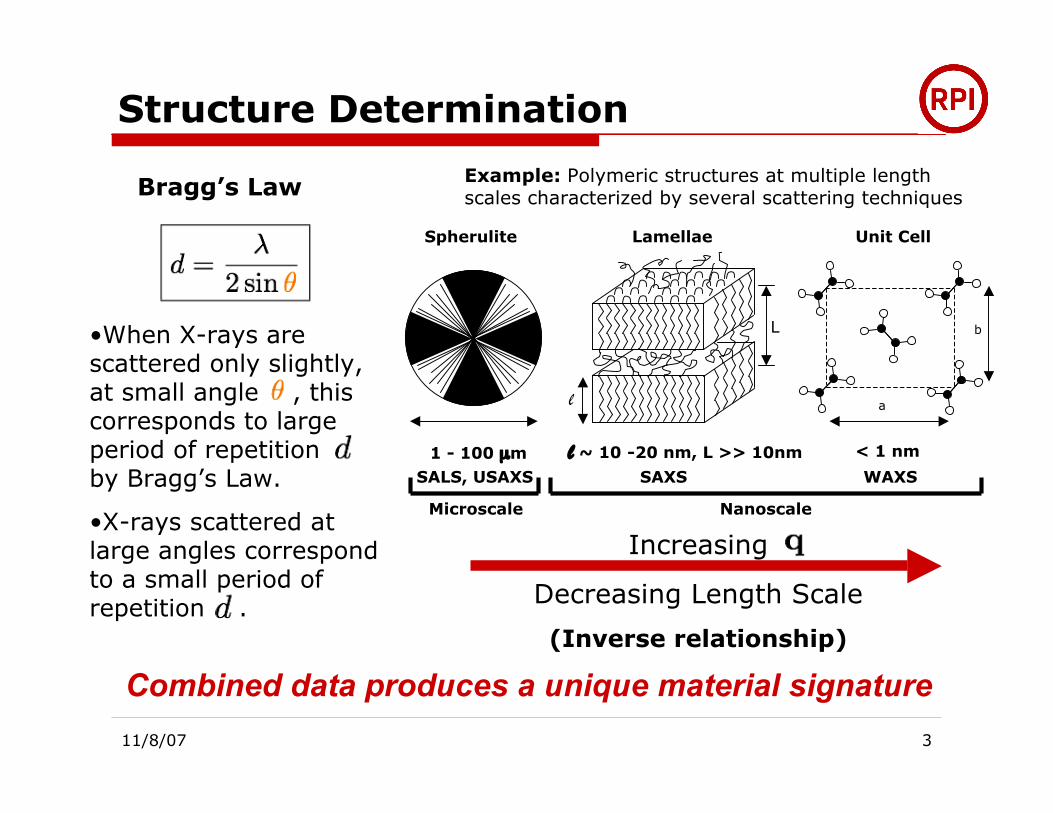
Structure Determination
•When X-rays arescattered only slightly,at small angle , thiscorresponds to largeperiod of repetitionby Bragg’s Law.
•X-rays scattered atlarge angles correspondto a small period ofrepetition .
Example: Polymeric structures at multiple lengthscales characterized by several scattering techniquesBragg’s Law
Increasing
Decreasing Length Scale
(Inverse relationship)
Combined data produces a unique material signature
< 1 nm1 - 100 µm
Spherulite Lamellae Unit Cell
L
l
l ~ 10 -20 nm, L >> 10nm
a
b
SALS, USAXS SAXS WAXS
Microscale Nanoscale
11/8/07 4
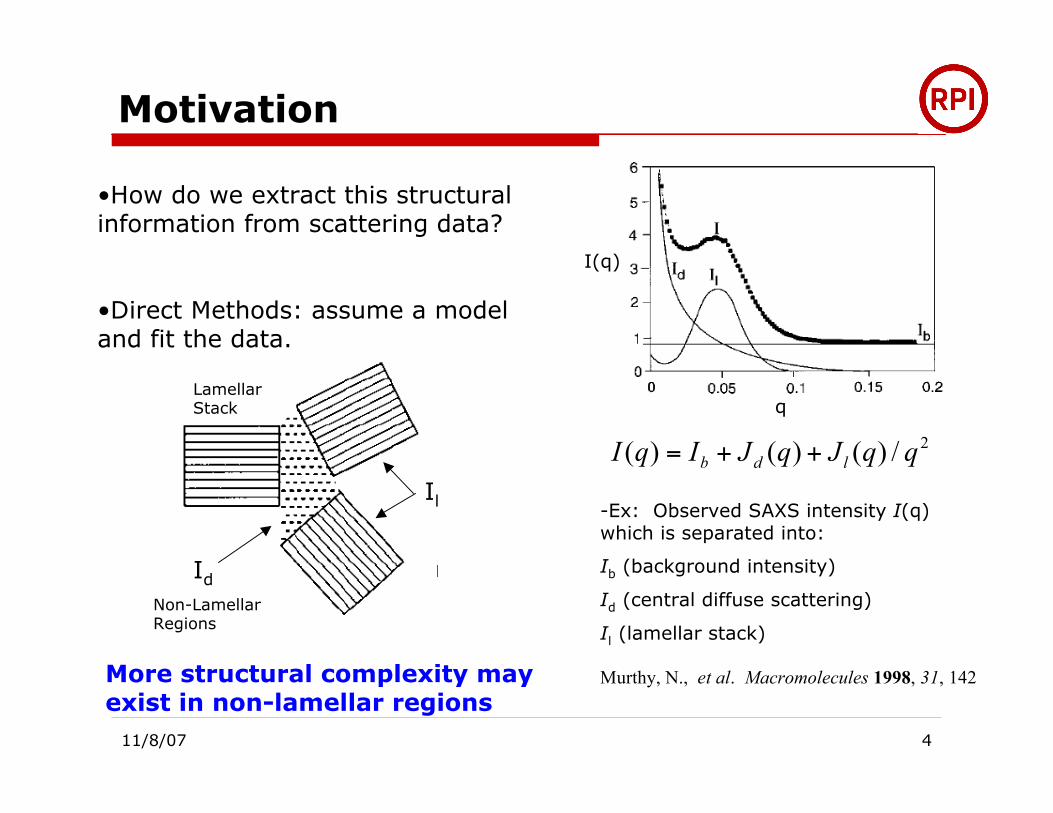
Motivation
q
I(q)
•How do we extract this structuralinformation from scattering data?
•Direct Methods: assume a modeland fit the data.
-Ex: Observed SAXS intensity I(q)which is separated into:
Ib (background intensity)
Id (central diffuse scattering)
Il (lamellar stack)
2/)()()( qqJqJIqI ldb ++=
More structural complexity mayexist in non-lamellar regions
IlId
LamellarStack
Non-LamellarRegions
Il
Murthy, N., et al. Macromolecules 1998, 31, 142
11/8/07 5
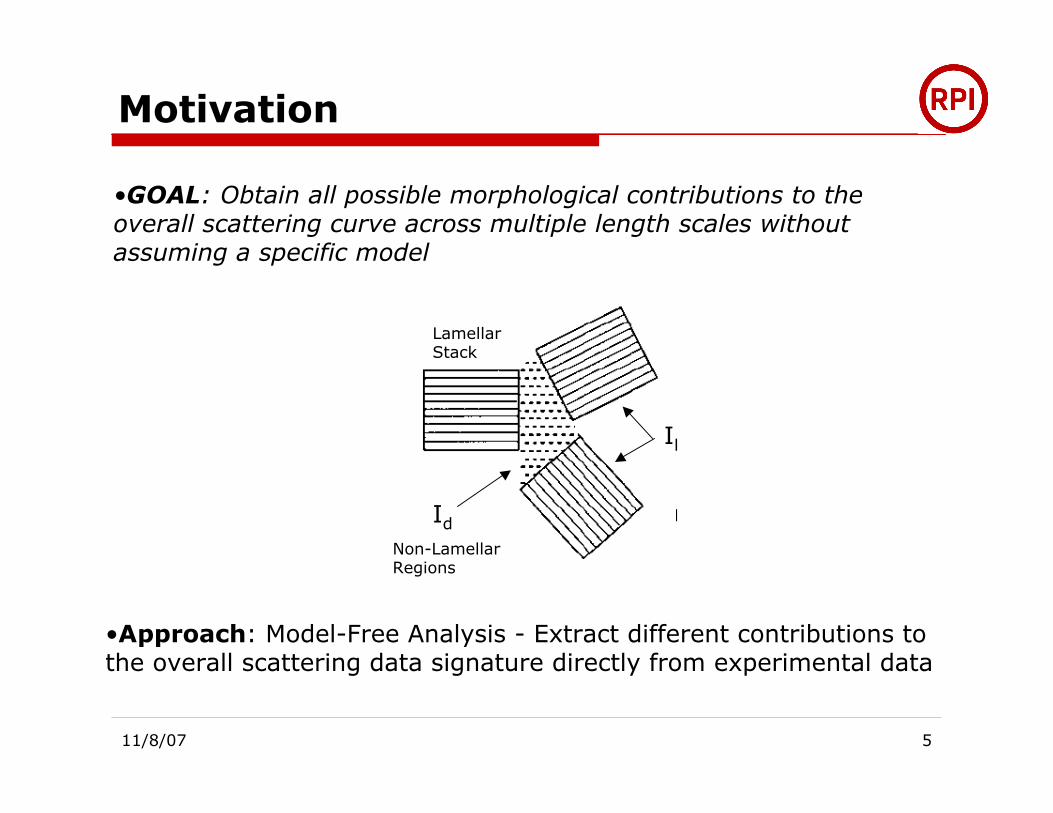
Motivation
•GOAL: Obtain all possible morphological contributions to theoverall scattering curve across multiple length scales withoutassuming a specific model
•Approach: Model-Free Analysis - Extract different contributions tothe overall scattering data signature directly from experimental data
IlId
LamellarStack
Non-LamellarRegions
Il
11/8/07 6
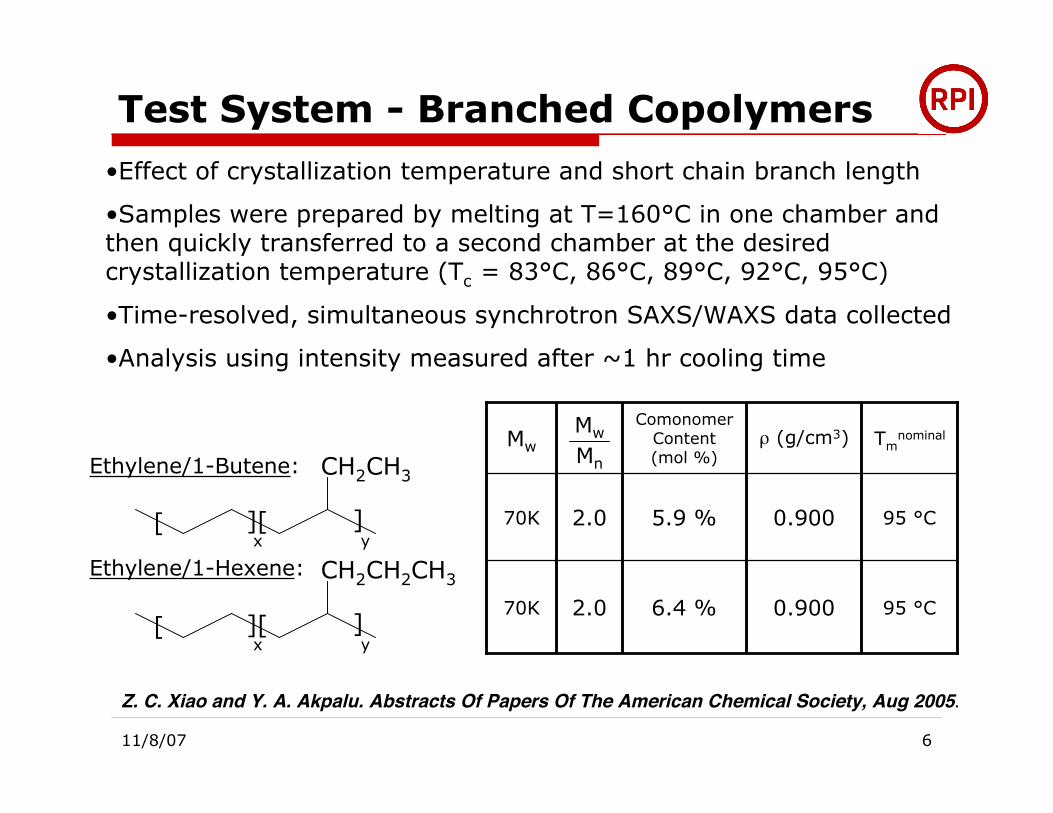
Test System - Branched Copolymers
Ethylene/1-Butene:
Ethylene/1-Hexene:
•Effect of crystallization temperature and short chain branch length
•Samples were prepared by melting at T=160°C in one chamber andthen quickly transferred to a second chamber at the desiredcrystallization temperature (Tc = 83°C, 86°C, 89°C, 92°C, 95°C)
•Time-resolved, simultaneous synchrotron SAXS/WAXS data collected
•Analysis using intensity measured after ~1 hr cooling time
Z. C. Xiao and Y. A. Akpalu. Abstracts Of Papers Of The American Chemical Society, Aug 2005.
70K
70K
Mw
2.0
2.0
Mw
Mn
6.4 %
5.9 %
ComonomerContent(mol %)
0.900
0.900
ρ (g/cm3)
95 °C
95 °C
Tmnominal
CH2CH3
[ ][ ]x y
CH2CH2CH3
[ ][ ]x y
11/8/07 7
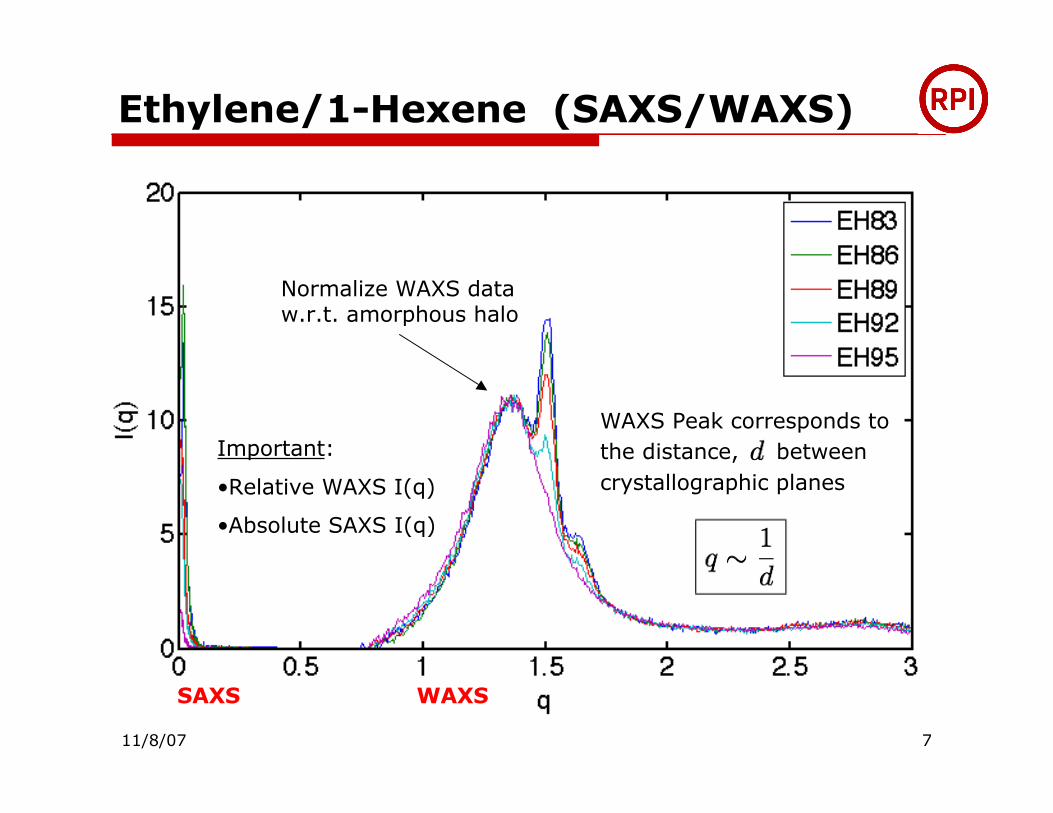
Ethylene/1-Hexene (SAXS/WAXS)
Normalize WAXS dataw.r.t. amorphous halo
SAXS WAXS
Important:
•Relative WAXS I(q)
•Absolute SAXS I(q)
WAXS Peak corresponds tothe distance, betweencrystallographic planes
11/8/07 8
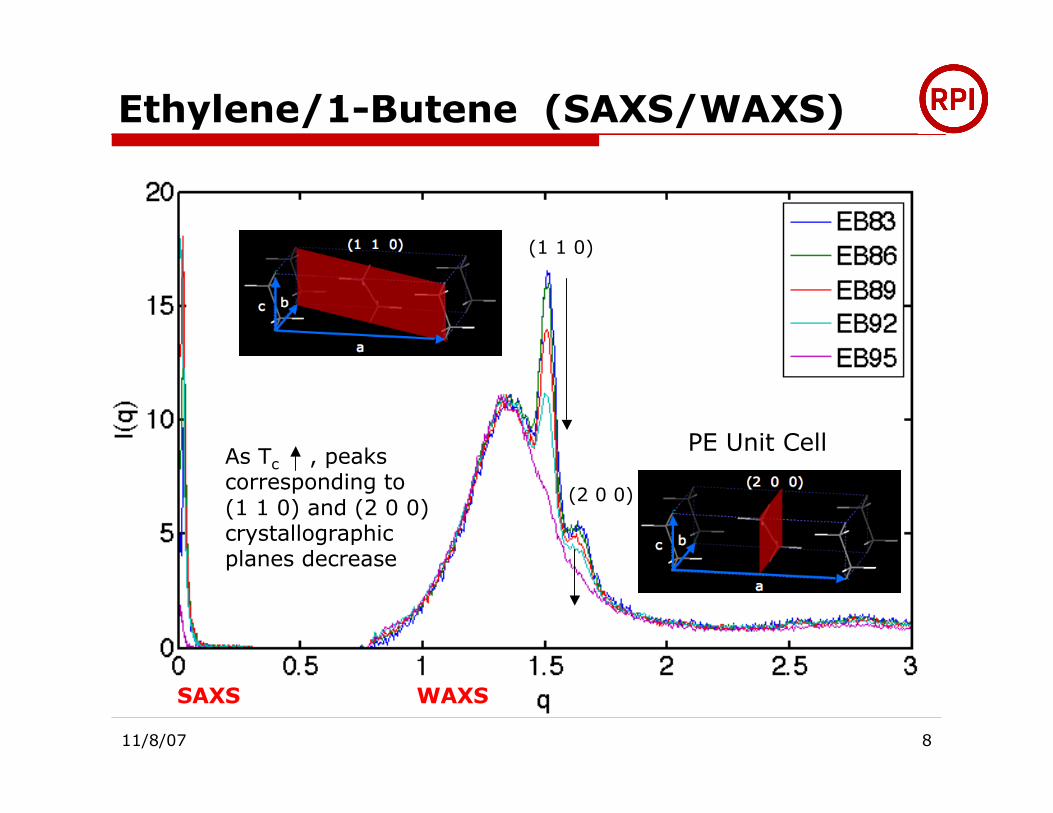
Ethylene/1-Butene (SAXS/WAXS)
As Tc , peakscorresponding to(1 1 0) and (2 0 0)crystallographicplanes decrease
(1 1 0)
(2 0 0)
SAXS WAXS
PE Unit Cell
11/8/07 9
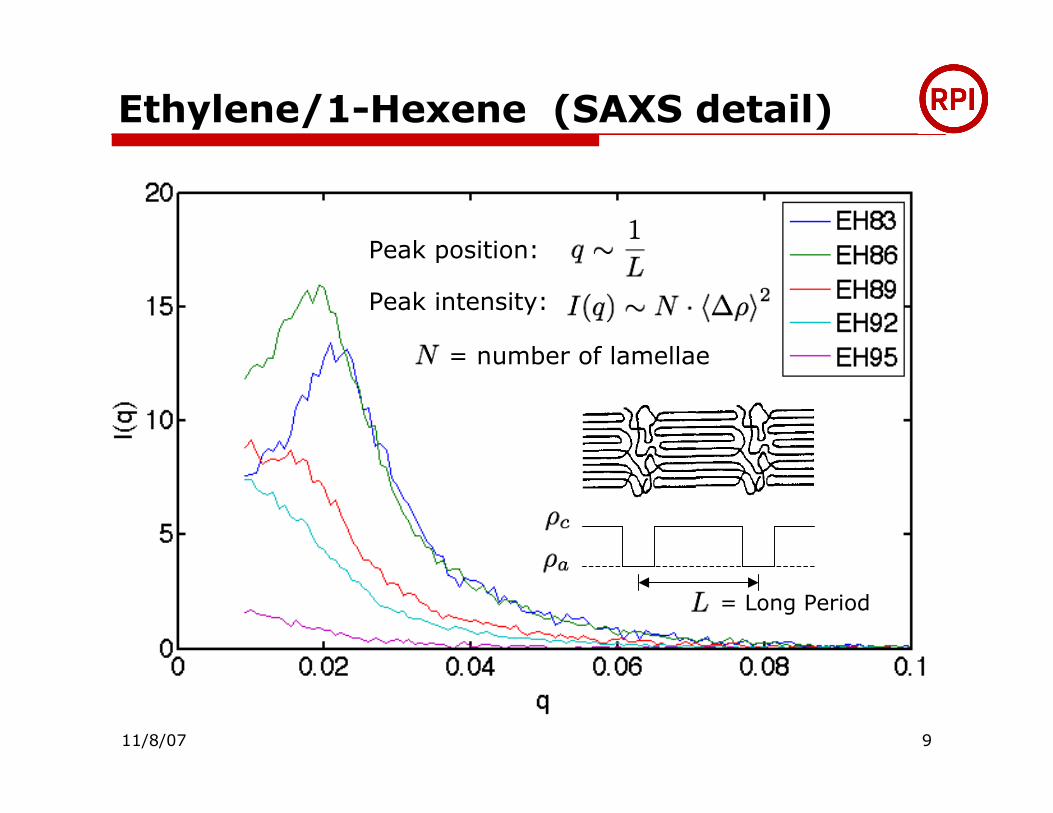
Ethylene/1-Hexene (SAXS detail)
Peak position:
Peak intensity:
= number of lamellae
= Long Period
11/8/07 10
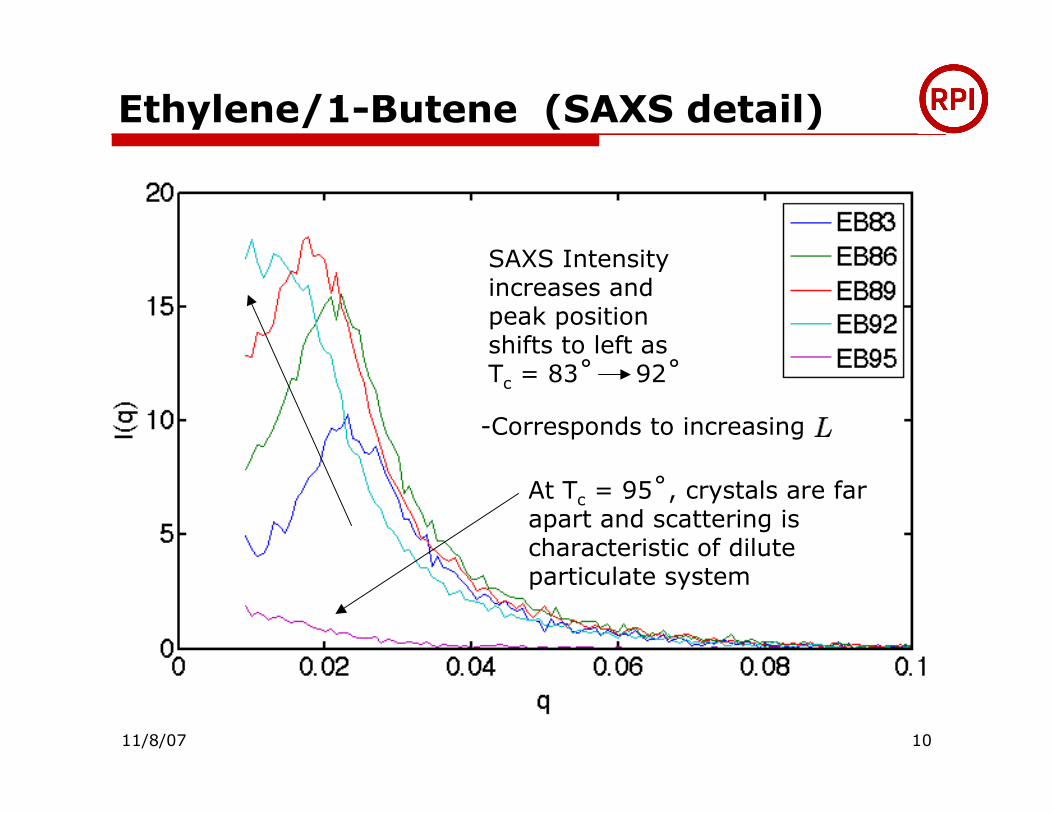
Ethylene/1-Butene (SAXS detail)
SAXS Intensityincreases andpeak positionshifts to left asTc = 83˚ 92˚
At Tc = 95˚, crystals are farapart and scattering ischaracteristic of diluteparticulate system
-Corresponds to increasing
11/8/07 11
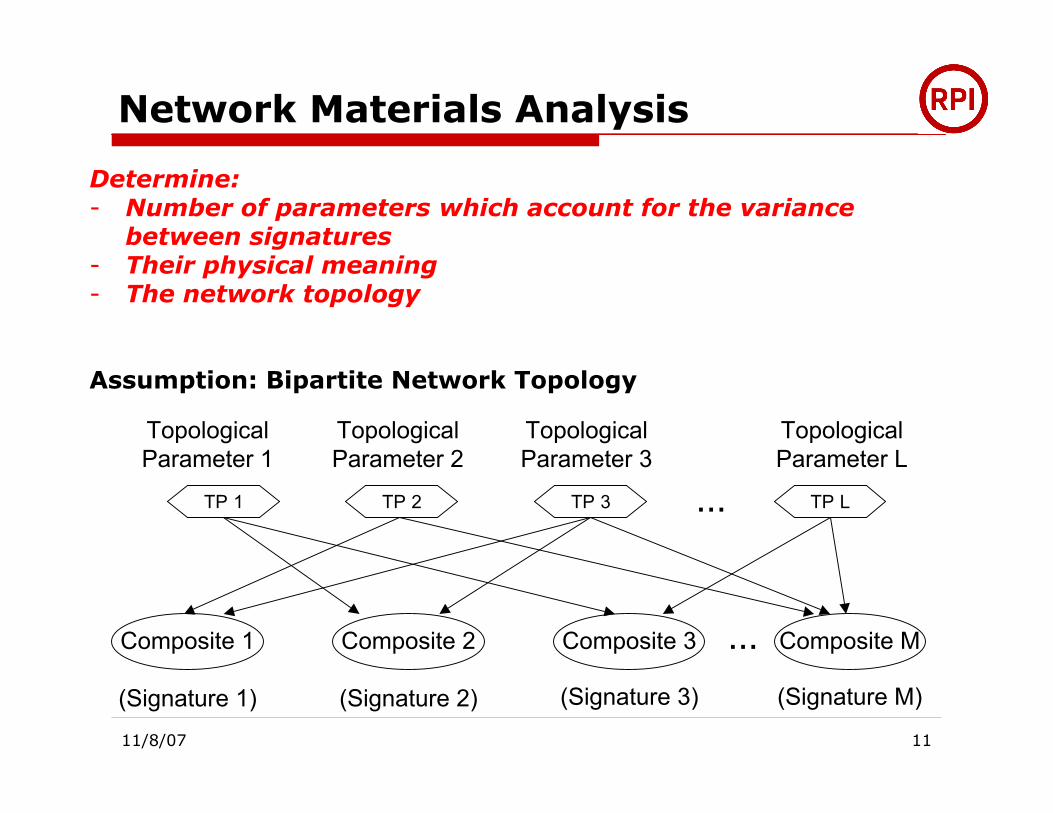
Network Materials Analysis
Determine:- Number of parameters which account for the variance
between signatures- Their physical meaning- The network topology
Assumption: Bipartite Network Topology
Composite 1 Composite 2 Composite 3 Composite M
(Signature 1) (Signature 2) (Signature 3) (Signature M)
TopologicalParameter 1
TopologicalParameter 2
TopologicalParameter 3
TopologicalParameter L
TP 1 TP 2 TP 3 TP L…
…
11/8/07 12
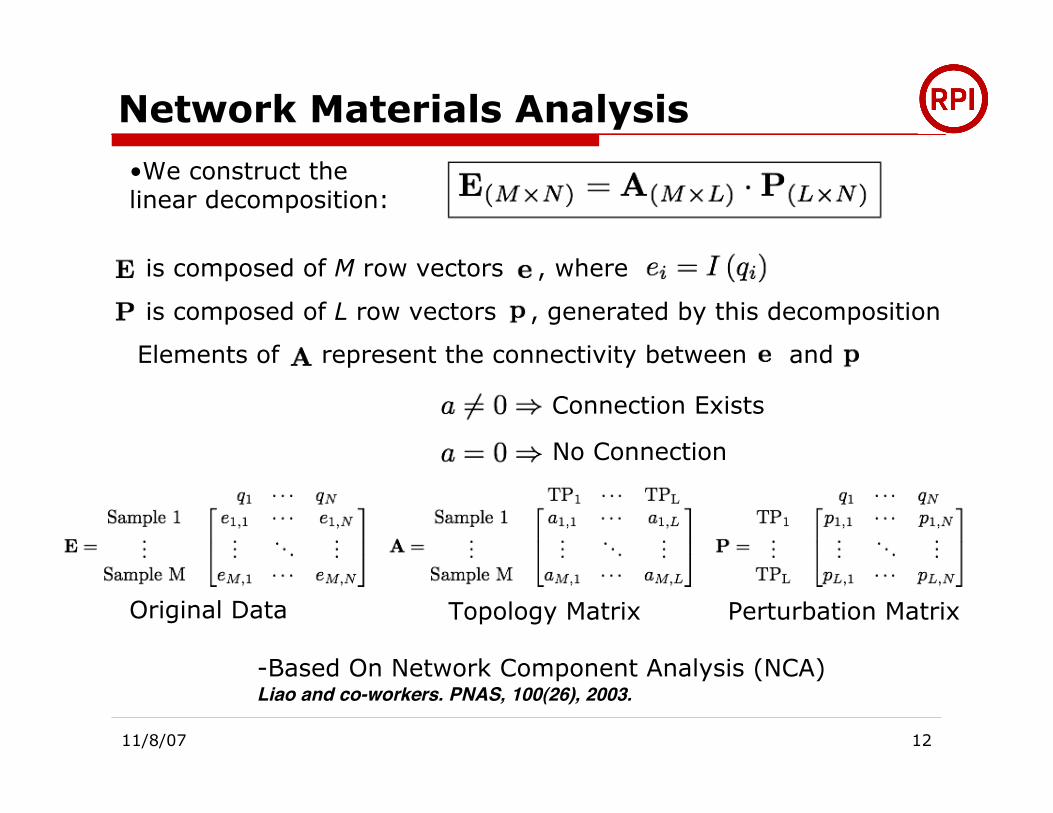
Network Materials Analysis
Topology Matrix Perturbation MatrixOriginal Data
•We construct thelinear decomposition:
is composed of M row vectors , where
is composed of L row vectors , generated by this decomposition
Elements of represent the connectivity between and
Connection Exists
No Connection
-Based On Network Component Analysis (NCA)Liao and co-workers. PNAS, 100(26), 2003.
11/8/07 13
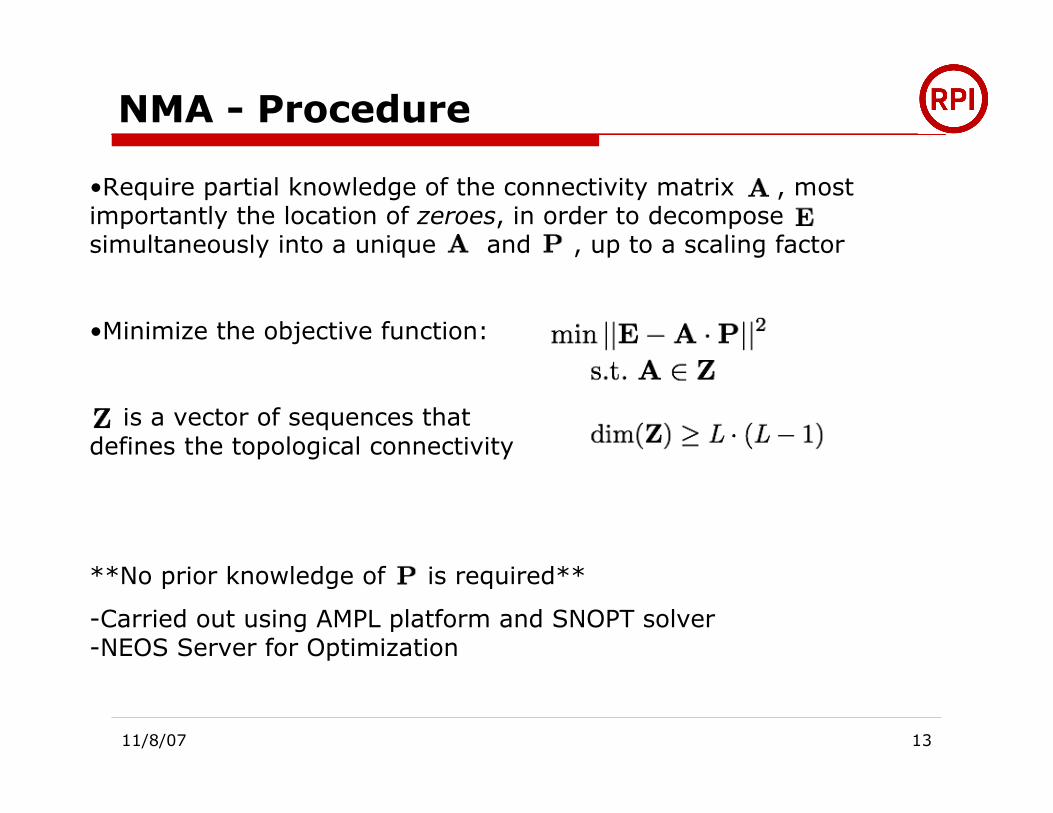
NMA - Procedure
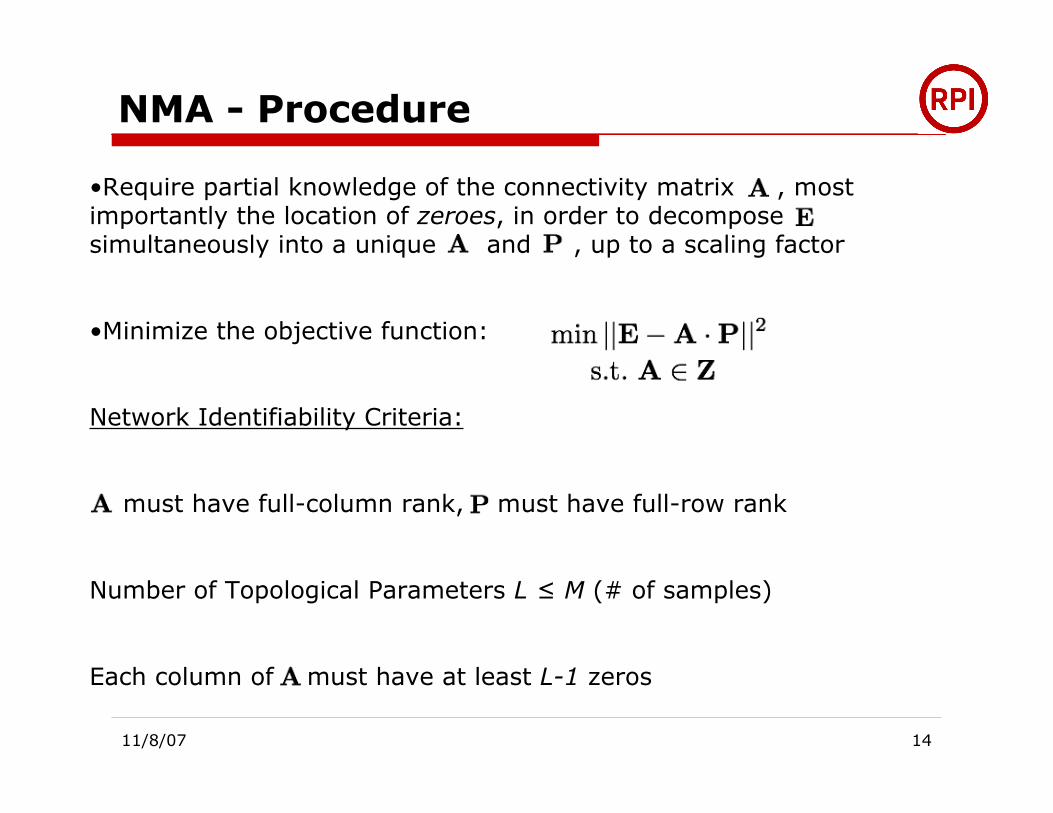
•Require partial knowledge of the connectivity matrix , mostimportantly the location of zeroes, in order to decomposesimultaneously into a unique and , up to a scaling factor
•Minimize the objective function:
is a vector of sequences that defines the topological connectivity
**No prior knowledge of is required**
-Carried out using AMPL platform and SNOPT solver -NEOS Server for Optimization
11/8/07 14
NMA - Procedure
•Require partial knowledge of the connectivity matrix , mostimportantly the location of zeroes, in order to decomposesimultaneously into a unique and , up to a scaling factor
•Minimize the objective function:
Network Identifiability Criteria:
must have full-column rank, must have full-row rank
Number of Topological Parameters L ≤ M (# of samples)
Each column of must have at least L-1 zeros
11/8/07 15
Principal Component Analysis
% Explained:
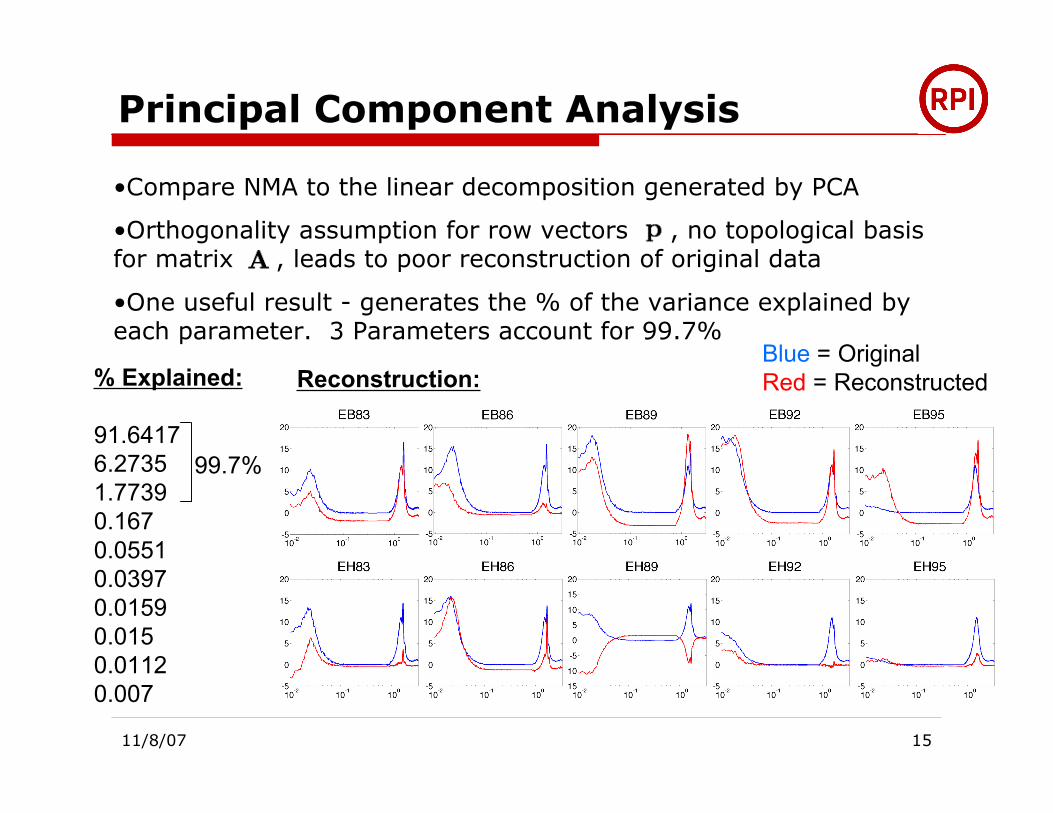
91.64176.27351.77390.1670.05510.03970.01590.0150.01120.007
•Compare NMA to the linear decomposition generated by PCA
•Orthogonality assumption for row vectors , no topological basisfor matrix , leads to poor reconstruction of original data
•One useful result - generates the % of the variance explained byeach parameter. 3 Parameters account for 99.7%
Reconstruction:Blue = OriginalRed = Reconstructed
99.7%
11/8/07 16
NMA Topology - Optimal Mapping
EB-83
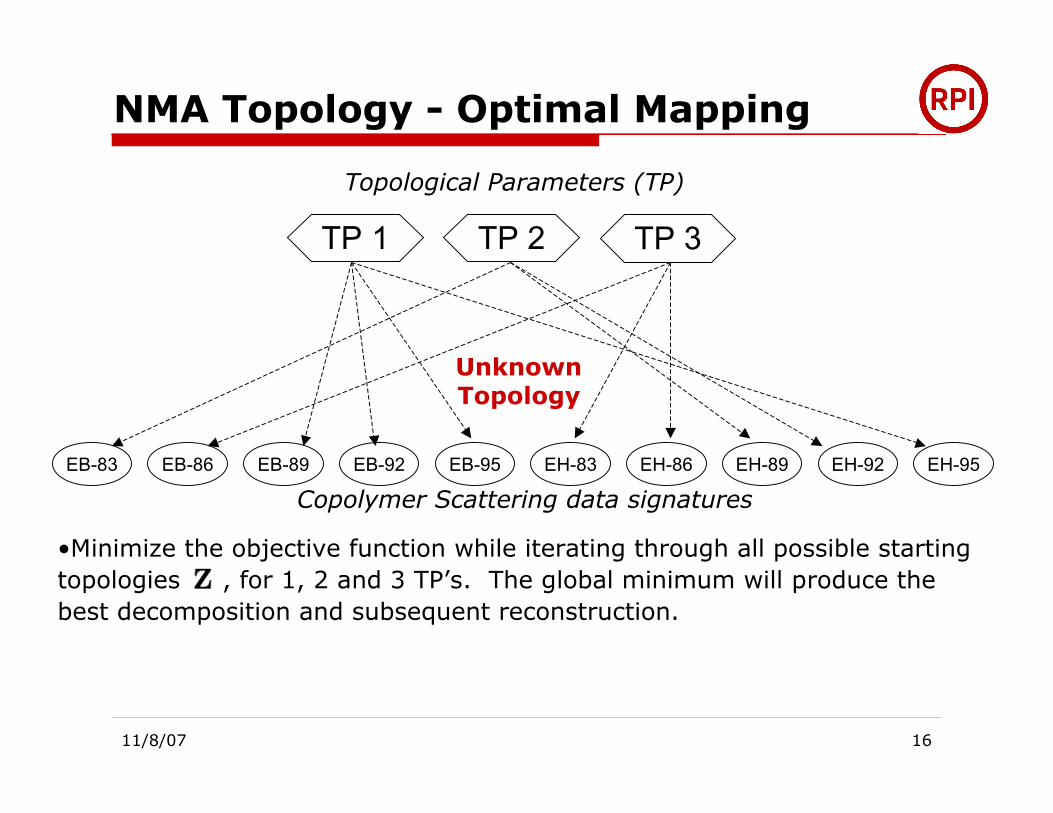
TP 1 TP 2 TP 3
Topological Parameters (TP)
Copolymer Scattering data signatures
UnknownTopology
EB-86 EB-89 EB-92 EB-95 EH-83 EH-86 EH-89 EH-92 EH-95
•Minimize the objective function while iterating through all possible startingtopologies , for 1, 2 and 3 TP’s. The global minimum will produce thebest decomposition and subsequent reconstruction.
11/8/07 17
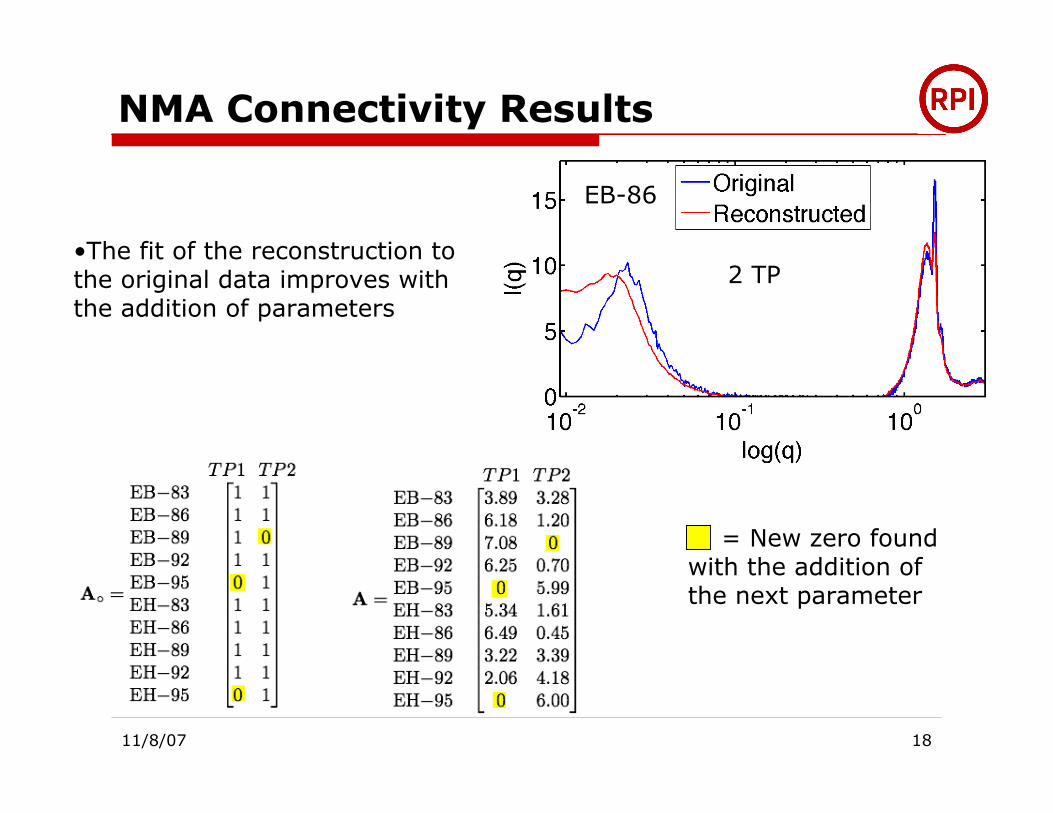
NMA Connectivity Results
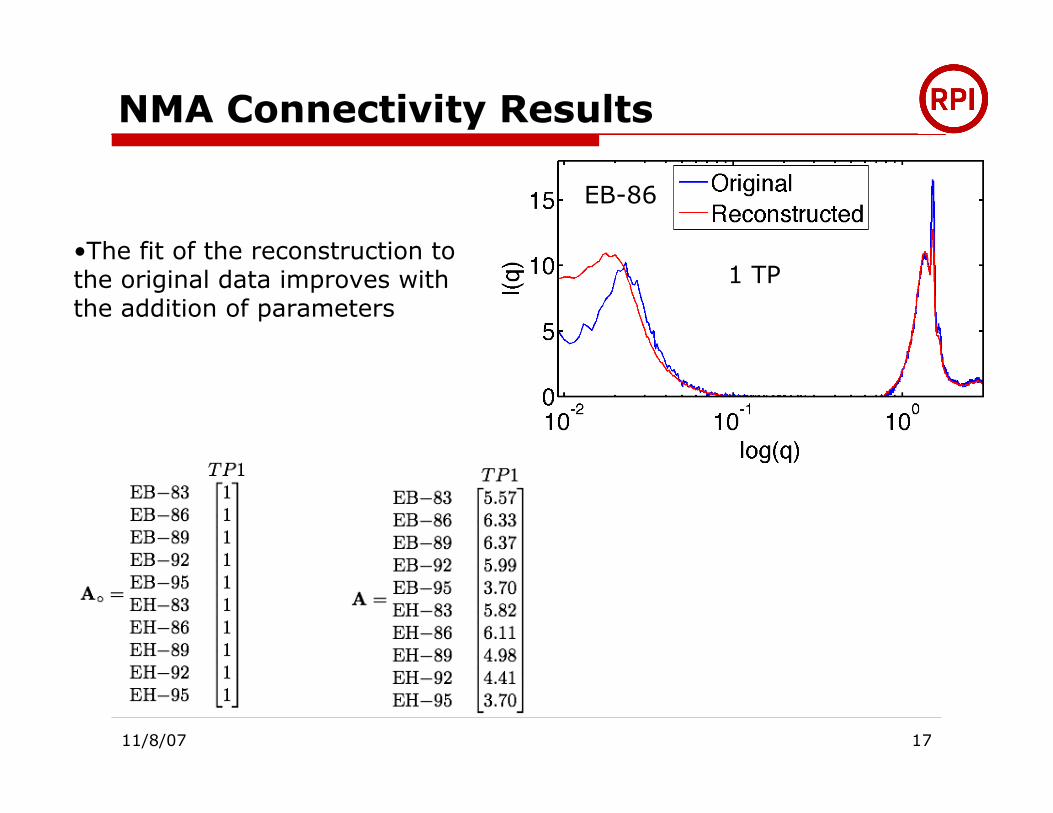
•The fit of the reconstruction tothe original data improves withthe addition of parameters
EB-86
1 TP
11/8/07 18
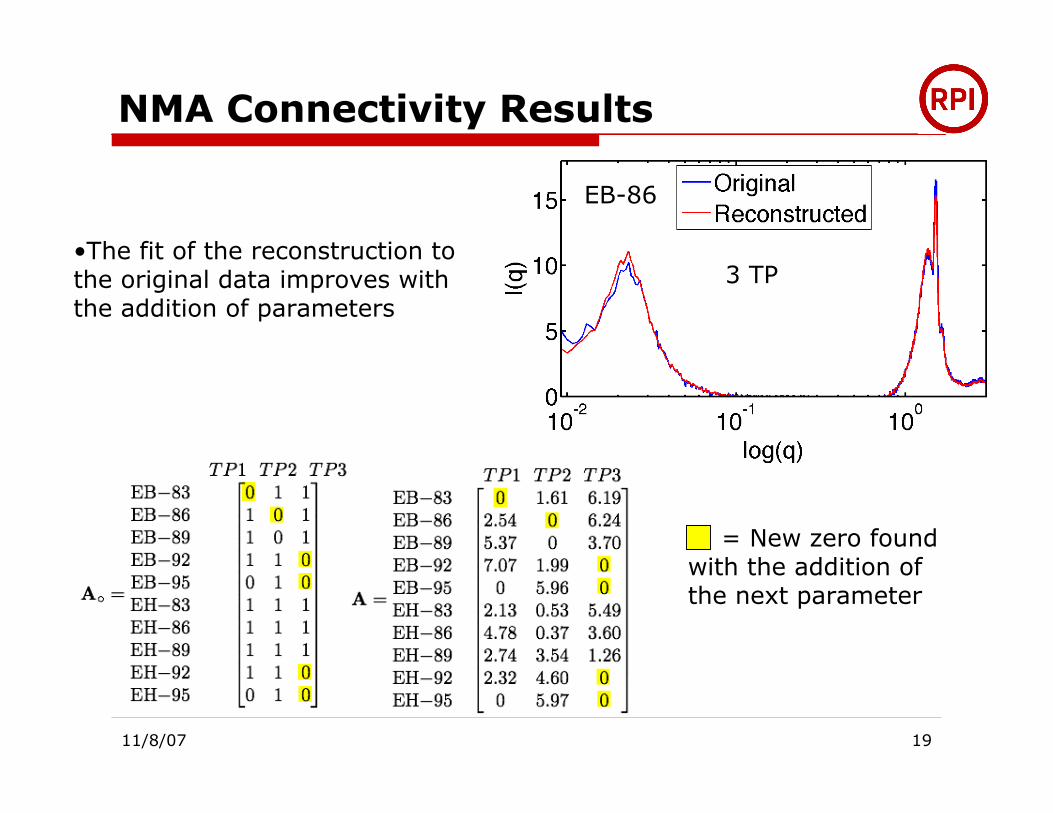
NMA Connectivity Results
•The fit of the reconstruction tothe original data improves withthe addition of parameters
EB-86
2 TP
= New zero foundwith the addition ofthe next parameter
11/8/07 19
•The fit of the reconstruction tothe original data improves withthe addition of parameters
EB-86
3 TP
= New zero foundwith the addition ofthe next parameter
NMA Connectivity Results
11/8/07 20
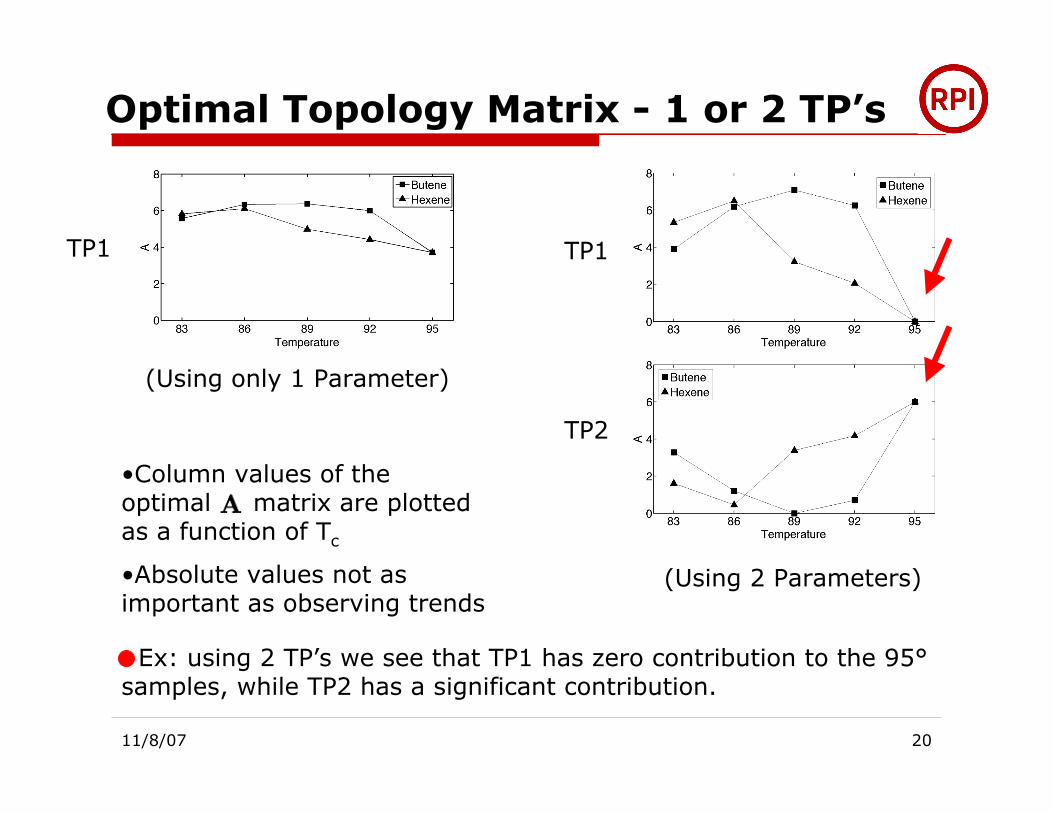
Optimal Topology Matrix - 1 or 2 TP’s
TP1 TP1
TP2
•Column values of theoptimal matrix are plottedas a function of Tc
•Absolute values not asimportant as observing trends
(Using only 1 Parameter)
(Using 2 Parameters)
Ex: using 2 TP’s we see that TP1 has zero contribution to the 95°samples, while TP2 has a significant contribution.
11/8/07 21
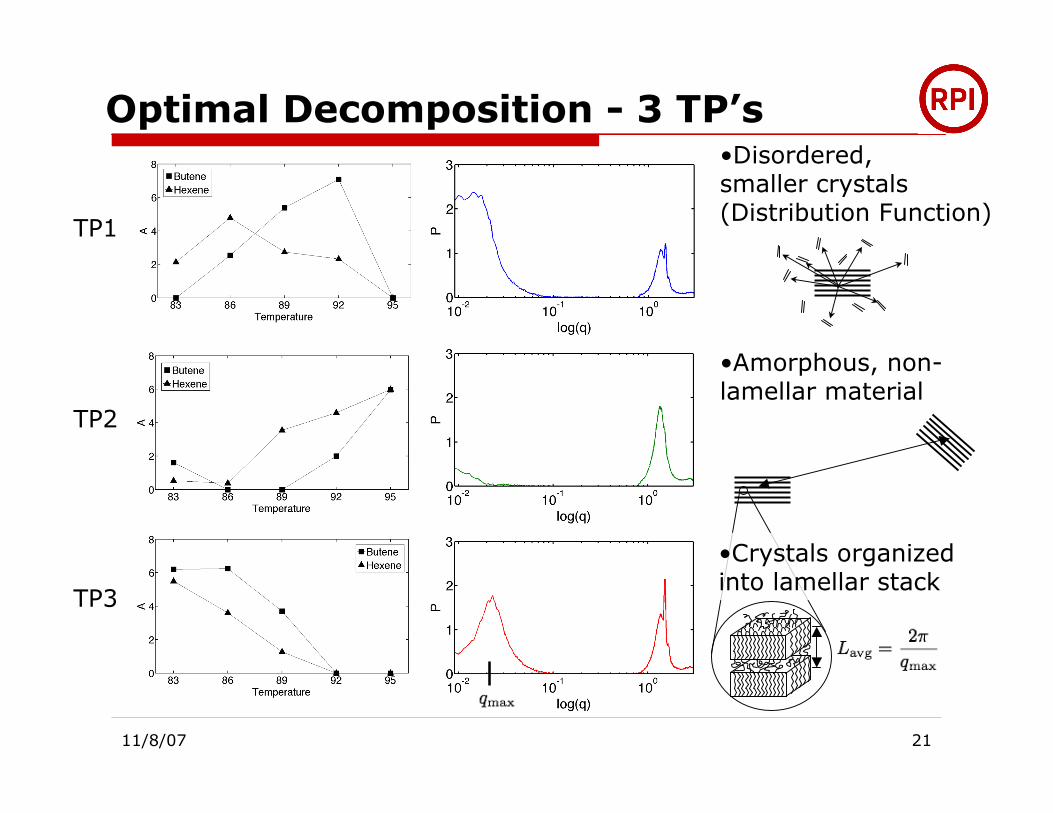
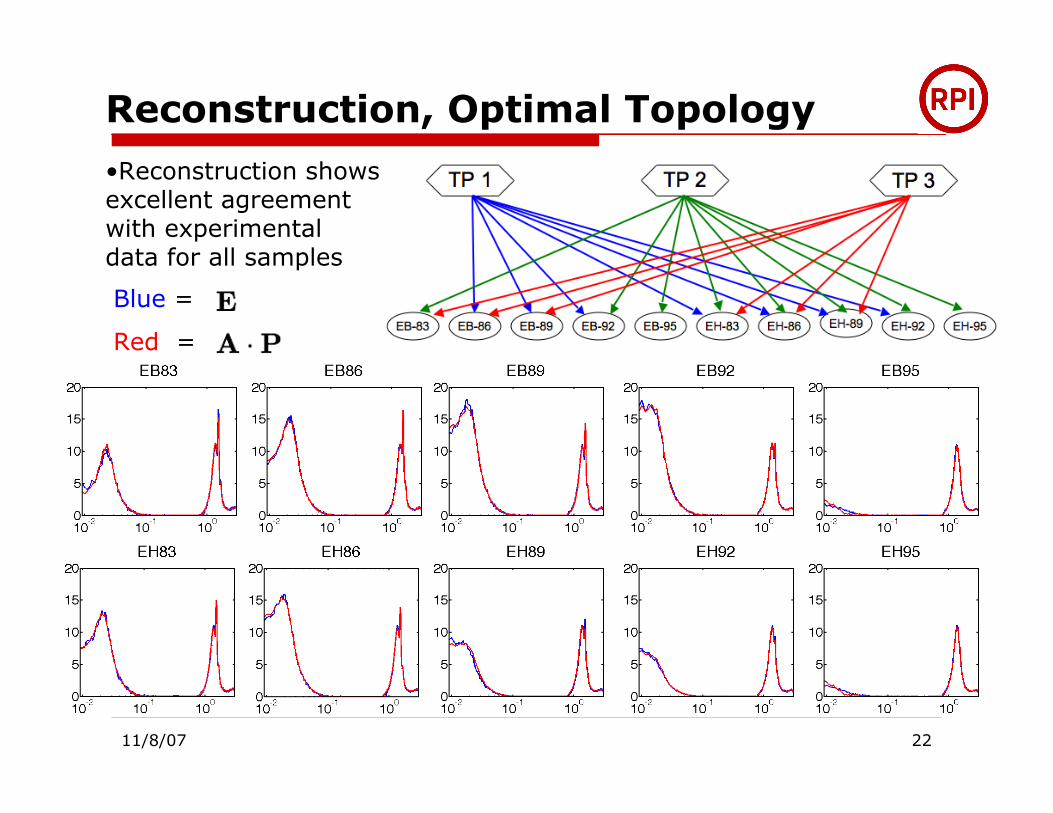
Optimal Decomposition - 3 TP’s
TP1
TP2
TP3
•Amorphous, non-lamellar material
•Disordered,smaller crystals(Distribution Function)
•Crystals organizedinto lamellar stack
11/8/07 22
Reconstruction, Optimal Topology
•Reconstruction showsexcellent agreementwith experimentaldata for all samples
Blue =
Red =
11/8/07 23
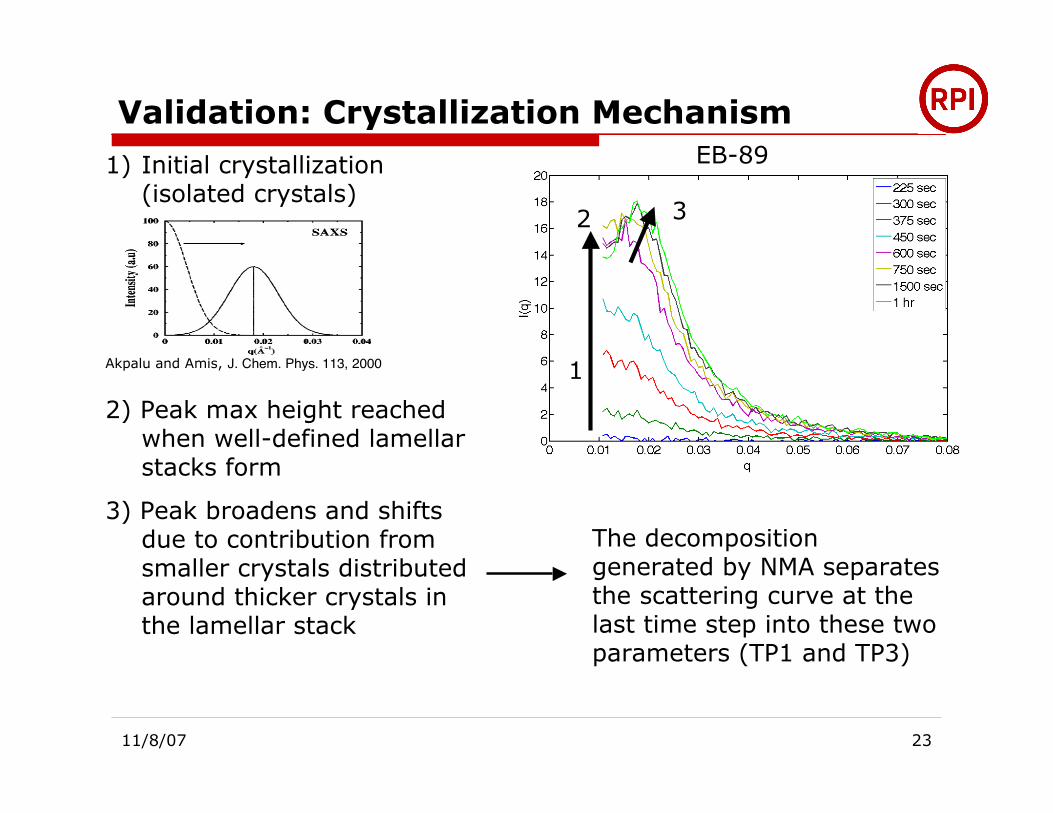
Validation: Crystallization Mechanism
2
1
1) Initial crystallization(isolated crystals)
2) Peak max height reachedwhen well-defined lamellarstacks form
3) Peak broadens and shiftsdue to contribution fromsmaller crystals distributedaround thicker crystals inthe lamellar stack
EB-89
Akpalu and Amis, J. Chem. Phys. 113, 2000
3
The decompositiongenerated by NMA separatesthe scattering curve at thelast time step into these twoparameters (TP1 and TP3)
11/8/07 24
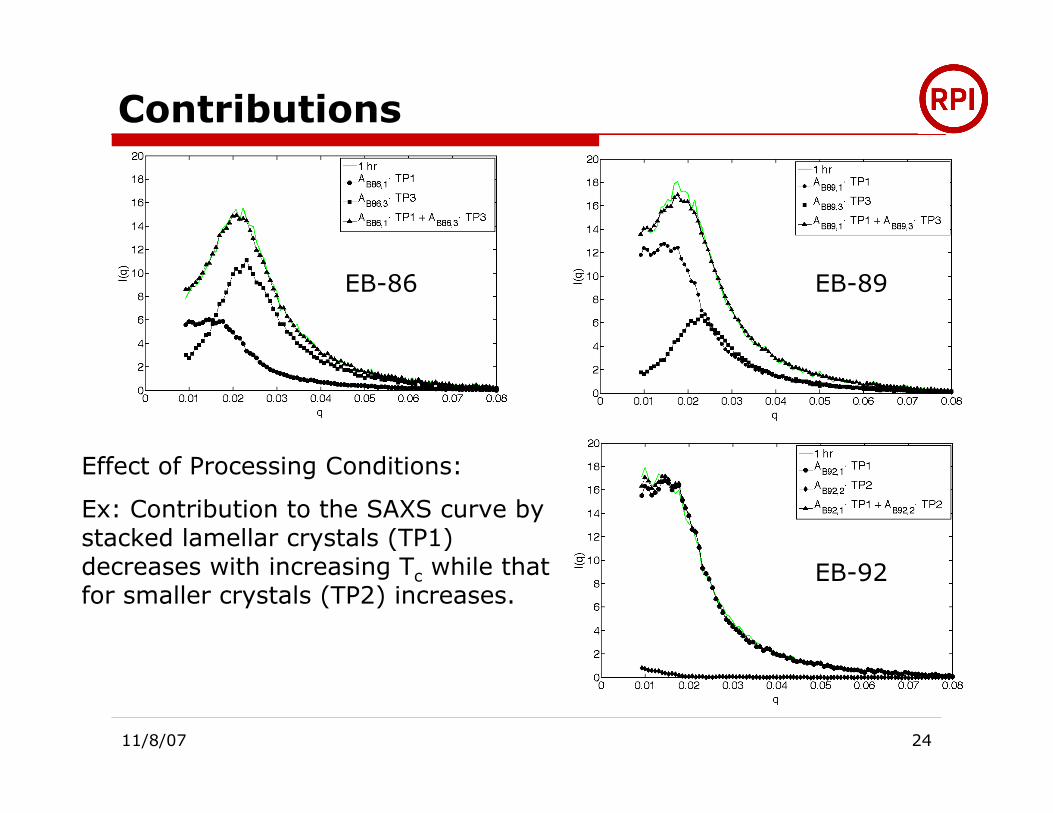
Contributions
EB-89EB-86
EB-92
Effect of Processing Conditions:
Ex: Contribution to the SAXS curve bystacked lamellar crystals (TP1)decreases with increasing Tc while thatfor smaller crystals (TP2) increases.
11/8/07 25
Summary & Conclusions•NMA approach can extract different contributions to the overall scatteringdata signature directly from experimental data without assuming a model,and determine the effect of processing conditions on these contributionsacross multiple length scales.
Effect of Processing Conditions:
Contributions to Structure:
•These scattering contributions can then be compared to existing modelsto determine how best to describe the structure/morphology, possiblyresulting in the development of new models.
Future work:
•Develop generalized models to describe influence of process onstructure/morphology
•Decomposition of time-resolved data into parameters to investigatepolymer crystallization
•Determine how NMA approach can improve the prediction of propertiesusing micromechanical models
Experimental Data:
11/8/07 26
Acknowledgements
Funding
NSF, DOE
Thank you! Questions?
•Martin Research Group
•Akpalu Research Group
•NIST, ANL, BNL


![Star-Topology Decoupled State Space SearchStar-topology decoupling also relates to Petri net unfolding, specifically to contextual unfolding [27] as planning actions typically have](https://img.pdfslide.us/doc/110x75/5f3db2530eec6d7a46493b38/star-topology-decoupled-state-space-search-star-topology-decoupling-also-relates.jpg)