Embed Size (px)
Citation preview
research papers
624 doi:10.1107/S0108768109026767 Acta Cryst. (2009). B65, 624–638
Acta Crystallographica Section B
StructuralScience
ISSN 0108-7681
Topological properties of hydrogen bonds andcovalent bonds from charge densities obtained bythe maximum entropy method (MEM)
Jeanette Netzel and Sander van
Smaalen*
Laboratory of Crystallography, University of
Bayreuth, D-95440 Bayreuth, Germany
Correspondence e-mail:
Charge densities have been determined by the Maximum
Entropy Method (MEM) from the high-resolution, low-
temperature (T ’ 20 K) X-ray diffraction data of six different
crystals of amino acids and peptides. A comparison of dynamic
deformation densities of the MEM with static and dynamic
deformation densities of multipole models shows that the
MEM may lead to a better description of the electron density
in hydrogen bonds in cases where the multipole model has
been restricted to isotropic displacement parameters and low-
order multipoles (lmax = 1) for the H atoms. Topological
properties at bond critical points (BCPs) are found to depend
systematically on the bond length, but with different functions
for covalent C—C, C—N and C—O bonds, and for hydrogen
bonds together with covalent C—H and N—H bonds. Similar
dependencies are known for AIM properties derived from
static multipole densities. The ratio of potential and kinetic
energy densities |V(BCP)|/G(BCP) is successfully used for a
classification of hydrogen bonds according to their distance
d(H� � �O) between the H atom and the acceptor atom. The
classification based on MEM densities coincides with the usual
classification of hydrogen bonds as strong, intermediate and
weak [Jeffrey (1997). An Introduction to Hydrogen Bonding.
Oxford University Press]. MEM and procrystal densities lead
to similar values of the densities at the BCPs of hydrogen
bonds, but differences are shown to prevail, such that it is
found that only the true charge density, represented by MEM
densities, the multipole model or some other method can lead
to the correct characterization of chemical bonding. Our
results do not confirm suggestions in the literature that the
promolecule density might be sufficient for a characterization
of hydrogen bonds.
Received 5 March 2009
Accepted 8 July 2009
1. Introduction
Inter- and intramolecular hydrogen bonds are important in
both molecular and biological chemistry, because they
contribute a large part of the interactions responsible for the
conformations and functions of many compounds in those
fields. Different approaches and methods have been employed
to determine geometrical, topological, energetic and func-
tional properties of hydrogen bonds. Besides spectroscopic
methods, X-ray diffraction is an important tool for providing
answers to structural questions regarding hydrogen bonds.
Koch & Popelier (1995) proposed eight criteria that establish
the existence of hydrogen bonds. Geometric, energetic and IR
spectroscopic properties were suggested by Jeffrey (1997),
thus allowing a classification of strong, medium and weak
hydrogen bonds.
A sophisticated approach to analyze the topological prop-
erties of electron densities is provided by Bader’s Atoms in
Molecules (AIM) theory (Bader, 1994). The AIM theory
allows the determination of BCPs and their properties, such as
the electron density and its Laplacian, leading to the detection
of hydrogen bonds in crystal structures as well as providing a
quantitative characterization of the type and strengths of these
bonds. Analyses according to the AIM theory (Bader, 1994) of
experimental electron densities of amino acids and peptides
have been performed by Destro et al. (1988, 2000), Benabicha
et al. (2000), Pichon-Pesme et al. (2000), Wagner & Luger
(2001), Flaig et al. (2002), Scheins et al. (2004), Mebs et al.
(2006), Checinska et al. (2006), Rodel et al. (2006) and Kali-
nowski et al. (2007). Amino acids were studied on the basis of
electron densities derived from quantum mechanical calcula-
tions by Matta & Bader (2000, 2002, 2003).
Abramov (1997) introduced a method which uses the
densities at BCPs and their Laplacians for calculating the
kinetic energy densities at the BCPs. Employment of the local
virial theorem (Bader, 1994) allows the calculation of the
potential energy densities at the BCPs. These energy densities
provide information on the character of the bond analyzed
(Abramov, 1997; Cremer & Kraka, 1984a,b). Extensive studies
of energy densities and topological properties at the BCPs of
hydrogen bonds have been performed by Espinosa et al. (1998,
2002), Espinosa, Lecomte & Molins (1999) and Espinosa,
Souhassou et al. (1999).
Experimental charge densities are usually based on the
multipole model (Hansen & Coppens, 1978). Alternatively,
they can be determined by the maximum entropy method
(MEM; Sakata & Sato, 1990; Hofmann, Kalinowski et al., 2007;
Hofmann, Netzel & van Smaalen, 2007; Netzel et al., 2008;
Nishibori et al., 2008). MEM electron densities (�MEM) have
been successfully used to study disorder in crystal structures.
The most prominent application has been the determination
of the location of the metal atom in endohedral fullerenes
(Takata et al., 1995). Earlier studies have stressed artifacts in
MEM densities, which have magnitudes equal to the defor-
mation densities of chemical bonds, and thus would prohibit
the use of the MEM in charge-density studies (Jauch &
Palmer, 1993; Jauch, 1994; de Vries et al., 1996; Takata &
Sakata, 1996; Roversi et al., 1998). These problems have been
overcome by a combination of extensions to the MEM,
including the use of a procrystal prior density (de Vries et al.,
1996), the use of static weights in the F constraint (de Vries et
al., 1994), the use of prior-derived F constraints (Palatinus &
van Smaalen, 2005) and the definition of a criterion of
convergence for the MEM iterations, which is based on
difference-Fourier maps (Hofmann, Netzel & van Smaalen,
2007). The MEM has the potential to become the method of
choice in accurate charge-density studies on proteins
(Hofmann, Kalinowski et al., 2007; Nishibori et al., 2008),
because the MEM (unlike multipole refinements) does not
suffer from correlations between parameters.
The present work reports the analysis of MEM electron
densities of several amino acids and peptides. The study
includes the analysis of geometrical, topological and energetic
properties of all 52 hydrogen bonds that have been identified
in these compounds. The quantitative analysis is supple-
mented by a descriptive analysis of electron densities in the
regions of the hydrogen bonds. Since the role of a promolecule
(procrystal) has been discussed as being important for the
extraction of information of bonding (Spackman, 1999; Downs
et al., 2002), the contribution of the prior density to properties
of chemical bonds is discussed. The systematic dependence of
properties of hydrogen bonds on the distance between the H
atom and acceptor atom is supplemented by an analysis of the
properties of covalent bonds with respect to the bond distance.
2. Computational details
2.1. MEM calculations
Single-crystal X-ray diffraction data of l-alanine (Ala;
Destro et al., 1988), an l-phenylalanine formic acid complex
(Phe; Mebs et al., 2006), l-alanyl-l-tyrosyl-l-alanine (Ala–
Tyr–Ala) with water as the solvent and Ala–Tyr–Ala with
ethanol as the solvent (Checinska et al., 2006) were kindly
provided by Destro or by Luger and co-workers, who have
already reported multipole refinements against these data
(Table 1). We have used these data to perform refinements of
the independent spherical atom model (ISAM) with the
computer program JANA2000 (Petrıcek et al., 2000). The
coordinates and atomic displacement parameters (ADPs)
obtained by the multipole refinements were used as the
starting model for the ISAM refinement. H atoms were fixed
at distances known from neutron diffraction (Wilson, 1995;
Mebs et al., 2006; Baur, 1972; Ohtomo & Arakawa, 1995). A
riding model of Uiso(H) = 1:2Ueq(N, C) and Uiso(H) =
1:5 Ueq(O) was employed to calculate the ADPs of H atoms.
For all three water molecules of the asymmetric unit of Ala–
Tyr–Ala with water, the H—O—H angle was restrained to
104.5�. The coordinates of H2b of Phe, of H15, H61, H62, H71,
H72, H81 and H82 of Ala–Tyr–Ala with water, and of H15 and
H16 of Ala–Tyr–Ala with ethanol were independently refined
subject to constraints on the X—H distances towards values
known from neutron diffraction, because a reasonable
geometrical restraint was not available for these H atoms.
Coordinates of all other H atoms were obtained by attachment
to their neighbor atoms with tetrahedral or trigonal angle
restraints according to their chemical meaning. Agreement
indices for ISAM refinements are given in Table 1.
According to a procedure by Bagautdinov et al. (1998), the
ISAM refinement was employed to obtain phased and scaled
observed structure factors corrected for anomalous scattering,
which were used for the MEM calculations. The coordinates
and ADPs of the ISAM were used to compute the procrystal
electron density [prior density or prior, �priorðxÞ] with the
computer program PRIOR (van Smaalen et al., 2003). The
prior was calculated on a grid over the unit cell and used as the
reference density in the MEM calculations. Equal grids were
chosen for the prior and MEM densities, such that the pixel
size did not exceed 0.1 � 0.1 � 0.1 A3 (Table 1).
research papers
Acta Cryst. (2009). B65, 624–638 Netzel and van Smaalen � Charge densities obtained by MEM 625

The MEM is based on the principle that the most probable
density f�kg is that which simultaneously fits the diffraction
data and maximizes the informational entropy S, with
S ¼ �XNp
k¼1
�k log �k=�priork
� �; ð1Þ
where �k = �ðxkÞ are the values of the electron density on a
grid over the unit cell of Np ¼ N1 � N2 � N3 points. �priork =
�priorðxkÞ are the corresponding values of the prior.
Diffraction data are taken into account by the method of
undetermined Lagrange multipliers employing the F
constraint CF2 ¼ 0 with (Sakata & Sato, 1990; Hofmann,
Netzel & van Smaalen, 2007)
CF2 ¼ ��2aim þ
1
NF
XNF
i¼1
wi
jFobsðHiÞ � FMEMðHiÞj
�ðHiÞ
� �2
¼ 0: ð2Þ
FobsðHiÞ is the phased observed structure factor of the Bragg
reflection with scattering vector Hi and standard uncertainty
(s.u.) �ðHiÞ. FMEMðHiÞ is obtained by discrete Fourier trans-
form of the electron density f�kg. The summation extends over
all observed reflections NF. Static weights
wi ¼1
jHijn
1
NF
XNF
i¼1
1
jHijn
!�1
ð3Þ
with n ¼ 4 have been chosen according to de Vries et al.
(1994). Our earlier studies have confirmed that weights H4
represent the optimal choice of weights (Hofmann, Netzel &
van Smaalen, 2007; Netzel et al., 2008). The summation of (2)
has been extended towards all reflections up to
sin �=� = 2.5 A�1 according to the method of prior-derived F
constraints (PDC; Palatinus & van Smaalen, 2005). Since the
PDC extends the F constraint using terms involving the
calculated structure factors of the prior, its use is recom-
mended only if the experimental data are available up to a
certain minimum resolution, e.g. up to at least
sin �=� > 0.9 A�1 (Palatinus & van Smaalen, 2005). This
condition is fulfilled for all the datasets considered in this
article.
MEM calculations have been performed with the computer
program BayMEM (van Smaalen et al., 2003), employing the
Cambridge maximum entropy algorithm (Gull, 1989; Gull &
Skilling, 1999). Convergence of the iterations is considered to
be reached once CF2 has dropped below zero [see (2)], and it
thus depends on the value of �2aim. Following procedures
introduced earlier (Netzel et al., 2008; Hofmann, Netzel & van
Smaalen, 2007), an optimal value for �2aim was determined for
each dataset by inspection of difference-Fourier maps and
dynamic deformation maps
�defMEMðxÞ ¼ �
MEMðxÞ � �prior
ðxÞ ð4Þ
research papers
626 Netzel and van Smaalen � Charge densities obtained by MEM Acta Cryst. (2009). B65, 624–638
Table 1Crystallographic data of �-glycine (Gly; Destro et al., 2000), l-alanine (Ala; Destro et al., 1988), l-phenylalanine formic acid complex (Phe; Mebs et al.,2006), trialanine (Ala–Ala–Ala; Rodel et al., 2006), l-alanyl-l-tyrosyl-l-alanine with water [Ala–Tyr–AlaH2O; Checinska et al., 2006], and l-alanyl-l-tyrosyl-l-alanine with ethanol [Ala–Tyr–Ala(EtOH); Checinska et al., 2006], together with summaries of the ISAM refinements and MEM calculations(present work).
Reflections with I=�ðIÞ> 3 are classified as observed, with the exception of the criterion Fobs=�ðFobsÞ> 4 for trialanine (Rodel et al., 2006).
Compound Gly Ala Phe Ala–Ala–Ala Ala–Tyr–Ala(H2O) Ala-Tyr-Ala(EtOH)
Chemical formula C2O2NH5 C3O2NH7 C9H11NO2�C9H12NOþ2 �CHO�2 C9H17N3O4�H2O C15H21N3O5�2.634H2O C15H21N3O5�C2H5OHSpace group P21=n P212121 P21 C2 P21 P21
Z 4 4 2 8 2 2a (A) 5.0866 5.9279 11.4585 18.4408 8.121 8.845b (A) 11.7731 12.2597 5.5941 5.2153 9.299 9.057c (A) 5.4595 5.7939 14.2147 24.8543 12.532 12.364� (�) 111.99 90.00 99.46 98.76 91.21 94.56V (A3) 303.16 421.1 898.8 2362.4 946.2 987.3F(000) 160 192 400 1031.8 397 396Temperature (K) 23 23 25 20 9 20Wavelength � (A) 0.71073 0.71073 0.71073 0.71073 0.50000 0.71073ðsin �=�Þmax (A�1) 1.15 1.08 1.18 1.15 1.24 1.11Unique reflections (obs/all) 3483/3822 2328/2535 8971/10981 12928/14895 12875/14111 10901/11703
Multipole refinement (Destro et al., 1988, 2000; Mebs et al., 2006; Checinska et al., 2006; Rodel et al., 2006)RF (obs/all) –/0.0129 –/0.0203 0.0272/0.0350 0.0183/0.0247 0.0293/0.0351 0.0223/0.0264RwF (obs/all) –/– –/0.0159 0.0307/– 0.0153/– 0.0208/– 0.0177/–GoF 1.04 1.17 1.06 0.67 2.06 1.63
ISAM refinementRF (obs/all) 0.0233/0.0260 0.0285/0.0316 0.0404/0.0480 – 0.0399/0.0455 0.0360/0.0400RwF (obs/all) 0.0525/0.0535 0.0373/0.0377 0.0473/0.0487 –/– 0.0478/0.0494 0.0419/0.0425GoF(obs/all) 2.02/1.96 1.81/1.75 1.43/1.33 –/– 1.67/1.64 2.27/2.22
MEM calculation (this work; Netzel et al., 2008; Hofmann, Netzel & van Smaalen, 2007)Number of pixels 64� 144� 72 72� 162� 72 144� 72� 192 216� 64� 324 96� 108� 162 108� 108� 162�2
aim 0.3131 0.7600 0.8300 0.4250 1.2750 1.3081RF /RwF 0.0104/0.0153 0.0199/0.0190 0.0355/0.0343 0.0263/0.0184 0.0330/0.0342 0.0248/0.0222
for several values of �2aim (Table 1). Details of the MEM
calculations of �-glycine and trialanine have been described
elsewhere (Netzel et al., 2008; Hofmann, Netzel & van
Smaalen, 2007).
An optimal value for �2aim is necessary to obtain accurate
and reliable electron-density maps by the MEM (Hofmann,
Kalinowski et al., 2007). In theory (Skilling, 1989; Gull, 1989),
one would only expect values of �2aim < 1, but values of �2
aim > 1
can appear if the standard uncertainties of measured reflection
intensities have been estimated to be smaller than their true
values. The standard uncertainties in turn are related to the
goodness of fit (GoF) of the refinements, with
GoF ¼
1
NF � Prefined
XNF
i¼1
ðjFobsðHiÞj � kjFcalcðHiÞjÞ=�ðHiÞ� �2
!1=2
;
ð5Þ
where Prefined is the number of refined parameters, k is the
scale factor and FcalcðHiÞ are the calculated structure factors of
the model. For underestimated standard uncertainties, the
value of GoF will be larger than that at convergence of the
refinement.
For datasets with multipole refinements resulting in a GoF
’ 1, we obtained �2aim < 1, and for datasets with refinements
resulting in a GoF close to two, values of �2aim > 1 were
obtained (Table 1). This indicates that the stopping criterion
for the MEM calculation depends on the scale of the standard
uncertainties of the intensities. Thus, the accuracy of the
standard uncertainties can be estimated from consideration of
the value of �2aim as determined in
the MEM procedure. Values of
�2aim smaller than one indicate that
the standard uncertainties are
estimated close to their true
values, whereas values of �2aim > 1
indicate that the standard uncer-
tainties have been underestimated.
2.2. Analysis of the MEM density
The difference between the
ISAM and the aspherical electron
distribution obtained by the MEM
has been analysed by inspection of
dynamic deformation maps [see
(4)]. In particular, sections of
�defMEMðxÞ containing selected atoms
allow the visualization of the
difference densities in hydrogen
bonds (Fig. 1).
Electron-density maps have
been analysed according to
Bader’s AIM theory (Bader, 1994)
with the module EDMA of the
program BayMEM (van Smaalen
et al., 2003). For each density map,
EDMA provides the positions and values of local maxima of
the density, the atomic basins, the atomic charges and the
positions of BCPs together with their densities �ðBCPÞ, their
principal curvatures �1, �2 and �3 (eigenvalues of the Hessian
matrix), and their Laplacians r2�ðBCPÞ. Both the prior and
the MEM densities have been analysed in the same way.
Covalent bonds have been identified by BCPs with values of
�ðBCPÞ larger than � 1.0 e A�3. A BCP with a smaller value
of �ðBCPÞ in the region of a potential donor–acceptor pair for
hydrogen bonds was used to establish the existence of a
hydrogen bond. The positions of BCPs of covalent and
hydrogen bonds in MEM densities match BCPs in electron
densities obtained from the multipole model.
The kinetic, potential and total energy densities at BCPs
have been obtained from prior and MEM densities according
to a procedure proposed by Abramov (1997). The kinetic
energy density GðBCPÞ at a BCP is given by
GðBCPÞ ¼3
10ð32Þ
2=3 �ðBCPÞ5=3þ
1
6r2�ðBCPÞ ð6Þ
with �ðBCPÞ and r2�ðBCPÞ in atomic units. Employing the
local virial theorem (Bader, 1994), the potential energy
density VðBCPÞ at a BCP is
VðBCPÞ ¼1
4r
2�ðBCPÞ � 2GðBCPÞ: ð7Þ
The total energy density HðBCPÞ at a BCP then is defined as
HðBCPÞ ¼ GðBCPÞ þ VðBCPÞ: ð8Þ
Note that (6) and (7) have been derived for static electron
densities, i.e. within the Born–Oppenheimer approximation.
research papers
Acta Cryst. (2009). B65, 624–638 Netzel and van Smaalen � Charge densities obtained by MEM 627
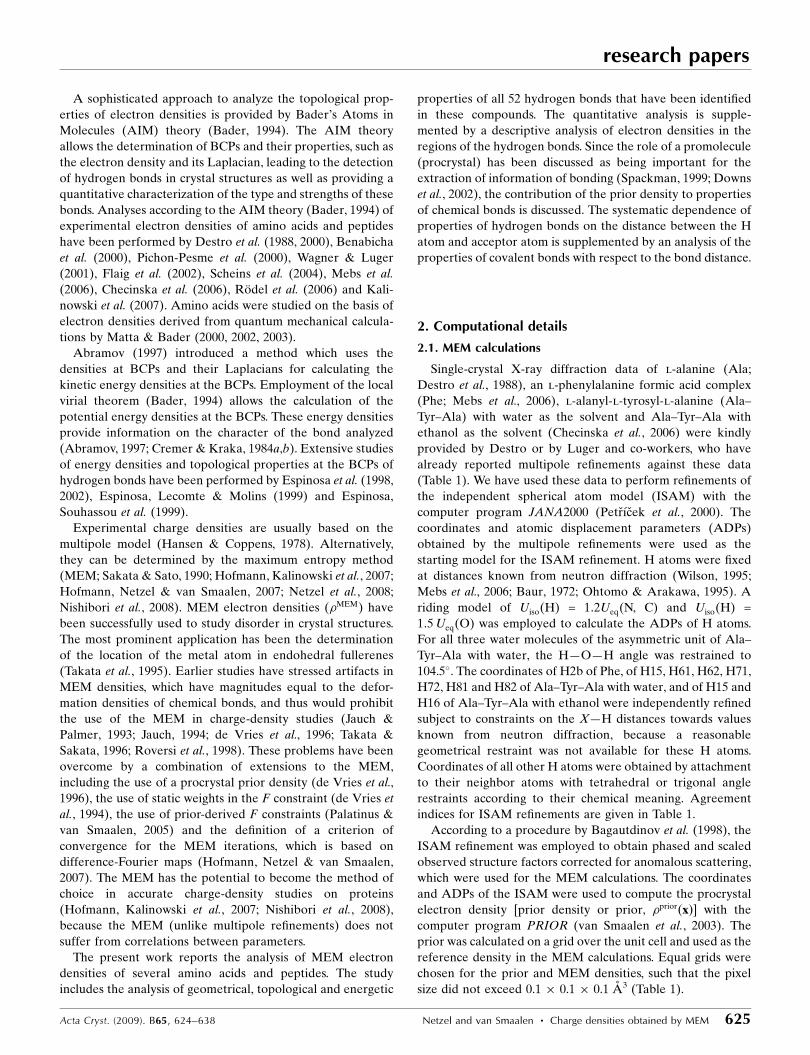
Figure 1Sections of deformation maps of the l-phenylalanine formic acid complex, containing the atoms O2a—C2a—O1a and showing the hydrogen bond O2b—H2b� � �O2a. (a) Section of area 6� 6 A2 of the dynamicdeformation density of the MEM [see (4)]. Contour intervals: 0.05 e A�3. Solid lines indicate positivecontours, dotted lines negative contours and dashed lines represent the zero contour. ��min=max = �0.15/0.61 e A�3. The cross indicates the BCP of the hydrogen bond, with d(H� � �O) = 1.45 A, �ðBCPÞ =0.599 e A�3 and r2�ðBCPÞ = 0.32 e A�5. (b) Static deformation density of the multipole model (reprintedwith permission from Mebs et al., 2006). Contour intervals: 0.10 e A�3.
We apply these relations to dynamic densities as obtained by
the prior and the MEM. While systematic dependencies of, for
example, GðBCPÞ on d(H� � �O) are found (x3.3), the inter-
pretation of these quantities as kinetic and potential energy
densities needs to be established or correction factors need to
be found (see the discussion in x3.3). This is beyond the scope
of the present manuscript.
Systematic dependencies on bond lengths have been
established for various topological and energetic properties at
BCPs of covalent C—C, C—N, C—O, C—H and N—H bonds
and of hydrogen bonds. Since some H atoms do not constitute
atomic maxima, the corresponding coordinates of H atoms
from the ISAM were employed to calculate the distance
d(H� � �O).
3. Results and discussion
3.1. Electron densities in hydrogen bonds
The dynamic deformation map of the MEM [see (4)] and
the static deformation map of the multipole model have
similar appearances for the l-phenylalanine formic acid
complex (Fig. 1). Distinct features, like lone pairs of O atoms
and an accumulation of electron density in regions of covalent
bonding, are uncovered by both the MEM and the multipole
model. However, the hydrogen bond appears differently in
these two densities: along the bond path of the hydrogen
bond, the MEM leads to a positive difference density (Fig. 1a),
whereas the multipole method exhibits a negative deforma-
tion density in this region (Fig. 1b). These observations are
consistent with those on trialanine and �-glycine (Hofmann,
Netzel & van Smaalen, 2007; Netzel et al., 2008). They can be
interpreted as being due to:
(i) the differences between dynamic and static densities,
(ii) features of the MEM, e.g. its tendency to produce
densities as flat as possible, and
(iii) the known inflexibility of the multipole model in
describing densities at positions remote from atomic maxima
and, especially, the limitations of the multipole model in
describing densities around H atoms if the latter have been
modeled by isotropic ADPs and low-order multipoles
(lmax ¼ 1) (Volkov et al., 2000, 2001; Volkov & Coppens, 2001;
Madsen et al., 2004; Koritsanszky, 2006).
Further support for this interpretation comes from the
comparison of the dynamic deformation density of the MEM
[see (4)] with an experimental dynamic deformation map that
has been computed as the difference-Fourier map of
½FobsðHÞ � FISAMðHÞ�, whereby phases for FobsðHÞ have been
obtained from a multipole model (Destro et al., 1988). The
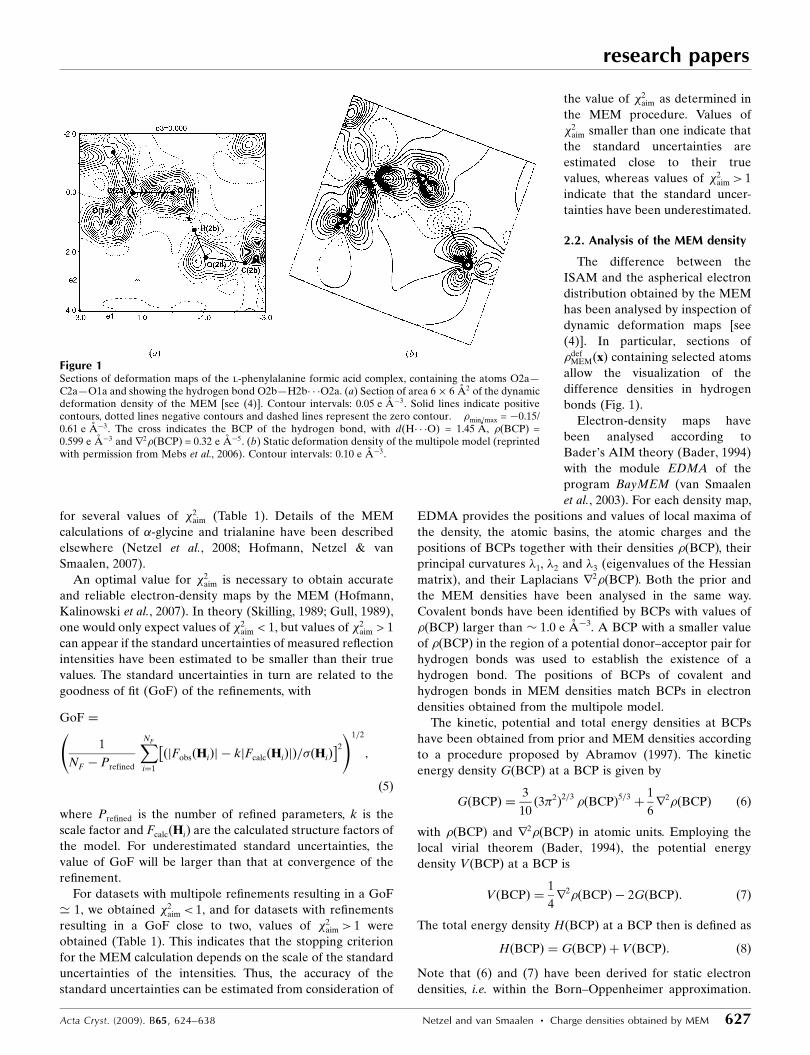
deformation density �defMEMðxÞ [see (4)] along the bond path of
the N—H� � �O hydrogen bond in l-alanine exhibits similar
features as �defMEMðxÞ of the O—H� � �O hydrogen bond in l-
phenylalanine (Figs. 1a and 2a). The experimental difference-
Fourier map with phases from a standard multipole model
exhibits a deformation density of N—H that is less protruded
towards oxygen than �defMEMðxÞ, while the minimum density
along the H� � �O bond path is approximately 0.1 e A�3 lower
research papers
628 Netzel and van Smaalen � Charge densities obtained by MEM Acta Cryst. (2009). B65, 624–638
Figure 2Sections of deformation densities containing the atoms N—H3—O2 andshowing the hydrogen bond N—H3� � �O2 of l-alanine. (a) Section of area5� 5 A2 through the dynamic deformation density of the MEM [see (4)].��min=max = �0.13/0.42 e A�3. The cross indicates the BCP of thehydrogen bond with d(H� � �O) = 1.76 A, �ðBCPÞ = 0.326 e A�3 andr2�ðBCPÞ = �1.46 e A�5. (b) Section of 4� 4 A2 through theexperimental dynamic deformation density (reprinted with permissionfrom Destro et al., 1988). (c) Section of 5� 5 A2 through theexperimental dynamic deformation density with phases from theextended multipole model (Destro et al., 2008; Destro & Lo Presti,2008). Contour intervals: 0.05 e A�3; contour lines as defined in Fig. 1.

than in �defMEMðxÞ (Fig. 2b). Phases of an extended multipole
model (anisotropic ADPs and multipole parameters up to
quadrupole terms for hydrogen) then lead to a dynamic
difference-Fourier map that is closer to �defMEMðxÞ (Fig. 2c;
Destro et al., 2008).
It has been noticed that anisotropic ADPs and higher-order
multipole terms of H atoms are important for a proper
description of the electron density around H atoms (Madsen et
al., 2004; Roversi & Destro, 2004; Whitten et al., 2006).
However, a refinement of these parameters is not possible for
systems substantially larger than simple amino acids, owing to
the problem of dependent parameters in the multipole model.
Usually, the treatment of H atoms does not go beyond
isotropic ADPs (Munshi et al., 2008; Benabicha et al., 2000;
Pichon-Pesme et al., 2000; Kalinowski et al., 2007; Wagner &
Luger, 2001; Lyssenko et al., 2005) and dipolar terms within
the multipole model (Grabowsky et al., 2007; Wagner et al.,
2004; Checinska et al., 2006; Dominiak et al., 2006). The
extended multipole model will thus remain an exceptional
case, to be encountered for crystals of small molecules only.
On the other hand, the MEM is applicable to both small and
large systems and it leads to a proper description of the
deformation density with phases from the ISAM.
Positive dynamic difference densities around the BCPs
between the H atom and the acceptor atom turn out to be a
feature of all three types of hydrogen bonds studied in the
present work. For hydrogen bonds of the type O—H� � �O and
N—H� � �O, this feature is very pronounced (Figs. 1–4),
whereas this behaviour is less pronounced in hydrogen bonds
of the type C—H� � �O (Fig. 5). Since hydrogen bonds of the
latter type can be considered as very weak or even as non-
conventional hydrogen bonds (Marechal, 2007), the present
results confirm that only stronger hydrogen bonds have a large
potential to draw electrons into the BCP, resulting in an
accumulation of charge between the H atom and the acceptor
atom.
3.2. Topological properties of hydrogen bonds
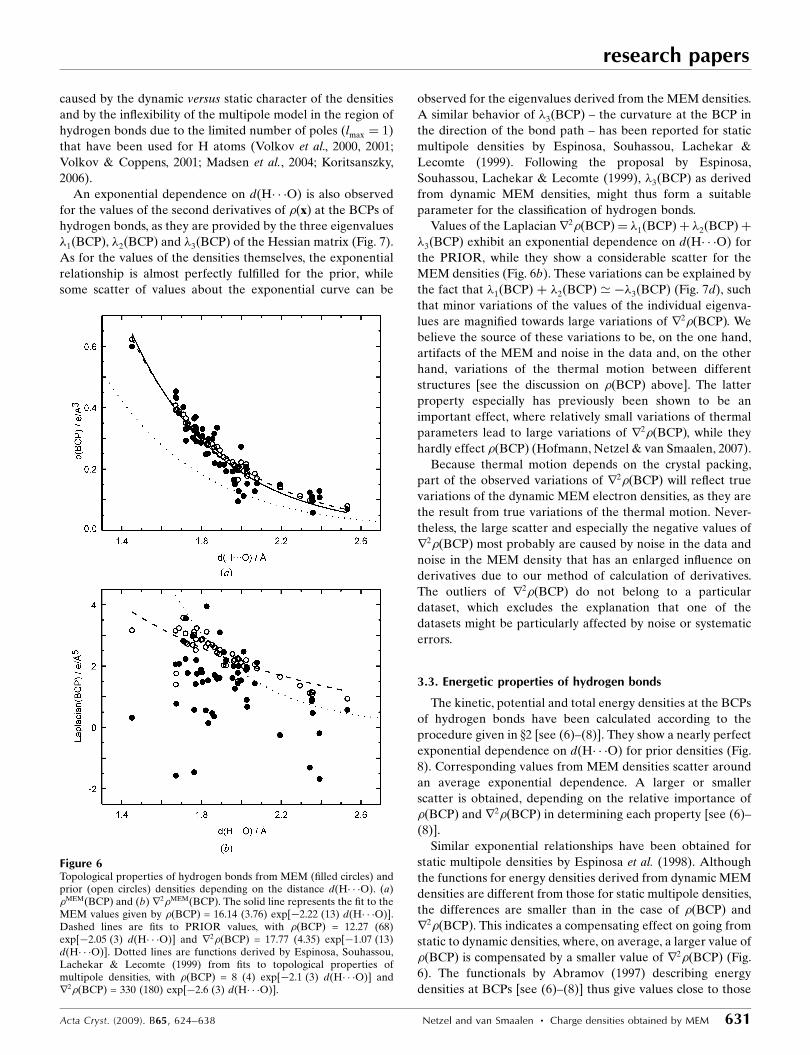
Densities at the BCPs of hydrogen bonds of both MEM and
prior densities depend exponentially on the distance d(H� � �O)
(Fig. 6a). For the prior this dependence is almost perfect, while
values of �ðBCPÞ derived from MEM densities exhibit a larger
scatter about the exponential curve. Contributions to this
scatter come from the properties of the MEM that it will have
fitted part of the noise in the data and that it suffers from
series termination effects owing to the incompleteness of the
data. Part of the scatter of values will be a real property caused
by different bonding properties of hydrogen bonds of similar
lengths. Furthermore, part of the scatter of values will be due
to differences in thermal motion of atoms involved in similar
hydrogen bonds, thus leading to differences in dynamic
densities even if the static density would be similar.
A quantum mechanical theory does not exist which would
demand an exponential relationship between �ðBCPÞ and
d(H� � �O). Deviations from an average exponential relation
can thus be caused by variations of the properties of the bonds,
e.g. as caused by variations of their environments. It is noted
that Espinosa, Souhassou, Lachekar & Lecomte (1999) have
established an exponential relationship between �MPðBCPÞ of
hydrogen bonds and d(H� � �O) for static multipole densities,
albeit with different values of the parameters in the expo-
nential function than have presently been determined for
MEM and prior densities (Fig. 6). The values of �MPðBCPÞ also
research papers
Acta Cryst. (2009). B65, 624–638 Netzel and van Smaalen � Charge densities obtained by MEM 629
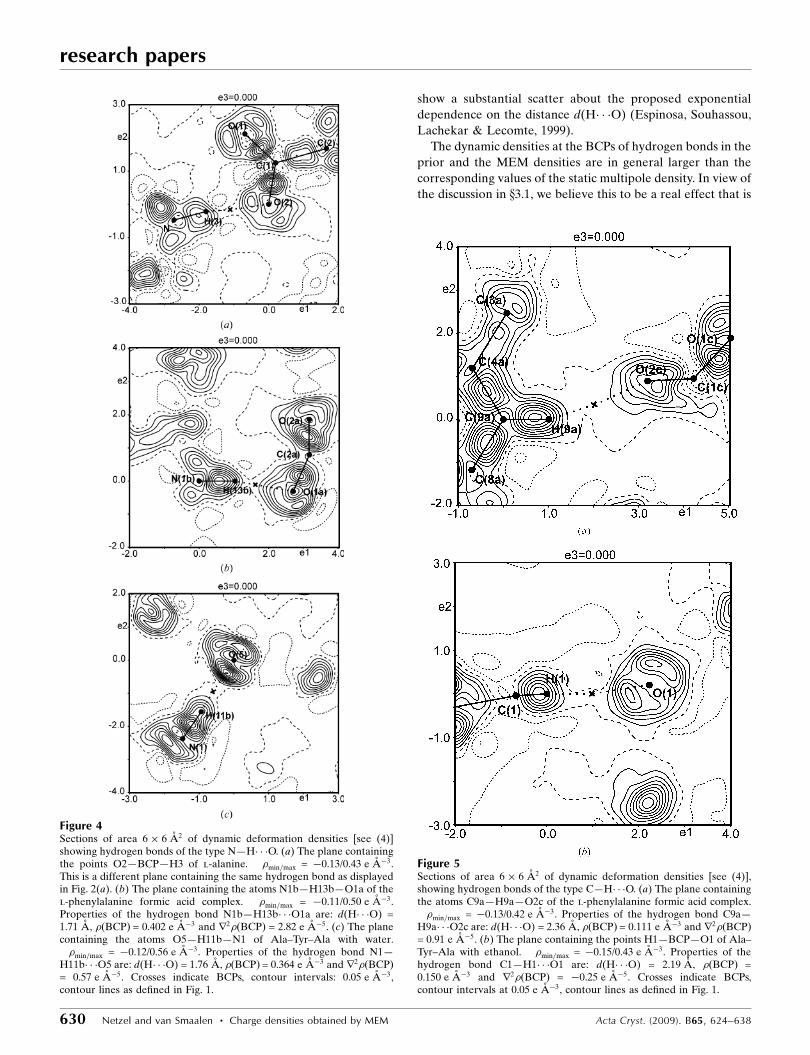
Figure 3Sections of area 6� 6 A2 of dynamic deformation densities [see (4)]showing hydrogen bonds of the type O—H� � �O. (a) The plane containingthe atoms O2b—H2b—O2a of the l-phenylalanine formic acid complex.��min=max = �0.15/0.46 e A�3. This is a different plane containing thesame hydrogen bond as displayed in Fig. 1(a). (b) The plane containingthe atoms O5—H15—O6 of Ala–Tyr–Ala with ethanol. ��min=max =�0.12/0.37 e A�3. Properties of the hydrogen bond O5—H15� � �O6:d(H� � �O) = 1.67 A, �ðBCPÞ = 0.435 e A�3 and r2�ðBCPÞ = 2.05 e A�5.Crosses indicate BCPs; contour interval: 0.05 e A�3; contour lines asdefined in Fig. 1.
show a substantial scatter about the proposed exponential
dependence on the distance d(H� � �O) (Espinosa, Souhassou,
Lachekar & Lecomte, 1999).
The dynamic densities at the BCPs of hydrogen bonds in the
prior and the MEM densities are in general larger than the
corresponding values of the static multipole density. In view of
the discussion in x3.1, we believe this to be a real effect that is
research papers
630 Netzel and van Smaalen � Charge densities obtained by MEM Acta Cryst. (2009). B65, 624–638
Figure 4Sections of area 6� 6 A2 of dynamic deformation densities [see (4)]showing hydrogen bonds of the type N—H� � �O. (a) The plane containingthe points O2—BCP—H3 of l-alanine. ��min=max = �0.13/0.43 e A�3.This is a different plane containing the same hydrogen bond as displayedin Fig. 2(a). (b) The plane containing the atoms N1b—H13b—O1a of thel-phenylalanine formic acid complex. ��min=max = �0.11/0.50 e A�3.Properties of the hydrogen bond N1b—H13b� � �O1a are: d(H� � �O) =1.71 A, �ðBCPÞ = 0.402 e A�3 and r2�ðBCPÞ = 2.82 e A�5. (c) The planecontaining the atoms O5—H11b—N1 of Ala–Tyr–Ala with water.��min=max = �0.12/0.56 e A�3. Properties of the hydrogen bond N1—H11b� � �O5 are: d(H� � �O) = 1.76 A, �ðBCPÞ = 0.364 e A�3 and r2�ðBCPÞ= 0.57 e A�5. Crosses indicate BCPs, contour intervals: 0.05 e A�3,contour lines as defined in Fig. 1.
Figure 5Sections of area 6� 6 A2 of dynamic deformation densities [see (4)],showing hydrogen bonds of the type C—H� � �O. (a) The plane containingthe atoms C9a—H9a—O2c of the l-phenylalanine formic acid complex.��min=max = �0.13/0.42 e A�3. Properties of the hydrogen bond C9a—H9a� � �O2c are: d(H� � �O) = 2.36 A, �ðBCPÞ = 0.111 e A�3 and r2�ðBCPÞ= 0.91 e A�5. (b) The plane containing the points H1—BCP—O1 of Ala–Tyr–Ala with ethanol. ��min=max = �0.15/0.43 e A�3. Properties of thehydrogen bond C1—H1� � �O1 are: d(H� � �O) = 2.19 A, �ðBCPÞ =0.150 e A�3 and r2�ðBCPÞ = �0.25 e A�5. Crosses indicate BCPs,contour intervals at 0.05 e A�3, contour lines as defined in Fig. 1.
caused by the dynamic versus static character of the densities
and by the inflexibility of the multipole model in the region of
hydrogen bonds due to the limited number of poles (lmax ¼ 1)
that have been used for H atoms (Volkov et al., 2000, 2001;
Volkov & Coppens, 2001; Madsen et al., 2004; Koritsanszky,
2006).
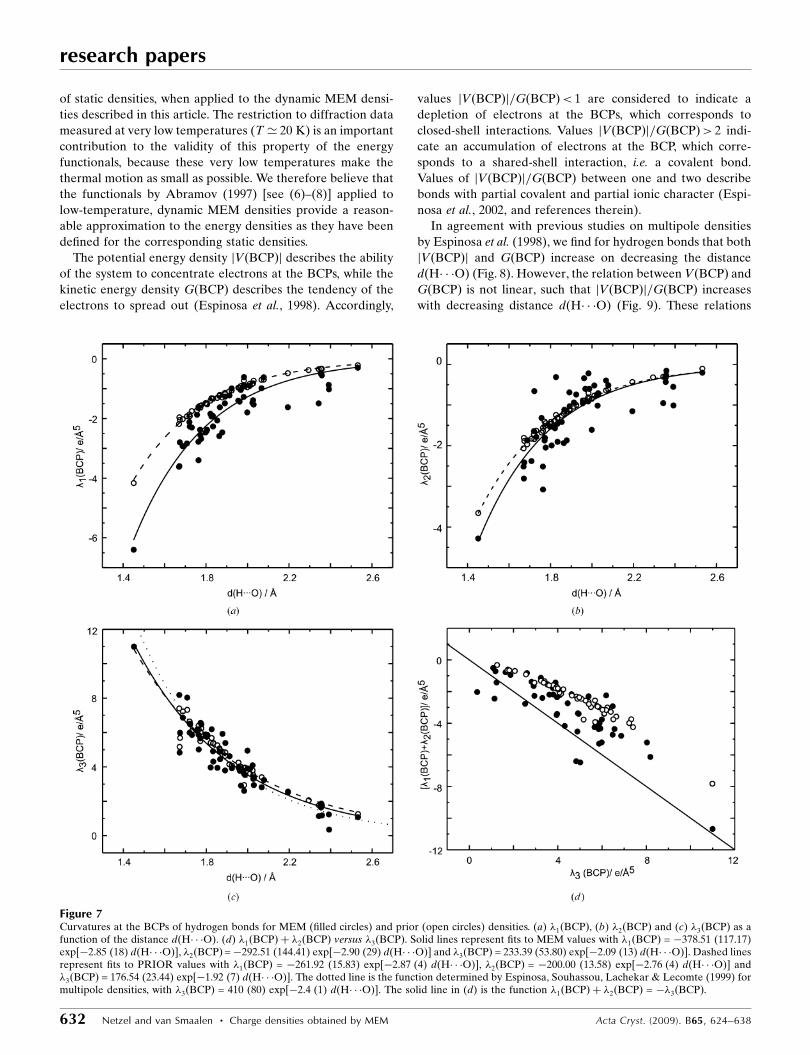
An exponential dependence on d(H� � �O) is also observed
for the values of the second derivatives of �ðxÞ at the BCPs of
hydrogen bonds, as they are provided by the three eigenvalues
�1ðBCPÞ, �2ðBCPÞ and �3ðBCPÞ of the Hessian matrix (Fig. 7).
As for the values of the densities themselves, the exponential
relationship is almost perfectly fulfilled for the prior, while
some scatter of values about the exponential curve can be
observed for the eigenvalues derived from the MEM densities.
A similar behavior of �3ðBCPÞ – the curvature at the BCP in
the direction of the bond path – has been reported for static
multipole densities by Espinosa, Souhassou, Lachekar &
Lecomte (1999). Following the proposal by Espinosa,
Souhassou, Lachekar & Lecomte (1999), �3ðBCPÞ as derived
from dynamic MEM densities, might thus form a suitable
parameter for the classification of hydrogen bonds.
Values of the Laplacianr2�ðBCPÞ ¼ �1ðBCPÞ þ �2ðBCPÞ þ
�3ðBCPÞ exhibit an exponential dependence on d(H� � �O) for
the PRIOR, while they show a considerable scatter for the
MEM densities (Fig. 6b). These variations can be explained by
the fact that �1ðBCPÞ þ �2ðBCPÞ ’ ��3ðBCPÞ (Fig. 7d), such
that minor variations of the values of the individual eigenva-
lues are magnified towards large variations of r2�ðBCPÞ. We
believe the source of these variations to be, on the one hand,
artifacts of the MEM and noise in the data and, on the other
hand, variations of the thermal motion between different
structures [see the discussion on �ðBCPÞ above]. The latter
property especially has previously been shown to be an
important effect, where relatively small variations of thermal
parameters lead to large variations of r2�ðBCPÞ, while they
hardly effect �ðBCPÞ (Hofmann, Netzel & van Smaalen, 2007).
Because thermal motion depends on the crystal packing,
part of the observed variations of r2�ðBCPÞ will reflect true
variations of the dynamic MEM electron densities, as they are
the result from true variations of the thermal motion. Never-
theless, the large scatter and especially the negative values of
r2�ðBCPÞ most probably are caused by noise in the data and
noise in the MEM density that has an enlarged influence on
derivatives due to our method of calculation of derivatives.
The outliers of r2�ðBCPÞ do not belong to a particular
dataset, which excludes the explanation that one of the
datasets might be particularly affected by noise or systematic
errors.
3.3. Energetic properties of hydrogen bonds
The kinetic, potential and total energy densities at the BCPs
of hydrogen bonds have been calculated according to the
procedure given in x2 [see (6)–(8)]. They show a nearly perfect
exponential dependence on d(H� � �O) for prior densities (Fig.
8). Corresponding values from MEM densities scatter around
an average exponential dependence. A larger or smaller
scatter is obtained, depending on the relative importance of
�ðBCPÞ and r2�ðBCPÞ in determining each property [see (6)–
(8)].
Similar exponential relationships have been obtained for
static multipole densities by Espinosa et al. (1998). Although
the functions for energy densities derived from dynamic MEM
densities are different from those for static multipole densities,
the differences are smaller than in the case of �ðBCPÞ and
r2�ðBCPÞ. This indicates a compensating effect on going from
static to dynamic densities, where, on average, a larger value of
�ðBCPÞ is compensated by a smaller value of r2�ðBCPÞ (Fig.
6). The functionals by Abramov (1997) describing energy
densities at BCPs [see (6)–(8)] thus give values close to those
research papers
Acta Cryst. (2009). B65, 624–638 Netzel and van Smaalen � Charge densities obtained by MEM 631
Figure 6Topological properties of hydrogen bonds from MEM (filled circles) andprior (open circles) densities depending on the distance d(H� � �O). (a)�MEMðBCPÞ and (b) r2�MEMðBCPÞ. The solid line represents the fit to theMEM values given by �ðBCPÞ = 16.14 (3.76) exp[�2.22 (13) d(H� � �O)].Dashed lines are fits to PRIOR values, with �ðBCPÞ = 12.27 (68)exp[�2.05 (3) d(H� � �O)] and r2�ðBCPÞ = 17.77 (4.35) exp[�1.07 (13)d(H� � �O)]. Dotted lines are functions derived by Espinosa, Souhassou,Lachekar & Lecomte (1999) from fits to topological properties ofmultipole densities, with �ðBCPÞ = 8 (4) exp[�2.1 (3) d(H� � �O)] andr2�ðBCPÞ = 330 (180) exp[�2.6 (3) d(H� � �O)].
of static densities, when applied to the dynamic MEM densi-
ties described in this article. The restriction to diffraction data
measured at very low temperatures (T ’ 20 K) is an important
contribution to the validity of this property of the energy
functionals, because these very low temperatures make the
thermal motion as small as possible. We therefore believe that
the functionals by Abramov (1997) [see (6)–(8)] applied to
low-temperature, dynamic MEM densities provide a reason-
able approximation to the energy densities as they have been
defined for the corresponding static densities.
The potential energy density jVðBCPÞj describes the ability
of the system to concentrate electrons at the BCPs, while the
kinetic energy density GðBCPÞ describes the tendency of the
electrons to spread out (Espinosa et al., 1998). Accordingly,
values jVðBCPÞj=GðBCPÞ< 1 are considered to indicate a
depletion of electrons at the BCPs, which corresponds to
closed-shell interactions. Values jVðBCPÞj=GðBCPÞ> 2 indi-
cate an accumulation of electrons at the BCP, which corre-
sponds to a shared-shell interaction, i.e. a covalent bond.
Values of jVðBCPÞj=GðBCPÞ between one and two describe
bonds with partial covalent and partial ionic character (Espi-
nosa et al., 2002, and references therein).
In agreement with previous studies on multipole densities
by Espinosa et al. (1998), we find for hydrogen bonds that both
jVðBCPÞj and GðBCPÞ increase on decreasing the distance
d(H� � �O) (Fig. 8). However, the relation between VðBCPÞ and
GðBCPÞ is not linear, such that jVðBCPÞj=GðBCPÞ increases
with decreasing distance d(H� � �O) (Fig. 9). These relations
research papers
632 Netzel and van Smaalen � Charge densities obtained by MEM Acta Cryst. (2009). B65, 624–638
Figure 7Curvatures at the BCPs of hydrogen bonds for MEM (filled circles) and prior (open circles) densities. (a) �1ðBCPÞ, (b) �2ðBCPÞ and (c) �3ðBCPÞ as afunction of the distance d(H� � �O). (d) �1ðBCPÞ þ �2ðBCPÞ versus �3ðBCPÞ. Solid lines represent fits to MEM values with �1ðBCPÞ = �378.51 (117.17)exp[�2.85 (18) d(H� � �O)], �2ðBCPÞ=�292.51 (144.41) exp[�2.90 (29) d(H� � �O)] and �3ðBCPÞ = 233.39 (53.80) exp[�2.09 (13) d(H� � �O)]. Dashed linesrepresent fits to PRIOR values with �1ðBCPÞ = �261.92 (15.83) exp[�2.87 (4) d(H� � �O)], �2ðBCPÞ = �200.00 (13.58) exp[�2.76 (4) d(H� � �O)] and�3ðBCPÞ = 176.54 (23.44) exp[�1.92 (7) d(H� � �O)]. The dotted line is the function determined by Espinosa, Souhassou, Lachekar & Lecomte (1999) formultipole densities, with �3ðBCPÞ = 410 (80) exp[�2.4 (1) d(H� � �O)]. The solid line in (d) is the function �1ðBCPÞ þ �2ðBCPÞ = ��3ðBCPÞ.

can again be described by exponential functions. From the
average exponential dependence of jVðBCPÞj=GðBCPÞ of
MEM densities on d(H� � �O), two distances can be derived
that describe the cross-over between covalent, mixed-char-
acter and closed-shell types of hydrogen bonds. The distance
d1 = 2.21 A is the distance at which jVðBCPÞj=GðBCPÞ ¼ 1
and d2 = 1.47 A is the distance at which
jVðBCPÞj=GðBCPÞ ¼ 2. MEM electron densities are thus in
agreement with long hydrogen bonds [d(H� � �O) > d1] being
dominated by electrostatic interactions, while short hydrogen
bonds [d(H� � �O)< d2] are covalent bonds. Most hydrogen
bonds studied in the present work are of intermediate char-
acter (d2 < d(H� � �O)< d1 ; see Fig. 9) and thus at least partly
covalent.
The distances d1 and d2 coincide with the classification by
Jeffrey (1997) who considers hydrogen bonds with d(H� � �O) >
2.2 A to be weak and hydrogen bonds with d(H� � �O) < 1.5 A
to be strong. MEM electron densities thus indicate that strong
hydrogen bonds are covalent bonds, while weak hydrogen
bonds possess mainly electrostatic character. Most hydrogen
bonds are of intermediate strength and will have mixed
covalent–electrostatic character.
A few outliers can be observed in Fig. 9, for which
jVðBCPÞj=GðBCPÞ 2 or jVðBCPÞj=GðBCPÞ< 0. These
points are precisely those hydrogen bonds for which a nega-
tive Laplacian r2�ðBCPÞ has been obtained (Fig. 6). Since a
negative Laplacian is interpreted as being non-physical for
hydrogen bonds, these values of jVðBCPÞj=GðBCPÞ are most
probably caused by inaccuracies of the MEM or the data.
Deviations from a smooth dependence on the distance might
also arise from the approximate character of (6)–(8)
(Abramov, 1997), and from the fact that these relations have
not been derived for dynamic densities.
research papers
Acta Cryst. (2009). B65, 624–638 Netzel and van Smaalen � Charge densities obtained by MEM 633
Figure 8Energetic properties of hydrogen bonds of MEM (filled circles) and prior(open circles) densities depending on the distance d(H� � �O). (a) Kineticenergy density GðBCPÞ, (b) potential energy density VðBCPÞ and (c) totalenergy density HðBCPÞ. Solid lines represent fits to the MEM values withGðBCPÞ = 4.331 (1.879) � 103 exp[�2.29 (25) d(H� � �O)], VðBCPÞ =�2.572 (627) � 104 exp[�3.09 (14) d(H� � �O)] and HðBCPÞ = �1.419(1.040) � 105 exp[�4.76 (46) d(H� � �O)]. Dashed lines correspond to fitsto prior values with GðBCPÞ = 4.335 (590) � 103 exp[�2.14 (8)d(H� � �O)], VðBCPÞ = �2.113 (178) � 104 exp[�2.91 (5) d(H� � �O)] andHðBCPÞ = �2.721 (782) � 105 exp[�5.33 (18) d(H� � �O)]. Dotted linesare functions determined by Espinosa et al. (1998) for multipole densities,with GðBCPÞ = 12 (2) � 103 exp[�2.73 (9) d(H� � �O)] and VðBCPÞ = �50(1.1) � 103 exp[�3.6 d(H� � �O)].
Figure 9Ratio of potential and kinetic energy densities jVðBCPÞj=GðBCPÞ atBCPs of hydrogen bonds of MEM (filled circles) and prior (open circles)densities depending on the distance d(H� � �O). The solid line representsthe fit to the MEM values with jVðBCPÞj=GðBCPÞ = 7.95 (5.07)exp[�0.94 (34) d(H� � �O)]. The dashed line represents the fit to the priorvalues with jVðBCPÞj=GðBCPÞ = 4.17 (30) exp[�0.69 (4) d(H� � �O)]. d1 =2.21 A and d2 = 1.47 A.
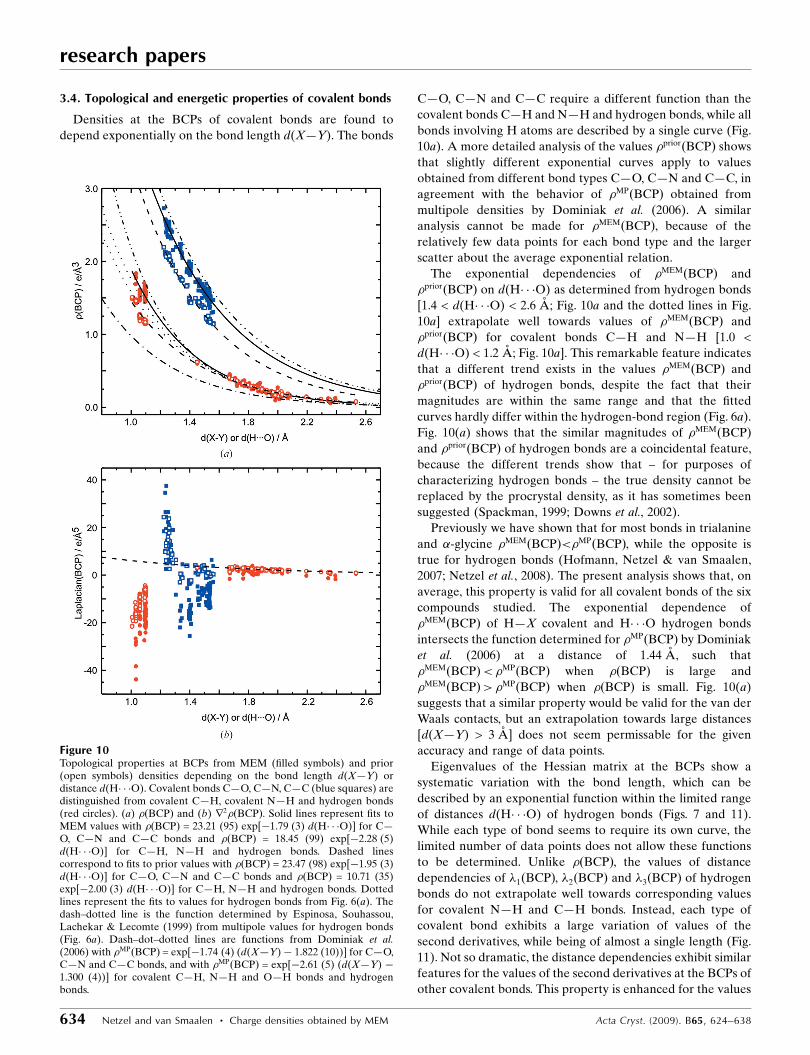
3.4. Topological and energetic properties of covalent bonds
Densities at the BCPs of covalent bonds are found to
depend exponentially on the bond length d(X—Y). The bonds
C—O, C—N and C—C require a different function than the
covalent bonds C—H and N—H and hydrogen bonds, while all
bonds involving H atoms are described by a single curve (Fig.
10a). A more detailed analysis of the values �priorðBCPÞ shows
that slightly different exponential curves apply to values
obtained from different bond types C—O, C—N and C—C, in
agreement with the behavior of �MPðBCPÞ obtained from
multipole densities by Dominiak et al. (2006). A similar
analysis cannot be made for �MEMðBCPÞ, because of the
relatively few data points for each bond type and the larger
scatter about the average exponential relation.
The exponential dependencies of �MEMðBCPÞ and
�priorðBCPÞ on d(H� � �O) as determined from hydrogen bonds
[1.4 < d(H� � �O) < 2.6 A; Fig. 10a and the dotted lines in Fig.
10a] extrapolate well towards values of �MEMðBCPÞ and
�priorðBCPÞ for covalent bonds C—H and N—H [1.0 <
d(H� � �O) < 1.2 A; Fig. 10a]. This remarkable feature indicates
that a different trend exists in the values �MEMðBCPÞ and
�priorðBCPÞ of hydrogen bonds, despite the fact that their
magnitudes are within the same range and that the fitted
curves hardly differ within the hydrogen-bond region (Fig. 6a).
Fig. 10(a) shows that the similar magnitudes of �MEMðBCPÞ
and �priorðBCPÞ of hydrogen bonds are a coincidental feature,
because the different trends show that – for purposes of
characterizing hydrogen bonds – the true density cannot be
replaced by the procrystal density, as it has sometimes been
suggested (Spackman, 1999; Downs et al., 2002).
Previously we have shown that for most bonds in trialanine
and �-glycine �MEMðBCPÞ<�MPðBCPÞ, while the opposite is
true for hydrogen bonds (Hofmann, Netzel & van Smaalen,
2007; Netzel et al., 2008). The present analysis shows that, on
average, this property is valid for all covalent bonds of the six
compounds studied. The exponential dependence of
�MEMðBCPÞ of H—X covalent and H� � �O hydrogen bonds
intersects the function determined for �MPðBCPÞ by Dominiak
et al. (2006) at a distance of 1.44 A, such that
�MEMðBCPÞ<�MPðBCPÞ when �ðBCPÞ is large and
�MEMðBCPÞ>�MPðBCPÞ when �ðBCPÞ is small. Fig. 10(a)
suggests that a similar property would be valid for the van der
Waals contacts, but an extrapolation towards large distances
[d(X—Y) > 3 A] does not seem permissable for the given
accuracy and range of data points.
Eigenvalues of the Hessian matrix at the BCPs show a
systematic variation with the bond length, which can be
described by an exponential function within the limited range
of distances d(H� � �O) of hydrogen bonds (Figs. 7 and 11).
While each type of bond seems to require its own curve, the
limited number of data points does not allow these functions
to be determined. Unlike �ðBCPÞ, the values of distance
dependencies of �1ðBCPÞ, �2ðBCPÞ and �3ðBCPÞ of hydrogen
bonds do not extrapolate well towards corresponding values
for covalent N—H and C—H bonds. Instead, each type of
covalent bond exhibits a large variation of values of the
second derivatives, while being of almost a single length (Fig.
11). Not so dramatic, the distance dependencies exhibit similar
features for the values of the second derivatives at the BCPs of
other covalent bonds. This property is enhanced for the values
research papers
634 Netzel and van Smaalen � Charge densities obtained by MEM Acta Cryst. (2009). B65, 624–638
Figure 10Topological properties at BCPs from MEM (filled symbols) and prior(open symbols) densities depending on the bond length d(X—Y) ordistance d(H� � �O). Covalent bonds C—O, C—N, C—C (blue squares) aredistinguished from covalent C—H, covalent N—H and hydrogen bonds(red circles). (a) �ðBCPÞ and (b) r2�ðBCPÞ. Solid lines represent fits toMEM values with �ðBCPÞ = 23.21 (95) exp[�1.79 (3) d(H� � �O)] for C—O, C—N and C—C bonds and �ðBCPÞ = 18.45 (99) exp[�2.28 (5)d(H� � �O)] for C—H, N—H and hydrogen bonds. Dashed linescorrespond to fits to prior values with �ðBCPÞ = 23.47 (98) exp[�1.95 (3)d(H� � �O)] for C—O, C—N and C—C bonds and �ðBCPÞ = 10.71 (35)exp[�2.00 (3) d(H� � �O)] for C—H, N—H and hydrogen bonds. Dottedlines represent the fits to values for hydrogen bonds from Fig. 6(a). Thedash–dotted line is the function determined by Espinosa, Souhassou,Lachekar & Lecomte (1999) from multipole values for hydrogen bonds(Fig. 6a). Dash–dot–dotted lines are functions from Dominiak et al.(2006) with �MPðBCPÞ = exp[�1.74 (4) (d(X—Y)� 1.822 (10))] for C—O,C—N and C—C bonds, and with �MPðBCPÞ = exp[�2.61 (5) (d(X—Y) �1.300 (4))] for covalent C—H, N—H and O—H bonds and hydrogenbonds.

of r2�MEMðBCPÞ and r2�priorðBCPÞ (Fig. 10b). While a
systematic dependence of r2�ðBCPÞ on the bond distance has
been reported for values derived from multipole densities
(Dominiak et al., 2006), a close inspection of the published
diagrams shows that r2�MPðBCPÞ exhibits similar features as
presently found for r2�MEMðBCPÞ and r2�priorðBCPÞ, i.e.
different values for bonds of nearly equal length.
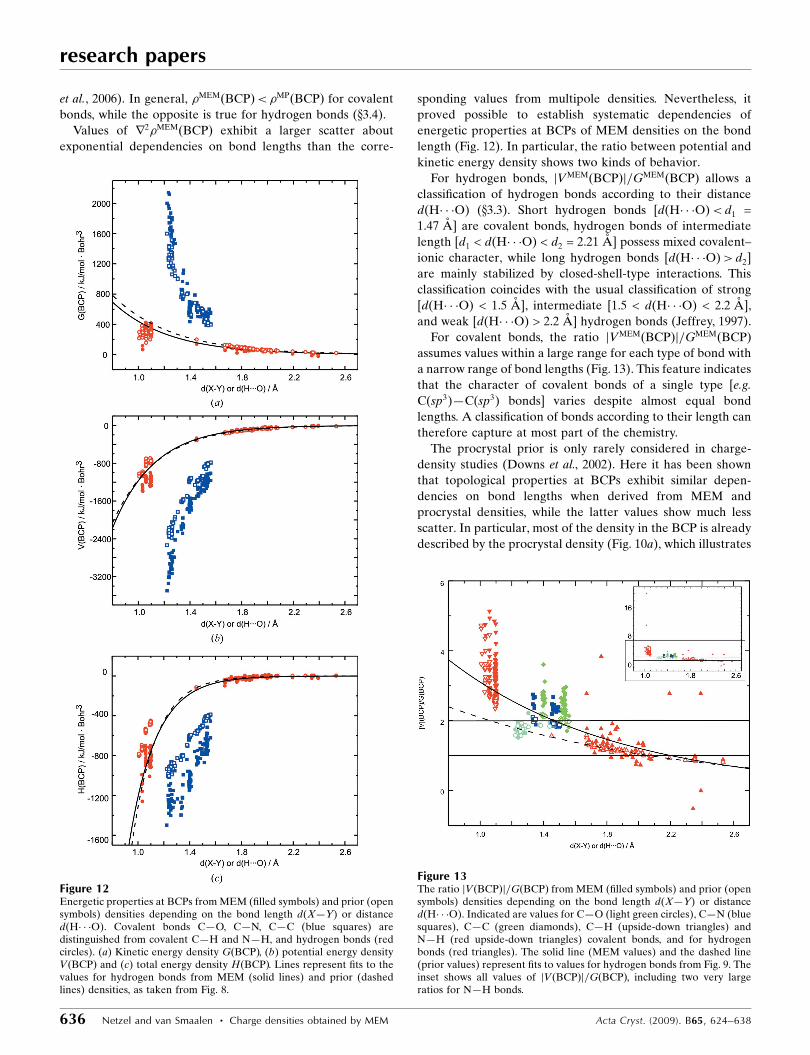
The properties of the distance dependencies of �ðBCPÞ and
r2�ðBCPÞ are transported towards the energy densities at the
BCPs (Fig. 12). They are even more pronounced for the values
of jVðBCPÞj=GðBCPÞ. jVMEMðBCPÞj=GMEMðBCPÞ assumes a
large range of values for covalent bonds C—C, C—N, C—H
and N—H, while distances of these bonds cluster around a few
values only (Fig. 13). This suggests a variation in the character
of bonds of similar length, as might be the result of different
environments of these bonds.
Polar C—O bonds appear to be of mixed covalent/ionic
character with jVMEMðBCPÞj=GMEMðBCPÞ< 2, while bonds
C—C, C—N, C—H and N—H appear to be covalent with
jVMEMðBCPÞj=GMEMðBCPÞ> 2 (Fig. 13), in accordance with
general chemical knowledge. For covalent bonds C—C and
C—N jVpriorðBCPÞj=GpriorðBCPÞ is close to two and generally
much smaller than jVMEMðBCPÞj=GMEMðBCPÞ. This again
shows that the true density should not be replaced by the
procrystal density for the quantitative description of chemical
bonding.
4. Conclusions
Charge densities have been determined by the MEM from X-
ray diffraction data on six different crystals of amino acids and
tripeptides. Employing the previously proposed criterion of
convergence for the iterations of the MEM (Hofmann, Netzel
& van Smaalen, 2007), the values of �2aim have been found to
vary by a factor of four. These values correlate with the GoF of
the multipole refinements (Table 1), and they thus show the
ability of the MEM to determine the correct scale of standard
uncertainties of measured intensities (x2.1).
Electron densities �MEMðxÞ and �MPðxÞ exhibit similar
features, with atomic maxima and BCPs at similar positions
(Hofmann, Netzel & van Smaalen, 2007; Netzel et al., 2008).
Differences are due to the differences between dynamic
[�MEMðxÞ] and static [�MPðxÞ] densities as well as the peculia-
rities of each method. Electron densities in hydrogen bonds
have been found to be better represented by the MEM than by
multipole models (x3.1), as it is the result of the inflexibility of
the multipole model for the small number of poles (lmax ¼ 1)
that has been used for H atoms (Volkov et al., 2000, 2001;
Volkov & Coppens, 2001; Madsen et al., 2004; Koritsanszky,
2006).
MEM densities at BCPs show an exponential dependence
on the bond length with individual functions for covalent
bonds between non-H atoms and bonds involving H atoms.
These functions differ from the functions that have been
determined for multipole densities at BCPs (Figs. 6a and 10a)
(Espinosa, Souhassou, Lachekar & Lecomte, 1999; Dominiak
research papers
Acta Cryst. (2009). B65, 624–638 Netzel and van Smaalen � Charge densities obtained by MEM 635
Figure 11Curvatures at BCPs from MEM (filled symbols) and prior (open symbols)densities depending on the bond length d(X—Y) or distance d(H� � �O).Covalent bonds C—O, C—N, C—C (blue squares) are distinguished fromcovalent C—H and N—H and hydrogen bonds (red circles). (a) �1ðBCPÞ,(b) �2ðBCPÞ and (c) �3ðBCPÞ. Lines represent fits to the values forhydrogen bonds from MEM (solid lines) and prior (dashed lines)densities, as taken from Fig. 7.
et al., 2006). In general, �MEMðBCPÞ<�MPðBCPÞ for covalent
bonds, while the opposite is true for hydrogen bonds (x3.4).
Values of r2�MEMðBCPÞ exhibit a larger scatter about
exponential dependencies on bond lengths than the corre-
sponding values from multipole densities. Nevertheless, it
proved possible to establish systematic dependencies of
energetic properties at BCPs of MEM densities on the bond
length (Fig. 12). In particular, the ratio between potential and
kinetic energy density shows two kinds of behavior.
For hydrogen bonds, jVMEMðBCPÞj=GMEMðBCPÞ allows a
classification of hydrogen bonds according to their distance
d(H� � �O) (x3.3). Short hydrogen bonds [d(H� � �O)< d1 =
1.47 A] are covalent bonds, hydrogen bonds of intermediate
length [d1 < d(H� � �O) < d2 = 2.21 A] possess mixed covalent–
ionic character, while long hydrogen bonds [d(H� � �O)> d2]
are mainly stabilized by closed-shell-type interactions. This
classification coincides with the usual classification of strong
[d(H� � �O) < 1.5 A], intermediate [1.5 < d(H� � �O) < 2.2 A],
and weak [d(H� � �O) > 2.2 A] hydrogen bonds (Jeffrey, 1997).
For covalent bonds, the ratio jVMEMðBCPÞj=GMEMðBCPÞ
assumes values within a large range for each type of bond with
a narrow range of bond lengths (Fig. 13). This feature indicates
that the character of covalent bonds of a single type [e.g.
C(sp3)—C(sp3) bonds] varies despite almost equal bond
lengths. A classification of bonds according to their length can
therefore capture at most part of the chemistry.
The procrystal prior is only rarely considered in charge-
density studies (Downs et al., 2002). Here it has been shown
that topological properties at BCPs exhibit similar depen-
dencies on bond lengths when derived from MEM and
procrystal densities, while the latter values show much less
scatter. In particular, most of the density in the BCP is already
described by the procrystal density (Fig. 10a), which illustrates
research papers
636 Netzel and van Smaalen � Charge densities obtained by MEM Acta Cryst. (2009). B65, 624–638
Figure 12Energetic properties at BCPs from MEM (filled symbols) and prior (opensymbols) densities depending on the bond length d(X—Y) or distanced(H� � �O). Covalent bonds C—O, C—N, C—C (blue squares) aredistinguished from covalent C—H and N—H, and hydrogen bonds (redcircles). (a) Kinetic energy density GðBCPÞ, (b) potential energy densityVðBCPÞ and (c) total energy density HðBCPÞ. Lines represent fits to thevalues for hydrogen bonds from MEM (solid lines) and prior (dashedlines) densities, as taken from Fig. 8.
Figure 13The ratio jVðBCPÞj=GðBCPÞ from MEM (filled symbols) and prior (opensymbols) densities depending on the bond length d(X—Y) or distanced(H� � �O). Indicated are values for C—O (light green circles), C—N (bluesquares), C—C (green diamonds), C—H (upside-down triangles) andN—H (red upside-down triangles) covalent bonds, and for hydrogenbonds (red triangles). The solid line (MEM values) and the dashed line(prior values) represent fits to values for hydrogen bonds from Fig. 9. Theinset shows all values of jVðBCPÞj=GðBCPÞ, including two very largeratios for N—H bonds.

the difficulties of MEM calculations and multipole refinements
in establishing a charge density beyond the procrystal model.
Differences between MEM and procrystal densities are more
pronounced in the energy densities. This suggests that only the
true charge densities – whether obtained by the MEM, the
multipole model or some other method – may lead to a correct
interpretation of the character of bonds.
Different trends could be identified in the distance depen-
dencies of �MEMðBCPÞ and �priorðBCPÞ of hydrogen bonds,
despite almost equal values of �MEMðBCPÞ and �priorðBCPÞ for
these bonds (Figs. 6a and 10a). This remarkable feature
stresses that MEM and procrystal densities are different, and
it shows once more that – for purposes of characterizing
chemical bonding in hydrogen bonds – the true density cannot
be replaced by the procrystal density, as has sometimes been
suggested (Spackman, 1999; Downs et al., 2002).
We are greatly indebted to R. Destro and P. Luger and
coworkers for providing the diffraction data. R. Destro and L.
Lo Presti are thanked for providing a yet unpublished plot of a
difference-Fourier map of l-alanine (Fig. 2c). Financial
support was obtained from the German Science Foundation
(DFG) within the framework of the priority program
SPP1178.
References
Abramov, Yu. A. (1997). Acta Cryst. A53, 264–272.Bader, R. F. W. (1994). Atoms in Molecules – A Quantum Theory.
Oxford University Press.Bagautdinov, B., Luedecke, J., Schneider, M. & van Smaalen, S.
(1998). Acta Cryst. B54, 626–634.Baur, W. H. (1972). Acta Cryst. B28, 1456–1465.Benabicha, F., Pichon-Pesme, V., Jelsch, C., Lecomte, C. & Khmou, A.
(2000). Acta Cryst. B56, 155–165.Checinska, L., Mebs, S., Hubschle, C. B., Forster, D., Morgenroth, W.
& Luger, P. (2006). Org. Biomol. Chem. 4, 3242–3251.Cremer, A. & Kraka, E. (1984a). Angew. Chem. 96, 612–614.Cremer, A. & Kraka, E. (1984b). Croat. Chem. Acta, 57, 1259–1281.Destro, R. & Lo Presti, L. (2008). Personal communication.Destro, R., Marsh, R. E. & Bianchi, R. (1988). J. Phys. Chem. 92, 966–
973.Destro, R., Roversi, P., Barzaghi, M. & Marsh, R. E. (2000). J. Phys.
Chem. A, 104, 1047–1054.Destro, R., Soave, R. & Barzaghi, M. (2008). J. Phys. Chem. B, 112,
5163–5174.Dominiak, P. M., Makal, A., Mallinson, P. R., Trzcinska, K., Eilmes, J.,
Grech, E., Chryszcz, M., Minor, W. & Wozniak, K. (2006). Chem.Eur. J. 12, 1941–1949.
Downs, R. T., Gibbs, G. V., Boisen Jr, M. B. & Rosso, K. M. (2002).Phys. Chem. Miner. 29, 369–385.
Espinosa, E., Alkorta, I., Elguero, J. & Molins, E. (2002). J. Chem.Phys. 117, 5529–5542.
Espinosa, E., Lecomte, C. & Molins, E. (1999). Chem. Phys. Lett. 300,745–748.
Espinosa, E., Molins, E. & Lecomte, C. (1998). Chem. Phys. Lett. 285,170–173.
Espinosa, E., Souhassou, M., Lachekar, H. & Lecomte, C. (1999).Acta Cryst. B55, 563–572.
Flaig, R., Koritsanszki, T., Dittrich, B., Wagner, A. & Luger, P. (2002).J. Am. Chem. Soc. 124, 3407–3417.
Grabowsky, S., Pfeuffer, T., Checinska, L., Weber, M., Morgenroth,W., Luger, P. & Schirmeister, T. (2007). Eur. J. Org. Chem. pp.2759–2768.
Gull, S. F. (1989). Maximum Entropy and Bayesian Methods, editedby J. Skilling, pp. 53–71. Dordrecht: Kluwer Academic Publishers.
Gull, S. F. & Skilling, J. (1999). MEMSYS5, Version 1.2. MaximumEntropy Data Consultants Ltd, UK.
Hansen, N. K. & Coppens, P. (1978). Acta Cryst. A34, 909–921.Hofmann, A., Kalinowski, R., Luger, P. & van Smaalen, S. (2007).
Acta Cryst. B63, 633–643.Hofmann, A., Netzel, J. & van Smaalen, S. (2007). Acta Cryst. B63,
285–295.Jauch, W. (1994). Acta Cryst. A50, 650–652.Jauch, W. & Palmer, A. (1993). Acta Cryst. A49, 590–591.Jeffrey, G. A. (1997). An Introduction to Hydrogen Bonding. Oxford
University Press.Kalinowski, R., Dittrich, B., Hubschle, C. B., Paulmann, C. & Luger, P.
(2007). Acta Cryst. B63, 753–767.Koch, U. & Popelier, P. L. A. (1995). J. Phys. Chem. 99, 9747–
9754.Koritsanszky, T. (2006). Hydrogen Bonding – New Insights, edited by
S. J. Grabowski, pp. 441–470. Berlin: Springer.Lyssenko, K. A., Lyubetsky, D. V., Sheremetev, A. B. & Antipin, M. Y.
(2005). Russ. Chem. Bull. Int. Ed. 54, 924–932.Madsen, A. Ø., Sørensen, H. O., Flensburg, C., Stewart, R. F. &
Larsen, S. (2004). Acta Cryst. A60, 550–561.Marechal, Y. (2007). The Hydrogen Bond and the Water Molecule, 1st
ed. Oxford: Elsevier Science Ltd.Matta, C. F. & Bader, R. F. W. (2000). Proteins Struct. Funct. Genet.
40, 310–329.Matta, C. F. & Bader, R. F. W. (2002). Proteins Struct. Funct. Genet.
48, 519–538.Matta, C. F. & Bader, R. F. W. (2003). Proteins Struct. Funct. Genet.
52, 360–399.Mebs, S., Messerschmidt, M. & Luger, P. (2006). Z. Kristallogr. 221,
656–664.Munshi, P., Madsen, A. Ø., Spackman, M. A., Larsen, S. & Destro, R.
(2008). Acta Cryst. A64, 465–475.Netzel, J., Hofmann, A. & van Smaalen, S. (2008). CrystEngComm,
10, 335–343.Nishibori, E., Nakamura, T., Arimoto, M., Aoyagi, S., Ago, H.,
Miyano, M., Ebisuzaki, T. & Sakata, M. (2008). Acta Cryst. D64,237–247.
Ohtomo, N. & Arakawa, K. (1995). Bull. Chem. Soc. Jpn, 51, 1649–1654.
Palatinus, L. & van Smaalen, S. (2005). Acta Cryst. A61, 363–372.Petrıcek, V., Dusek, M. & Palatinus, L. (2000). JANA2000. Institute
of Physics, Praha, Czech Republic.Pichon-Pesme, V., Lachekar, H., Souhassou, M. & Lecomte, C.
(2000). Acta Cryst. B56, 728–737.Rodel, E., Messerschmidt, M., Dittrich, B. & Luger, P. (2006). Org.
Biomol. Chem. 4, 475–481.Roversi, P. & Destro, R. (2004). Chem. Phys. Lett. 386, 472–478.Roversi, P., Irwin, J. J. & Bricogne, G. (1998). Acta Cryst. A54, 971–
996.Sakata, M. & Sato, M. (1990). Acta Cryst. A46, 263–270.Scheins, S., Dittrich, B., Messerschmidt, M., Paulmann, C. & Luger, P.
(2004). Acta Cryst. B60, 184–190.Skilling, J. (1989). Maximum Entropy and Bayesian Methods, edited
by J. Skilling, pp. 45–52. Dordrecht Academic Publishers: Kluwer.Spackman, M. A. (1999). Chem. Phys. Lett. 301, 425–429.Takata, M. & Sakata, M. (1996). Acta Cryst. A52, 287–290.Takata, M., Umeda, B., Nishibori, E., Sakata, M., Saito, Y., Ohno, M.
& Shinohara, H. (1995). Nature, 377, 46–49.van Smaalen, S., Palatinus, L. & Schneider, M. (2003). Acta Cryst.
A59, 459–469.Volkov, A., Abramov, Y. A. & Coppens, P. (2001). Acta Cryst. A57,
272–282.
research papers
Acta Cryst. (2009). B65, 624–638 Netzel and van Smaalen � Charge densities obtained by MEM 637

Volkov, A., Abramov, Y., Coppens, P. & Gatti, C. (2000). Acta Cryst.A56, 332–339.
Volkov, A. & Coppens, P. (2001). Acta Cryst. A57, 395–405.Vries, R. Y. de, Briels, W. J. & Feil, D. (1994). Acta Cryst. A50, 383–
391.Vries, R. Y. de, Briels, W. J. & Feil, D. (1996). Phys. Rev. Lett. 77,
1719–1722.
Wagner, A., Flaig, R., Dittrich, B., Schmidt, H., Koritsanszky, T. &Luger, P. (2004). Chem. Eur. J. 10, 2977–2982.
Wagner, A. & Luger, P. (2001). J. Mol. Struct. 595, 39–46.Whitten, A. E., Turner, P., Klooster, W. T., Piltz, R. O. & Spackman,
M. A. (2006). J. Phys. Chem. A, 110, 8763–8776.Wilson, A. J. C. (1995). Editor. International Tables for Crystallo-
graphy, Vol. C. Dordrecht: Kluwer Academic Publishers.
research papers
638 Netzel and van Smaalen � Charge densities obtained by MEM Acta Cryst. (2009). B65, 624–638


![How do hydrogen bonds influence thermophoresis? · Hydrogen bonds: temperature effect [Kishikawa, Y., SW, and R. Kita, Biomacromolecules, 11 (2010) 740] Many, but not all aqueous](https://img.pdfslide.us/doc/110x75/5ed6a3c9f8f40e7c16721f76/how-do-hydrogen-bonds-influence-thermophoresis-hydrogen-bonds-temperature-effect.jpg)