Embed Size (px)
Citation preview
310 IEEE TRANSACTIONS ON ROBOTICS, VOL. 30, NO. 2, APRIL 2014
Topological Mapping and Scene Recognition WithLightweight Color Descriptors for an
Omnidirectional CameraMing Liu, Student Member, IEEE, and Roland Siegwart, Fellow, IEEE
Abstract—Scene recognition problems for mobile robots havebeen extensively studied. This is important for tasks such as visualtopological mapping. Usually, sophisticated key-point-based de-scriptors are used, which can be computationally expensive. In thispaper, we describe a lightweight novel scene recognition methodusing an adaptive descriptor, which is based on color features andgeometric information that are extracted from an uncalibratedomnidirectional camera. The proposed method enables a mobilerobot to perform online registration of new scenes onto a topologi-cal representation automatically and solve the localization problemto topological regions simultaneously, all in real time. We adopt aDirichlet process mixture model (DPMM) to describe the onlineinference process. It is based on an approximation of conditionalprobabilities of the new measurements given incrementally esti-mated reference models. It enables online inference speeds of up to50 Hz for a normal CPU. We compare it with state-of-the-art key-point descriptors and show the advantage of the proposed algo-rithm in terms of performance and computational efficiency. Areal-world experiment is carried out with a mobile robot equippedwith an omnidirectional camera. Finally, we show the results onextended datasets.
Index Terms—Graphic model, non-parametric learning, omni-directional camera, scene recognition, topological segmentation.
I. INTRODUCTION
A. Motivation
IN this paper, we propose a lightweight descriptor for omni-directional vision. It enables a mobile robot to incrementally
build a topological map that is based on image appearances andlocalize itself at scenes simultaneously. Generally, a model ofthe surrounding environment is needed for robotic missions.Metric and topological maps are the two fundamental types ofenvironment representations. A metric map describes the sur-rounding environment in a precise and measurable way, usuallyby defining free and occupied space with occupancy grids [1] or
Manuscript received July 9, 2012; revised May 14, 2013; accepted June 26,2013. Date of publication August 2, 2013; date of current version April 1, 2014.This paper was recommended for publication by Associate Editor P. Jensfeltand Editor D. Fox upon evaluation of the reviewers’ comments. This work wassupported in part by the EU FP7 project NIFTi under Contract 247870 and inpart by the EU project Robots@home under Grant IST-6-045350.
M. Liu is with the Autonomous Systems Lab, ETH Zurich, Zurich 8092,Switzerland and also with the The Hong Kong University of Science and Tech-nology, Hong Kong (e-mail: [email protected]).
R. Siegwart is with the Autonomous Systems Lab, ETH Zurich, Zurich 8092,Switzerland (e-mail: [email protected]).
Color versions of one or more of the figures in this paper are available onlineat http://ieeexplore.ieee.org.
Digital Object Identifier 10.1109/TRO.2013.2272250
a set of positions/poses of features [2], [3]. Usually, raw-rangesensor measurements are applied to construct such a precisemodel. Although metric maps are able to incorporate redundantinformation for precise mapping, they are typically not capableof handling the data in an efficient way.
In order to efficiently represent the environment, topologicalmapping is widely applied for several vision-based applica-tions [4]–[6], since it contains sufficient information and ex-cludes overly detailed metrics, which may be computationallyexpensive.
Topological mapping and scene recognition techniques areefficient ways to model an environment with sparse informa-tion. It facilitates humans’ cognition and recognition of theirsurroundings as well. When people describe where they are,they normally use unique labels of the places such as “my of-fice,” “the first part of the corridor,” etc.
According to the psychological research [7], region-basedtopological structures are mostly used by humans when suchinformation is learned or recognized. It relies highly on theirability to learn egocentric positions that are based on visualhints. In most cases, the information that humans use is simple.Several studies have shown that color information can affect theperception of humans in terms of spatial dimensions [8] andscene cognition [9], [10]. These intuitive observations can beextended to similar tasks for mobile robots.
The ability to visually detect scene changes and recognizeexisting places is essential to mobile robots. Moreover, sincerobots may have multiple tasks at the same time, it is preferableif these detection and recognition methods are online, whichimplies the need for minimum computational and memory costin real time.
However, for most existing techniques that deal with scenerecognition, major computational time goes into the featureextraction due to the complexity of the feature detector anddescriber, e.g., SIFT [11], SURF [12]. Instead of computingcomplex robust but computationally expensive descriptors, wewould like to focus on matching simple and lightweight de-scriptors, by forming the extraction and matching process as astatistical modeling procedure.
B. Contributions
In our previous work [13], we proposed a lightweight frame-work for the scene recognition problem using an omnidirec-tional camera as the only sensor. It focused on the nonparamet-ric modeling of color-based features that are extracted from thepanoramic images, without detailed tests for performance and
1552-3098 © 2013 IEEE. Personal use is permitted, but republication/redistribution requires IEEE permission.See http://www.ieee.org/publications standards/publications/rights/index.html for more information.
Authorized licensed use limited to: Hong Kong University of Science and Technology. Downloaded on March 02,2020 at 05:41:38 UTC from IEEE Xplore. Restrictions apply.
LIU AND SIEGWART: TOPOLOGICAL MAPPING AND SCENE RECOGNITION WITH LIGHTWEIGHT COLOR DESCRIPTORS 311
analysis. Based on these existing results, the following contri-butions and evaluations are discussed in this paper.
1) Detailed explanation and discussion of the differencesbetween two matching algorithms: The heuristic naivematching algorithm that is based on distance in the featurespace and the statistical method, namely, Dirichlet processmodeled fast adaptive color tags (DP-FACT). By investi-gating illustrated cross-comparison matrices, we show thedecoupled feature space that is used by DP-FACT leads toa more flexible algorithm and reliable results.
2) Further evaluations are carried out, e.g., the linearity of theinference time against the number of topological nodes,time cost for different descriptors, and different types ofCPUs, by which we show the potential to apply the pro-posed framework on platforms with unfavorable hardware.We also discuss the reason why the proposed statisticalmodel performs better than the naive matching algorithm.
3) Extended experiments on a widely cited dataset are in-troduced. The results show the generalization capabilityand lightweight computational complexity of the proposedDP-FACT algorithm.
C. Outline
The remainder of this paper is organized as follows. We firstintroduce the state of the art by referring to several aspects ofrelated works. After introducing the formation of FACT descrip-tors in Section III, we recall some basic concepts related to theDPMM and introduce how we use it for the topological mappingproblem in Section IV. In Section V, we describe an approx-imation method for online reference of the DPMM, followedby results of real-time experiments given in Section VI. Theconclusions and future steps of this study are discussed at theend of the paper.
II. PREVIOUS WORK
A. Perception and Descriptors
Most of the existing place recognition systems assume a finiteset of place labels. The target problem is to determine the labelsfor each image frame. These classifier-based approaches [14]are limited to applications in predefined or known environments.One of the mainstream techniques for visual scene recognitionis based on object detections [15]–[18]. A representative sce-nario of these methods is to first detect known objects in thescene and then maximize the posterior of the place label giventhese recognized objects. Methods that are based on similarconcepts [19]–[21] use key-point-based features for completescenes, by which feature retrieval techniques, such as visualvocabulary, are usually used for large-scale applications [22].These methods are very robust when the objects are correctly de-tected. Nevertheless, the state-of-the-art object detection meth-ods [11], [12] are usually computationally expensive. They arelikely to be unfeasible on computers with limited resources,even with optimizations [23], [24], let alone if the robot hadsimultaneous tasks besides place recognition.
Several lightweight key-point descriptors were developed aswell [25], [26] and widely applied in scene recognition problems[27]–[29]. Unfortunately, most existing applications either deal
with categorization of a finite number of known places or arelimited to offline inferences.
Besides the key-point-based approaches, descriptors using thetransformation/inference of whole images [30]–[35] are alsopopular. Amongst the most similar to our previous contribu-tions [13], [36] is the “fingerprint of a place” [37], [38]. Bothfingerprint and FACT use segments from unwrapped panoramicimages. The difference is that both [37] and [38] used a laserrange finder to help the matching of the descriptors, and FACTonly used color information from the segments. This means thatthe proposed algorithm deals with noisier data and alleviates theextra hardware constraints.
B. Sensors
As far as sensors are concerned, omnidirectional vision hasbeen shown to be one of the most suitable sensors for scenerecognition and visual topological mapping tasks because ofits 360◦ field of view [39], [40]. Another reason for choosingomnidirectional vision is that when the camera is mounted per-pendicularly to the plane of motion, the vertical lines of thescene are mapped onto radial lines on the images. This meansthat the vertical lines are well preserved after the transforma-tion [36]. Several other approaches utilized this feature as well,e.g., [37] and [41]. The proposed algorithm does not require afull calibration of the omnidirectional camera. It only conductsa detection function of the center coordinate of the panoramicimage, which supports the unwrapping operation.
C. Hierarchical Bayesian Modeling
Regarding inference approaches, hierarchical Bayesian meth-ods have been widely used. For example, Vasudevan et al. firstbuilt a hierarchical probabilistic representation of the environ-ment and then used Naive Bayesian to carry out model in-ference [17]. Furthermore, hierarchical probabilistic methodsbased on statistical techniques are very successful in text min-ing and biological information processing [42], [43].
Theoretical advances in hierarchical probabilistic models,such as LDA [43] and HDP [42], provide good support forthe proposed algorithm. The DPMM enables countable infiniteclusters for the measurements, which can be used to representthe process of state detection and recognition. Fei-Fei and Per-ona [44] proposed a key-point-based approach using this frame-work to cluster natural scenes. Nevertheless, this study dealswith indoor environments by using lighter descriptors. In gen-eral, these related works only consider one type of observation,e.g., object names or text semantics. In this study, we adopt theclassical mixture model and then fit it into multiple types ofobservations. At the same time, we allow infinite increment ofthe number of labels. Furthermore, the model is to be learned,updated, and inferred in real time online.
D. Clustering
In order to automate the classification and recognition pro-cess, an unsupervised learning algorithm is required. Sophis-ticated clustering algorithms usually rely, at least in part, on
Authorized licensed use limited to: Hong Kong University of Science and Technology. Downloaded on March 02,2020 at 05:41:38 UTC from IEEE Xplore. Restrictions apply.
312 IEEE TRANSACTIONS ON ROBOTICS, VOL. 30, NO. 2, APRIL 2014
iterative calculations such as K-means, spectral clustering [45],or affinity propagation [46]. An example of an online reasoningapproach is the Chow–Liu tree-based segmentation for staticdata [47] and change-point detection for sequential data [48],[49]. Recent research showed that semisupervised clustering isalso an efficient way in topological structural analysis [50]. Forextreme cases, the synchronization of multisensor data needsto be managed [51], [52] or spatial and temporal hints must bejointly considered [53]. In this paper, a naive online change-point detection algorithm is implemented.
E. Recognition and Inference
Recognition is at the core of most robotic applications. Forexample, robot topological mapping requires detection andrecognition of loop closure; semantic mapping usually requiresrecognition of objects, and human–machine interfaces requirerecognition of human behaviors. Researchers targeting thesecore problems attempt to seek the best algorithms to representthis perception process efficiently.
Concerning inference approaches, hierarchical probabilisticmethods based on statistical techniques have achieved greatsuccess in text classification and biological information process-ing [42], [43]. In this study, we adapt the classical mixture modelto allow multiple types of observations. At the same time, weallow infinite increment of the number of labels. Furthermore,the model is derived and inferred online.
In most of the related works, change-point detection is the ba-sis for segmenting a data sequence [49], [54], [55]. In this study,since we are targeting a lightweight method, the change-pointdetection is not feasible when using multiple hypothesis meth-ods, e.g., particle filtering [49]. Instead, we use a nonparametricstatistical test to evaluate the labeling for each frame separately.This may cause instability in the output label, but it alleviatesthe requirement to store all previous measurement data in thesequence.
F. Topological Mapping
Several works deal with the extraction of topological regionsfrom metric maps. Intuitively, a topological map is defined as agraph structure, which is composed of nodes and links amongthem. In general, there are two types of topological maps,depending on what a node represents. Most existing worksconsider nodes in a topological map as waypoints [56]–[61]in the metric map. The rest consider nodes as interesting re-gions [62]–[64], namely region-based topological maps. Con-ceptually, both types describe environments by topology repre-sentations, typically by using graph structures. However, theyhave different purposes in terms of robotic tasks. The first typeis generally built for facilitating navigation [60], [65] using localnavigation [66], [67] methods between nodes, or using topolog-ical pose graph [68]. The second type is to enable robots to sharea common understanding of the environment with humans, suchas in [64], [69], for service purposes. The proposed method con-siders topological mapping in twofold way. First, it aims to finda way similar to how humans would model the world. Second,
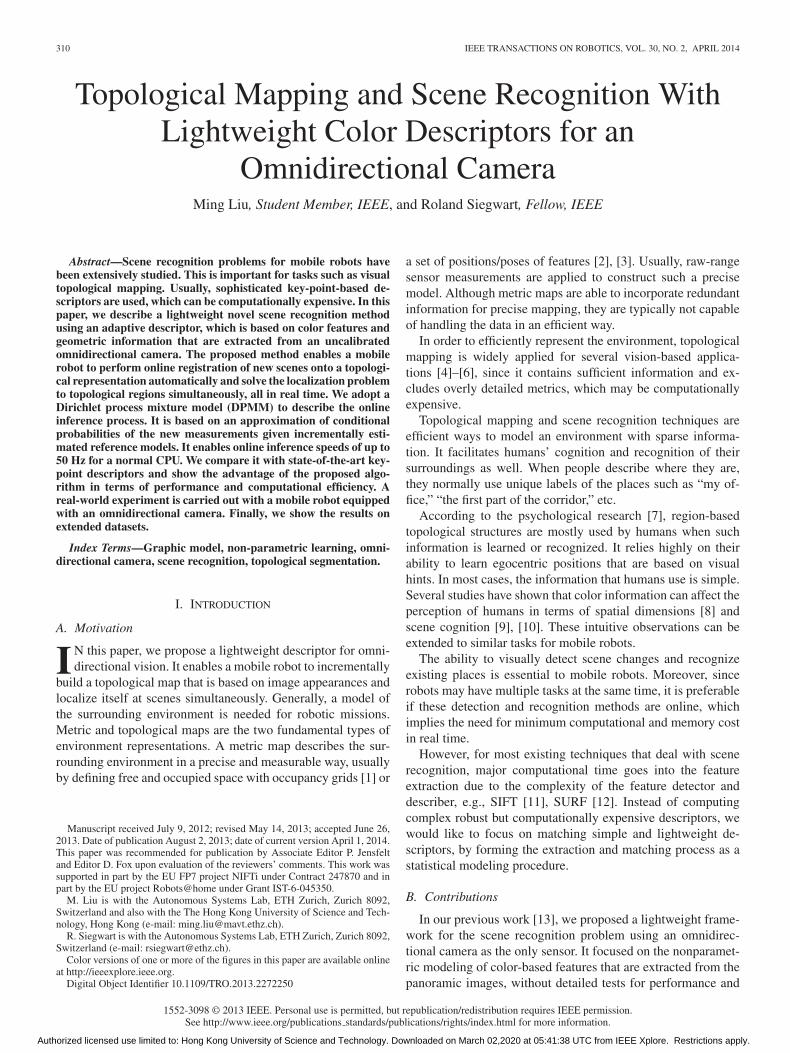
Fig. 1. Extraction of vertical segments. (a) Unwrapped panoramic image.(b) Output of vertical edges detection. (c) Segmentation result.
at the same time, it helps several aspects of robot navigation,e.g., loop closing or node formation.
G. Further References for Color Features
As for color features, besides the fingerprint of place [37], adetailed report on the state of art can be found in [70]. Generallyspeaking, a color feature is a weak descriptor, as it can be easilyaffected by lighting conditions. It is the main reason for using astatistical method to minimize the uncertainty.
III. DESCRIPTOR
In this section, we first introduce how the FACT descriptor isextracted from omnidirectional camera images. Then, we showhow FACT can be represented, based on absolute measurementsand statistical ways, e.g., histograms. In addition, we presenta naive approach to match two FACT descriptors and depict adistance matrix over frames of an indoor dataset.
A. Segmentation of the Panorama
The proposed descriptor is based on color features and seg-mentation of the panoramic image. Since the vertical lines fromthe environment are preserved during a typical motion of mo-bile robots in a 2-D plane, the dominant vertical lines are usedto segment the panoramic image. The examples of extractionresults are shown in Fig. 1.
After unwrapping the raw panoramic image [see Fig. 1(a)], weapply, in sequence, Sobel filtering (only along the x direction),Otsu thresholding [71], and morphological operators to extractthe most dominant vertical lines. Fig. 1(b) shows the result of thevertical extraction process. Note that only half of the unwrappedimage is shown here because of the width limitation.
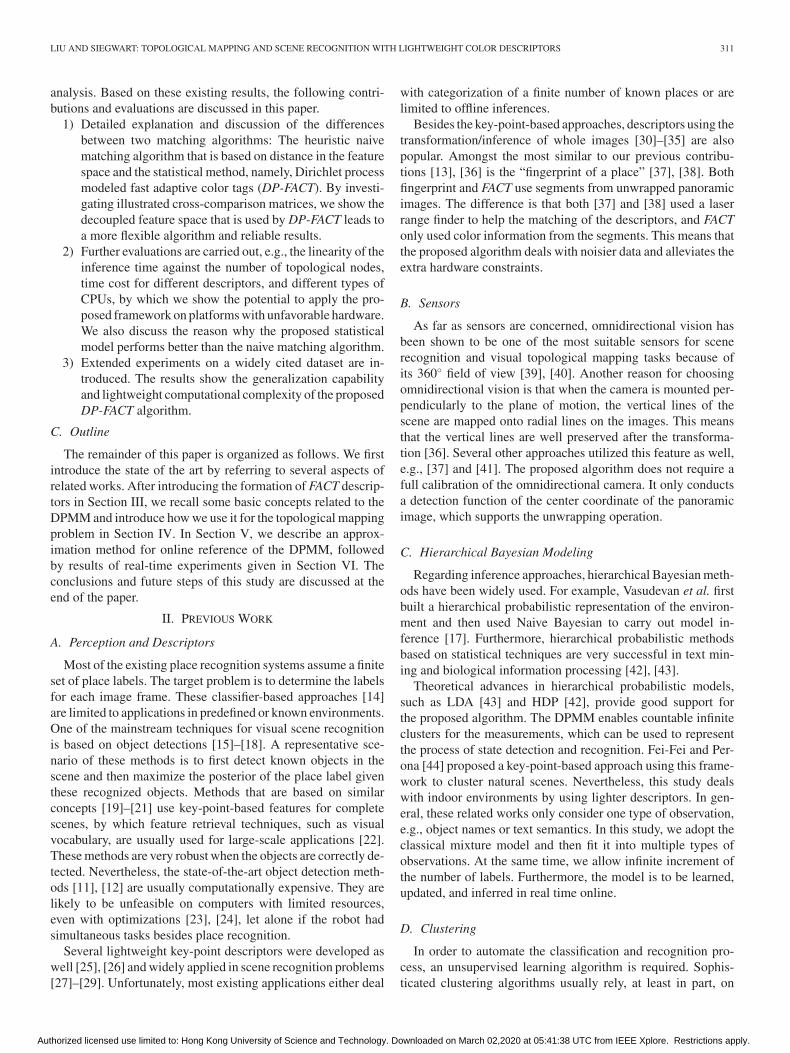
The dominant vertical lines are chosen based on their length.The lines with length above the average are retained. Morpho-logical operators are used to fuse the lines, which are too close
Authorized licensed use limited to: Hong Kong University of Science and Technology. Downloaded on March 02,2020 at 05:41:38 UTC from IEEE Xplore. Restrictions apply.
LIU AND SIEGWART: TOPOLOGICAL MAPPING AND SCENE RECOGNITION WITH LIGHTWEIGHT COLOR DESCRIPTORS 313
Fig. 2. Segmentation process.
to each other, as a single line. The detailed processing phasesare shown in Fig. 2.
As observed in Fig. 1(c), the vertical lines partition thepanoramic image into multiple regions. In the next section, wewill explain how to extract color-based lightweight descriptors,which we name Tags, from these regions.
B. FACT Descriptor
In this section, we describe the components that construct aFACT descriptor. The color representation in RGB color space isnot suitable, since it is sensitive to illumination changes, whichmay be caused by translation and rotation of the omnidirectionalcamera, as well as different times of the day. Alternatively, weuse the YUV color space. The Euclidean distance between twocolor sites is shown as
⎧⎪⎨
⎪⎩
Ui = 0.7 ∗ Ri − 0.6 ∗ Gi − 0.1 ∗ Bi
Vi = 0.9 ∗ Bi − 0.3 ∗ Ri − 0.6 ∗ Gi
Dis1,2 =√
(U1 − U2)2 + (V1 − V2)2 .
(1)
Different environment lights may cause white-balance changes.In order to automatically adjust the white-balance, we imple-ment a PD controller to adjust camera parameters. The cameraparameters are tuned according to sampled UV values from areflective white paper, which is stuck in the field of view.
C. Construction of the FACT Descriptor
We extract the descriptor based on the segmented unwrappedimage explained in the previous section. In this study, we chosethe YUV color space, where the Y signal represents the overallbrightness of the pixel and U–V are the two chromatic compo-nents. The benefit of using this color space is that we only needtwo elements (i.e., U and V) to represent a color, regardless ofits brightness.
For each region between two vertical lines, the average colorvalue in the U–V space is extracted. Compared with other key-point-based or edge-based descriptors, an obvious advantageof our approach is that the similarity between features in theU–V space can be simply measured in terms of a 2-D Euclideandistance. The descriptor is formed by the U–V color informationand the width W (in pixels) of the region, which is delimitedbetween two vertical edges. Instead of taking each pixel in everyregion into account, we directly use the average of U–V valuethat was calculated for each region. Ui and Vi indicate the colorinformation of region i.
One primitive idea is that even if the width of each regionmay change during the translation of the camera, the projectedarea in the real world can be well determined in a local neigh-borhood, as long as the segmentation stays consistent. In thiscase, the average value of a certain region in the color spaceremains constant. On the other hand, we must avoid false posi-tive matches that are caused by color similarity of regions. Forexample, the difference between a green cup and a green cabinetmay be very small in color space, but the geometric features ofthese two are distinguishable. Therefore, we employ the widthof the corresponding region Wi as the third dimension of ourdescriptor. By testing the ratio of the corresponding regions’width, the descriptor can get more reliable results. Let N be thenumber of regions segmented from the unwrapped image1. Thedimension of the FACT descriptor of a scene is 3 × N . A sampledescriptor D is shown in (2). Each column in the descriptor isnamed a Tag
D =
⎛
⎜⎝
U1 U2 UN
V1 V2 . . . VN
W1 W2 WN
⎞
⎟⎠ . (2)
D. Statistical Representation of FACT
DP-FACT [13] grants the FACT descriptor statistical mean-ings. DP-FACT uses two multinomial distributions, i.e.,DP-FACTt := {wt, gt}, to show the statistical distributions ofTag’s over discrete feature spaces. Considering a serialized dis-cretization of the U–V color space into m bins, and the numberof Tags for a given image at timestamp t is N , we derive thedistribution of the color component gt as follows:
gt ∼ p(r;N,m, h) =N !
r1 !r2 ! · · · rm !hr1
1 hr22 · · ·hrm
m (3)
where the variable r is a vector with m integers for which0 ≤ ri ≤ N and
∑i ri = N . N > 0 and m > 2 are integers,
and h is a vector with elements 0 ≤ hi ≤ 1,∑
i hi = 1.Similarly, the width component wt can also be defined for
each image t, such that
wt ∼ p(r′;N,n, h′) =N !
r′1 !r′2 ! · · · r′n !
h′r ′1
1 h′r ′2
2 · · ·h′r ′n
n (4)
1According to our experiment, N is usually smaller than 100 and greater than20 for typical indoor environments.
Authorized licensed use limited to: Hong Kong University of Science and Technology. Downloaded on March 02,2020 at 05:41:38 UTC from IEEE Xplore. Restrictions apply.
314 IEEE TRANSACTIONS ON ROBOTICS, VOL. 30, NO. 2, APRIL 2014
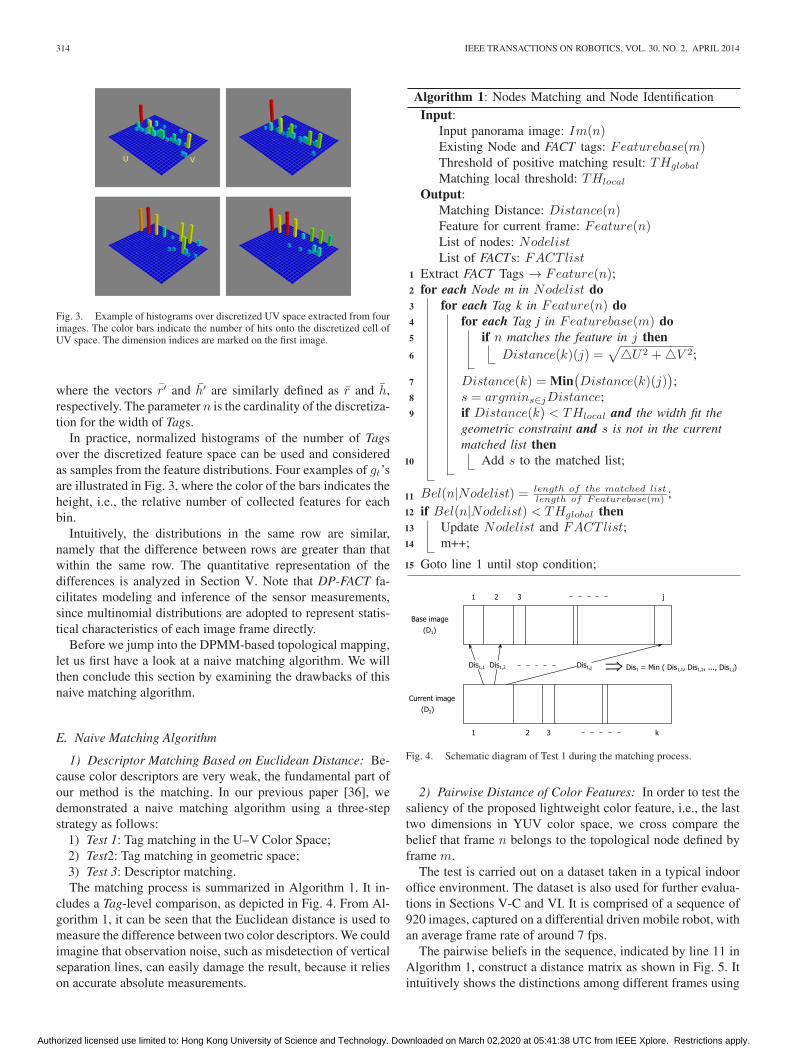
Fig. 3. Example of histograms over discretized UV space extracted from fourimages. The color bars indicate the number of hits onto the discretized cell ofUV space. The dimension indices are marked on the first image.
where the vectors r′ and h′ are similarly defined as r and h,respectively. The parameter n is the cardinality of the discretiza-tion for the width of Tags.
In practice, normalized histograms of the number of Tagsover the discretized feature space can be used and consideredas samples from the feature distributions. Four examples of gt’sare illustrated in Fig. 3, where the color of the bars indicates theheight, i.e., the relative number of collected features for eachbin.
Intuitively, the distributions in the same row are similar,namely that the difference between rows are greater than thatwithin the same row. The quantitative representation of thedifferences is analyzed in Section V. Note that DP-FACT fa-cilitates modeling and inference of the sensor measurements,since multinomial distributions are adopted to represent statis-tical characteristics of each image frame directly.
Before we jump into the DPMM-based topological mapping,let us first have a look at a naive matching algorithm. We willthen conclude this section by examining the drawbacks of thisnaive matching algorithm.
E. Naive Matching Algorithm
1) Descriptor Matching Based on Euclidean Distance: Be-cause color descriptors are very weak, the fundamental part ofour method is the matching. In our previous paper [36], wedemonstrated a naive matching algorithm using a three-stepstrategy as follows:
1) Test 1: Tag matching in the U–V Color Space;2) Test2: Tag matching in geometric space;3) Test 3: Descriptor matching.The matching process is summarized in Algorithm 1. It in-
cludes a Tag-level comparison, as depicted in Fig. 4. From Al-gorithm 1, it can be seen that the Euclidean distance is used tomeasure the difference between two color descriptors. We couldimagine that observation noise, such as misdetection of verticalseparation lines, can easily damage the result, because it relieson accurate absolute measurements.
Fig. 4. Schematic diagram of Test 1 during the matching process.
2) Pairwise Distance of Color Features: In order to test thesaliency of the proposed lightweight color feature, i.e., the lasttwo dimensions in YUV color space, we cross compare thebelief that frame n belongs to the topological node defined byframe m.
The test is carried out on a dataset taken in a typical indooroffice environment. The dataset is also used for further evalua-tions in Sections V-C and VI. It is comprised of a sequence of920 images, captured on a differential driven mobile robot, withan average frame rate of around 7 fps.
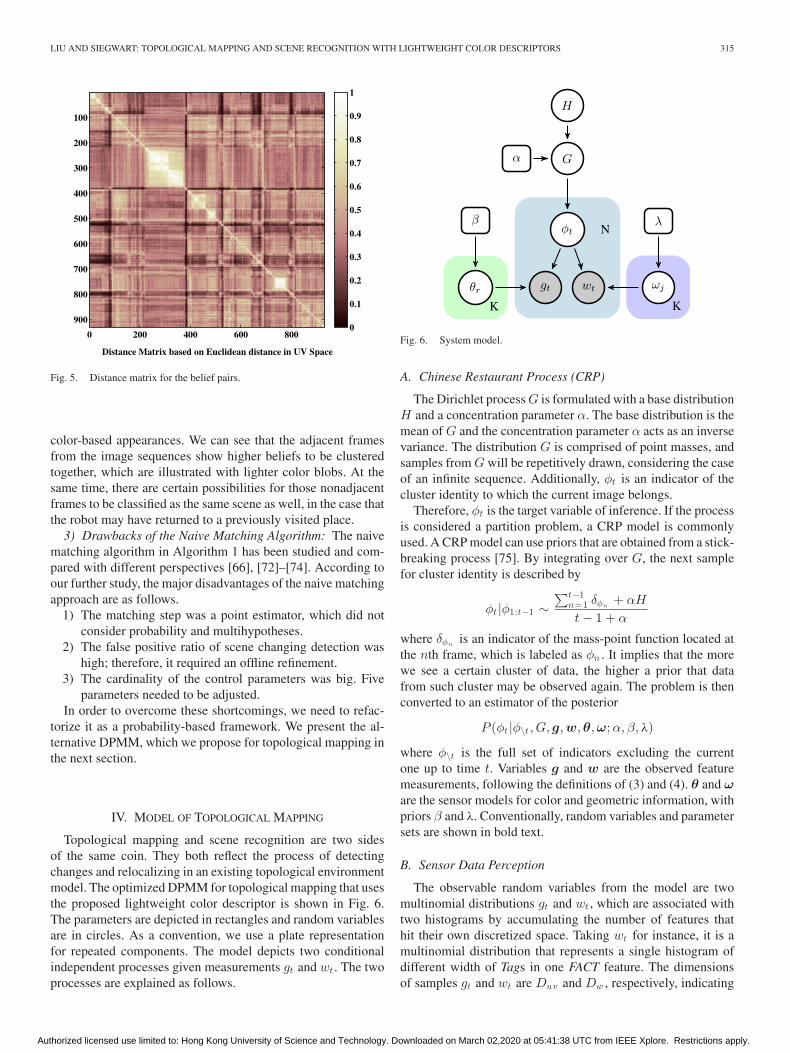
The pairwise beliefs in the sequence, indicated by line 11 inAlgorithm 1, construct a distance matrix as shown in Fig. 5. Itintuitively shows the distinctions among different frames using
Authorized licensed use limited to: Hong Kong University of Science and Technology. Downloaded on March 02,2020 at 05:41:38 UTC from IEEE Xplore. Restrictions apply.
LIU AND SIEGWART: TOPOLOGICAL MAPPING AND SCENE RECOGNITION WITH LIGHTWEIGHT COLOR DESCRIPTORS 315
Fig. 5. Distance matrix for the belief pairs.
color-based appearances. We can see that the adjacent framesfrom the image sequences show higher beliefs to be clusteredtogether, which are illustrated with lighter color blobs. At thesame time, there are certain possibilities for those nonadjacentframes to be classified as the same scene as well, in the case thatthe robot may have returned to a previously visited place.
3) Drawbacks of the Naive Matching Algorithm: The naivematching algorithm in Algorithm 1 has been studied and com-pared with different perspectives [66], [72]–[74]. According toour further study, the major disadvantages of the naive matchingapproach are as follows.
1) The matching step was a point estimator, which did notconsider probability and multihypotheses.
2) The false positive ratio of scene changing detection washigh; therefore, it required an offline refinement.
3) The cardinality of the control parameters was big. Fiveparameters needed to be adjusted.
In order to overcome these shortcomings, we need to refac-torize it as a probability-based framework. We present the al-ternative DPMM, which we propose for topological mapping inthe next section.
IV. MODEL OF TOPOLOGICAL MAPPING
Topological mapping and scene recognition are two sidesof the same coin. They both reflect the process of detectingchanges and relocalizing in an existing topological environmentmodel. The optimized DPMM for topological mapping that usesthe proposed lightweight color descriptor is shown in Fig. 6.The parameters are depicted in rectangles and random variablesare in circles. As a convention, we use a plate representationfor repeated components. The model depicts two conditionalindependent processes given measurements gt and wt . The twoprocesses are explained as follows.
Fig. 6. System model.
A. Chinese Restaurant Process (CRP)
The Dirichlet process G is formulated with a base distributionH and a concentration parameter α. The base distribution is themean of G and the concentration parameter α acts as an inversevariance. The distribution G is comprised of point masses, andsamples from G will be repetitively drawn, considering the caseof an infinite sequence. Additionally, φt is an indicator of thecluster identity to which the current image belongs.
Therefore, φt is the target variable of inference. If the processis considered a partition problem, a CRP model is commonlyused. A CRP model can use priors that are obtained from a stick-breaking process [75]. By integrating over G, the next samplefor cluster identity is described by
φt |φ1:t−1 ∼∑t−1
n=1 δφn+ αH
t − 1 + α
where δφnis an indicator of the mass-point function located at
the nth frame, which is labeled as φn . It implies that the morewe see a certain cluster of data, the higher a prior that datafrom such cluster may be observed again. The problem is thenconverted to an estimator of the posterior
P (φt |φ\t , G, g,w,θ,ω;α, β, λ)
where φ\t is the full set of indicators excluding the currentone up to time t. Variables g and w are the observed featuremeasurements, following the definitions of (3) and (4). θ and ωare the sensor models for color and geometric information, withpriors β and λ. Conventionally, random variables and parametersets are shown in bold text.
B. Sensor Data Perception
The observable random variables from the model are twomultinomial distributions gt and wt , which are associated withtwo histograms by accumulating the number of features thathit their own discretized space. Taking wt for instance, it is amultinomial distribution that represents a single histogram ofdifferent width of Tags in one FACT feature. The dimensionsof samples gt and wt are Duv and Dw , respectively, indicating
Authorized licensed use limited to: Hong Kong University of Science and Technology. Downloaded on March 02,2020 at 05:41:38 UTC from IEEE Xplore. Restrictions apply.
316 IEEE TRANSACTIONS ON ROBOTICS, VOL. 30, NO. 2, APRIL 2014
the dimensions of the discrete UV space and width space. Thenumber of samples is represented by N , which is equal to thenumber of sequential frames during the experiment.
By only considering wt , for example, as it is a multinomialdistribution, wt is subject to a Dirichlet distribution prior ωj .Assuming there are K different scenes, ω will be a matrix ofdimensions K × Z. wt’s of dimension Z are drawn from ω.Z is the number of possible histograms given the maximumnumber of Tags in a frame, which is a large number. Since weuse an approximation method for the inference in Section V,the precise expression of Z is not necessary. Note that becauseθ and ω are discrete, P (θt1 = θt2) �= 0,P (ωt1 = ωt2) �= 0, fordifferent time stamps t1 and t2.
In summary, on one hand, observations are inherently deter-mined by its label φt , as defined previously; on the other hand,we can also consider the observations gt and wt as samples froma sensor model θr and ωj for cluster k, respectively. The sensormodel priors are given by β and λ. So far, we have built a modelof two subprocesses, namely a perception process and a sensor-ing process. They serve as the basis for building a data-driveninference model for the recognition problem.
C. Model Inference
As a summary of the proposed model
G ∼ Dir(αH)
φt |G ∼ G
gt ∼ F (φt, θφt)
wt ∼ Q(φt, ωφt)
where F and Q represent the generation processes of the mea-surements from the base models, according to the label φt .
The joint probability can be written directly as
p(φGθ ω g w;β, λ) =K∏
r=1
p(θr ;β)K∏
j=1
p(ωj ; λ)
×N∏
t=1
p(G;H,α)p(φt |G)p(gt |θφt)p(wt |ωφt
).
In order to factorize it into independent components, we in-tegrate the joint probability over ω, θ, and G
p(φ g w;β, λ) =∫
ω
∫
θ
∫
G
p(φGθ ω g w;β, λ)dGdθ dω
=∫
ω
K∏
j=1
p(ωj ; λ)N∏
t=1
p(wt |ωφt)dω
×∫
θ
K∏
r=1
p(θj ;β)N∏
t=1
p(gt |θφt)dθ
×∫
G
∫
H
N∏
t=1
p(φt |G)p(G;Hα)dHdG. (5)
The last component is an expectation on G, i.e.,EG [p(φ1 φ2 φ3 φ4 · · ·φN |G)]. According to the characteris-
tics of the Dirichlet process, it is proportional to the product∏Nt=1 p(φt |φ\t) ∝ p(φt |φ\t). Therefore
∫
G
∫
H
N∏
t=1
p(φt |G)p(G;Hα)dHdG ∝∑N −1
t=1 δφt+ αδφk
N − 1 + α
(6)where δφn
is a mass point function located at φn . k is theindicator of a new cluster.
The first two parts can be treated in a similar manner. Takingthe first part for instance, using nj
v to represent the number offrames, whose width histogram is the vth element in ωj withincluster j, we obtain
∫
ω
K∏
j=1
p(ωj ; λ)N∏
t=1
p(wt |ωφt)dω
=K∏
j=1
∫
ωj
p(ωj ; λ)N∏
t=1
p(wt |ωφt)dωj
=K∏
j=1
∫
ωj
Γ(∑Z
v=1 λv )∏Z
v=1 Γ(λv )
Z∏
v=1
ωλv −1j,v
Z∏
v=1
ωnjv
j,v dωj
=K∏
j=1
∫
ωj
Γ(∑Z
v=1 λv )∏Z
v=1 Γ(λv )
Z∏
v=1
ωλv +njv −1
j,v dωj (7)
since the integral of the Dirichlet distribution equals unity
∫
ωj
Γ(∑Z
v=1 λv + njv )
∏Zv=1 Γ(λv + nj
v )
Z∏
v=1
ωλv +njv −1
j,v dωj = 1. (8)
Equation (7) can be continued as
∫
ω
K∏
j=1
p(ωj ; λ)N∏
t=1
p(wt |ωφt)dω
=K∏
j=1
∫
ωj
Γ(∑Z
v=1 λv )∏Z
v=1 Γ(λv )
∏Zv=1 Γ(λv + nj
v )
Γ(∑Z
v=1 λv + njv )
. (9)
It is similar for the integration over θ. The joint probability isthen represented using
p(φ g w;β, λ)
∝K∏
j=1
Γ(∑Z
v=1 λv )∏Z
v=1 Γ(λv )
∏Zv=1 Γ(λv + nj
v )
Γ(∑Z
v=1 λv + njv )
K∏
j=1
Γ(∑Y
v=1 βv )∏Y
v=1 Γ(βv )
∏Yv=1 Γ(βv + nj
v )
Γ(∑Y
v=1 βv + njv )
×(∑N −1
t=1 δφt+ αδφk
N − 1 + α
)
. (10)
When we consider a collapsed Gibbs sampling process on thecluster indicator φt at time t, we have
p(φt |φ\t g w;β, λ) ∝ p(φt φ\t g w;β, λ). (11)
Authorized licensed use limited to: Hong Kong University of Science and Technology. Downloaded on March 02,2020 at 05:41:38 UTC from IEEE Xplore. Restrictions apply.
LIU AND SIEGWART: TOPOLOGICAL MAPPING AND SCENE RECOGNITION WITH LIGHTWEIGHT COLOR DESCRIPTORS 317
However, the large size of Z makes the direct inference impos-sible. In general, sampling methods [76] are used to estimate theposterior, but they are usually computational expensive. Here,we propose a real-time approximated solution. The first twoparts are indications of the relation between the reference distri-bution of ωk and βk , and the current measure of frame i. Usingξ() and μ() to represent these two relations, we could rewrite(11) as
p(φt = k|φ\tg w)
∝Γ(λp + nk
p )
Γ(∑Z
v=1 λv + nkv )
Γ(βq + ckq )
Γ(∑Y
u=1 βu + cku )
(∑N −1t=1 δk +αδφk
N − 1+α
)
= ξ(wt |ωφt)μ(gt |βφt
)p(φt |φ\t). (12)
In the next section, we approximate both conditional prob-abilities ξ(·|·) and μ(·|·) based on a common nonparametricstatistical test: χ2 test. This leads to the improved approach formatching two DP-FACT features.
V. MATCHING OF DIRICHLET PROCESS MODELED FAST
ADAPTIVE COLOR TAGS
Most existing methods for DPMM use offline infer-ence, mainly because the inference is time consuming. TheMonte Carlo Markov chain (MCMC) sampling method [77]is considered as the standard approach [76]. In order to solvethe inference problem in real time in an online manner, the in-ference of the conditional probabilities is to be approximateddirectly. When it is possible, it relieves the need to calculate thejoint probability. Recall that the equation of the posterior of theplace labeling, depicted in (12), includes three parts. The lastpart is a representation of a prior CRP based on the previousobserved labels. It can be calculated directly from the historyof measurements. The first two parts are similar. Typically, theyare estimated by sampling methods. A closer look at them willreveal that they calculate the gamma function of the count ofa certain observation over all the possibilities. In other words,they represent the probability of a certain histogram showing upin a sequence of observations. Therefore, it is a measure of thesimilarity of the current observation to all the predefined mod-els. As a result, no sampling methods are needed to estimatethis measure if we can approximate the underlying similaritybetween the current observation and the reference models. Thisis the basic idea of our online inference method.
A. Nonparametric Test
Since both observation and existing models are inherentlyhistograms, the similarity between them can be estimated bynonparametric statistical methods. Here, we introduce our ap-proximation of 11 using the χ2 test.
The χ2 test is formalized as follows [78]:
χ2(m,n) =r∑
t=1
(nt − Npt)2
Npt+
r∑
t=1
(mt − Mpt)2
Mpt(13)
where pt = nt +mt
N +M ,N =∑r
t=1 nt,M =∑r
t=1 mt, r is the di-mension of both histograms, and nt and mt are the number
of hits at the bin t. The converging condition is∑r
t=1 pt = 1according to the definition. For the bins where both histogramshave 0 measure, the calculation is skipped.
According to (10), the observed distribution is determined byboth the history of observations and the Dirichlet prior. How-ever, the χ2 test only provides an estimation of the probabilityof the current observation referring to the base distribution. Itcan be further inferred as a statistical count of occurrences whileconsidering the history of observations. In order to compensatethe lack of information of the Dirichlet prior, we define a weight-ing factor ρ to adjust the influence of both measures, i.e., themeasure in the color space and geometry space. The estimatorof the target label is therefore approximated as
p(φt = k|φ\t , g w) ≡ p(φt |φ\t) · ξ(wt |ωφt) · μ(gt |βφt
)
∝(∑N −1
t=1 δφt+ αδφk
N − 1 + α
)
e−ρχ2 (wt ,ωk )−(1−ρ)χ2 (gt ,θk )
(14)
where ρ ∈ [0, 1]. If ρ = 1, then the estimator (14) considersonly the geometry measure, and vice versa. Using the form of(12), the two targeting conditional probabilities are formalizedas follows:
ξ(wt |ωφt) ∝ e−ρχ2 (wt ,ωφ t )
μ(gt |βφt) ∝ e−(1−ρ)χ2 (gt ,θφ t ) . (15)
B. Model Update
Despite the fast calculation, the nonparametric statistic thatwas introduced in (14) has an obvious disadvantage. It can beseen that the nonparametric test is a point estimation withoutconsidering previous information. In order to remedy this dis-advantage, a model update algorithm is developed. Unlike (12),where the previous information is represented by the counts ofoccurrences nk
p and ckq , we require a method to take the history
of data into account. This means that the reference models ωk
and θk need to be able to fuse information from all the existingmeasurements. Instead of saving all the previous observations,we propose an iterative method to fuse the current measurementswith existing models as follows:
θt+1k =
ntk
ntk + 1
θtk +
1nt
k + 1gt
ωt+1k =
ntk
ntk + 1
ωtk +
1nt
k + 1wt (16)
where ntk is the number of frames that have been clustered
as label k by time t. Therefore, the update process in (16) isa weighted mean by combining the existing knowledge andthe new observation at each time step. The advantages of thismodel update algorithm is obvious. On one hand, it can becalculated online with low requirements on computational andspatial costs. On the other hand, it reflects the history of data inthe updated model directly.
Authorized licensed use limited to: Hong Kong University of Science and Technology. Downloaded on March 02,2020 at 05:41:38 UTC from IEEE Xplore. Restrictions apply.
318 IEEE TRANSACTIONS ON ROBOTICS, VOL. 30, NO. 2, APRIL 2014
(a)
(b)
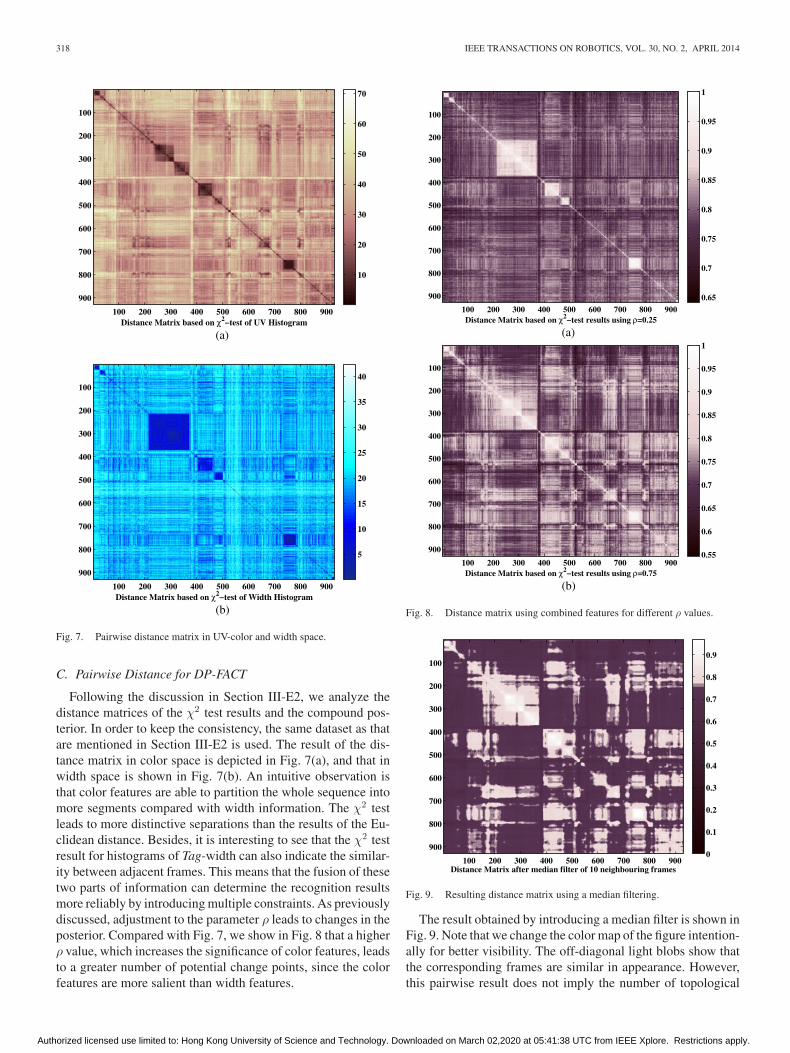
Fig. 7. Pairwise distance matrix in UV-color and width space.
C. Pairwise Distance for DP-FACT
Following the discussion in Section III-E2, we analyze thedistance matrices of the χ2 test results and the compound pos-terior. In order to keep the consistency, the same dataset as thatare mentioned in Section III-E2 is used. The result of the dis-tance matrix in color space is depicted in Fig. 7(a), and that inwidth space is shown in Fig. 7(b). An intuitive observation isthat color features are able to partition the whole sequence intomore segments compared with width information. The χ2 testleads to more distinctive separations than the results of the Eu-clidean distance. Besides, it is interesting to see that the χ2 testresult for histograms of Tag-width can also indicate the similar-ity between adjacent frames. This means that the fusion of thesetwo parts of information can determine the recognition resultsmore reliably by introducing multiple constraints. As previouslydiscussed, adjustment to the parameter ρ leads to changes in theposterior. Compared with Fig. 7, we show in Fig. 8 that a higherρ value, which increases the significance of color features, leadsto a greater number of potential change points, since the colorfeatures are more salient than width features.
(a)
(b)
Fig. 8. Distance matrix using combined features for different ρ values.
Fig. 9. Resulting distance matrix using a median filtering.
The result obtained by introducing a median filter is shown inFig. 9. Note that we change the color map of the figure intention-ally for better visibility. The off-diagonal light blobs show thatthe corresponding frames are similar in appearance. However,this pairwise result does not imply the number of topological
Authorized licensed use limited to: Hong Kong University of Science and Technology. Downloaded on March 02,2020 at 05:41:38 UTC from IEEE Xplore. Restrictions apply.
LIU AND SIEGWART: TOPOLOGICAL MAPPING AND SCENE RECOGNITION WITH LIGHTWEIGHT COLOR DESCRIPTORS 319
nodes, since the node models keep evolving regarding (16),whenever a new positive reading is detected. Here, we simplyuse these plots to reveal the distinctiveness and feasibility of theproposed DP-FACT features. The result of a real-time experi-ment including all the components of (12) is shown in the nextsection.
D. Discussion on the χ2 Test and Naive Matching
In this section, we show the theoretical insight into why theχ2 test provides more distinct results. A typical result can beseen by comparing Figs. 5 and 7(a). For two feature vectors x1
and x2 , a summation form of Euclidean distances is representedby
de =√
(x1 − x2)T (x1 − x2) =√
(x1 − x2)T Ikk (x1−x2)(17)
where Ikk is an identity matrix with the same dimension as thefeature. It can be interpreted that the covariance of the featuresis not considered.
On the other hand, considering the χ2 test that is introduced in(13), it has a limiting χ2 distribution with N + M − 1 degreesof freedom. Under the null hypothesis, it has the mean vector μand covariance matrix V as follows:
μ = (N + M) × (p1 , p2 , . . . , pr )T (18)
V =(N + M)
⎛
⎜⎜⎝
p1(1 − p1) −p1 p2 . . . −p1 pr
−p2 p1 p1(1 − p1) . . . −p2 pr
......
. . ....
−pr p1 −pk p2 . . . pr (1 − pr )
⎞
⎟⎟⎠
(19)
using the notation of (13). This additional information enablesthat all the Tags in a FACT descriptor are jointly consideredwith respect to the frequency of hits on each discrete bin of thefeature space.
E. Discussion on Data Modeling
We address the major differences between the proposed DP-FACT and the naive matching method introduced by Algorithm1 as follows.
1) The matching process is no longer a point estimator withthe DPMM. With multiple hypotheses, the final output isa maximum-a-posterior (MAP) result instead.
2) New nodes are incrementally generated online, and thefalse positives are, due to noise, with low priority withregard to the CRP process. It is an important feature forapplications on a larger scale.
3) Last but not the least, the designed DPMM takes intoconsideration that the observations from sensors are con-ditionally independent when the label is given. This canalso be inferred from (14). This shows that even with morethan two observations, it is possible to fuse the informationrelated to a certain label (place, scene) efficiently.
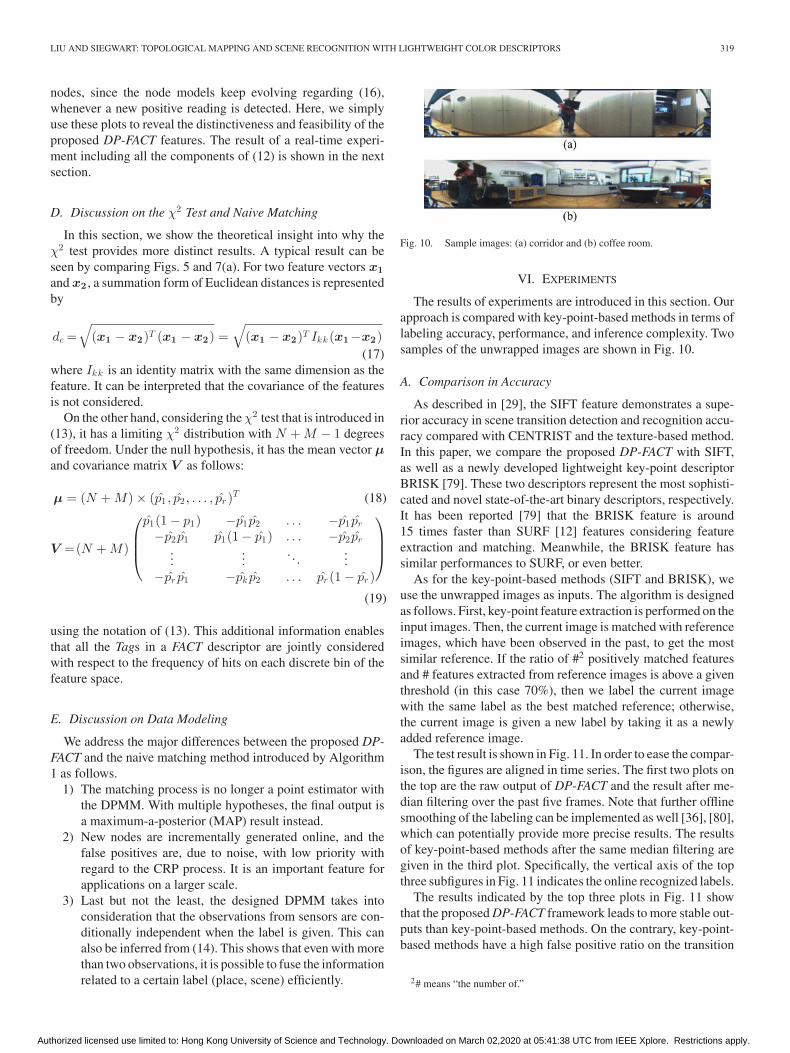
Fig. 10. Sample images: (a) corridor and (b) coffee room.
VI. EXPERIMENTS
The results of experiments are introduced in this section. Ourapproach is compared with key-point-based methods in terms oflabeling accuracy, performance, and inference complexity. Twosamples of the unwrapped images are shown in Fig. 10.
A. Comparison in Accuracy
As described in [29], the SIFT feature demonstrates a supe-rior accuracy in scene transition detection and recognition accu-racy compared with CENTRIST and the texture-based method.In this paper, we compare the proposed DP-FACT with SIFT,as well as a newly developed lightweight key-point descriptorBRISK [79]. These two descriptors represent the most sophisti-cated and novel state-of-the-art binary descriptors, respectively.It has been reported [79] that the BRISK feature is around15 times faster than SURF [12] features considering featureextraction and matching. Meanwhile, the BRISK feature hassimilar performances to SURF, or even better.
As for the key-point-based methods (SIFT and BRISK), weuse the unwrapped images as inputs. The algorithm is designedas follows. First, key-point feature extraction is performed on theinput images. Then, the current image is matched with referenceimages, which have been observed in the past, to get the mostsimilar reference. If the ratio of #2 positively matched featuresand # features extracted from reference images is above a giventhreshold (in this case 70%), then we label the current imagewith the same label as the best matched reference; otherwise,the current image is given a new label by taking it as a newlyadded reference image.
The test result is shown in Fig. 11. In order to ease the compar-ison, the figures are aligned in time series. The first two plots onthe top are the raw output of DP-FACT and the result after me-dian filtering over the past five frames. Note that further offlinesmoothing of the labeling can be implemented as well [36], [80],which can potentially provide more precise results. The resultsof key-point-based methods after the same median filtering aregiven in the third plot. Specifically, the vertical axis of the topthree subfigures in Fig. 11 indicates the online recognized labels.
The results indicated by the top three plots in Fig. 11 showthat the proposed DP-FACT framework leads to more stable out-puts than key-point-based methods. On the contrary, key-point-based methods have a high false positive ratio on the transition
2# means “the number of.”
Authorized licensed use limited to: Hong Kong University of Science and Technology. Downloaded on March 02,2020 at 05:41:38 UTC from IEEE Xplore. Restrictions apply.
320 IEEE TRANSACTIONS ON ROBOTICS, VOL. 30, NO. 2, APRIL 2014
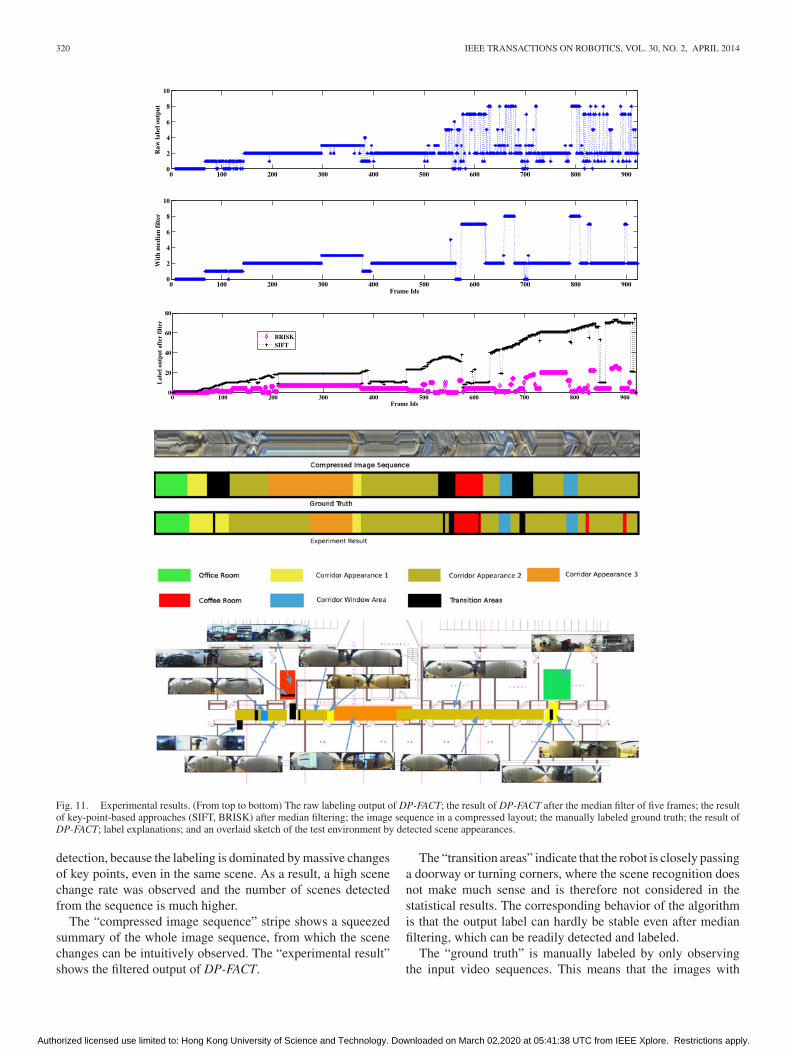
Fig. 11. Experimental results. (From top to bottom) The raw labeling output of DP-FACT; the result of DP-FACT after the median filter of five frames; the resultof key-point-based approaches (SIFT, BRISK) after median filtering; the image sequence in a compressed layout; the manually labeled ground truth; the result ofDP-FACT; label explanations; and an overlaid sketch of the test environment by detected scene appearances.
detection, because the labeling is dominated by massive changesof key points, even in the same scene. As a result, a high scenechange rate was observed and the number of scenes detectedfrom the sequence is much higher.
The “compressed image sequence” stripe shows a squeezedsummary of the whole image sequence, from which the scenechanges can be intuitively observed. The “experimental result”shows the filtered output of DP-FACT.
The “transition areas” indicate that the robot is closely passinga doorway or turning corners, where the scene recognition doesnot make much sense and is therefore not considered in thestatistical results. The corresponding behavior of the algorithmis that the output label can hardly be stable even after medianfiltering, which can be readily detected and labeled.
The “ground truth” is manually labeled by only observingthe input video sequences. This means that the images with
Authorized licensed use limited to: Hong Kong University of Science and Technology. Downloaded on March 02,2020 at 05:41:38 UTC from IEEE Xplore. Restrictions apply.
LIU AND SIEGWART: TOPOLOGICAL MAPPING AND SCENE RECOGNITION WITH LIGHTWEIGHT COLOR DESCRIPTORS 321
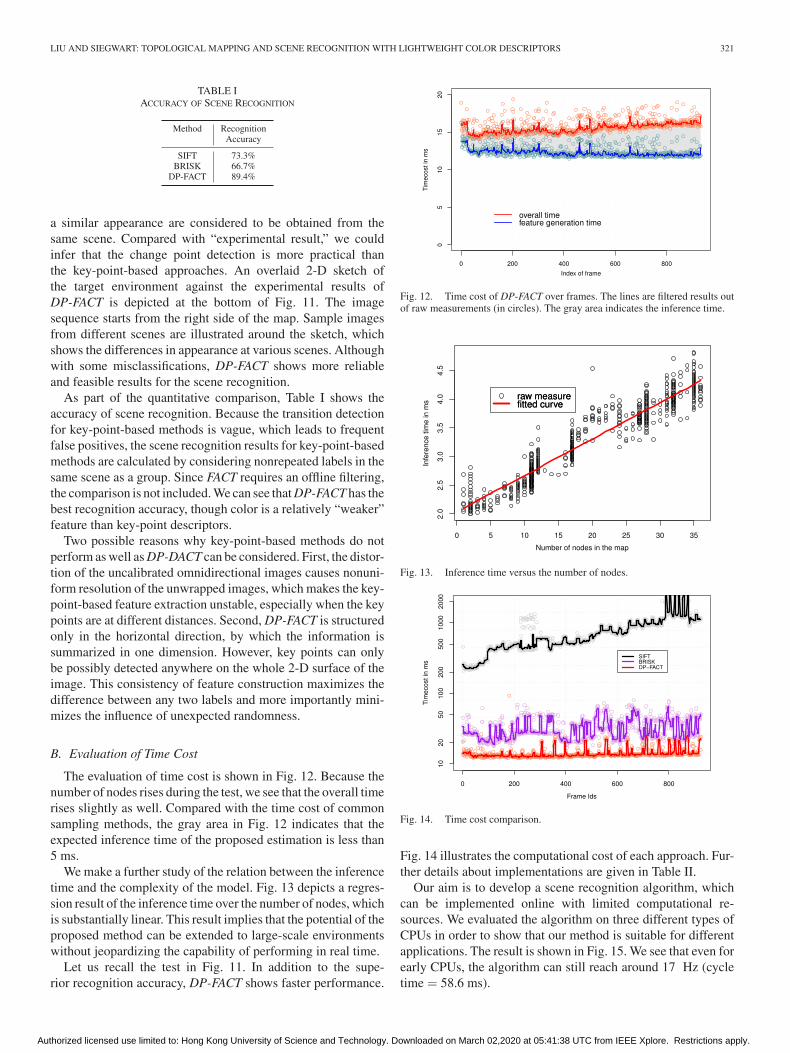
TABLE IACCURACY OF SCENE RECOGNITION
a similar appearance are considered to be obtained from thesame scene. Compared with “experimental result,” we couldinfer that the change point detection is more practical thanthe key-point-based approaches. An overlaid 2-D sketch ofthe target environment against the experimental results ofDP-FACT is depicted at the bottom of Fig. 11. The imagesequence starts from the right side of the map. Sample imagesfrom different scenes are illustrated around the sketch, whichshows the differences in appearance at various scenes. Althoughwith some misclassifications, DP-FACT shows more reliableand feasible results for the scene recognition.
As part of the quantitative comparison, Table I shows theaccuracy of scene recognition. Because the transition detectionfor key-point-based methods is vague, which leads to frequentfalse positives, the scene recognition results for key-point-basedmethods are calculated by considering nonrepeated labels in thesame scene as a group. Since FACT requires an offline filtering,the comparison is not included. We can see that DP-FACT has thebest recognition accuracy, though color is a relatively “weaker”feature than key-point descriptors.
Two possible reasons why key-point-based methods do notperform as well as DP-DACT can be considered. First, the distor-tion of the uncalibrated omnidirectional images causes nonuni-form resolution of the unwrapped images, which makes the key-point-based feature extraction unstable, especially when the keypoints are at different distances. Second, DP-FACT is structuredonly in the horizontal direction, by which the information issummarized in one dimension. However, key points can onlybe possibly detected anywhere on the whole 2-D surface of theimage. This consistency of feature construction maximizes thedifference between any two labels and more importantly mini-mizes the influence of unexpected randomness.
B. Evaluation of Time Cost
The evaluation of time cost is shown in Fig. 12. Because thenumber of nodes rises during the test, we see that the overall timerises slightly as well. Compared with the time cost of commonsampling methods, the gray area in Fig. 12 indicates that theexpected inference time of the proposed estimation is less than5 ms.
We make a further study of the relation between the inferencetime and the complexity of the model. Fig. 13 depicts a regres-sion result of the inference time over the number of nodes, whichis substantially linear. This result implies that the potential of theproposed method can be extended to large-scale environmentswithout jeopardizing the capability of performing in real time.
Let us recall the test in Fig. 11. In addition to the supe-rior recognition accuracy, DP-FACT shows faster performance.
Fig. 12. Time cost of DP-FACT over frames. The lines are filtered results outof raw measurements (in circles). The gray area indicates the inference time.
Fig. 13. Inference time versus the number of nodes.
Fig. 14. Time cost comparison.
Fig. 14 illustrates the computational cost of each approach. Fur-ther details about implementations are given in Table II.
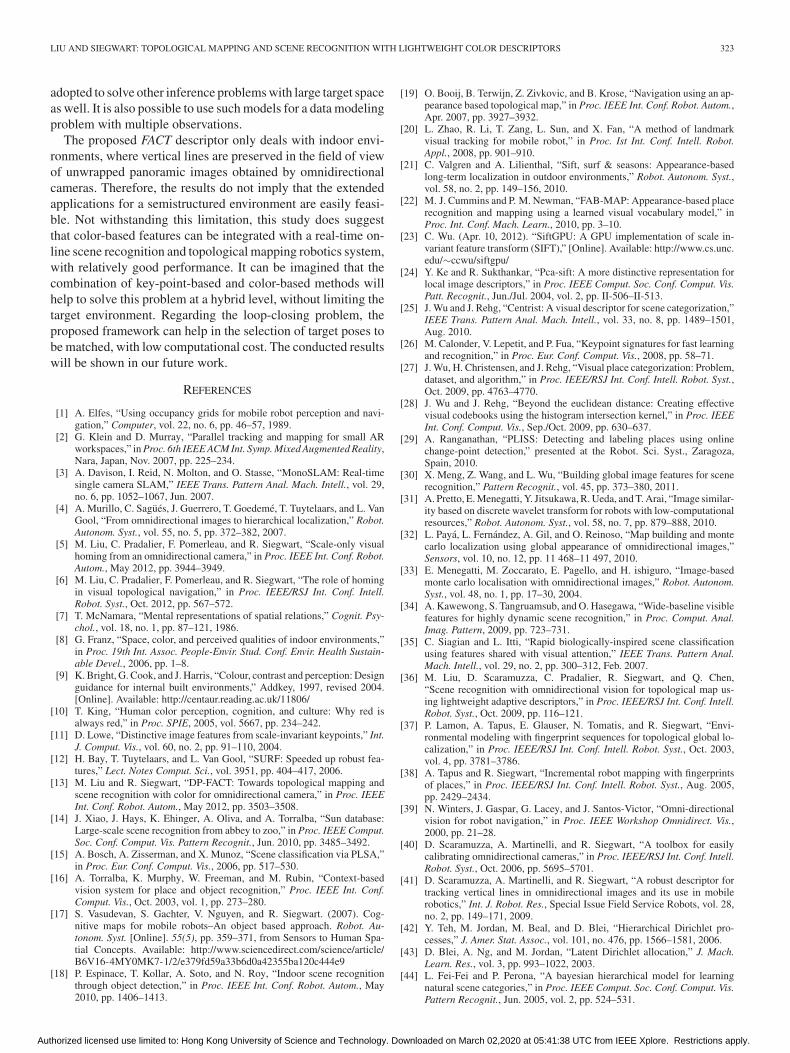
Our aim is to develop a scene recognition algorithm, whichcan be implemented online with limited computational re-sources. We evaluated the algorithm on three different types ofCPUs in order to show that our method is suitable for differentapplications. The result is shown in Fig. 15. We see that even forearly CPUs, the algorithm can still reach around 17 Hz (cycletime = 58.6 ms).
Authorized licensed use limited to: Hong Kong University of Science and Technology. Downloaded on March 02,2020 at 05:41:38 UTC from IEEE Xplore. Restrictions apply.
322 IEEE TRANSACTIONS ON ROBOTICS, VOL. 30, NO. 2, APRIL 2014
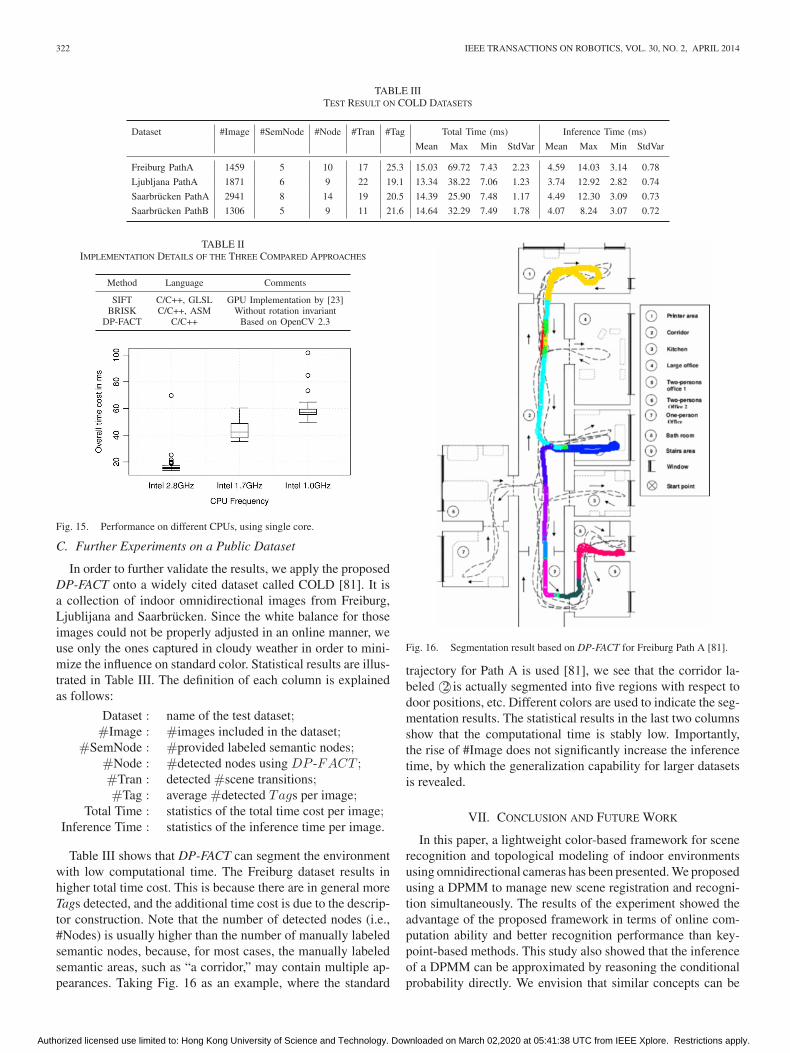
TABLE IIITEST RESULT ON COLD DATASETS
TABLE IIIMPLEMENTATION DETAILS OF THE THREE COMPARED APPROACHES
Fig. 15. Performance on different CPUs, using single core.
C. Further Experiments on a Public Dataset
In order to further validate the results, we apply the proposedDP-FACT onto a widely cited dataset called COLD [81]. It isa collection of indoor omnidirectional images from Freiburg,Ljublijana and Saarbrucken. Since the white balance for thoseimages could not be properly adjusted in an online manner, weuse only the ones captured in cloudy weather in order to mini-mize the influence on standard color. Statistical results are illus-trated in Table III. The definition of each column is explainedas follows:
Dataset : name of the test dataset;#Image : #images included in the dataset;
#SemNode : #provided labeled semantic nodes;#Node : #detected nodes using DP -FACT ;#Tran : detected #scene transitions;#Tag : average #detected Tags per image;
Total Time : statistics of the total time cost per image;Inference Time : statistics of the inference time per image.
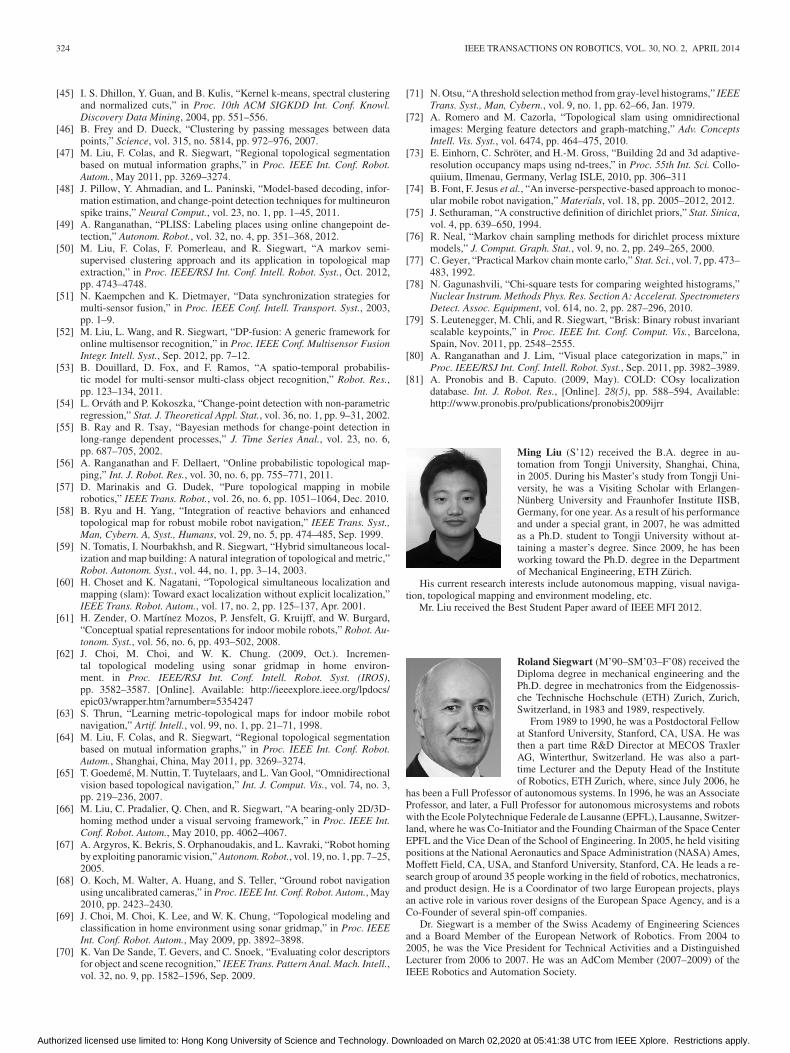
Table III shows that DP-FACT can segment the environmentwith low computational time. The Freiburg dataset results inhigher total time cost. This is because there are in general moreTags detected, and the additional time cost is due to the descrip-tor construction. Note that the number of detected nodes (i.e.,#Nodes) is usually higher than the number of manually labeledsemantic nodes, because, for most cases, the manually labeledsemantic areas, such as “a corridor,” may contain multiple ap-pearances. Taking Fig. 16 as an example, where the standard
Fig. 16. Segmentation result based on DP-FACT for Freiburg Path A [81].
trajectory for Path A is used [81], we see that the corridor la-beled ©2 is actually segmented into five regions with respect todoor positions, etc. Different colors are used to indicate the seg-mentation results. The statistical results in the last two columnsshow that the computational time is stably low. Importantly,the rise of #Image does not significantly increase the inferencetime, by which the generalization capability for larger datasetsis revealed.
VII. CONCLUSION AND FUTURE WORK
In this paper, a lightweight color-based framework for scenerecognition and topological modeling of indoor environmentsusing omnidirectional cameras has been presented. We proposedusing a DPMM to manage new scene registration and recogni-tion simultaneously. The results of the experiment showed theadvantage of the proposed framework in terms of online com-putation ability and better recognition performance than key-point-based methods. This study also showed that the inferenceof a DPMM can be approximated by reasoning the conditionalprobability directly. We envision that similar concepts can be
Authorized licensed use limited to: Hong Kong University of Science and Technology. Downloaded on March 02,2020 at 05:41:38 UTC from IEEE Xplore. Restrictions apply.
LIU AND SIEGWART: TOPOLOGICAL MAPPING AND SCENE RECOGNITION WITH LIGHTWEIGHT COLOR DESCRIPTORS 323
adopted to solve other inference problems with large target spaceas well. It is also possible to use such models for a data modelingproblem with multiple observations.
The proposed FACT descriptor only deals with indoor envi-ronments, where vertical lines are preserved in the field of viewof unwrapped panoramic images obtained by omnidirectionalcameras. Therefore, the results do not imply that the extendedapplications for a semistructured environment are easily feasi-ble. Not withstanding this limitation, this study does suggestthat color-based features can be integrated with a real-time on-line scene recognition and topological mapping robotics system,with relatively good performance. It can be imagined that thecombination of key-point-based and color-based methods willhelp to solve this problem at a hybrid level, without limiting thetarget environment. Regarding the loop-closing problem, theproposed framework can help in the selection of target poses tobe matched, with low computational cost. The conducted resultswill be shown in our future work.
REFERENCES
[1] A. Elfes, “Using occupancy grids for mobile robot perception and navi-gation,” Computer, vol. 22, no. 6, pp. 46–57, 1989.
[2] G. Klein and D. Murray, “Parallel tracking and mapping for small ARworkspaces,” in Proc. 6th IEEE ACM Int. Symp. Mixed Augmented Reality,Nara, Japan, Nov. 2007, pp. 225–234.
[3] A. Davison, I. Reid, N. Molton, and O. Stasse, “MonoSLAM: Real-timesingle camera SLAM,” IEEE Trans. Pattern Anal. Mach. Intell., vol. 29,no. 6, pp. 1052–1067, Jun. 2007.
[4] A. Murillo, C. Sagues, J. Guerrero, T. Goedeme, T. Tuytelaars, and L. VanGool, “From omnidirectional images to hierarchical localization,” Robot.Autonom. Syst., vol. 55, no. 5, pp. 372–382, 2007.
[5] M. Liu, C. Pradalier, F. Pomerleau, and R. Siegwart, “Scale-only visualhoming from an omnidirectional camera,” in Proc. IEEE Int. Conf. Robot.Autom., May 2012, pp. 3944–3949.
[6] M. Liu, C. Pradalier, F. Pomerleau, and R. Siegwart, “The role of homingin visual topological navigation,” in Proc. IEEE/RSJ Int. Conf. Intell.Robot. Syst., Oct. 2012, pp. 567–572.
[7] T. McNamara, “Mental representations of spatial relations,” Cognit. Psy-chol., vol. 18, no. 1, pp. 87–121, 1986.
[8] G. Franz, “Space, color, and perceived qualities of indoor environments,”in Proc. 19th Int. Assoc. People-Envir. Stud. Conf. Envir. Health Sustain-able Devel., 2006, pp. 1–8.
[9] K. Bright, G. Cook, and J. Harris, “Colour, contrast and perception: Designguidance for internal built environments,” Addkey, 1997, revised 2004.[Online]. Available: http://centaur.reading.ac.uk/11806/
[10] T. King, “Human color perception, cognition, and culture: Why red isalways red,” in Proc. SPIE, 2005, vol. 5667, pp. 234–242.
[11] D. Lowe, “Distinctive image features from scale-invariant keypoints,” Int.J. Comput. Vis., vol. 60, no. 2, pp. 91–110, 2004.
[12] H. Bay, T. Tuytelaars, and L. Van Gool, “SURF: Speeded up robust fea-tures,” Lect. Notes Comput. Sci., vol. 3951, pp. 404–417, 2006.
[13] M. Liu and R. Siegwart, “DP-FACT: Towards topological mapping andscene recognition with color for omnidirectional camera,” in Proc. IEEEInt. Conf. Robot. Autom., May 2012, pp. 3503–3508.
[14] J. Xiao, J. Hays, K. Ehinger, A. Oliva, and A. Torralba, “Sun database:Large-scale scene recognition from abbey to zoo,” in Proc. IEEE Comput.Soc. Conf. Comput. Vis. Pattern Recognit., Jun. 2010, pp. 3485–3492.
[15] A. Bosch, A. Zisserman, and X. Munoz, “Scene classification via PLSA,”in Proc. Eur. Conf. Comput. Vis., 2006, pp. 517–530.
[16] A. Torralba, K. Murphy, W. Freeman, and M. Rubin, “Context-basedvision system for place and object recognition,” Proc. IEEE Int. Conf.Comput. Vis., Oct. 2003, vol. 1, pp. 273–280.
[17] S. Vasudevan, S. Gachter, V. Nguyen, and R. Siegwart. (2007). Cog-nitive maps for mobile robots–An object based approach. Robot. Au-tonom. Syst. [Online]. 55(5), pp. 359–371, from Sensors to Human Spa-tial Concepts. Available: http://www.sciencedirect.com/science/article/B6V16-4MY0MK7-1/2/e379fd59a33b6d0a42355ba120c444e9
[18] P. Espinace, T. Kollar, A. Soto, and N. Roy, “Indoor scene recognitionthrough object detection,” in Proc. IEEE Int. Conf. Robot. Autom., May2010, pp. 1406–1413.
[19] O. Booij, B. Terwijn, Z. Zivkovic, and B. Krose, “Navigation using an ap-pearance based topological map,” in Proc. IEEE Int. Conf. Robot. Autom.,Apr. 2007, pp. 3927–3932.
[20] L. Zhao, R. Li, T. Zang, L. Sun, and X. Fan, “A method of landmarkvisual tracking for mobile robot,” in Proc. Ist Int. Conf. Intell. Robot.Appl., 2008, pp. 901–910.
[21] C. Valgren and A. Lilienthal, “Sift, surf & seasons: Appearance-basedlong-term localization in outdoor environments,” Robot. Autonom. Syst.,vol. 58, no. 2, pp. 149–156, 2010.
[22] M. J. Cummins and P. M. Newman, “FAB-MAP: Appearance-based placerecognition and mapping using a learned visual vocabulary model,” inProc. Int. Conf. Mach. Learn., 2010, pp. 3–10.
[23] C. Wu. (Apr. 10, 2012). “SiftGPU: A GPU implementation of scale in-variant feature transform (SIFT),” [Online]. Available: http://www.cs.unc.edu/∼ccwu/siftgpu/
[24] Y. Ke and R. Sukthankar, “Pca-sift: A more distinctive representation forlocal image descriptors,” in Proc. IEEE Comput. Soc. Conf. Comput. Vis.Patt. Recognit., Jun./Jul. 2004, vol. 2, pp. II-506–II-513.
[25] J. Wu and J. Rehg, “Centrist: A visual descriptor for scene categorization,”IEEE Trans. Pattern Anal. Mach. Intell., vol. 33, no. 8, pp. 1489–1501,Aug. 2010.
[26] M. Calonder, V. Lepetit, and P. Fua, “Keypoint signatures for fast learningand recognition,” in Proc. Eur. Conf. Comput. Vis., 2008, pp. 58–71.
[27] J. Wu, H. Christensen, and J. Rehg, “Visual place categorization: Problem,dataset, and algorithm,” in Proc. IEEE/RSJ Int. Conf. Intell. Robot. Syst.,Oct. 2009, pp. 4763–4770.
[28] J. Wu and J. Rehg, “Beyond the euclidean distance: Creating effectivevisual codebooks using the histogram intersection kernel,” in Proc. IEEEInt. Conf. Comput. Vis., Sep./Oct. 2009, pp. 630–637.
[29] A. Ranganathan, “PLISS: Detecting and labeling places using onlinechange-point detection,” presented at the Robot. Sci. Syst., Zaragoza,Spain, 2010.
[30] X. Meng, Z. Wang, and L. Wu, “Building global image features for scenerecognition,” Pattern Recognit., vol. 45, pp. 373–380, 2011.
[31] A. Pretto, E. Menegatti, Y. Jitsukawa, R. Ueda, and T. Arai, “Image similar-ity based on discrete wavelet transform for robots with low-computationalresources,” Robot. Autonom. Syst., vol. 58, no. 7, pp. 879–888, 2010.
[32] L. Paya, L. Fernandez, A. Gil, and O. Reinoso, “Map building and montecarlo localization using global appearance of omnidirectional images,”Sensors, vol. 10, no. 12, pp. 11 468–11 497, 2010.
[33] E. Menegatti, M. Zoccarato, E. Pagello, and H. ishiguro, “Image-basedmonte carlo localisation with omnidirectional images,” Robot. Autonom.Syst., vol. 48, no. 1, pp. 17–30, 2004.
[34] A. Kawewong, S. Tangruamsub, and O. Hasegawa, “Wide-baseline visiblefeatures for highly dynamic scene recognition,” in Proc. Comput. Anal.Imag. Pattern, 2009, pp. 723–731.
[35] C. Siagian and L. Itti, “Rapid biologically-inspired scene classificationusing features shared with visual attention,” IEEE Trans. Pattern Anal.Mach. Intell., vol. 29, no. 2, pp. 300–312, Feb. 2007.
[36] M. Liu, D. Scaramuzza, C. Pradalier, R. Siegwart, and Q. Chen,“Scene recognition with omnidirectional vision for topological map us-ing lightweight adaptive descriptors,” in Proc. IEEE/RSJ Int. Conf. Intell.Robot. Syst., Oct. 2009, pp. 116–121.
[37] P. Lamon, A. Tapus, E. Glauser, N. Tomatis, and R. Siegwart, “Envi-ronmental modeling with fingerprint sequences for topological global lo-calization,” in Proc. IEEE/RSJ Int. Conf. Intell. Robot. Syst., Oct. 2003,vol. 4, pp. 3781–3786.
[38] A. Tapus and R. Siegwart, “Incremental robot mapping with fingerprintsof places,” in Proc. IEEE/RSJ Int. Conf. Intell. Robot. Syst., Aug. 2005,pp. 2429–2434.
[39] N. Winters, J. Gaspar, G. Lacey, and J. Santos-Victor, “Omni-directionalvision for robot navigation,” in Proc. IEEE Workshop Omnidirect. Vis.,2000, pp. 21–28.
[40] D. Scaramuzza, A. Martinelli, and R. Siegwart, “A toolbox for easilycalibrating omnidirectional cameras,” in Proc. IEEE/RSJ Int. Conf. Intell.Robot. Syst., Oct. 2006, pp. 5695–5701.
[41] D. Scaramuzza, A. Martinelli, and R. Siegwart, “A robust descriptor fortracking vertical lines in omnidirectional images and its use in mobilerobotics,” Int. J. Robot. Res., Special Issue Field Service Robots, vol. 28,no. 2, pp. 149–171, 2009.
[42] Y. Teh, M. Jordan, M. Beal, and D. Blei, “Hierarchical Dirichlet pro-cesses,” J. Amer. Stat. Assoc., vol. 101, no. 476, pp. 1566–1581, 2006.
[43] D. Blei, A. Ng, and M. Jordan, “Latent Dirichlet allocation,” J. Mach.Learn. Res., vol. 3, pp. 993–1022, 2003.
[44] L. Fei-Fei and P. Perona, “A bayesian hierarchical model for learningnatural scene categories,” in Proc. IEEE Comput. Soc. Conf. Comput. Vis.Pattern Recognit., Jun. 2005, vol. 2, pp. 524–531.
Authorized licensed use limited to: Hong Kong University of Science and Technology. Downloaded on March 02,2020 at 05:41:38 UTC from IEEE Xplore. Restrictions apply.
324 IEEE TRANSACTIONS ON ROBOTICS, VOL. 30, NO. 2, APRIL 2014
[45] I. S. Dhillon, Y. Guan, and B. Kulis, “Kernel k-means, spectral clusteringand normalized cuts,” in Proc. 10th ACM SIGKDD Int. Conf. Knowl.Discovery Data Mining, 2004, pp. 551–556.
[46] B. Frey and D. Dueck, “Clustering by passing messages between datapoints,” Science, vol. 315, no. 5814, pp. 972–976, 2007.
[47] M. Liu, F. Colas, and R. Siegwart, “Regional topological segmentationbased on mutual information graphs,” in Proc. IEEE Int. Conf. Robot.Autom., May 2011, pp. 3269–3274.
[48] J. Pillow, Y. Ahmadian, and L. Paninski, “Model-based decoding, infor-mation estimation, and change-point detection techniques for multineuronspike trains,” Neural Comput., vol. 23, no. 1, pp. 1–45, 2011.
[49] A. Ranganathan, “PLISS: Labeling places using online changepoint de-tection,” Autonom. Robot., vol. 32, no. 4, pp. 351–368, 2012.
[50] M. Liu, F. Colas, F. Pomerleau, and R. Siegwart, “A markov semi-supervised clustering approach and its application in topological mapextraction,” in Proc. IEEE/RSJ Int. Conf. Intell. Robot. Syst., Oct. 2012,pp. 4743–4748.
[51] N. Kaempchen and K. Dietmayer, “Data synchronization strategies formulti-sensor fusion,” in Proc. IEEE Conf. Intell. Transport. Syst., 2003,pp. 1–9.
[52] M. Liu, L. Wang, and R. Siegwart, “DP-fusion: A generic framework foronline multisensor recognition,” in Proc. IEEE Conf. Multisensor FusionIntegr. Intell. Syst., Sep. 2012, pp. 7–12.
[53] B. Douillard, D. Fox, and F. Ramos, “A spatio-temporal probabilis-tic model for multi-sensor multi-class object recognition,” Robot. Res.,pp. 123–134, 2011.
[54] L. Orvath and P. Kokoszka, “Change-point detection with non-parametricregression,” Stat. J. Theoretical Appl. Stat., vol. 36, no. 1, pp. 9–31, 2002.
[55] B. Ray and R. Tsay, “Bayesian methods for change-point detection inlong-range dependent processes,” J. Time Series Anal., vol. 23, no. 6,pp. 687–705, 2002.
[56] A. Ranganathan and F. Dellaert, “Online probabilistic topological map-ping,” Int. J. Robot. Res., vol. 30, no. 6, pp. 755–771, 2011.
[57] D. Marinakis and G. Dudek, “Pure topological mapping in mobilerobotics,” IEEE Trans. Robot., vol. 26, no. 6, pp. 1051–1064, Dec. 2010.
[58] B. Ryu and H. Yang, “Integration of reactive behaviors and enhancedtopological map for robust mobile robot navigation,” IEEE Trans. Syst.,Man, Cybern. A, Syst., Humans, vol. 29, no. 5, pp. 474–485, Sep. 1999.
[59] N. Tomatis, I. Nourbakhsh, and R. Siegwart, “Hybrid simultaneous local-ization and map building: A natural integration of topological and metric,”Robot. Autonom. Syst., vol. 44, no. 1, pp. 3–14, 2003.
[60] H. Choset and K. Nagatani, “Topological simultaneous localization andmapping (slam): Toward exact localization without explicit localization,”IEEE Trans. Robot. Autom., vol. 17, no. 2, pp. 125–137, Apr. 2001.
[61] H. Zender, O. Martınez Mozos, P. Jensfelt, G. Kruijff, and W. Burgard,“Conceptual spatial representations for indoor mobile robots,” Robot. Au-tonom. Syst., vol. 56, no. 6, pp. 493–502, 2008.
[62] J. Choi, M. Choi, and W. K. Chung. (2009, Oct.). Incremen-tal topological modeling using sonar gridmap in home environ-ment. in Proc. IEEE/RSJ Int. Conf. Intell. Robot. Syst. (IROS),pp. 3582–3587. [Online]. Available: http://ieeexplore.ieee.org/lpdocs/epic03/wrapper.htm?arnumber=5354247
[63] S. Thrun, “Learning metric-topological maps for indoor mobile robotnavigation,” Artif. Intell., vol. 99, no. 1, pp. 21–71, 1998.
[64] M. Liu, F. Colas, and R. Siegwart, “Regional topological segmentationbased on mutual information graphs,” in Proc. IEEE Int. Conf. Robot.Autom., Shanghai, China, May 2011, pp. 3269–3274.
[65] T. Goedeme, M. Nuttin, T. Tuytelaars, and L. Van Gool, “Omnidirectionalvision based topological navigation,” Int. J. Comput. Vis., vol. 74, no. 3,pp. 219–236, 2007.
[66] M. Liu, C. Pradalier, Q. Chen, and R. Siegwart, “A bearing-only 2D/3D-homing method under a visual servoing framework,” in Proc. IEEE Int.Conf. Robot. Autom., May 2010, pp. 4062–4067.
[67] A. Argyros, K. Bekris, S. Orphanoudakis, and L. Kavraki, “Robot homingby exploiting panoramic vision,” Autonom. Robot., vol. 19, no. 1, pp. 7–25,2005.
[68] O. Koch, M. Walter, A. Huang, and S. Teller, “Ground robot navigationusing uncalibrated cameras,” in Proc. IEEE Int. Conf. Robot. Autom., May2010, pp. 2423–2430.
[69] J. Choi, M. Choi, K. Lee, and W. K. Chung, “Topological modeling andclassification in home environment using sonar gridmap,” in Proc. IEEEInt. Conf. Robot. Autom., May 2009, pp. 3892–3898.
[70] K. Van De Sande, T. Gevers, and C. Snoek, “Evaluating color descriptorsfor object and scene recognition,” IEEE Trans. Pattern Anal. Mach. Intell.,vol. 32, no. 9, pp. 1582–1596, Sep. 2009.
[71] N. Otsu, “A threshold selection method from gray-level histograms,” IEEETrans. Syst., Man, Cybern., vol. 9, no. 1, pp. 62–66, Jan. 1979.
[72] A. Romero and M. Cazorla, “Topological slam using omnidirectionalimages: Merging feature detectors and graph-matching,” Adv. ConceptsIntell. Vis. Syst., vol. 6474, pp. 464–475, 2010.
[73] E. Einhorn, C. Schroter, and H.-M. Gross, “Building 2d and 3d adaptive-resolution occupancy maps using nd-trees,” in Proc. 55th Int. Sci. Collo-quiium, Ilmenau, Germany, Verlag ISLE, 2010, pp. 306–311
[74] B. Font, F. Jesus et al., “An inverse-perspective-based approach to monoc-ular mobile robot navigation,” Materials, vol. 18, pp. 2005–2012, 2012.
[75] J. Sethuraman, “A constructive definition of dirichlet priors,” Stat. Sinica,vol. 4, pp. 639–650, 1994.
[76] R. Neal, “Markov chain sampling methods for dirichlet process mixturemodels,” J. Comput. Graph. Stat., vol. 9, no. 2, pp. 249–265, 2000.
[77] C. Geyer, “Practical Markov chain monte carlo,” Stat. Sci., vol. 7, pp. 473–483, 1992.
[78] N. Gagunashvili, “Chi-square tests for comparing weighted histograms,”Nuclear Instrum. Methods Phys. Res. Section A: Accelerat. SpectrometersDetect. Assoc. Equipment, vol. 614, no. 2, pp. 287–296, 2010.
[79] S. Leutenegger, M. Chli, and R. Siegwart, “Brisk: Binary robust invariantscalable keypoints,” in Proc. IEEE Int. Conf. Comput. Vis., Barcelona,Spain, Nov. 2011, pp. 2548–2555.
[80] A. Ranganathan and J. Lim, “Visual place categorization in maps,” inProc. IEEE/RSJ Int. Conf. Intell. Robot. Syst., Sep. 2011, pp. 3982–3989.
[81] A. Pronobis and B. Caputo. (2009, May). COLD: COsy localizationdatabase. Int. J. Robot. Res., [Online]. 28(5), pp. 588–594, Available:http://www.pronobis.pro/publications/pronobis2009ijrr
Ming Liu (S’12) received the B.A. degree in au-tomation from Tongji University, Shanghai, China,in 2005. During his Master’s study from Tongji Uni-versity, he was a Visiting Scholar with Erlangen-Nunberg University and Fraunhofer Institute IISB,Germany, for one year. As a result of his performanceand under a special grant, in 2007, he was admittedas a Ph.D. student to Tongji University without at-taining a master’s degree. Since 2009, he has beenworking toward the Ph.D. degree in the Departmentof Mechanical Engineering, ETH Zurich.
His current research interests include autonomous mapping, visual naviga-tion, topological mapping and environment modeling, etc.
Mr. Liu received the Best Student Paper award of IEEE MFI 2012.
Roland Siegwart (M’90–SM’03–F’08) received theDiploma degree in mechanical engineering and thePh.D. degree in mechatronics from the Eidgenossis-che Technische Hochschule (ETH) Zurich, Zurich,Switzerland, in 1983 and 1989, respectively.
From 1989 to 1990, he was a Postdoctoral Fellowat Stanford University, Stanford, CA, USA. He wasthen a part time R&D Director at MECOS TraxlerAG, Winterthur, Switzerland. He was also a part-time Lecturer and the Deputy Head of the Instituteof Robotics, ETH Zurich, where, since July 2006, he
has been a Full Professor of autonomous systems. In 1996, he was an AssociateProfessor, and later, a Full Professor for autonomous microsystems and robotswith the Ecole Polytechnique Federale de Lausanne (EPFL), Lausanne, Switzer-land, where he was Co-Initiator and the Founding Chairman of the Space CenterEPFL and the Vice Dean of the School of Engineering. In 2005, he held visitingpositions at the National Aeronautics and Space Administration (NASA) Ames,Moffett Field, CA, USA, and Stanford University, Stanford, CA. He leads a re-search group of around 35 people working in the field of robotics, mechatronics,and product design. He is a Coordinator of two large European projects, playsan active role in various rover designs of the European Space Agency, and is aCo-Founder of several spin-off companies.
Dr. Siegwart is a member of the Swiss Academy of Engineering Sciencesand a Board Member of the European Network of Robotics. From 2004 to2005, he was the Vice President for Technical Activities and a DistinguishedLecturer from 2006 to 2007. He was an AdCom Member (2007–2009) of theIEEE Robotics and Automation Society.
Authorized licensed use limited to: Hong Kong University of Science and Technology. Downloaded on March 02,2020 at 05:41:38 UTC from IEEE Xplore. Restrictions apply.