Embed Size (px)
Citation preview

THE JOURNAL OF COMPARATIVE NEUROLOGY 300:5-25 (1990)
Topography of Ganglion Cells in Human Retina
CHRISTINE A. CURCIO AND KIMBERLY A. ALLEN Departments of Biological Structure CC.A.C., K.A.A.) and Ophthalmology (C.A.C.),
University of Washington, Seattle, Washington 98195
ABSTRACT We quantified the spatial distribution of presumed ganglion cells and displaced amacrine
cells in unstained whole mounts of six young normal human retinas whose photoreceptor distributions had previously been characterized. Cells with large somata compared to their nuclei were considered ganglion cells; cells with small somata relative to their nuclei were considered displaced amacrine cells. Within the central area, ganglion cell densities reach 32,000-38,000 cells/mm2 in a horizontally oriented elliptical ring 0.4-2.0 mm from the foveal center. In peripheral retina, densities in nasal retina exceed those at corresponding eccentricities in temporal retina by more than 300%; superior exceeds inferior by 60%. Displaced amacrine cells represented 3% of the total cells in central retina and nearly 80% in the far periphery. A twofold range in the total number of ganglion cells (0. 7 to 1.5 million) was largely explained by a similar range in ganglion cell density in different eyes. Cone and ganglion cell number were not correlated, and the overall cone:ganglion cell ratio ranged from 2.9 to 7.5 in different eyes. Peripheral cones and ganglion cells have different topographies, thus suggesting meridiana! differences in convergence onto individual ganglion cells.
Low convergence of foveal cones on to individual ganglion cells is an important mechanism for preserving high resolution at later stages of neural processing. Our improved estimates for the density of central ganglion cells allowed us to ask whether there are enough ganglion cells for each cone at the foveal center to have a direct line to the brain. Our calculations indicate that 1) there are so many ganglion cells relative to cones that a ratio of only one ganglion cell per foveal cone would require fibers of Henle radiating toward rather than away from the foveal center; and 2) like the macaque, the human retina may have enough ganglion cells to transmit the information afforded by closely spaced foveal cones to both ON- and OFF-channels. Comparison of ganglion cell topography with the visual field representation in V1 reveals similarities consistent with the idea that cortical magnification is proportional to ganglion cell density throughout the visual field.
Key words: fovea, displaced amacrine cells, cones, fibers of Henle, cortical magnification
The distribution of the ganglion cells in the vertebrate retina is distinctly non-uniform. In non-human primates, there is a high concentration of cells near the fovea, a horizontally oriented zone of higher cell density in the mid-periphery (visual streak; Hughes, '77, for r eview), and higher cell density in nasal than temporal r etina (Rolls and Cowey, '70; Webb and Kaas, '76; DeBruyn et al., '80; Stone and Johnston, '81; Perry et al., '84; Perry and Cowey, '85). Human ganglion cell topography exhibits the same basic features, but our understanding of its details are surprisingly incomplete. Older studies of the human ganglion cell distribution (Vilter, '54; Van Buren, '63; Oppel, ' 67) used vertical sections, which produce varying degrees of shrinkage. It is difficult to deduce topographic details from serial sections, and cell counts must be corrected for regional differences in the size of ganglion cells. These studies also
10 1990 WILEY-LISS, INC.
used poorly defined criteria for identifying ganglion cells, and they were unaware of the large population of displaced amacrine cells now known to be a consistent feature of the mammalian ganglion cell layer (Perry, '82, for review; Wong and Hughes, '87; Wassle et al., '87). More recently, the use of whole mounts has allowed direct determination of spatial density of cells in periphery of human retina (Stone and Johnston, '81; Provis et al., '85; Quigley et al ., '89), but because foveal ganglion cells are densely packed, they are very difficult to resolve reliably in conventional whole mounts. Thus, the number of ganglion cells available for foveal vision in adult human retina remains unknown.
Accepted April 26, 1990. Christ ine A. Curcio's present address is Department of Ophthalmology,
University of Alabama-Birmingham, Birmingham, AL 35294.
6
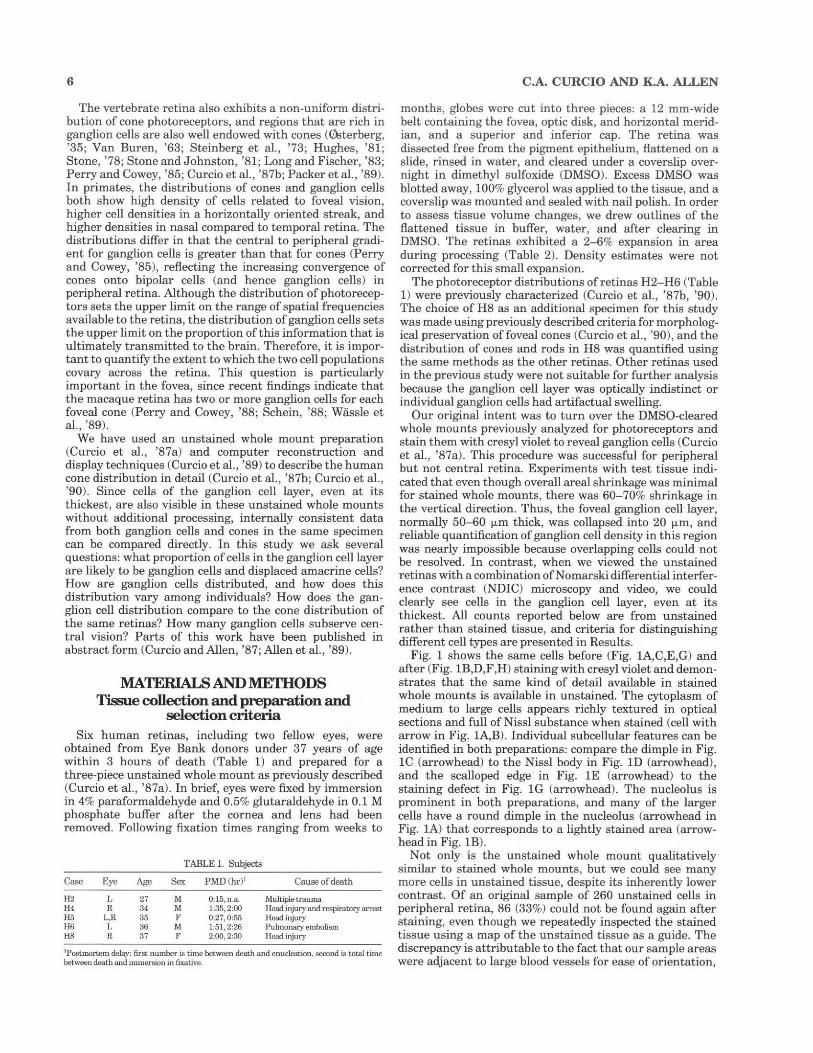
The vertebrate retina also exhibits a non-uniform distribution of cone photoreceptors, and regions that are rich in ganglion cells are also well endowed with cones (~terberg, '35; Van Buren, '63; Steinberg et al., '73; Hughes, '81; Stone, '78; Stone and Johnston, '81; Long and Fischer, '83; Perry and Cowey, '85; Curcio et al. , '87b; Packer et al. , '89). In primates, the distributions of cones and ganglion cells both show high density of cells related to foveal vision, higher cell densities in a horizontally oriented streak, and higher densities in nasal compared to temporal retina. The distributions differ in that the central to peripheral gradient for ganglion cells is greater than that for cones (Perry and Cowey, '85), reflecting the increasing convergence of cones onto bipolar cells (and hence ganglion cells) in peripheral retina. Although the distribution of photoreceptors sets the upper limit on the range of spatial frequencies available to the retina, the distribution of ganglion cells sets the upper limit on the proportion of this information that is ultimately transmitted to the brain. Therefore, it is important to quantify the extent to which the two cell populations covary across the retina. This question is particularly important in the fovea, since recent findings indicate that the macaque retina has two or more ganglion cells for each foveal cone (P erry and Cowey, '88; Schein, '88; Wassle et al. , '89).
We have used an unstained whole mount preparation (Curcio et al. , '87a) and computer reconstruction and display techniques (Curcio et al., '89) to describe the human cone distribution in detail (Curcio et al., '87b; Curcio et al., '90). Since cells of the ganglion cell layer, even at its thickest, are also visible in these unstained whole mounts without additional processing, internally consistent data from both ganglion cells and cones in the same specimen can be compared directly. In this study we ask several questions: what proportion of cells in the ganglion cell layer are likely to be ganglion cells and displaced amacrine cells? How are ganglion cells distributed, and how does this distribution vary among individuals? How does the ganglion cell distribution compare to the cone distribution of the same retinas? How many ganglion cells subserve central vision? Parts of this work have been published in abstract form (Curcio and Allen, '87; Allen et al., '89).
MA1ERIALS AND METHODS ~e collection and preparation and
selection criteria Six human retinas, including two fellow eyes, were
obtained from Eye Bank donors under 37 years of age within 3 hours of death (Table 1) and prepared for a three-piece unstained whole mount as previously described (Curcio et al., '87a). In brief, eyes were fixed by immersion in 4% paraformaldehyde and 0.5% glutaraldehyde in 0.1 M phosphate buffer after the cornea and lens had been removed. Following fixation times ranging from weeks to
TABLE 1. Subjects
Case Eye Age Sex PMD(hr)' Cause of death
H2 L 27 M 0:15, n.a. Multiple trawna H4 R 34 M 1:35, 2:00 Head injury and respiratory arrest H5 L,R 35 F 0:27, 0:55 Head injury H6 L 36 M 1:51, 2:26 Puhnonary embolism HS R 37 F 2:00, 2:30 Head injury
1 Postmortem delay: first number is time between death and enucleation, second is total time between deatb and immersion in fixative.
C.A. CURCIO AND K.A. ALLEN
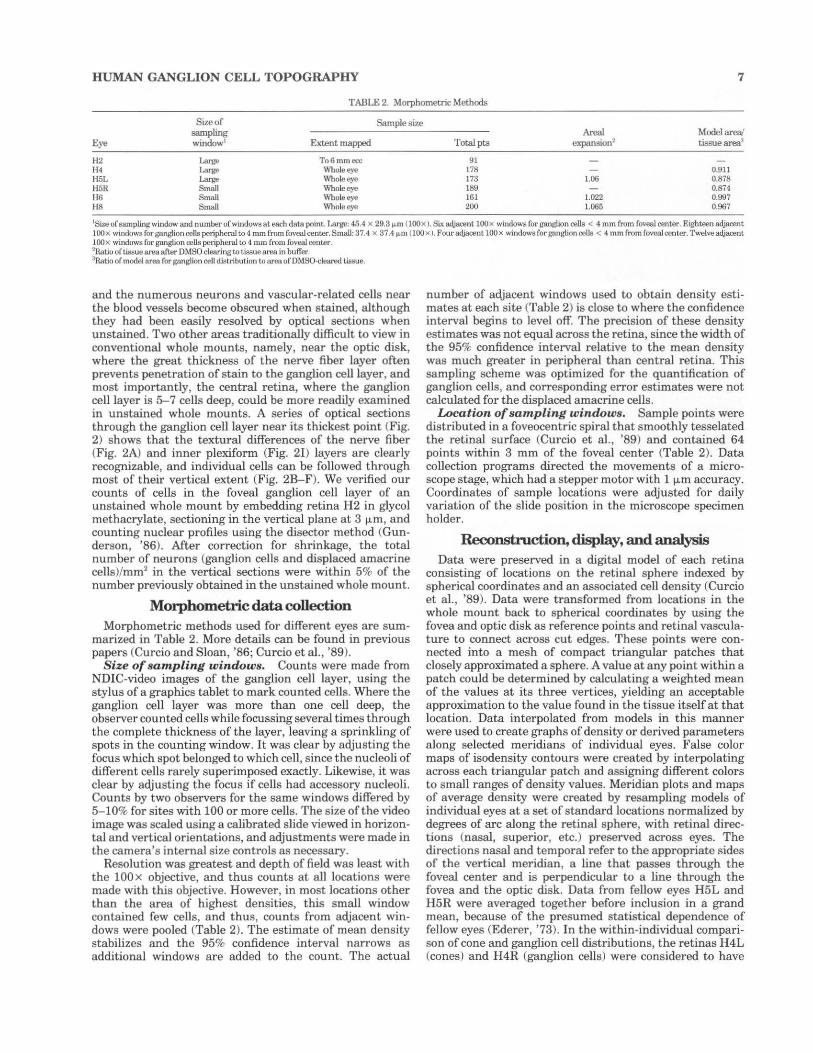
months, globes were cut into three pieces: a 12 mm-wide belt containing the fovea, optic disk, and horizontal meridian, and a superior and inferior cap. The retina was dissected free from the pigment epithelium, flattened on a slide, rinsed in water, and cleared under a coverslip overnight in dimethyl sulfoxide (DMSO). Excess DMSO was blotted away, 100% glycerol was applied to the tissue, and a coverslip was mounted and sealed with nail polish. In order to assess tissue volume changes, we drew outlines of the flattened tissue in buffer, water, and after clearing in DMSO. The retinas exhibited a 2-6% expansion in area during processing (Table 2). Density estimates were not corrected for this small expansion.
The photoreceptor distributions of retinas H2-H6 (Table 1) were previously characterized (Curcio et al., '87b, '90). The choice of H8 as an additional specimen for this study was made using previously described criteria for morphological preservation of foveal cones (Curcio et al., '90), and the distribution of cones and rods in H8 was quantified using the same methods as the other r etinas. Other retinas used in the previous study were not suitable for further analysis because the ganglion cell layer was optically indistinct or individual ganglion cells had artifactual swelling.
Our original intent was to turn over the DMSO-cleared whole mounts previously analyzed for photoreceptors and stain them with cresyl violet to reveal ganglion cells (Curcio et al., '87a). This procedure was successful for peripheral but not central retina. Experiments with test tissue indicated that even though overall areal shrinkage was minimal for stained whole mounts, there was 60-70% shrinkage in the vertical direction. Thus, the foveal ganglion cell layer, normally 50-60 11m thick, was collapsed into 20 JJ.m, and reliable quantification of ganglion cell density in this region was nearly impossible because overlapping cells could not be resolved. In contrast, when we viewed the unstained retinas with a combination ofNomarski differential interference contrast (NDIC) microscopy and video, we could clearly see cells in the ganglion cell layer, even at its thickest. All counts reported below are from unstained rather than stained tissue, and criteria for distinguishing different cell types are presented in Results.
Fig. 1 shows the same cells before (Fig. 1A,C,E,G) and after (Fig. lB,D,F,H) staining with cresyl violet and demonstrates that the same kind of detail available in stained whole mounts is available in unstained. The cytoplasm of medium to large cells appears richly textured in optical sections and full of Nissl substance when stained (cell with arrow in Fig. 1A,B). Individual subcellular features can be identified in both preparations: compare the dimple in Fig. 1C (arrowhead) to the Nissl body in Fig. 1D (arrowhead), and the scalloped edge in Fig. 1E (arrowhead) to the staining defect in Fig. 1G (arrowhead). The nucleolus is prominent in both preparations, and many of the larger cells have a round dimple in the nucleolus (arrowhead in Fig. 1A) that corresponds to a lightly stained area (arrowhead in Fig. 1B).
Not only is the unstained whole mount qualitatively similar to stained whole mounts, but we could see many more cells in unstained tissue, despite its inherently lower contrast. Of an original sample of 260 unstained cells in peripheral retina, 86 (33%) could not be found again after staining, even though we repeatedly inspected the stained tissue using a map of the unstained tissue as a guide. The discrepancy is attributable to the fact that our sample areas were acljacent to large blood vessels for ease of orientation,
HUMAN GANGLION CELL TOPOGRAPHY 7
TABLE 2. Morphometric Methods
Size of Sample size sampling Arool Model area/
Eye window' Extent mapped Totalpts expansion' tissue area'
H2 Large To6mmecc 91 H4 Large Whole eye 178 0.911 H5L Large Wholee)-e 173 1.06 0.878 H5R Small Wholee)-e 189 0.874 116 Small \\'holee)-e 161 1.022 0.997 H8 Small WholeC)-e 200 1.06fi 0.967
1SUeofswnplingwindow and number of windows at eech data point. Large: 45.4 X 29.3 ~m (100x). Six a<lj..:ent 100X windows for gBJlglloncells < 4 mm from foveal center. Eightren adjacent 100x windows for ganglion cellsperipheml to4 mm from foveal center.Small: 37.4 x 37.4 ~m (100x). Foura<\j..:ent 100x windows for ganglion cells < 4 mm from foveal center. T"-elveadjll<:ent LOO x windows for gunglion oells peripheral to 4 mm from foveal cenw·. 2Ratio ofli.osue area afulr DMSO clearingtoti.osuearoo in buffer. 'Ratio of model area for ganglion cell distribution to area ofD~tSO-cl•ared t.i&ue.
and the numerous neurons and vascular-related cells near the blood vessels become obscured when stained, although they had been easily resolved by optical sections when unstained. Two other areas traditionally difficult to view in conventional whole mounts, namely, near the optic disk, where the great thickness of the nerve fiber layer often prevents penetration of stain to the ganglion cell layer, and most importantly, the central retina, where the ganglion cell layer is 5-7 cells deep, could be more readily examined in unstained whole mounts. A series of optical sections through the ganglion cell layer near its thickest point (Fig. 2) shows that the textural differences of the nerve fiber (Fig. 2A) and inner plexiform (Fig. 21) layers are clearly recognizable, and individual cells can be followed through most of their vertical extent (Fig. 2B-F). We verified our counts of cells in the foveal ganglion cell layer of an unstained whole mount by embedding retina H2 in glycol methacrylate, sectioning in the vertical plane at 3 1-1m, and counting nuclear profiles using the disector method (Gunderson, '86). After correction for shrinkage, the total number of neurons (ganglion cells and displaced amacrine cells)/mm2 in the vertical sections were within 5% of the number previously obtained in the unstained whole mount.
Morphometric data collection Morphometric methods used for different eyes are sum
marized in Table 2. More details can be found in previous papers (Curcio and Sloan, '86; Curcio et al., '89).
Size of sampling windows. Counts were made from NDIC-video images of the ganglion cell layer, using the stylus of a graphics tablet to mark counted cells. Where the ganglion cell layer was more than one cell deep, the observer counted cells while focussing several times through the complete thickness of the layer, leaving a sprinkling of spots in the counting window. It was clear by adjusting the focus which spot belonged to which cell, since the nucleoli of different cells rarely superimposed exactly. Likewise, it was clear by adjusting the focus if cells had accessory nucleoli. Counts by two observers for the same windows differed by 5- 10% for sites with 100 or more cells. The size of the video image was scaled using a calibrated slide viewed in horizontal and vertical orientations, and adjustments were made in the camera's internal size controls as necessary.
Resolution was greatest and depth of field was least with the 100x objective, and thus counts at all locations were made with this objective. However, in most locations other than the area of highest densities, this small window contained few cells, and thus, counts from adjacent windows were pooled (Table 2). The estimate of mean density stabilizes and the 95% confidence interval narrows as additional windows are added to the count. The actual
number of adjacent windows used to obtain density estimates at each site (Table 2) is close to where the confidence interval begins to level off. The precision of these density estimates was not equal across the retina, since the width of the 95% confidence interval relative to the mean density was much greater in peripheral than central retina. This sampling scheme was optimized for the quantification of ganglion cells, and corresponding error estimates were not calculated for the displaced amacrine cells.
Location of sampling windows. Sample points were distributed in a foveocentric spiral that smoothly tesselated the retinal surface (Curcio et al., '89) and contained 64 points within 3 mm of the foveal center (Table 2). Data collection programs directed the movements of a microscope stage, which had a stepper motor with 1 fl-m accuracy. Coordinates of sample locations were adjusted for daily variation of the slide position in the microscope specimen holder.
Reconstruction, display, and analysis Data were preserved in a digital model of each retina
consisting of locations on the retinal sphere indexed by spherical coordinates and an associated cell density (Curcio et al., '89). Data were transformed from locations in the whole mount back to spherical coordinates by using the fovea and optic disk as reference points and retinal vasculature to connect across cut edges. These points were connected into a mesh of compact triangular patches that closely approximated a sphere. A value at any point within a patch could be determined by calculating a weighted mean of the values at its three vertices, yielding an acceptable approximation to the value found in the tissue itself at that location. Data in terpolated from models in this manner were used to create graphs of density or derived parameters along selected meridians of individual eyes. False color maps of isodensity contours were created by interpolating across each triangular patch and assigning different colors to small ranges of density values. Meridian plots and maps of average density were created by resampling models of individual eyes at a set of standard locations normalized by degrees of arc along the retinal sphere, with retinal directions (nasal, superior, etc.) preserved across eyes. The directions nasal and temporal refer to the appropriate sides of the vertical meridian, a line that passes through the foveal center and is perpendicular to a line through the fovea and the optic disk. Data from fellow eyes H5L and H5R were averaged together before inclusion in a grand mean, because of the presumed statistical dependence of fellow eyes (Ederer, '73). In the within-individual comparison of cone and ganglion cell distributions, the retinas H4L (cones) and H4R (ganglion cells) were considered to have
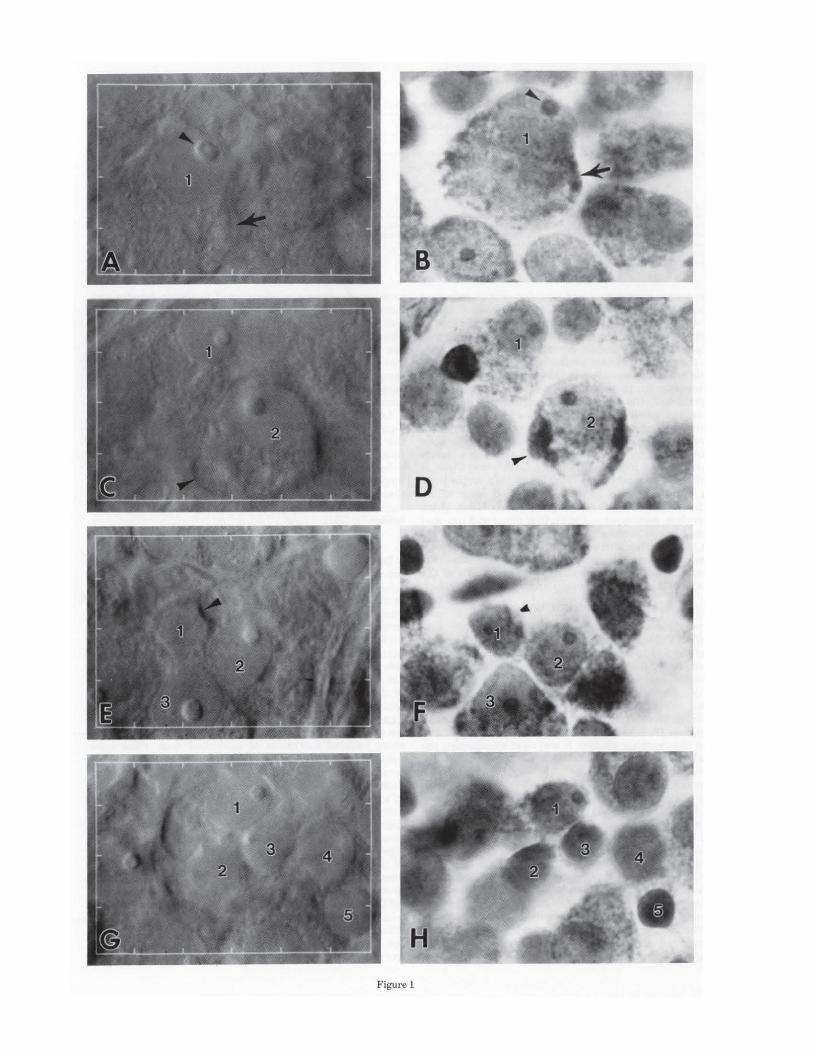
Figure 1

HUMAN GANGLION CELL TOPOGRAPHY
Fig. 2. Focus series of optical sections through ganglion cell layer at a location 3 mm temporal to the foveal center of retina H5R. Series begins at nerve fiber layer in A and ends at inner plexiform layer in I. Optical sections are approximately 3.5 11m apart. Bar in I = 10 IJ.m, a pplies to all. Arrowhead in B-F indicates one of several closely packed
originated from the same eye, since the number of cones are within 8% (Curcio et al., '90) and the number of ganglion cells are within 4% in fellow eyes (see Results). Average ganglion cell densities were converted to cells/deg 2 using a schematic eye (Drasdo and Fowler, '74) as previously described (Curcio et al. , ' 90).
Fig. 1. Cells of the peripheral ganglion cell layer in retina H2, first in an unstained whole mount (left) and again after staining with cresyl violet (right). Numbers denote corresponding cells in each pair of pictures (A-B, etc.). NDIC-video images at left and photomicrographs at right are x 1,800. A, B: Cell 1 has a prominent nucleolus (arrowheads) and organelle-rich cytoplasm (arrows). C, D: Cell 2 has a bump in the optical section that corresponds to a large Nissl body (arrowheads). E, F: Cell 1 has an indistinct nucleolus that is out of the plane of the optical section but is visible when stained in F and an indented nucleus (arrowheads). G, H: Note differences in basophilia of small cells 2-5 in H.
9
cells as it passes through several sections, beginning with a glancing section through Nissl-filled cytoplasm in B, passing thr ough nucleus and nucleolus in C, and ending with another glancing section in F. Arrows in H indicate two cells with grainy nuclei (see Fig. 4 and text for more details). A capillary with air bubbles is present in F -H.
We calculated the total number of cells and total area in specific regions or the entire retina from the mean density of a triangular patch and its area on the spherical surface. Table 2 shows that the total area of each model was 0.3-13.9% smaller than the area of the tissue. The total number of cells was therefore corrected for missing tissue area by calculating a mean density for the retina at eccentricities greater than 14 mm and multiplying that mean density by the areal difference between the model and the tissue.
RESULTS Identity of cells in the human ganglion
cell layer We used a hierarchical scheme to classify cells using
morphologic criteria. The decision about any given cell was made within the local context of other nearby cells, since
10
the size of cells and the proportion of different cell types changes with retinal region. We emphasize that it is still unknown which cell types have axons projecting to the brain, and therefore our classifications must be considered provisional. At the top of the hierarchy, we divided neurons from glia. Cells with oval nuclei resembling those interposed between axon fascicles of the nerve fiber layer and small cells with highly refractive nuclei remote from blood vessels were considered to be astrocytes and microglia, respectively. These cells were rarely found within the ganglion cell layer, consistent with findings in other species (Schnitzer, '85, '89; Karschin et al., '86; Wong and Hughes, '87).
Distinguishing ganglion cells from displaced amacrine cells is a significant problem, because the latter may constitute the majority of neurons in the ganglion cell layer in many species (e.g., rabbit: Vaney, '80; Hughes and Vaney, '80; rat: Perry, '81; cat: Wong and Hughes, '87; Wassle et al. , '87). In the monkey, the cells that disappear from peripheral retina following long-term optic tract section are described as having a pale nucleus, prominent nucleolus, granular cytoplasm, and generally larger somata
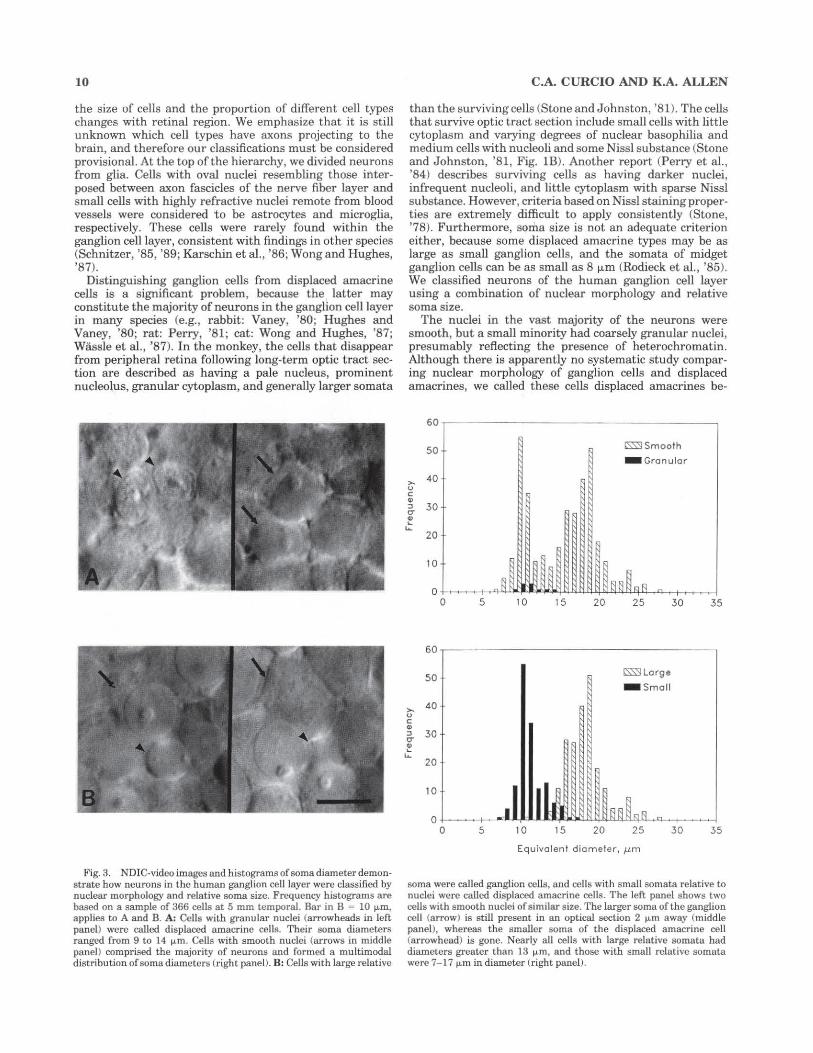
Fig. 3. NDIC-video images and histograms of soma diameter demonstrate how neurons in the human ganglion cell layer were classified by nuclear morphology and relative soma size. Frequency histograms are based on a sample of 366 cells at 5 mm temporal. Bar in B = 10 IJ.m, applies to A and B. A: Cells with granular nuclei (arrowheads in left panel) were called displaced amacrine cells. Their soma diameters ranged from 9 to 14 IJ.ffi. Cells with smooth nuclei (arrows in middle panel) comprised the majority of neurons and formed a multimodal distribution of soma diameters (right panel). B: Cells with large relative
C.A. CURCIO AND K.A. ALLEN
than the surviving cells (Stone and Johnston, '81). The cells that survive optic tract section include small cells with little cytoplasm and varying degrees of nuclear basophilia and medium cells with nucleoli and some Nissl substance (Stone and Johnston, '81, Fig. lB). Another report (Perry et al., '84) describes surviving cells as having darker nuclei, infrequent nucleoli, and little cytoplasm with sparse Nissl substance. However, criteria based on Nissl staining properties are extremely difficult to apply consistently (Stone, ' 78). Furthermore, soma size is not an adequate criterion either, because some displaced amacrine types may be as large as small ganglion cells, and the somata of midget ganglion cells can be as small as 8 !J.ID (Rodieck et al., '85). We classified neurons of the human ganglion cell layer using a combination of nuclear morphology and relative soma size.
The nuclei in the vast majority of the neurons were smooth, but a small minority had coarsely granular nuclei, presumably reflecting the presence of heterochromatin. Although there is apparently no systematic study comparing nuclear morphology of ganglion cells and displaced amacrines, we called these cells displaced amacrines be-
60
50
>- 40 0 c: .. ::> 30 cr-.. .... ...
20
10
0 0
60
50
>- 40 (J
c: .. ::> 30 cr-~ ...
20
10
0 0
5
5
10 15 20
10 15 20
ISS'5I Smooth - Granu lar
25
ISS'5I Larg e
- Small
25
30
30
Equiva lent diameter, J.J,m
35
35
soma were called ganglion cells, and cells with small somata relative to nuclei were called displaced amacrine cells. The left panel shows two cells with smooth nuclei of similar size. The larger soma of the ganglion cell (arrow) is still present in an optical section 2 I'-m away (middle panel), whereas the smaller soma of the displaced amacrine cell (arrowhead) is gone. Nearly all cells with large relative somata had diameters greater than 13 IJ.m, and those with small relative somata were 7- 17 I'-m in diameter (right panel).

HUMAN GANGLION CELL TOPOGRAPHY
cause they were small, had little cytoplasm, and were preferentially located on the inner plexiform side of the central ganglion cell layer. In a sample of 366 cells at 5 mm eccentricity, 10 cells had granular nuclei, and their soma diameters were 9-14 IJ.m (dark bars, Fig. 3A right). The remaining population (356 cells) had smooth nuclei (Fig. 3A, middle), and their soma diameters formed a multimodal population with one obvious peak at 9 IJ.m and another at 18 ~J,m (light bars, Fig. 3A right).
Of the remaining neurons with smooth nuclei, we considered cells with large and small somata relative to the nucleus ganglion cells and displaced amacrines cells, respectively (Fig. 3B, left and middle), because at least two confirmed displaced amacrine types (coronate cells: Hughes and Vaney, '80; Wong and Hughes, '87; bar cells: Hughes, '81; Wong and Hughes, '87) appear to have less cytoplasm relative to the nucleus than surrounding ganglion cells of similar soma size. This judgment divided the population with smooth nuclei into two partially overlapping groups: the group with relatively small somata had soma diameters between 7 and 17 f.l-m, and the group with relatively large somata had diameters generally greater than 13 IJ.m (Fig. 3B, right). In addition to being absolutely larger , cells with relatively large somata tended to have organelle-rich cytoplasm, and large, round nucleoli that often contained a dimple (see Fig. 2A,B). Cells with relatively small somata tended to have organelle-poor cytoplasm, and small, irregularly shaped nucleoli. Of the original population, only ten cells ( < 3%) had relatively small somata but had nucleoli that more closely resembled those in the major ity of the cells with relatively large somata. However, since we gave precedence to the subjective judgment of relative soma size, these cells would have been called displaced amacrines.
Because it was not practical to measure a ratio of soma and nuclear area for all cells counted, we need to establish the reliability of our subjective judgment of relative soma size across the range of absolute soma sizes found in the human retina. We compared our subjective classifications to direct measurements of the ratio of the largest crosssectional area of somata and nuclei (SIN ratio) for 200 cells at each of two locations with distinctly different ranges of cell sizes (Fig. 4). At 10 mm nasal (Fig. 4A), one population of neurons has areal SIN ratios less than 2, and a second population has ratios greater than 2 and as high as 6. Furthermore, 98% of the cells subjectively classified as having relatively large somata (hatched bars in Fig. 4A) had ratios greater than 2, and 98% of the cells subjectively classified as having relatively small soma (solid bars) had ratios less than 2. Both the dividing line of 2 and our subjective scoring of cells on either side of the line were consistent for eccentricities greater than 3 mm. Within 3 mm of the foveal center, however, where soma diameters are smallest (Rodieck et al. , '85; Curcio and Allen, unpublished observations), a judgment based on relative soma size was not so straightforward. At 3 mm (Fig. 4B), all cells subjectively classified as having small relative soma size (dark bars) have actual SIN ratios of 2 or less. However, 13.7% (24/175) cells subjectively classified as large had ratios of less than 2. Thus, these cells, which had soma diameters between 10.5 and 16.5 IJ..m, would have been called ganglion cells by subjective size judgment and displaced amacrine cells by the objective criterion of direct measurement. If all these cells were in fact displaced amacrine cells instead of ganglion cells, then we undercounted displaced amacrine cells by 4 7% and overcounted
11
A 30
25 10 mm NASAL
>-20
0 c: .,
15 :J 0'
~ u.
10
:I JlliQ I 0
B 30
25- 3 mm NASAL
20->-
15 j ()
c: " :J 0'
~ u.
"j 5
o' 0 2 3 4 5 6 7
S/N Ratio
Fig. 4. Cells subjectively classified as having large (hatched bars) or small (solid bars) somata relative to nuclei, compared to actual measurements of soma/nuclear (SiN) area ratio. Both somata and nuclei were measured at their largest cross-section. A: 10 mm nasal. Soma diameters were 6.1- 27.7 ~m, with two clearly separated peaks at 9- 10 and 19-20 ~m.ln a sample of200 cells, 92 were classified as small, of which 90 (98%) had actual SiN ratios less than 2, and 108 cells were classified as large, of which 106 (98%) had ratios greater than 2. B: 3 mm nasal. Soma diameters were 6.5-19.6 ~m, with a small peak at lG-11 ~m and a large peak at 14--15 ~m. In a sample of 202 cells, 27 were classified as small, of which all had SiN ratios less than 2. In contrast, of the 175 classified as large, only 151 (86.3%) had ratios greater than 2.
ganglion cells by 13.7%. Although the areal S/N ratio is not a completely valid measure of errors in our relative size judgments, since we actually make volumetric judgments while focussing through tissue (see Fig. 3B, left and middle panels), these considerations allow us to put an upper bound on errors in the application of our criteria to cells in central retina and indicate that we erred in the direction of undercounting displaced amacrine cells.
Distribution of cells in the human ganglion cell layer
Topography of ganglion cell density. Polyak ('41) divided the human retina into two regions on the basis of ganglion cell layer thickness: the central area, a foveocentric region 6 mm in diameter where the ganglion cell layer was more than one cell deep, and the remaining peripheral retina, where ganglion cells formed a single continuous or broken layer.
Central retina. The highest ganglion cell densities are found in a horizontally oriented, elliptical ring that at half-height extends from 0.4-2.0 mm from the foveal center
12 C.A. CURCIO AND K.A. ALLEN
1 0 0.5 4 15
0 '
20 . 4,0
. ~~L-~====~~ 100 200
20 40
FigureS
HUMAN GANGLION CELL TOPOGRAPHY 13
"f c 6 A
I 5 35
• - • Nasal • - • Nosa l N 30 D-C Tempora l I D - O Temporal E I E 25 '- I 0 20 I 3 0 0
I X 15 ~ 2 u l:) 10
~ 5
0 0
8 40 ----- 0 6 35
5 -
30 Jo. - .t. Superior A - A Superior
N b.-b. ln ferior b.-b.lnferior E 4 E 25 '-0 A 0 20 3
~' 0
~ X 15 ~ 2 u l:) 10
5 ""--.:.:::::.:::----&--.::::::---~ 0 0
0 2 3 4 0 2 4 6 8 10 12 14 15 18 20 22
Eccentricity. m m Eccentrici ty ,mm
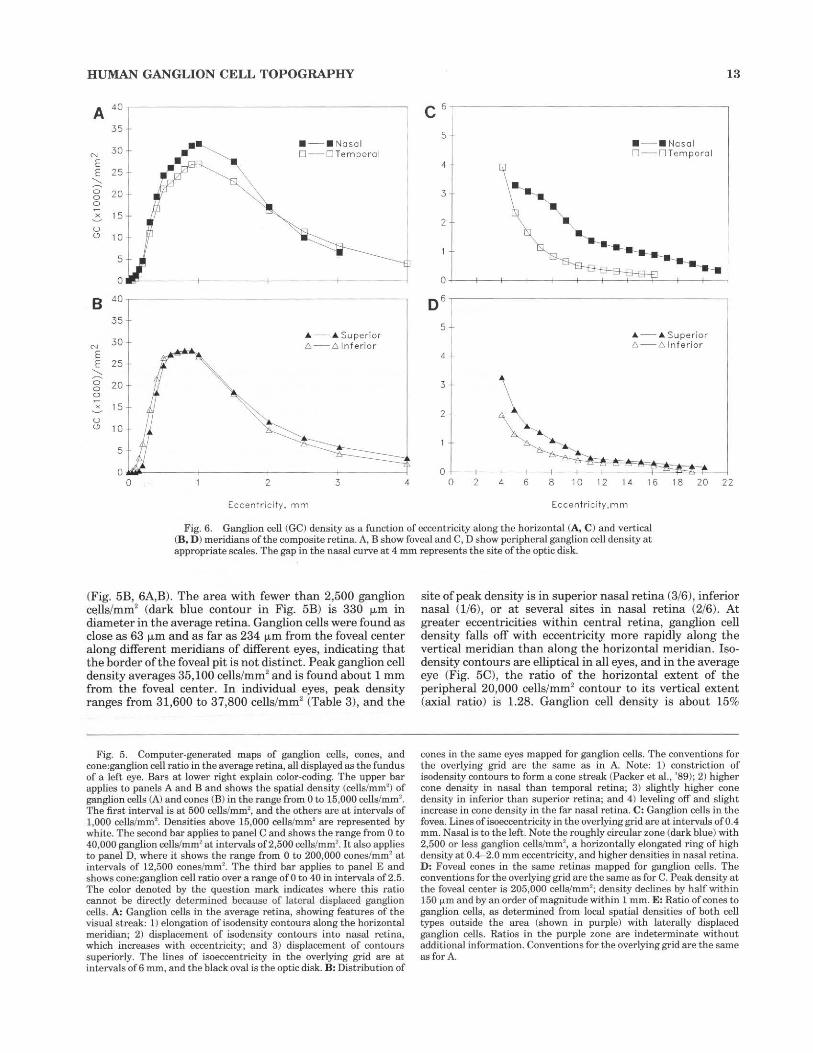
Fig. 6. Ganglion cell (GC) density as a function of eccentricity along the horizontal (A, C) and vertical (B, D ) meridians of the composite retina. A, B show foveal and C, D show peripheral ganglion cell density at appropriate scales. The gap in the nasal curve at 4 mm represents the site of the optic disk.
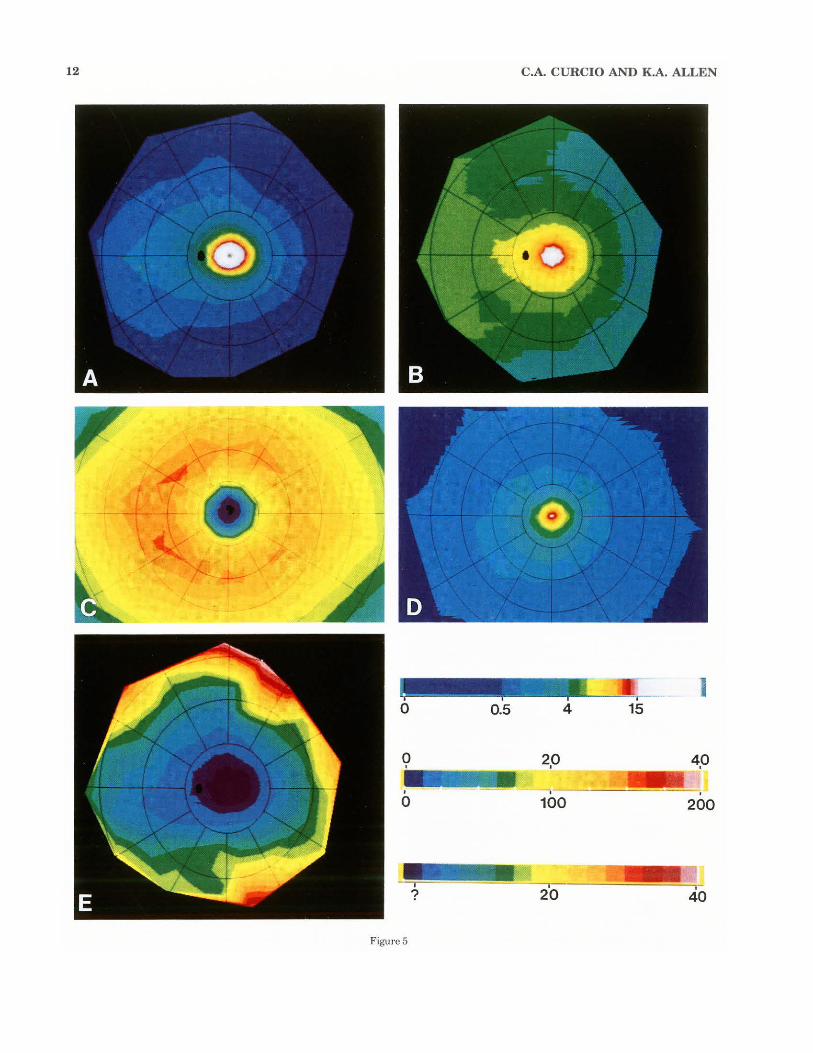
(Fig. 5B, 6A,B). The area with fewer than 2,500 ganglion cells/mm2 (dark blue contour in Fig. 5B) is 330 1-Lm in diameter in the average retina. Ganglion cells were found as close as 63 IJ.ffi and as far as 234 IJ.ffi from the foveal center along different meridians of different eyes, indicating that the border of the foveal pit is not distinct. Peak ganglion cell density averages 35,100 cells/mm2 and is found about 1 mm from the foveal center. In individual eyes, peak density ranges from 31,600 to 37,800 cells/mm2 (Table 3), and the
Fig. 5. Computer-generated maps of ganglion cells, cones, and cone: ganglion cell ratio in the average retina, all displayed as the fundus of a left eye. Bars at lower right explain color-coding. The upper bar applies to panels A and B and shows the spatial density (cells/mm') of ganglion cells (A) and cones (B) in the range from 0 to 15,000 cells/mm2
•
The first interval is at 500 cells/mm2, and the others arc at intervals of
1,000 cells/mm2• Densities above 15,000 cells/mm' are represented by
white. The second bar applies to panel C and shows the range from 0 to 40,000 ganglion cells/mm2 at intervals of2,500 cells/mm2
• It also applies to panel D, where it shows the range from 0 to 200,000 cones/mm2 at intervals of 12,500 cones/mm'. The third bar applies to panel E and shows cone:ganglion cell ratio over a range ofO to 40 in intervals of2.5. The color denoted by the question mark indicates where this ratio cannot be directly determined because of lateral displaced ganglion cells. A: Ganglion cells in the average retina, showing features of the vi.sual streak: 1) elongation of isodensity contours along the horizontal meridian; 2) displacement of isodensity contours into nasal retina, which increases with eccentricity; and 3) displacement of contours superiorly. The lines of isoeccentricity in the overlying grid are at intervals of 6 mm, and the black oval is the optic disk. B: Distribution of
site of peak density is in superior nasal retina (3/6), inferior nasal (1/6), or at several sites in nasal retina (2/6). At greater eccentricities within central retina, ganglion cell density falls off with eccentricity more rapidly along the vertical meridian than along the horizontal meridian. !sodensity contours are elliptical in all eyes, and in the average eye (Fig. 5C), the ratio of the horizontal extent of the peripheral 20,000 cells/mm2 contour to its vertical extent (axial ratio) is 1.28. Ganglion cell density is about 15%
cones in the same eyes mapped for ganglion cells. The conventions for the overlying grid are the same as in A. Note: 1) constriction of isodensity contours to form a cone streak (Packer et al., '89); 2) higher cone density in nasal than temporal retina; 3) slightly higher cone density in inferior than superior retina; and 4) leveling off and slight increase in cone density in the far nasal retina. C: Ganglion cells in the fovea. Lines ofisoeccentricity in the overlying grid are at intervals of0.4 mm. Nasal is to the left. Note the roughly circular zone (dark blue) with 2,500 or less ganglion cells/mm', a horizontally e longated ring of high density at 0.4-2.0 mm eccentricity, and higher densities in nasal retina. D: Foveal cones in the same retinas mapped for ganglion cells. The conventions for the overlying grid arc the same as for C. Peak density at the foveal center is 205,000 cells/mm' ; density declines by half within 150 1.1-m and by an order of magnitude within 1 mm. E: Ratio of cones to ganglion cells, as determined from local spatial densities of both cell types outside the area (shown in purple) with laterally displaced ganglion cells. Ratios in the purple zone are indeterminate without additional information. Conventions for t he overlying grid are the same as for A.
14 C.A. CURCIO AND K.A. ALLEN
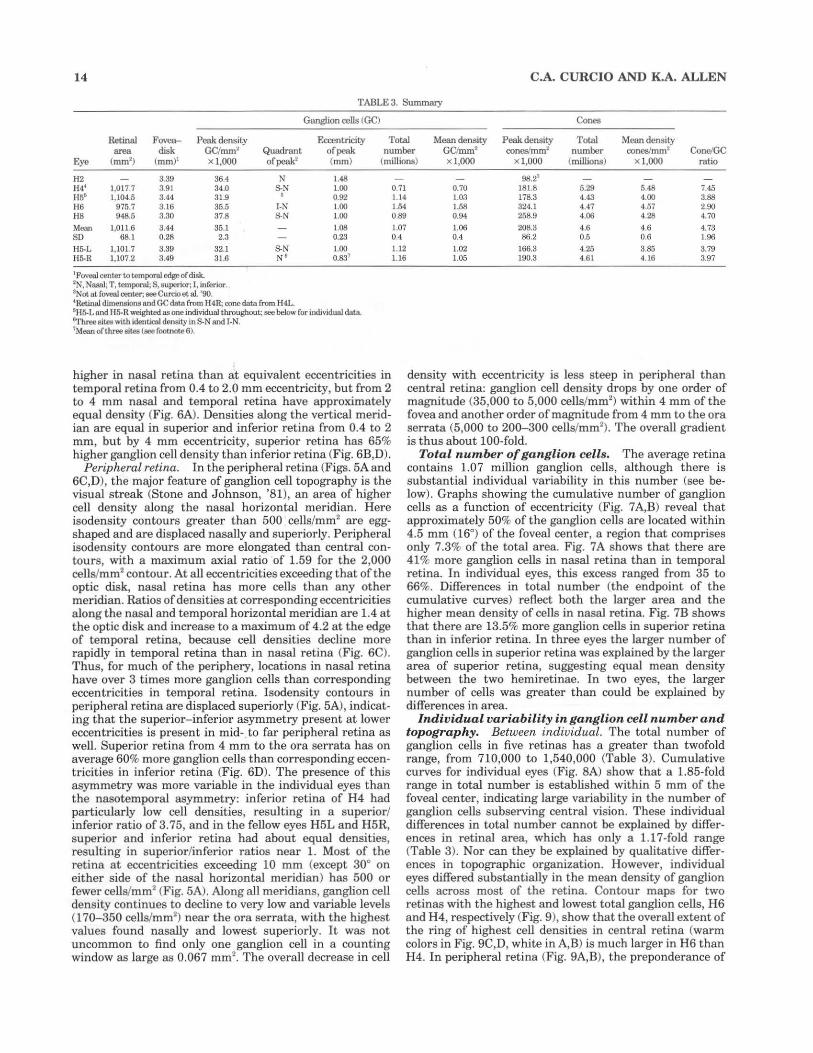
TABLE 3. Summary
Ganglion cells (GC) Cones
Retinal Fovea- Peak density Eccentricity Total Mean density Peak density Total Mean density area disk GC/mrn' Quadrant of peak number GCimrn' ooneslmrn2 number ooneslmm2 Cone.IGC
Eye (mrn' ) (mrn)' x l ,OOO ofpeak2 (mm} (millions) x l,OOO x l ,OOO (millions) Xl ,OOO ratio
H2 3.39 36.4 N 1.48 H4' 1,017 7 3.91 34.0 S.N 1.00 H56 1, 104.5 3.44 31.9 ' 0.92 H6 975.7 3.16 35.5 1-N l.OO H8 948.5 3.30 37.8 S.N 1.00
Mean 1,011.6 3.44 35.1 1.08 so 68.1 0.28 2.3 0.23
Hi;.L 1,101.7 3.39 32.1 S.N 1.00 Hi;.R 1,107 2 3.49 3 1.6 N' 0.831
'Foveal centerwtemporal edge of disk. 2N, Nnsn.l; T, tcmporaJ; S, superior; I, inferior. ' Notatfovooloonter; aeeCwcioet.al. '90. ' Retinal dllnensionsand GCdata from H4R; cone data from H4L. ' Hi;.L and I !5-R weighted"" one individual throughout.; see below for individual data. 6Three• ites with idenl.ical denSity mS.N and 1-N. 7~1ean of three sites (see footnote 6).
higher in nasal retina than at equivalent eccentricities in temporal retina from 0.4 to 2.0 mm eccentricity, but from 2 to 4 mm nasal and temporal retina have approximately equal density (Fig. 6A). Densities along the vertical meridian are equal in superior and inferior retina from 0.4 to 2 mm, but by 4 mm eccentricity, superior retina has 65% higher ganglion cell density than inferior retina (Fig. 6B,D).
Peripheral retina. In the peripheral retina (Figs. 5A and 6C,D), the major feature of ganglion cell topography is the visual streak (Stone and Johnson, '81), an area of higher cell density along the nasal horizontal meridian. Here isodensity contours greater than 500 cells/mm2 are eggshaped and are displaced nasally and superiorly. Peripheral isodensity contours are more elongated than central contours, with a maximum axial ratio of 1.59 for the 2,000 cells/mm2 contour. At all eccentricities exceeding that of the optic disk, nasal retina has more cells than any other meridian. Ratios of densities at corresponding eccentricities along the nasal and temporal horizontal meridian are 1.4 at the optic disk and increase to a maximum of 4.2 at the edge of temporal retina, because cell densities decline more rapidly in temporal retina than in nasal retina (Fig. 6C). Thus, for much of the periphery, locations in nasal retina have over 3 times more ganglion cells than corresponding eccentricities in temporal retina. Isodensity contours in peripheral retina are displaced superiorly (Fig. 5A), indicating that the superior- inferior asymmetry present at lower eccentricities is present in mid- to far peripheral retina as welL Superior retina from 4 mm to the ora serrata has on average 60% more ganglion cells than corresponding eccentricities in inferior retina (Fig. 6D). The presence of this asymmetry was more variable in the individual eyes than the nasotemporal asymmetry: inferior retina of H4 had particularly low cell densities, resulting in a superior/ inferior ratio of 3. 75, and in the fellow eyes H5L and H5R, superior and inferior retina had about equal densities, resulting in superior/inferior ratios near 1. Most of the retina at eccentricities exceeding 10 mm (except 30° on either side of the nasal horizontal meridian) has 500 or fewer cells/mm2 (Fig. 5A). Along all meridians, ganglion cell density continues to decline to very low and var iable levels (170-350 cells/mm2
) near the ora serrata, with the highest values found nasally and lowest superiorly. It was not uncommon to find only one ganglion cell in a counting window as large as 0.067 mm2
• The overall decrease in cell
98.2"' 0.71 0.70 181.8 6.29 5.48 7.45 1. 14 1.03 178.3 4.43 4.00 3.88 1.54 1.58 324.1 4.47 4 57 2.90 0.89 0.94 258.9 4.06 4.28 4.70
1.07 1.06 208.3 4.6 4.6 4.73 0.4 0.4 86.2 0.5 0.6 1.96
1.12 1.02 166.3 4.25 3.85 3.79 1.16 1.05 190.3 4.61 4.16 3.97
density with eccentricity is less steep in peripheral than central retina: ganglion cell density drops by one order of magnitude (35,000 to 5,000 cells/mm2
) within 4 mm of the fovea and another order of magnitude from 4 mm to the ora serrata (5,000 to 200-300 cells/mm2
). The overall gradient is thus about 100-fold.
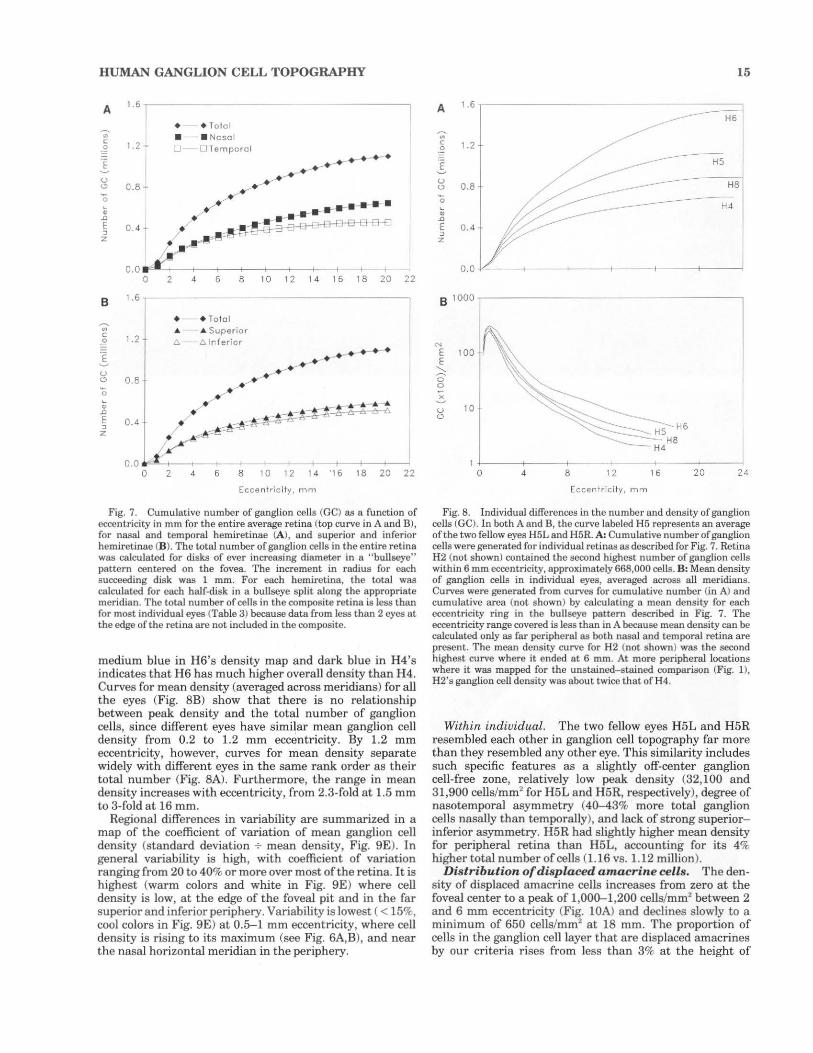
Total number of ganglion cells. The average retina contains 1.07 million ganglion cells, although there is substantial individual variability in this number (see below). Graphs showing the cumulative number of ganglion cells as a function of eccentricity (Fig. 7A,B) reveal that approximately 50% of the ganglion cells are located within 4.5 mm (16°) of the foveal center, a region that comprises only 7.3% of the total area. Fig. 7A shows that there are 41% more ganglion cells in nasal retina than in temporal retina. In individual eyes, this excess ranged from 35 to 66%. Differences in total number (the endpoint of the cumulative curves) reflect both the larger area and the higher mean density of cells in nasal retina. Fig. 7B shows that there are 13.5% more ganglion cells in superior retina than in inferior retina. In three eyes the larger number of ganglion cells in superior retina was explained by the larger area of superior retina, suggesting equal mean density between the two hemiretinae. In two eyes, the larger number of cells was greater than could be explained by differences in area.
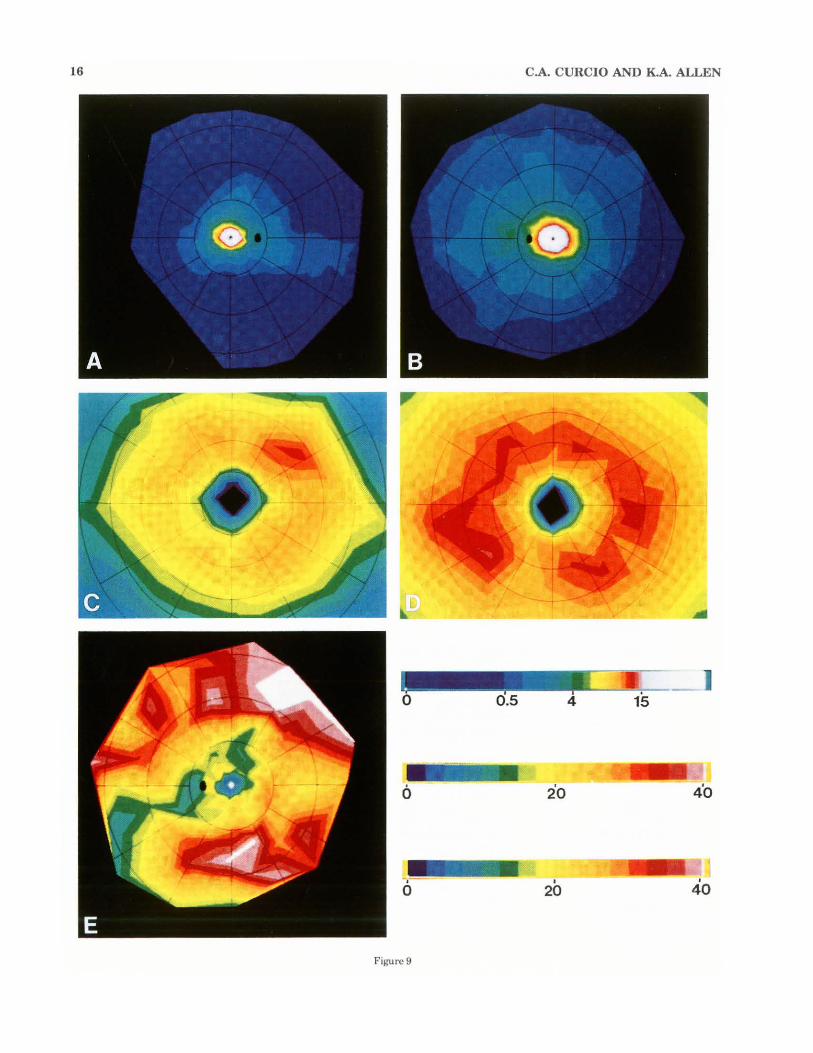
Individual var iability in ganglion cell number and topography. Between individual. The total number of ganglion cells in five retinas has a greater than twofold range, from 710,000 to 1,540,000 (Table 3). Cumulative curves for individual eyes (Fig. 8A) show that a 1.85-fold range in total number is established within 5 mm of the foveal center, indicating large variability in the number of ganglion cells subserving central vision. These individual differences in total number cannot be explained by differences in retinal area, which has only a 1.17-fold range (Table 3). Nor can they be explained by qualitative differences in topographic organization. However, individual eyes differed substantially in the mean density of ganglion cells across most of the retina. Contour maps for two retinas with the highest and lowest total ganglion cells, H6 and H4, respectively (Fig. 9), show that the overall extent of the ring of highest cell densities in central retina (warm colors in Fig. 9C,D, white in A, B) is much larger in H6 than H4. In peripheral retina (Fig. 9A,B), the preponderance of
HUMAN GANGLION CELL TOPOGRAPHY
A
~
<II c -~ .E ~
u '-' 0 ~
"' -" E :;:J z
B
~
" c
~ l u '-' 0 ~
"' -" E :;:J
z
1.6 --, • + Total
• • Ncso 1.2- ~J U Temporol ........ -.....
....... --~ .. -· 0.8-
/ -----···· -------/ ~~...a-H-f::t-f'l-fl-B-H n -fJ 0. 4 t ~~~ ,... ..
o.o •~~--~--~~---+---+---r--4- t I
o 2 4 6 8 10 12 14 16 18 20 22
1.6
+ + To tal _.. _.. Superior 1::. 6 rf erior 1.2 ... .--....-• ~-~
_..../ / ---·-=t-..... ~-.. --i'r-<'~
· ~~··
0.8
0.4
0.0 *"''"-~~------+---+---+ I -1 0 2 4 6 8 10 12 14 "1 6 18 20 22
Eccen tric ity, mm
Fig. 7. Cumulative number of ganglion cells (GC) as a fu nction of eccentricity in mm for the entire average retina (top curve in A and B), for nasal and temporal hemiretinae (A), and superior and inferior hemiretinae (B). The total number of ganglion cells in the entire retina was calculated for disks of ever increasing diameter in a "bullseye" pattern centered on the fovea. The increment in radius for each succeeding disk was 1 mm. For each hemirctina, the total was calculated for each half-disk in a bullseye split along the appropriate meridian. The total number of cells in the composite retina is less than for most individual eyes (Table 3) because data from less than 2 eyes at the edge of the retina are not included in the composite.
medium blue in H6's density map and dark blue in H4's in dicates that H6 has much rugher overall density than H4. Curves for mean density (averaged across meridians) for all the eyes (Fig. 8B) show that there is no relationsrup between peak density and the total number of ganglion cells, since different eyes have similar mean ganglion cell density from 0.2 to 1.2 mm eccentricity. By 1.2 mm eccentricity, however, curves for mean density separate widely with different eyes in the same rank order as their total number (Fig. SA). Furthermore, the range in mean density increases with eccentricity, from 2.3-fold at 1.5 mm to 3-fold at 16 mm.
Regional differences in variability are summarized in a map of the coefficient of variation of mean ganglion cell density (standard deviation -;. mean density, Fig. 9E). In general variability is high, with coefficient of variation ranging from 20 to 40% or more over most of the retina. It is highest (warm colors and white in Fig. 9E) where cell density is low, at the edge of the foveal pit and in the far superior and inferior periphery. Variability is lowest ( < 15%, cool colors in Fig. 9E) at 0.5-1 mm eccentricity, where cell density is rising to its maximum (see Fig. 6A,B), and near the nasal horizontal meridian in the periphery.
A 1.6
~
"' c 1.2 2
s u
0 .8 '-' 0 ~
"' -" E 0 .4 :;:J z
B 1000r----------------
N E 100 E
....... 0 0 ;; u '-'
0 4 8
15
------------------ HS
-------------~ H4
- I ------~-----1
-------- ------ 1-< 6 ------HS ·-....__--He
-- H4
12 I
16 20 24
Eccentricity, mm
Fig. 8. Individual differences in the number and density of ganglion cells (GC). In both A and B, the curve labeled H5 represents an average of the two fellow eyes H5L and H5R. A: Cumulative number of ganglion cells were generated for individual retinas as described for Fig. 7. Retina H2 (not shown) contained the second highest number of ganglion cells within 6 mm eccentricity, approximately 668,000 cells. B: Mean density of ganglion cells in individual eyes, averaged across all meridians. Curves were generated from curves for cumulative number (in A) and cumulative area (not shown) by calculating a mean density for each eccentr icity ring in the bullseye pattern described in Fig. 7. The eccentricity range covered is less than in A because mean density can be calculated only as far peripheral as both nasal and temporal retina are present. The mean density curve for H2 (not shown ) was t he second highest curve where it ended at 6 mm. At more peripheral locations where it was mapped for the unstained-stained comparison (Fig. 1), H2's ganglion cell density was about twice that of H4.
Within individual. The two fellow eyes H5L and H5R resembled each other in ganglion cell topography far more than they resembled any other eye. Tills similarity includes such specific features as a slightly off-center ganglion cell-free zone, relatively low peak density (32,100 and 31,900 cells/mm2 for H5L and H5R, respectively), degree of nasotemporal asymmetry (40-43% more total ganglion cells nasally than temporally), and lack of strong superiorinferior asymmetry. H5R had slightly rugher mean density for peripheral retina than H5L, accounting for its 4% rugher total number of cells (1.16 vs. 1.12 million).
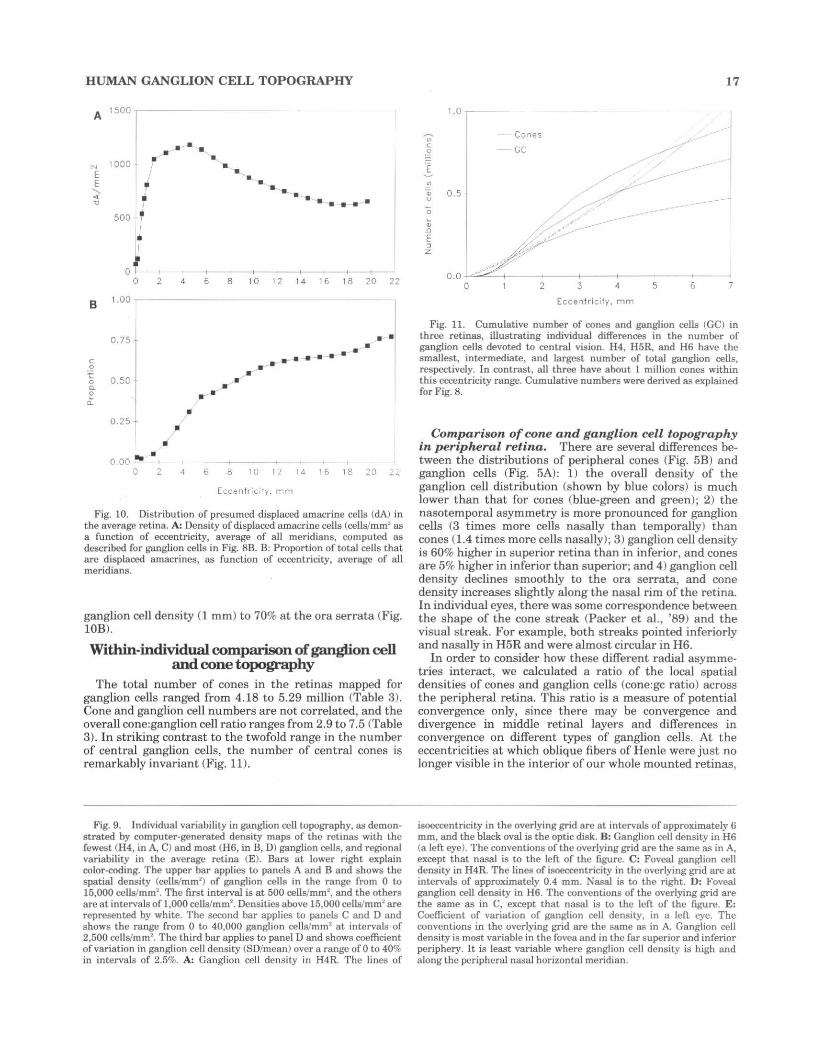
Distribution of d isplaced amacrine cells. The density of displaced amacrine cells increases from zero at the foveal center to a peak of 1,000-1,200 cells/mm2 between 2 and 6 mm eccentricity (Fig. lOA) and declines slowly to a minimum of 650 cells/mm2 at 18 mm. The proportion of cells in the ganglion cell layer that are displaced amacrines by our criteria rises from less than 3% at the height of
16 C.A. CURCIO AND K.A. ALLEN
Figure 9
HUMAN GANGLION CELL TOPOGRAPHY
A 1500 ,-----
"' E E ' ..: "0
B
c
~ 0 a. ~
0..
1000 + r I , • I
500 • I I
of 0
1.00
0.50
0.25 1
0 .00 .. • 0
I
2
2
·-· . . '• ' -. . ........ _
... .. ... ~. ..... --........... .
- -+- -+-4 6 8 10 12 14 16 18 20 22
·-- • •
• ,/
4 6
·-· .. -· .-·---
t ~ +
I
.~· - · -~ ·,
8 10 I 2 14 1 6 18 20 22
Eccentric'·y . mm
Fig. 10. Distribution of presumed displaced amacrine cells (dA) in the average retina. A: Density of displaced amacrine cell~ (cclli!lmm' as a function of eccentricity, average of all meridians, computed as described for ganglion cells in Fig. 8B. B: Proportion of total cells that are displaced amacrines, as function of eccentricity, average of all meridians.
ganglion cell density (1 mm) to 70% at the ora serrata (Fig. lOB).
Within-individual comparison of ganglion cell and cone topography
The total number of cones in the retinas mapped for ganglion cells ranged from 4.18 to 5.29 million (Table 3). Cone and ganglion cell numbers are not correlated, and the overall cone:ganglion cell ratio ranges from 2.9 to 7.5 (Table 3). In striking contrast to the twofold range in the number of central ganglion cells, the number of central cones is remarkably invariant (Fig. 11).
Fig. 9. Individual variability in ganglion cell topography, as demonstrated by computer-generated density maps of the retinas wil.h the fewest (H4, in A, C) and most (H6, in B, D) ganglion cells, and regional variability in the average retina (E). Bars at lower right explain color-coding. The upper bar applies to panels A and B and shows the spatial density (cells/mm') of ganglion cells in the range from 0 to 15,000 cells/mm'. The first interval is at 500 cells/mm', and the others are at intervals of 1,000 cells/mm' . Densities above 15,000 cells/mm' are represented by white. The second bar applies to panels C and D and shows the range from 0 to 40,000 ganglion cells/mm' at intervals of 2,500 cells/mm' . The third bar applies to panel D and shows coefficient of variation in ganglion cell density (SO/mean) over a range ofO to 40% in intervals of 2.5%. A: Ganglion cell density in H4R. The lines of
17
1.0.
• I
-;- Cones c ~
-GC
.E
"' Qj u
0.5
0 .. "' .0
E :l z
0.0 0 7
Eccenfricity. mm
Fig. 11. Cumulative number of cones and ganglion cells (GC) in three retinas, illustrating individual differences in the number of ganglion cells devoted to central vision. H4, H5R, and H6 have the smallest, intermediate, and Largest number of total ganglion cells, respectively. In contrast, all three have about l million cones within this eccentricity range. Cumulative numbers were derived as explained for Fig. 8.
Comparison of cone and ganglion cell topography in peripheral retina. There are several differences between the distributions of peripheral cones (Fig. 5B) and ganglion cells (Fig. 5A): 1) the overall density of the ganglion cell distribution (shown by blue colors) is much lower than that for cones (blue-green and green); 2) the nasotemporal asymmetry is more pronounced for ganglion cells (3 times more cells nasally than temporally) than cones (1.4 times more cells nasally); 3) ganglion cell density is 60% higher in superior retina than in inferior, and cones are 5% higher in inferior than superior; and 4) ganglion cell density declines smoothly to the ora serrata, and cone density increases slightly along the nasal rim of the retina. In individual eyes, there was some correspondence between the shape of the cone streak (Packer et al. , '89) and the visual streak. For example, both streaks pointed inferiorly and nasally in H5R and were almost circular in H6.
In order to consider how these different radial asymmetries interact, we calculated a ratio of the local spatial densities of cones and ganglion cells {cone:gc ratio) across the peripheral retina. This ratio is a measure of potential convergence only, since there may be convergence and divergence in middle retinal layers and differences in convergence on different types of ganglion cells. At the eccentricities at which oblique fibers of Henle were just no longer visible in the interior of our whole mounted retinas,
isoeccentricity in the overlying grid are at intervals of approximately 6 mm, and the black oval is the optic disk. 8: Ganglion cell density in H6 (a left eye). The conventions of the overlying grid are the same as in A, except that nasal is to the left of the figure. C: Foveal ganglion cell density in H4R. The lines of isoeccentricity in the overlying grid are at intervals of approximately 0.4 mm. Nasal is to the right. D: Foveal ganglion cell density in H6. The conventions of the overlying grid are the same as in C, except that nasal is to the lefi of the figure. E: Coefficient of variation of ganglion cell density, in a lefi eye. The conventions in lhe overlying grid are the same as in A. Ganglion cell density is most variable in the fovea and in the far superior and inferior periphery. It is least variable where ganglion cell density is high and along the peripheral nasal horizontal meridian.
18
0
~ u 0
" .. <: 0 u
20
10
0 0 2
• Nosa l Tem pera
• Superior 1-lfer;or
I
-r-;-1 I I I
' I I '· .
&xe .: ti ....-J ~ •
/ - .. _.., . ••••
• •
' .. ~ A :. ~ : • ; . . .. -11--· ! · -· •••
I ---+-- ,_
4 6 8 1 0 1 2 1 4 1 6 1 8 20 2 2
Eccer>lricily, r1'Tl
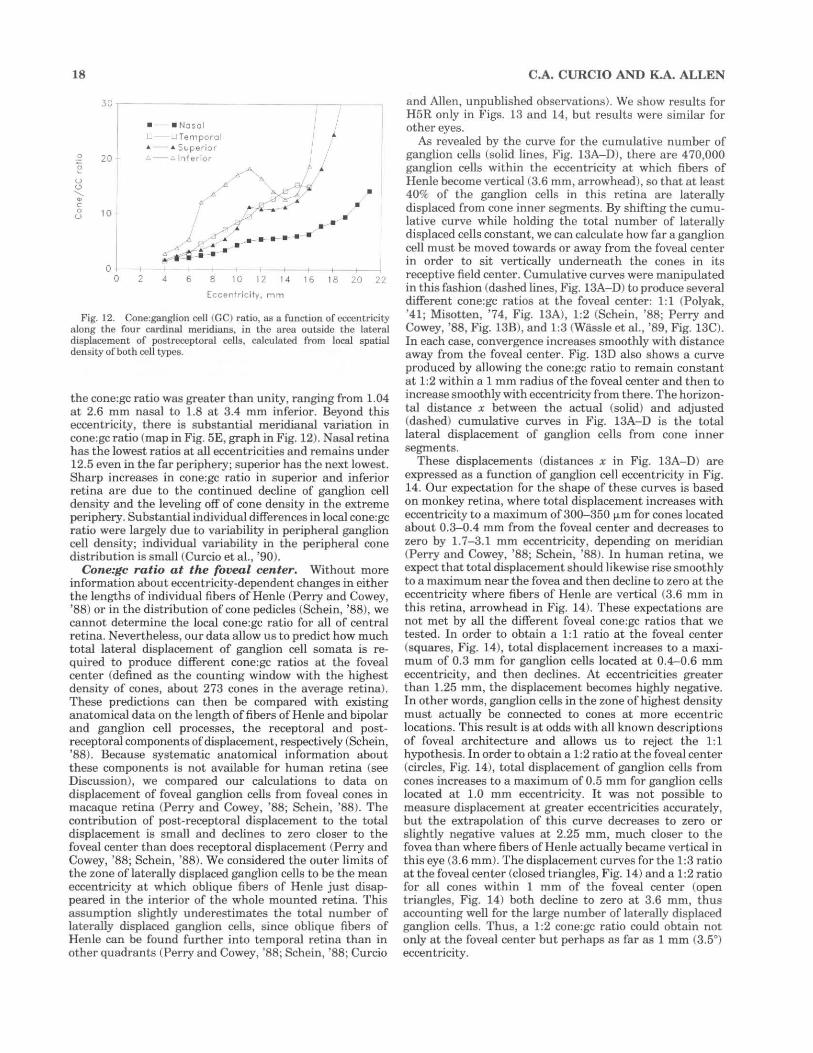
Fig. 12. Cone:ganglion cell (GC) ratio, as a function of eccentricity along the four cardinal meridians, in the area outside the lateral displacement of postrcceptoral cells, calculated from local spatial density of both cell types.
the cone:gc ratio was greater than unity, ranging from 1.04 at 2.6 mm nasal to 1.8 at 3.4 mm inferior. Beyond this eccentricity, there is substantial meridiana! variation in cone:gc ratio (map in Fig. 5E, graph in Fig. 12). Nasal retina has the lowest ratios at all eccentricities and remains under 12.5 even in the far periphery; superior has the next lowest. Sharp increases in cone:gc ratio in superior and inferior retina are due to the continued decline of ganglion cell density and the leveling off of cone density in the extreme periphery. Substantial individual differences in local cone:gc ratio were largely due to variability in peripheral ganglion cell density; individual variability in the peripheral cone distribution is small (Curcio et aL, '90).
Cone:gc ratio a t the foveal center. Without more information about eccentricity-dependent changes in either the lengths of individual fibers of Henle (Perry and Cowey, '88) or in the distribution of cone pedicles (Schein, '88), we cannot determine the local cone:gc ratio for all of central retina. Nevertheless, our data allow us to predict how much total lateral displacement of ganglion cell somata is required to produce different cone:gc ratios at the foveal center (defined as the counting window with the highest density of cones, about 273 cones in the average retina). These predictions can then be compared with existing anatomical data on the length of fibers of Henle and bipolar and ganglion cell processes, the receptoral and postreceptoral components of displacement, respectively (Schein, '88). Because systematic anatomical information about these components is not available for human retina (see Discussion), we compared our calculations to data on displacement of foveal ganglion cells from foveal cones in macaque retina (Perry and Cowey, '88; Schein, '88). The contribu tion of post-receptoral displacement to the total displacement is small and declines to zero closer to the foveal center than does receptoral displacement (Perry and Cowey, '88; Schein, '88). We considered the outer limits of the zone of laterally displaced ganglion cells to be the mean eccentricity at which oblique fibers of Henle just disappeared in the interior of the whole mounted retina. This assumption slightly underestimates the total number of laterally displaced ganglion cells, since oblique fibers of Henle can be found further into temporal retina than in other quadrants (Perry and Cowey, '88; Schein, '88; Curcio
C.A. CURCIO AND K.A. ALLEN
and Allen, unpublished observations). We show results for H5R only in Figs. 13 and 14, but results were similar for other eyes.
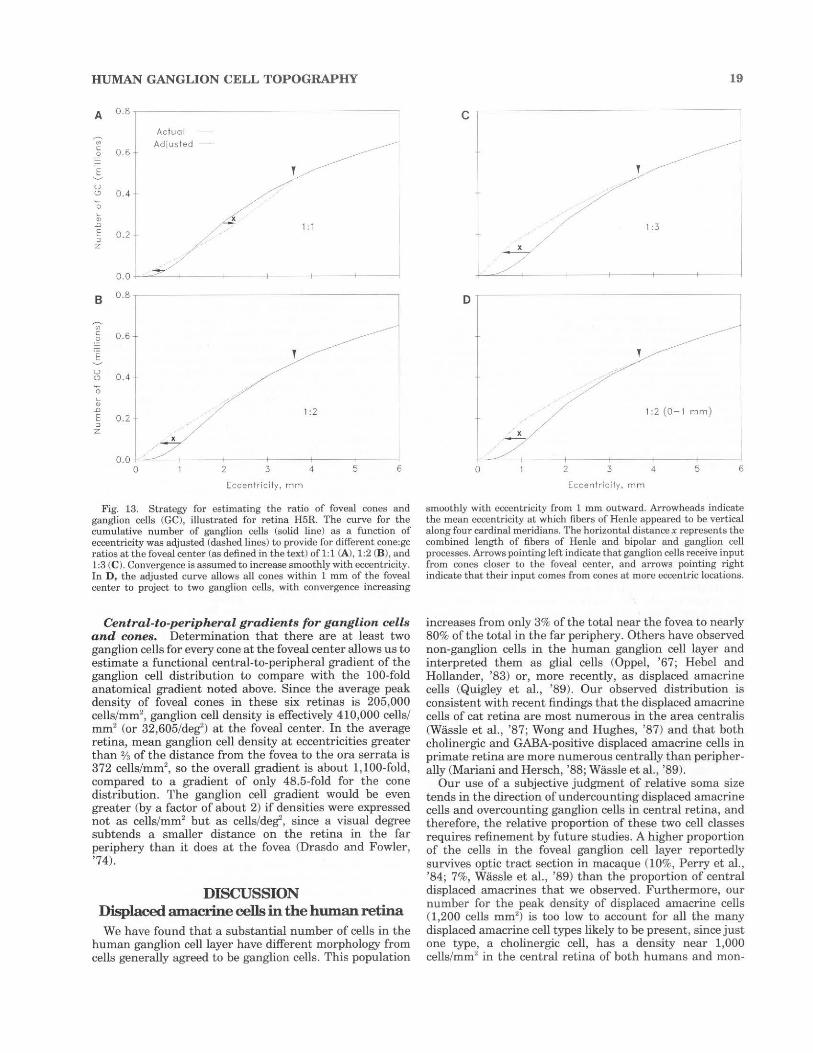
As revealed by the curve for the cumulative number of ganglion cells (solid lines, Fig. 13A-D), there are 4 70,000 ganglion cells within the eccentricity at which fibers of Henle become vertical (3.6 mm, arrowhead), so that at least 40% of the ganglion cells in this retina are laterally displaced from cone inner segments. By shifting the cumulative curve while holding the total number of laterally displaced cells constant, we can calculate how far a ganglion cell must be moved towards or away from the foveal center in order to sit vertically underneath the cones in its receptive field center. Cumulative curves were manipulated in this fashion (dashed lines, Fig. 13A-D) to produce several different cone:gc ratios at the foveal center: 1:1 (Polyak, '41; Misotten, '74, Fig. 13A), 1:2 (Schein, '88; Perry and Cowey, '88, Fig. 13B), and 1:3 (Wassle et al. , '89, Fig. 13C). In each case, convergence increases smoothly with distance away from the foveal center. Fig. 13D also shows a curve produced by allowing the cone:gc ratio to remain constant at 1:2 within a 1 mm radius of the foveal center and then to increase smoothly with eccentricity from there. The horizontal distance x between the actual (solid) and adjusted (dashed) cumulative curves in Fig. 13A-D is the total lateral displacement of ganglion cells from cone inner segments.
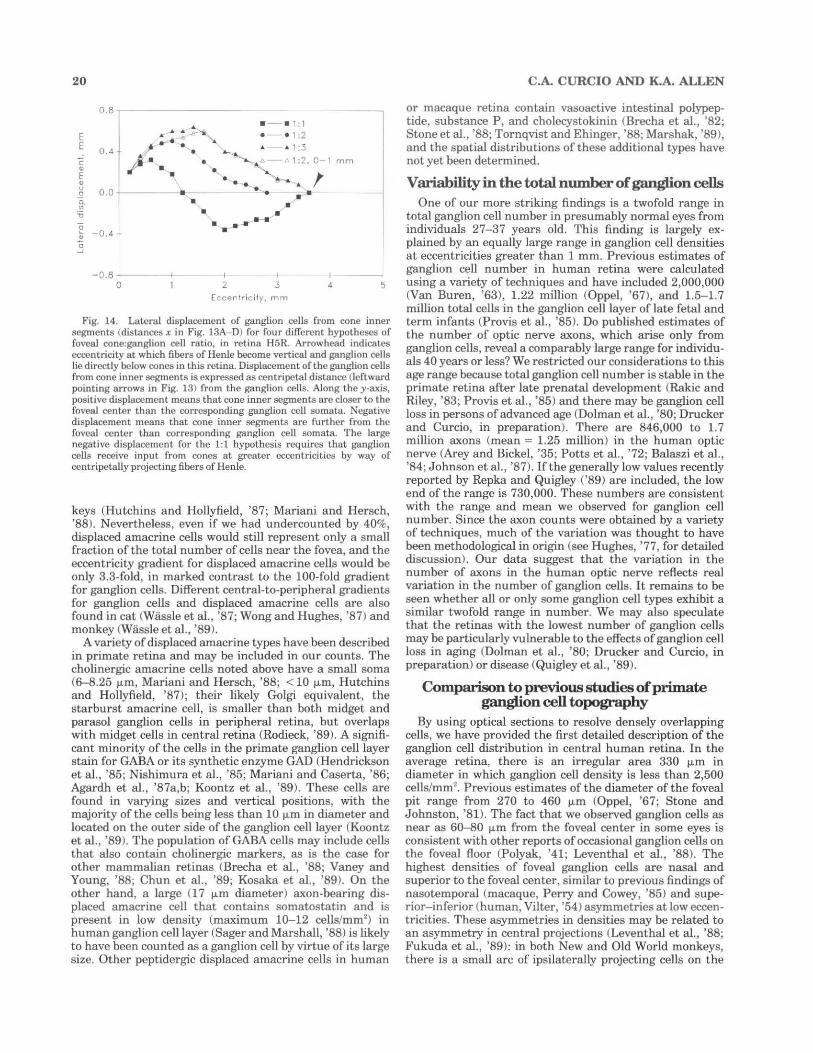
These displacements (distances x in Fig. 13A- D) are expressed as a function of ganglion cell eccentricity in Fig. 14. Our expectation for the shape of these curves is based on monkey retina, where total displacement increases with eccentricity to a maximum of300-350 fLm for cones located about 0.3-0.4 mm from the foveal center and decreases to zero by 1. 7-3.1 mm eccentricity, depending on meridian (Perry and Cowey, '88; Schein, '88). In human retina, we expect that total displacement should likewise rise smoothly to a maximum near the fovea and then decline to zero at the eccentricity where fibers of Henle are vertical (3.6 mm in this retina, arrowhead in Fig. 14). These expectations are not met by all the different foveal cone:gc ratios that we tested. In order to obtain a 1:1 ratio at the foveal center (squares, Fig. 14), total displacement increases to a maximum of 0.3 mm for ganglion cells located at 0.4-0.6 mm eccentricity, and then declines. At eccentricities greater than 1.25 mm, the displacement becomes highly negative. In other words, ganglion cells in the zone of highest density must actually be connected to cones at more eccentric locations. This result is at odds with all known descriptions of foveal architecture and allows us to reject the 1:1 hypothesis. In order to obtain a 1:2 ratio at the foveal center (circles, Fig. 14), total displacement of ganglion cells from cones increases to a maximum of0.5 mm for ganglion cells located at LO mm eccentricity. It was not possible to measure displacement at greater eccentricities accurately, but the extrapolation of this curve decreases to zero or slightly negative values at 2.25 mm, much closer to the fovea than where fibers of Henle actually became vertical in this eye (3.6 mm). The displacement curves for the 1:3 ratio at the foveal center (closed triangles, Fig. 14) and a 1:2 ratio for all cones within 1 mm of the foveal center (open triangles, Fig. 14) both decline to zero at 3.6 mm, thus accounting well for the large number of laterally displaced ganglion cells. Thus, a 1:2 cone:gc ratio could obtain not only at the foveal center but perhaps as far as 1 mm (3.5°) eccentricity.
HUMAN GANGLION CELL TOPOGRAPHY
A
~ c .2
'E: u ~
0 ... '" .D
E :J z
B
~
"' c .2 .E ~
u (;>
0 ... '" .D
E :J z
0.8
0 .6
0 .4
0 .2
o.o I 0 .8
0 .6
0 .4
0 .2
0 .0 0
Ac tua Adjus ted
/ /
._/ -- ,. __ _
Eccentric ity, mm
Fig. 13. Strategy for estimating the ratio of foveal cones and ganglion cells (GC), illustrated for retina H5R. The curve for the cumulative number of ganglion cells (solid line) as a function of eccentricity was adjusted (dashed lines) to provide for different cone:gc ratios at the foveal center (as defined in the text) of 1:1 (A), 1:2 (B), and 1:3 (C). Convergence is assumed to increase smoothly with eccentricity. In D, the adjusted curve allows all cones within 1 mm of the foveal center to project to two ganglion cells, with convergence increasing
Central-to-peripheral gradients for ganglion cells and cones. Determination that there are at least two ganglion cells for every cone at the foveal center allows us to estimate a functional central-to-peripheral gradient of the ganglion cell distribution to compare with the 100-fold anatomical gradient noted above. Since the average peak density of foveal cones in these six retinas is 205,000 cells/mm2
, ganglion cell density is effectively 410,000 cells/ mm2 (or 32,605/deg2) at the foveal center. In the average retina, mean ganglion cell density at eccentricities greater than % of the distance from the fovea to the ora serrata is 372 cells/mm2
, so the overall gradient is about 1,100-fold, compared to a gradient of only 48.5-fold for the cone distribution. The ganglion cell gradient would be even greater (by a factor of about 2) if densities were expressed not as cells/mm2 but as cells/deg2, since a visual degree subtends a smaller distance on the retina in the far periphery than it does at the fovea (Drasdo and Fowler, '74).
DISCUSSION Displaced amacrine cells in the human retina We have found that a substantial number of cells in the
human ganglion cell layer have different morphology from cells generally agreed to be ganglion cells. This population
D
19
------~--------------
~--+------t-/ "'--+---
,. 0
I 2 3
Eccen tricity , mm
1:2 (0 - 1 mm)
4 5 6
smoothly with eccentricity from 1 mm outward. Arrowheads indicate the mean eccentricity at which fibers of Henle appeared to be vertical along four cardinal meridians. The horizontal distance x represents the combined length of fibers of Henle and bipolar and ganglion cell processes. Arrows pointing left indicate that ganglion cells receive input from cones closer to the foveal center, and arrows pointing right indicate that their input comes from cones at more eccentric locations.
increases from only 3% of the total near the fovea to nearly 80% of the total in the far periphery. Others have observed non-ganglion cells in the human ganglion cell layer and interpreted them as glial cells (Oppel, '67; Hebel and Hollander, '83) or, more recently, as displaced amacrine cells (Quigley et al., '89). Our observed distribution is consistent with recent findings that the displaced amacrine cells of cat retina are most numerous in the area centralis (Wassle et al., '87; Wong and Hughes, '87) and that both cholinergic and GABA-positive displaced amacrine cells in primate retina are more numerous centrally than peripherally (Mariani and Hersch, '88; Wassle et al., '89).
Our use of a subjective judgment of relative soma size tends in the direction of undercounting displaced amacrine cells and overcounting ganglion cells in central retina, and therefore, the relative proportion of these two cell classes requires refinement by future studies. A higher proportion of the cells in the foveal ganglion cell layer reportedly survives optic tract section in macaque (10%, Perry et al., '84; 7%, Wassle et al., '89) than the proportion of central displaced amacrines that we observed. Furthermore, our number for the peak density of displaced amacrine cells (1,200 cells mm2
) is too low to account for all the many displaced amacrine cell types likely to be present, since just one type, a cholinergic cell, has a density near 1,000 cells/mm2 in the central retina of both humans and mon-
20
E E
c
"' E "'
0.8
0.4
... • - • 1: 1 ~;~~~ • - • 1:2
' • • ...,_ • & 1:3 )•. • -~,.1 :2.0-1
u .2 o_
-~
"\ '--............ .._"'-... t 0.0 -t---- .. .? 'a
" ~ - 0.4
.2! 0
...J
- 0.8 0
.. , ,... . ---------2
I
3 Eccertricity, mm
I
4
mm
5
Fig. 14. Lateral displacement of ganglion cells from cone inner segments (distances x in Fig. 13A- D) for four different hypotheses of foveal cone:ganglion cell ratio, in retina H5R. Arrowhead indicates eccentricity at which fibers of Henle become vertical and ganglion cells lie directly below cones in this retina. Displacement of the ganglion cells from cone inner segments is expressed as centripetal distance (leftward pointing arrows in Fig. 13) from the ganglion cells. Along they-axis, positive di~placement means that cone inner segments are closer to the foveal center than the corresponding ganglion cell somata. Negative displacement means that cone inner segments are further from the foveal center than corresponding ganglion cell somata. The large negative displacement for the 1:1 hypothesis requires that ganglion cells receive input from cones at greater eccentricities by way of centripetally projecting fibers of Henle.
keys (Hutchins and Hollyfield, '87; Mariani and Hersch, '88). Nevertheless, even if we had undercounted by 40%, displaced amacrine cells would still represent only a small fraction of the total number of cells near the fovea, and the eccentricity gradient for displaced amacrine cells would be only 3.3-fold, in marked contrast to the 100-fold gradient for ganglion cells. Different central-to-peripheral gradients for ganglion cells and displaced amacrine cells are also found in cat (Wassle et al., '87; Wong and Hughes, '87) and monkey (Wassle et al., '89).
A variety of displaced amacrine types have been described in primate retina and may be included in our counts. The cholinergic amacrine cells noted above have a small soma (6-8.25 IJ.m, Mariani and Hersch, '88; < 10 tJ.m, Hutchins and Hollyfield, '87); their likely Golgi equivalent, the starburst amacrine cell, is smaller than both midget and parasol ganglion cells in peripheral retina, but overlaps with midget cells in central retina (Rodieck, '89). A significant minority of the cells in the primate ganglion cell layer stain for GABA or its synthetic enzyme GAD (Hendrickson et al., '85; Nishimura et al., '85; Mariani and Caserta, '86; Agardh et al., '87a,b; Koontz et al., '89). These cells are found in varying sizes and vertical positions, with the majority of the cells being less than 10 tJ.m in diameter and located on the outer side of the ganglion cell layer (Koontz et al., '89). The population of GABA cells may include cells that also contain cholinergic markers, as is the case for other mammalian retinas (Brecha et al., '88; Vaney and Young, '88; Chun et al. , '89; Kosaka et al., '89). On the other hand, a large (17 tJ.m diameter) axon-bearing displaced amacrine cell that contains somatostatin and is present in low density (maximum 10- 12 cells/mm2
) in human ganglion cell layer (Sager and Marshall, '88) is likely to have been counted as a ganglion cell by virtue of its large size. Other peptidergic displaced amacrine cells in human
C.A. CURCIO AND K.A. ALLEN
or macaque retina contain vasoactive intestinal polypeptide, substance P , and cholecystokinin (Brecha et al., '82; Stone et al., '88; Tornqvist and Ehinger, '88; Marshak, '89), and the spatial distributions of these additional types have not yet been determined.
Variability in the total number of ganglion cells One of our more striking findings is a twofold range in
total ganglion cell number in presumably normal eyes from individuals 27-37 years old. This finding is largely explained by an equally large range in ganglion cell densities at eccentricities greater than 1 mm. Previous estimates of ganglion cell number in human retina were calculated using a variety of techniques and have included 2,000,000 (Van Buren, '63), 1.22 million (Oppel, '67), and 1.5-1.7 million total cells in the ganglion cell layer of late fetal and term infants (Provis et al., '85). Do published estimates of the number of optic nerve axons, which arise only from ganglion cells, reveal a comparably large range for individuals 40 years or less? We restricted our considerations to this age range because total ganglion cell number is stable in the primate retina after late prenatal development (Ralcic and Riley, '83; Provis et al., '85) and there may be ganglion cell Joss in persons of advanced age (Dolman et al., '80; Drucker and Curcio, in preparation). There are 846,000 to 1. 7 million axons (mean = 1.25 million) in the human optic nerve (Arey and Bickel, '35; Potts et al., '72; Balaszi et al., '84; Johnson et al., '87). If the generally low values recently reported by Repka and Quigley ('89) are included, the low end of the range is 730,000. These numbers are consistent with the range and mean we observed for ganglion cell number. Since the axon counts were obtained by a variety of techniques, much of the variation was thought to have been methodological in origin (see Hughes, '77, for detailed discussion). Our data suggest that the variation in the number of axons in the human optic nerve reflects real variation in the number of ganglion cells. It remains to be seen whether all or only some ganglion cell types exhibit a similar twofold range in number. We may also speculate that the retinas with the lowest number of ganglion cells may be particularly vulnerable to the effects of ganglion cell Joss in aging (Dolman et al., '80; Drucker and Curcio, in preparation) or disease (Quigley et al., '89).
Comparison to previous studies of primate ganglion cell topography
By u sing optical sections to resolve densely overlapping cells, we have provided the first detailed description of the ganglion cell distribution in central human retina. In the average retina, there is an irregular area 330 tJ.m in diameter in which ganglion cell density is less than 2,500 cells/mm2
• Previous estimates of the diameter of the foveal pit range from 270 to 460 tJ.m (Oppel, '67; Stone and Johnston, '81). The fact that we observed ganglion cells as near as 60-80 11m from the foveal center in some eyes is consistent with other reports of occasional ganglion cells on the foveal floor (Polyak, '41; Leventhal et al., '88). The highest densities of foveal ganglion cells are nasal and superior to the foveal center, similar to previous findings of nasotemporal (macaque, Perry and Cowey, ' 85) and superior-inferior (human, Vilter, '54) asymmetries at low eccentricities. These asymmetries in densities may be related to an asymmetry in central projections (Leventhal eta!., '88; Fukuda et al., '89): in both New and Old World monkeys, there is a small arc of ipsilaterally projecting cells on the

HUMAN GANGLION CELL TOPOGRAPHY
nasal side of the foveal slope without a corresponding arc of contralaterally projecting cells on the temporal side.
The peak density of presumed ganglion cells in unstained whole mounts is 31,600-37,800 cells/mm2 at about 1 mm from the foveal center. Our estimates, which were validated by counts in vertical sections through one retina, are similar to those reported for sectioned human retinas by Oppel ('67) (30,000-33,000 cells/mm~) and Misotten ('74) (32,7000 cells/mm2
). Our estimate of peak ganglion cell density is substantially lower than the indirectly calculated figure of 80,000 cells/mm2 reported by Van Buren ('63), and substantially higher than the figures of 17,000-21,000 cells/mm2 in late prenatal retina (Provis et al., '85) and 20,000 cells/mm2 in retinas from elderly individuals (Quigley et al., '89). The low values in the latter two studies may represent either undercounting due to overlapping cells in conventionally stained whole mounts, or in the case of the Quigley et al. ('89) study, age-related ganglion cell loss. It is difficult to compare our data on human retina with the conflicting literature on the density of foveal ganglion cells in other diurnal primates. Peak densities of 30,000-33,000 cells/mm2 have been reported both for whole mounted (Perry and Cowey, '85) and vertically sectioned (Rolls and Cowey, '70) macaque retinas, although it has been suggested that the latter values are actually over 50,000 cells/mm2 when corrected for shrinkage (Schein, '88). Others using semi thin vertical sections and improved stereological techniques have observed that peak ganglion cell density in macaque is 48,000 cells/mm2 (Wiissle et al. , '89). Peak density in baboon retina is 26,000-34,000 cells/mm2
in conventional whole mounts and higher by a factor of2 in vertical sections (Fisher and Kirby, '90). Peak ganglion cell density in cebus monkey is also much higher than in humans (49,000 cells/mm2
), even in stained whole mounts (Silveira et al., '89). Some of the discrepancies in reports on a single species are certainly due to differences in methodology. More data are needed, however, to determine if non-human primates have consistently higher density of foveal ganglion cells than humans. Such a difference might be explained partly by comparative optics, because high packing density of ganglion cells would be one way to provide high sampling density (cells/deg2) in foveal vision of primates with eyes smaller than human eyes.
The peripheral human retina contains a weak visual streak (Hughes, '77), an area of higher ganglion cell density along the horizontal meridian. The visual streak has a prominent nasotemporal asymmetry at eccentricities exceeding that of the optic disk such that the nasal retina has greater than threefold higher density than corresponding eccentricities in temporal retina. This asymmetry is a consistent feature also seen in other studies of human (Van Buren, '63; Oppel, '67; Stone and Johnston, '81), macaque (Rolls and Cowey, '70; Perry et al., '84; Perry and Cowey, '85; Fukuda et al., '89; Wiissle et al., '89), baboon (Fisher and Kirby, '90), and cebus (Silveira et al., '89) retina, although the asymmetry in human retina is not as marked as has been reported for macaque (Wiissle et al., '89). We found no evidence for secondary peaks in ganglion cell density along the mid-peripheral horizontal meridian, as was reported for all five of Oppel's ('67) human specimens. On the other hand, a superior-inferior asymmetry in the human ganglion cell distribution is not as consistently found as the nasotemporal asymmetry. There was 60% higher density in superior retina compared to inferior in the average eye, but the excess density in superior retina
21
ranged from fourfold to zero in different retinas. This variability no doubt accounts for the discrepancy between reports in the literature: Van Buren ('63) noted higher density superiorly in some but not all eyes, Stone and Johnston ('81) showed a substantial difference between superior and inferior retina, and Perry and Cowey ('85) saw a small increase in ganglion cell density inferiorly, which they assumed was related to a similar asymmetry in the cone distribution of the same retina.
The radial asymmetry of the peripheral ganglion cell distribution is also consonant with psychophysical evidence of meridional variation in visual function. In particular, one function that is thought to be limited by the spacing of ganglion cell receptive fields is resolution acuity (Weymouth, '58; Thibos et al., '87). Isodensity contours in the periphery of the average retina (Fig. 5A) are remarkably similar to isoacuity contours (Wertheim, '80), since resolution is better in both temporal and inferior field (nasal and superior retina, respectively).
Our estimates of ganglion cell density (averaged across all meridians) can be used with dendritic field diameters of parasol and midget cells in human retina (Rodieck et al. , '85) to estimate coverage for these two ganglion cell types. Assuming that midget cells comprise 80% of the ganglion cells across the retina (Perry et al., '84), coverage for midget cells is 1.6-3.4 from 1 to 12 mm eccentricity, in good agreement with the coverage calculated for macaque (Perry et al., '84). Assuming that parasol cells comprise 10% of ganglion cells (Perry et al., '84), their coverage is 1.5-2.6 at eccentricities exceeding 6 mm and much larger (4-17) at lesser eccentricities. This large estimated coverage for parasol cells in central retina may be attributable to the fact that dendritic field diameters measured in this eccentricity range in the two fellow eyes studied by Rodieck et al. ('85) are unusually large (Watanabe and Rodieck, '89).
Comparison of cones and ganglion ceDs The distributions of cone photoreceptors and ganglion
cells are similar in many (macaque: Perry and Cowey, '85; cat: Steinberg et al., '73; Hughes, '75, '81; Stone, '78; squirrel: Long and Fischer, '83) but not all (tree shrew: Muller and Peichl, '89) mammalian species. The use of the same specimens for quantification of both cell populations and the more detailed topographies afforded by our reconstruction techniques have revealed intriguing differences between cone and ganglion cell topography in peripheral retina of humans. Now that it is clear that ganglion cell density declines steadily to the ora serrata, the functional significance of an increase in cone density in the far nasal periphery (Curcio et al., '90) is more obscure. Without more ganglion cells to convey information to higher visual centers, the increased cone density is unlikely to produce greater resolution. Perhaps it is a mechanism for increasing the aggregate light gathering ability of the cone mosaic, but then it is unclear why such an advantageous increase is found only in nasal retina and why a similar phenomenon is not present for rods as well. Other differences between the cone and ganglion cell distributions in peripheral retina suggest that there may be meridianal differences in the convergence of cones onto ganglion cells, perhaps reflecting differences in the distributions of specific ganglion cell types. It is possible that the higher density of ganglion cells in superior retina is related to the higher density of rods in this quadrant (Curcio et al., '90) rather than to cones, but rod density in superior retina is only 15-20% higher than

22
inferior over the eccentricity range in which superior ganglion cells outnumber inferior by 60-70%.
In central retina, minimal convergence of cones onto ganglion cells has been long believed to provide a mechanism for preserving the high sampling density of foveal cones at later stages of neural processing. Our finding that there are so many central ganglion cells that there cannot be only one ganglion cell per foveal cone without requiring centripetally traveling fibers of Henle is consistent with recent evidence that the ratio of cones to ganglion cells in the macaque fovea is 1:2 (Perry and Cowey, '88; Schein, '88), perhaps as far eccentric as 3°. These studies agree with Golgi evidence (Boycott and Dowling, '69; Kolb et al. , '69; and Polyak's drawings, '41) that each foveal cone contacts two midget bipolar cells, each of which in turn contacts a midget ganglion cell. One pair of midget bipolars and ganglion cells stratifies in the outer part of the inner plexiform layer and the other in the inner part, suggesting that these cells are OFF- and ON-center, respectively (Famiglietti and Kolb, '76; Nelson et al., '78; Watanabe and Rodieck, '89). Thus in human and macaque there are sufficient ganglion cells to provide a representation of closely spaced foveal cones in both the ON- and OFFchannels. Even greater divergence of foveal cones, such as one cone projecting to three ganglion cells (Vilter, '54; Wiissle et al., '89) would allow individual cones to project to ganglion cell types other than just ON- and OFF-center midgets. Our finding contrasts to those of earlier studies (Polyak, '41; Missotten, ' 7 4), which suggested that each cone was connected to only one midget bipolar cell, which in turn connected to one midget ganglion cell. If we assume a 1:2 ratio, the effective sampling density of ganglion cells (32,605 cells/deg2) at the human foveal center is remarkably close to the prediction of 33,000 cells/de!f made by Drasdo ('77, '89).
While our calculations allow us to reject a foveal cone: ganglion cell ratio of 1:1 and even a ratio of 1:2 confined to just the foveal center, we currently have no basis for strongly supporting either of the other two possibilities we tested. Ratios of 1:3 at the foveal center only and 1:2 over a wider area of central retina both account reasonably well for the large number of laterally displaced ganglion cells. Since the length of the cone fiber represents about 88% of the total maximum displacement in macaque (Perry and Cowey, '88; Schein, '88), we predict that the maximum length of fibers of Henle in human retina would be 528-682 1-Lm for the 1:3 ratio and 480-528 1-Lm for the 1:2 ratio over 0-1 mm eccentricity. Unfortunately, existing data on the lengths of fibers of H~nle in human retina are too sparse and inconsistent to distinguish between these possibilities, since reported values range from 80 to 600 1-Lm for foveal cones at unspecified eccentricities (Polyak, '41; Yamada, '69; Missotten, '74; Yuodelis and Hendrickson, '86; Ahnelt and Pflug, '86). Clearly, more anatomic data about fibers of Henle and the functional displacement introduced by bipolar and ganglion cell dendrites are required to resolve this question.
Our sample of retinas includes those whose peak foveal cone density ranges from the low (H2) to the high (H6) end of the threefold range found in normal adult humans (Curcio et al. , '87b, '90). Despite the large individual variability in both the total number of central ganglion cells and in the peak density of foveal cones, our data do not allow us to determine if the cone: ganglion cell ratio at the foveal center differs among these eyes, because our consid-
C.A. CURCIO AND K.A. ALLEN
erations are based on the total number of cells, and the total number of cones within the area of variable cone density is small. Nevertheless, we noted that while the predicted displacements for a 1:2 ratio at the foveal center in the two retinas with lowest number of ganglion cells (H4 and H8) were similar to the other retinas, a constant ratio of 1:2 over 0-1 mm in these two eyes would require fibers of Henle that are more than 700-800 j.Lm long. Since these lengths are greater than any previously reported (see above), we suggest that individual eyes may differ in the extent of central retina over which a 1:2 ratio obtains. Taken with evidence from macaque that the foveal cone: ganglion cell ratio is less than unity out to somewhere between 7 and 20° (Schein, '88; Wiissle et al., '89), our data suggest that low convergence is not limited to the foveal center, and that cone spacing may be a limiting factor in resolution over a larger extent of the visual field than previously realized.
Comparison to the visual field representation in striate cortex
Our description of human ganglion cell topography may be used to address the question of whether the representation of the visual world in the primary visual cortex is scaled proportionately to the density of ganglion cells. This representation is non-uniform in that a solid degree of central retina is mapped to a much larger area of cortex than a solid degree of peripheral retina, as specified by the cortical magnification factor (CMF, mm/0
; Daniel and Whitteridge, '61). The extent to which the non-uniformity reflects strict scaling to the density of retinal cells (e.g., Woolsey et al. , '42) or expansion of the representation of central retina within the geniculostriate pathway (e.g., Malpeli and Baker, ' 75; Connolly and Van Essen, '84; Perry and Cowey, '88) has been controversial, largely because of the difficulty of determining the effective density (cells/deg2) of foveal ganglion cells. Recent studies that have accounted for the lateral displacement of ganglion cells in macaque retina have indicated that CMF is proportional to ganglion cell density throughout the visual field (Schein and De Monasterio, '87; Schein, '88; Wiissle et al. , '89). These questions are of interest because many aspects of peripheral vision that are ordinarily poor relative to central vision can be markedly improved if the angular sub tense of a peripheral stimulus is increased by a local scaling factor. It has been proposed that this scaling factor is the CMF and that increasing stimuli proportionately with CMF-1 provides stimuli of the same absolute cortical extent at different visual field locations (Rovamo et al., ' 78). Alternatively, the scaling factor may be established at the level of retinal cells. Because the bulk of experimental evidence relating visual function and CMF derives from human psychophysics, it is worth asking whether CMF is in fact proportional to the functional gradient of human ganglion cell density throughout the visual field.
A comparison of the human ganglion cell distribution with the visual field representation in macaque Vl reveals similarities that are at least consistent with this notion. First, the areal CMF in macaque ranges over three orders of magnitude with eccentricity (Hubel and Freeman, '77; Van Essen et al., '84; Schein and De Monasterio, '87 ; Tootell et al., '88), as does the functional gradient in human ganglion cell density. Second, there is a twofold range in the area of Vl across individual animals (Van Essen et al. , '84), as there is a twofold range in ganglion cell number across
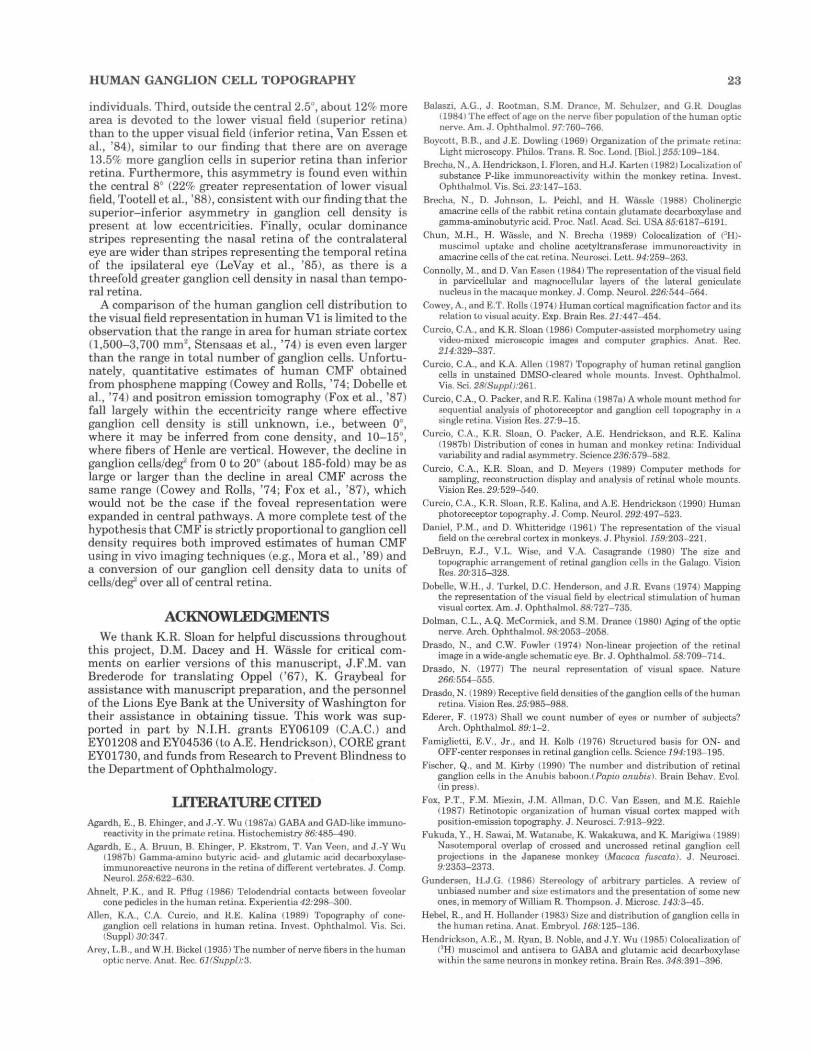
HUMAN GANGLION CELL TOPOGRAPHY
individuals. Third, outside the central2.5°, about 12% more area is devoted to the lower visual field (superior retina) than to the upper visual field (inferior retina, Van Essen et al., '84), similar to our finding that there are on average 13.5% more ganglion cells in superior retina than inferior retina. Furthermore, this asymmetry is found even within the central 8° (22% greater representation of lower visual field, Tootell et al., '88), consistent with our finding that the superior-inferior asymmetry in ganglion cell density is present at low eccentricities. Finally, ocular dominance stripes representing the nasal retina of the contralateral eye are wider than stripes representing the temporal retina of the ipsilateral eye (LeVay et al., '85), as there is a threefold greater ganglion cell density in nasal than temporal retina.
A comparison of the human ganglion cell distribution to the visual field representation in human V1 is limited to the observation that the range in area for human striate cortex (1,500-3,700 mm2
, Stensaas et al., '74) is even even larger than the range in total number of ganglion cells. Unfortunately, quantitative estimates of human CMF obtained from phosphene mapping (Cowey and Rolls, '74; Dobelle et al., '74) and positron emission tomography (Fox et al., '87) fall largely within the eccentricity range where effective ganglion cell density is still unknown, i.e., between oo, where it may be inferred from cone density, and 10-15°, where fibers of Henle are vertical. However, the decline in ganglion cells/deg2 from 0 to 20° (about 185-fold) may be as large or larger than the decline in areal CMF across the same range (Cowey and Rolls, '74; Fox et al., '87), which would not be the case if the foveal representation were expanded in central pathways. A more complete test of the hypothesis that CMF is strictly proportional to ganglion cell density requires both improved estimates of human CMF using in vivo imaging techniques (e.g., Mora et al., '89) and a conversion of our ganglion cell density data to units of cells/deg2 over all of central retina.
ACKNOWLEDGMENI'S We thank K.R. Sloan for helpful discussions throughout
this project, D.M. Dacey and H. Wassle for critical comments on earlier versions of this manuscript, J.F.M. van Brederode for translating Oppel ('67), K. Graybeal for assistance with manuscript preparation, and the personnel of the Lions Eye Bank at the University of Washington for their assistance in obtaining tissue. This work was supported in part by N.I.H. grants EY06109 (C.A.C.) and EY01208 and EY04536 (to A. E. Hendrickson), CORE grant EY01730, and funds from Research to Prevent Blindness to the Department of Ophthalmology.
LITERATURE CITED Agardh, E., B. Ehinger, and J .-Y. Wu (1987a) GABA and GAD-like immuno
reactivity in the primate re t ina. Histochemistry 86:485-490. Agardh, E., A. Bruun, B. Ehinger, P. Ekstrom, 'I'. Van Vccn, and J .-Y Wu
(1987b) Gamma-amino butyric acid- and glutamic acid decarboxylaseimmunoreactive neurons in the retina of different vertebra tes. J . Comp. Neurol. 258:622-630.
Ahnelt, P .K., and R. Pflug (1986) Telodendria! contacts between foveolar cone pedicles in the human retina. Experientia 42:298 300.
Allen, K.A., C.A. Curcio, and R.E. Kalina ( 1989) Topography of cone· ganglion cell relations in human retina. invest. Ophthalmol. Vis . Sci. <Suppl) 30:347.
Arey, L.B., and W.H. Dickel (1935) The number of nerve fibers in the human optic nerve. Anat. Rec. 61(Suppl):3.
23
Balaszi, A.G., J . Hootman, S.M. Drance, M. Schulzer , and G.R. Douglas (1984) The effect of age on the ne rve ftber popula tion of the human optic ne rve. Am. J . Ophthalmol. 97:760-766.
Boycott, B. B., and J.E. Dowling (1969) Organization of the primate retina: Light microscopy. Philos. Trans. R. Soc. Lond. [Biol.] 255:109-184.
Brccha, N., A. Hendrickson, !. Floren, and H.J . Karten 0982) Localization of substance P-like immunoreactivity within the monkey retina. Invest. Ophthalmol. Vis. Sci. 23:147-153.
Brccha, N., D. Johnson, L. Peichl, and H. Wiissle 0988) Cholinergic amacrine cells of the rabbit retina contain glutamate decarboxylase and gamma·aminobutyric acid. Proc. Natl. Acad. Sci. USA 85: 6187-6191.
Chun, M.H., H. Wiissle, and N. Br4..'cha (1989) Colocalization of ('H). muscimol uptake and choline acetyltransferase immunoreactivity in amacrine cells of the cat retina. Neu rosci. Lett. 94:259-263.
Connolly, M., and D. Van Essen (1984) The representation of the visual field in parvicellular and magnoccllular layers of the lateral geniculate nucleus in the macaque monkey. J . Comp. Neurol. 226:544-564.
Cowey, A., and E.T . Rolls (1974) Human cortical magnification factor and its relation to visual acuity. Exp. Brain Res. 21:447-454.
Curcio, C.A., and K.R. Sloan (1986) Computer-assis ted morphometry using video-mixed microscopic images and computer graphics. Anat. Rec. 214:329-337.
Curcio, C.A., and K.A. Allen (1987) Topography of human retinal ganglion cells in unstained DMSO-cleared whole mounts. Invest. Ophthalmol. Vis. Sci. 28(Suppl):261.
Curcio, C.A., 0. Packer, and R.E. Kalina (1987a) A whole mount method for sequential analysis of photoreceptor and ganglion cell topography in a s ingle retina. Vision Res. 27:9-15.
Curcio, C.A., K.R. Sloan, 0 . Packer, A.E. Hendrickson, and R.E. Kalina (1987b) Distribution of cones in human and monkey retina: Individual variability and radial asymmetry. Science 236:579- 582.
Curcio, C.A., K.R. Sloan, and D. Meyers (1989) Computer methods for sampling, reconstruction display and analys is of retinal whole mounts. Vision Res. 29:529-540.
Curcio, C.A., K.R. Sloan, R.E. Kalina, and A. E. Hendrickson (1990) Human photoreceptor topography. J . Comp. Neurol. 292:497-523.
Daniel, P.M., and D. Whitteridge (1961) The representation of the visual field on the cerebral cortex in monkeys. J . Physiol. 159:203- 221.
DeBruyn, E.J., V.L. Wise, and V.A. Casagrande (1980) The size and topographic arrangement of retinal ganglion cells in the Galago. Vis ion Res. 20:315-328.
Dobelle, W.H., J. Turkel, D.C. Henderson, and J .R. Evans (1974) Mapping the representation of the visual field by electrical stimulation of human visual cortex. Am. J. Ophthalmol. 88:727- 735.
Dolman, C.L., A.Q. McCormick, and S.M. Drance (1980) Aging of the optic nerve. Arch. Ophthalmol. 98:2053-2058.
Drasdo, N., and C.W. Fowler 0974) Non-linear projection of the retinal image in a wide-angle schematic eye. Br. J . Ophthalmol. 58:709-714.
Drasdo, N. (1977) The neural representation of visual space. Nature 266:554-555.
Drasdo, N. ( 1989) Receptive field densities of the ganglion cells of the human retina. Vision Res. 25:985-988.
Ederer, F. (1973) Shall we count number of eyes or number of subjects? Arch. Ophthalmol. 89:1-2.
Famiglietti, E.V., Jr., and H . Kolb (1976) Structured basis for ON· and OFF-center responses in retinal ganglion cells. Science 194:193-195.
Fischer, Q., and M. Kirby (1990) The number and distribution of retinal ganglion cells in the Anubis baboon.(Papio anubis ). Brain Behav. Evol. (in press).
Fox, P.T., F.M. Miezin, J.M. Allman, D.C. Van Essen, and M.E. Raichle ( 1987) Retinotopic organization of human visual cortex mapped with position-emission topography. J . Neurosci. 7:913-922.
Fukuda, Y., H. Sawai, M. Watanabe, K. Wakakuwa, and K. Marigiwa (1989) Nasotemporal overlap of crossed and uncrossed retinal ganglion cell projections in the Japanese monkey (Mocaca (uscala ). J . Neurosci. 9:2353-2373.
Gundersen, H.J.G. (1986) Stereology of arbttrary particles. A review of unbiased number and size estimators and the presentation of some new ones, in memory ofWilliam R. Thompson. J . Microsc. 143:3-45.
Hebel, R., and H. Hollander 0983) Size and distribution of ganglion cells in the human retina. Anat. Embryo!. 168:125-136.
Hendrickson, A.E., M. Ryan, B. Noble, and J .Y. Wu (1985) Colocalization of ('H) muscimol and antisera to GABA and glutamic acid decarboxylase within the same neurons in monkey retina. Brain Res. 348:391- 396.

24
Hubel, D.H., and D.C. Freeman (1977) Projoction into the visual field of ocular dominance columns in macaque monkey. Brain Res. 122:33&-343.
Hughes, A. (1975) A quantitative analysis of the cut retinal ganglion cell topography. J. Comp. Neurol. 163:107-128.
Hughes, A. (1977) The topography of vision in mammals of contrasting life style: Comparative optics and retinal organization. In F. Crescitelli (ed.): Handbook of Sensory Physiology. Vol. Vll/5: The Visual System in Vertebrates. Berlin: Springer-Verlag, pp. 613-756.
Hughes, A. (1981) Population magnitudes and distribution of the major modal classes of cat retinal ganglion cell as estimated from HRP filling and a systematic survey of the soma diameter· spectra for classicnl neurons. J. Comp. Ncurol. 197:303-339.
Hughes, A., and 0.1. Yaney (1980) Coronate cells: Displaced amacrines of the rabbit retina? J . Comp. Neuroi.189:169-J89.
Hutchins, J .B., and J.G. Hollyfield (1987) Cholinergic neurons in the human retina. Exp. Eye Res. 44:363-375.
Johnson, B.M., M. Miao, and A.A. Sadun (1987) Age-related decline of human optic nerve axon populations. Age 10:5-9.
Karschin, A., H. Wiissle, and J. Schnitzer (1986) Shape and distribution of astrocytes in the cut retina. Invest. Ophthalmol. Vis. Sci. 27:82~30.
Kolb, H., B.B. Boycott, and J.E. Dowling (1969) A socond type of midget bipolar cell in the primate retina. Appendix. Philos. Trans. R. Soc. Lond. [Bioi.] 255: 177-184.
Koontz, M.A., A. E. Hendrickson, and M.K Ryan (1989) GABA-immunoreactive synaptic plexus in the nerve fiber layer of primate retina. Visual Neurosci. 2:19-25.
Kosaka, T., M. Tauchi, and J. Dahl (1988) Cholinergic neurons containing GABA-Iike and/or GAD-like immunoreactivities in various brain regions of the rat. Exp. Brain Res. 77:605-617.
LeVay, S., M. Connolly, J. Honde, and D.C. Van Essen (1985) The complete pattern of ocular dominance stripes in the striate cortex and visual field of the macaque monkey. J. Neurosci. 5:486-501.
Leventhal, A. G., S.J. Ault, and D.J. Vitek (1988) The nasotemporal division in primate retina: The neural basis of macu Jar sparing and splitting. Science 240:66-67.
Long, K.O., and S.K. Fisher (1983) The distributions of photor(.>eeptors and ganglion cells in the California ground squirrel. J . Comp. Neurol. 221:329-340.
Malpeli, J .G., and F.H. Baker (1975) The representation of the visual field in the lateral geniculate nucleus of Macaca mulatta. J. Comp. Neurol. 161:569-594.
Mariani, A.P., and M.T. Caserta (1986) Electron microscopy of glutamate decarboxylase <GAD) immunoreactivity in the inner plexi form layer of the rhesus monkey retina. J. Neurocytol. 15:645-655.
Mariani, A.P., and L.B. Hersch ( 1988) Synaptic organization of cholinergic amacrine cells in the rhesus monkey retina. J . Comp. Neurol. 267:269-280.
Marshak, D.W. (1989) Peptidergic neurons of the macaque monkey retina. Neurosci. Res. (Suppl.) 10:5117-5130.
)dissotten, L. (1974) Estimation of the ratio of cones to neurons in the fovea of the human retina. Invest. Ophthnlmol. 13:1045-1049.
Mora, B.N., G.J. Carman, and J .M. Allman (1989) In vivo functional localization of the human visual cortex using positron emission tomography and magnetic r·esonance imaging. TINS 12:282-286.
Muller, B., and L. Peichl (1989) Topography of cones and rods in the tree shrew retina. J. Comp. Neurol. 282:581-594.
Nelson, R., E.V. Famiglietti, Jr., and H. Kolb (1978) Int racellular staining reveals different levels of stratification for ON- and OFF-center ganglion cells in cat retina. J. Neurophysiol. 41:472-483.
Nishimura, Y., M.L. Schwartz, and P. Rakic (1985) Locu.lization of gamma aminobutyric acid and glutamic acid decarboxylase in rhesus monkey retina. Brain Res. 359:351-355.
Oppel, 0. (1967) Untersuchungen uber die Verteilung und Zahl dcr retinalin Ganglinzellen beim menschen. Albrt-'Cht Graefes Arch. Klin. Exp. Ophthalmo1.172:1- 22.
~terberg, G.A. (1935) Topography of the layer of rods and cones in the human retina. Acta Ophthalmol. 6(Suppl): 1-102.
Packer, 0 ., A.E. Hendrickson and C.A. Curcio (1989) Photoreceptor topography of the adult pigtail macaque (Macaca nemestina) retina. J. Comp. Neurol. 298:4 72-494.
Perry, V.H. (1981) Evidence for an amacrine cell system in the ganglion cell layer of the rat retina. Neuroscience 6:931- 944.
C.A. CURCIO AND K.A. ALLEN
Perry, V.H. ( 1982) The ganglion cell layer of the mammalian retina. In N.N. Osborne and G.J. Chader (eds): Progress in Retinal Research, Vol. 1. Oxford: Pergamon Press, pp. 53 -80.
Perry, V.H., and A. Cowey (1985) The ganglion cell and cone distributions in the monkey's retina: Implications for central magnification factors. Vision Res. 25:1795-1810.
Perry, V.H., and A. Cowey (1988) The lengths of the fibers of Henle in the retrna of macaque monkeys: Implications for vision. Neuroscience 25:225-236.
Perry, V.H., R. Oehler, and A. Cowey (1984) Retinal ganglion cells that project to the dorsal lateral geniculate nucleus in the macaque monkey. Neuroscience 12:1101-1123.
Polyak, S.L. (1941) The Retina. Chicago: University of Chicago Press. Potts, A.M., D. Hodges, C.B. Shelman, K.J. Fritz, H.S. Levy, and Y.
Mangnall (1972) Morphology of the primate optic nerve. I. Method and total fiber count. Invest. Ophthalmol.l1:980- 1003.
Provis, J .M., D. Van Oriel, F.A. Billson, and P. Russell (1985) Development of the human retina: Patterns of cell distribution and redistribution in the ganglion cell layer. J . Comp. Neurol. 233:429-451.
Quigley, HA, G.R. Dunkelberger, and W.R. Green (1989) Retinal ganglion cell atrophy correlated with automated perimetry in human eyes with glaucoma. Am. J . Ophthalmol. 107:453-464 .
Rakic, P., and K.P. Riley (1983) Overproduction and elimination of retinal axons in the fetal rhesus monkey. Science 219:1441-1444.
Repka, M.X., and H.A. Quigley (1989) The effect of age on normal human optic nerve fiber number and diameter. Ophthalmology 96:26-3 1.
Rodieck, R.W. ( 1988) The Primate Retina. In H.D. Steklis and J. Erwin (eds): Comparative Primate Biology, Vol. 4. New York: Alan R. Liss, pp. 203-278.
Rodieck, R.W., K.F. Binmoeller, and J . Dineen (1985) Parasol and midget ganglion cells of the human retina. J. Comp. Ncurol. 233:115-132.
Rolls, E.T., and A. Cowey ( 1970) Topography of the retina and striate cortex and ita relationship to visual acuity in rhesus monkeys and squirrel monkeys. Exp. Brain Res. 10:298-310.
Rovamo, J ., and V. Virsu, and R. Niisiinen (1978) Cortical magnification factor predicts the photopic sensit ivity of peripheral vision. Nature 271:54-56.
Sager, S.M., and P.E. Marshall (1988) Somatostatin-like immunoreactive material in ussociational ganglion cells of human retina. Neuroscience 27:507-516.
Schein, S.J . (1988) Anatomy of macaque fovea and spatial densities of neurons in foveal representation. J. Comp. Neurol. 269:479-505.
Schein, S.J ., and F.M. De Monasterio (1987) Mapping of retinal and geniculate neurons onto striate cortex of macaque. J. Neurosci . 7:99&-1009.
Schnitzer, J. (1985) Distribution and immunoreactivity of glia in the retina of the rabbit. J. Comp. Neurol. 240:128-142.
Schnitzer, J . (1989) Enzyme-histochemicnl demonstration of microglial cells in the adult and postnatal rabbit retina. J. Comp. Neurol. 282:249-263.
Silveira, L.C.L., C.W. Picuno-Diaz, L.F.S. Sampaio, and E. Oswald-Cruz (1989) Retinal ganglion cell distribution in the cebus monkey: A comparison with the corticnl magnification factor. Vision Res. 29:14 71-1483.
Steinberg, R.H., M. Reid, and P.L. Lacy (1973) The distribution of rods and cones in the retina of the cat (Felis domesticus ). J . Comp. Ncurol. 148:229-248.
Stcnsaas, S.S., O.K. Eddington, and W.H. Dobelle (1974) The topography and variability of the primary visual cortex in man. J. Neu rosurg. 40:741-155.
Stone, J. (1978) The number and distribution of g-anglion cells in the eat's retina. J . Comp. Neurol.180:753-772.
Stone, J., and E. Johnston (1981) The topography of primate retina: A study of the human, bush baby, and New- and Old-World monkeys. J. Comp. Neurol. 196:205-224.
Stone, R.A., A.M. Laties, E. Raviola, and T.N. Wiesel (1988) Increase in retinal vasoactive intestinal polypeptide after eyelid fusion in primates. Proc. Natl. Acad. Sci. USA85:257-260.
Thibos, L.N., l<'.E. Cheney, and D.J. Walsh (1987) Vision beyond the resolution limit: Aliasing in the periphery. Vision Res. 27:2193-2197.
'I'ootell, R.B.ll., E. Switkes, M.S. Silverman, and S.L. Hamilton (1988) Functional anatomy of macaque striate cortex. II. Retinotopic organization. J. Neurosci. 8:1531-1568.
Tornqvist, K , and B. Ehinger 0988) Peptide immunoreactive neurons in the human retina. Invest. Ophthalmol. Vis. Sci. 29:680-686.
Van Buren, A. (1963) The retinal ganglion cell layer. Springfield: Thomas. Van Essen, D.C., W.T. Newsome, and J.H.R. Maunsell (1984) The visual
HUMAN GANGLION CELL TOPOGRAPHY
field representation in striate cortex of the macaque monkey: Asymme· tries, anisotropies and individual variability. Vision Res. 24:429-448.
Yaney, 0.1. (1980) A quantitative comparison between the ganglion cell populations and axonal outflows of the visual streak and periphery of the rabbit retina. J . Comp. Neural. 189:215-233.
Yaney, 0.1., and H.M. Young (1988) GABA-like immunoreactivity in cholinergic amacrine cells of the rabbit. Brain Res. 428:369--373.
Vilter, V. (1954} Asymetrie cyto-architectonique de Ia Fovea retinienne de l'homme. C.R. Soc. Bio1.148:22()-223.
Wiissle, H., M.H. Chun, and F. Muller (1987) Amacr ine cells in the ganglion cell layer of the cat retina. J . Comp. Neurol. 265:391-408.
Wiissle, H., U. Grunert, J . Rohrenbcck, and B.B. Boycott (1989) Cortical magnification factor and the ganglion cell density in the primate retina. Nature 341:643-646.
Watanabe, M., and R.W. Rodieck ( 1989) Parasol and midget ganglion cells of the primate retina. J. Comp. Neural. 289:434-454.
Webb, S.V., and J .H. Kaas ( 1976) The sizes and distribution of ganglion cells
25
in the retina of the owl monkey, Aotus triuirgatus. Vision Res . 16:1247-1254.
Wertheim, T. (1980} Peripheral visual acuity. (I.L. Ounsky, trans!.) Am. J. Optom. 57:915-934.
Weymouth, F. (1958) Visual sensory units and the minimal angle of resolution. Am. J. Ophthalmol. 46:102-113.
Wong, R.O.L., and A. Hughes (1987) The morphology, number, and distribution of a large population of confirmed displaced amacrine cells in the cat retina. J . Comp. Neural. 255:159-177.
Woolsey, C.N., W.H. Marshall, and P. Bard (1942) Representation of cutaneous tactile sensibility in the cerebral cortex of the monkey as indicated by evoked potentials. Bull. Johns Hopkins Hosp. 70:399-441.
Yamada, E. (1969) Some structural features of the fovea centralis of the human retina. Arch. Ophthalmol. 82:151-159.
Yuodelis, C., and A.E. Hendrickson (1986) A qualitative and quantitative analysis of the human fovea during development. Vision Res. 26:847-856.