Embed Size (px)
Citation preview
Plant and Soil 238: 79–90, 2002.© 2002 Kluwer Academic Publishers. Printed in the Netherlands.
79
Topographic position affects the water regime in a semideciduous tropicalforest in Panama
Matthew I. Daws1,4, Christopher E. Mullins1, David F.R.P. Burslem1, Steven R. Paton2 & JamesW. Dalling3
1Department of Plant and Soil Science, University of Aberdeen, St Machar Drive, Aberdeen, AB24 3UU, UK.2Smithsonian Tropical Research Institute, Apartado 2072, Balboa, Republic of Panama. 3Department of Plant Bio-logy, University of Illinois, 149 Morril Hall, 505 S Goodwin Avenue, Urbana, Illinois 61801, USA. 4Correspondingauthor∗
Received 22 February 2001. Accepted in revised form 17 September 2001
Key words: matric potential, niche specialisation, water balance, water regime
Abstract
The effects of topographic position on water regime in a semideciduous tropical forest on Barro Colorado Island inPanamá were assessed by measuring soil matric potential using the filter paper technique and by using measuredsoil water release characteristics to convert a long-term (20 years) gravimetric water content data-set to matricpotential. These were also compared against predictions from a simple water balance model. Soil matric potentialson slope sites were significantly higher than on plateau sites throughout the measurement interval and slopesexperienced a shorter duration of drought during the annual dry-season. Measured values of matric potential agreedwith those predicted from converting the gravimetric measurements using water release characteristics. Annualduration of drought predicted by the simple water balance model agreed with values determined from the convertedlong term water content data-set and was able to predict the annual duration of drought on plateau sites. On slopesites, the water balance systematically and significantly overestimated the duration of drought obtained from thewater content data-set, suggesting that slope sites were supplied with water from upslope. Predictions of annualdrought duration from sites with higher annual rainfall than Barro Colorado Island (BCI), suggest that while plateausites on BCI experience a water regime consistent with annual rainfall, slopes experience a water regime moresimilar to that of forests with much higher rainfall. We conclude that such large variations in water regime oversmall spatial scales may play a role in maintaining high species richness through providing opportunities for nichespecialisation and by buffering slopes against possible climate change.
Introduction
The mechanisms maintaining the high species richnessof tropical forests are subject to debate. Predictionsfrom resource-based competition theory suggest thatstable co-existence between species depends on eachbeing a superior competitor within its own niche (Wil-liamson, 1957). However, all plants require the sameresources and acquire them in a limited number ofways, so species are not usually tightly grouped withinsharply defined niches (Grubb, 1977; Mahdi et al.,
∗ FAX No: +1224-27-2763. E-mail: [email protected]
1989; Tilman, 1984). Although it might be expec-ted that a few species would out-compete all others,this does not usually occur. A number of theoreticalsolutions have been proposed to explain the main-tenance of high species richness. Several of theseinvoke some degree of niche differentiation within aheterogeneous environment as necessary for speciesco-existence (Ashton, 1969; Denslow, 1980; Tilman,1982).
Many of the hypotheses involving niche differenti-ation focus on the light environment and its variabilitybetween sites, particularly with reference to gap dy-namics (Denslow, 1980; Ricklefs, 1977). The light
80
environment of intact forests and canopy gaps hasbeen quantified at a number of sites (Chazdon andFetcher, 1984; Chazdon, 1988). Studies with bothtemperate and tropical tree seedlings have demon-strated a range of seedling responses to irradiance(Augspurger, 1984; Brokaw and Scheiner, 1989; Can-ham et al., 1999; Kobe, 1999) and this partitioningof available resources is hypothesised to contributeto species coexistence. However, with the exceptionof light conditions, the spatial and temporal variationin available resources within tropical forests has beenpoorly studied (Bazzaz, 1984).
Within both temperate and tropical forests, numer-ous studies have observed an effect of topography onthe distribution of plants (for example Basnet, 1992;Harms, 1997; Hubbell and Foster, 1986). Despite theexistence of distinct vegetation patterns that relate totopography, few studies have measured variation inthe availability of resources that might cause these pat-terns. Hydrological models based on water movementin uniform soil slabs predict that, after drainage, thewater content of soil on a slope is greatest at the baseand becomes progressively less towards the top. Soilmoisture deficits are thus smallest at the slope basewhere further rainfall will rewet the soil most quickly.This will then be maintained by through-flow fromupslope (Hewlett and Hibbert, 1963; Knapp, 1978).While these models imply that slopes will be wet-ter than plateau sites, this has not been consistentlydemonstrated; published studies have indicated thatslopes may be wetter, drier or no different to plateausites (Becker et al., 1988; Helvey, 1971; Werling andTajchman, 1983, 1984; Young and Young, 1983).
In regional scale studies, differences in the soilwater regime between wet evergreen and moist semi-deciduous tropical forest in Ghana (Veenendaal et al.,1996) have been related to variation in plant speciescomposition (Hall and Swaine, 1976). Furthermore,the relationship between plant biodiversity and rainfallin the tropics is well known (Wright, 1992). How-ever, with the exception of Becker et al., (1988) nostudies in intact tropical forests have measured soilwater availability at the scale of local topographicdifferences that might be important in producing thedistributions of plant species that are commonly ob-served.
Becker et al. (1988) measured soil water potentialwithin the semi-deciduous forest of Barro ColoradoIsland (BCI), Panamá, on the gentle slopes and theneighbouring high plateau of a 50 ha forest dynam-ics plot (Hubbell and Foster, 1983). They found that
higher soil water potentials were maintained on slopesites compared to the plateau during the dry seasonand that this was related to observed differences in leafwater potential. This study drew attention to the issueof topographically induced differences in soil wateravailability, but used soil psychrometers with an ac-curacy of only ± 50 kPa (Mullins, 2000) and failedto provide any statistical backing for its conclusions.Thus, the work of Becker et al. (1988) points to thelikely existence of topographic differences and to theireffect on vegetation, but requires further support.
The objectives of this study were therefore to testfor topographically induced patterns of water availab-ility, in the semi-deciduous tropical forest of BCI. Inorder to extend the information obtained from a shortdatabase of detailed measurements of soil matric po-tential back over a number of years, we have also triedtwo different approaches. Firstly, we have used an ex-isting long-term data set of measurements of soil watercontent and converted these to matric potentials usingmeasured soil water release characteristics. Secondly,we have compared these results against predictionsbased on a simple soil water balance model that usesrainfall and an estimate of evapo-transpiration. Finally,we have tried to compare the relative importance forplants of differences in soil water regime caused bytopographic differences with those caused by regionaldifferences in rainfall for plants in Panamá.
Methods
Study site
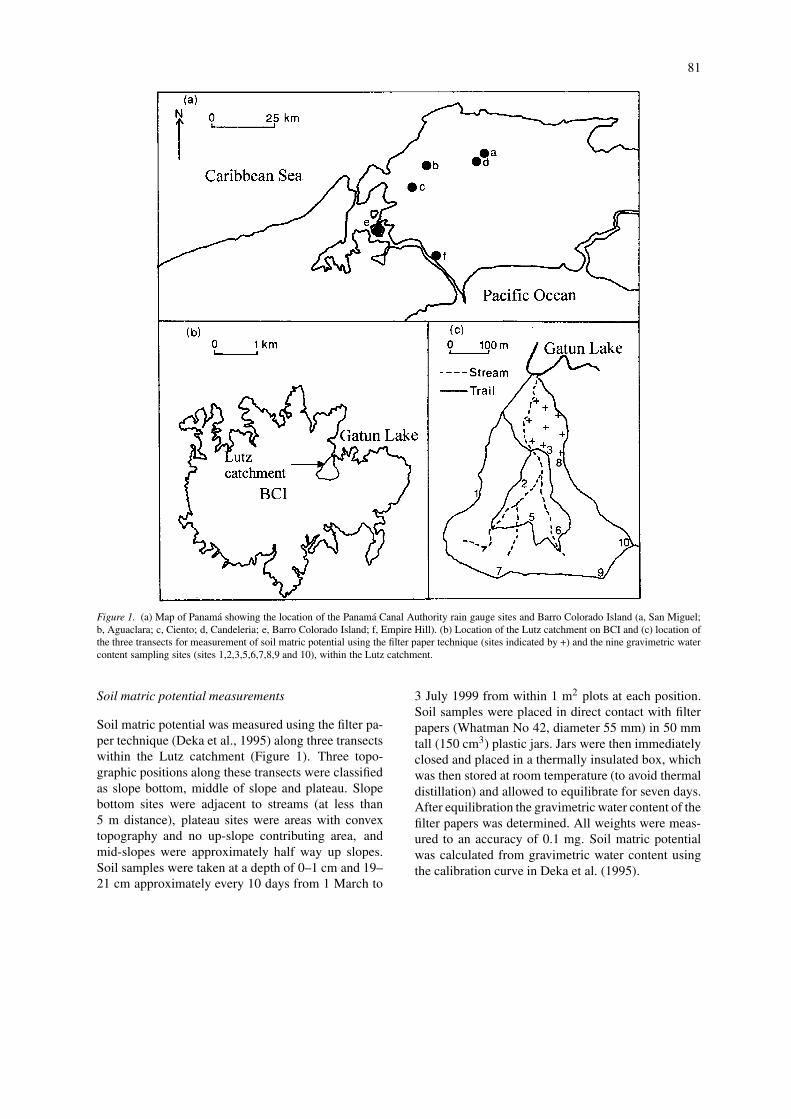
The study was conducted in the semi-deciduous foreston Barro Colorado Island (BCI), Republic of Panamá(9 ◦10′ N, 79 ◦51′ W), which is described in detailelsewhere (Leigh et al., 1982). Rainfall on BCI av-erages 2600 mm/yr, with a pronounced dry seasonbetween January and April (Dietrich et al., 1982). TheLutz catchment, which is located in the east of theisland (Figure 1), close to the laboratory clearing, wasused for this study. The entire catchment is forestedand its soils have been classified as alfisols (Yavittand Wieder, 1988) and are usually less than 500 mmdeep (Dietrich et al., 1982). The island was declareda reserve in 1923 and its vegetation has been littledisturbed since the late nineteenth century, when theFrench attempted to build a canal (Leigh, 1999).
81
Figure 1. (a) Map of Panama showing the location of the Panama Canal Authority rain gauge sites and Barro Colorado Island (a, San Miguel;b, Aguaclara; c, Ciento; d, Candeleria; e, Barro Colorado Island; f, Empire Hill). (b) Location of the Lutz catchment on BCI and (c) location ofthe three transects for measurement of soil matric potential using the filter paper technique (sites indicated by +) and the nine gravimetric watercontent sampling sites (sites 1,2,3,5,6,7,8,9 and 10), within the Lutz catchment.
Soil matric potential measurements
Soil matric potential was measured using the filter pa-per technique (Deka et al., 1995) along three transectswithin the Lutz catchment (Figure 1). Three topo-graphic positions along these transects were classifiedas slope bottom, middle of slope and plateau. Slopebottom sites were adjacent to streams (at less than5 m distance), plateau sites were areas with convextopography and no up-slope contributing area, andmid-slopes were approximately half way up slopes.Soil samples were taken at a depth of 0–1 cm and 19–21 cm approximately every 10 days from 1 March to
3 July 1999 from within 1 m2 plots at each position.Soil samples were placed in direct contact with filterpapers (Whatman No 42, diameter 55 mm) in 50 mmtall (150 cm3) plastic jars. Jars were then immediatelyclosed and placed in a thermally insulated box, whichwas then stored at room temperature (to avoid thermaldistillation) and allowed to equilibrate for seven days.After equilibration the gravimetric water content of thefilter papers was determined. All weights were meas-ured to an accuracy of 0.1 mg. Soil matric potentialwas calculated from gravimetric water content usingthe calibration curve in Deka et al. (1995).
82
Gravimetric water content determination
Soil gravimetric water content has been determinedat one or two week intervals since 1981. Using an‘Oakfield punch’, 2.5 cm diameter soil cores were col-lected from depths of 0–10 cm and 30–40 cm at eachof 10 locations (Figure 1) within the Lutz catchment(Windsor, 1990). Samples were sealed in pre-weighedmetals canisters, transported to the laboratories onBCI, weighed, dried to constant mass and reweighedto determine gravimetric soil water content. Data fromnine of these ten locations (site 4 was too stony) werethen used as a basis for calculating matric potentialusing water release curves. For comparison with thematric potential measurements that were taken at plat-eau, mid- and bottom-slope sites the nine sites weredivided into two categories; slope (sites 2, 3, 5, 6 and7) and plateau (sites 1, 8, 9 and 10). Sites with concavetopography and an up-slope contributing area weredesignated as slopes, sites with no up-slope contrib-uting area and convex topography as plateau. The fiveslope sites were generally located at a position on theslopes that was intermediate between the bottom- andmid-slopes sites used for filter paper measurements.Additionally all five sites were approximately 100 mfrom the top of the slopes.
Water release curves
Undisturbed soil cores (4 cm×5.64 cm diameter) werecollected from soil depths of 3–7 and 33–37 cm bypushing metal rings with sharpened edges into thesoil. The cores were dug out with a trowel, trimmed,fitted with caps at both ends and sealed with tape.Three cores and approximately 100 g of loose soilwere sampled from each depth at each of the ninegravimetric water content sampling sites. The coreswere saturated and then a tension table was used todetermine water retention at matric potentials of −1,−5 and −16 kPa (Townend et al., 2000). Water reten-tion at −100 and −1500 kPa (the permanent wiltingpoint) was determined using a pressure plate apparatus(Townend et al., 2000).
Water balance calculations
Soil water deficit (Wd) is the amount of rainfall re-quired to return a soil profile to field capacity (Mar-shall et al., 1996) and provides a simple estimate ofthe limitation imposed on plant water uptake as a res-ult of drought. It is calculated by assuming the soil
profile is at field capacity following heavy rains andthen repeatedly applying the following formula:
Wd(tn+1) = Wd(tn) − P(tn+1) + E (1)
Wd(tn) and Wd(tn+1) refer to the water deficit onday n and n + 1, respectively, P is precipitation and Epotential evapo-transpiration. When the deficit takes apositive value we have assumed that drainage wouldhave occurred and reset it to zero. This model rep-resents a very basic approach that does not allow forany possible by-passing that could result in drainagefrom a profile that was under deficit and assumes thatprofiles are freely draining. When the available waterwithin a profile is fully exhausted, it is impossible forplants to extract further water. Thus a maximum limitwas set to Wd in Equation (1) and Wd values greaterthan this were reset to this limiting profile avail-able water capacity (Zawc). Precipitation on BCI wasmeasured with a rain gauge situated within the laborat-ory clearing. Potential evapo-transpiration at the Lutzcatchment was estimated using an ETgage Model A(ETgage Company, Loveland, USA), situated at thetop of a canopy tower. Potential evapo-transpirationdata were only available for the 5 year period, 1994–1999. Therefore, to enable longer-term calculationsof soil water deficit, mean monthly potential evapo-transpiration over the 5-year period was used for timeintervals outside the data range. Drought was definedas the period of time during which Wd was equal toZawc. Zawc was estimated by plotting soil water deficit(calculated during periods when the profile was dryingfrom near field capacity) versus measured values ofgravimetric water content at 30–40 cm. It was assumedthat, when the soil had reached the water content at thepermanent wilting point (determined from the laborat-ory water release characteristics), that the whole pro-file had no remaining water. Consequently Wd at thispoint was taken to be equal to Zawc. Modelling profiledrying in this way is subject to a number of possiblelimitations. In particular, actual evapo-transpirationwill decline as the forest is stressed, whereas we haveassumed that it continues at the potential rate untilthe whole profile reaches wilting point. Additionally,the ETgage can only be expected to give a crude es-timate of potential evapo-transpiration that may havesystematic error.
Duration of drought at other locations
BCI lies at the midpoint of a rainfall gradient betweenthe tropical deciduous dry forests of the Pacific shore,
83
with an annual rainfall of 1800 mm, and the ever-green wet tropical forests of the Caribbean coast, withan annual rainfall of over 3000 mm (Windsor, 1990).Rainfall data from several sites across the isthmus ofPanamá (Figure 1) was supplied by the Panamá CanalAuthority and used to compare the estimated durationof drought at sites with differing annual rainfall usingthe water balance method previously described. In thewater balance calculation, it was both assumed thatZawc and evapo-transpiration at all of the geographic-ally separated sites, were the same as at BCI. Whilstthese assumptions are not necessarily true and canonly be rough approximations, they were consideredadequate for a comparison between magnitude, andhence importance, of local variations in water regimedue to topography and differences in water regimeoccurring over a large area due to differences inrainfall.
Statistical methods
Soil matric potentials measured by the filter papertechnique were log-transformed prior to RepeatedMeasures Analysis of Variance (ANOVA) conductedusing SPSS version 9.0. This was used to test for theeffects of season, soil depth and topographic positionon soil matric potential.
The curve fitting function in Sigmaplot 5 was usedto fit second order polynomials to the water releasecurves. As these curves were used to predict soil mat-ric potential (x) from gravimetric water content (y)the data was regressed y on x for curve fitting. Theequations of these curves were then used to convert thelong-term gravimetric water content data set to matricpotential. The resulting plots of soil matric potentialagainst time were used to calculate the annual severityof drought (defined as the duration when there was asoil matric potential below wilting point, −1500 kPa)at each of the nine sites. Water release curves can beconveniently modelled as a straight line relationshipbetween log (volumetric water content) and log (mat-ric suction) for a wide range of matric suctions (Feltonand Nieber, 1991). To compare water release charac-teristics of soils from different sites, straight lines werefitted to the log-log plots and tested for differencesusing linear regression.
Repeated Measures ANOVA on log transformeddata was also used to make a comparison between soilmatric potential measured using the filter paper tech-nique and that calculated from the gravimetric watercontent data set. The filter paper data revealed that
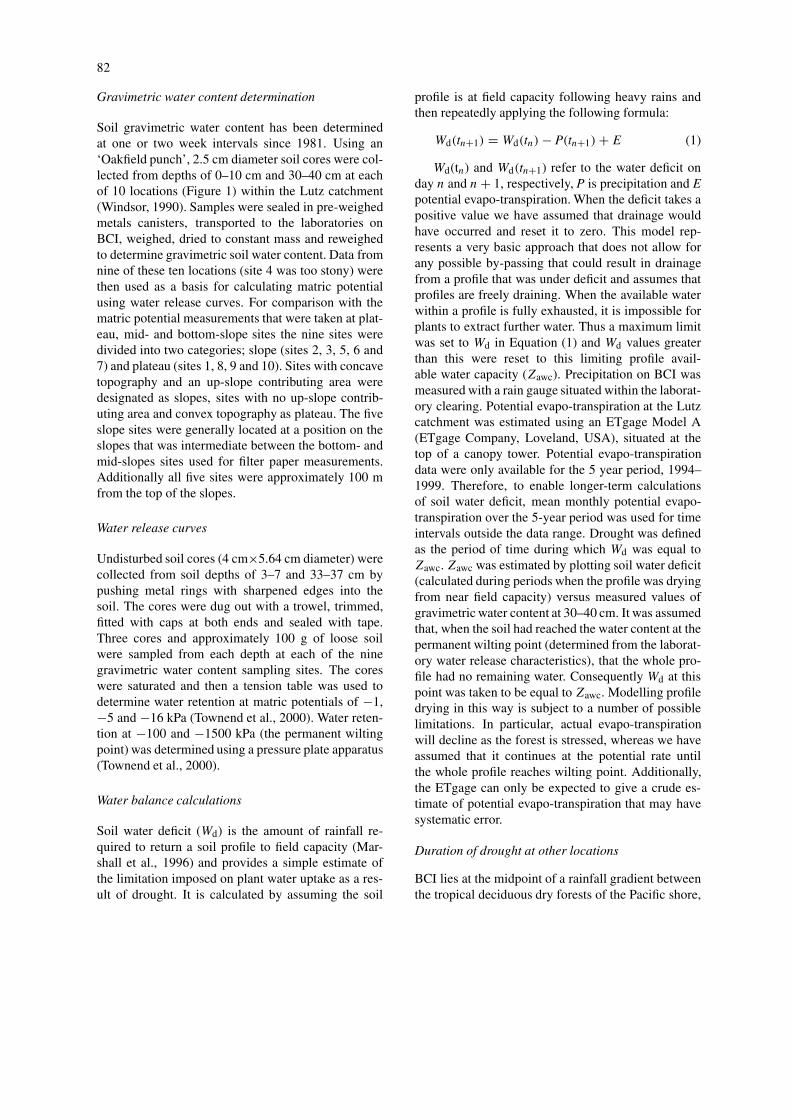
Figure 2. (a). The effect of season, topography (slope bottom,circles; mid slope, squares; and plateau, triangles) and soil depthon soil matric potential measured using the filter paper techniquebetween 1 March (day 60) and 3 July (day 184) 1999 at a depth of0–1 cm and (b) at a depth of 19–21 cm, n = 3. Error bars are ±1 standard error and when not shown are smaller than the symbol.Time periods marked by an asterisk indicate a significant differencein soil matric potential between all three topographic positions. (c).Daily rainfall between 1 March and 3 July 1999.
slope position had a pronounced effect on matric po-tential. However, since the wetness of a slope is likelyto be affected by the size of the area contributing drain-age and because it was not clear that the slope sitesused for matric potential measurements and gravimet-ric water content determination had the same upslopecontributing area, only plateau sites were compareddirectly. Since measurements of soil matric potentialand gravimetric water content were not made on thesame days, matric potentials from the long-term dataset were interpolated to enable a direct comparison tobe made.
The slopes of regression lines were compared tonull lines with a slope of one or zero using a t-test.Tests for equality of slopes of two regression lineswere carried out using the F-test.
84
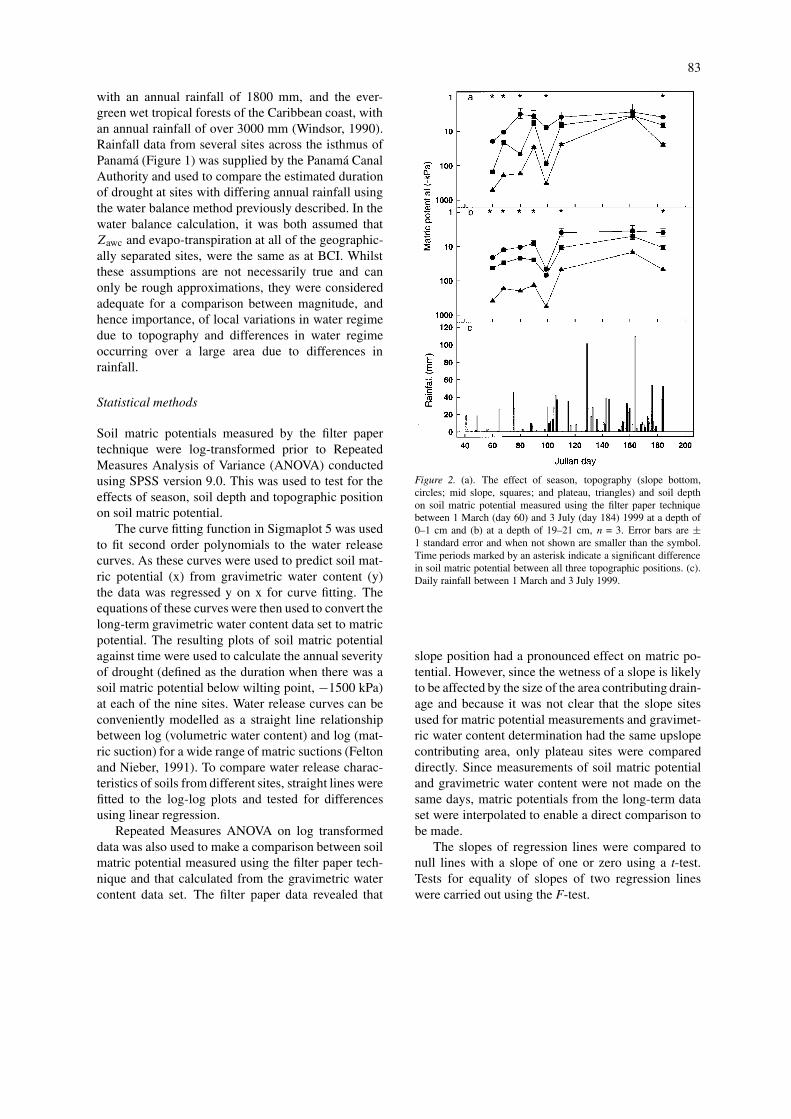
Figure 3. Average soil water release characteristics for slope(circles) and plateau (triangles) sites at 0–10 (closed symbols) and30–40 cm (open symbols). Error bars are ± 1 standard error andwhen not shown are smaller than the symbol.
Results
Soil matric potential measurements
Filter paper measurements of soil matric potentialcommenced during the dry-season, by which time soilmatric potential had already fallen to approximately−500 kPa at a depth of 20 cm on the plateau sites (Fig-ure 2). During the remainder of the dry-season, matricpotential fluctuated according to occasional rainfallevents. During the dry to wet-season transition inmid April–early May (approximately days 100–125),matric potential increased to field capacity with theincreasing probability and amounts of daily rainfall.Throughout the period of measurement, there was ahighly significant effect of topographic position on soilmatric potential (Repeated Measures ANOVA, F =26.2, P < 0.01) and plateau sites were almost alwaysdrier than slope sites. The matric potential at the bot-tom of slopes was only once less than −25 kPa, whilstthe matric potential on plateau sites fell as low as −550kPa.
Gravimetric water content (GWC) data set
For all nine sites and both soil depths, soil water re-lease characteristics could be described using secondorder polynomials (in all cases r2 > 0.89, P < 0.05).Straight lines fitted to log-log data (r2 > 0.90, P <
0.05) to test for differences in slope and intercept re-vealed no significant differences either between sitesor soil depths (P > 0.05; Fig. 3).
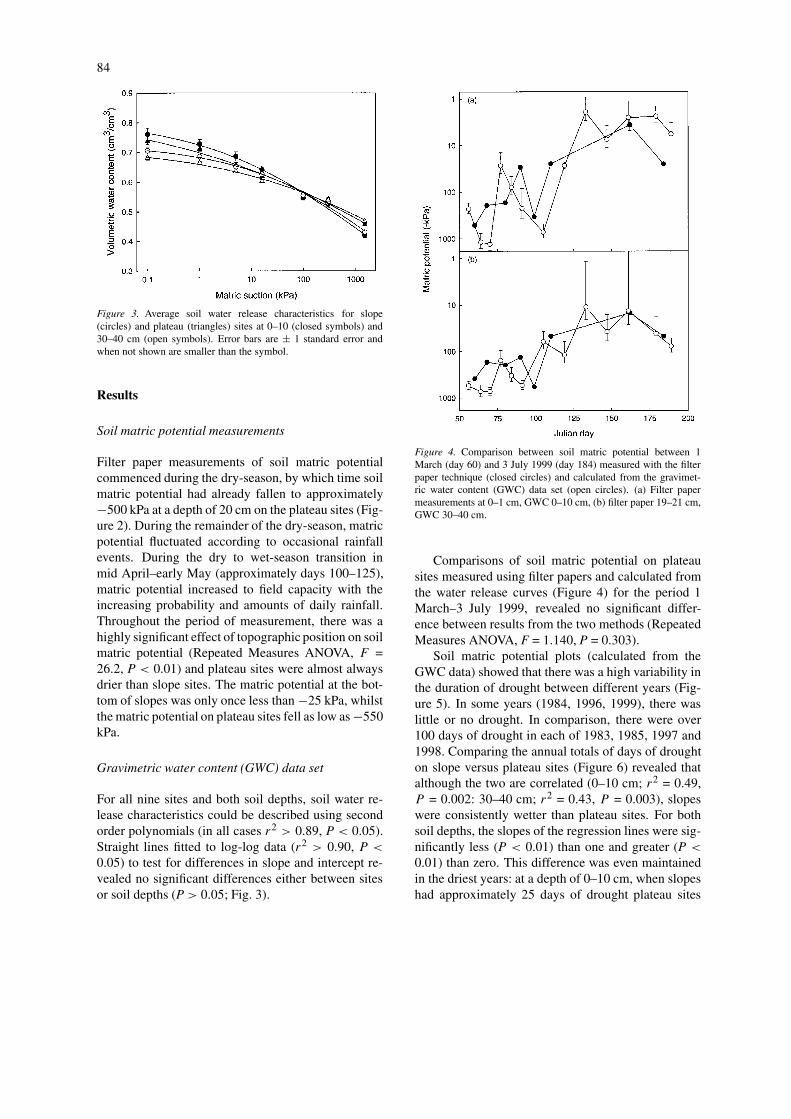
Figure 4. Comparison between soil matric potential between 1March (day 60) and 3 July 1999 (day 184) measured with the filterpaper technique (closed circles) and calculated from the gravimet-ric water content (GWC) data set (open circles). (a) Filter papermeasurements at 0–1 cm, GWC 0–10 cm, (b) filter paper 19–21 cm,GWC 30–40 cm.
Comparisons of soil matric potential on plateausites measured using filter papers and calculated fromthe water release curves (Figure 4) for the period 1March–3 July 1999, revealed no significant differ-ence between results from the two methods (RepeatedMeasures ANOVA, F = 1.140, P = 0.303).
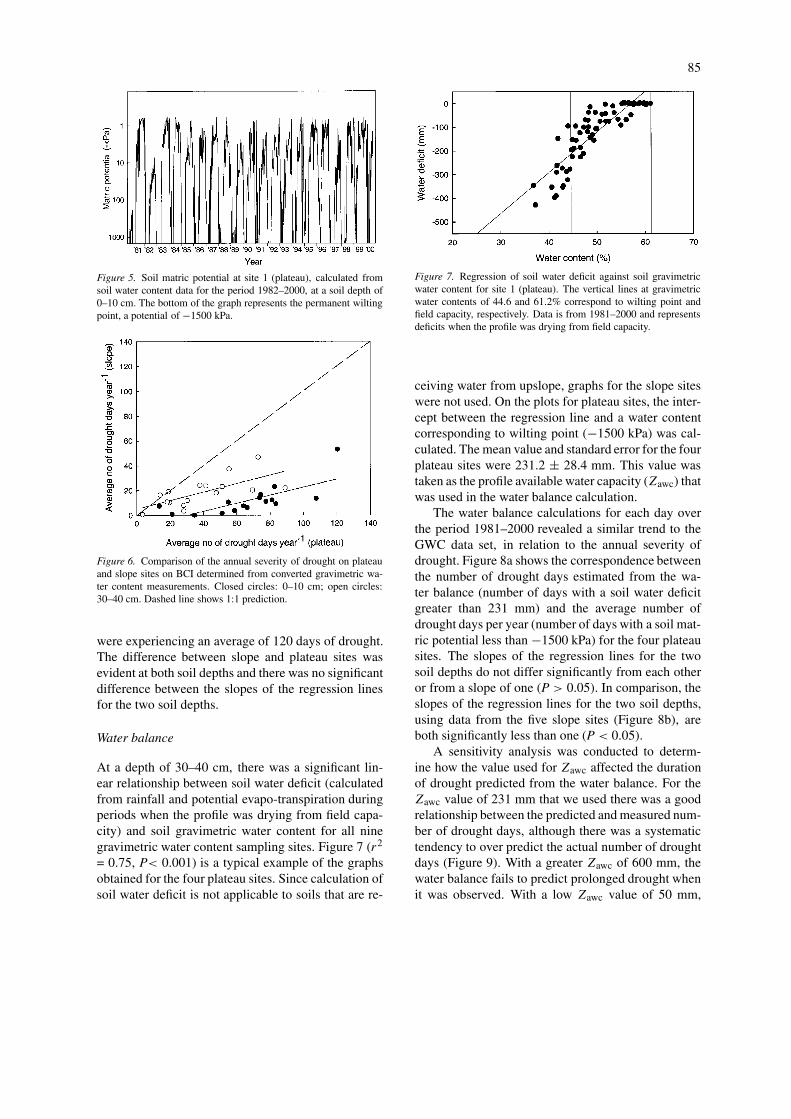
Soil matric potential plots (calculated from theGWC data) showed that there was a high variability inthe duration of drought between different years (Fig-ure 5). In some years (1984, 1996, 1999), there waslittle or no drought. In comparison, there were over100 days of drought in each of 1983, 1985, 1997 and1998. Comparing the annual totals of days of droughton slope versus plateau sites (Figure 6) revealed thatalthough the two are correlated (0–10 cm; r2 = 0.49,P = 0.002: 30–40 cm; r2 = 0.43, P = 0.003), slopeswere consistently wetter than plateau sites. For bothsoil depths, the slopes of the regression lines were sig-nificantly less (P < 0.01) than one and greater (P <
0.01) than zero. This difference was even maintainedin the driest years: at a depth of 0–10 cm, when slopeshad approximately 25 days of drought plateau sites
85
Figure 5. Soil matric potential at site 1 (plateau), calculated fromsoil water content data for the period 1982–2000, at a soil depth of0–10 cm. The bottom of the graph represents the permanent wiltingpoint, a potential of −1500 kPa.
Figure 6. Comparison of the annual severity of drought on plateauand slope sites on BCI determined from converted gravimetric wa-ter content measurements. Closed circles: 0–10 cm; open circles:30–40 cm. Dashed line shows 1:1 prediction.
were experiencing an average of 120 days of drought.The difference between slope and plateau sites wasevident at both soil depths and there was no significantdifference between the slopes of the regression linesfor the two soil depths.
Water balance
At a depth of 30–40 cm, there was a significant lin-ear relationship between soil water deficit (calculatedfrom rainfall and potential evapo-transpiration duringperiods when the profile was drying from field capa-city) and soil gravimetric water content for all ninegravimetric water content sampling sites. Figure 7 (r2
= 0.75, P< 0.001) is a typical example of the graphsobtained for the four plateau sites. Since calculation ofsoil water deficit is not applicable to soils that are re-
Figure 7. Regression of soil water deficit against soil gravimetricwater content for site 1 (plateau). The vertical lines at gravimetricwater contents of 44.6 and 61.2% correspond to wilting point andfield capacity, respectively. Data is from 1981–2000 and representsdeficits when the profile was drying from field capacity.
ceiving water from upslope, graphs for the slope siteswere not used. On the plots for plateau sites, the inter-cept between the regression line and a water contentcorresponding to wilting point (−1500 kPa) was cal-culated. The mean value and standard error for the fourplateau sites were 231.2 ± 28.4 mm. This value wastaken as the profile available water capacity (Zawc) thatwas used in the water balance calculation.
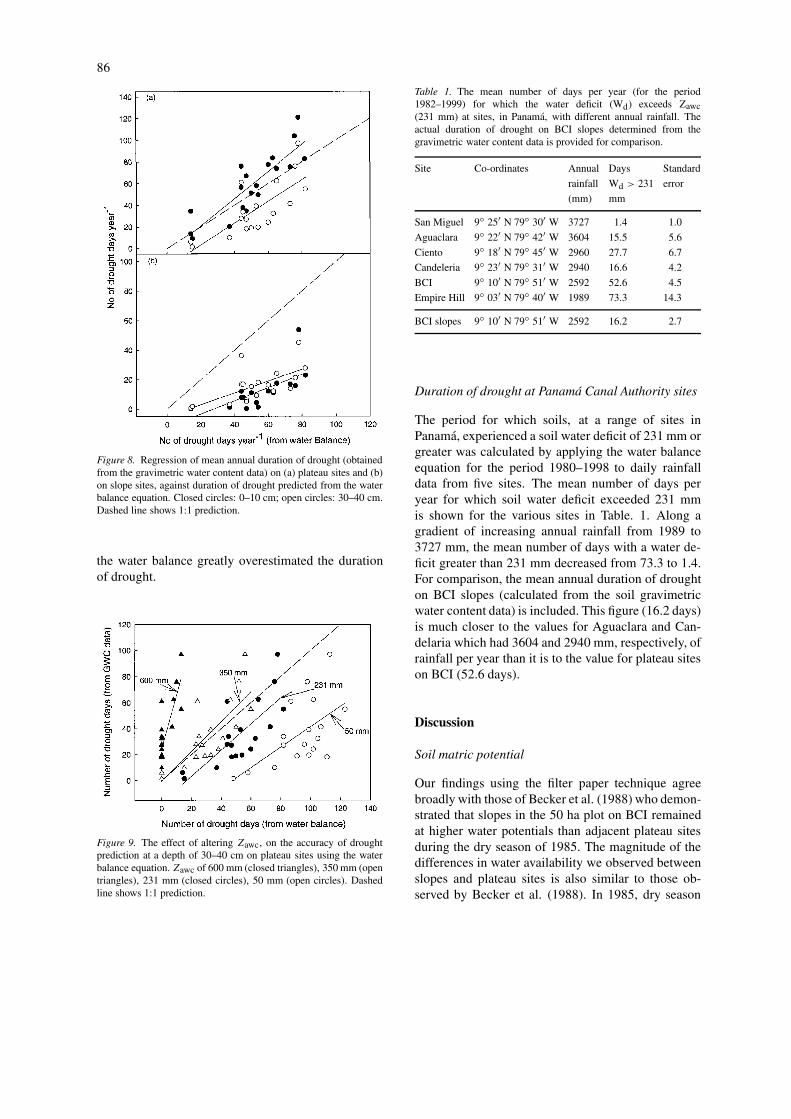
The water balance calculations for each day overthe period 1981–2000 revealed a similar trend to theGWC data set, in relation to the annual severity ofdrought. Figure 8a shows the correspondence betweenthe number of drought days estimated from the wa-ter balance (number of days with a soil water deficitgreater than 231 mm) and the average number ofdrought days per year (number of days with a soil mat-ric potential less than −1500 kPa) for the four plateausites. The slopes of the regression lines for the twosoil depths do not differ significantly from each otheror from a slope of one (P > 0.05). In comparison, theslopes of the regression lines for the two soil depths,using data from the five slope sites (Figure 8b), areboth significantly less than one (P < 0.05).
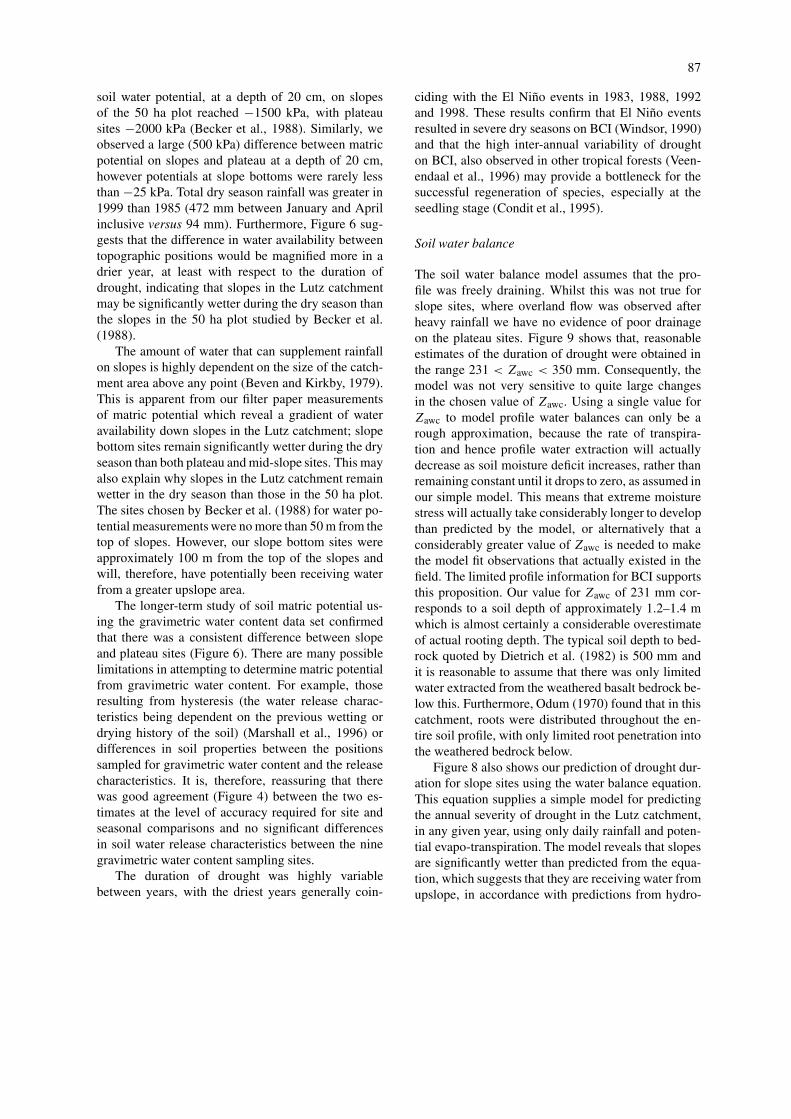
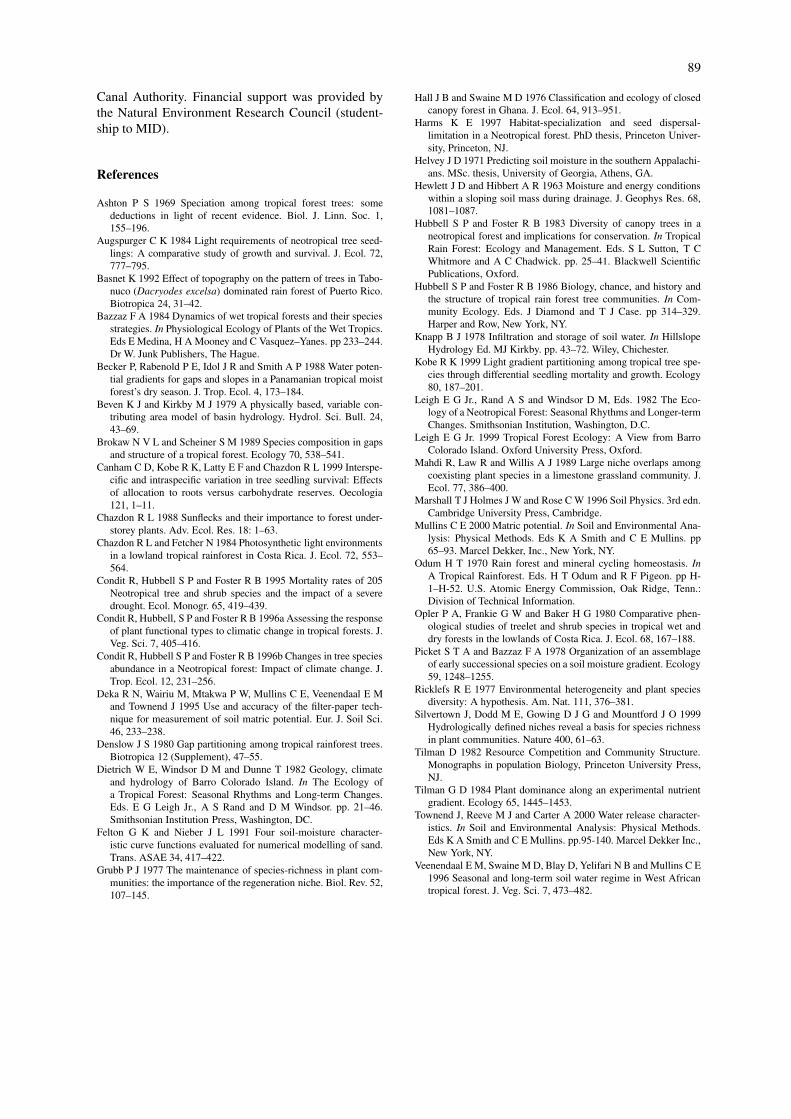
A sensitivity analysis was conducted to determ-ine how the value used for Zawc affected the durationof drought predicted from the water balance. For theZawc value of 231 mm that we used there was a goodrelationship between the predicted and measured num-ber of drought days, although there was a systematictendency to over predict the actual number of droughtdays (Figure 9). With a greater Zawc of 600 mm, thewater balance fails to predict prolonged drought whenit was observed. With a low Zawc value of 50 mm,
86
Figure 8. Regression of mean annual duration of drought (obtainedfrom the gravimetric water content data) on (a) plateau sites and (b)on slope sites, against duration of drought predicted from the waterbalance equation. Closed circles: 0–10 cm; open circles: 30–40 cm.Dashed line shows 1:1 prediction.
the water balance greatly overestimated the durationof drought.
Figure 9. The effect of altering Zawc, on the accuracy of droughtprediction at a depth of 30–40 cm on plateau sites using the waterbalance equation. Zawc of 600 mm (closed triangles), 350 mm (opentriangles), 231 mm (closed circles), 50 mm (open circles). Dashedline shows 1:1 prediction.
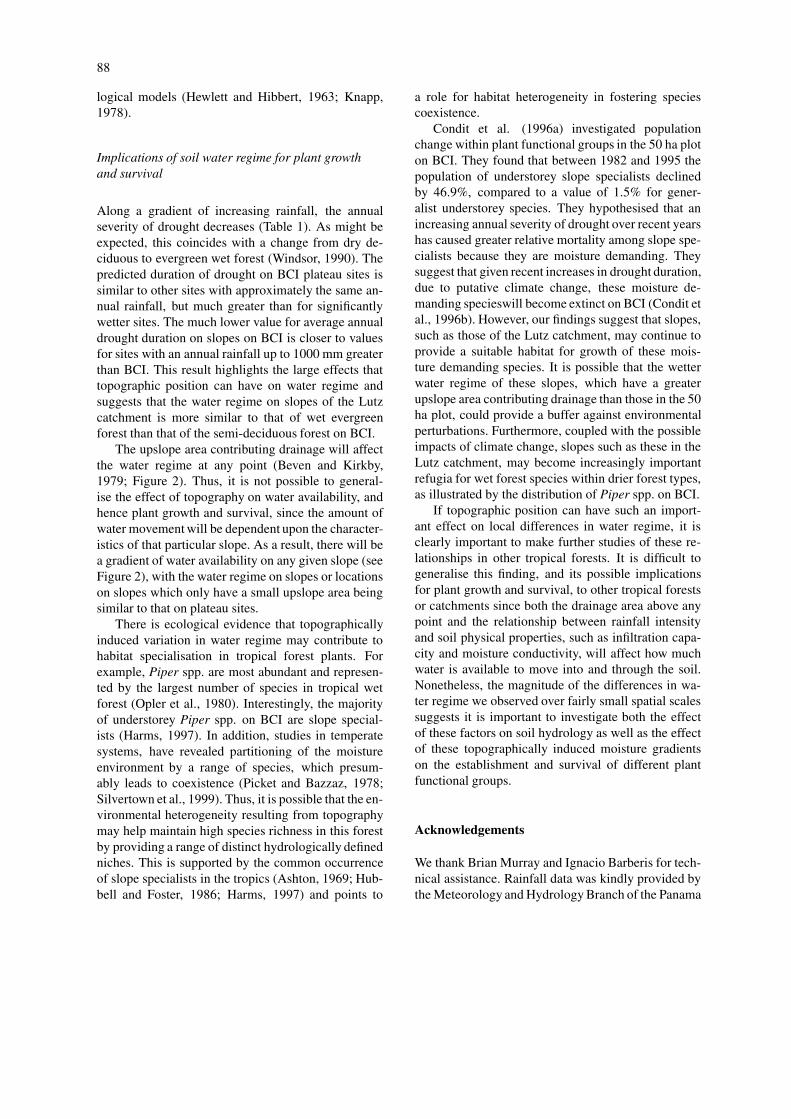
Table 1. The mean number of days per year (for the period1982–1999) for which the water deficit (Wd) exceeds Zawc(231 mm) at sites, in Panama, with different annual rainfall. Theactual duration of drought on BCI slopes determined from thegravimetric water content data is provided for comparison.
Site Co-ordinates Annual Days Standard
rainfall Wd > 231 error
(mm) mm
San Miguel 9◦ 25′ N 79◦ 30′ W 3727 1.4 1.0
Aguaclara 9◦ 22′ N 79◦ 42′ W 3604 15.5 5.6
Ciento 9◦ 18′ N 79◦ 45′ W 2960 27.7 6.7
Candeleria 9◦ 23′ N 79◦ 31′ W 2940 16.6 4.2
BCI 9◦ 10′ N 79◦ 51′ W 2592 52.6 4.5
Empire Hill 9◦ 03′ N 79◦ 40′ W 1989 73.3 14.3
BCI slopes 9◦ 10′ N 79◦ 51′ W 2592 16.2 2.7
Duration of drought at Panamá Canal Authority sites
The period for which soils, at a range of sites inPanamá, experienced a soil water deficit of 231 mm orgreater was calculated by applying the water balanceequation for the period 1980–1998 to daily rainfalldata from five sites. The mean number of days peryear for which soil water deficit exceeded 231 mmis shown for the various sites in Table. 1. Along agradient of increasing annual rainfall from 1989 to3727 mm, the mean number of days with a water de-ficit greater than 231 mm decreased from 73.3 to 1.4.For comparison, the mean annual duration of droughton BCI slopes (calculated from the soil gravimetricwater content data) is included. This figure (16.2 days)is much closer to the values for Aguaclara and Can-delaria which had 3604 and 2940 mm, respectively, ofrainfall per year than it is to the value for plateau siteson BCI (52.6 days).
Discussion
Soil matric potential
Our findings using the filter paper technique agreebroadly with those of Becker et al. (1988) who demon-strated that slopes in the 50 ha plot on BCI remainedat higher water potentials than adjacent plateau sitesduring the dry season of 1985. The magnitude of thedifferences in water availability we observed betweenslopes and plateau sites is also similar to those ob-served by Becker et al. (1988). In 1985, dry season
87
soil water potential, at a depth of 20 cm, on slopesof the 50 ha plot reached −1500 kPa, with plateausites −2000 kPa (Becker et al., 1988). Similarly, weobserved a large (500 kPa) difference between matricpotential on slopes and plateau at a depth of 20 cm,however potentials at slope bottoms were rarely lessthan −25 kPa. Total dry season rainfall was greater in1999 than 1985 (472 mm between January and Aprilinclusive versus 94 mm). Furthermore, Figure 6 sug-gests that the difference in water availability betweentopographic positions would be magnified more in adrier year, at least with respect to the duration ofdrought, indicating that slopes in the Lutz catchmentmay be significantly wetter during the dry season thanthe slopes in the 50 ha plot studied by Becker et al.(1988).
The amount of water that can supplement rainfallon slopes is highly dependent on the size of the catch-ment area above any point (Beven and Kirkby, 1979).This is apparent from our filter paper measurementsof matric potential which reveal a gradient of wateravailability down slopes in the Lutz catchment; slopebottom sites remain significantly wetter during the dryseason than both plateau and mid-slope sites. This mayalso explain why slopes in the Lutz catchment remainwetter in the dry season than those in the 50 ha plot.The sites chosen by Becker et al. (1988) for water po-tential measurements were no more than 50 m from thetop of slopes. However, our slope bottom sites wereapproximately 100 m from the top of the slopes andwill, therefore, have potentially been receiving waterfrom a greater upslope area.
The longer-term study of soil matric potential us-ing the gravimetric water content data set confirmedthat there was a consistent difference between slopeand plateau sites (Figure 6). There are many possiblelimitations in attempting to determine matric potentialfrom gravimetric water content. For example, thoseresulting from hysteresis (the water release charac-teristics being dependent on the previous wetting ordrying history of the soil) (Marshall et al., 1996) ordifferences in soil properties between the positionssampled for gravimetric water content and the releasecharacteristics. It is, therefore, reassuring that therewas good agreement (Figure 4) between the two es-timates at the level of accuracy required for site andseasonal comparisons and no significant differencesin soil water release characteristics between the ninegravimetric water content sampling sites.
The duration of drought was highly variablebetween years, with the driest years generally coin-
ciding with the El Niño events in 1983, 1988, 1992and 1998. These results confirm that El Niño eventsresulted in severe dry seasons on BCI (Windsor, 1990)and that the high inter-annual variability of droughton BCI, also observed in other tropical forests (Veen-endaal et al., 1996) may provide a bottleneck for thesuccessful regeneration of species, especially at theseedling stage (Condit et al., 1995).
Soil water balance
The soil water balance model assumes that the pro-file was freely draining. Whilst this was not true forslope sites, where overland flow was observed afterheavy rainfall we have no evidence of poor drainageon the plateau sites. Figure 9 shows that, reasonableestimates of the duration of drought were obtained inthe range 231 < Zawc < 350 mm. Consequently, themodel was not very sensitive to quite large changesin the chosen value of Zawc. Using a single value forZawc to model profile water balances can only be arough approximation, because the rate of transpira-tion and hence profile water extraction will actuallydecrease as soil moisture deficit increases, rather thanremaining constant until it drops to zero, as assumed inour simple model. This means that extreme moisturestress will actually take considerably longer to developthan predicted by the model, or alternatively that aconsiderably greater value of Zawc is needed to makethe model fit observations that actually existed in thefield. The limited profile information for BCI supportsthis proposition. Our value for Zawc of 231 mm cor-responds to a soil depth of approximately 1.2–1.4 mwhich is almost certainly a considerable overestimateof actual rooting depth. The typical soil depth to bed-rock quoted by Dietrich et al. (1982) is 500 mm andit is reasonable to assume that there was only limitedwater extracted from the weathered basalt bedrock be-low this. Furthermore, Odum (1970) found that in thiscatchment, roots were distributed throughout the en-tire soil profile, with only limited root penetration intothe weathered bedrock below.
Figure 8 also shows our prediction of drought dur-ation for slope sites using the water balance equation.This equation supplies a simple model for predictingthe annual severity of drought in the Lutz catchment,in any given year, using only daily rainfall and poten-tial evapo-transpiration. The model reveals that slopesare significantly wetter than predicted from the equa-tion, which suggests that they are receiving water fromupslope, in accordance with predictions from hydro-
88
logical models (Hewlett and Hibbert, 1963; Knapp,1978).
Implications of soil water regime for plant growthand survival
Along a gradient of increasing rainfall, the annualseverity of drought decreases (Table 1). As might beexpected, this coincides with a change from dry de-ciduous to evergreen wet forest (Windsor, 1990). Thepredicted duration of drought on BCI plateau sites issimilar to other sites with approximately the same an-nual rainfall, but much greater than for significantlywetter sites. The much lower value for average annualdrought duration on slopes on BCI is closer to valuesfor sites with an annual rainfall up to 1000 mm greaterthan BCI. This result highlights the large effects thattopographic position can have on water regime andsuggests that the water regime on slopes of the Lutzcatchment is more similar to that of wet evergreenforest than that of the semi-deciduous forest on BCI.
The upslope area contributing drainage will affectthe water regime at any point (Beven and Kirkby,1979; Figure 2). Thus, it is not possible to general-ise the effect of topography on water availability, andhence plant growth and survival, since the amount ofwater movement will be dependent upon the character-istics of that particular slope. As a result, there will bea gradient of water availability on any given slope (seeFigure 2), with the water regime on slopes or locationson slopes which only have a small upslope area beingsimilar to that on plateau sites.
There is ecological evidence that topographicallyinduced variation in water regime may contribute tohabitat specialisation in tropical forest plants. Forexample, Piper spp. are most abundant and represen-ted by the largest number of species in tropical wetforest (Opler et al., 1980). Interestingly, the majorityof understorey Piper spp. on BCI are slope special-ists (Harms, 1997). In addition, studies in temperatesystems, have revealed partitioning of the moistureenvironment by a range of species, which presum-ably leads to coexistence (Picket and Bazzaz, 1978;Silvertown et al., 1999). Thus, it is possible that the en-vironmental heterogeneity resulting from topographymay help maintain high species richness in this forestby providing a range of distinct hydrologically definedniches. This is supported by the common occurrenceof slope specialists in the tropics (Ashton, 1969; Hub-bell and Foster, 1986; Harms, 1997) and points to
a role for habitat heterogeneity in fostering speciescoexistence.
Condit et al. (1996a) investigated populationchange within plant functional groups in the 50 ha ploton BCI. They found that between 1982 and 1995 thepopulation of understorey slope specialists declinedby 46.9%, compared to a value of 1.5% for gener-alist understorey species. They hypothesised that anincreasing annual severity of drought over recent yearshas caused greater relative mortality among slope spe-cialists because they are moisture demanding. Theysuggest that given recent increases in drought duration,due to putative climate change, these moisture de-manding specieswill become extinct on BCI (Condit etal., 1996b). However, our findings suggest that slopes,such as those of the Lutz catchment, may continue toprovide a suitable habitat for growth of these mois-ture demanding species. It is possible that the wetterwater regime of these slopes, which have a greaterupslope area contributing drainage than those in the 50ha plot, could provide a buffer against environmentalperturbations. Furthermore, coupled with the possibleimpacts of climate change, slopes such as these in theLutz catchment, may become increasingly importantrefugia for wet forest species within drier forest types,as illustrated by the distribution of Piper spp. on BCI.
If topographic position can have such an import-ant effect on local differences in water regime, it isclearly important to make further studies of these re-lationships in other tropical forests. It is difficult togeneralise this finding, and its possible implicationsfor plant growth and survival, to other tropical forestsor catchments since both the drainage area above anypoint and the relationship between rainfall intensityand soil physical properties, such as infiltration capa-city and moisture conductivity, will affect how muchwater is available to move into and through the soil.Nonetheless, the magnitude of the differences in wa-ter regime we observed over fairly small spatial scalessuggests it is important to investigate both the effectof these factors on soil hydrology as well as the effectof these topographically induced moisture gradientson the establishment and survival of different plantfunctional groups.
Acknowledgements
We thank Brian Murray and Ignacio Barberis for tech-nical assistance. Rainfall data was kindly provided bythe Meteorology and Hydrology Branch of the Panama
89
Canal Authority. Financial support was provided bythe Natural Environment Research Council (student-ship to MID).
References
Ashton P S 1969 Speciation among tropical forest trees: somedeductions in light of recent evidence. Biol. J. Linn. Soc. 1,155–196.
Augspurger C K 1984 Light requirements of neotropical tree seed-lings: A comparative study of growth and survival. J. Ecol. 72,777–795.
Basnet K 1992 Effect of topography on the pattern of trees in Tabo-nuco (Dacryodes excelsa) dominated rain forest of Puerto Rico.Biotropica 24, 31–42.
Bazzaz F A 1984 Dynamics of wet tropical forests and their speciesstrategies. In Physiological Ecology of Plants of the Wet Tropics.Eds E Medina, H A Mooney and C Vasquez–Yanes. pp 233–244.Dr W. Junk Publishers, The Hague.
Becker P, Rabenold P E, Idol J R and Smith A P 1988 Water poten-tial gradients for gaps and slopes in a Panamanian tropical moistforest’s dry season. J. Trop. Ecol. 4, 173–184.
Beven K J and Kirkby M J 1979 A physically based, variable con-tributing area model of basin hydrology. Hydrol. Sci. Bull. 24,43–69.
Brokaw N V L and Scheiner S M 1989 Species composition in gapsand structure of a tropical forest. Ecology 70, 538–541.
Canham C D, Kobe R K, Latty E F and Chazdon R L 1999 Interspe-cific and intraspecific variation in tree seedling survival: Effectsof allocation to roots versus carbohydrate reserves. Oecologia121, 1–11.
Chazdon R L 1988 Sunflecks and their importance to forest under-storey plants. Adv. Ecol. Res. 18: 1–63.
Chazdon R L and Fetcher N 1984 Photosynthetic light environmentsin a lowland tropical rainforest in Costa Rica. J. Ecol. 72, 553–564.
Condit R, Hubbell S P and Foster R B 1995 Mortality rates of 205Neotropical tree and shrub species and the impact of a severedrought. Ecol. Monogr. 65, 419–439.
Condit R, Hubbell, S P and Foster R B 1996a Assessing the responseof plant functional types to climatic change in tropical forests. J.Veg. Sci. 7, 405–416.
Condit R, Hubbell S P and Foster R B 1996b Changes in tree speciesabundance in a Neotropical forest: Impact of climate change. J.Trop. Ecol. 12, 231–256.
Deka R N, Wairiu M, Mtakwa P W, Mullins C E, Veenendaal E Mand Townend J 1995 Use and accuracy of the filter-paper tech-nique for measurement of soil matric potential. Eur. J. Soil Sci.46, 233–238.
Denslow J S 1980 Gap partitioning among tropical rainforest trees.Biotropica 12 (Supplement), 47–55.
Dietrich W E, Windsor D M and Dunne T 1982 Geology, climateand hydrology of Barro Colorado Island. In The Ecology ofa Tropical Forest: Seasonal Rhythms and Long-term Changes.Eds. E G Leigh Jr., A S Rand and D M Windsor. pp. 21–46.Smithsonian Institution Press, Washington, DC.
Felton G K and Nieber J L 1991 Four soil-moisture character-istic curve functions evaluated for numerical modelling of sand.Trans. ASAE 34, 417–422.
Grubb P J 1977 The maintenance of species-richness in plant com-munities: the importance of the regeneration niche. Biol. Rev. 52,107–145.
Hall J B and Swaine M D 1976 Classification and ecology of closedcanopy forest in Ghana. J. Ecol. 64, 913–951.
Harms K E 1997 Habitat-specialization and seed dispersal-limitation in a Neotropical forest. PhD thesis, Princeton Univer-sity, Princeton, NJ.
Helvey J D 1971 Predicting soil moisture in the southern Appalachi-ans. MSc. thesis, University of Georgia, Athens, GA.
Hewlett J D and Hibbert A R 1963 Moisture and energy conditionswithin a sloping soil mass during drainage. J. Geophys Res. 68,1081–1087.
Hubbell S P and Foster R B 1983 Diversity of canopy trees in aneotropical forest and implications for conservation. In TropicalRain Forest: Ecology and Management. Eds. S L Sutton, T CWhitmore and A C Chadwick. pp. 25–41. Blackwell ScientificPublications, Oxford.
Hubbell S P and Foster R B 1986 Biology, chance, and history andthe structure of tropical rain forest tree communities. In Com-munity Ecology. Eds. J Diamond and T J Case. pp 314–329.Harper and Row, New York, NY.
Knapp B J 1978 Infiltration and storage of soil water. In HillslopeHydrology Ed. MJ Kirkby. pp. 43–72. Wiley, Chichester.
Kobe R K 1999 Light gradient partitioning among tropical tree spe-cies through differential seedling mortality and growth. Ecology80, 187–201.
Leigh E G Jr., Rand A S and Windsor D M, Eds. 1982 The Eco-logy of a Neotropical Forest: Seasonal Rhythms and Longer-termChanges. Smithsonian Institution, Washington, D.C.
Leigh E G Jr. 1999 Tropical Forest Ecology: A View from BarroColorado Island. Oxford University Press, Oxford.
Mahdi R, Law R and Willis A J 1989 Large niche overlaps amongcoexisting plant species in a limestone grassland community. J.Ecol. 77, 386–400.
Marshall T J Holmes J W and Rose C W 1996 Soil Physics. 3rd edn.Cambridge University Press, Cambridge.
Mullins C E 2000 Matric potential. In Soil and Environmental Ana-lysis: Physical Methods. Eds K A Smith and C E Mullins. pp65–93. Marcel Dekker, Inc., New York, NY.
Odum H T 1970 Rain forest and mineral cycling homeostasis. InA Tropical Rainforest. Eds. H T Odum and R F Pigeon. pp H-1–H-52. U.S. Atomic Energy Commission, Oak Ridge, Tenn.:Division of Technical Information.
Opler P A, Frankie G W and Baker H G 1980 Comparative phen-ological studies of treelet and shrub species in tropical wet anddry forests in the lowlands of Costa Rica. J. Ecol. 68, 167–188.
Picket S T A and Bazzaz F A 1978 Organization of an assemblageof early successional species on a soil moisture gradient. Ecology59, 1248–1255.
Ricklefs R E 1977 Environmental heterogeneity and plant speciesdiversity: A hypothesis. Am. Nat. 111, 376–381.
Silvertown J, Dodd M E, Gowing D J G and Mountford J O 1999Hydrologically defined niches reveal a basis for species richnessin plant communities. Nature 400, 61–63.
Tilman D 1982 Resource Competition and Community Structure.Monographs in population Biology, Princeton University Press,NJ.
Tilman G D 1984 Plant dominance along an experimental nutrientgradient. Ecology 65, 1445–1453.
Townend J, Reeve M J and Carter A 2000 Water release character-istics. In Soil and Environmental Analysis: Physical Methods.Eds K A Smith and C E Mullins. pp.95-140. Marcel Dekker Inc.,New York, NY.
Veenendaal E M, Swaine M D, Blay D, Yelifari N B and Mullins C E1996 Seasonal and long-term soil water regime in West Africantropical forest. J. Veg. Sci. 7, 473–482.

90
Werling J A Jr. and Tajchman S J 1983/84 Soil thermal and moistureregimes on forested slopes of an Appalachian watershed. For.Ecol. Manag. 7, 297–310.
Williamson M H 1957 An elementary theory of interspecific com-petition. Nature 180, 422–425.
Windsor D M 1990 Climate and Moisture Availability in a Trop-ical Forest: Long-term Records from Barro Colorado Island,Panamá. Smithsonian Contributions to the Earth Sciences, no.29. Smithsonian Institution Press, Washington, DC.
Wright S J 1992 Seasonal drought, soil fertility and the speciesdensity of tropical forest plant communities. Trends Ecol. Evol.7, 260–263.
Yavitt J B and Wieder R K 1988 Nitrogen, phosphorous, and sul-fur properties of some forest soils on Barro Colorado Island,Panama. Biotropica 20, 2–10.
Young H J and Young T P 1983 Local distribution of C3 and C4grasses in sites of overlap on Mount Kenya. Oecologia (Berl.)58, 373–377.
Section editor: P. M. Attiwill