Embed Size (px)
Citation preview
Topographic Organization for Delayed Saccades in Human PosteriorParietal Cortex
Denis Schluppeck,1,2 Paul Glimcher,2 and David J. Heeger1,2
1Department of Psychology and 2Center for Neural Science, New York University, New York City, New York
Submitted 17 December 2004; accepted in final form 1 April 2005
Schluppeck, Denis, Paul Glimcher, and David J. Heeger. Topo-graphic organization for delayed saccades in human posterior parietalcortex. J Neurophysiol 94: 1372–1384, 2005. First published April 7,2005; doi:10.1152/jn.01290.2004. Posterior parietal cortex (PPC) isthought to play a critical role in decision making, sensory attention,motor intention, and/or working memory. Research on the PPC innon-human primates has focused on the lateral intraparietal area (LIP)in the intraparietal sulcus (IPS). Neurons in LIP respond after theonset of visual targets, just before saccades to those targets, andduring the delay period in between. To study the function of posteriorparietal cortex in humans, it will be crucial to have a routine andreliable method for localizing specific parietal areas in individualsubjects. Here, we show that human PPC contains at least twotopographically organized regions, which are candidates for the hu-man homologue of LIP. We mapped the topographic organization ofhuman PPC for delayed (memory guided) saccades using fMRI.Subjects were instructed to fixate centrally while a peripheral targetwas briefly presented. After a further 3-s delay, subjects made asaccade to the remembered target location followed by a saccade backto fixation and a 1-s inter-trial interval. Targets appeared at successivelocations “around the clock” (same eccentricity, �30° angular steps),to produce a traveling wave of activity in areas that are topographi-cally organized. PPC exhibited topographic organization for delayedsaccades. We defined two areas in each hemisphere that containedtopographic maps of the contra-lateral visual field. These two areaswere immediately rostral to V7 as defined by standard retinotopicmapping. The two areas were separated from each other and from V7by reversals in visual field orientation. However, we leave open thepossibility that these two areas will be further subdivided in futurestudies. Our results demonstrate that topographic maps tile the cortexcontinuously from V1 well into PPC.
I N T R O D U C T I O N
Early studies of posterior parietal cortex (PPC) describedattention-related (Robinson et al. 1978) and movement-related(Mountcastle et al. 1975) responses for this region of the brain.More recently, a role in decision making has been proposed(Glimcher 2003). These opposing views continue to be debatedtoday. For an overview, see, e.g., Colby and Goldberg (1999),Goldberg et al. (2002), Kusunoki et al. (2000), Andersen andBuneo (2002), Snyder (2000) and also Dorris and Glimcher(2004), Platt and Glimcher (1999), Roitman and Shadlen(2002), Shadlen and Newsome (1996). There is evidence thatPPC neurons respond after the onset of a sensory stimulus,encode the attention that is paid to the stimulus, sustain thememory of the stimulus, compute the sensorimotor transfor-mation involved in making a movement to the stimulus, encode
the intention to make such a movement, and compute thedecision concerning which of two or more movements tomake. Clearly, these observations underline that it is difficult toneatly categorize these neurons as purely “sensory” or “motor”(Platt and Glimcher 1999). There are a number of separate anddistinct cortical areas in the PPC, and it has been hypothesizedthat these areas have distinct functional specializations withregard to decision, attention, intention, and/or memory (e.g.,Andersen and Buneo 2002). Much of the single-unit electro-physiology research on these topics has focused on the lateralintraparietal area (LIP), a small region in the macaque intrapa-rietal sulcus (IPS), that is tied to the production of eye move-ments. The study of LIP in macaques has hence become amicrocosm of the research on the cortical control of attention,intention, working memory, and decision-making. This in turnhas led to increasing interest in the comparative study of LIP(and PPC in general) in humans and non-human primates.
Some areas of PPC have been defined with precision in themonkey brain (Andersen et al. 1990a; Colby and Duhamel1991; Lewis and Van Essen 2000), but less so in the humanbrain. Topographic mapping with functional magnetic reso-nance imaging (fMRI) has been a particularly useful techniquefor defining human cortical areas objectively, precisely, androutinely. This technique, introduced originally by Engel et al.(1994), has successfully been used to measure the retinotopicorganization of early visual cortex and to define a number ofvisual cortical areas (DeYoe et al. 1996; Engel et al. 1994,1997; Press et al. 2001; Sereno et al. 1995). Using a variant ofthis method, Sereno et al. (2001) identified an area near thehuman IPS that they suggest might be the human homologue ofmacaque LIP. In their experiment, subjects made saccades to aseries of targets located in sequence around the visual field.The targets were presented only briefly, and subjects had toremember their locations for several seconds before each eyemovement. Sereno et al. observed a traveling wave of activityacross a region of human PPC as subjects remembered con-secutive target locations, implying that some neurons in thisarea are topographically organized for delayed saccades toremembered locations. Other experiments have provided com-plementary evidence for potential homologies between areas ofhuman PPC and monkey LIP. There are numerous reports ofsustained activity in human PPC during a delay period beforesubjects make saccades (e.g., Astafiev et al. 2003; Connolly etal. 2002; Curtis and D’Esposito 2002). It has even been arguedthat human PPC exhibits spatial updating after eye movements(Merriam et al. 2003), a phenomenon analogous to one that has
Address for reprint requests and other correspondence: D. Schluppeck,Center for Neural Science, New York University, 6 Washington Place, NewYork, NY 10003 (E-mail: [email protected]).
The costs of publication of this article were defrayed in part by the paymentof page charges. The article must therefore be hereby marked “advertisement”in accordance with 18 U.S.C. Section 1734 solely to indicate this fact.
J Neurophysiol 94: 1372–1384, 2005.First published April 7, 2005; doi:10.1152/jn.01290.2004.
1372 0022-3077/05 $8.00 Copyright © 2005 The American Physiological Society www.jn.org
been reported in monkey LIP (Duhamel et al. 1992). It is,however, unclear if these human regions are the same as thatidentified by Sereno et al. based on topography.
Here, we used the methodology introduced by Sereno et al. tomeasure the response to delayed saccades in human PPC. Incontrast to their report of one region, we found that there are atleast two candidate areas in the IPS that exhibit topographic maps.These regions covered the medial aspect of the IPS. We refer tothem as IPS1 and IPS2 based on their anatomical location. Theywere anterior to visual areas V3A and V7 at the transverseoccipital sulcus, but posterior to the area reported previously bySereno et al. (2001). The boundaries between V7 and IPS1 andbetween IPS1 and IPS2 were defined by reversals in the visualfield orientation (i.e., phase reversals in the topographic map). Weshow in a companion paper that the same areas exhibited topo-graphic organization when subjects performed a visual detectiontask in which the focus of attention systematically traversed thevisual field, in the absence of eye movements (M. Silver, D. B.Ress, and D. J. Heeger 2005). It is important to note that thedefinitions of these two regions in the IPS are tentative. We leaveopen the possibility that these areas may be further subdivided infuture experiments. Additional experiments will also be needed todetermine the functional homology between these areas in humanPPC defined by topographic mapping and areas in the macaquebrain. A preliminary report of these results has been presented inabstract form (Schluppeck et al. 2004).
M E T H O D S
Subjects
Four experienced subjects participated in this study with writtenconsent. Procedures were in compliance with the safety guidelines for
MR research and approved by the human subjects Institutional Re-view Board at New York University. Each subject participated in anumber of scanning sessions: one session to obtain a high-resolutionanatomical volume; two sessions to measure the retinotopic maps invisual cortex (see following text) and two to three sessions to measurefMRI responses in the experimental conditions.
Visual stimuli and task
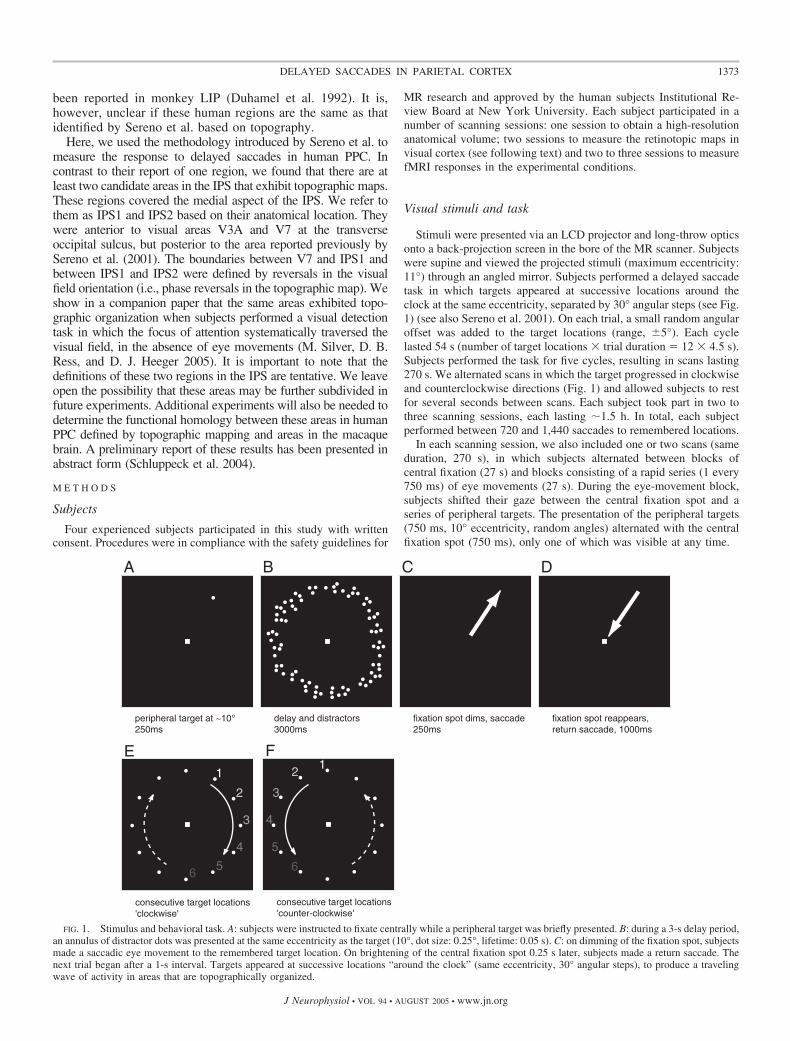
Stimuli were presented via an LCD projector and long-throw opticsonto a back-projection screen in the bore of the MR scanner. Subjectswere supine and viewed the projected stimuli (maximum eccentricity:11°) through an angled mirror. Subjects performed a delayed saccadetask in which targets appeared at successive locations around theclock at the same eccentricity, separated by 30° angular steps (see Fig.1) (see also Sereno et al. 2001). On each trial, a small random angularoffset was added to the target locations (range, �5°). Each cyclelasted 54 s (number of target locations � trial duration � 12 � 4.5 s).Subjects performed the task for five cycles, resulting in scans lasting270 s. We alternated scans in which the target progressed in clockwiseand counterclockwise directions (Fig. 1) and allowed subjects to restfor several seconds between scans. Each subject took part in two tothree scanning sessions, each lasting �1.5 h. In total, each subjectperformed between 720 and 1,440 saccades to remembered locations.
In each scanning session, we also included one or two scans (sameduration, 270 s), in which subjects alternated between blocks ofcentral fixation (27 s) and blocks consisting of a rapid series (1 every750 ms) of eye movements (27 s). During the eye-movement block,subjects shifted their gaze between the central fixation spot and aseries of peripheral targets. The presentation of the peripheral targets(750 ms, 10° eccentricity, random angles) alternated with the centralfixation spot (750 ms), only one of which was visible at any time.
FIG. 1. Stimulus and behavioral task. A: subjects were instructed to fixate centrally while a peripheral target was briefly presented. B: during a 3-s delay period,an annulus of distractor dots was presented at the same eccentricity as the target (10°, dot size: 0.25°, lifetime: 0.05 s). C: on dimming of the fixation spot, subjectsmade a saccadic eye movement to the remembered target location. On brightening of the central fixation spot 0.25 s later, subjects made a return saccade. Thenext trial began after a 1-s interval. Targets appeared at successive locations “around the clock” (same eccentricity, 30° angular steps), to produce a travelingwave of activity in areas that are topographically organized.
1373DELAYED SACCADES IN PARIETAL CORTEX
J Neurophysiol • VOL 94 • AUGUST 2005 • www.jn.org
Functional imaging
We used functional magnetic resonance imaging at 3T (Allegra,Siemens, Erlangen) to measure blood-oxygen-level-dependentchanges in cortical activity (BOLD). During each fMRI scan, a timeseries of volumes were acquired using a T2*-sensitive EPI pulsesequence (TR: 1,500 ms, TE: 30 ms, flip angle: 75°, 24 slices, 3 � 3 �3 mm3voxels, FOV: 192 mm). We acquired images using custom RFcoils (NM-011 transmit head-coil and NMSC-021 4-channel phasedarray receive coil, NOVA Medical, Wakefield, MA).
Preprocessing and motion correction
To minimize head motion, subjects were stabilized by use of a bitebar and/or foam padding. Post hoc image registration was used tocorrect for residual motion in the functional data (MCFLIRT) (Jen-kinson et al. 2002). Data from the first 14 s of each fMRI scan werediscarded to minimize transient effects of magnetic saturation. Furtherpreprocessing of the fMRI data were as follows: high-pass filtering ofthe time series at each voxel to compensate for the slow drift typicalin fMRI measurements (Smith et al. 1999) and dividing each voxel’stime series by its mean intensity to convert the data from arbitraryimage intensity units to percent signal modulation (and to compensatefor the decrease in mean image intensity with distance from thereceive coil). The resulting time series were either analyzed for eachvoxel or averaged over a region of cortical gray matter correspondingto a given region of interest (ROI).
Topography for delayed saccades
In the saccade experiment the main difference across trials was thetarget location. Subjects made sequential delayed eye movements todifferent locations in the visual field (Fig. 1). If a topographic mapexists, adjacent parts of the cortical gray matter should representadjacent parts of the visual field, and successive delayed eye-move-ments to targets “around the clock” will therefore lead to a travelingwave of activity across the cortical surface.
Data were analyzed by fitting a sinusoid (same 54-s period as thatof the stimulus/cue cycle) to the time series at each voxel andcomputing: the correlation (technically, coherence) between the timeseries and the corresponding best-fitting sinusoid and the phase of thebest-fitting sinusoid. The coherence measures signal-to-noise (Engelet al. 1994, 1997), taking a value near 1 when the fMRI signalmodulation at the stimulus/cue period is large relative to the noise (atthe other frequency components) and a value near 0 when there is nosignal modulation or when the signal is small compared with noise.The phase measures the temporal delay of the fMRI signal relative tothe beginning of the experimental cycle and consequently correspondsto the polar angle component of the topographic map. A topographicmap should be visible on the cortical surface as a smooth progressionof early to late “phase values,” corresponding to different targetlocations in the visual field.
We combined data from “clockwise” and “counter-clockwise”scans by time shifting the time series at each voxel to remove thehemodynamic delay (�t � 4.5 s). We then time-reversed the counter-clockwise scans and averaged across the time-shifted and time-reversed scans, separately for each subject, across scanning sessions.The resulting mean time series therefore reflected the timing ofclockwise scans, in which targets progressed through the right hemi-field in the first part of each cycle and through the left hemifield fieldin the second half of the cycle.
Regions of posterior parietal cortex that were topographicallyorganized for delayed saccades were visualized on flattened represen-tations of each subject’s posterior parietal cortex (see following text).Candidate cortical areas were defined when they were observed to beconsistent across hemispheres/subjects. Consistency was determinedusing the following criteria: the location of each area with respect to
the gross anatomy, the size of each area, the distances between theareas and their placement relative to one another, and the visual fieldorientations (see following text) within the areas. Each candidatecortical area was defined by hand on the flat map. We defined eacharea conservatively by locating two features: the representation of thevertical meridia (at reversals in the phase map; see Visual fieldorientation), which indicated the borders between areas, and themedial and lateral borders of the maps. These borders were defined byincluding regions on the map that showed a significant response(coherence, c � 0.2) in the topography experiment. We also verifiedthe definition of areas by comparing them to the region on the mapsthat showed significant response (c � 0.3) in the saccade-versus-fixation control condition (see Fig. 8). Because subjects performed thesaccade tasks only at one eccentricity, the regions we defined likelyrepresent only a portion of the true extent of these topographic maps.
Statistics
The statistical significance of the coherence values c can be deter-mined with a t-test (H0: c � 0, number of trials � 2 � 178 df) (Sokaland Rohlf 1995). The probability of observing a coherence value of0.2 under the null hypothesis (c � 0), is P 0.0035, t � 2.72. For c �0.35, P 7.31 � 10�7 and for c � 0.75, the highest coherencethresholds used, P � 0 (within numerical precision in Matlab). Tocalculate these P values, we assumed that consecutive time pointswere independent. This assumption is known to be false because thereis considerably more noise in fMRI time series at low frequencies(�0.25 Hz) than at higher frequencies (Aguirre et al. 1997; Biswal etal. 1995, 1997a,b; Purdon and Weisskoff 1998; Smith et al. 1999;Woolrich et al. 2001; Zarahn et al. 1997). Hence the P values shouldbe taken only as a rule of thumb. There is a one-to-one correspon-dence between coherence and P values, but precise calculation of theP values would require further assumptions about the properties of thenoise in the measurements. The c- (or corresponding P) values wereused only for the purpose of thresholding the data to visualize thephase maps. Because of the arbitrariness of these statistical thresholds,we performed additional analyses to quantify the lateralization andvisual field orientations in the identified areas of PPC.
Visual field orientation
To characterize the reversals in the topographic maps, we computedthe visual field orientation for each cortical area. There are twodiagnostic features of topographic maps for defining cortical areas. 1)The response phases progress across each visual area (indicating atopographic organization of the visual field on the cortical surface). 2)The adjacent maps are mirror images of each other so the phaseprogressions are in opposite directions along the cortical surface,resulting in a phase reversal at their shared boundary. The local visualfield orientation at each voxel was determined by comparing itsresponse phase to the phases of each of its eight neighboring voxels onthe flat map. In particular, the local horizontal component of visualfield orientation was determined by computing the difference betweenthe sine of the response phase of the central voxel and the sine of thephase of each of its neighboring voxels and computing the differencebetween the resulting values from the three voxels on the right minusthe values from the three voxels on the left. The local verticalcomponent of the visual field orientation was determined analogously.The visual field orientation of an entire cortical area was computed asthe vector average of the local orientations at each voxel (as in Figs.4 and 5, arrows).
Retinotopy
Retinotopic visual areas (V1, V2, V3, V3A, V3B, hV4, V7) weredefined using standard methods (DeYoe et al. 1996; Engel et al. 1994,1997; Sereno et al. 1995). Briefly, to estimate the angular component
1374 D. SCHLUPPECK, P. GLIMCHER, AND D. J. HEEGER
J Neurophysiol • VOL 94 • AUGUST 2005 • www.jn.org
of the retinotopic maps, we used a 45° wedge of flickering checker-board that rotated slowly (f � 1/24s) about a central fixation point.Analogously, to estimate the radial component of the retinotopicmaps, we used an expanding annulus (f � 1/24s, 25% duty cycle).These stimuli evoked traveling waves of activity across each of theretinotopic areas. As for the delayed-saccade data, we fit the measuredtime series with a sinusoid and calculated the response phase andcoherence separately for each voxel. The phase values measuredtemporal delay of the fMRI responses relative to the beginning of theexperimental cycle and, therefore corresponded to the polar (or radial)component of the topographic map.
Anatomical imaging, registration, and flat maps
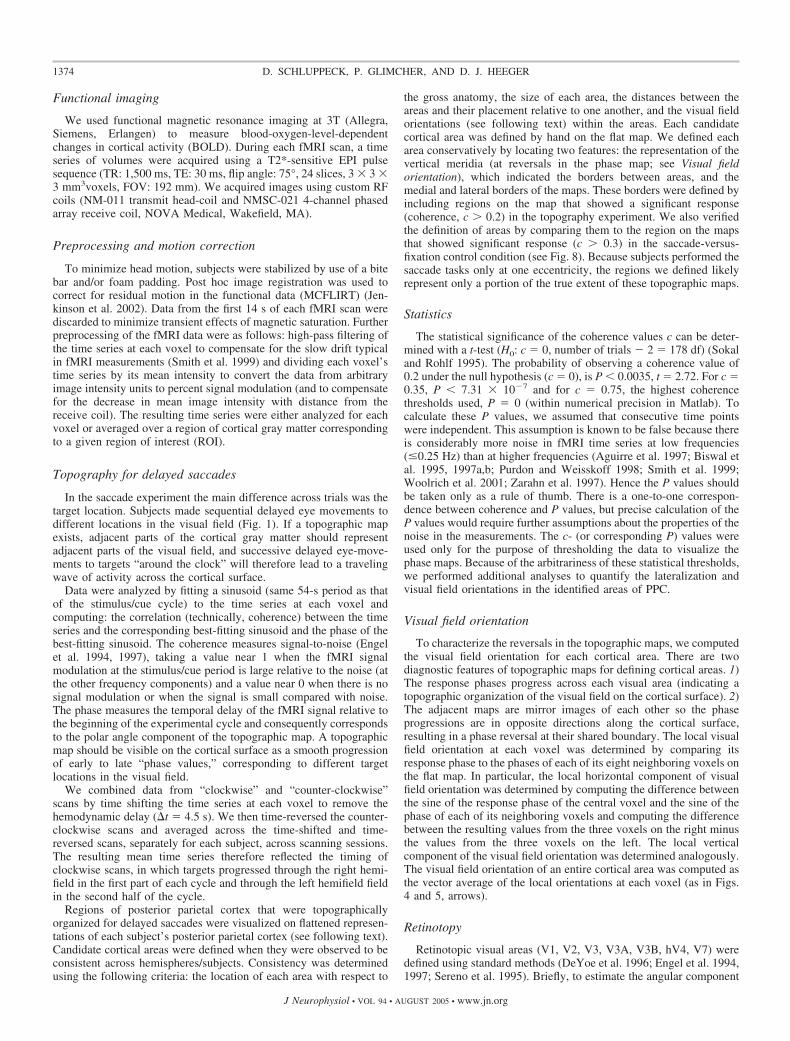
A high-resolution anatomical volume was acquired of each sub-ject’s brain using a T1-weighted, 3D-MPRAGE pulse sequence (1 �1 � 1 mm3 voxels). These anatomical volumes were used to registerthe functional data across scanning sessions, restrict the functionaldata analysis to gray matter voxels, and computationally flatten thegray matter to create flattened visualizations of the cortical activity.Gray and white matter were segmented, and flat maps were computedusing custom software (Fig. 2) (Larsson 2001). A surface correspond-ing to the gray-white matter boundary was extracted and computa-tionally inflated. In a further step, selected regions containing thetransverse occipital (TOS) and intraparietal (IPS) sulci were selectedand then computationally flattened (Larsson 2001; Smith 2002). Flatmaps were rendered such that areas that were concave on the originalsurface (buried in sulci) are dark gray, and areas that were convex (topof gyri) are light gray.
Each session began by acquiring a set of anatomical images in thesame slices as the functional images (T1-weighted, MPRAGE pulsesequence). An image registration algorithm (Nestares and Heeger2000) was used to align these inplane anatomical images to thehigh-resolution anatomical volume of the observers brain (see pre-ceding text), so that the data from a given subject were co-registeredacross scanning sessions.
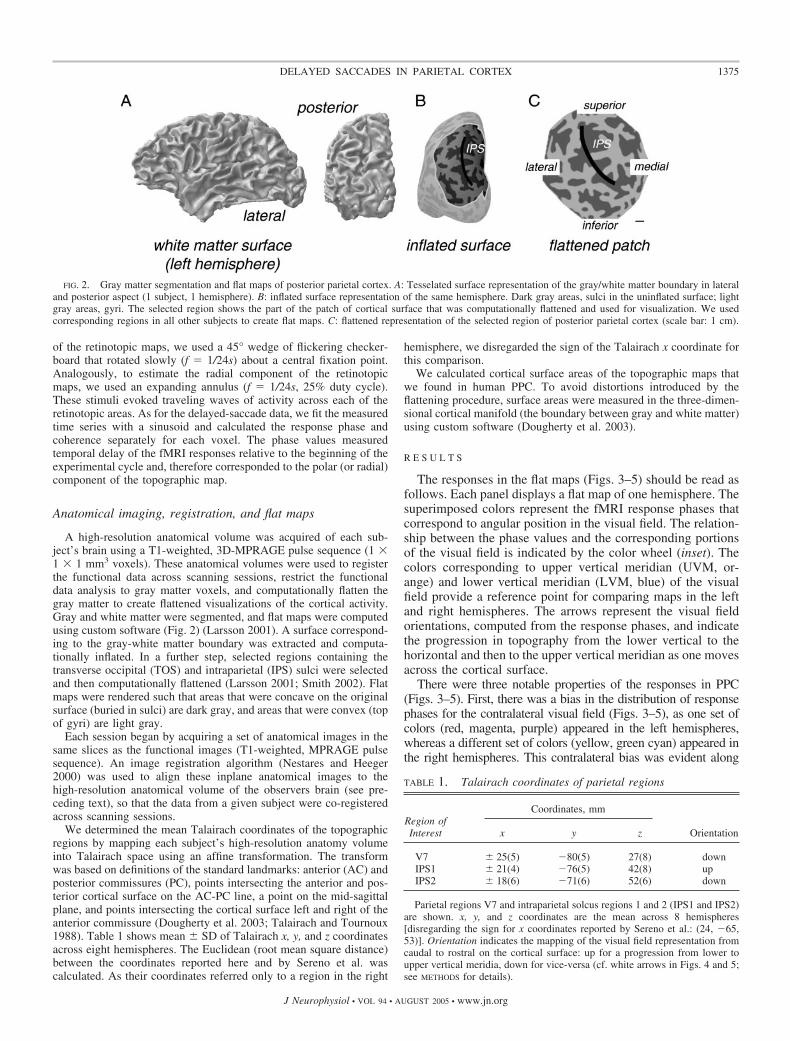
We determined the mean Talairach coordinates of the topographicregions by mapping each subject’s high-resolution anatomy volumeinto Talairach space using an affine transformation. The transformwas based on definitions of the standard landmarks: anterior (AC) andposterior commissures (PC), points intersecting the anterior and pos-terior cortical surface on the AC-PC line, a point on the mid-sagittalplane, and points intersecting the cortical surface left and right of theanterior commissure (Dougherty et al. 2003; Talairach and Tournoux1988). Table 1 shows mean � SD of Talairach x, y, and z coordinatesacross eight hemispheres. The Euclidean (root mean square distance)between the coordinates reported here and by Sereno et al. wascalculated. As their coordinates referred only to a region in the right
hemisphere, we disregarded the sign of the Talairach x coordinate forthis comparison.
We calculated cortical surface areas of the topographic maps thatwe found in human PPC. To avoid distortions introduced by theflattening procedure, surface areas were measured in the three-dimen-sional cortical manifold (the boundary between gray and white matter)using custom software (Dougherty et al. 2003).
R E S U L T S
The responses in the flat maps (Figs. 3–5) should be read asfollows. Each panel displays a flat map of one hemisphere. Thesuperimposed colors represent the fMRI response phases thatcorrespond to angular position in the visual field. The relation-ship between the phase values and the corresponding portionsof the visual field is indicated by the color wheel (inset). Thecolors corresponding to upper vertical meridian (UVM, or-ange) and lower vertical meridian (LVM, blue) of the visualfield provide a reference point for comparing maps in the leftand right hemispheres. The arrows represent the visual fieldorientations, computed from the response phases, and indicatethe progression in topography from the lower vertical to thehorizontal and then to the upper vertical meridian as one movesacross the cortical surface.
There were three notable properties of the responses in PPC(Figs. 3–5). First, there was a bias in the distribution of responsephases for the contralateral visual field (Figs. 3–5), as one set ofcolors (red, magenta, purple) appeared in the left hemispheres,whereas a different set of colors (yellow, green cyan) appeared inthe right hemispheres. This contralateral bias was evident along
FIG. 2. Gray matter segmentation and flat maps of posterior parietal cortex. A: Tesselated surface representation of the gray/white matter boundary in lateraland posterior aspect (1 subject, 1 hemisphere). B: inflated surface representation of the same hemisphere. Dark gray areas, sulci in the uninflated surface; lightgray areas, gyri. The selected region shows the part of the patch of cortical surface that was computationally flattened and used for visualization. We usedcorresponding regions in all other subjects to create flat maps. C: flattened representation of the selected region of posterior parietal cortex (scale bar: 1 cm).
TABLE 1. Talairach coordinates of parietal regions
Region ofInterest
Coordinates, mm
Orientationx y z
V7 � 25(5) �80(5) 27(8) downIPS1 � 21(4) �76(5) 42(8) upIPS2 � 18(6) �71(6) 52(6) down
Parietal regions V7 and intraparietal solcus regions 1 and 2 (IPS1 and IPS2)are shown. x, y, and z coordinates are the mean across 8 hemispheres[disregarding the sign for x coordinates reported by Sereno et al.: (24, �65,53)]. Orientation indicates the mapping of the visual field representation fromcaudal to rostral on the cortical surface: up for a progression from lower toupper vertical meridia, down for vice-versa (cf. white arrows in Figs. 4 and 5;see METHODS for details).
1375DELAYED SACCADES IN PARIETAL CORTEX
J Neurophysiol • VOL 94 • AUGUST 2005 • www.jn.org
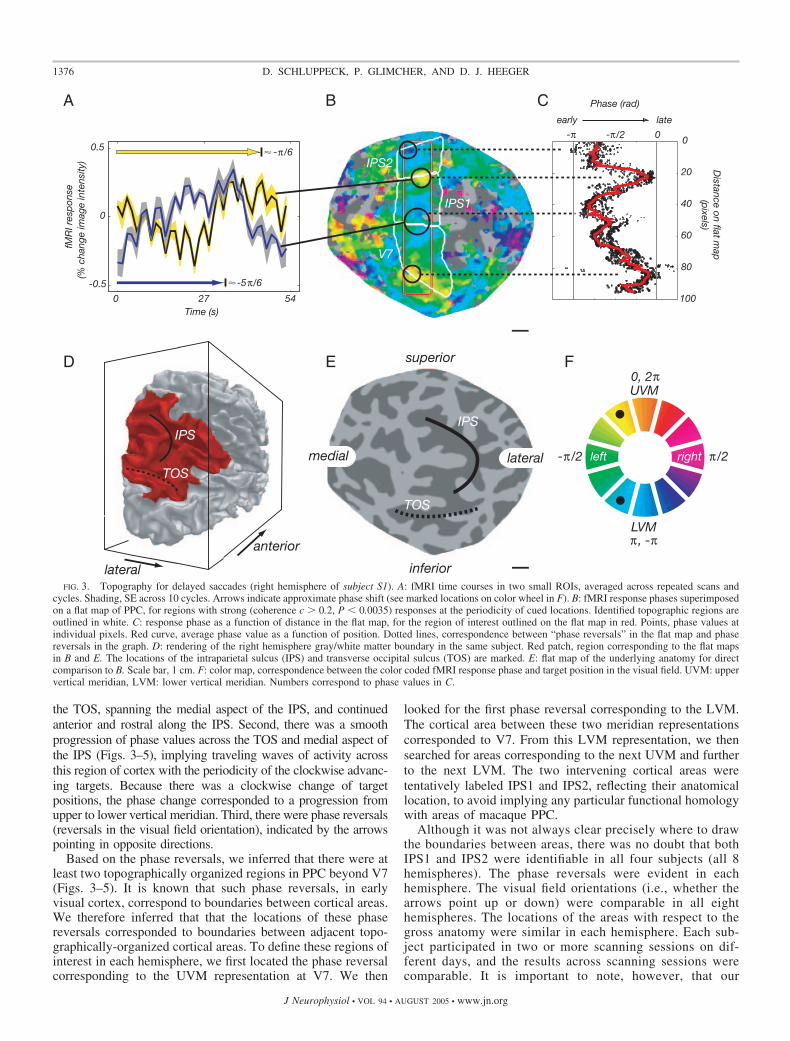
the TOS, spanning the medial aspect of the IPS, and continuedanterior and rostral along the IPS. Second, there was a smoothprogression of phase values across the TOS and medial aspect ofthe IPS (Figs. 3–5), implying traveling waves of activity acrossthis region of cortex with the periodicity of the clockwise advanc-ing targets. Because there was a clockwise change of targetpositions, the phase change corresponded to a progression fromupper to lower vertical meridian. Third, there were phase reversals(reversals in the visual field orientation), indicated by the arrowspointing in opposite directions.
Based on the phase reversals, we inferred that there were atleast two topographically organized regions in PPC beyond V7(Figs. 3–5). It is known that such phase reversals, in earlyvisual cortex, correspond to boundaries between cortical areas.We therefore inferred that that the locations of these phasereversals corresponded to boundaries between adjacent topo-graphically-organized cortical areas. To define these regions ofinterest in each hemisphere, we first located the phase reversalcorresponding to the UVM representation at V7. We then
looked for the first phase reversal corresponding to the LVM.The cortical area between these two meridian representationscorresponded to V7. From this LVM representation, we thensearched for areas corresponding to the next UVM and furtherto the next LVM. The two intervening cortical areas weretentatively labeled IPS1 and IPS2, reflecting their anatomicallocation, to avoid implying any particular functional homologywith areas of macaque PPC.
Although it was not always clear precisely where to drawthe boundaries between areas, there was no doubt that bothIPS1 and IPS2 were identifiable in all four subjects (all 8hemispheres). The phase reversals were evident in eachhemisphere. The visual field orientations (i.e., whether thearrows point up or down) were comparable in all eighthemispheres. The locations of the areas with respect to thegross anatomy were similar in each hemisphere. Each sub-ject participated in two or more scanning sessions on dif-ferent days, and the results across scanning sessions werecomparable. It is important to note, however, that our
FIG. 3. Topography for delayed saccades (right hemisphere of subject S1). A: fMRI time courses in two small ROIs, averaged across repeated scans andcycles. Shading, SE across 10 cycles. Arrows indicate approximate phase shift (see marked locations on color wheel in F). B: fMRI response phases superimposedon a flat map of PPC, for regions with strong (coherence c � 0.2, P 0.0035) responses at the periodicity of cued locations. Identified topographic regions areoutlined in white. C: response phase as a function of distance in the flat map, for the region of interest outlined on the flat map in red. Points, phase values atindividual pixels. Red curve, average phase value as a function of position. Dotted lines, correspondence between “phase reversals” in the flat map and phasereversals in the graph. D: rendering of the right hemisphere gray/white matter boundary in the same subject. Red patch, region corresponding to the flat mapsin B and E. The locations of the intraparietal sulcus (IPS) and transverse occipital sulcus (TOS) are marked. E: flat map of the underlying anatomy for directcomparison to B. Scale bar, 1 cm. F: color map, correspondence between the color coded fMRI response phase and target position in the visual field. UVM: uppervertical meridian, LVM: lower vertical meridian. Numbers correspond to phase values in C.
1376 D. SCHLUPPECK, P. GLIMCHER, AND D. J. HEEGER
J Neurophysiol • VOL 94 • AUGUST 2005 • www.jn.org
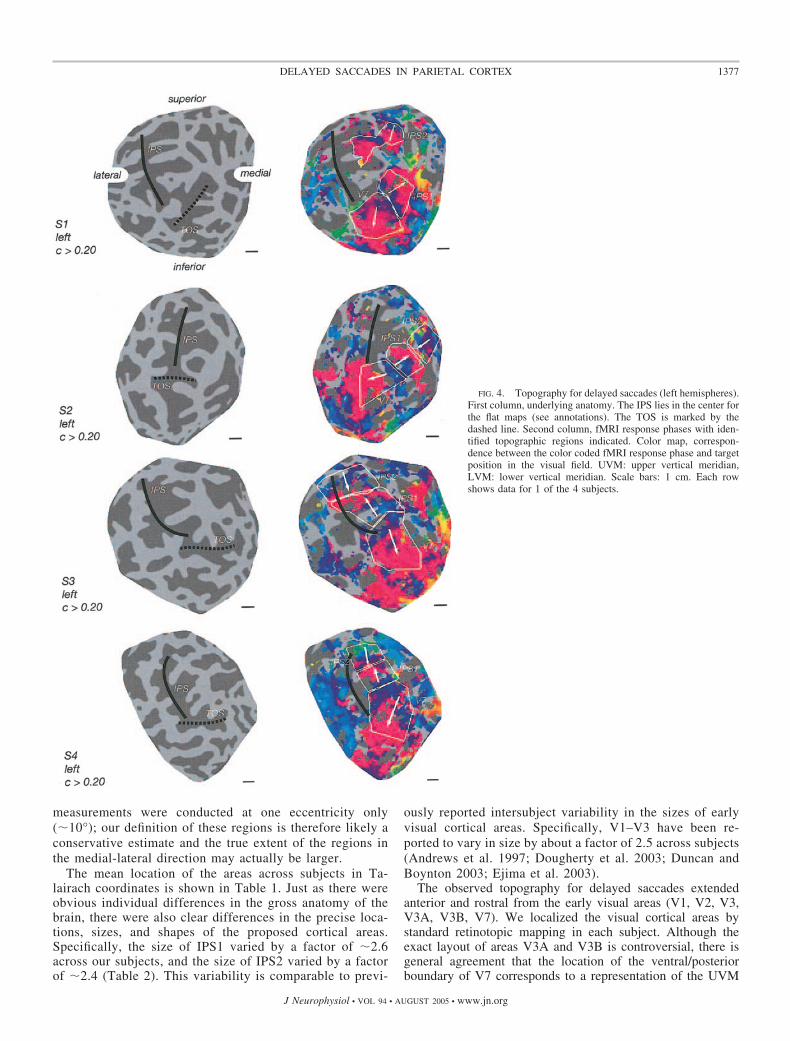
measurements were conducted at one eccentricity only(�10°); our definition of these regions is therefore likely aconservative estimate and the true extent of the regions inthe medial-lateral direction may actually be larger.
The mean location of the areas across subjects in Ta-lairach coordinates is shown in Table 1. Just as there wereobvious individual differences in the gross anatomy of thebrain, there were also clear differences in the precise loca-tions, sizes, and shapes of the proposed cortical areas.Specifically, the size of IPS1 varied by a factor of �2.6across our subjects, and the size of IPS2 varied by a factorof �2.4 (Table 2). This variability is comparable to previ-
ously reported intersubject variability in the sizes of earlyvisual cortical areas. Specifically, V1–V3 have been re-ported to vary in size by about a factor of 2.5 across subjects(Andrews et al. 1997; Dougherty et al. 2003; Duncan andBoynton 2003; Ejima et al. 2003).
The observed topography for delayed saccades extendedanterior and rostral from the early visual areas (V1, V2, V3,V3A, V3B, V7). We localized the visual cortical areas bystandard retinotopic mapping in each subject. Although theexact layout of areas V3A and V3B is controversial, there isgeneral agreement that the location of the ventral/posteriorboundary of V7 corresponds to a representation of the UVM
FIG. 4. Topography for delayed saccades (left hemispheres).First column, underlying anatomy. The IPS lies in the center forthe flat maps (see annotations). The TOS is marked by thedashed line. Second column, fMRI response phases with iden-tified topographic regions indicated. Color map, correspon-dence between the color coded fMRI response phase and targetposition in the visual field. UVM: upper vertical meridian,LVM: lower vertical meridian. Scale bars: 1 cm. Each rowshows data for 1 of the 4 subjects.
1377DELAYED SACCADES IN PARIETAL CORTEX
J Neurophysiol • VOL 94 • AUGUST 2005 • www.jn.org
(Wandell et al. 2004). In every hemisphere, the ventral/poste-rior boundary of V7 as defined by conventional retinotopicmapping coincided precisely with that determined from ourdelayed-saccade experiments. Area V7 is the most rostral/anterior visual area that has been reported consistently fromretinotopic mapping experiments. Wandell et al. (2004) have,however, reported hints of topographic maps extending into theintraparietal sulcus, using standard retinotopic mapping tech-niques. These topographic maps appear to be more easilyvisualized with the delayed-saccade mapping protocol usedhere, although we did not perform a direct comparison (with
the same cycle times, equal numbers of repeated scans, etc.)between the two protocols.
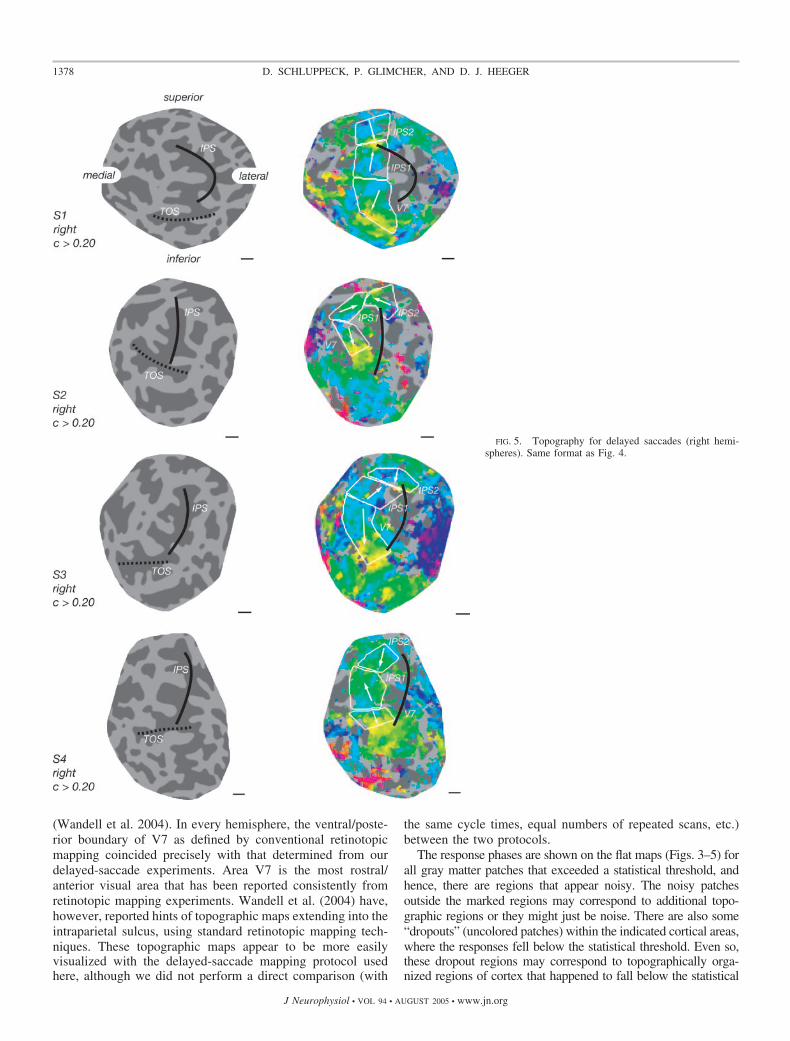
The response phases are shown on the flat maps (Figs. 3–5) forall gray matter patches that exceeded a statistical threshold, andhence, there are regions that appear noisy. The noisy patchesoutside the marked regions may correspond to additional topo-graphic regions or they might just be noise. There are also some“dropouts” (uncolored patches) within the indicated cortical areas,where the responses fell below the statistical threshold. Even so,these dropout regions may correspond to topographically orga-nized regions of cortex that happened to fall below the statistical
FIG. 5. Topography for delayed saccades (right hemi-spheres). Same format as Fig. 4.
1378 D. SCHLUPPECK, P. GLIMCHER, AND D. J. HEEGER
J Neurophysiol • VOL 94 • AUGUST 2005 • www.jn.org

threshold (for any of a number of reasons). We chose a statisticalthreshold of c � 0.2 because it resulted in the most easilyinterpretable maps across subjects. Because of the arbitrariness ofthe statistical thresholds, and to complement the qualitative inter-pretation of the phase reversals in the flat maps, we performedadditional analyses to quantify the lateralization and visual fieldorientations in the proposed areas.
To further illustrate the contralateral bias in the responses,we plotted response coherence as a function of response phase,for each voxel in V7, IPS1, and IPS2 (Fig. 6). Unlike the phasemaps in Figs. 3–5, this analysis included all voxels in each ofthe ROIs that responded (coherence threshold, c � 0.3, P 2.14 � 10�5) during a separate localizer scan in which subjectsalternated between making a series of saccades and holdingfixation (Fig. 8). Voxels the activity of which was highlycorrelated with the periodic experimental design exhibitedfMRI responses with large coherence values. The left and righthemisphere ROIs each covered a complementary range ofresponse phases (� radians). fMRI response phases in the lefthemisphere took on values between 0 and � radians, indicatingthat they were more active during the first half of each cycle ofthe clockwise progression of targets starting at the uppervertical meridian. Conversely, the right hemisphere ROIs ex-hibited response phases between � and 2� radians, indicatingthat they were more active during the second half of the cycle.
The relationship among the measured time courses, under-lying anatomy on the flat maps, and the color scale of thesuperimposed phase values is illustrated in Fig. 3. The smoothprogression of phase on the maps can be illustrated by plottingthe phase value as a function of distance on the flat map (Fig.
FIG. 6. Contralateral response bias. A: distribution of coherence and phasevalues in the IPS. The analysis included all voxels in the PPC that respondedsignificantly (coherence, c � 0.3, P 2.14 � 10�5) in a separate saccadeversus fixation localizer scan. Possible values for phases lie on [0,2�].Coherence values can range between 0 and 1. Left hemisphere fMRI responsephases covered a range of 0 to � radians, corresponding to contralateral targetpresentations. Right hemisphere response phases covered the complementaryrange of values.
FIG. 7. Multiple task components reflected in the fMRI responses. A:example time course for left and right hemisphere IPS1 in subject S2 (mean �SE across cycles). Because targets progressed clockwise, starting at the uppervertical meridian, the right visual field was swept out first. Right hemisphereIPS1 responded more during this period, confirming the contralateral bias inthis region of PPC. B: mean amplitude spectrum of the time courses of allvoxels in IPS1 of subject S2. Note the peaks at 5, 10, and 60 cycles per scan.Five cycles per scan corresponds to the periodicity of the cued location, 10cycles per scan to periodicity of saccades in a particular direction, and 60cycles per scan to each individual trial (12 trials in each of 5 cycles).
TABLE 2. Cortical surface area measurements of parietal regionsV7, IPS1, and IPS2
Region of Interest Surface Area, mm2
V7 1225 � 435IPS1 925 � 235IPS2 902 � 276
To avoid distortions introduced by the flattening procedure, cortical areasizes were measured in the three-dimensional cortical manifold (the boundarybetween gray and white matter) using custom software (Dougherty et al. 2003).Values are means � SD.
1379DELAYED SACCADES IN PARIETAL CORTEX
J Neurophysiol • VOL 94 • AUGUST 2005 • www.jn.org
3, B and C). We defined a large rectangular ROI that includedseveral phase reversals. For each pixel in the ROI, we deter-mined the phase and coherence values and the vertical distancefrom the top edge of the ROI, which was defined as the origin.We found a smooth progression of tightly distributed phasevalues as a function of distance on the map and local maximaand minima in the progression of phase values. This comple-mentary approach confirmed our method for defining topo-graphic areas based on the maps of response phase.
The measured fMRI responses reflected three separate com-ponents of the delayed-saccade task (Fig. 7 ). First, if these IPSregions reflected only topography for delay period activity, wewould have observed responses that modulated only with theperiodicity of the cued locations (54-s period, f � 5 cycles/scanin our experiment). Second, if these regions reflected onlymotor commands for particular saccade directions, we would
have observed a “frequency-doubled” response (27-s period,2f � 10 cycles/scan) because there were two saccades on everytrial. For example, an area of the right hemisphere that re-sponded to only leftward saccades would have responded bothwhen subjects made a saccade to a cued location on the left(followed by a rightward return saccade) and when they madea leftward return saccade (preceded by a saccade to a cuedlocation on the right). Although the cued location movedaround the visual field with a period of 54 s, activity wouldhave modulated with a period of 27 s.1 Third, if these regionsreflected an aspect of the task that occurred on each trial (e.g.,the onset of the distractor annulus, arousal/attention to thetarget flashes regardless of their locations), we would haveobserved responses at the much higher frequency (4.5-s period,12f � 60 cycles/scan) corresponding to the duration of eachtrial. In fact, we observed all three of these components in thetime courses, suggesting that each of these factors contributedto the neural activity in these regions.
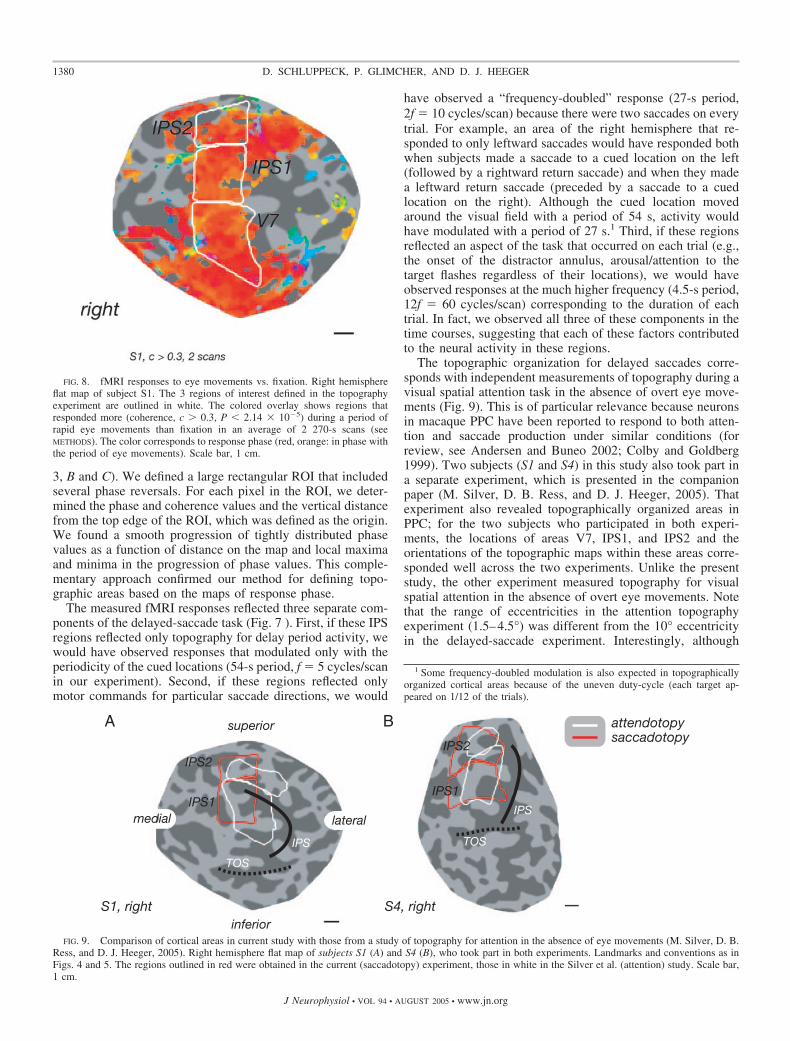
The topographic organization for delayed saccades corre-sponds with independent measurements of topography during avisual spatial attention task in the absence of overt eye move-ments (Fig. 9). This is of particular relevance because neuronsin macaque PPC have been reported to respond to both atten-tion and saccade production under similar conditions (forreview, see Andersen and Buneo 2002; Colby and Goldberg1999). Two subjects (S1 and S4) in this study also took part ina separate experiment, which is presented in the companionpaper (M. Silver, D. B. Ress, and D. J. Heeger, 2005). Thatexperiment also revealed topographically organized areas inPPC; for the two subjects who participated in both experi-ments, the locations of areas V7, IPS1, and IPS2 and theorientations of the topographic maps within these areas corre-sponded well across the two experiments. Unlike the presentstudy, the other experiment measured topography for visualspatial attention in the absence of overt eye movements. Notethat the range of eccentricities in the attention topographyexperiment (1.5–4.5°) was different from the 10° eccentricityin the delayed-saccade experiment. Interestingly, although
1 Some frequency-doubled modulation is also expected in topographicallyorganized cortical areas because of the uneven duty-cycle (each target ap-peared on 1/12 of the trials).
FIG. 8. fMRI responses to eye movements vs. fixation. Right hemisphereflat map of subject S1. The 3 regions of interest defined in the topographyexperiment are outlined in white. The colored overlay shows regions thatresponded more (coherence, c � 0.3, P 2.14 � 10�5) during a period ofrapid eye movements than fixation in an average of 2 270-s scans (seeMETHODS). The color corresponds to response phase (red, orange: in phase withthe period of eye movements). Scale bar, 1 cm.
FIG. 9. Comparison of cortical areas in current study with those from a study of topography for attention in the absence of eye movements (M. Silver, D. B.Ress, and D. J. Heeger, 2005). Right hemisphere flat map of subjects S1 (A) and S4 (B), who took part in both experiments. Landmarks and conventions as inFigs. 4 and 5. The regions outlined in red were obtained in the current (saccadotopy) experiment, those in white in the Silver et al. (attention) study. Scale bar,1 cm.
1380 D. SCHLUPPECK, P. GLIMCHER, AND D. J. HEEGER
J Neurophysiol • VOL 94 • AUGUST 2005 • www.jn.org

there was generally a good correspondence between the topo-graphic maps revealed by these two experiments, there was abias in the location of attention topography to more lateralpositions on the cortical surface. It is therefore possible that theIPS regions map eccentricity in the medial-lateral directionwith foveal locations being represented more laterally on thecortical surface in and near the IPS.
D I S C U S S I O N
PPC has been implicated in sensory attention, motor inten-tion, decision making, and working memory. In extensivesingle-unit work during the last two decades, it has beenestablished that there are several distinct subregions in PPC innon-human primates, although their individual functions re-main a subject of hot debate. Decades of research in visualcortex have taught us that there is little hope of understandingthe function of these cortical areas without first having precise,routine, and reliable methods for defining them. This is self-evident from an experimental point of view; one must beconfident about performing the same measurement repeatedlyin the same bit of cortical tissue for the necessary replicationsand controls. Cortical areas are defined using a variety ofmethods and a confluence of factors. One of the factors istopography, which refers to the orderly layout of informationacross a cortical area.
Here, we used the methodology introduced by Sereno et al.to measure the topography of delayed saccades in human PPC.We observed at least two phase reversals beyond the V3A/V7vertical meridian representation, signaling boundaries betweentwo adjacent cortical areas in IPS, which we tentatively refer toas IPS1 and IPS2. Wandell et al. (2004) report activity inposterior parietal cortex in standard retinotopy experiments,albeit weaker than the responses in early visual areas. Thissuggests that the topographic organization that we have foundwith delayed saccades might be revealed using standard reti-notopic mapping, by averaging across a sufficient number ofrepeated scans.
There are possible alternative interpretations of our results(Fig. 10). There is no doubt that there is a phase reversalseparating V7 from what we labeled IPS1 and another reversalseparating IPS1 from what we labeled IPS2, but we leave open
the possibility that IPS1 and IPS2 might be further subdivided.One possible alternative interpretation would subdivide thesame region of cortex into two quarter-field representations(1a/b, Fig. 10) and two hemifield representations (2a/b, Fig.10). The subdivision we suggest is more parsimonious for thefollowing reasons: 1) the IPS1/2 division appears in all hemi-spheres in this and the companion study (M. Silver, D. B. Ress,and D. J. Heeger, 2005). 2) With our delineation, the sizes ofIPS1/2 roughly match that of V7. The quarter-field represen-tations would be substantially smaller. And 3) in the alternative(quarter-field) model, the sizes of the cortical areas are close tothe limits of spatial accuracy imposed by our measurements.Hence, further measurements would have to be performed withsmaller voxels to assess the plausibility of this alternative.
The IPS1 and IPS2 regions we report here are distinct fromthe area previously proposed Sereno et al. as the humanhomologue of macaque LIP. The locations of IPS1 and IPS2are more posterior (closer to V7 and other retinotopic visualareas) than their reported Talairach coordinates. The mean(Euclidean) distance from the locus reported by Sereno et al. toour area V7 is 30 mm, to IPS1 16 mm, and to IPS2 9 mm (seeMETHODS). Further, the more anterior IPS2 region had a visualfield orientation that was opposite to that reported by Sereno etal. (2001). They reported a topographic map that represented awhole hemifield from lower to upper vertical meridia rostrallyacross the cortical surface. We found exactly the opposite inIPS2, a mapping of upper to lower visual meridia in the rostraldirection on the cortical surface. It is possible that the areadescribed by Sereno et al. lies just rostral to IPS2, with visualfield sign opposite to that of IPS2 (consistent with the visualfield sign reported by Sereno et al.). If this is correct, however,then our measurements failed to reveal it consistently.
One further notable difference between the results presentedhere and those of Sereno et al. relates to the time courses of themeasured fMRI responses. We observed “frequency-doubled”responses corresponding to the two saccades on each trial (first,a saccade out to the cued location followed by a return saccadeto central fixation), suggesting that these cortical areas reflectmotor commands. Sereno et al. (2001) did not observe such afrequency-doubled response in the area they proposed as hu-man LIP. The interpretation they offered is that the activity in
FIG. 10. Alternative area boundaries for topographic maps. A: same map as in Fig. 3B but with alternative visual field delineations. V7 is smaller, areas 1aand 1b represent a quarter field each, areas 2a and 2b a hemifield each. B: phase values as a function of distance on cortical surface. C: color map (cf. Fig. 3,C and F).
1381DELAYED SACCADES IN PARIETAL CORTEX
J Neurophysiol • VOL 94 • AUGUST 2005 • www.jn.org
that area was not primarily related to the saccades themselvesbut rather that it was dominated by the delay-period activitypreceding the first saccade on each trial. Unlike Sereno et al.,we also observed responses at the much higher frequency(4.5-s period, 60 cycles/scan) corresponding to the duration ofeach trial. However, neither the frequency-doubled responsesnor the higher frequency exhibited a topographic organizationthat was consistent across subjects. This suggests that theneurons in these cortical areas may be topographically orga-nized, not with respect to the direction of the executed move-ment per se but rather with respect to factors that covary withthe location of the cue. For example, the position of the eye inthe orbit, the desirability of a saccade, or the allocation ofattention during the delay period could all contribute to thistopographically organized activity.
There are purely methodological reasons for why the patternof responses seen by Sereno et al. differ from those reportedhere. Our data were collected at 3T using an occipital surfacecoil with four receive channels, whereas they used a 1.5Tscanner. The resulting improvement in signal-to-noise ratiomay have helped to reveal the topographic maps more clearlyin occipital and posterior parietal cortex. Further methodolog-ical differences with the previous study were voxel size (Ser-eno et al. 2001: 3 � 3 � 4 mm3; this study: 3 � 3 � 3 mm3),acquisition time (Sereno et al. 2001: 4 s; this study 1.5 s), andthe software we used for gray/white matter segmentation,inflation, and flattening.
Several other groups have recently presented preliminaryresults that showed hints of topographic organization in pos-terior parietal cortex, although none of them reported twocomplete hemifield representations (as we found). Nor did theyreport the pattern observed by Sereno et al. (DeSimone et al.2004; Huddleston and DeYoe 2004; Jack et al. 2004).
Our results are consistent with the interpretation that thetopography in the IPS may be due to a relatively small biastoward contralateral responses in neurons that respond primar-ily bilaterally. It is important to note that our subjects per-formed between 720 and 1,440 saccades across several scan-ning sessions to yield the resulting topographic maps. Incomparison, we obtained similar levels of statistical signifi-cance in about 1/10 of the time when subjects alternatedbetween rapid eye movements and fixation (Fig. 8), a protocolthat evoked strong responses but with no means for assessingtopography. The weak topographic specificity that we observedin PPC might be caused by at least two factors. First, theseareas might have precise topographic organization but largeand broadly tuned response fields. Neurons with large responsefields would be active through most of each cycle of theexperiment, regardless of their topographic organization, evok-ing only weak response modulations. Second, the responsefields might be small but poorly organized topographically. Ifa single voxel includes neurons with a number of differentresponse field locations, spanning a large part of the visualfield, then this would again yield only weak response modu-lations. Of course, the response fields might be both large andpoorly organized because these two possibilities are not mu-tually exclusive. Either or both would suggest that the topo-graphically organized component of the responses is superim-posed on a background of bilateral activity. Consistent withthis interpretation, previous fMRI measurements have reportedonly weak, if any, lateralization in many regions of PPC
(Brown et al. 2004; Konen et al. 2004; Koyama et al. 2004;Simon et al. 2004).
The observation that these human IPS regions appear to haveat least weak topographic organization is of particular interestbecause studies of this issue have yielded mixed results inmonkeys. There are some reports that monkey LIP neurons aretopographically organized, i.e., that each neuron has a responsefield that corresponds to a particular location in visual spaceand that there is an orderly layout of these response fieldlocations across the cortical surface. Anecdotally, most re-searchers who have examined receptive field or movementfield organization in macaque LIP have reported that as elec-trodes are advanced tangentially to the cortical surface thelocations of sequentially encountered response field centersprogress gradually through the visual/motor field. Most, how-ever, also report occasional abrupt discontinuities in this pro-gression within the anatomical boundaries of LIP. This has ledto uncertainty about the topographic organization of LIP.
To explore this issue, Blatt et al. (1990) mapped the visualfield locations that activated LIP neurons using classical visualstimuli consisting mostly of light bars. Their experiments wereconducted in anesthetized animals. They reported that neuronsin LIP preferentially represented locations in the contralateralvisual field; a result commensurate with our findings here. Astudy by Ben Hamed et al. (2001) reported data from 171 LIPneurons in awake behaving rhesus monkeys performing apassive fixation task. They concluded that there exists a coarsebut systematic topographic map in LIP of visual stimuluslocations with a gradient from lower to upper visual fieldrepresented anterior to posterior (the opposite mapping of IPS1reported here; the same as IPS2). Platt and Glimcher (1997),however, examined the response fields of 100 LIP in awakebehaving animals performing a saccade task and reported thatLIP was not biased to represent the contralateral visual ormotor field. Their study used an experimental protocol that wasthe most similar to ours.
Adding to this complexity is the observation that neurons inLIP are also modulated by the position of the eye in the orbit(Andersen et al. 1985, 1990b; Snyder et al. 1998; Stricanne etal. 1996). Saccades of the same amplitude and direction initi-ated from different starting positions in the orbit give rise todifferent activity in the same neuron. Although the precisestructure of this position dependent response, the gain field, isunknown, this must also be considered in interpreting ourfMRI data. When in our experiment subjects made saccadesfrom an eccentric target at an angle of 45° back to fixation andfrom fixation to a 225° target, they produced the same saccadeamplitude and direction but from different orbital positions.Hence these two saccades would be expected to influence theactivity of LIP neurons differently. Because we do not knowthe topographic organization of the gain field properties, evenin the monkey, some of the responses we observed may havebeen due to gain field organization. Consistent with this pos-sibility, we observed topographic organization only for theperiodicity of the cued locations, not with respect to movementdirection. Note, however, that movement direction is the prop-erty most often examined in single-unit electrophysiology.
There is now widespread agreement that the intraparietalsulcus of the macaque is lined with a series of separate anddistinct cortical areas. Both anatomical studies and physiolog-ical studies attest to this fact. Medial to area LIP, for example,
1382 D. SCHLUPPECK, P. GLIMCHER, AND D. J. HEEGER
J Neurophysiol • VOL 94 • AUGUST 2005 • www.jn.org
lies the anatomically defined area MIP which corresponds tothe physiologically defined parietal reach region (PRR). Theresults from IPS1 and IPS2 in this study contribute to thisdebate in an interesting way. It is possible that one of the IPSareas reported here corresponds to macaque LIP and the otherto MIP/PRR.
Although MIP/PRR was initially believed to be a saccade-related area, Snyder et al. (2000) demonstrated that this area isinvolved in the control of reaching movements by the fore-limbs. The initial confusion about the function of this regionstems, at least in part, from the observation that during saccadictasks, when no arm movement is required, neurons in this areashow LIP-like responses. When, however, arm movements arerequired as well in more complex tasks, these neurons almostinvariably covary with arm rather than eye movements. Thesedata have led to the suggestion that PRR neurons are activatedduring purely saccadic tasks because eye and arm movementsare often made in concert. Indeed, many of the areas lining themonkey IPS may be similar. Areas for hand shaping, reaching,lip movement, and eye movement may all be heavily intercon-nected and correlated in their activity.
These intercorrelations between representations of eye andlimb movements may also bear on the topographic organiza-tion of these areas. In the monkey, for example, neurons inMIP/PRR appear to encode the locations of reaching targetswith respect to fixation, a framework known as oculocentriccoordinates. There also appears to be lateralization in this areawith regard to effector; movements of the right arm seem to bepreferentially represented in the left PRR. fMRI studies ofhumans, however, have been controversial in this regard.Connolly et al. (2002) reported an area that they proposed ishomologous to PRR in the human, but there was no clearevidence for topography or lateralization of any kind in theirdata. In contrast, Medendorp et al. (2004) have recently re-ported a possible homologue for PRR that does show lateral-ization with regard to effector.
Another possible interpretation of our results rests on thepossible subdivision of macaque LIP into more than onetopographic map. The occasional discontinuities in the LIPtopography observed by monkey physiologists, and the seg-mentation into ventral (LIPv) and dorsal (LIPd) subareas thathas been observed anatomically (Ben Hamed et al. 2001;Lewis and Van Essen 2000) may in fact correspond to thesubdivisions in human PPC that we found with fMRI.
All three regions of interest in this study (V7, IPS1, andIPS2) showed a similar topographic organization, similar re-sponses to contraversive saccades, and similar responses at thefrequency of individual trials. These regions are thereforeindistinguishable—functionally—in the current experiment.Any conclusion about possible functional homologies betweenthese areas and macaque LIP are therefore not warranted.Further experiments are needed to establish which of theseareas might correspond to the various regions in macaque PPC.Of particular importance will be to establish whether thesehuman cortical areas exhibit the defining physiological featuresof monkey LIP, namely: responses to visual stimuli, activitybefore saccadic eye movements, sustained delay-period activ-ity, and sensitivity to reward magnitude and probability.
A C K N O W L E D G M E N T S
We thank J. Larsson and M. Silver for helpful discussion and comments onthe manuscript.
G R A N T S
This research was supported by National Eye Institute Grant R01-EY-11794 and by a grant from the Seaver Foundation.
R E F E R E N C E S
Aguirre GK, Zarahn E, and D’Esposito M. Empircal analysis of BOLDfMRI statistics. II. Spatially smoothed data collected under null-hypothesisand experimental conditions. Neuroimage 5: 199–212, 1997.
Andersen RA, Asanuma C, Essick G, and Siegel RM. Cortico-corticalconnections of anatomically and physiologically defined subdivisions withinthe inferior parietal lobule. J Comp Neurol 296: 65–113, 1990a.
Andersen RA, Bracewell RM, Barash S, Gnadt JW, and Fogassi L. Eyeposition effects on visual, memory, and saccade-related activity in areas LIPand 7a of macaque. J Neurosci 10: 1176–1196, 1990b.
Andersen RA and Buneo CA. Intentional maps in posterior parietal cortex.Annu Rev Neurosci 25: 189–220, 2002.
Andersen RA, Essick GK, and Siegel RM. Encoding of spatial location byposterior parietal neurons. Science 230: 456–458, 1985.
Andrews TJ, Halpern SD, and Purves D. Correlated size variations in humanvisual cortex, lateral geniculate nucleus, and optic tract. J Neurosci 17:2859–2868, 1997.
Astafiev SV, Shulman GL, Stanley CM, Snyder AZ, Van Essen DC, andCorbetta M. Functional organization of human intraparietal and frontalcortex for attending, looking, and pointing. J Neurosci 23: 4689–4699,2003.
Ben Hamed S, Duhamel JR, Bremmer F, and Graf W. Representation ofthe visual field in the lateral intraparietal area of macaque monkeys: aquantitative receptive field analysis. Exp Brain Res 140: 127–144, 2001.
Biswal B, Hudetz AG, Yetkin FZ, Haughton VM, and Hyde JS. Hyper-capnia reversibly suppresses low-frequency fluctuations in the human motorcortex during rest using echoplanar MRI. J Cereb Blood Flow Metab 17:301–308, 1997a.
Biswal BB, Van Kylen J, and Hyde JS. Simultaneous assessment of flow andbold signals in resting-state functional connectivity maps. NMR Biomed 10:165–170, 1997b.
Biswal B, Yetkin FZ, Haughton VM, and Hyde JS. Functional connectivityin the motor cortex of resting human brain using echoplanar MRI. MagnReson Med 341: 537–541, 1995.
Blatt GJ, Andersen RA, and Stoner GR. Visual receptive field organizationand cortico-cortical connections of the lateral intraparietal area (area LIP) inthe macaque. J Comp Neurol 299: 421–445, 1990.
Brown MRG, DeSouza JFX, Goltz HC, Ford K, Menon RS, Goodale MA,and Everling S. Comparison of memory and visually guided saccades usingeventrelated fMRI. J Neurophysiol 91: 873–889, 2004.
Colby CL and Duhamel JR. Heterogeneity of extrastriate visual areas andmultiple parietal areas in the macaque monkey. Neuropsychologia 29:517–537, 1991.
Colby CL and Goldberg ME. Space and attention in parietal cortex. AnnuRev Neurosci 22: 319–349, 1999.
Connolly JD, Goodale MA, Menon RS, and Munoz DP. Human fMRIevidence for the neural correlates of preparatory set. Nat Neurosci 5:1345–1352, 2002.
Curtis CE, Rao VY, and D’Esposito M. Maintenance of spatial and motorcodes during oculomotor delayed response tasks. J Neurosci 24: 3944–3952, 2004.
DeSimone K, Schneider, K, Pinsk, M, Norman, K, and Kastner, S.Response properties of a putative LIP area in human parietal cortex. SocNeurosci Abstr 751.16, 2004.
DeYoe EA, Carman GJ, Bandettini P, Glickman S, Wieser J, Cox R,Miller D, and Neitz J. Mapping striate and extrastriate visual areas inhuman cerebral cortex. Proc Natl Acad Sci USA 93: 2382–2386, 1996.
Dorris MC and Glimcher PW. Activity in posterior parietal cortex iscorrelated with the relative subjective desirability of action. Neuron 44:365–378, 2004.
Dougherty RF, Koch VM, Brewer AA, Fischer B, Modersitzki J, andWandell BA. Visual field representations and locations of visual areasV1/2/3 in human visual cortex. J Vis 3: 586–598, 2003.
1383DELAYED SACCADES IN PARIETAL CORTEX
J Neurophysiol • VOL 94 • AUGUST 2005 • www.jn.org

Duhamel JR, Colby CL, and Goldberg ME. The updating of the represen-tation of visual space in parietal cortex by intended eye movements. Science255: 90–92, 1992.
Duncan RO and Boynton GM. Cortical magnification within human primaryvisual cortex correlates with acuity thresholds. Neuron 38: 659–671, 2003.
Ejima Y, Takahashi S, Yamamoto H, Fukunaga M, Tanaka C, Ebisu T,and Umeda M. Interindividual and interspecies variations of the extrastriatevisual cortex. Neuroreport 14: 1579–1583, 2003.
Engel SA, Glover GH, and Wandell BA. Retinotopic organization in humanvisual cortex and the spatial precision of functional MRI. Cereb Cortex 7:181–192, 1997.
Engel SA, Rumelhart DE, Wandell BA, Lee AT, Glover GH, ChichilniskyEJ, and Shadlen MN. fMRI of human visual cortex. Nature 369: 525, 1994.
Glimcher PW. The neurobiology of visual-saccadic decision making. AnnuRev Neurosci 26: 133–179, 2003
Goldberg ME, Bisley J, Powell KD, Gottlieb J, and Kusunoki M. The roleof the lateral intraparietal area of the monkey in the generation of saccadesand visuospatial attention. Ann NY Acad Sci 956: 205–215, 2002.
Huddleston W and DeYoe E. Behavioral modulation of visuospatial attentionmaps in human parietal cortex. Soc Neurosci Abstr 709.8, 2004.
Jack A, Patel G, Astafiev S, Snyder A, McAvoy M, Shulman G, andCorbetta M. Retinotopic specificity in human parietal, temporal and frontalcortices. Soc Neurosci Abstr 717.3, 2004.
Jenkinson M, Bannister P, Brady J, and Smith S. Improved optimisation forthe robust and accurate linear registration and motion correction of brainimages. NeuroImage 17: 825–841, 2002.
Konen CS, Kleiser R, Wittsack HJ, Bremmer F, and Seitz RJ. Theencoding of saccadic eye movements within human posterior parietal cortex.Neuroimage 22: 304–314, 2004.
Koyama M, Hasegawa I, Osada T, Adachi Y, Nakahara K, and MiyashitaY. Functional magnetic resonance imaging of macaque monkeys performingvisually guided saccade tasks: comparison of cortical eye fields with hu-mans. Neuron 41: 795–807, 2004.
Kusunoki M, Gottlieb J, and Goldberg ME. The lateral intraparietal area asa salience map: the representation of abrupt onset, stimulus motion, and taskrelevance. Vision Res 40: 1459–1468, 2000.
Larsson J. Imaging Vision: Functional Mapping of Intermediate Visual Processesin Man (PhD thesis). Stockholm, Sweden: Karolinska Institutet, 2001.
Lewis JW and Van Essen DC. Mapping of architectonic subdivisions in themacaque monkey with emphasis on parieto-occipital cortex. J Comp Neurol428: 79–111, 2000.
Medendorp W, Goltz HC, Crawford JD, and Vilis T. Integration of targetand effector information in human posterior parietal cortex for the planningof action. J Neurophysiol 93: 954–962, 2004.
Merriam EP, Genovese CR, and Colby CL. Spatial updating in humanparietal cortex. Neuron 39: 361–373, 2003.
Mountcastle VB, Lynch JC, Georgopoulos A, Sakata H, and Acuna C.Posterior parietal association cortex of the monkey: command functions foroperations within extrapersonal space. J Neurophysiol 38: 871–908, 1975.
Nestares O and Heeger DJ. Robust multiresolution alignment of MRI brainvolumes. Magn Reson Med 43: 705–715, 2000.
Platt ML and Glimcher PW. Responses of intraparietal neurons to saccadictargets and visual distractors. J Neurophysiol 78: 1574–1589, 1997.
Platt ML and Glimcher PW. Neural correlates of decision variables inparietal cortex. Nature 400: 233–238, 1999.
Press WA, Brewer AA, Dougherty RF, Wade AR, and Wandell BA. Visualareas and spatial summation in human visual cortex. Vision Res 41: 1321–1332, 2001.
Purdon P and Weisskoff R. Effect of temporal autocorrelation due tophysiological noise and stimulus paradigm on voxel-level false-positiverates in fMRI. Hum Brain Mapp 61: 239–249, 1998.
Robinson DL, Goldberg ME, and Stanton GB. Parietal association cortex inthe primate: sensory mechanisms and behavioral modulations. J Neuro-physiol 41: 910–932, 1978.
Roitman JD and Shadlen MN. Response of neurons in the lateral intraparietalarea during a combined visual discrimination reaction time task. J Neurosci22: 9475–9489, 2002.
Schluppeck, D, Muller, J, Sayres, R, Glimcher, P, and Heeger, D. Topo-graphic organization for delayed saccades in human posterior parietalcortex. Soc Neurosci Abstr 991.7, 2004.
Sereno MI, Dale AM, Reppas JB, Kwong KK, Belliveau JW, Brady TJ,Rosen BR, and Tootell RB. Borders of multiple visual areas in humansrevealed by functional magnetic resonance imaging. Science 268: 889–893,1995.
Sereno MI, Pitzalis S, and Martinez A. Mapping of contralateral space inretinotopic coordinates by a parietal cortical area in humans. Science 294:1350–1354, 2001.
Shadlen MN and Newsome WT. Motion perception: seeing and deciding.Proc Natl Acad Sci USA 93: 628–633, 1996.
Silver MA, Ress D, and Heeger DJ. Topographic maps of visual spatialattention in human parietal cortex. J Neurophysiol 94: 1357–1370,2005.
Simon O, Mangin JF, Cohen L, Le Bihan D, and Dehaene S. Topographicallayout of hand, eye, calculation, and language related areas in the humanparietal lobe. Neuron 33: 475–487, 2004.
Smith AM, Lewis BK, Ruttimann UE, Ye FQ, Sinnwell TM, Yang Y,Duyn JH, and Frank JA. Investigation of low frequency drift in fMRIsignal. Neuroimage 93: 526–533, 1999.
Smith S. Fast robust automated brain extraction. Hum Brain Mapp 17:143–155, 2002.
Snyder LH. Coordinate transformations for eye and arm movements in thebrain. Curr Opin Neurobiol 10: 747–754, 2000.
Snyder LH, Batista AP, and Andersen RA. Saccade-related activity in theparietal reach region. J Neurophysiol 83: 1099–1102, 2000.
Snyder LH, Grieve KL, Brotchie P, and Andersen RA. Separate body andworld-referenced representations of visual space in parietal cortex. Nature394: 887–191, 1998.
Sokal RR and Rohlf FJ. Biometry: The Principles and Practice of Statisticsin Biological Research (3rd ed.). NewYork: Freeman, 1995.
Stricanne B, Andersen RA, and Mazzoni P. Eye centered, head centered,and intermediate coding of remembered sound locations in area lip. J Neu-rophysiol 76: 2071–2076, 1996.
Talairach J and Tournoux P. Co-Planar Stereotaxic Atlas of the HumanBrain. Thieme Medical Publishers, New York. 1988.
Wandell BA, Brewer AA, and Dougherty RF. Visual field map clusters inhuman cortex. Phil Trans R Soc B 360: 1628, 2005.
Woolrich MW, Ripley BD, Brady M, and Smith SM. Temporal autocorre-lation in univariate linear modeling of FMRI data. Neuroimage 14: 1370–1386, 2001.
Zarahn E, Aguirre GK, and D’Esposito M. Empircal analysis fo BOLDfMRI statistics I. spatially unsmoothed data collected under null hypothesisconditions. Neuroimage 5: 179–197, 1997.
1384 D. SCHLUPPECK, P. GLIMCHER, AND D. J. HEEGER
J Neurophysiol • VOL 94 • AUGUST 2005 • www.jn.org