Embed Size (px)
Citation preview
MATERIALS ENGINEERING
SME 3623
Dr. Norhayati AhmadDepartment of Materials Engineering
Faculty of Mechanical Engineering,
Universiti Teknologi Malaysia.
WWII Liberty Ships fracture into two halves
E-mail: [email protected]
http:[email protected]
Hp: 019-7785102
Off: 07-5534666
Room : C23-419
Topic/content
1. Introduction
2. Metal fracture
3. Metal creep
4. Metal fatigue
5. Metal wear
6. Corrosion
7. Polymer
8. Ceramic
9. Composite
10. Materials selection and case studies
Why study ?
� An engineer ~ will be exposed to a design problem involving materials
� properties required
� deterioration during service
� cost
� Knowledge needed
� materials characteristics
� Structure – property relationship
� Processing techniques
By the end of this course :
Able to :
1) explain, analyse and differentiate the failure mechanisms (fracture, creep, fatigue, corrosion) of materials
2) Apply the theory of fracture mechanics in failure analysis
3) Relate structure, properties and processing of non metallic materials (polymer, ceramic, composite)

References:
• Callister W.D., Materials Science and Engineering – An introduction, 7th edition, Wiley, 2007.
•Smith W.F., Foundation of Materials Science and Engineering, 4th edition, McGraw Hill, 2006.
•Fontana M.G., Corrosion Engineering, 3rd
edition, McGraw Hill, 1991.
•Dieter G.E., Mechanical Metallurgy, 3rd
edition, 1991.
Assessment
• 2x Test = 40%• Assignment = 20%
• Final Exam = 40%
• Attendance : ≥ 80%
1.1 REVIEW OF MATERIALS PROPERTIES
Properties are the way the material responds to the environment
and external forces
Mechanical Properties : response to mechanical forces, such as
Strength
Toughness
Hardness
Ductility
Elasticity
Fatigue,
Creep…etc
Physical Properties → Density, melting point,, …etc
Electrical & MagneticProperties →e.g conductivity
Thermal Properties →e.g thermal expansion
Optical Properties → absorption, transmission and scattering of light
Chemical Properties → corrosion resistance such as oxidation,
corrosion, materials composition
-Strength : Ability to support load tension, compression,shear
-Hardness : Resistance to penetration/ scratches
-Toughness : Ability to resist impact force.
-Ductility: Ability to change shape. Opposed to brittleness

Type of loading
10
• Simple tension: cable
τ
Note: τ = M/AcR here.
Common States of Stress
Ao = cross sectional
area (when unloaded)
FF
o
σ =F
A
o
τ =Fs
A
σσ
M
M Ao
2R
FsAc
• Torsion (a form of shear): drive shaftSki lift (photo courtesy
P.M. Anderson)
11
(photo courtesy P.M. Anderson)Canyon Bridge, Los Alamos, NM
o
σ =F
A
• Simple compression:
Note: compressive
structure member(σ < 0 here).(photo courtesy P.M. Anderson)
OTHER COMMON STRESS STATES (1)
Ao
Balanced Rock, Arches National Park
12
Stress-Strain Testing
• Typical tensile test
machine
Adapted from Fig. 6.3, Callister 7e. (Fig. 6.3 is taken from H.W. Hayden, W.G. Moffatt, and J. Wulff, The Structure and Properties of
Materials, Vol. III, Mechanical Behavior, p. 2, John Wiley and Sons, New York, 1965.)
specimenextensometer
• Typical tensile
specimen
Adapted from Fig. 6.2,
Callister 7e.
gauge length

13
Linear Elastic Properties
• Modulus of Elasticity, E:
(also known as Young's modulus)
• Hooke's Law:
σ = E ε σ
Linear-
elastic
E
ε
F
Fsimple tension test
14
Metals
Alloys
GraphiteCeramics
Semicond
PolymersComposites
/fibers
E(GPa)
Based on data in Table B2,
Callister 7e.Composite data based on
reinforced epoxy with 60 vol%
of aligned
carbon (CFRE),
aramid (AFRE), orglass (GFRE)
fibers.
Young’s Moduli: Comparison
109 Pa
0.2
8
0.6
1
Magnesium,
Aluminum
Platinum
Silver, Gold
Tantalum
Zinc, Ti
Steel, Ni
Molybdenum
Graphite
Si crystal
Glass -soda
Concrete
Si nitrideAl oxide
PC
Wood( grain)
AFRE( fibers) *
CFRE*
GFRE*
Glass fibers only
Carbon fibers only
Aramid fibers only
Epoxy only
0.4
0.8
2
4
6
10
20
40
6080
100
200
600800
10001200
400
Tin
Cu alloys
Tungsten
<100>
<111>
Si carbide
Diamond
PTFE
HDPE
LDPE
PP
Polyester
PSPET
CFRE( fibers) *
GFRE( fibers)*
GFRE(|| fibers)*
AFRE(|| fibers)*
CFRE(|| fibers)*
15
Tensile Strength, TS
• Metals: occurs when noticeable necking starts.
• Polymers: occurs when polymer backbone chains arealigned and about to break.
Adapted from Fig. 6.11, Callister 7e.
σσσσy
strain
Typical response of a metal
F = fracture or
ultimate
strength
Neck – acts as stress
concentrator
en
gin
ee
rin
g
TS
str
ess
engineering strain
• Maximum stress on engineering stress-strain curve.
16
Tensile Strength : Comparison
Si crystal<100>
Graphite/ Ceramics/ Semicond
Metals/ Alloys
Composites/ fibers
Polymers
Te
nsile
str
en
gth
, T
S(M
Pa
)
PVC
Nylon 6,6
10
100
200
300
1000
Al (6061) a
Al (6061) ag
Cu (71500) hr
Ta (pure)Ti (pure) a
Steel (1020)
Steel (4140) a
Steel (4140) qt
Ti (5Al-2.5Sn) aW (pure)
Cu (71500) cw
LDPE
PP
PC PET
20
3040
2000
3000
5000
Graphite
Al oxide
Concrete
Diamond
Glass-soda
Si nitride
HDPE
wood ( fiber)
wood(|| fiber)
1
GFRE(|| fiber)
GFRE( fiber)
CFRE(|| fiber)
CFRE( fiber)
AFRE(|| fiber)
AFRE( fiber)
E-glass fib
C fibersAramid fib
Room Temp. values
Based on data in Table B4,
Callister 7e.a = annealed
hr = hot rolled
ag = aged
cd = cold drawn
cw = cold workedqt = quenched & tempered
AFRE, GFRE, & CFRE =
aramid, glass, & carbon
fiber-reinforced epoxy
composites, with 60 vol%fibers.

17
• Plastic tensile strain at failure:
Adapted from Fig. 6.13,
Callister 7e.
Ductility
• Another ductility measure: 100xA
AARA%
o
fo-
=
x 100L
LLEL%
o
of−
=
Engineering tensile strain, ε
Engineeringtensile stress, σ
smaller %EL
larger %ELLf
AoAf
Lo
18
• Energy to break a unit volume of material
• Approximate by the area under the stress-strain
curve.
Toughness
Brittle fracture: elastic energy
Ductile fracture: elastic + plastic energy
very small toughness (unreinforced polymers)
Engineering tensile strain, ε
Engineeringtensile stress, σ
small toughness (ceramics)
large toughness (metals)
Adapted from Fig. 6.13,
Callister 7e.
19
Hardness• Resistance to permanently indenting the surface.
• Large hardness means:
--resistance to plastic deformation or cracking in
compression.--better wear properties.
e.g., 10 mm sphere
apply known force measure size of indent after removing load
dDSmaller indents mean larger hardness.
increasing hardness
most plastics
brasses Al alloys
easy to machine steels file hard
cutting tools
nitridedsteels diamond
20
Hardness: Measurement
Table 6.5

21
True Stress & StrainNote: S.A. (cross-sectional area) changes when sample
stretched
• True stress
• True Strain
iT AF=σ
( )oiT λλln=ε
( )( )ε+=ε
ε+σ=σ
1ln
1
T
T
Adapted from Fig. 6.16, Callister 7e.
22
• Design uncertainties mean we do not push the limit.
• Factor of safety, N
N
y
working
σ=σ
Often N isbetween1.2 and 4
• Example: Calculate a diameter, d, to ensure that yield does
not occur in the 1045 carbon steel rod below. Use a
factor of safety of 5.
Design or Safety Factors
( )4
0002202 /d
N,
π
5
N
y
working
σ=σ 1045 plain
carbon steel: σy = 310 MPa
TS = 565 MPa
F = 220,000N
d
L o
d = 0.067 m = 6.7 cm
Strengthening Mechanism of
Metals
24
Dislocation Motion
• Dislocation motion is analogous to the locomotion of a caterpillar.
• Caterpillar moves by repeated lifting and shifting of leg pairs.
Strength is linked to dislocation mobility
If dislocation mobility is easy, low forces will lead to easy movement

25
Dislocations & plastic deformation
• Cubic & hexagonal metals - plastic deformation by plastic shear or slip where one plane of atoms slides over adjacent plane by defect motion (dislocations).
• If dislocations don't move,
deformation doesn't occur!Adapted from Fig. 7.1,
Callister 7e.26
• Dislocation moves along slip plane in slip directionperpendicular to dislocation line
• Slip direction same direction as Burgers vector
Edge dislocation
Screw dislocation
Adapted from Fig. 7.2, Callister 7e.
27
Slip System– Slip plane - plane allowing easiest slippage
• Wide interplanar spacings - highest planar densities
– Slip direction - direction of movement - Highest linear
densities
– FCC Slip occurs on {111} planes (close-packed) in <110> directions (close-packed)
=> total of 12 slip systems in FCC
– in BCC & HCP other slip systems occur
Deformation Mechanisms
Adapted from Fig.
7.6, Callister 7e.
28
Deformation MechanismsSlip System
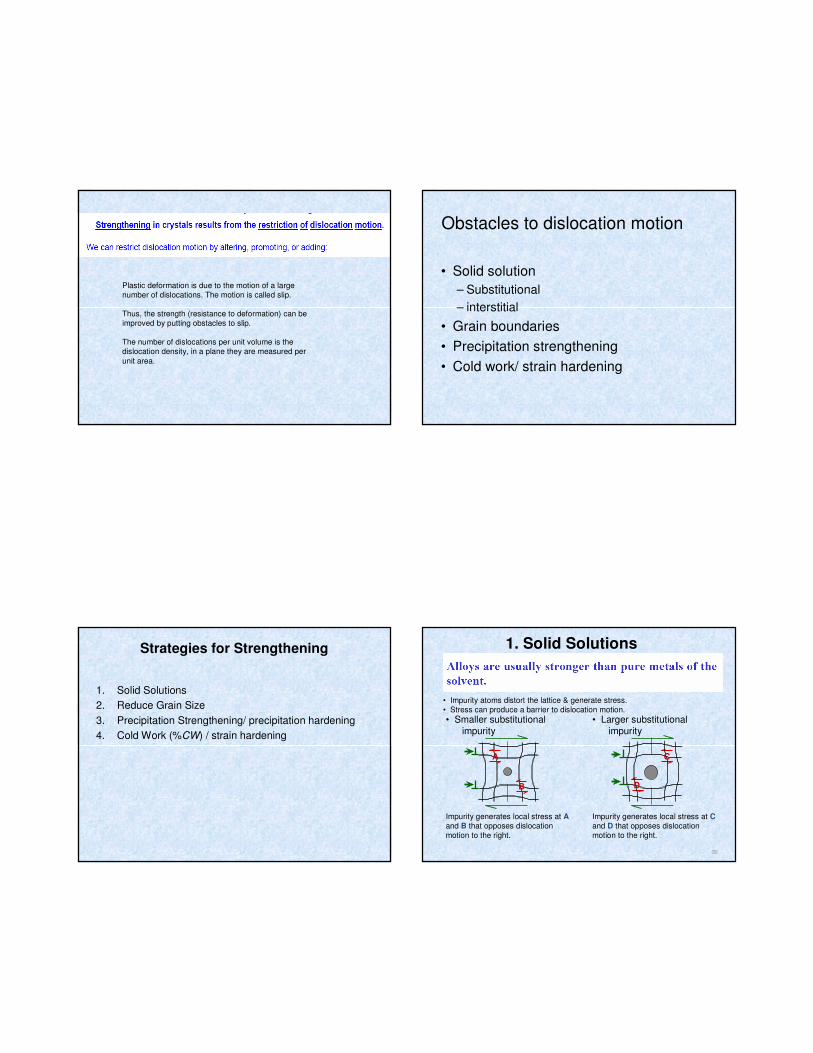
Plastic deformation is due to the motion of a large
number of dislocations. The motion is called slip.
Thus, the strength (resistance to deformation) can be
improved by putting obstacles to slip.
The number of dislocations per unit volume is the
dislocation density, in a plane they are measured per
unit area.
Obstacles to dislocation motion
• Solid solution
– Substitutional
– interstitial
• Grain boundaries
• Precipitation strengthening
• Cold work/ strain hardening
Strategies for Strengthening
1. Solid Solutions
2. Reduce Grain Size
3. Precipitation Strengthening/ precipitation hardening
4. Cold Work (%CW) / strain hardening
32
• Impurity atoms distort the lattice & generate stress.
• Stress can produce a barrier to dislocation motion.
1. Solid Solutions
• Smaller substitutional
impurity
Impurity generates local stress at A
and B that opposes dislocation
motion to the right.
A
B
• Larger substitutional
impurity
Impurity generates local stress at C
and D that opposes dislocation
motion to the right.
C
D

33
Strengthening in Copper
• Tensile strength & yield strength increase with wt% Ni.
• Empirical relation:
• Alloying increases σy and TS.
21 /
y C~σ
Adapted from Fig. 7.16 (a) and (b),
Callister 7e.
Tensile
str
ength
(M
Pa)
wt.% Ni, (Concentration C)
200
300
400
0 10 20 30 40 50 Yie
ld s
tre
ngth
(M
Pa
)
wt.%Ni, (Concentration C)
60
120
180
0 10 20 30 40 50
34
2. Reduce Grain Size
• Grain boundaries are
barriers to slip.
• Barrier "strength"
increases with
Increasing angle of
misorientation.
• Smaller grain size:
more barriers to slip.
• Hall-Petch Equation:
21 /yoyield dk −+σ=σ
Adapted from Fig. 7.14, Callister 7e.(Fig. 7.14 is from A Textbook of Materials Technology, by Van Vlack, Pearson Education,
Inc., Upper Saddle River, NJ.)
Materials with finer grain size are stronger than materials with coarse
grains
35
Strengthening by Alloying
• small impurities tend to concentrate at dislocations
• reduce mobility of dislocation ∴ increase strength
Adapted from Fig. 7.17, Callister 7e.
36
• Hard precipitates are difficult to shear.
Ex: Ceramics in metals (SiC in Iron or Aluminum).
• Result:
S~y
1 σ
3. Precipitation Strengthening/
Precipitation Hardening
Large shear stress needed to move dislocation toward precipitate and shear it.
Dislocation “advances” but precipitates act as “pinning” sites with
S.spacing
Side View
precipitate
Top View
Slipped part of slip plane
Unslipped part of slip plane
Sspacing

• The particles can be precipitates, which are natural. They can also be things like dispersed oxide or carbide particles which are not natural.
• Particle hardening is generally a more better way to strengthen a materials than solid solution hardening. Precipitates and dispersed phases are usually more effective barriers to dislocation penetration than single solutes.
Age hardening/precipitation hardening
• 1. solution treatmentReheat the alloy up to a temperature where only one solid phase exists
(above the solvus). Don’t exceed the eutectic temperature.
• 2. QuenchRapidly cool to room temperature or below.This result in a supersaturated – nonequilibrium structure. The second
phase does not form, because diffusion is so slow.
• 3. AgingReheat o a temperatureDiffusion a short distanceResult in a fine precipitate
There is an optimum aging time
Al-Cu
39
4. Cold Work (%CW) / strain hardening
• Strengthening by increase of dislcation density.• Room temperature deformation.
•Ductile metals become stronger when they are deformed plastically at temperatures well below the melting point.
• Common forming operations change the cross
sectional area:
Adapted from Fig.
11.8, Callister 7e.
-Forging
Ao Ad
force
die
blank
force-Drawing
tensile force
Ao
Addie
die
-Extrusion
ram billet
container
containerforce
die holder
die
Ao
Adextrusion
100 x %o
do
A
AACW
−=
-Rolling
roll
Ao
Adroll
40
• Ti alloy after cold working:
• Dislocations entangle
with one another
during cold work.
• Dislocation motion
becomes more difficult.
Adapted from Fig. 4.6, Callister 7e.(Fig. 4.6 is courtesy
of M.R. Plichta, Michigan Technological
University.)
Dislocations During Cold Work
0.9 µm

41
Impact of Cold Work
Adapted from Fig. 7.20,
Callister 7e.
• Yield strength (σy) increases.
• Tensile strength (TS) increases.
• Ductility (%EL or %AR) decreases.
As cold work is increasedThe purposes of strain hardening
• To enhance strength• Reduce ductility
• Shape products
The effect of strain hardening can be removed by annealing heat treatment
- during annealing three stages take place:• Revovery
• Recrystallization• Grain growth
43
Annihilation reduces dislocation density.Recovery
• Scenario 1
Results from
diffusion
• Scenario 2
4. opposite dislocations meet and annihilate
Dislocations annihilate and form a perfect atomic plane.
extra half-plane of atoms
extra half-plane of atoms
atoms diffuse to regions of tension
2. grey atoms leave by vacancy diffusion allowing disl. to “climb”
τR
1. dislocation blocked; can’t move to the right
Obstacle dislocation
3. “Climbed” disl. can now move on new slip plane
44
• New grains are formed that:
-- have a small dislocation density
-- are small
-- consume cold-worked grains.
Adapted from Fig. 7.21 (a),(b), Callister 7e.(Fig. 7.21 (a),(b)
are courtesy of J.E. Burke, General Electric
Company.)
33% cold
worked
brass
New crystals
nucleate after
3 sec. at 580°C.
0.6 mm 0.6 mm
Recrystallization
45
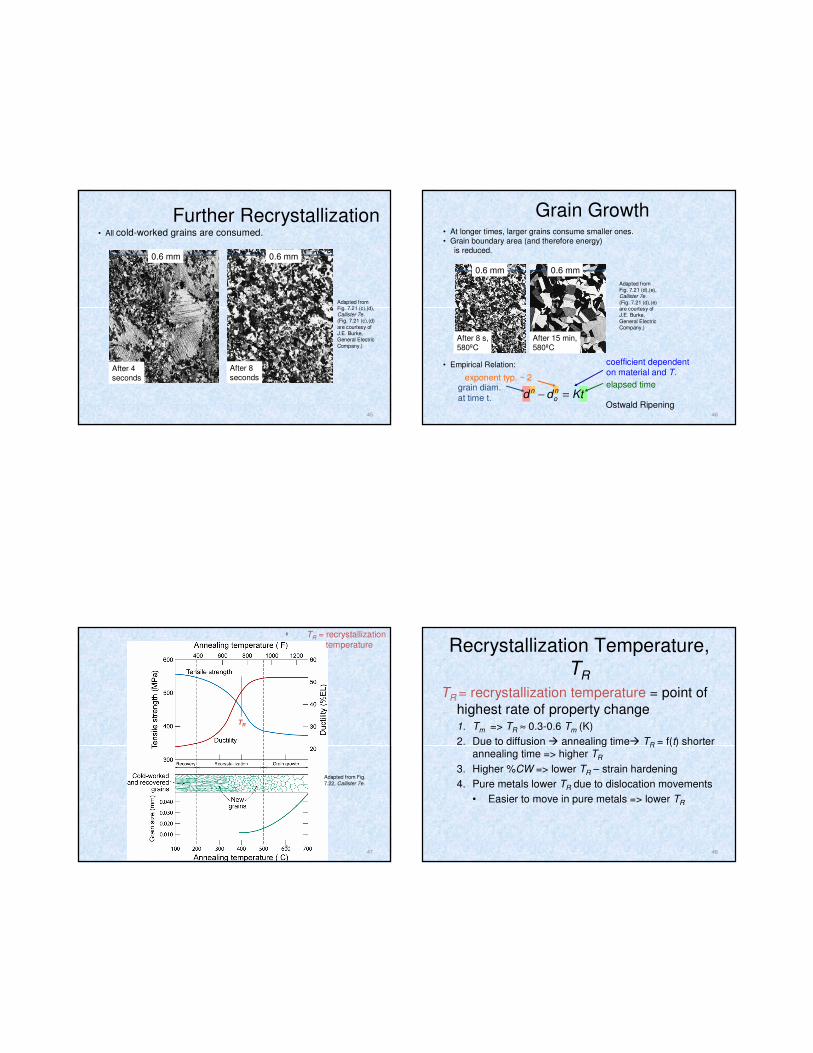
• All cold-worked grains are consumed.
Adapted from Fig. 7.21 (c),(d), Callister 7e.(Fig. 7.21 (c),(d)
are courtesy of J.E. Burke, General Electric
Company.)
After 4
seconds
After 8
seconds
0.6 mm0.6 mm
Further Recrystallization
46
• At longer times, larger grains consume smaller ones.
• Grain boundary area (and therefore energy)
is reduced.
After 8 s,
580ºC
After 15 min,
580ºC
0.6 mm 0.6 mm
Adapted from Fig. 7.21 (d),(e), Callister 7e.
(Fig. 7.21 (d),(e) are courtesy of J.E. Burke,
General Electric Company.)
Grain Growth
• Empirical Relation:
Ktdd no
n =−elapsed time
coefficient dependenton material and T.
grain diam.
at time t.
exponent typ. ~ 2
Ostwald Ripening
47
TR
Adapted from Fig.
7.22, Callister 7e.
º
º
TR = recrystallizationtemperature
48
Recrystallization Temperature, TR
TR = recrystallization temperature = point of
highest rate of property change1. Tm => TR ≈ 0.3-0.6 Tm (K)
2. Due to diffusion � annealing time� TR = f(t) shorter annealing time => higher TR
3. Higher %CW => lower TR – strain hardening
4. Pure metals lower TR due to dislocation movements
• Easier to move in pure metals => lower TR
49
• Dislocations are observed primarily in metals and alloys.
• Strength is increased by making dislocation motion difficult.
• Particular ways to increase strength are to:
-- solid solution strengthening
-- decrease grain size
-- precipitate strengthening
-- cold work
• Heating (annealing) can reduce dislocation densityand increase grain size. This decreases the strength.
Summary
Failure Criteria Review
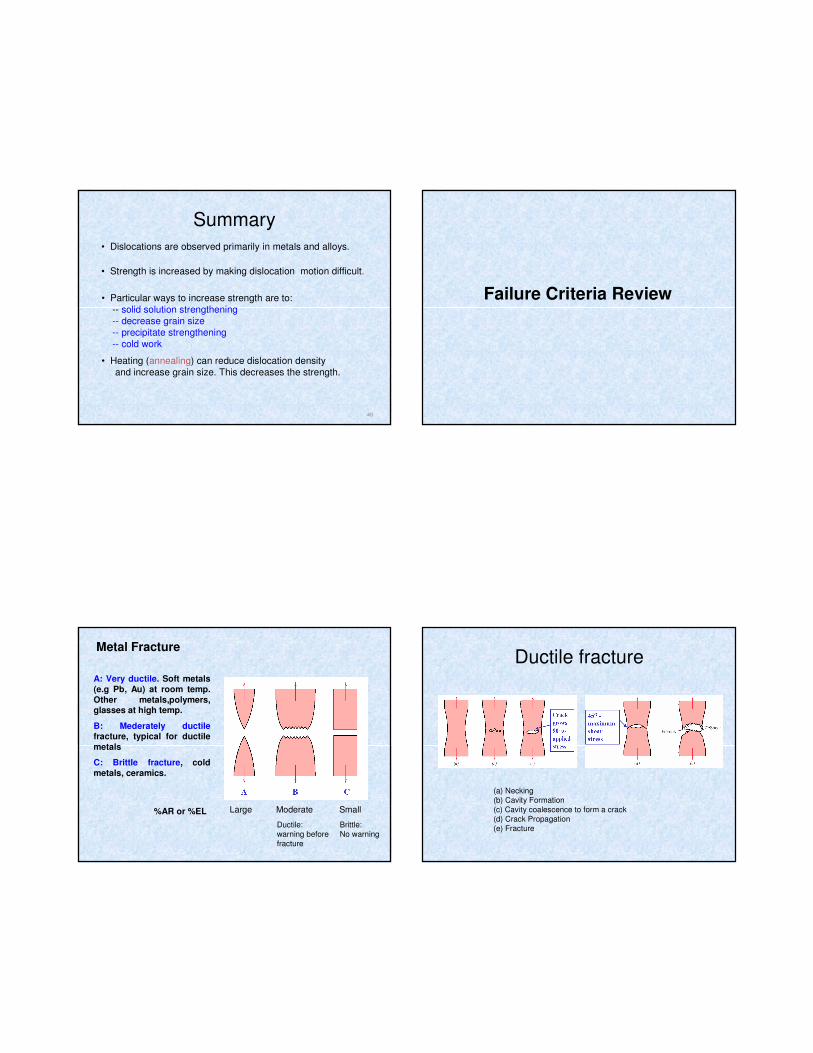
%AR or %EL Large Moderate Small
Ductile:
warning before
fracture
Brittle:
No warning
A: Very ductile. Soft metals
(e.g Pb, Au) at room temp. Other metals,polymers, glasses at high temp.
B: Mederately ductilefracture, typical for ductile
metals
C: Brittle fracture, cold metals, ceramics.
Metal FractureDuctile fracture
(a) Necking
(b) Cavity Formation
(c) Cavity coalescence to form a crack
(d) Crack Propagation
(e) Fracture

Creep• Creep is a time-dependent and permanent
deformation of materials when subjected to a constant load at a high temperature (>0.4Tm), Example : turbine blades, steam generators.
If a material is kept under a constant load over a long period of time (for example , carry a load permanently), it undergoes permanent deformation.Creep rate increase with increase in temp.
tr = time to rupture or rupture lifetime
Creep rate increase with temp and stress
Fatigue
• Components (e.g tools, dies, gears, cam shaft, springs….etc) failure because of rapidly fluctuating (cyclic or periodic) loads in addition to static loads
Cyclic stress may be caused by
fluctuating mechanical loads (such as in
gear teeth or thermal stress (such as on
tool, die..)
Parts fails at stress level below that at which failure would occur under static loading
Fatigue testing apparatus
S-N curve for Ferrous Metal and S-N curve for non Ferrous Metal

Fatigue :Failure under cyclic stress.
On very smooth surfaces,
SLIP steps can act as stress raisers.
Cracks that cause fatigue failure almost always initiate/nucleate atcomponent surface at some stressConcentration (scratches, dents, fillets, keyways,threads, weld beads/spatter…..)
Beachmarks may represent an 8hr daily shift : For a shaft operating at 3000 rpm, total number of cycles per day is….
Beach marks DO NOT indicate the crack growth per stress cycle
Corrosion
• Destructive of a material due to electrochemical attack from the environment.