Embed Size (px)
Citation preview

Topic Transition in Educational Videos Using VisuallySalient Words
Ankit Gandhi∗Xerox Research Centre India
Arijit Biswas∗Xerox Research Centre [email protected]
Om DeshmukhXerox Research Centre India
ABSTRACTIn this paper, we propose a visual saliency algorithm forautomatically finding the topic transition points in an ed-ucational video. First, we propose a method for assign-ing a saliency score to each word extracted from an edu-cational video. We design several mid-level features thatare indicative of visual saliency. The optimal feature com-bination strategy is learnt from a Rank-SVM to obtain anoverall visual saliency score for all the words. Second, weuse these words and their saliency scores to find the prob-ability of a slide being a topic transition slide. On a testset of 10 instructional videos (12 hours), the F-score of theproposed algorithm in retrieving topic-transition slides is0.17 higher than that of Latent Dirichlet Allocation (LDA)-based methods. The proposed algorithm enables demarca-tion of an instructional video along the lines of ‘table ofcontent’/‘sections’ for a written document and has appli-cations in efficient video navigation, indexing, search andsummarization. User studies also demonstrate statisticallysignificant improvement in across-topic navigation using theproposed algorithm.
Keywordsvisual word saliency, ranking, topic transition, educationalvideos, video demarcation and indexing
1. INTRODUCTIONThe rapid growth of online courses and Open EducationalResources (OER) is considered to be one of the biggest turn-ing points in education technology in the last few decades.Many top-ranked universities and educational organizationsacross the world are making thousands of video lecturesavailable online for no cost either in the form of MassivelyOpen Online Courses (MOOCs) or as open access mate-rial. A few national governments have also formulated poli-cies to record classroom lectures from top-tier colleges andmake them freely available online (e.g., National Program of
∗Equal contribution.
Technology Enhanced Learning (NPTEL)[1] in India). Thisonline content can either assist classroom teaching in educa-tional institutions with limited resources or aid out-of-classlearning by the students.
As the amount of this online material is increasing rapidly(tens of thousands of hours of video currently), it is impor-tant to develop methods for efficient consumption of thismultimedia content. Developing methods for summariza-tion [2, 3], navigation [4] and topic transition[5, 6, 7, 8], foreducational videos are now active areas of research.
One of the most challenging areas of research is to auto-matically identify time instances where a particular topicends and a new one beings (i.e., topic transitions) in aneducational video. Consider this real-classroom example:Professors often teach multiple topics within a lecture (of,say, 60-75 minutes). For example, in a lecture video1 onsupport vector machine (SVM), the professor might coverthe definition of version space, motivation for SVM, primalformulation, dual formulation, support vectors and perhapsend the lecture with kernel formulation. When a student isviewing this video lecture s/he might only be interested inthe part where the professor is discussing, say, the dual for-mulation for SVM. This frequently happens when only a fewtopics of the video are relevant for the student or when thestudent wants to revise particular concepts for an upcomingassessment. In such a situation the student would typically‘guesstimate’ the location with multiple back and forth nav-igations of the video. [Indeed, in a large-scale study on theEdX platform, authors in [9] found that certificate earningstudents, on an average, spend only about 4.4 minutes on a12-15 minute-long video and skip about 22% of the content.]Finding these topic transition points in long videos can beextremely difficult and time-consuming. On the other hand,if the lecture videos can be automatically annotated withthe locations where the topic is changing (e.g., dual formu-lation start point, primal formulation start point, etc.), thestudent can easily navigate through these locations and findthe topics of interest efficiently.
A human expert familiar with the topic of a lecture canmanually go through each lecture video and label the topictransition points. However as the quantity of online videolectures increases, manually labelling topic transition pointsfor all of them is going to be a highly time consuming andexpensive process. Demarcating these topic transitions isstraightforward in written documents as the authors tend to
1https://www.youtube.com/watch?v=eHsErlPJWUU
Proceedings of the 8th International Conference on Educational Data Mining 289

create table of contents or sections and subsections. Videolectures, by the very nature of the medium, don’t have suchdemarcation. It is the goal of this research work to automat-ically identify these topic transitions in educational videosand highlight these ‘sections’ to the end user.
In this paper, we propose a novel approach where the visualcontent of a lecture video is analyzed to determine the transi-tion points. In the proposed approach, the visually salient orimportant words are extracted from the frames of an educa-tional video and these words along with their saliency scoresare used to identify the points where the topic is changing inthe video. Two major novel contributions of this work are:
1. Visual saliency of words: Since we use the visualcontent in an educational video to find out the topictransition points, one major challenge was to figure outthe visual cues that are most important for determin-ing the transition points. Intuitively it is clear that thewords used in the slide frames 2 and their distributioncan be used to determine the change of topics. How-ever we also figured out that how a word is used in aparticular slide provides significant cues regarding theword’s significance in topic transition. For example, ifa word is bold and located towards the top or left of thepage, they contribute more in the topic transition thanwords which are located at the bottom right corner ofa slide. An underlined word is usually more importantthan other words in a slide frame. To capture these vi-sual characteristics, we propose seven novel mid-levelfeatures for the words present in educational videos.These features are called underlineness, boldness, size,capitalization, isolation, padding, and location. Oncewe extract all of these features for a word they are com-bined using a weight vector to create a saliency scorecorresponding to every word in the video. To learn thisoptimal weight vector we propose a novel formulationof the Rank-SVM algorithm [10] on human-annotatedsalient words (described in Section 4).
2. Topic transition: Once we extract the words andtheir corresponding saliency scores from a video, thenext step is to find the topic change points. Thesaliency scores are used to estimate (a) how manynovel yet salient words are introduced in each slide(referred to as Salient-Word-Novelty), and (b) num-ber of lower saliency words in earlier slides that occurwith higher saliency (referred to as Relative Saliency),for a particular slide. We propose novel methods forvisual content-based across-slide computation of thesetwo features for every slide and formulate a posteriormodel to estimate the probability that a given slide isa topic transition slide.
Note that the proposed approach is applicable for educa-tional videos where slides are fully or at least partially usedas word recognition accuracy for hand-written text in im-ages is extremely poor and still an open research problem.We observed that a sizable majority of the OER is based onslideware.
2Throughout the paper by slide frame/slide we mean theframes of an education video where the teacher is displayinga slide. We also assume that the power point (.ppt) slide fileis not separately available along with the video.
Figure 1: Pipeline of the proposed system. Figure also showsthe corresponding section numbers where details of each com-ponent are explained.
The performance of the proposed approach in identifyingtopic transition locations was evaluated on 10 different lec-ture videos with a total duration of 12 hours chosen from theNPTEL set. The proposed approach outperforms the topictransition points derived using the well-known topic mod-elling approach [11] by an F-score of 0.17 (0.6 to 0.77 wherethe maximum possible F-score is 1). User studies demon-strate statistically significant improvement in across-topicnavigation using the proposed algorithm.
2. RELATED WORKTopic segmentation of instructional videos is an active areaof research. All the work however focuses on analysing thefilming aspects of the video and not the educational content.
Authors in [5] proposed a method for high level segmentationof topics in an instructional video using the variation in thecontent density function. The key contributing factors whichmanipulate the content density function are shot length, mo-tion and sound energy. This work is extended in [6], where athematic function is introduced to capture the frequency ofappearance of the narrator, frequency of the superimposedtext and narrator’s voice over. The thematic function is usedalong with the content density function in a two tiered hier-archical algorithm for segmenting the topics. The authors in[7] propose hidden markov model (HMM) based approachesfor topic transition detection. First audio-visual featuresare extracted from shots in a video and each shot is classi-fied into one of the five classes: direct-narration, assisted-narration, voice-over, expressive-linkage and functional link-age. Direct-narration/assisted-narration/voice-over impliessegments where the narrator is seen in the video or not.Functional linkage is captured by large superimposed textor music playing in background. Expressive linkage is usedto create the mood for the subject being presented, e.g.,houses with fire images in fire safety videos. Then a twolevel HMM is trained using a training dataset and topictransition points are found out.
All of these approaches were developed mainly for videosused in industries to train people and to convey instructionsand practices, e.g., fire safety video. However OER videos,where the teacher goes over the content of slides, are verydifferent from these kinds of videos. The camera capturesthe teacher and the content interchangeably with the con-tent being more on focus. OER videos do not have musicplaying in background, images for mood creation, variationin sound energy or significant amount of motion. Thus all
Proceedings of the 8th International Conference on Educational Data Mining 290

of these prior methods will not be applicable for the educa-tional videos of our interest. More importantly, none of thesemethods capture the actual content or their characteristicslike saliency to model the topic change.
The proposed solution for topic transition will also driveother applications related to educational videos such as non-linear navigation [4] and summarization [2, 3] which are alsoactive areas of research.
3. SYSTEM OVERVIEWA pipeline of the proposed system is shown in Figure 1. Inthe next two sections (Section 4 and Section 5), we describethe technical detail of each of the components shown in thefigure. The input to the system is uniformly sampled framesextracted from an educational video.
4. VISUAL SALIENCYIn this section, we discuss the steps involved in assigningvisual saliency scores to words present in slides.
4.1 Word Recognition and Text Post-processingThe first step of our pipeline is to recognize words in framesfrom an educational video. Recognizing text from images [12]is an extremely hard problem and continues to be an ac-tive area of research in computer vision/image processing.Words recognition usually involves two steps, first, localiza-tion of text in the frame, and then identification of text inthe localized regions. In our proposed approach, we haveused the algorithm proposed by Neumann et al [13] for lo-calizing text in frames and the open source OCR engineTesseract [14] to identify or recognize the words in the local-ized regions. The recognized words and their correspondinglocations will serve as the input to the next part of oursystem. We perform stop words removal and words stem-ming as a text post-processing step on the recognized words.Stop words (‘and’, ‘it’, ‘the’, etc.)[15] do not contribute to-wards the context or topic of the document. Thus remov-ing them reduces the complexity of system without affectingany downstream processing. Also, all words are stemmed toobtain their base or root form (e.g., stemming the words‘played’, ‘playing’, ‘player’ to ‘play’) to further reduce thecomplexity.
4.2 Saliency Feature ComputationIn this step, we compute the visual features of words thathelps in determining their saliency. For computing visualfeatures, OCR outputs, i.e., the recognized words and theirlocations (bounding boxes) are used. Based upon the analy-sis of several educational videos (different from the ones usedin experiments) taken from NPTEL and edX, we formulatedseveral visual features such as location, boldness, underline-ness, capitalization, isolation, padding and size, that are in-dicative of visual saliency. In this section, we provide a wayto quantize them and in the next section, a formal frame-work is proposed that combines them to predict the overallvisual saliency of a word. The visual feature extraction pro-cedure for each of the words is described below:
• Location feature (u1): This feature captures the loca-tion information of a word in a slide. Generally, wordswhich are located towards the top and left of a page aremore important than the words located at the bottom and
right corner of a page. We use two one dimensional Gaus-
sian distributions (f(x, µ, σ) = 1
σ√2πe−(x−µ)2
2σ2 ) to com-
pute this feature. The mean of the first Gaussian distri-bution is set to be the left most point of an image (givingmaximum score to left-most words) and the mean of thesecond Gaussian distribution is set to be the top mostpoint of an image (giving maximum score to the top mostwords). The variance is chosen as 0.25 times the width ofimage and 0.16 times the height of image respectively forthe two Gaussian distributions. These parameters are se-lected using a small validation set. For each word, top-leftcorner(X-Y coordinate) of its bounding box is chosen asvariables in the Gaussian distributions. The location fea-ture is given by the product of the scores obtained fromthe two Gaussian distributions. If a word moves awayfrom the top left corner of an image, the location featurevalue gradually decreases.
• Boldness feature (u2): It is usually true that if a wordin a slide is relatively bolder than other words in the slideit is an important word. For computing boldness feature,first the word image is binarized. Then, the number ofpixels which are foreground (i.e., the pixels which are partof the written text) are found. The pixel count is normal-ized with the number of characters present in the wordto obtain the boldness feature. Thus, the boldness fea-ture captures the average number of pixels occupied percharacter in a word.
• Underlineness feature (u3): A word is underlined ina slide if the teacher wants to highlight that particularword. In this work, we use Hough Transform [16] of animage to detect line segments present in that image. Sincewe are only interested in horizontal or near-horizontal linesegments, all other line segments are removed from consid-eration. We use another post-processing step to removeall the horizontal line segments which are too close tothe margin. Then, all the words which are immediatelyabove the remaining horizontal/near-horizontal line seg-ments are assigned a non-zero score for the underlinenessfeature. Note that the underlineness feature for a wordis binary denoting whether an underline is present belowthe word or not.
• Capitalization feature (u4): If all the characters of aword are in upper case, then a word is assigned a non-zero score for the capitalization feature. This feature isalso binary.
• Isolation feature (u5): The isolation feature representshow isolated a word is in the slide. The hypothesis is thatfewer the number of words in a slide, the more importantthe words present in it and similarly, the fewer the numberof words in a line of a slide, more important the wordsin that line. For example, often in title slides only a titleword or a phrase is present in the center of the slide. And,the title word instances are more important than theircorresponding instances elsewhere. Suppose, a word w ispresent in line l of a slide, then the isolation feature forword w is computed as follows -
u5(w) =1
No. of lines in a slide×No. of words in line l
Proceedings of the 8th International Conference on Educational Data Mining 291

• Padding feature (u6): In educational slides teachersoften end a concept and start talking about another con-cept starting at the same slide. In those cases, they tend tokeep usually more space before or after the title line of thenew concept. We introduce a novel feature called paddingto capture that information. For a word, padding featureis computed as the amount of empty space available be-low and above the line in which the word is present. Freespace above is computed as number of pixels present be-tween the current line and the previous line. Similarly, freespace below is computed as the number of pixels presentbetween the considered line and the next line. The sumis then normalized by the height of the image (slide) andthe average line gap in the slide.
• Size feature (u7): This feature captures the size of wordin the slide. Words appearing with larger font are gener-ally more important than the words appearing appear-ing with relatively smaller fonts. We denote the size of aword (size feature) as the height of the smallest characterpresent in that word.
We normalize each of the visual features using 0-1 normal-ization across the entire video. The weighted sum of thenormalized scores represents overall saliency of the wordsin frame. The weights are obtained using Rank-SVM[10],which we describe in the next subsection.
4.3 Learning to Rank Using Rank-SVMIn this subsection, we learn the relative importance of thevisual features to predict the overall saliency of words. Theweights determine how much each visual feature contributesto the overall saliency of a word. The weights were learnt bycollecting a training dataset from 10 users over 5 videos. 10slides were randomly selected from each video (hence, totalof 50 slides) to collect the training set. Each slide has beenshown to 3 users and thus, a single user provides data for 15unique slides. For each slide, the user was asked the follow-ing question - “What are the salient words present in thatslide that describe the overall content of the slide?”. Gen-erally, the number of salient words per slide vary between2-12 depending upon the user and the slide. To overcomeinter-user subjectivity, a word is accepted as salient onlyif it is marked as salient by atleast 2 users. Since in eachslide users considered the selected words more salient thanthe words which were not selected, we can consider themas pairwise preferences. These pairwise preferences can beused in a Rank-SVM framework to learn the correspondingfeature weights.
Let u = [u1u2 . . . u7] denote the visual saliency feature vec-tor and w = [w1w2 . . . w7] denotes the weight vector to belearnt for a particular word. Also, let D denotes the set ofwords and Ds denotes the set of salient words present inslide S. Consider two words i and j such that i ∈ Ds andj ∈ D−{Ds} and their visual features are ui and uj respec-tively. Then the weights learnt should satisfy the saliency or-dering constraints (pairwise preferences by users): wTui >wTuj , ∀i, j. For each slide S, we will have |Ds| × |D−{Ds}|number of constraints. Our goal is to learn saliency rankingfunction r(u) = wTu such that the maximum number ofthe following pairwise constraints are satisfied:
wTui > wTuj , ∀(i, j) ∈ (Ds,D − {Ds}),∀S (1)
While the above optimization problem is a NP-hard prob-lem, it can be solved approximately by introducing negativeslack variables similar to SVM classification. This leads tothe following optimization problem:
min (1
2||wT ||22 + C
∑ξ2ij) (2)
s.t. wTui > wTuj + 1− ξij ; ∀(i, j) ∈ (Ds,D − {Ds}),∀Sξij ≥ 0
The above formulation is very similar to the SVM classifi-cation problem but on pairwise difference vectors, where Cis the trade-off between maximizing the margin and satis-fying the pairwise relative saliency constraints. The primalform of above optimization problem is solved using New-ton’s method [10, 17]. It should be noted that the aboveoptimization problem learns a function that explicitly en-forces a desired ordering on the saliency of words providedas training data. Now for any new word with feature vec-tor u, the saliency score can be obtained by computing thedot product of u with w (i.e., wTu). Some example framesfrom different videos with the detected words and their cor-responding saliency scores are shown in Figure 2. Note thatthe words ‘Torsional’ and ‘Waves’ are part of the title ofthe slide in Figure 2a and are visually more salient. Hence,they have received higher scores. Similarly, in Figure 2b,the word ‘Concepts’ has received the highest saliency score.
5. TOPIC TRANSITIONIn this section, we discuss the steps of the topics transitionpart of our proposed approach. Words from different slidesare clustered and unique slides are extracted before we com-pute probability that given slide is a topic transition slide.
5.1 Clustering of Recognized WordsThe text localization and recognition in uncontrolled/wildsettings is an extremely hard problem to solve. In case ofeducational videos, word recognition result is not always per-fect and is inconsistent across the slides due to changes inlighting conditions, poor frame quality (noise and low reso-lution), positioning of mouse pointer over frames, presenceof special symbols, punctuation, typography due to italics,spacing, underlining, shaded background and unusual type-faces. For e.g., Word ‘algorithm’ is recognized as ‘algorlthm’in one slide and ‘algorithm’ in another slide. One simple ap-proach to tackle this problem is to use a vocabulary andforce the words to be one of the in-vocabulary words. How-ever in many practical scenarios, it is often difficult to comeup with a vocabulary of all words which can be present inthe video (some of the technical words and proper nounsmay not be present in the vocabulary). So, instead of usinga vocabulary, we propose to use agglomerative hierarchicalbased clustering approach to cluster words that are samebut recognized differently across slides.
Agglomerative hierarchical clustering [18] is a bottom-upclustering method and involves the following steps: (i) as-signing each word to a different cluster, (ii) evaluation ofall pair-wise distances between clusters, (iii) finding the pairof clusters with the shortest distance, (iv) merging the pairof clusters, (v) updating the distance matrix, i.e., comput-ing the distances of this new cluster to all the other clusters,and (vi) repeat until a pair of clusters can be found with dis-tance less than a predetermined threshold. In our system,
Proceedings of the 8th International Conference on Educational Data Mining 292

(a) A frame from Video1 (b) A frame from Video2
Figure 2: Figure showing the visual saliency scores of words on few of the slides sampled from NPTEL educational videos.Note that the words which are visually more salient based on boldness, underlineness, size, location, isolation, padding andcapitalization have received higher scores.
we have used Damerau-Levenshtein distance [19] normalizedby the product of the length of the two words as the dis-tance metric (substitution, deletion and insertion cost usedin the Damerau-Levenshtein distance are 1). To measurethe distance between a pair of clusters, we compute the av-erage distance (average-link hierarchical clustering) betweenall possible pairs of words in two clusters. Also, it must benoted that the words belonging to the same cluster will beconsidered as the same word for any further processing.
5.2 Unique Frame ExtractionOne more novel contribution of this paper is to find outunique frames from an educational video. Unique frame ex-traction step finds all the unique frames (slides) in an edu-cational video. Unique frames are identified from uniformlysampled frames of a video based on a criterion defined usingpixel difference and the number of words (i.e., word clusters)matched. In case of educational videos, unique slides cannotbe directly extracted by just comparing the adjacent slidesas the same slide may be present in later portions of thevideo also (for e.g., in a typical video lecture, there will beframes of a slide followed by frames of a professor discussingthe slide and then, again few frames of the same slide). In-stead we compare each frame (beginning from start frame)with all the previous frames of a video and mark it as dupli-cate if the pixel difference threshold is less than γ or moreimportantly if the words overlap ratio is greater than thresh-old ρ with any of the previous slides. If a frame is found tobe duplicate to a previous slide, it is removed from the setof possible unique slides. The pseudo code of our uniqueframe detection approach is provided in Algorithm 1. Usingwords overlap ratio along with pixel difference as the simi-larity metric makes our algorithm robust to change in light-ing conditions, partial occlusions by the teacher and noisyvideo capturing methods. We note that our pipeline ignoresall non-content (lecturer) frames in the video, where no textregion is detected using the text detection algorithm. Hence,the output of the unique frame selection algorithm is all theunique slides present in the actual video. From this sectiononwards, term ‘slides’ or ‘frames’ will be used to refer to theunique slides in the video.
5.3 Content-based Features for SlidesIn this subsection, we describe features which we propose todetermine the topic transition probabilities. We have stud-
Algorithm 1 Finding unique frames in a video
Input: Uniformly sampled frames {Sm}, m = 1, 2, . . . ,MOutput: Unique frames {St}, t = 1, 2, . . . , T and t ∈{1, 2, . . . ,M}Approach:
uniqueFrames ← []for i ← 1 . . .m do
isUnique ← truefor j ← 1 . . . i− 1 do
if pixelDiff(Si, Sj) ≤ γ OR wordsOverlap(Si, Sj) ≥ρ then
isUnique ← falsebreak
end ifend forif isUnique AND detectedWordList(Si)6= ∅ then
uniqueFrames.append(Si)end if
end for
ied an extensive number of educational videos from differentresources such as NPTEL, Coursera and EdX to figure outhow a new topic is introduced in educational videos. Thereare two most common methods to introduce a new topic.Often a teacher while introducing a new topic, uses a fewsalient and novel words (the name of the new topic) in theslide. For example, the name of the new topic might bebold, placed on top of the page or might be underlined.Thus saliency of novel words definitely indicates how likelya new topic will start in a slide. Our first feature salientword novelty tries to capture how many novel but salientwords are introduced in a slide.
Sometimes the teacher also refers to the names of the top-ics to be discussed later in the video by either enlistingall the topics in the video or in context with some othertopics. However these occurrences usually happen with rel-atively lower saliency. Eventually when the topic discus-sion begins, the name of that topic is introduced with muchhigher saliency. Although these words are not novel theycan still indicate topic change. Our second feature rela-tive saliency is designed to capture if a word which waspresent earlier with lower saliency reappears in a particular
Proceedings of the 8th International Conference on Educational Data Mining 293
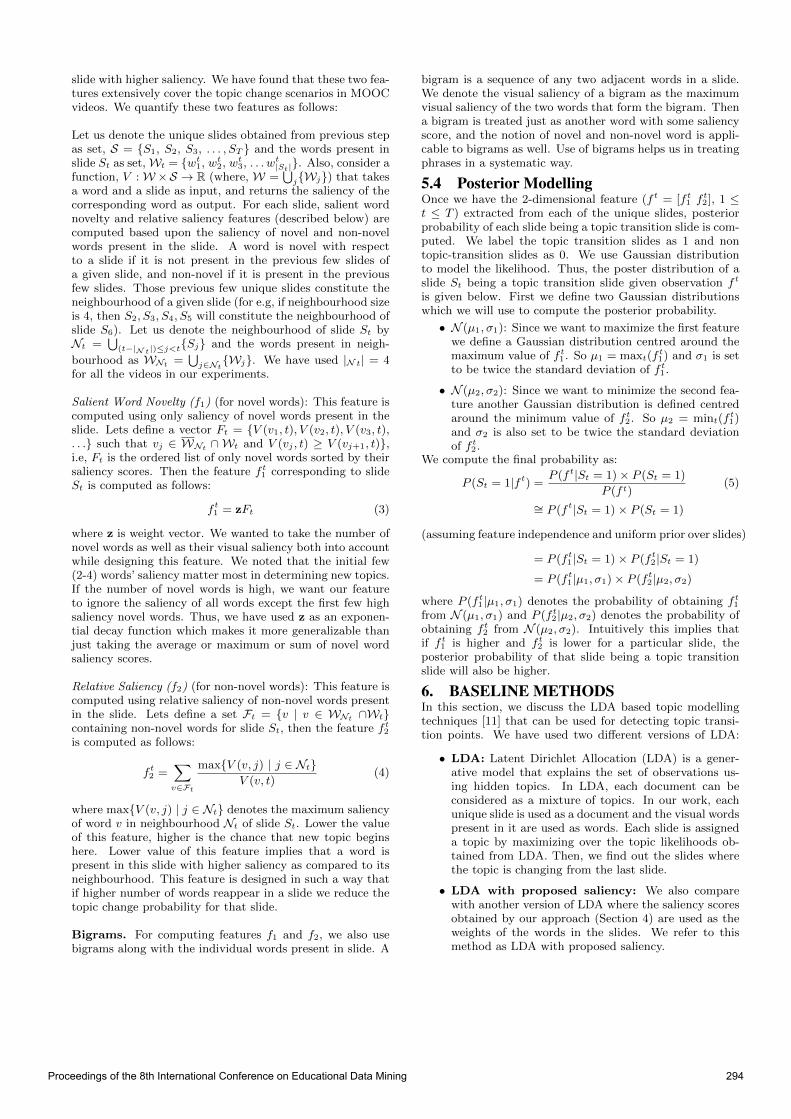
slide with higher saliency. We have found that these two fea-tures extensively cover the topic change scenarios in MOOCvideos. We quantify these two features as follows:
Let us denote the unique slides obtained from previous stepas set, S = {S1, S2, S3, . . . , ST } and the words present inslide St as set,Wt = {wt1, wt2, wt3, . . .wt|St|}. Also, consider afunction, V :W×S → R (where, W =
⋃j{Wj}) that takes
a word and a slide as input, and returns the saliency of thecorresponding word as output. For each slide, salient wordnovelty and relative saliency features (described below) arecomputed based upon the saliency of novel and non-novelwords present in the slide. A word is novel with respectto a slide if it is not present in the previous few slides ofa given slide, and non-novel if it is present in the previousfew slides. Those previous few unique slides constitute theneighbourhood of a given slide (for e.g, if neighbourhood sizeis 4, then S2, S3, S4, S5 will constitute the neighbourhood ofslide S6). Let us denote the neighbourhood of slide St byNt =
⋃(t−|N t|)≤j<t
{Sj} and the words present in neigh-
bourhood as WNt =⋃j∈Nt{Wj}. We have used |N t| = 4
for all the videos in our experiments.
Salient Word Novelty (f1) (for novel words): This feature iscomputed using only saliency of novel words present in theslide. Lets define a vector Ft = {V (v1, t), V (v2, t), V (v3, t),. . .} such that vj ∈ WNt ∩ Wt and V (vj , t) ≥ V (vj+1, t)},i.e, Ft is the ordered list of only novel words sorted by theirsaliency scores. Then the feature f t1 corresponding to slideSt is computed as follows:
f t1 = zFt (3)
where z is weight vector. We wanted to take the number ofnovel words as well as their visual saliency both into accountwhile designing this feature. We noted that the initial few(2-4) words’ saliency matter most in determining new topics.If the number of novel words is high, we want our featureto ignore the saliency of all words except the first few highsaliency novel words. Thus, we have used z as an exponen-tial decay function which makes it more generalizable thanjust taking the average or maximum or sum of novel wordsaliency scores.
Relative Saliency (f2) (for non-novel words): This feature iscomputed using relative saliency of non-novel words presentin the slide. Lets define a set Ft = {v | v ∈ WNt ∩Wt}containing non-novel words for slide St, then the feature f t2is computed as follows:
f t2 =∑v∈Ft
max{V (v, j) | j ∈ Nt}V (v, t)
(4)
where max{V (v, j) | j ∈ Nt} denotes the maximum saliencyof word v in neighbourhood Nt of slide St. Lower the valueof this feature, higher is the chance that new topic beginshere. Lower value of this feature implies that a word ispresent in this slide with higher saliency as compared to itsneighbourhood. This feature is designed in such a way thatif higher number of words reappear in a slide we reduce thetopic change probability for that slide.
Bigrams. For computing features f1 and f2, we also usebigrams along with the individual words present in slide. A
bigram is a sequence of any two adjacent words in a slide.We denote the visual saliency of a bigram as the maximumvisual saliency of the two words that form the bigram. Thena bigram is treated just as another word with some saliencyscore, and the notion of novel and non-novel word is appli-cable to bigrams as well. Use of bigrams helps us in treatingphrases in a systematic way.
5.4 Posterior ModellingOnce we have the 2-dimensional feature (f t = [f t1 f
t2], 1 ≤
t ≤ T ) extracted from each of the unique slides, posteriorprobability of each slide being a topic transition slide is com-puted. We label the topic transition slides as 1 and nontopic-transition slides as 0. We use Gaussian distributionto model the likelihood. Thus, the poster distribution of aslide St being a topic transition slide given observation f t
is given below. First we define two Gaussian distributionswhich we will use to compute the posterior probability.
• N (µ1, σ1): Since we want to maximize the first featurewe define a Gaussian distribution centred around themaximum value of f t1. So µ1 = maxt(f
t1) and σ1 is set
to be twice the standard deviation of f t1.
• N (µ2, σ2): Since we want to minimize the second fea-ture another Gaussian distribution is defined centredaround the minimum value of f t2. So µ2 = mint(f
t1)
and σ2 is also set to be twice the standard deviationof f t2.
We compute the final probability as:
P (St = 1|f t) =P (f t|St = 1)× P (St = 1)
P (f t)(5)
∼= P (f t|St = 1)× P (St = 1)
(assuming feature independence and uniform prior over slides)
= P (f t1|St = 1)× P (f t2|St = 1)
= P (f t1|µ1, σ1)× P (f t2|µ2, σ2)
where P (f t1|µ1, σ1) denotes the probability of obtaining f t1from N (µ1, σ1) and P (f t2|µ2, σ2) denotes the probability ofobtaining f t2 from N (µ2, σ2). Intuitively this implies thatif f t1 is higher and f t2 is lower for a particular slide, theposterior probability of that slide being a topic transitionslide will also be higher.
6. BASELINE METHODSIn this section, we discuss the LDA based topic modellingtechniques [11] that can be used for detecting topic transi-tion points. We have used two different versions of LDA:
• LDA: Latent Dirichlet Allocation (LDA) is a gener-ative model that explains the set of observations us-ing hidden topics. In LDA, each document can beconsidered as a mixture of topics. In our work, eachunique slide is used as a document and the visual wordspresent in it are used as words. Each slide is assigneda topic by maximizing over the topic likelihoods ob-tained from LDA. Then, we find out the slides wherethe topic is changing from the last slide.
• LDA with proposed saliency: We also comparewith another version of LDA where the saliency scoresobtained by our approach (Section 4) are used as theweights of the words in the slides. We refer to thismethod as LDA with proposed saliency.
Proceedings of the 8th International Conference on Educational Data Mining 294

7. EXPERIMENTAL RESULTSIn this section, we evaluate our approach to detect topictransition points on publicly available NPTEL educationalvideos. We compare the proposed approach with well-knownLatent Dirichlet Allocation based topic modelling technique[11]. We also perform a user study to evaluate the efficiencyand effectiveness of our approach for finding topic startingpoints in educational videos and provides a quick way ofnavigating though videos in a non-linear fashion.
7.1 DatasetThe experiments were conducted on 10 NPTEL educationalvideos. The duration of each of these videos is around 1-1.5 hours; giving us total 12 hours of video content for ex-periments. NPTEL videos usually have a large amount ofdiversity. Lighting conditions, slide orientations and style,camera angle, video resolution, and lecturer positioning inthe slides (for e.g., on few occasions lecturer occupies bot-tom right part of the slide and sometimes full frame) varysignificantly across the NPTEL videos. In few of the videos,the lecturer uses printed text instead of using slides. Also, in4 of the selected videos, along with slides, lecturer also useshandwritten text in the presentation. In 2 other videos, thelecturer writes on slides during the presentation. All thesescenarios make word recognition and thus, the identificationof topic transition points extremely challenging and diffi-cult. Examples of few of the slides from different educationalvideos can be seen in Figure 2. Ground truth annotation ofthe topic transition points in this dataset are obtained fromhumans who are experts in the respective topics.
7.2 EvaluationThe proposed approach in this paper assigns a visual saliencyscore to each word in the video. The mid-level visual fea-tures extracted in Section 4.2 are combined using the weightvector obtained in Section 4.3. The weights obtained us-ing our training set are 1.1250 (boldness), 1.0015 (location),0.6605 (underlineness), 0.6050 (size), 0.4612 (capitalization),0.2291 (isolation), 0.0232 (padding). We observe that bold-ness and location features have higher weights compared tothe other feature weights indicating that these two featuresare perhaps more important in determining the overall vi-sual saliency.
Next, we use these saliency scores to assign a probability foreach unique slide being a topic transition slide. We generatethe ranked list of slides sorted by their ‘being a topic tran-sition slide’ probabilities. We compute the precision and re-call for all top n elements of the ranked list, where n variesfrom 1 to the length of the ranked list. In our analysis,we have used F-Score to measure the performance. F-Scoreconsiders both precision and recall of the method while scor-ing. In this context, precision is the number of correct topictransition points retrieved (within the top n elements of theranked list) divided by the total number of retrieved topictransition points, and recall is the number of correct topictransition points retrieved divided by the total number ofground truth topic transition topics. The F-score is definedas the harmonic mean of precision and recall:
F-Score = 2× Precision×RecallPrecision+Recall
(6)
While the recall measures how well the system can retrievethe true ground truth topic transitions, and high precision
Figure 3: Comparison of proposed approach with LDA andLDA (with visual saliency) topic modelling techniques over10 NPTEL videos. The proposed method significantly out-performs LDA by 17%.
ensures that it does not over-predict the true topic transi-tions, the F-Score measures the overall performance of theapproach. F-Score is 1 in the ideal case (when the algorithmis perfect and when both precision and recall are 1). Fol-lowing the norm regarding F-score usage[7], we also reportthe best F-score obtained from the ranked list. Similarly,for LDA and LDA with proposed saliency, we compute theprecision and recall of the topic transitions with respect toground truth topic transition points and get the F-Score.
In Figure 3, we provide the comparison of our approachwith the LDA based techniques. We find our approach givesan average F-score of 0.77 where LDA gives an F-Score of0.58 ± 0.018 and LDA with proposed saliency gives an F-Score of 0.60 ± 0.021 over 10 videos. The standard devia-tion values reported show the variation in LDA performancedue to different number of topics. We vary the number oftopics from 3 to 8 for both versions of LDA. Our methodachieves an absolute improvement of 0.17 (relative improve-ment 28%) over state-of-the-art topic modelling techniqueLDA for topic transition detection in educational videos.Statistical significance of the improvement was also esti-mated using t-tests (t(10) = 4.31, p = 0.0003). This clearlyshows the importance of visual saliency of words present inslides and how they can be used to detect topic transitions.We distinguish slides based on the relative saliency of theirwords, thus the temporal progression of saliency capturesthe transitions more accurately. We have also observed thatthe combination of two features novel word saliency and rel-ative saliency performs the best and absence of any one ofthem deteriorates the performance.
7.3 User StudyWe conducted a 6-participant 3-video user study to evalu-ate effectiveness and efficiency of the proposed system andcompared it with the baseline transcript+youtube style ren-dering based interface (similar to the EdX interface) wherethe text is hyperlinked with the corresponding location inthe video where it is spoken.
All the 6 participants had engineering degrees, exposure toonline videos and had not seen these videos. The threevideos were of 60, 49 and 56 minutes each. We design thevideo interface where we show the markers for topic transi-tion points in the video timeline (Figure 4). For each video,we show the top-15 topic transition points obtained usingthe proposed approach. Each topic transition marker inFigure 4 corresponds to the first occurrence of the corre-sponding topic transition slide in the video. Each partici-pant was presented one video with the proposed interfaceand one other video with the baseline interface. Thus, eachvideo + interface combination was evaluated by two differ-
Proceedings of the 8th International Conference on Educational Data Mining 295

Figure 4: Proposed video interface which shows the markersfor topic transition points in the video timeline. Hoveringthe mouse over a marker shows the thumbnail of the corre-sponding topic transition slide.
ent users. For each video, the users were given a list of 5topics and asked to navigate to the starting point of each ofthese topics. They were allowed to go back and forth in thevideo multiple times to identify these topic locations. These5 topics were randomly chosen from the ground truth topicsgiven by the human experts (Section 7.1).
The total time taken by the participant to answer all thequestions along with the number of correctly answered ques-tions was measured. The answer is considered to be correctif the timestamp given by the participant is within a windowof ±10 seconds of the ground truth location. We observedthat the average time taken by the participants to correctlyanswer one question is 50.07±14.38 sec using our interfaceand 98.75±47.75 sec using the baseline interface. The pro-posed interface leads to statistically significant time savingsin navigating to required topics as compared to the base-line interface (t(6) = -2.78, p = 0.027). The percentage ofcorrectly answered questions using our interface is 76.67%(out of 30 question instances) as compared to only 60% inbaseline interface. Thus, the proposed interface shows bothefficiency and effectiveness of our system.
8. CONCLUSIONIn this paper, we propose a system for automatically detect-ing topic transitions in educational videos. The proposed al-gorithm has two novel contributions: (a) a method to assignsaliency score to each word on each slide, and (b) a methodto combine across-slide word saliency to estimate the poste-rior probability of a slide being a topic transition point. Theproposed method shows a F-Score improvement of 0.17 fordetecting topic transition points as compared to the LDA-based topic modelling technique. We also demonstrate theefficiency and effectiveness of the proposed method in a videonavigation interface to navigate through various topics dis-cussed in a video.
While the focus of this work is to analyze the visual con-tent to identify topic transitions, the text transcript of the
videos can also be analyzed. In the absence of manuallygenerated text transcripts, Automatic Speech Recognition(ASR) techniques can be used. The accuracy of ASR out-puts, especially given the wide variety of speaker accent andtopics will be a bottleneck in their use of downstream anal-ysis. We are currently working on combining these multiplemodalities of video, speech and text to further improve thetopic transition estimation.
9. REFERENCES[1] http://nptel.ac.in/.
[2] C. Choudary and T. C. Liu. Summarization of visualcontent in instructional videos. IEEE Transactions onMultimedia, 9(7):1443–1455, November 2007.
[3] T. C. Liu and C. Choudary. Content extraction andsummarization of instructional videos. In ICIP, pages149–152, 2006.
[4] Kuldeep Yadav et al. Content-driven multi-modaltechniques for non-linear video navigation. In ACMIUI, 2015.
[5] Dinh Q. Phung, Svetha Venkatesh, and Chitra Dorai.High level segmentation of instructional videos basedon content density. In ACM Multimedia, 2002.
[6] Dinh Q. Phung, Svetha Venkatesh, and Chitra Dorai.Hierarchical topical segmentation in instructional filmsbased on cinematic expressive functions. In ACMMultimedia, 2003.
[7] Dinh Q. Phung, Thi V. Duong, Svetha Venkatesh, andHung Hai Bui. Topic transition detection usinghierarchical hidden markov and semi-markov models.In ACM Multimedia. ACM, 2005.
[8] Ying Li, Youngja Park, and Chitra Dorai. Atomictopical segments detection for instructional videos. InACM Multimedia. ACM, 2006.
[9] Philip J. Guo and Katharina Reinecke. Demographicdifferences in how students navigate through moocs.In Proceedings of the First ACM Conference onLearning @ Scale Conference, L@S ’14. ACM, 2014.
[10] Olivier Chapelle and S. Sathiya Keerthi. Efficientalgorithms for ranking with SVMs. Inf. Retr,13(3):201–215, 2010.
[11] David M. Blei, Andrew Y. Ng, and Michael I. Jordan.Latent dirichlet allocation. J. Mach. Learn. Res.,3:993–1022, March 2003.
[12] Kai Wang, Boris Babenko, and Serge Belongie.End-to-end scene text recognition. In ICCV, 2011.
[13] Lukas Neumann and Jirı Matas. Scene textlocalization and recognition with oriented strokedetection. In ICCV 2013. IEEE, 2013.
[14] https://code.google.com/p/tesseract-ocr/.
[15] http:
//nlp.stanford.edu/IR-book/html/htmledition/
dropping-common-terms-stop-words-1.html.
[16] R. S. Wallace. A modified hough transform for lines.In CVPR, pages 665–667, 1985.
[17] Devi Parikh and Kristen Grauman. Relativeattributes. In ICCV, pages 503–510. IEEE, 2011.
[18] A. Lukasova. Hierarchical agglomerative clusteringprocedure. Pattern Recognition, 11(5-6):365–381, 1979.
[19] http://en.wikipedia.org/wiki/Damerau%E2%80%
93Levenshtein_distance.
Proceedings of the 8th International Conference on Educational Data Mining 296