Embed Size (px)
Citation preview
GetThoseGrades
Topic: Progressive & Stationary Waves Specification reference: 3.3.1
Marks available: 122 Time allowed (minutes): 154 Examination questions from AQA. Don’t forget your data sheet! Mark scheme begins on page 28
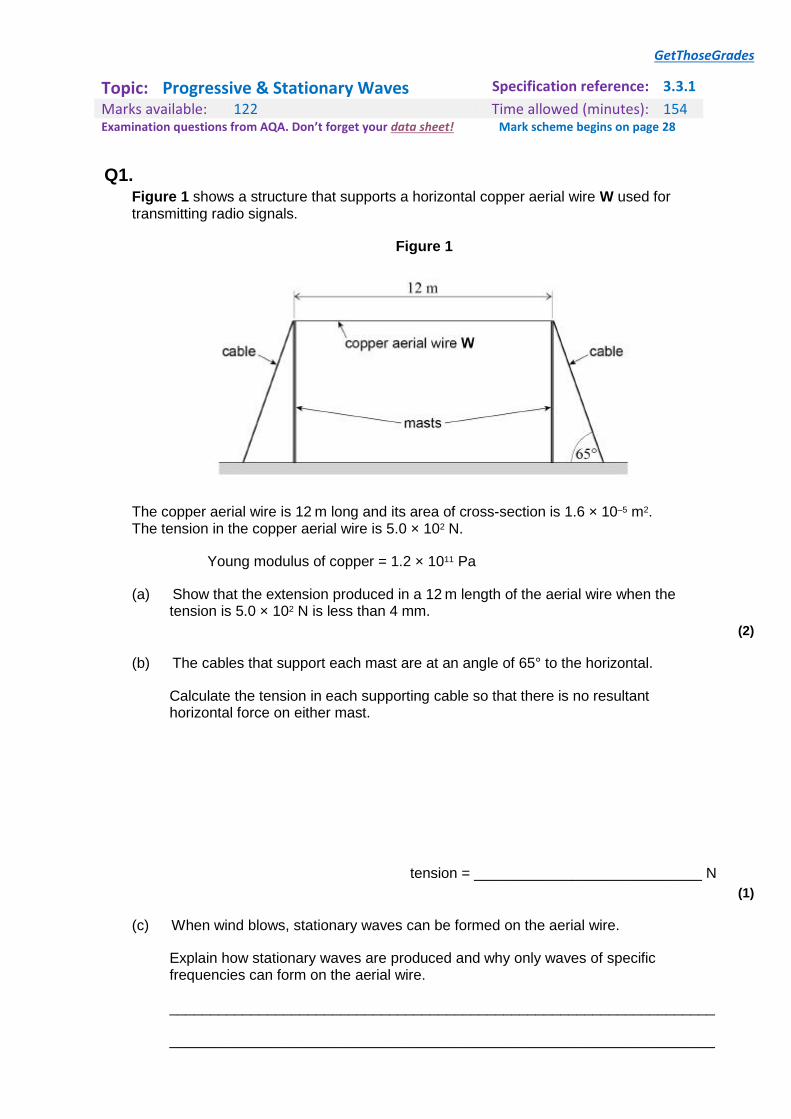
Q1. Figure 1 shows a structure that supports a horizontal copper aerial wire W used for transmitting radio signals.
Figure 1
The copper aerial wire is 12 m long and its area of cross-section is 1.6 × 10⁻⁵ m2. The tension in the copper aerial wire is 5.0 × 10² N.
Young modulus of copper = 1.2 × 10¹¹ Pa
(a) Show that the extension produced in a 12 m length of the aerial wire when the tension is 5.0 × 10² N is less than 4 mm.
(2)
(b) The cables that support each mast are at an angle of 65° to the horizontal.
Calculate the tension in each supporting cable so that there is no resultant horizontal force on either mast.
tension = ____________________________ N
(1)
(c) When wind blows, stationary waves can be formed on the aerial wire.
Explain how stationary waves are produced and why only waves of specific frequencies can form on the aerial wire.
___________________________________________________________________
___________________________________________________________________
GetThoseGrades
___________________________________________________________________
___________________________________________________________________
___________________________________________________________________
___________________________________________________________________
___________________________________________________________________
___________________________________________________________________
(4)
(d) Calculate the mass of a 1.0 m length of the aerial wire.
Density of copper = 8900 kg m–3
mass = ____________________________ kg
(1)
(e) Calculate the frequency of the wave when the third harmonic is formed on the aerial wire.
frequency = ____________________________ Hz
(2)
(f) Sketch, on Figure 2, the standing wave on the wire when the third harmonic is formed.
Figure 2
(1)
(g) High winds produce large amplitudes of vibration of the aerial wire.
Explain why the wire may sag when the high wind stops.
___________________________________________________________________
GetThoseGrades
___________________________________________________________________
___________________________________________________________________
___________________________________________________________________
(2)
(Total 13 marks)
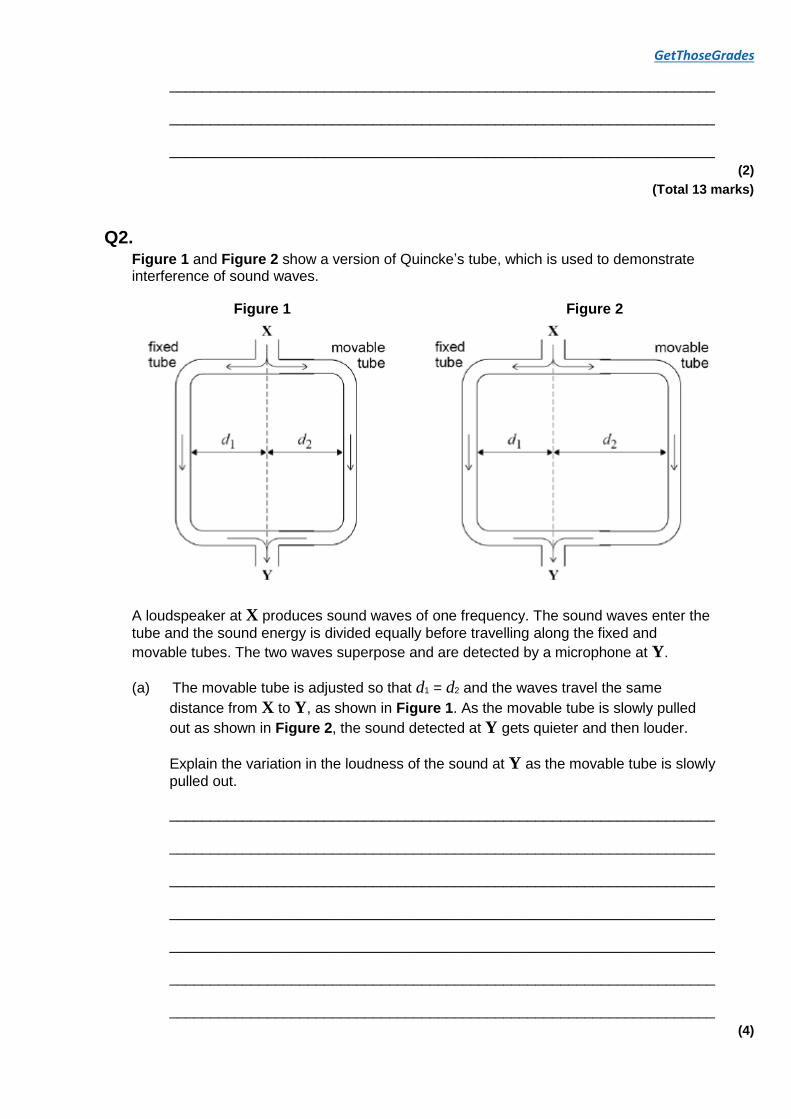
Q2. Figure 1 and Figure 2 show a version of Quincke’s tube, which is used to demonstrate interference of sound waves.
Figure 1 Figure 2
A loudspeaker at X produces sound waves of one frequency. The sound waves enter the
tube and the sound energy is divided equally before travelling along the fixed and
movable tubes. The two waves superpose and are detected by a microphone at Y.
(a) The movable tube is adjusted so that d1 = d2 and the waves travel the same
distance from X to Y, as shown in Figure 1. As the movable tube is slowly pulled
out as shown in Figure 2, the sound detected at Y gets quieter and then louder.
Explain the variation in the loudness of the sound at Y as the movable tube is slowly
pulled out.
___________________________________________________________________
___________________________________________________________________
___________________________________________________________________
___________________________________________________________________
___________________________________________________________________
___________________________________________________________________
___________________________________________________________________
(4)
GetThoseGrades
(b) The tube starts in the position shown in Figure 1.
Calculate the minimum distance moved by the movable tube for the sound detected
at Y to be at its quietest.
frequency of sound from loud speaker = 800 Hz speed of sound in air = 340 m s–1
minimum distance moved = ____________________ m
(3)
(c) Quincke’s tube can be used to determine the speed of sound.
State and explain the measurements you would make to obtain a value for the speed of sound using Quincke’s tube and a sound source of known frequency.
___________________________________________________________________
___________________________________________________________________
___________________________________________________________________
___________________________________________________________________
___________________________________________________________________
___________________________________________________________________
___________________________________________________________________
___________________________________________________________________
___________________________________________________________________
(4)
(Total 11 marks)
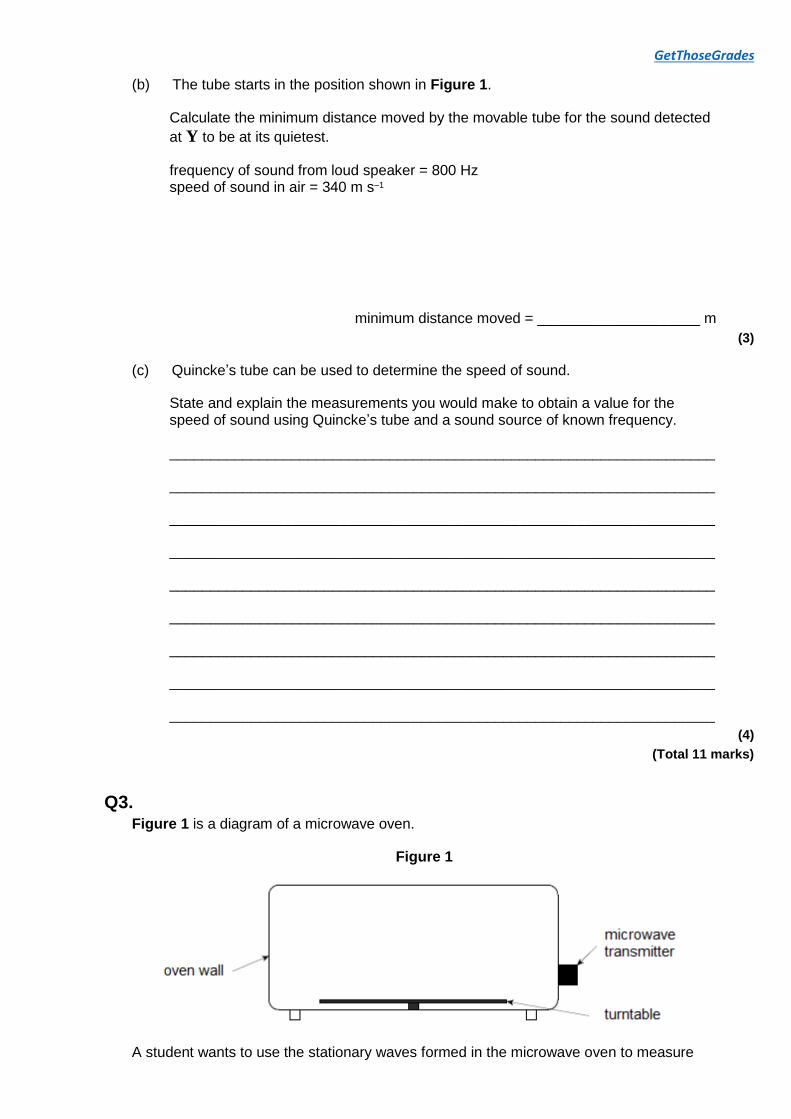
Q3. Figure 1 is a diagram of a microwave oven.
Figure 1
A student wants to use the stationary waves formed in the microwave oven to measure
GetThoseGrades
the frequency of the microwaves emitted by the transmitter.
(a) Suggest how stationary waves are formed in the microwave oven.
___________________________________________________________________
___________________________________________________________________
___________________________________________________________________
___________________________________________________________________
___________________________________________________________________
___________________________________________________________________
___________________________________________________________________
(2)
(b) The student removes the turntable and places a bar of chocolate on the floor of the oven. He then switches the oven on for about one minute. When the chocolate is removed the student observes that there are three small patches of melted chocolate with unmelted chocolate between them. Figure 2 is a full-sized diagram of the chocolate bar.
Figure 2
Suggest why the chocolate only melts in the positions shown.
___________________________________________________________________
___________________________________________________________________
___________________________________________________________________
___________________________________________________________________
(2)
(c) Calculate, by making suitable measurements on Figure 2, the frequency of the microwaves used by the oven.
frequency = ____________________ Hz
(5)
(d) Explain why most microwave ovens contain a rotating turntable on which the food is placed during cooking.
GetThoseGrades
___________________________________________________________________
___________________________________________________________________
___________________________________________________________________
(1)
(Total 10 marks)
Q4. (a) Explain what is meant by a progressive wave.
___________________________________________________________________
___________________________________________________________________
___________________________________________________________________
(2)
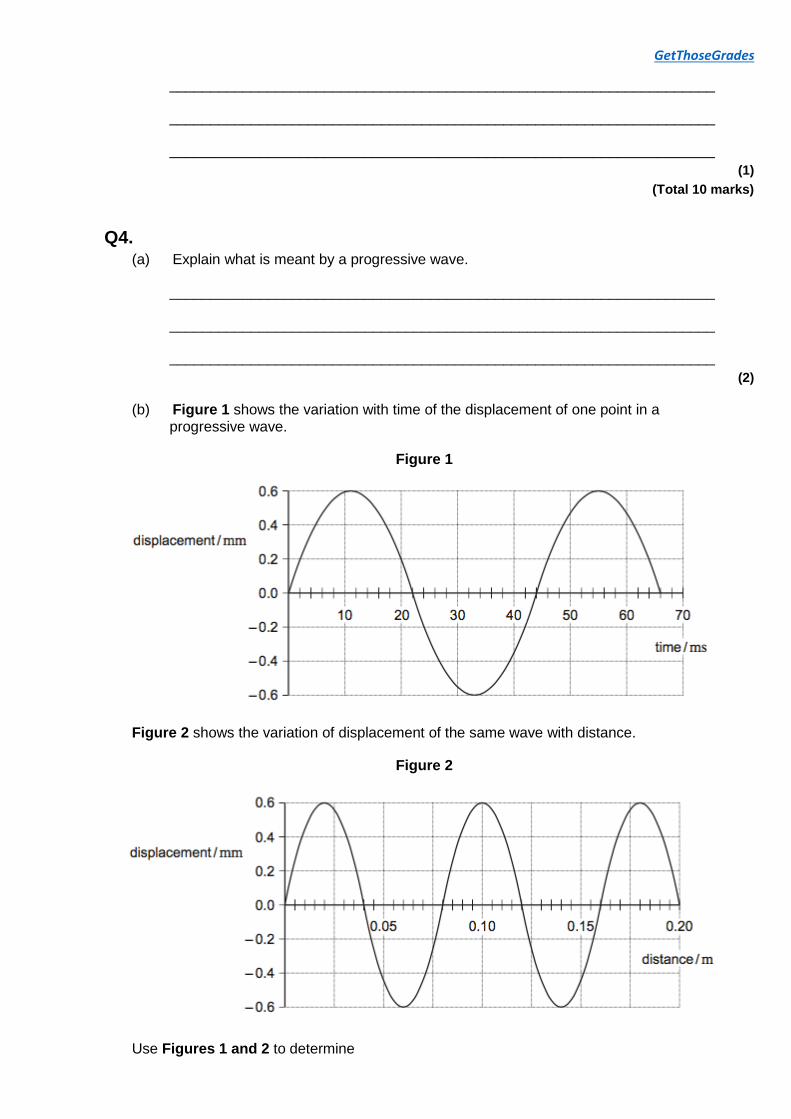
(b) Figure 1 shows the variation with time of the displacement of one point in a progressive wave.
Figure 1
Figure 2 shows the variation of displacement of the same wave with distance.
Figure 2
Use Figures 1 and 2 to determine
GetThoseGrades
(i) the amplitude of the wave
amplitude = ____________________ mm
(1)
(ii) the wavelength of the wave
wavelength = ____________________ m
(1)
(iii) the frequency of the wave
frequency = ____________________ Hz
(1)
(iv) the speed of the wave
speed = ____________________ m s−1
(1)
(c) Which of the following statements apply?
Place a tick (✔) in the right-hand column for each correct statement.
✔ if correct
sound waves are transverse
sound waves are longitudinal
sound waves can interfere
sound waves can be polarised
(1)
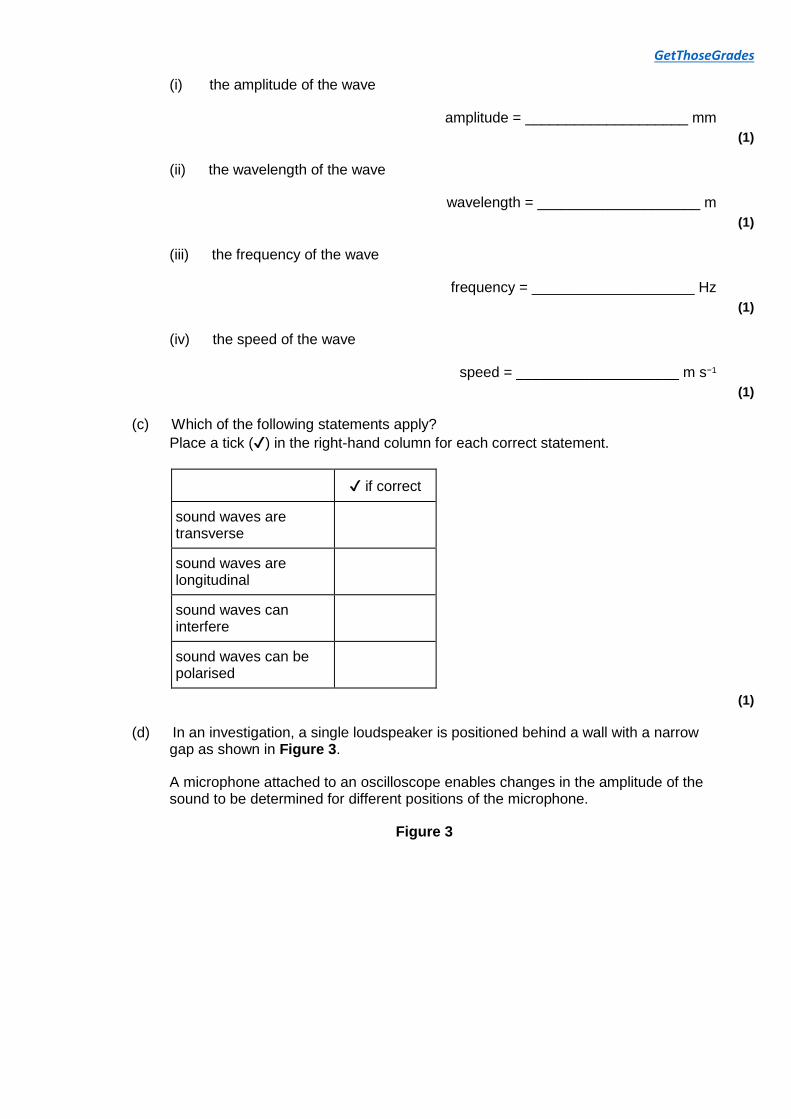
(d) In an investigation, a single loudspeaker is positioned behind a wall with a narrow gap as shown in Figure 3.
A microphone attached to an oscilloscope enables changes in the amplitude of the sound to be determined for different positions of the microphone.
Figure 3
GetThoseGrades
The amplitude of sound is recorded as the microphone position is moved along the line AB a large distance from the gap.
The result of the measurements is shown in Figure 4.
Figure 4
The signal generator is adjusted so that sound waves of the same amplitude but of a higher frequency are emitted by the loudspeaker. The investigation using the apparatus shown in Figure 3 is then repeated. Explain the effect this has on Figure 4.
___________________________________________________________________
___________________________________________________________________
GetThoseGrades
___________________________________________________________________
___________________________________________________________________
___________________________________________________________________
___________________________________________________________________
___________________________________________________________________
___________________________________________________________________
___________________________________________________________________
___________________________________________________________________
(3)
(Total 10 marks)
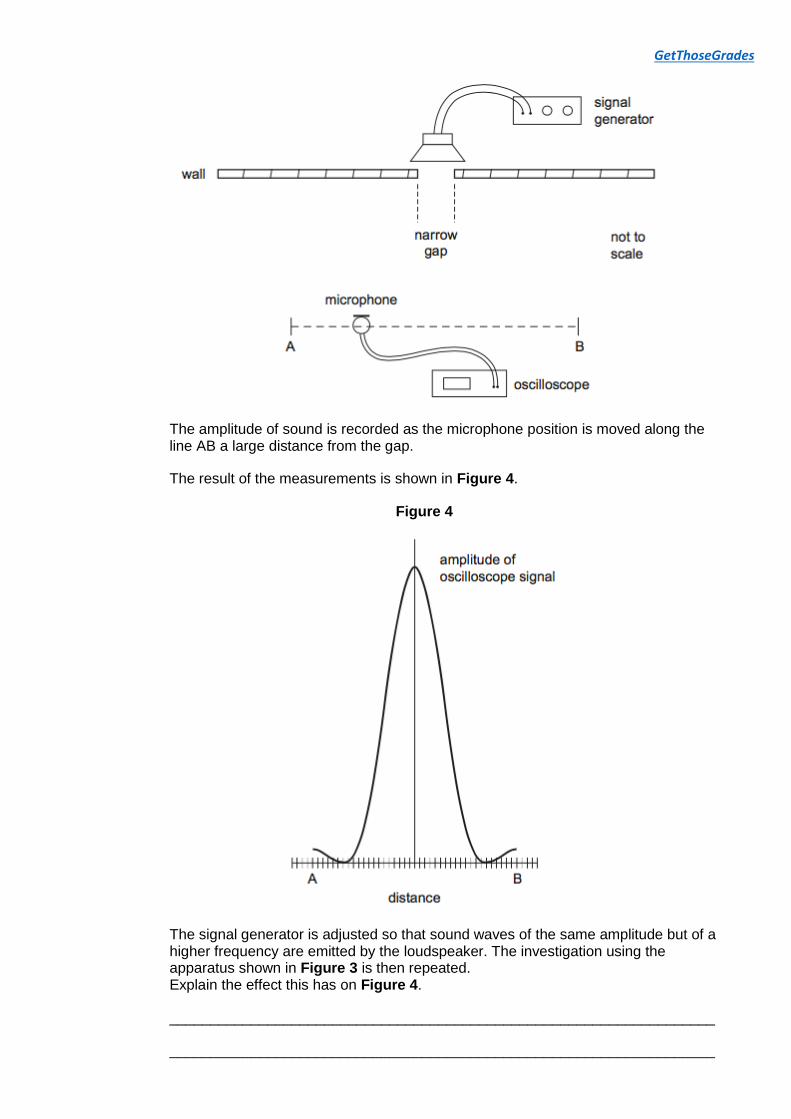
Q5. Read through the following passage and answer the questions that follow it.
Measuring the speed of sound in air
5 10
After the wave nature of sound had been identified, many attempts were made to measure its speed in air. The earliest known attempt was made by the French scientist Gassendi in the 17th century. The procedure involved timing the interval between seeing the flash of a gun and hearing the bang from some distance away. Gassendi assumed that, compared with the speed of sound, the speed of light is infinite. The value he obtained for the speed of sound was 480 m s–1. He also realised that the speed of sound does not depend on frequency. A much better value of 350 m s–1 was obtained by the Italian physicists Borelli and Viviani using the same procedure. In 1740 another Italian, Bianconi, showed that sound travels faster when the temperature of the air is greater. In 1738 a value of 332 m s–1 was obtained by scientists in Paris. This is remarkably close to the currently accepted value considering the measuring equipment available to the scientists at that time. Since 1986 the accepted value has been 331.29 m s–1 at 0 °C.
(a) Suggest an experiment that will demonstrate the wave nature of sound (line 1).
___________________________________________________________________
___________________________________________________________________
___________________________________________________________________
(1)
(b) Using Gassendi’s value for the speed of sound (line 6), calculate the time between seeing the flash of a gun and hearing its bang over a distance of 2.5 km.
time = ____________________ s
(1)
GetThoseGrades
(c) Explain why it was necessary to assume that ‘compared with the speed of sound, the speed of light is infinite’ (line 5).
___________________________________________________________________
___________________________________________________________________
___________________________________________________________________
(1)
(d) Explain one observation that could have led Gassendi to conclude that ‘the speed of sound does not depend on frequency’ (line 7).
___________________________________________________________________
___________________________________________________________________
___________________________________________________________________
___________________________________________________________________
___________________________________________________________________
___________________________________________________________________
(2)
(e) Explain how the value obtained by Borelli and Viviani was ‘much better’ than that obtained by Gassendi (line 8).
___________________________________________________________________
___________________________________________________________________
(1)
(f) The speed of sound c in dry air is given by
where θ is the temperature in °C, and k is a constant.
Calculate a value for k using data from the passage.
k = ____________________ m s–1 K–½
(2)
(g) State the steps taken by the scientific community for the value of a quantity to be ‘accepted’ (line 13).
___________________________________________________________________
___________________________________________________________________
GetThoseGrades
___________________________________________________________________
___________________________________________________________________
(2)
(Total 10 marks)
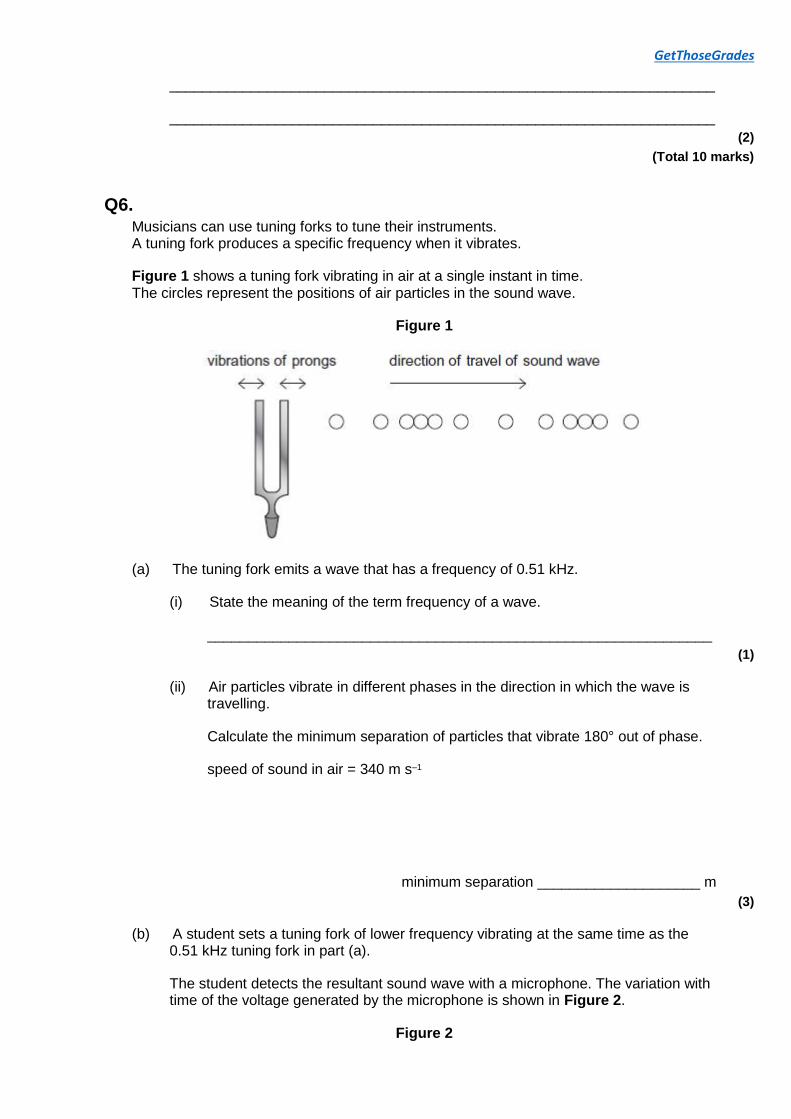
Q6. Musicians can use tuning forks to tune their instruments. A tuning fork produces a specific frequency when it vibrates.
Figure 1 shows a tuning fork vibrating in air at a single instant in time. The circles represent the positions of air particles in the sound wave.
Figure 1
(a) The tuning fork emits a wave that has a frequency of 0.51 kHz.
(i) State the meaning of the term frequency of a wave.
______________________________________________________________
(1)
(ii) Air particles vibrate in different phases in the direction in which the wave is travelling.
Calculate the minimum separation of particles that vibrate 180° out of phase.
speed of sound in air = 340 m s–1
minimum separation ____________________ m
(3)
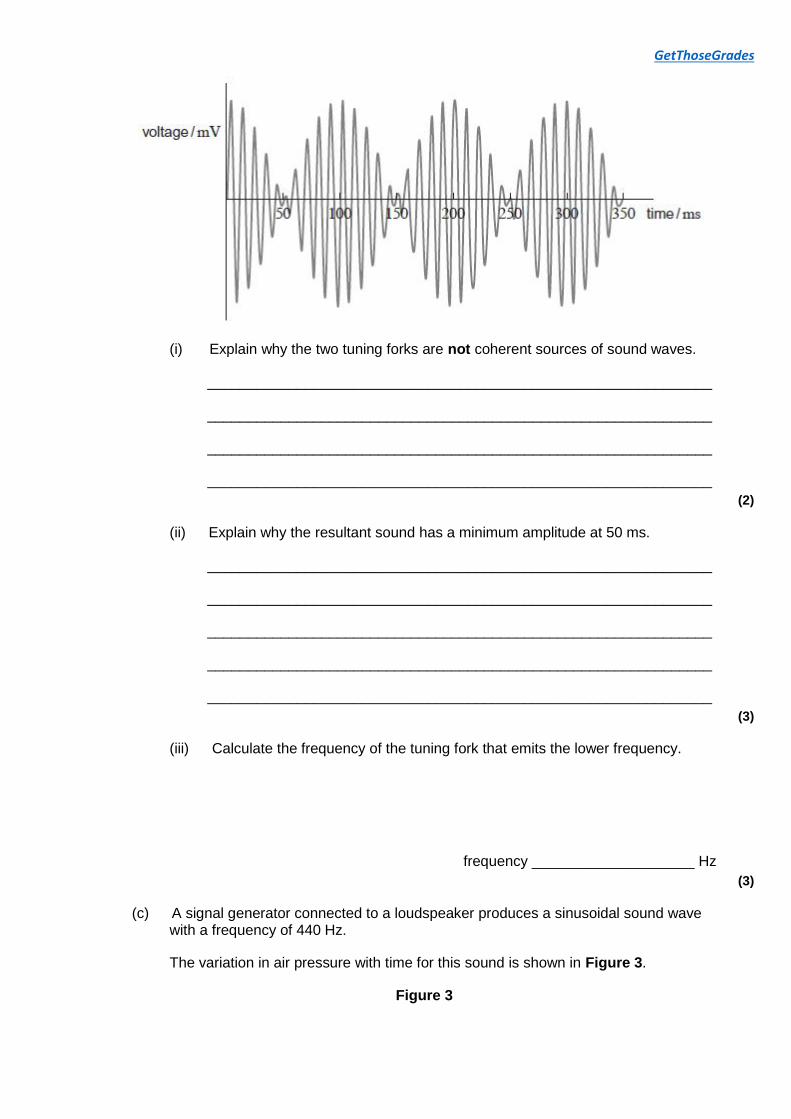
(b) A student sets a tuning fork of lower frequency vibrating at the same time as the 0.51 kHz tuning fork in part (a).
The student detects the resultant sound wave with a microphone. The variation with time of the voltage generated by the microphone is shown in Figure 2.
Figure 2
GetThoseGrades
(i) Explain why the two tuning forks are not coherent sources of sound waves.
______________________________________________________________
______________________________________________________________
______________________________________________________________
______________________________________________________________
(2)
(ii) Explain why the resultant sound has a minimum amplitude at 50 ms.
______________________________________________________________
______________________________________________________________
______________________________________________________________
______________________________________________________________
______________________________________________________________
(3)
(iii) Calculate the frequency of the tuning fork that emits the lower frequency.
frequency ____________________ Hz
(3)
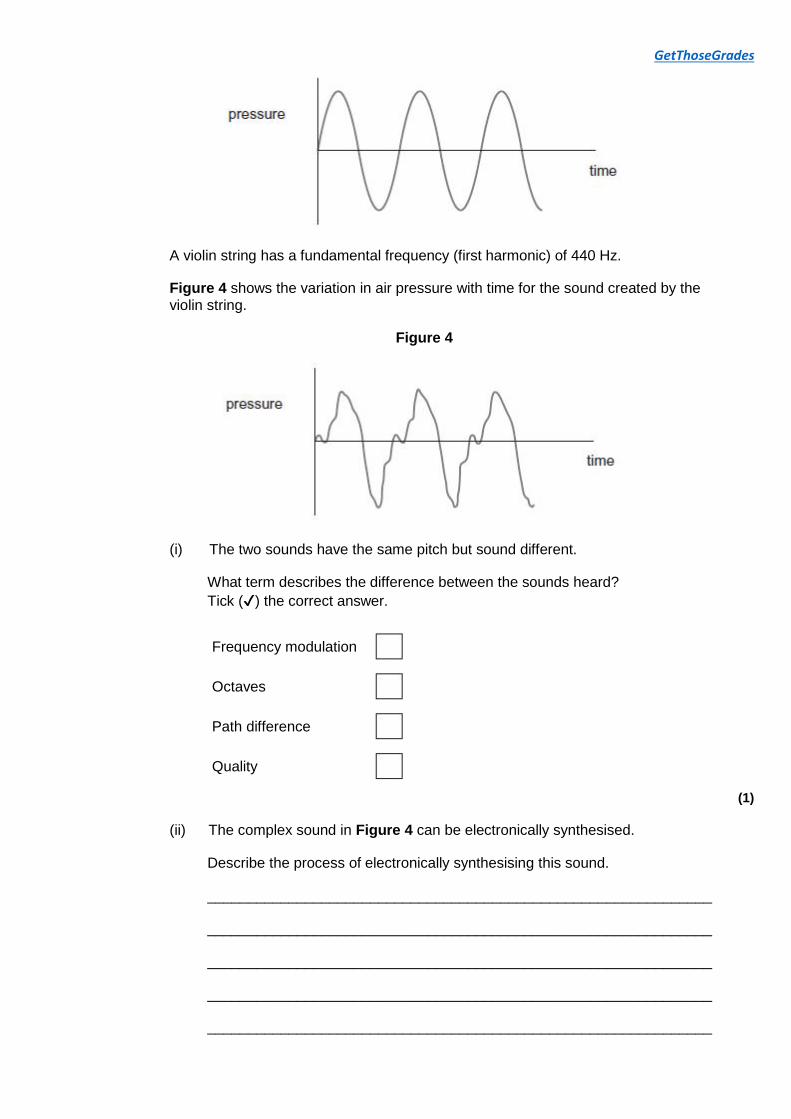
(c) A signal generator connected to a loudspeaker produces a sinusoidal sound wave with a frequency of 440 Hz.
The variation in air pressure with time for this sound is shown in Figure 3.
Figure 3
GetThoseGrades
A violin string has a fundamental frequency (first harmonic) of 440 Hz.
Figure 4 shows the variation in air pressure with time for the sound created by the violin string.
Figure 4
(i) The two sounds have the same pitch but sound different.
What term describes the difference between the sounds heard?
Tick (✔) the correct answer.
Frequency modulation
Octaves
Path difference
Quality
(1)
(ii) The complex sound in Figure 4 can be electronically synthesised.
Describe the process of electronically synthesising this sound.
______________________________________________________________
______________________________________________________________
______________________________________________________________
______________________________________________________________
______________________________________________________________
GetThoseGrades
______________________________________________________________
______________________________________________________________
(3)
(Total 16 marks)
Q7. Describe a laboratory experiment to investigate how the fundamental frequency of a stretched string depends on the tension in the string. The stretched string has a mass per unit length of 1.5 × 10⁻³ kg m–1.
Your detailed method should include: • a labelled diagram of the experiment arrangement • suitable estimates of any quantities involved in the experiment • how you would use the data to demonstrate the relationship between fundamental frequency and tension.
The quality of your written communication will be assessed in your answer.
(Total 6 marks)
Q8. The term ultrasound refers to vibrations in a material that occur at frequencies too high to be detected by a human ear. When ultrasound waves move through a solid, both longitudinal and transverse vibrations may be involved. For the longitudinal vibrations in a
solid, the speed c of the ultrasound wave is given by
where E is the Young modulus of the material and ρ is the density. Values for c and ρ are
given in the table below.
Substance c / m s−1 ρ / kg m−3
glass 5100 2500
sea water 1400 1000
Ultrasound waves, like electromagnetic radiation, can travel through the surface between two materials. When all the energy is transmitted from one material to the other, the
materials are said to be acoustically matched. This happens when ρc is the same for
both materials.
(a) Calculate the magnitude of the Young modulus for glass.
Young modulus = ____________________
(1)
GetThoseGrades
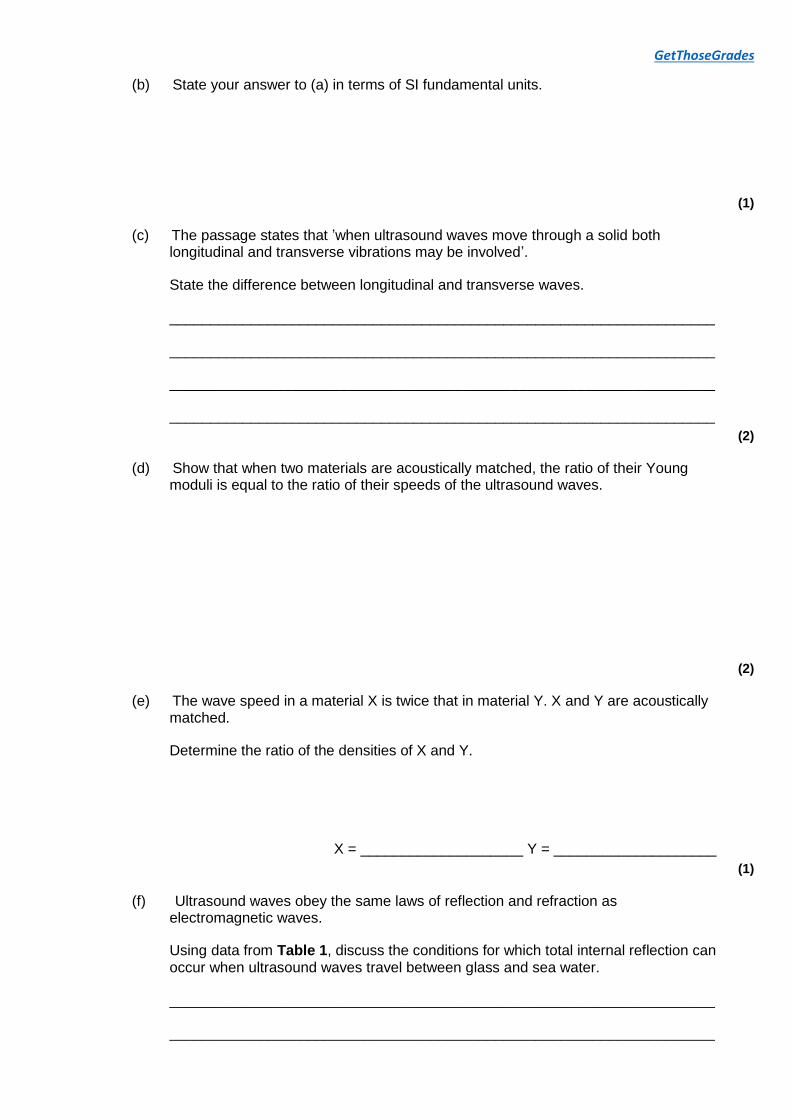
(b) State your answer to (a) in terms of SI fundamental units.
(1)
(c) The passage states that ’when ultrasound waves move through a solid both longitudinal and transverse vibrations may be involved’.
State the difference between longitudinal and transverse waves.
___________________________________________________________________
___________________________________________________________________
___________________________________________________________________
___________________________________________________________________
(2)
(d) Show that when two materials are acoustically matched, the ratio of their Young moduli is equal to the ratio of their speeds of the ultrasound waves.
(2)
(e) The wave speed in a material X is twice that in material Y. X and Y are acoustically matched.
Determine the ratio of the densities of X and Y.
X = ____________________ Y = ____________________
(1)
(f) Ultrasound waves obey the same laws of reflection and refraction as electromagnetic waves.
Using data from Table 1, discuss the conditions for which total internal reflection can occur when ultrasound waves travel between glass and sea water.
___________________________________________________________________
___________________________________________________________________
GetThoseGrades
___________________________________________________________________
___________________________________________________________________
___________________________________________________________________
___________________________________________________________________
___________________________________________________________________
___________________________________________________________________
(3)
(Total 10 marks)
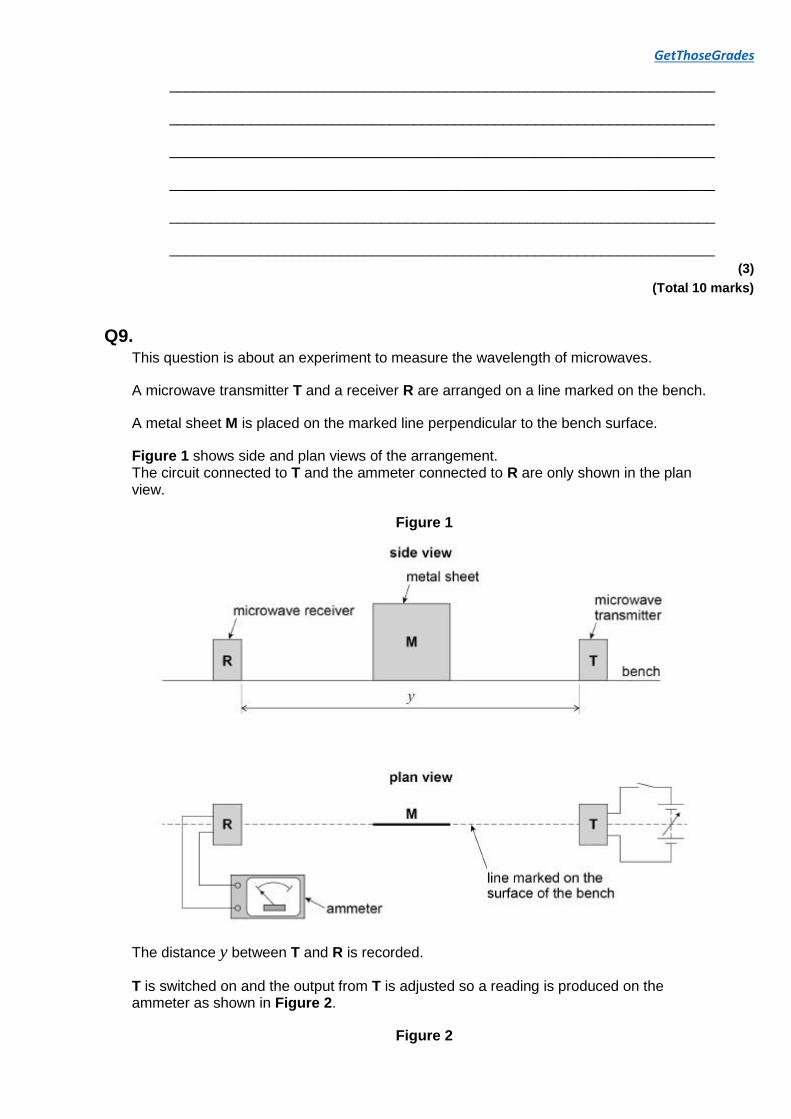
Q9. This question is about an experiment to measure the wavelength of microwaves.
A microwave transmitter T and a receiver R are arranged on a line marked on the bench.
A metal sheet M is placed on the marked line perpendicular to the bench surface.
Figure 1 shows side and plan views of the arrangement. The circuit connected to T and the ammeter connected to R are only shown in the plan view.
Figure 1
The distance y between T and R is recorded.
T is switched on and the output from T is adjusted so a reading is produced on the ammeter as shown in Figure 2.
Figure 2
GetThoseGrades
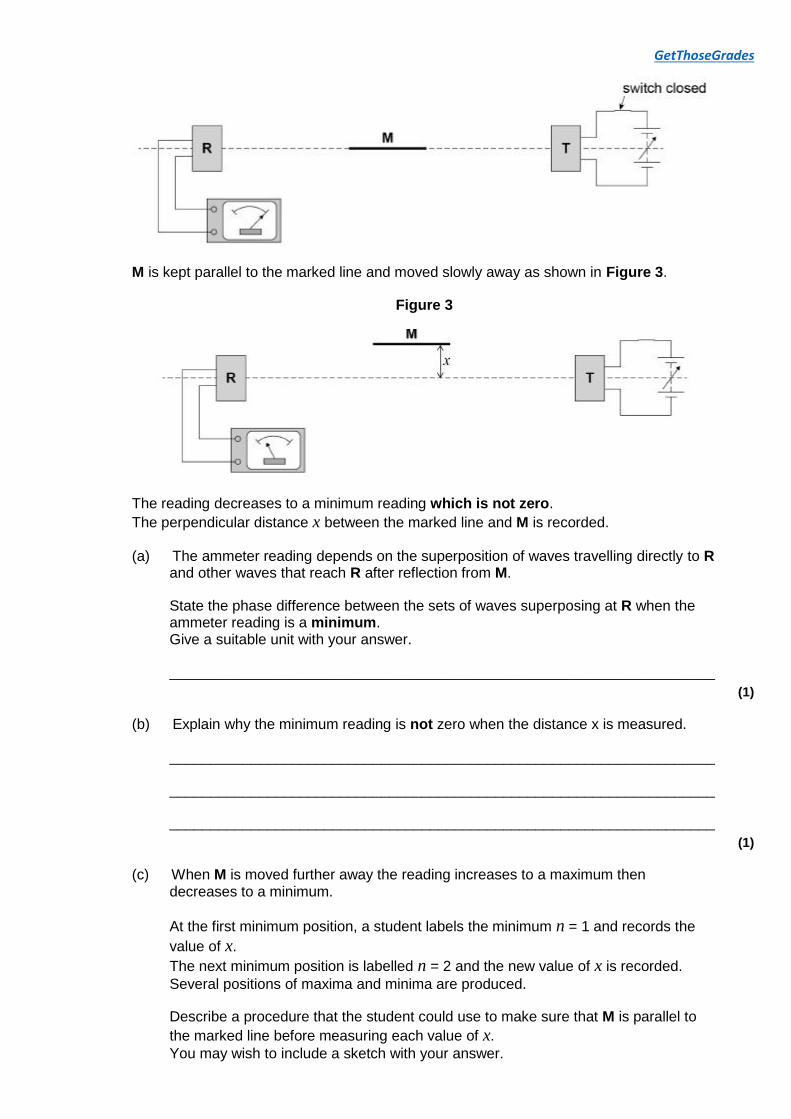
M is kept parallel to the marked line and moved slowly away as shown in Figure 3.
Figure 3
The reading decreases to a minimum reading which is not zero.
The perpendicular distance x between the marked line and M is recorded.
(a) The ammeter reading depends on the superposition of waves travelling directly to R and other waves that reach R after reflection from M.
State the phase difference between the sets of waves superposing at R when the ammeter reading is a minimum. Give a suitable unit with your answer.
___________________________________________________________________
(1)
(b) Explain why the minimum reading is not zero when the distance x is measured.
___________________________________________________________________
___________________________________________________________________
___________________________________________________________________
(1)
(c) When M is moved further away the reading increases to a maximum then decreases to a minimum.
At the first minimum position, a student labels the minimum n = 1 and records the
value of x.
The next minimum position is labelled n = 2 and the new value of x is recorded.
Several positions of maxima and minima are produced.
Describe a procedure that the student could use to make sure that M is parallel to
the marked line before measuring each value of x.
You may wish to include a sketch with your answer.
GetThoseGrades
___________________________________________________________________
___________________________________________________________________
___________________________________________________________________
___________________________________________________________________
___________________________________________________________________
___________________________________________________________________
___________________________________________________________________
___________________________________________________________________
(2)
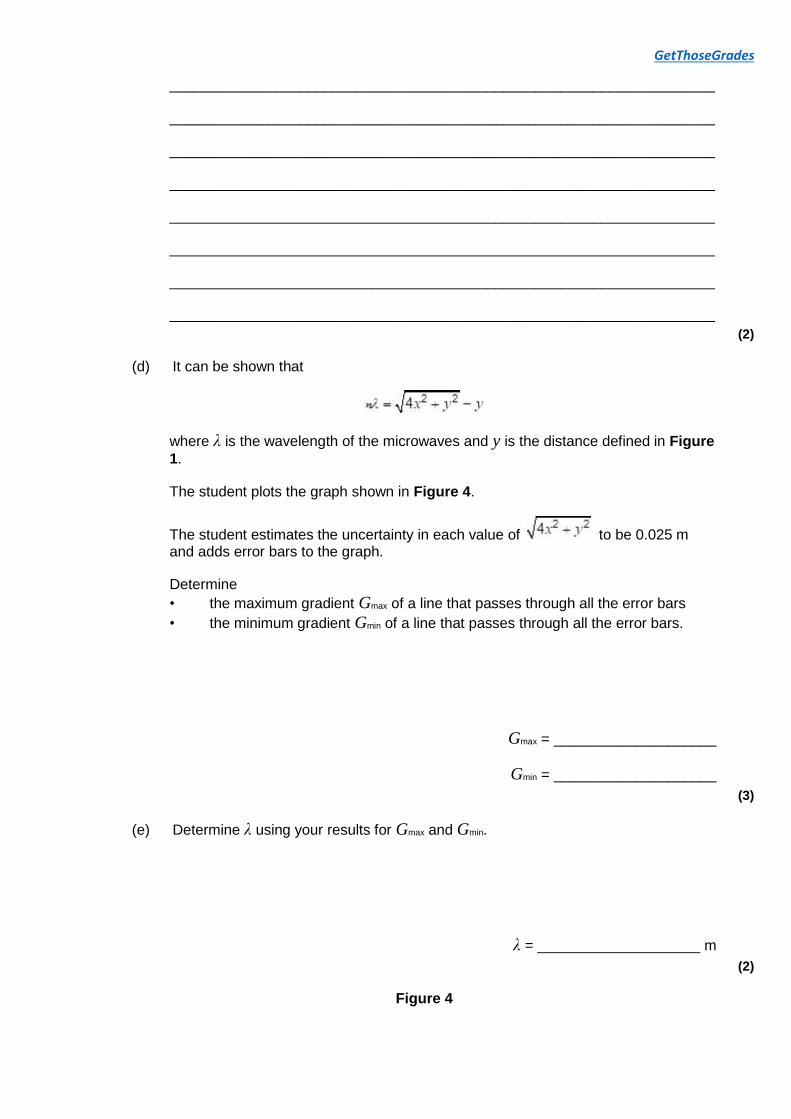
(d) It can be shown that
where λ is the wavelength of the microwaves and y is the distance defined in Figure
1.
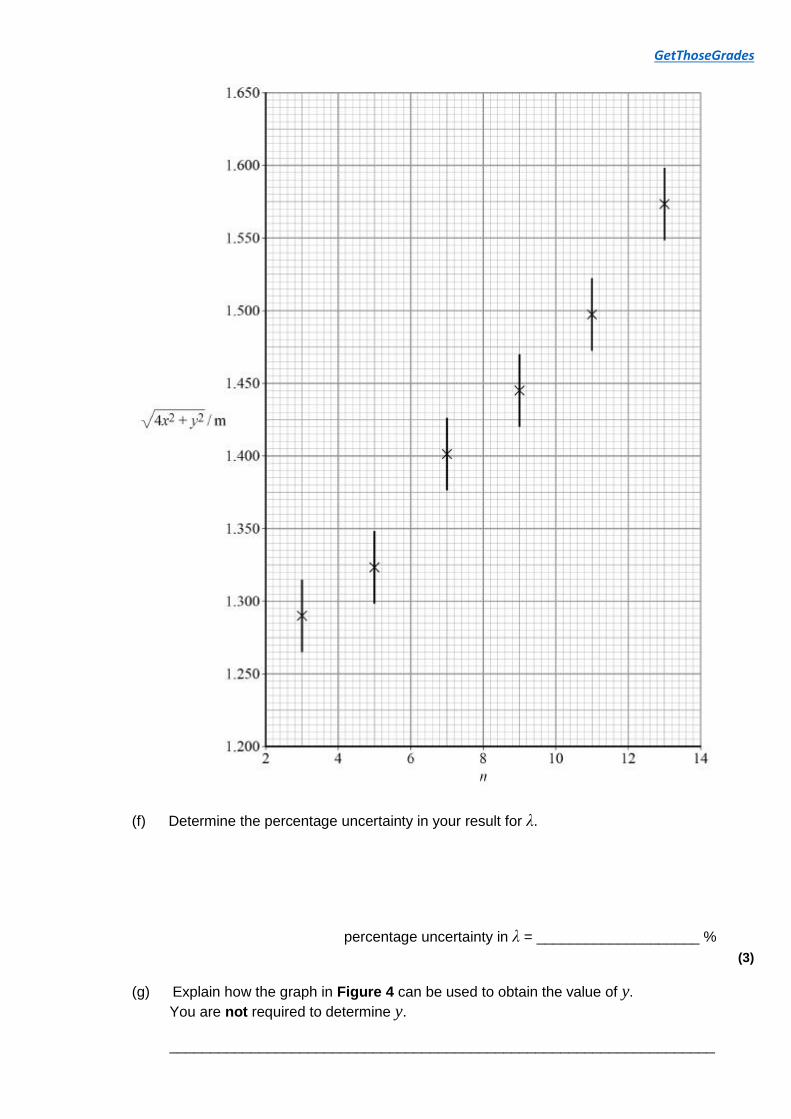
The student plots the graph shown in Figure 4.
The student estimates the uncertainty in each value of to be 0.025 m and adds error bars to the graph.
Determine
• the maximum gradient Gmax of a line that passes through all the error bars
• the minimum gradient Gmin of a line that passes through all the error bars.
Gmax = ____________________
Gmin = ____________________
(3)
(e) Determine λ using your results for Gmax and Gmin.
λ = ____________________ m
(2)
Figure 4
GetThoseGrades
(f) Determine the percentage uncertainty in your result for λ.
percentage uncertainty in λ = ____________________ %
(3)
(g) Explain how the graph in Figure 4 can be used to obtain the value of y.
You are not required to determine y.
___________________________________________________________________
GetThoseGrades
___________________________________________________________________
___________________________________________________________________
___________________________________________________________________
___________________________________________________________________
___________________________________________________________________
___________________________________________________________________
___________________________________________________________________
___________________________________________________________________
(2)
(h) Suppose that the data for n = 13 had not been plotted on Figure 4.
Add a tick (✔) in each row of the table to identify the effect, if any, on the results you
would obtain for Gmax, Gmin, λ and y.
Result Reduced Not affected increased
Gmax
Gmin
λ
y
(4)
(Total 18 marks)
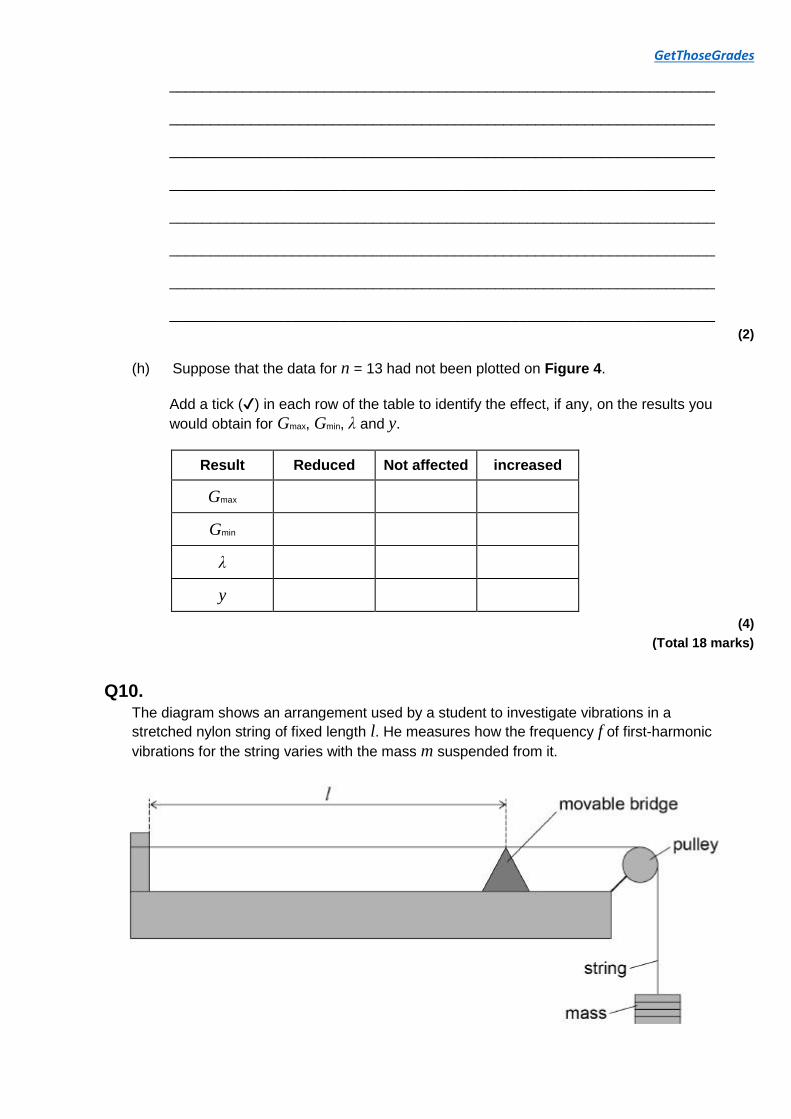
Q10. The diagram shows an arrangement used by a student to investigate vibrations in a
stretched nylon string of fixed length l. He measures how the frequency f of first-harmonic
vibrations for the string varies with the mass m suspended from it.
GetThoseGrades
The table shows the results of the experiment.
m / kg f / Hz
0.50 110
0.80 140
1.20 170
(a) Show that the data in the table are consistent with the relationship
f ∝ √T
where T is the tension in the nylon string.
(2)
(b) The nylon string used has a density of 1150 kg m–3 and a uniform diameter of 5.0 × 10⁻⁴ m.
Determine the length l of the string used.
l = ____________________ m
(3)
(c) The student uses the relationship in question (a) to predict frequencies for tensions that are much larger than those used in the original experiment.
Explain how the actual frequencies produced would be different from those that the student predicts.
___________________________________________________________________
___________________________________________________________________
___________________________________________________________________
___________________________________________________________________
(2)
(Total 7 marks)
GetThoseGrades
Q11. Which row correctly shows electromagnetic radiations in order of decreasing wavelength?
A gamma > ultraviolet > microwave
B ultraviolet > gamma > microwave
C microwave > ultraviolet > gamma
D gamma > microwave > ultraviolet
(Total 1 mark)
Q12. Which statement is correct about the properties of an unpolarised electromagnetic wave as it passes through a polariser?
A The wave remains unchanged.
B The wave does not pass through the polariser.
C The wave’s electric field oscillates along the direction of travel.
D The intensity of the wave is reduced.
(Total 1 mark)
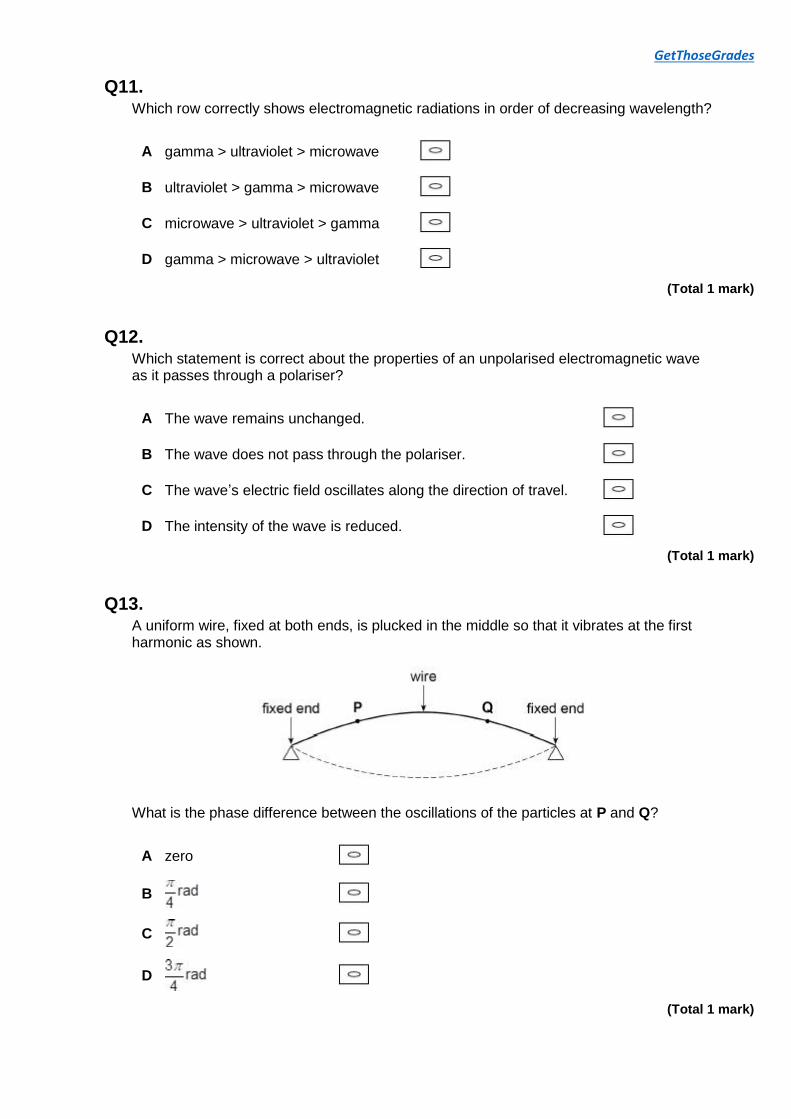
Q13. A uniform wire, fixed at both ends, is plucked in the middle so that it vibrates at the first harmonic as shown.
What is the phase difference between the oscillations of the particles at P and Q?
A zero
B
C
D
(Total 1 mark)
GetThoseGrades
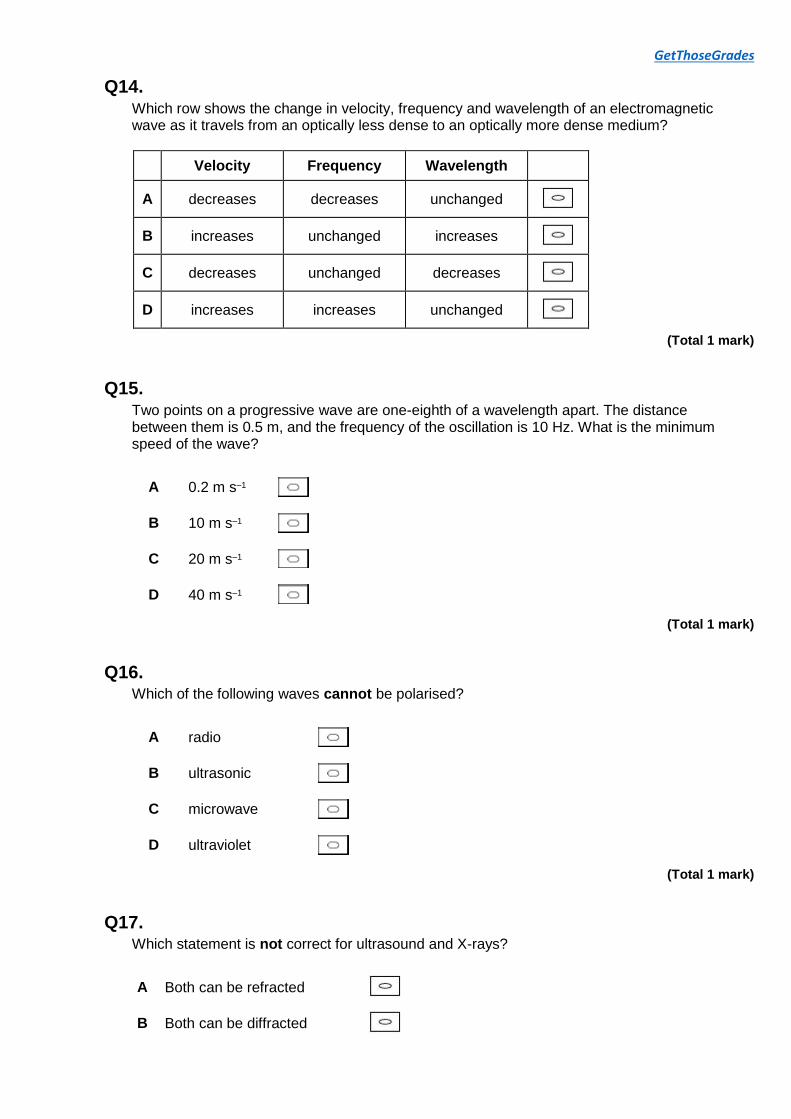
Q14. Which row shows the change in velocity, frequency and wavelength of an electromagnetic wave as it travels from an optically less dense to an optically more dense medium?
Velocity Frequency Wavelength
A decreases decreases unchanged
B increases unchanged increases
C decreases unchanged decreases
D increases increases unchanged
(Total 1 mark)
Q15. Two points on a progressive wave are one-eighth of a wavelength apart. The distance between them is 0.5 m, and the frequency of the oscillation is 10 Hz. What is the minimum speed of the wave?
A 0.2 m s–1
B 10 m s–1
C 20 m s–1
D 40 m s–1
(Total 1 mark)
Q16. Which of the following waves cannot be polarised?
A radio
B ultrasonic
C microwave
D ultraviolet
(Total 1 mark)
Q17. Which statement is not correct for ultrasound and X-rays?
A Both can be refracted
B Both can be diffracted
GetThoseGrades
C Both can be polarised
D Both can be reflected
(Total 1 mark)
Q18. Which of the following is correct for a stationary wave?
A Between two nodes the amplitude of the wave is constant.
B The two waves producing the stationary wave must always be 180° out of phase.
C The separation of the nodes for the second harmonic is double the separation of nodes for the first harmonic.
D Between two nodes all parts of the wave vibrate in phase.
(Total 1 mark)
Q19. Sound waves cross a boundary between two media X and Y. The frequency of the waves in X is 400 Hz. The speed of the waves in X is 330 m s–1 and the speed of the waves in Y is 1320 m s–1. What are the correct frequency and wavelength in Y?
Frequency / Hz Wavelength / m
A 100 0.82
B 400 0.82
C 400 3.3
D 1600 3.3
(Total 1 mark)
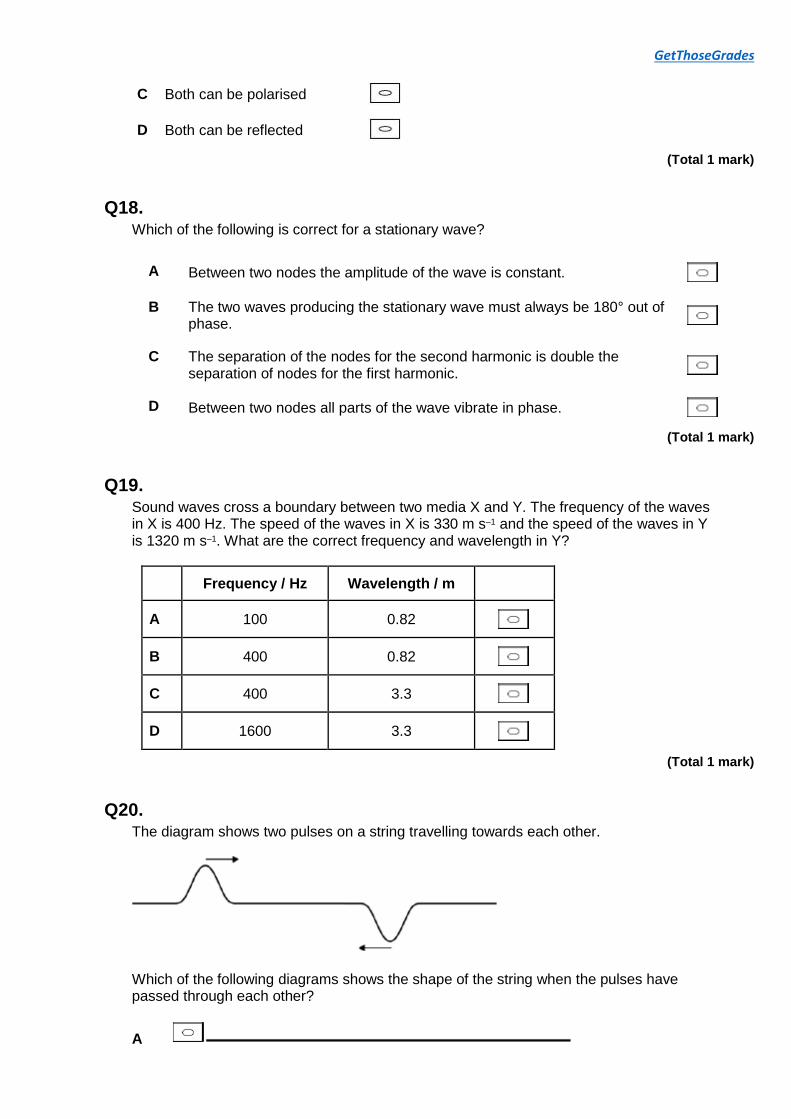
Q20. The diagram shows two pulses on a string travelling towards each other.
Which of the following diagrams shows the shape of the string when the pulses have passed through each other?
A
GetThoseGrades
B
C
D
(Total 1 mark)
Q21. Which one of the following provides direct experimental evidence that light is a transverse wave motion rather than a longitudinal wave motion?
A Two light waves that are coherent can be made to interfere.
B Light can be diffracted.
C Light can be polarised.
D The intensity of light from a point source falls off inversely as the square of the distance from the source.
(Total 1 mark)
Q22.
The frequency of the first harmonic of a standing wave on a wire is f. The length of the
wire and tension in the wire are both doubled.
What is the frequency of the first harmonic as a result?
A
B f
C
D 2f
(Total 1 mark)
Q23. What is the phase difference between two points 0.16 m apart on a progressive sound
GetThoseGrades
wave of frequency 256 Hz?
speed of sound = 330 m s–1
A
B
C
D
(Total 1 mark)
Q24.
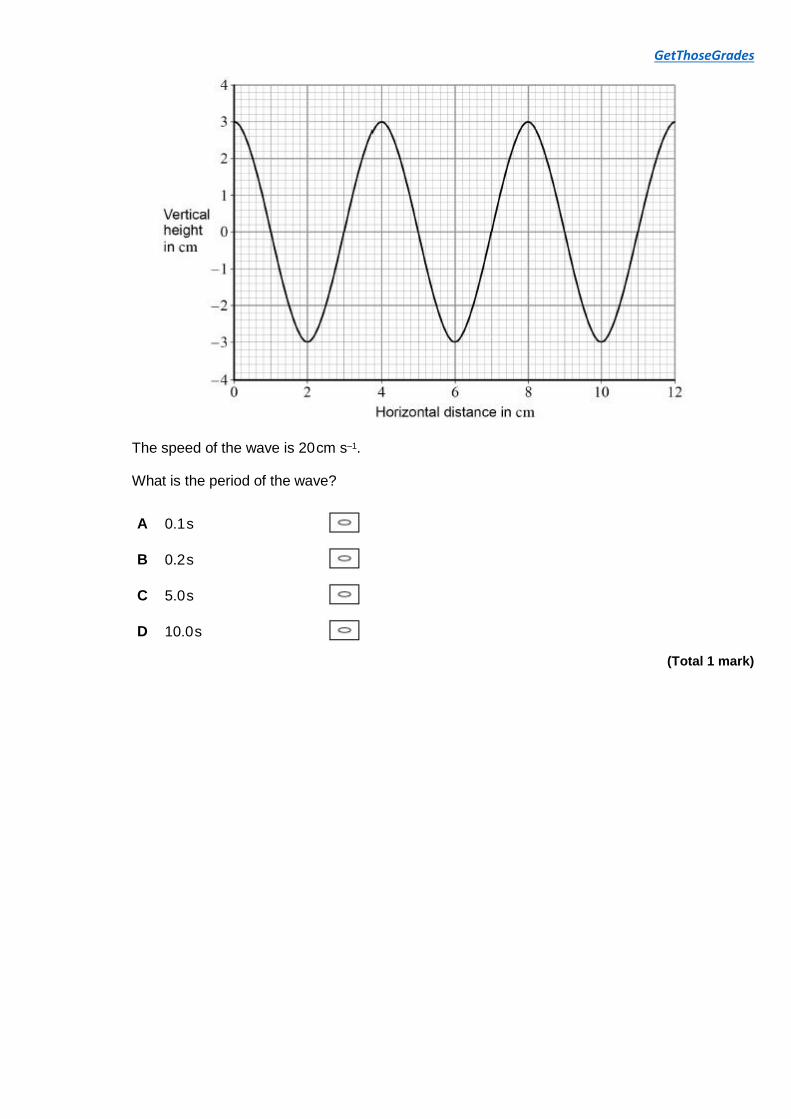
A stationary wave is set up on a stretched string of length l and diameter d.
Another stationary wave is also set up on a second string made from the same material and with the same tension as the first.
What length and diameter are required for the second string so that both strings have the same first-harmonic frequency?
Length of second string Diameter of second string
A 2l 2d
B l 2d
C
2d
D l
(Total 1 mark)
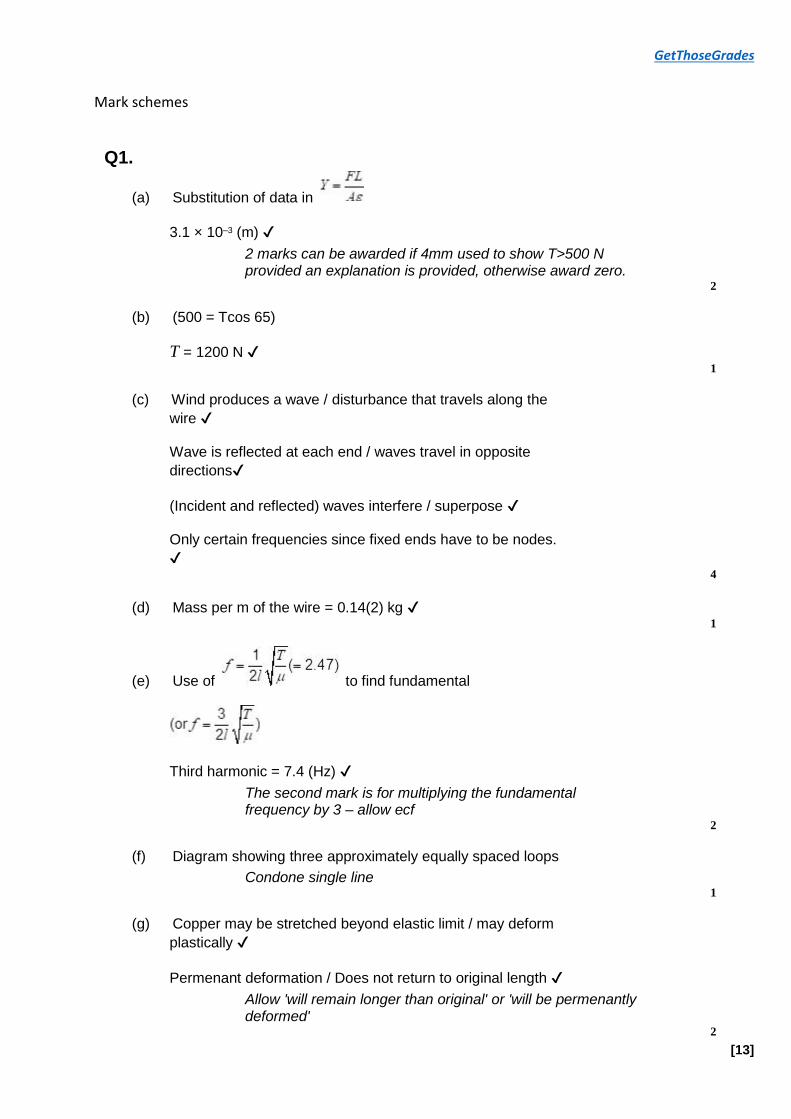
Q25. The graph shows how the vertical height of a travelling wave varies with distance along the path of the wave.
GetThoseGrades
The speed of the wave is 20 cm s–1.
What is the period of the wave?
A 0.1 s
B 0.2 s
C 5.0 s
D 10.0 s
(Total 1 mark)
GetThoseGrades
Mark schemes
Q1.
(a) Substitution of data in
3.1 × 10⁻³ (m) ✔
2 marks can be awarded if 4mm used to show T>500 N provided an explanation is provided, otherwise award zero.
2
(b) (500 = Tcos 65)
T = 1200 N ✔ 1
(c) Wind produces a wave / disturbance that travels along the
wire ✔
Wave is reflected at each end / waves travel in opposite
directions✔
(Incident and reflected) waves interfere / superpose ✔
Only certain frequencies since fixed ends have to be nodes.
✔ 4
(d) Mass per m of the wire = 0.14(2) kg ✔ 1
(e) Use of to find fundamental
Third harmonic = 7.4 (Hz) ✔
The second mark is for multiplying the fundamental frequency by 3 – allow ecf
2
(f) Diagram showing three approximately equally spaced loops
Condone single line 1
(g) Copper may be stretched beyond elastic limit / may deform
plastically ✔
Permenant deformation / Does not return to original length ✔
Allow 'will remain longer than original' or 'will be permenantly deformed'
2
[13]
GetThoseGrades
Q2. (a) Initially the path difference is zero/the two waves are in phase when they meet/the
(resultant) displacement is a maximum ✓
Alternative:
Constructive interference occurs when the path difference is a whole number of wavelengths and the waves are in phase
1
As the movable tube is pulled out, the path difference increases and the two
waves are no longer in phase, so the displacement and loudness decrease ✓
Destructive interference occurs when the path difference is an odd number of half wavelengths and the waves are in antiphase
1
When the path difference is one half wavelength, the two are in antiphase and
sound is at its quietest. ✓
Initially the path difference is zero and the sound is loud 1
As the path difference continues to increase, the two waves become more in
phase and the sound gets louder again. ✓
As the pipe is pulled out the path difference gradually increases, changing the phase relationship and hence the loudness of the sound
1
(b) Use of wavelength = speed / frequency
The first mark is for calculating the wavelength 1
To give: 340 / 800 = 0.425 m ✓
Path difference = one half wavelength = 0.21 m ✓
The second mark is for relating the wavelength to the path difference
Path difference = 2 (d2 – d1) = 2 (distance moved by movable tube) 1
Distance moved by movable tube = 0.10 m. ✓
The final mark is for relating this to the distance moved by the tube and working out the final answer.
1
(c) Start with d1 = d2
(Alternative mark scheme involving changing frequency and measuring to first min for each one can gain equal credit)
Measure distance moved by movable tube for each successive minima and
maxima✓
Start with d1 = d2
Measure distance moved by movable tube for first minimum. 1
GetThoseGrades
Each change in distance is equal to one quarter wavelength. ✓
Distance is equal to one quarter wavelength 1
Continue until tube is at greatest distance or repeat readings for decreasing
distance back to starting point. ✓
Repeat for different measured frequencies. 1
Use speed = frequency x wavelength ✓
Use speed = frequency x wavelength) 1
[11]
Q3.
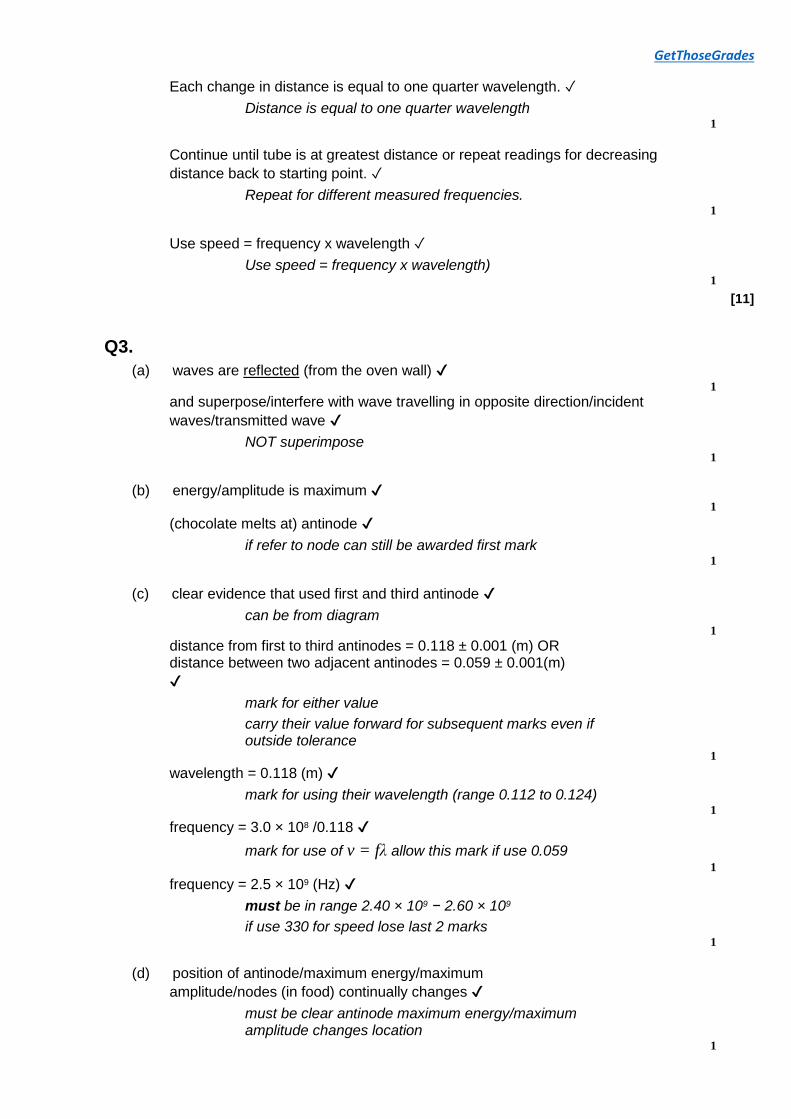
(a) waves are reflected (from the oven wall) ✔ 1
and superpose/interfere with wave travelling in opposite direction/incident
waves/transmitted wave ✔
NOT superimpose 1
(b) energy/amplitude is maximum ✔ 1
(chocolate melts at) antinode ✔
if refer to node can still be awarded first mark 1
(c) clear evidence that used first and third antinode ✔
can be from diagram 1
distance from first to third antinodes = 0.118 ± 0.001 (m) OR distance between two adjacent antinodes = 0.059 ± 0.001(m)
✔
mark for either value
carry their value forward for subsequent marks even if outside tolerance
1
wavelength = 0.118 (m) ✔
mark for using their wavelength (range 0.112 to 0.124) 1
frequency = 3.0 × 10⁸ /0.118 ✔
mark for use of v = fλ allow this mark if use 0.059 1
frequency = 2.5 × 10⁹ (Hz) ✔
must be in range 2.40 × 10⁹ − 2.60 × 10⁹
if use 330 for speed lose last 2 marks 1
(d) position of antinode/maximum energy/maximum
amplitude/nodes (in food) continually changes ✔
must be clear antinode maximum energy/maximum amplitude changes location
1
GetThoseGrades
[10]
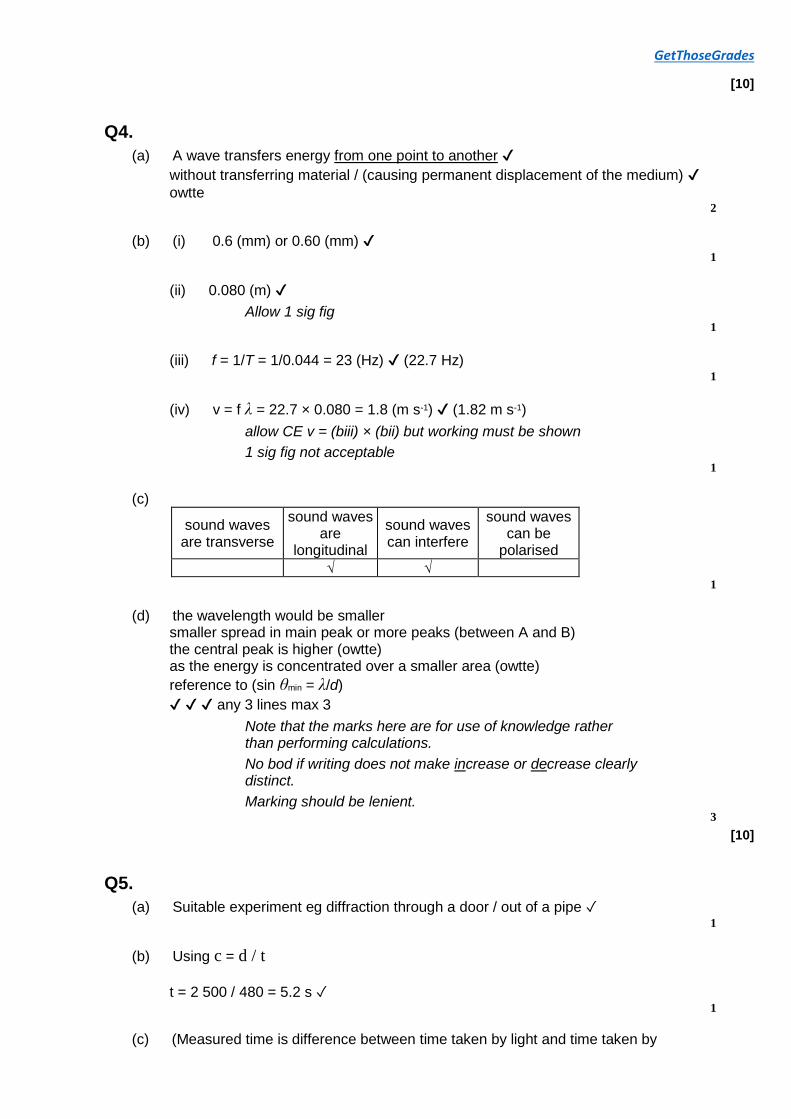
Q4.
(a) A wave transfers energy from one point to another ✔
without transferring material / (causing permanent displacement of the medium) ✔
owtte 2
(b) (i) 0.6 (mm) or 0.60 (mm) ✔ 1
(ii) 0.080 (m) ✔
Allow 1 sig fig 1
(iii) f = 1/T = 1/0.044 = 23 (Hz) ✔ (22.7 Hz) 1
(iv) v = f λ = 22.7 × 0.080 = 1.8 (m s-1) ✔ (1.82 m s-1)
allow CE v = (biii) × (bii) but working must be shown
1 sig fig not acceptable 1
(c)
sound waves are transverse
sound waves are
longitudinal
sound waves can interfere
sound waves can be
polarised
√ √ 1
(d) the wavelength would be smaller smaller spread in main peak or more peaks (between A and B) the central peak is higher (owtte) as the energy is concentrated over a smaller area (owtte)
reference to (sin θmin = λ/d)
✔ ✔ ✔ any 3 lines max 3
Note that the marks here are for use of knowledge rather than performing calculations.
No bod if writing does not make increase or decrease clearly distinct.
Marking should be lenient. 3
[10]
Q5.
(a) Suitable experiment eg diffraction through a door / out of a pipe ✓ 1
(b) Using c = d / t
t = 2 500 / 480 = 5.2 s ✓ 1
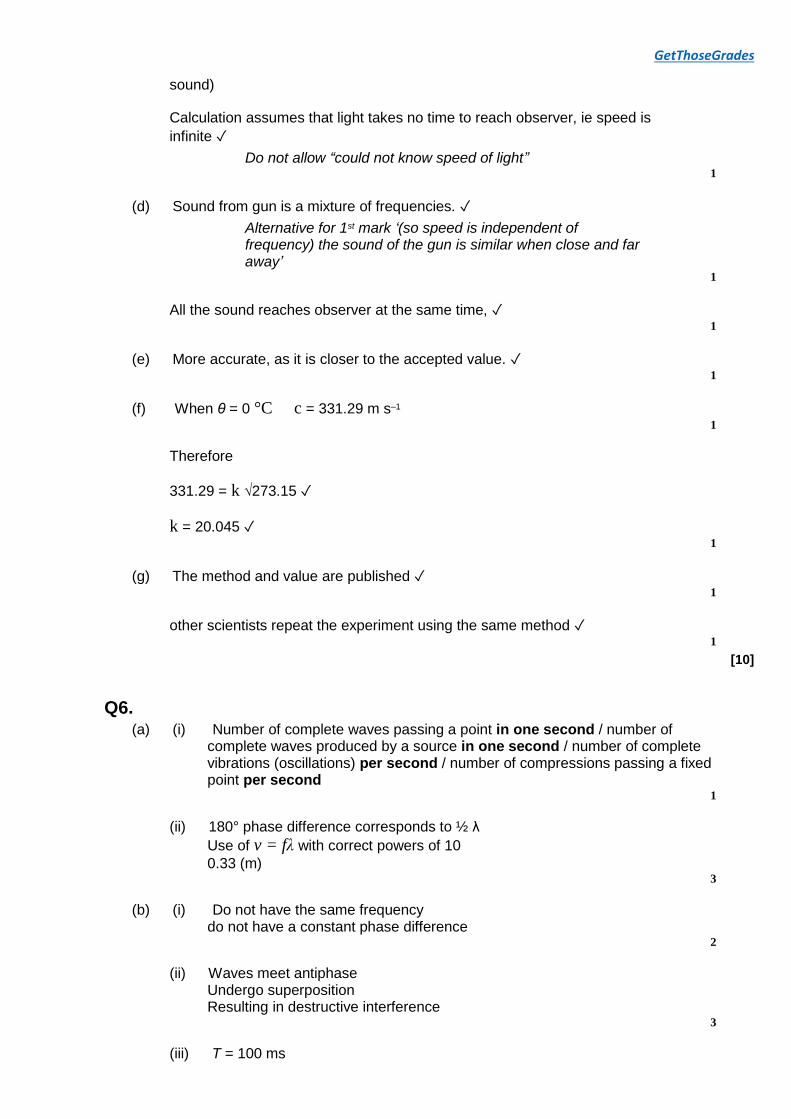
(c) (Measured time is difference between time taken by light and time taken by
GetThoseGrades
sound)
Calculation assumes that light takes no time to reach observer, ie speed is
infinite ✓
Do not allow “could not know speed of light” 1
(d) Sound from gun is a mixture of frequencies. ✓
Alternative for 1st mark ‘(so speed is independent of frequency) the sound of the gun is similar when close and far away’
1
All the sound reaches observer at the same time, ✓ 1
(e) More accurate, as it is closer to the accepted value. ✓ 1
(f) When θ = 0 °C c = 331.29 m s–1
1
Therefore
331.29 = k √273.15 ✓
k = 20.045 ✓ 1
(g) The method and value are published ✓ 1
other scientists repeat the experiment using the same method ✓ 1
[10]
Q6. (a) (i) Number of complete waves passing a point in one second / number of
complete waves produced by a source in one second / number of complete vibrations (oscillations) per second / number of compressions passing a fixed point per second
1
(ii) 180° phase difference corresponds to ½ λ
Use of v = fλ with correct powers of 10
0.33 (m) 3
(b) (i) Do not have the same frequency do not have a constant phase difference
2
(ii) Waves meet antiphase Undergo superposition Resulting in destructive interference
3
(iii) T = 100 ms
GetThoseGrades
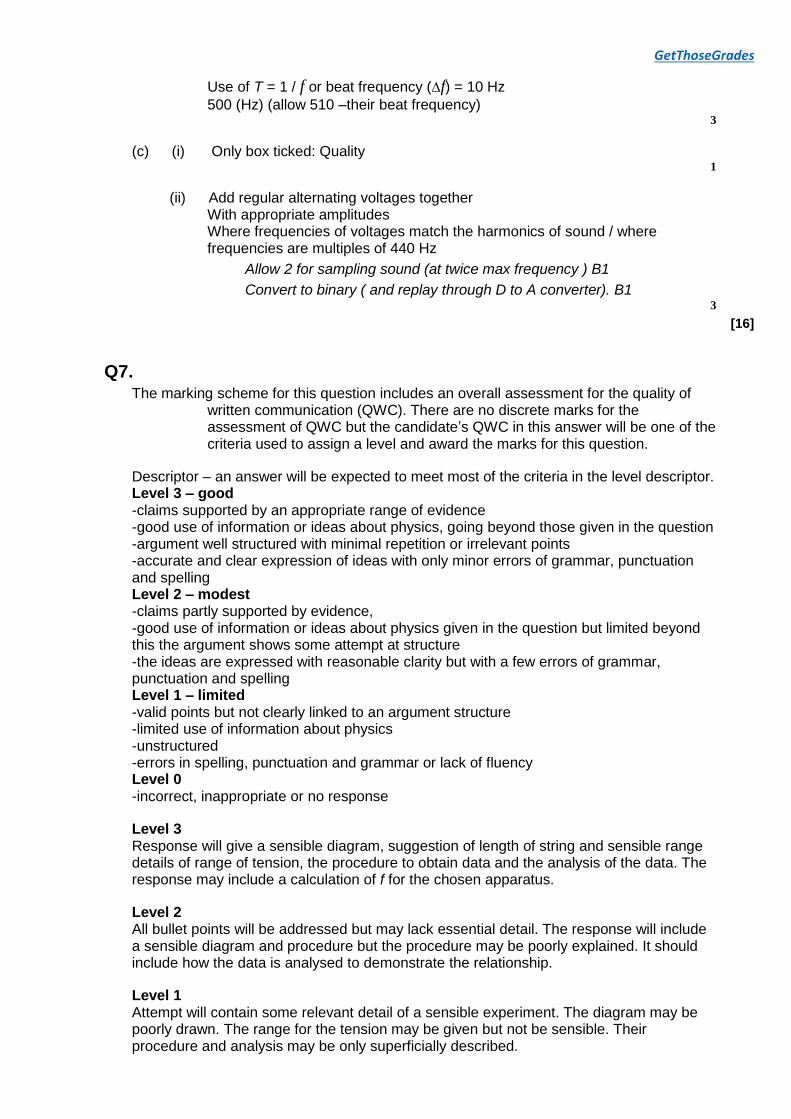
Use of T = 1 / f or beat frequency (∆f) = 10 Hz
500 (Hz) (allow 510 –their beat frequency) 3
(c) (i) Only box ticked: Quality 1
(ii) Add regular alternating voltages together With appropriate amplitudes Where frequencies of voltages match the harmonics of sound / where frequencies are multiples of 440 Hz
Allow 2 for sampling sound (at twice max frequency ) B1
Convert to binary ( and replay through D to A converter). B1 3
[16]
Q7. The marking scheme for this question includes an overall assessment for the quality of
written communication (QWC). There are no discrete marks for the assessment of QWC but the candidate’s QWC in this answer will be one of the criteria used to assign a level and award the marks for this question.
Descriptor – an answer will be expected to meet most of the criteria in the level descriptor. Level 3 – good -claims supported by an appropriate range of evidence -good use of information or ideas about physics, going beyond those given in the question -argument well structured with minimal repetition or irrelevant points -accurate and clear expression of ideas with only minor errors of grammar, punctuation and spelling Level 2 – modest -claims partly supported by evidence, -good use of information or ideas about physics given in the question but limited beyond this the argument shows some attempt at structure -the ideas are expressed with reasonable clarity but with a few errors of grammar, punctuation and spelling Level 1 – limited -valid points but not clearly linked to an argument structure -limited use of information about physics -unstructured -errors in spelling, punctuation and grammar or lack of fluency Level 0 -incorrect, inappropriate or no response
Level 3 Response will give a sensible diagram, suggestion of length of string and sensible range details of range of tension, the procedure to obtain data and the analysis of the data. The response may include a calculation of f for the chosen apparatus.
Level 2 All bullet points will be addressed but may lack essential detail. The response will include a sensible diagram and procedure but the procedure may be poorly explained. It should include how the data is analysed to demonstrate the relationship.
Level 1 Attempt will contain some relevant detail of a sensible experiment. The diagram may be poorly drawn. The range for the tension may be given but not be sensible. Their procedure and analysis may be only superficially described.
GetThoseGrades
Level 0 Response will contain no relevant information about an appropriate experiment.
Points that may be included
• Labelled diagram including string , weights, pulley, metre rule,
• method using signal generator (calibrated) and magnets to cause oscillation of the string
• method using tuning forks
• Length 1-2 m
• e.g Weights up to 12 N in 2 N increments (range of at least 6)
• Frequencies different by detectable amount on sig gen / use of range of tuning forks
• Calculation to show approx f value for selected T and l
• Method of changing T
• How frequency is determined for each T
• Graph of f against √T
[6]
Q8.
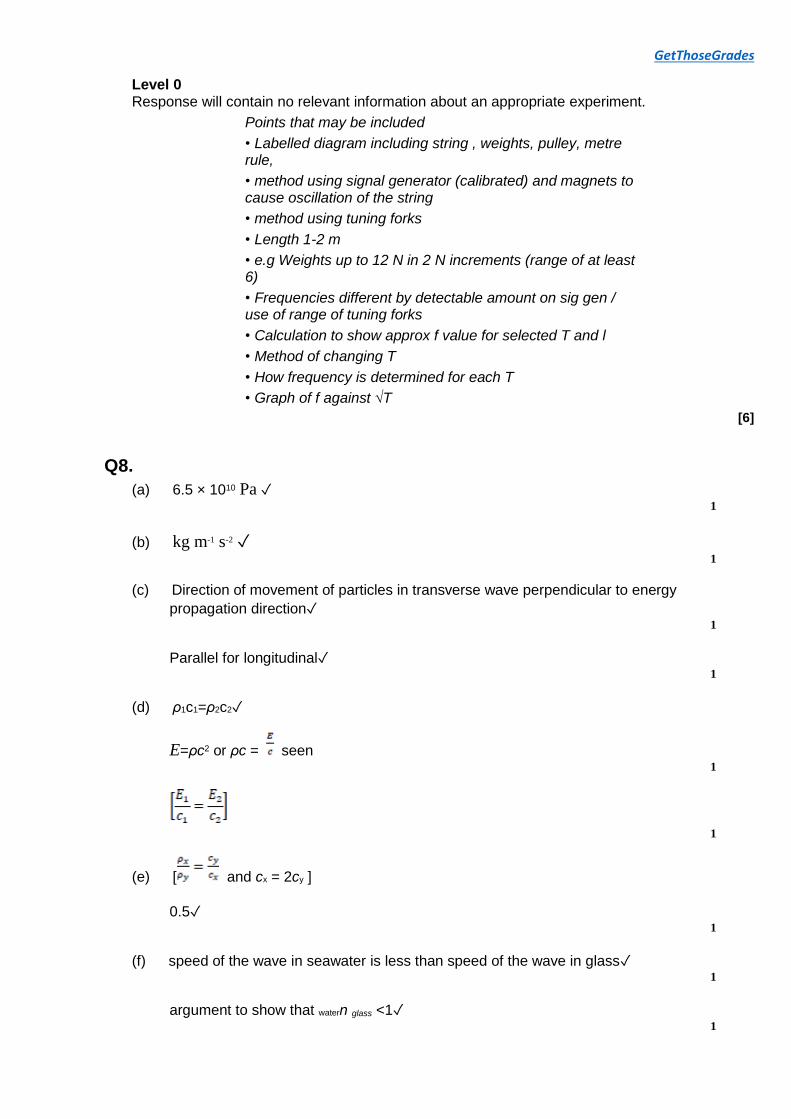
(a) 6.5 × 10¹⁰ Pa ✓ 1
(b) kg m-1 s-2 ✓ 1
(c) Direction of movement of particles in transverse wave perpendicular to energy
propagation direction✓ 1
Parallel for longitudinal✓ 1
(d) ρ1c1=ρ2c2✓
E=ρc2 or ρc = seen 1
1
(e) [ and cx = 2cy ]
0.5✓ 1
(f) speed of the wave in seawater is less than speed of the wave in glass✓ 1
argument to show that watern glass <1✓ 1
GetThoseGrades
so tir could be observed when wave moves from water to glass ✓ 1
[10]
Q9. (a) 180 degrees
accept ° for degrees
OR
π radians ✔
condone c or ‘rad’ for radian
reject ‘half a cycle’
treat ‘π radians in phase’ as talk out 1
(b) (idea that) sets of combining waves do not have the same
amplitude ✔
condone ‘waves do not have same intensity’ or ‘same energy’ or ‘some energy is absorbed on reflection’ or ‘same power’ or ‘same strength’ or idea that non point source or non point receiver would lead to imperfect cancellation
condone the idea that the waves may not be monochromatic
ignore ‘some waves travel further’ or ‘waves do not perfectly cancel out’
reject ‘waves may not be 180° out of phase’ 1
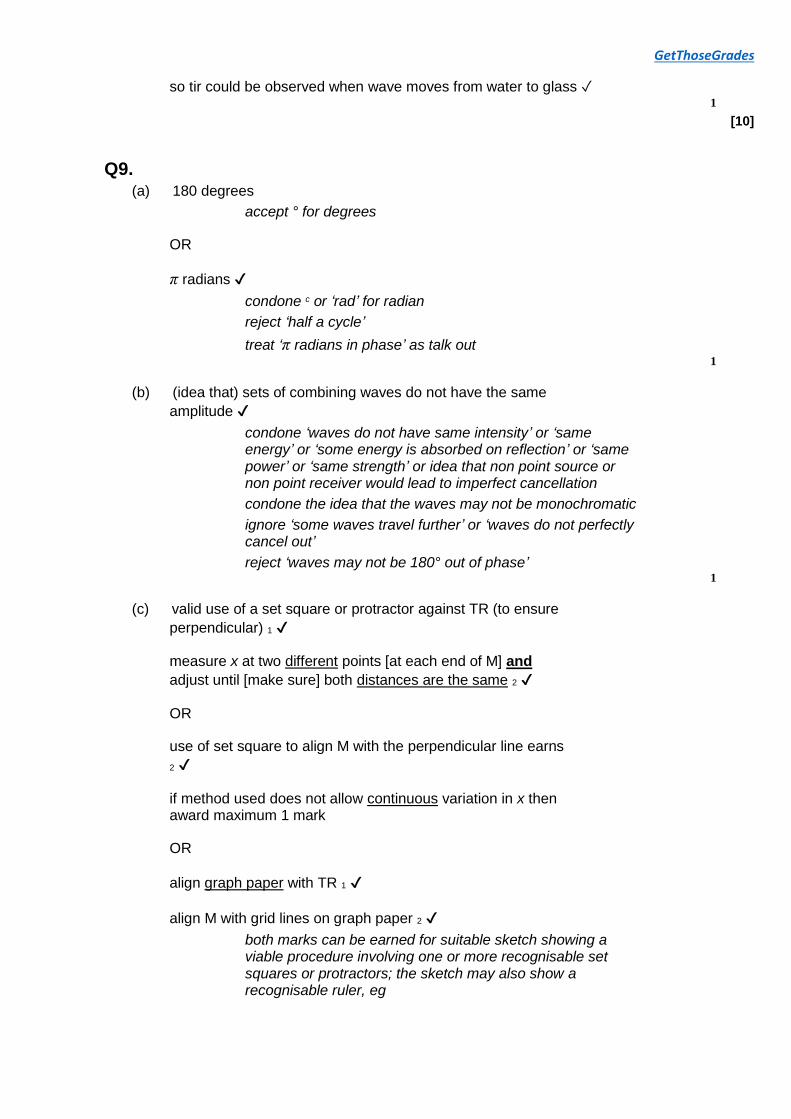
(c) valid use of a set square or protractor against TR (to ensure
perpendicular) 1 ✔
measure x at two different points [at each end of M] and
adjust until [make sure] both distances are the same 2 ✔
OR
use of set square to align M with the perpendicular line earns
2 ✔
if method used does not allow continuous variation in x then award maximum 1 mark
OR
align graph paper with TR 1 ✔
align M with grid lines on graph paper 2 ✔
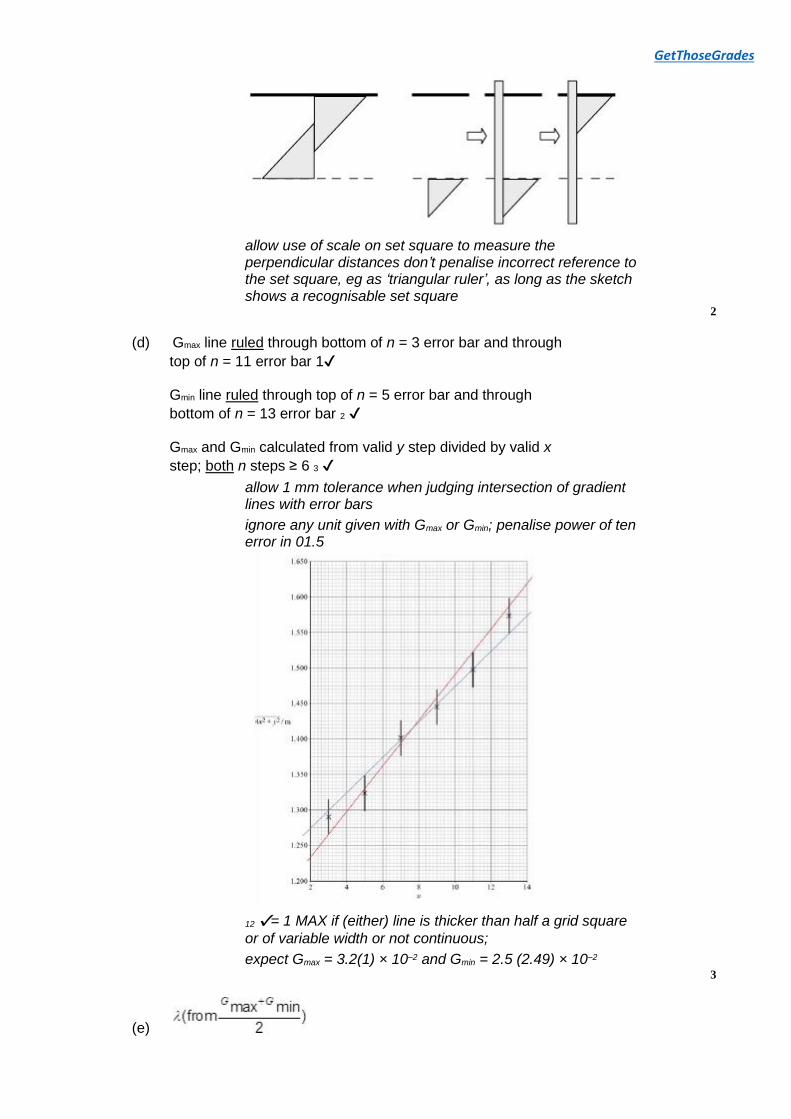
both marks can be earned for suitable sketch showing a viable procedure involving one or more recognisable set squares or protractors; the sketch may also show a recognisable ruler, eg
GetThoseGrades
allow use of scale on set square to measure the perpendicular distances don’t penalise incorrect reference to the set square, eg as ‘triangular ruler’, as long as the sketch shows a recognisable set square
2
(d) Gmax line ruled through bottom of n = 3 error bar and through
top of n = 11 error bar 1✔
Gmin line ruled through top of n = 5 error bar and through
bottom of n = 13 error bar 2 ✔
Gmax and Gmin calculated from valid y step divided by valid x
step; both n steps ≥ 6 3 ✔
allow 1 mm tolerance when judging intersection of gradient lines with error bars
ignore any unit given with Gmax or Gmin; penalise power of ten error in 01.5
12 ✔= 1 MAX if (either) line is thicker than half a grid square
or of variable width or not continuous;
expect Gmax = 3.2(1) × 10–2 and Gmin = 2.5 (2.49) × 10–2
3
(e)
GetThoseGrades
AND
result in range 2.8(0) to 2.9(0) × 10–2 (m) 1 ✔ 2 ✔
OR
award one mark for
2.7(0) to 3.0(0) × 10–2 (m) 12 ✔
penalise 1 mark for a power of ten error
reject 1 sf 3 × 10⁻² (m)
if a best fit line is drawn between the Gmax and Gmin lines and
the gradient of this is calculated award 1 mark for λ in range
2.8(0) to 3.0(0) × 10–2(m) 2
(f) uncertainty in λ = Gmax – λ
OR
λ – Gmin
OR
1 ✔
percentage uncertainty = (uncertainty/λ)×100 2 ✔
result in range 11(.0) % to 14(.0) % 3 ✔
1✔ can be earned by showing a valid uncertainty then
dividing by λ
ecf their λ, Gmax and Gmin for 1 ✔ and 2 ✔
allow λ found from best fit line
12 ✔
allow × 100 where ∆λ is any plausible uncertainty for 2
✔
numerical answer without valid working can only earn 3 ✔ 3
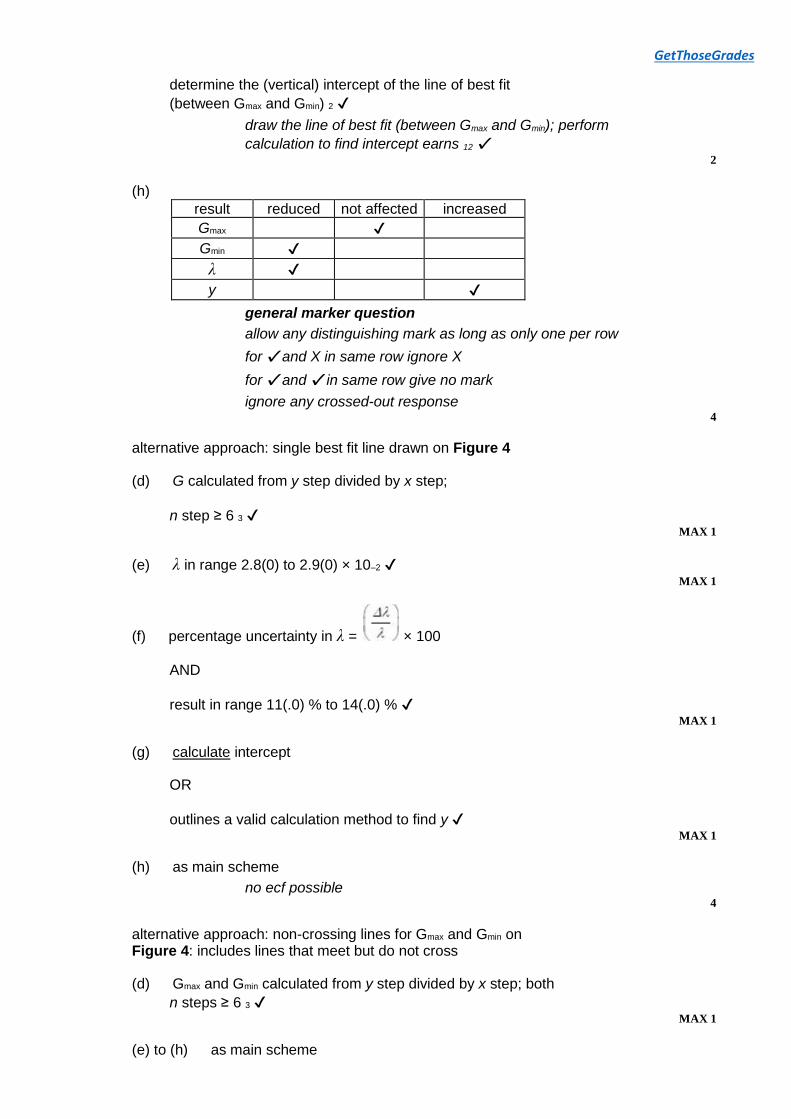
(g) (states) calculate the (vertical) intercept 1 ✔
OR
outlines a valid calculation method to calculate y 1 ✔
determine the intercept for both lines and calculate average
value 2 ✔
OR
GetThoseGrades
determine the (vertical) intercept of the line of best fit
(between Gmax and Gmin) 2 ✔
draw the line of best fit (between Gmax and Gmin); perform
calculation to find intercept earns 12 ✔ 2
(h)
result reduced not affected increased
Gmax ✔
Gmin ✔
λ ✔
y ✔
general marker question
allow any distinguishing mark as long as only one per row
for ✔ and X in same row ignore X
for ✔ and ✔ in same row give no mark
ignore any crossed-out response 4
alternative approach: single best fit line drawn on Figure 4
(d) G calculated from y step divided by x step;
n step ≥ 6 3 ✔ MAX 1
(e) λ in range 2.8(0) to 2.9(0) × 10–2 ✔ MAX 1
(f) percentage uncertainty in λ = × 100
AND
result in range 11(.0) % to 14(.0) % ✔ MAX 1
(g) calculate intercept
OR
outlines a valid calculation method to find y ✔ MAX 1
(h) as main scheme
no ecf possible 4
alternative approach: non-crossing lines for Gmax and Gmin on Figure 4: includes lines that meet but do not cross
(d) Gmax and Gmin calculated from y step divided by x step; both
n steps ≥ 6 3 ✔ MAX 1
(e) to (h) as main scheme
GetThoseGrades
1
[18]
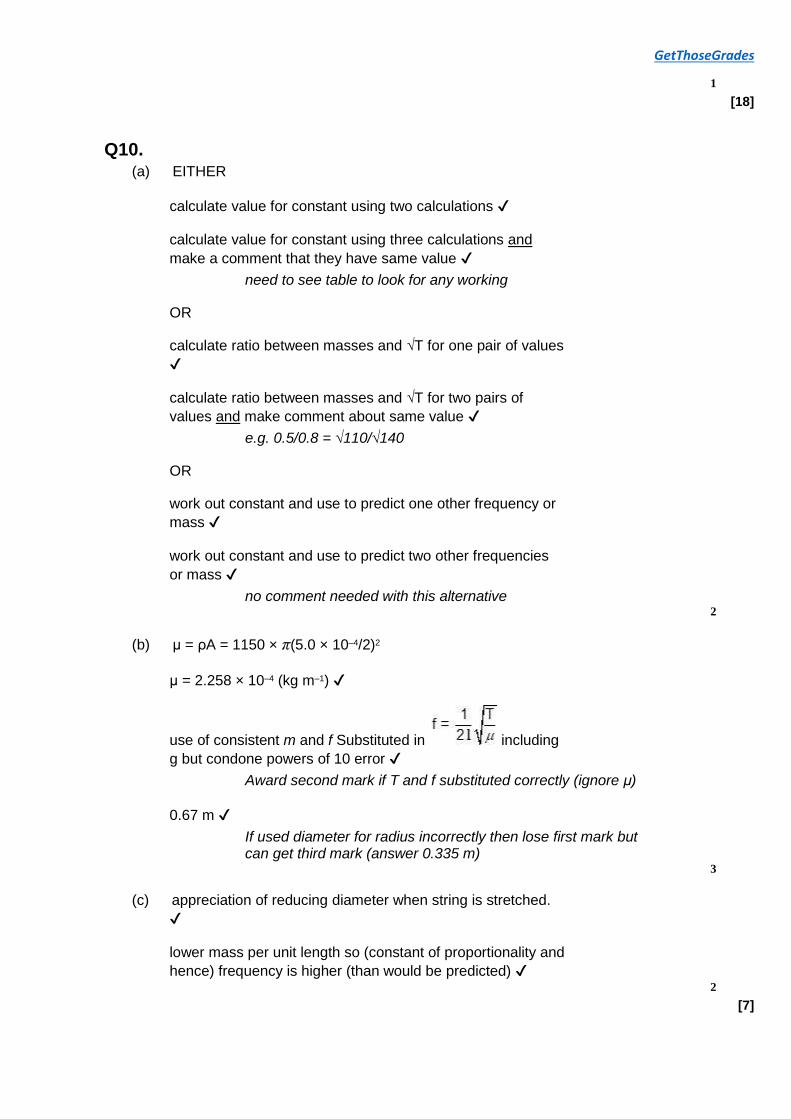
Q10. (a) EITHER
calculate value for constant using two calculations ✔
calculate value for constant using three calculations and
make a comment that they have same value ✔
need to see table to look for any working
OR
calculate ratio between masses and √T for one pair of values
✔
calculate ratio between masses and √T for two pairs of
values and make comment about same value ✔
e.g. 0.5/0.8 = √110/√140
OR
work out constant and use to predict one other frequency or
mass ✔
work out constant and use to predict two other frequencies
or mass ✔
no comment needed with this alternative 2
(b) μ = ρA = 1150 × π(5.0 × 10⁻⁴/2)2
μ = 2.258 × 10⁻⁴ (kg m–1) ✔
use of consistent m and f Substituted in including
g but condone powers of 10 error ✔
Award second mark if T and f substituted correctly (ignore μ)
0.67 m ✔
If used diameter for radius incorrectly then lose first mark but can get third mark (answer 0.335 m)
3
(c) appreciation of reducing diameter when string is stretched.
✔
lower mass per unit length so (constant of proportionality and
hence) frequency is higher (than would be predicted) ✔ 2
[7]
GetThoseGrades
Q11. C
[1]
Q12. D
[1]
Q13. A
[1]
Q14. C
[1]
Q15. D
[1]
Q16. B
[1]
Q17. C
[1]
Q18. D
[1]
Q19. C
[1]
Q20. C
[1]
Q21. C
[1]


![17.2 Sound Waves: In Halliday and Resnick: Longitudinal waves are sound waves! Chapter 17: [Sound] Waves-(II) Sound waves propagate in gases. Can they](https://img.pdfslide.us/doc/110x75/56649eb25503460f94bb9375/172-sound-waves-in-halliday-and-resnick-longitudinal-waves-are-sound-waves.jpg)