Embed Size (px)
Citation preview

Topic Outline
1) Motivation
2) Representing/Modeling Causal Systems
3) Estimation and Updating
4) Model Search
5) Linear Latent Variable Models
6) Case Study: fMRI
1

2
Richard ScheinesCarnegie Mellon University
Discovering Pure Measurement Models
Ricardo Silva*University College London
Clark Glymour and Peter SpirtesCarnegie Mellon University

3
Outline
1. Measurement Models & Causal Inference
2. Strategies for Finding a Pure Measurement Model
3. Purify
4. MIMbuild
5. Build Pure Clusters
6. Examples
a) Religious Coping
b) Test Anxiety

4
Goals:
• What Latents are out there?
• Causal Relationships Among Latent Constructs
DepressionRelationshipSatisfaction
DepressionRelationshipSatisfaction
or
or ?

5
Needed:
Ability to detect
conditional independence
among latent variables

6
Lead and IQ
Parental Resources
IQLeadExposure
PR ~ N(m=10, s = 3)
Lead = 15 -.5*PR + e2
e2 ~ N(m=0, s = 1.635)
IQ = 90 + 1*PR + e3
e3 ~ N(m=0, s = 15)
e2 e3
Lead _||_ IQ | PR

7
Psuedorandom sample: N = 2,000
Parental Resources
IQLead
Exposure
IndependentVariable
Coefficient Estimate p-value Screened-off at .05?
PR 0.98 0.000 No
Lead -0.088 0.378 Yes
Regression of IQ on Lead, PR

8
Measuring the Confounder
Lead Exposure
Parental Resources IQ
X1 X2 X3
e1 e2 e3
X1 = g1* Parental Resources + e1
X2 = g2* Parental Resources + e2
X3 = g3* Parental Resources + e3
PR_Scale = (X1 + X2 + X3) / 3

9
Scales don't preserve conditional independence
Lead Exposure
Parental Resources IQ
X1 X2 X3
PR_Scale = (X1 + X2 + X3) / 3
Independent
Variable
Coefficient
Estimate
p-value Screened-off
at .05?
PR_scale 0.290 0.000 No
Lead -0.423 0.000 No

10
Indicators Don’t Preserve Conditional Independence
Lead Exposure
Parental Resources IQ
X1 X2 X3
IndependentVariable
Coefficient Estimate
p-value Screened-off at .05?
X1 0.22 0.002 No
X2 0.45 0.000 No
X3 0.18 0.013 No
Lead -0.414 0.000 No
Regress IQ on: Lead, X1, X2, X3

11
Structural Equation Models Work
Lead Exposure
Parental Resources
IQ
X1 X2 X3
b
Structural Equation Model
•
• (p-value = .499)
• Lead and IQ “screened off” by PR
0)ˆ( E
07.ˆ

12
F1
x1 x2
F2 F3
x3 x4 x5 x6 x7 x8 x9 x10 x11 x12
Local Independence / Pure Measurement Models
• For every measured item xi:
xi _||_ xj | latent parent of xi

13
F1
x1 x2
F2 F3
x3 x4 y1 y2 y3 y4 z1 z2 z3 z4
Truth
Local Independence Desirable
1
x1 x2
2 3
x3 x4 y1 y2 y3 y4 z1 z2 z3 z4
Specified Model 31
0)ˆ( 31 E

14
F1
x1 x2
F2 F3
x3 x4 y1 y2 y3 y4 z1 z2 z3 z4
Truth
F4
Correct Specification Crucial
1
x1 x2
2 3
x3 x4 y1 y2 y3 y4 z1 z2 z3 z4
Specified Model 31
0)ˆ( 31 E

15
Strategies
• Find a Locally Independent Measurement Model
• Correctly specify the MM, including deviations from Local Independence

16
F1
x1 x2
F2 F3
x3 x4 y1 y2 y3 y4 z1 z2 z3 z4
Truth
F4
Correctly Specify Deviations from Local Independence
1
x1 x2
2 3
x3 x4 y1 y2 y3 y4 z1 z2 z3 z4
Specified Model 31
x4 z4
0)ˆ( 31 E

17
F1
x1 x2
F2 F3
x3 x4 y1 y2 y3 y4 z1 z2 z3 z4
Truth
F4 F5 F6
Correctly Specifying Deviations from Local Independence is Often Very Hard

18
Finding Pure Measurement Models - Much Easier
F1
x1 x2
F2 F3
x3 y1 y2 y3 y4 z3 z4
Truth
F5 F6
F1
x1 x2
F2 F3
x3 x4 y1 y2 y3 y4 z1 z2 z3 z4
Truth
F4 F5 F6
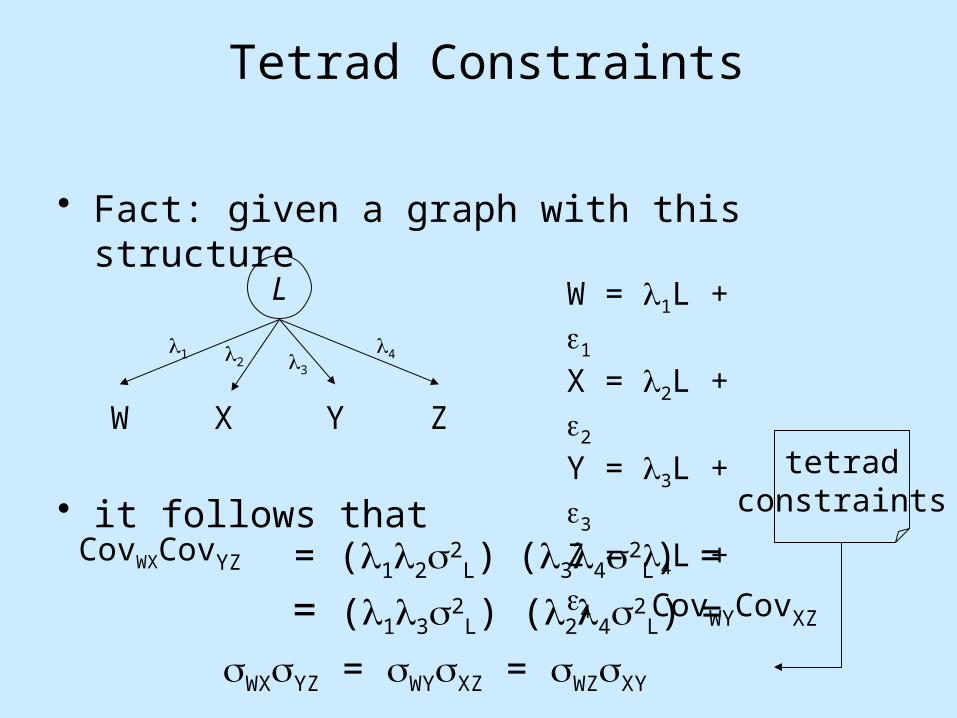
Tetrad Constraints
• Fact: given a graph with this structure
• it follows that
L
X Y ZW
W = 1L + 1
X = 2L + 2
Y = 3L + 3
Z = 4L + 4
CovWXCovYZ = (122L) (342
L) =
= (132L) (242
L) = CovWYCovXZ
WXYZ = WYXZ = WZXY
tetradconstraints
1 2 3
4

Early Progenitors
Charles Spearman (1904)
Statistical Constraints Measurement Model Structure
g
m1 m2 r1 r2
rm1 * rr1 = rm2 * rr2

21
F1
x1 x2 x3 x4
Truth
Impurities/Deviations from Local Independencedefeat tetrad constraints selectively
F1
x1 x2 x3 x4
Truth
F5
rx1,x2 * rx3,x4 = rx1,x3 * rx2,x4
rx1,x2 * rx3,x4 = rx1,x4 * rx2,x3
rx1,x3 * rx2,x4 = rx1,x4 * rx2,x3
rx1,x2 * rx3,x4 = rx1,x3 * rx2,x4
rx1,x2 * rx3,x4 = rx1,x4 * rx2,x3
rx1,x3 * rx2,x4 = rx1,x4 * rx2,x3

22
F1
x1 x2
F
F2 F3
x3 x4 y1 y2 y3 y4 z1 z2 z3 z4
Purify
True Model
F1
x1 x2
F2 F3
x3 x4 y1 y2 y3 y4 z1 z2 z3 z4
Initially Specified Measurement Model

Purify
Iteratively remove item whose removal most improves measurement model fit (tetrads or c2)
– stop when confirmatory fit is acceptable
F1
x1 x2
F
F2 F3
x3 x4 y1 y2 y3 y4 z1 z2 z3 z4
Remove x4
F1
x1 x2
F
F2 F3
x3 x4 y1 y2 y3 y4 z1 z2 z3 z4
Remove z2

24
F1
x1 x2
F
F2 F3
x3 y1 y2 y3 y4 z1 z3 z4
Purify
Detectibly Pure Subset of Items
Detectibly Pure Measurement Model

25
Purify

How a pure measurement model is useful
F1
x1 x2
F
F2 F3
x3 y1 y2 y3 y4 z1 z3 z4
1. Consistently estimate covariances/correlations among latents- test conditional independence with estimated latent correlations
2. Test for conditional independence among latents directly

2. Test conditional independence relations among latents directly
b21
b21 = 0 L1 _||_ L2 | {Q1, Q2, ..., Qn}
Question: L1 _||_ L2 | {Q1, Q2, ..., Qn}

28
MIMbuild
MIMbuild
PC algorithm with independence tests
performed directly on latent variables
Output: Equivalence class of structural models
over the latent variables
Input:
- Purified Measurement Model
- Covariance matrix over set of pure items

29
Purify & MIMbuild

30
Goal 2: What Latents are out there?
• How should they be measured?

31
F1
x1 x2 x3 x4
Model 1
x5
F2
x5
Latents and the clustering of items they measure imply tetrad constraints diffentially
F1
x1 x2 x3 x4
Model 2
x5
F2
x5
F1
x1 x2 x3 x4
Model 4
x5
F2
x6
F3
F1
x1 x2 x3 x4
Model 3
x5
F2
x6
F3

32
Build Pure Clusters (BPC)
BPC
1) Cluster (complicated boolean combinations of tetrads)
2) Purify
Output: Equivalence class of measurement models over a pure subset of original Items
Input:
- Covariance matrix over set of original items

33
Build Pure Clusters

34
Build Pure Clusters
Qualitative Assumptions
1. Two types of nodes: measured (M) and latent (L)
2. M L (measured don’t cause latents)
3. Each m M measures (is a direct effect of) at least one l L
4. No cycles involving M
Quantitative Assumptions:
1. Each m M is a linear function of its parents plus noise
2. P(L) has second moments, positive variances, and no deterministic relations

35
Build Pure ClustersOutput - provably reliable (pointwise consistent):
Equivalence class of measurement models over a pure subset of M
For example:
L1 L2 L3
m1 m2 m3 m4 m5 m6 m7 m8 m9
L1 L2 L3
m1 m2 m3 m4 m5 m6 m7 m8 m9 m11 m10
True Model
Output

36
Build Pure Clusters
Measurement models in the equivalence class are at most refinements, but never coarsenings or permuted clusterings.
L1 L2 L3
m1 m2 m3 m4 m5 m6 m7 m8 m9
Output
L1 L2 L3
m1 m2 m3 m4 m5 m6 m7 m8 m9
L4
L1 L2 L3
m1 m2 m3 m4 m5 m6 m7 m8 m9
L1 L3
m1 m2 m3 m4 m5 m6 m7 m8 m9

37
Build Pure Clusters
Algorithm Sketch:
1. Use particular rank (tetrad) constraints on the measured correlations to find pairs of items mj, mk that do NOT share a single latent parent
2. Add a latent for each subset S of M such that no pair in S was found NOT to share a latent parent in step 1.
3. Purify
4. Remove latents with no children

38
Build Pure Clusters + MIMbuild

39
Case Studies
Stress, Depression, and Religion (Lee, 2004)
Test Anxiety (Bartholomew, 2002)

40
Case Study: Stress, Depression, and Religion
Masters Students (N = 127) 61 - item survey (Likert Scale)
• Stress: St1 - St21
• Depression: D1 - D20
• Religious Coping: C1 - C20
p = 0.00
St1
12
Stress
St2
12
St21
12
.
.
Dep1
12
Coping
.
.
Depression
Dep2
12
Dep20
12
C1 C2 C20 . .
+
- +
Specified Model

41
Build Pure Clusters St3
12
Stress
St4
12 St16
12
Dep9
12
Coping
Depression Dep13
12 Dep19
12
C9 C12 C15
St18
12
St20
12
C14
Case Study: Stress, Depression, and Religion

42
Assume Stress temporally prior:
MIMbuild to find Latent Structure: St3
12
Stress
St4
12 St16
12
Dep9
12
Coping
Depression Dep13
12 Dep19
12
C9 C12 C15
St18
12
St20
12
C14
+
+
p = 0.28
Case Study: Stress, Depression, and Religion

43
Case Study : Test Anxiety
Bartholomew and Knott (1999), Latent variable models and factor analysis
12th Grade Males in British Columbia (N = 335)
20 - item survey (Likert Scale items): X1 - X20:
X2
Emotionality Worry
X8
X9
X10
X15
X16
X18
X3
X4
X5
X6
X7
X14
X17
X20
Exploratory Factor Analysis:

44
Build Pure Clusters:
X2
Emotionalty
X8
X9
X10
X11
X16
X18
X3
X5
X7
X14
X6
Cares About Achieving
Self-Defeating
Case Study : Test Anxiety

45
Build Pure Clusters:
X2
Emotionalty
X8
X9
X10
X11
X16
X18
X3
X5
X7
X14
X6
Worries About Achieving
Self-Defeating
X2
Emotionality Worry
X8
X9
X10
X15
X16
X18
X3
X4
X5
X6
X7
X14
X17
X20
p-value = 0.00 p-value = 0.47
Exploratory Factor Analysis:
Case Study : Test Anxiety

46
X2
Emotionalty
X8
X9
X10
X11
X16
X18
X3
X5
X7
X14
X6
Worries About Achieving
Self-Defeating
MIMbuild
p = .43
Emotionalty-Scale
Worries About Achieving-Scale
Self-Defeating
Uninformative
Scales: No Independencies or Conditional Independencies
Case Study : Test Anxiety

47
Limitations
• In simulation studies, requires large sample sizes to be really reliable (~ 400-500).
• 2 pure indicators must exist for a latent to be discovered and included
• Moderately computationally intensive (O(n6)).
• No error probabilities.

48
Open Questions/Projects
• IRT models?
• Bi-factor model extensions?
• Appropriate incorporation of background knowledge

49
References
• Tetrad: www.phil.cmu.edu/projects/tetrad_download
• Spirtes, P., Glymour, C., Scheines, R. (2000). Causation, Prediction, and Search, 2nd Edition, MIT Press.
• Pearl, J. (2000). Causation: Models of Reasoning and Inference, Cambridge University Press.
• Silva, R., Glymour, C., Scheines, R. and Spirtes, P. (2006) “Learning the Structure of Latent Linear Structure Models,” Journal of Machine Learning Research, 7, 191-246.
• Learning Measurement Models for Unobserved Variables, (2003). Silva, R., Scheines, R., Glymour, C., and Spirtes. P., in Proceedings of the Nineteenth Conference on Uncertainty in Artificial Intelligence , U. Kjaerulff and C.
Meek, eds., Morgan Kauffman