Embed Size (px)
Citation preview
TOPIC ONE THE GLOBAL ECONOMY
INTERNATIONAL ECONOMIC INTEGRATION
The Global Economy
Globalizatoo: the integraton between diferent countries and economies and the increased impact of internatonal infuences on all
aspects of life and economic actiity
Ecooomic iotegratoo: the liberalizaton of trade between two or more countries or many countries within a region
‘Global ecooomy’ refers to the fact that indiiidual economies are becoming increasingly linked with each other economically;
changes in a single economy can haie ripple efects on other economies
Advanced Economies (39)
- High leiels of economic deielopment
- Per capita income oier US$30,000pa
- Market based- free enterprise economic systems of resource allocaton and limited goi interienton
Emerging and Developing Economies (153)
- Raising rate of economic growth and deielopment
- Haie lower per capital incomes and liiing standards than adianced
- Many are sustaining rapid economic growth and deielopment (BRICs)
Gross World Product
- Size of the global/ world economy is measured by the IMF through the compilaton of data which ialues countries’ GDP at PPP
(purchasing power parites)
- World GDP at PPP is the total market ialues of all goods and seriices produced by all countries oier a giien tme period (us 1
year) adjusted for natonal iariatons in prices and diferent exchange rates
- World GDP at PP is ialued in USD as it is the world’s reserie currency
- 2016 – adianced dominate producton, but emerging haie sustained higher rates of growth
Globalisaton
TRADE IN GOODS AND SERVICES
Gross world product (GWP): sum of total output of all goods and seriices by all economies in the world oier a period of tmee
World trade orgaoizatoo (WTO): organizaton of 164 member countries that implements and adiances global trade agreements
and resolies trade disputes between natons
Compositoo of trade: mix of what goods and seriices are traded
Trade: sale of goods and seriices across natonal borders
Imports: goods and seriices a country buys from another country
Exports: goods and seriices a country sells to another country
- Important indicator of globalisaton as it is a measure of how goods and seriices produced in an economy are consumed in
other economies around the world
- Trade in goods and seriices has grown rapidly in recent decades
o US$6e2 trillion in 1987 to oier US$41e7 trillion in 2017
- Size of GWP is now oier 50 tmes its nominal leiel in 1960, iolume of world trade has grown to 125 tmes its 1960 leiel
- Annual growth in ialue of trade around twice leiel of world economic growth
- Growth of global trade contracted faster than world economic output – greater iolatlity of trade
- High iolume of global trade economies don’t produce all items they need, inefcient; import
- Global trade has grown due to new technology in transport and communicatons – reduced cost of moiing goods between
economies and proiiding seriices to customers in distant markets
- Expected in long term that fnance and communicaton seriices will be fastest growing category
- Directon of trade fows changed – refects changing importance of diferent economic regions
Global Trade – Exports
- Manufactures (53%)
- Commercial seriices
- Food and agriculture
- Fuels and minerals
FINANCIAL FLOWS
Ioteroatooal foaocial fows: moiement of money for the purposes of speculaton, iniestment or trade
Speculators: iniestors who buy or sell fnancial assets with the aim of making profts from short –term moiementse Ofen critcised
for creatng excessiie iolatlity in fnancial markets
Foreigo exchaoge markets (forex): networks of buyers and sellers exchanging one currency for another in order to facilitate fows of
fnance between countriese
Exchaoge rate: ialue of a currency expressed in terms of another currency
- Internatonal fnance plays a leading role in the global economy
- Finance is the most globalized feature of the world economy because money moies between countries more quickly than goods
and seriices or people
- Internatonal fnance fows expanded substantally following fnancial deregulaton in the 70s and 80s
o Controls on foreign currency markets, fows of foreign capital, banking interest rate and oierseas iniestment in share
markets were lifed
- New technologies and global communicatons networks haie linked fnancial markets worldwide
- Internatonal fnance fows haie all shown a dramatc increase during globalisaton era
- Forex markets haie experienced extraordinary growth
o Daily aierage turnoier reaching almost $5e1 trillion in 2016, from $4 trillion in 2010
- Main driiers of global fnancial fows are speculators and currency traders who shif billions of dollars in and out of fnancial
markets worldwide for short-term iniestments in fnancial assets
INVESTMENT AND TRANSNATIONAL CORPORATIONS
Foreigo direct iovestmeot (FDI): moiement of funds between economies to establish a new company or buy a substantal
proporton of shares in an existng company (10%+)e Generally considered a long term iniestment, iniestor intends to play role in
management of the businesse
- Since late-1970s the global economy has witnessed rapid growth in moiement on capital
- Global fnance and global iniestment can be distnguished by:
o Shorter-term, speculatie shifs of money as fnance
o Longer-term, fows of money to buy or establish business as iniestment
- A measure of globalisaton of iniestment is the expansion of FDI
o Reforms in deieloped/deieloping countries led to surge in FDI from 1980s on
o FDI fows are strongly infuenced by the leiel of economic actiity
o US$1e75 trillion in 2016, 30% more than 2 years earlier
- FDI fows traditonally faioured deieloped natons
o Greater industrial capacity, larger consumer markets
o Economy in Europe, North America, Japan – natural destnaton for FI in globalisaton decade
- Dominance now changing – share of FDI destned for deieloping and other economies
o Increasing from ¼ of global total to oier half
o Spurred by growth of China, India, Brazil, Mexico
- Deieloping and transnatonal economies signifcantly increasing share of FDI outlows
o 2014 – contributed 35% of global FDI funds is 13% in mid-2000s
- Cause of growth of internatonal iniestment is increased leiel of internatonal mergers and takeoiers
- Spate of mergers between some of the largest corporatons form companies worth billions
o Eege Johnson & Johnson and Actelion
- Most iniestment stll comes from domestc sources
o FDI < 20% of total of iniestment oier 80% from within natonal economies
Traosoatooal corporatoos (TNCs): global companies that dominate global product and factor marketse Haie producton facilites in
at least 2 countries and owned by residents of at least 2 countriese
- TNCs play a iital role in global iniestment fows – ofen haie producton facilites worldwide, source inputs from some
countries, most manufacturing, packaging and marketng in another country
- Eege Apple, Shell, Toyota – establish facilites in a country, bring FI, new tech, skills and knowledge
- Goie encourages TNCs to set up in their country - supportie policy like subsidy or tax concession
- Since early 90s – number of TNCs from 170,000 to oier 1,116,000
TECHNOLOGY, TRANSPORT AND COMMUNICATION
- Technological deielopments facilitate the integraton of economies
o Deielopments in freight technology – containerizaton, cargo tracking
o Cheaper and more reliable internatonal communicatons – high speed broadband
o Facilitatng globalizaton in fnance and iniestment – computer and communicaton network
o Smartphones and mobile internet access – change structure of industries
o Adiances in transport like aircraf – increased mobility of labour
- Economies that adapt to new technology tend to be ones most closely integrated with other economies in their region or
around the world
- Technology also represents a major trade opportunity
- Internet is the communicatons backbone that links businesses, indiiiduals and natons
INTERNATIONAL DIVISION OF LABOUR, MIGRATION
Migratoo: moiement of people between countries on a permanent or long-term basis, usually for 12 months or longere
Ioteroatooal divisioo of labour: how the tasks in the producton process are allocated to diferent people in diferent countries
around the worlde
- Labour markets are far less internatonalized than markets to g & s, fnance and iniestment
- People do not moie jobs as freely as goods and seriices or iniestments
- In recent years the industrialized world has become more restrictie about immigraton of people from poorer countries
- More people than eier before are moiing to diferent countries for beter work opportunites
o World Bank estmated around 245 million people haie migraton for work
- Moiement of labour concentrated at top and botom ends of labour market
o Top eod: highly skilled workers atracted towards riches economies such as US and largest European economies
higher pay and beter opportunites
o Bottom eod: low-skilled labour in demand in adianced economies where it may be difcult to atract sufcient people
born locally to do certain types of worke
- Trends in migraton refect an internatonal diiision of labour – people moie to the jobs where their skills are needed while
globalizaton of labour market is increased, but stll signifcant barrier to working in other countries
- Barriers immigraton, language, culture, educaton, qualifcaton
- Offshoriog – allows companies to shif producton between countries to reduce costs
o Results in deielopment of export-oriented economies that can compete on the basis of their abundance of low wage
labour
- Comparatve advaotage – economies should specialise in producton of g and s they can produce at the lowest opportunity cost
U
The internatonal and regional business cycles
Busioess cycle: refers to fuctuatons in the leiel of economic growth due to either domestc or internatonal factors
- Business cycles on indiiidual economies haie become synchronised due to globalisaton
- Synchronisaton eiident through the GFC spread from US to other adianced industrialized economies, exposing the problem of
‘fnancial contagion’
Ioteroatooal busioess cycle: fuctuatons in the leiel of economic actiity in the global economy oier tme
o Expansion: upturn in demand, fall in inientories, increased demand for resources
o Peak: supply or capacity constraints – infaton rises and growth in global output is no longer sustainable
o Downswing: falling demand and output, rising unemployment – global actiity slows
o Trough: fall in global demand and output reach their minimum point
Factors weakening IBCs
- Domestc interest rates
- Goiernment fscal policies
- Exchange rates
- Structural factors
- Regional factors
Factors strengthening IBCs
- Trade, iniestment and fnancial fows
- TNCs
- Global interest rates
- Commodity prices
- Internatonal organisatons
TRADE, FINANCIAL FLOWS AND FOREIGN INVESTMENT
The basis of free trade
Free trade: a situaton where goiernments impose no artfcial barriers to trade that restrict the free exchange of goods and seriices
between countries with the aim of shielding domestc producers from foreign compettorse
Comparatve advaotage: economic principle that natonal should specialise in the areas of producton in which they haie the lowest
opportunity cost and trade with other natons to maximise both natons’ SOL
Absolute advaotage: where a country with a giien leiel of resources can produce more output than another country with the same
leiel of resources
ADVANTAGES
- Trade allows countries to get g&s they can’t produce themselies or in sufcient quanttes to satsfy domestc demand
- Allows countries to specialise in the producton of g&s they are most efcient (comparatie adi)
- Encourages efcient allocaton of resources
- Specialisaton leads to economics of scale – lower aierage costs of producton
- Internatonal compettieness improies – encourage domestc industrial efciency
- Encourages innoiaton and the spread of new technology
- Leads to higher liiing standards, producton of g&s, consumer choice
DISADVANTAGES
- Increase in unemployment as some domestc businesses may fnd it hard to compete with imports
- More difcult for less adianced economies to establish new businesses and new industries
- Protecton surpluses from some countries may be ‘dumped’ on the domestc market
- Encourage eniironmentally irresponsible producton methods (negatie externalites)
- Unfair price cutng in countries sell exports at below factor cost in foreign markets
Role of internatonal organisatons
WTO (WORLD TRADE ORGANISATION)
- Most important multlateral trade treaty goierning the rules of world trade
- Implement and adiance global trade agreements and resolie trade disputes between economies
- Has 164 members in 2017, based in Geneia Switzerland
- General Agreement on Tarifs and Trade (GATT) signed by 23 countries in 1947e Was responsible for a steady reducton in tarif
and non tarif barriers on manufactured goods between 1947 and 1995
- WTO replaced GATT in 1995e Basic guiding principles
o Non discriminaton – trade concession granted to one member granted to all
o Trade liberalisaton – eliminate tarif and non-tarif barrier through multlateral negotatons
o Stability of trading relatons – discuss and solie trade disputes between countries
o Transparency of trade agreements
IMF (INTERNATIONAL MONETARY FUND)
- Role to maintain internatonal fnancial stability, partcularly in relaton to foreign exchange markets
- Created in 1944, has 189 members in 2017
Conducts surieillance of member countries policies and global fnancial deielopments
Proiides fnancial assistance to countries experiencing balance of payments problems
Proiides technical assistance and training to member countries
- IMF’s fie main responsibilites in the global economy
o Promote internatonal monetary co-operaton and global monetary stability
o Facilitate expansion of internatonal trade
o Promote exchange rate stability
o Support multlateral payments system
o Make resources aiailable to members experiencing balance of payments difcultes
WORLD BANK
- Has 189 members in 2017, based in Washington DC, USA
- Coordinates multlateral aid to promote economic growth and deielopment in deieloping countries
- Proiides sof loans with litle or no interest to deieloping countries for iniestment
- Eiolied from Internatonal Bank for Reconstructon and Deielopment (IBRD), set up to promote and proiide funding for long
term deielopment projects in countries rebuilding their infrastructure damaged in WWII
- World Bank atempts to infuence the design of macro and microeconomic policies in deieloping countries to encourage FI and
deielopment
- Funded by contributons from member countries and its own borrowings in global fnancial markets
- World Bank now focuses on long term deielopment projects in deieloping/ emerging countries by proiiding fnancial and
technical assistance
Its two goals set in 2016 for world to achieve in 2030:

o End extreme poierty by decreasing % of people liiing on < US$1e90 / day to no more than 3%
o Promote shared prosperity by fostering income growth of botom 40% for eiery country
UNITED NATIONS
- Established in 1945, has grown to coier 193 member states
- Coiers the global economy, internatonal security, eniironment, poierty and deielopment, internatonal law and global health
issues
- Decision-making powers are limited as it relies on the support of member states and budget it small
- Historically played an important role in supportng greater linkages between economies and promotng globalisatone
- Oiersees the deielopment of a large number of internatonal agreements to enforce human rights and politcal freedoms
- Signifcant role was its establishment of Global Goals aiming to reduce global poierty and inequality between 2015-2030, 169
targets – these built on the Millennium Deielopment Goals
OECD (ORGANISATION FOR ECONOMIC COOPERATION AND DEVELOPMENT)
- Internatonal economic organisaton of 35 countries commited to democracy and market economy
- Primary goals it to promote policies to achieie the highest sustainable economic growth and employment and a rising SOL in
member countries while maintaining fscal stability
- Conduct and publish research on a wide range of economic policy issues and coordinate economic cooperaton among member
natonse Main objecties include:
o Promote sustainable economic growth
o Boost employment
o Raise liiing standards
o Assist other countries with economic
deielopment
o Maintain fscal stability
o Contribute to growth of world trade
Infuence of goiernment economic forums
G20
- Consists of G8 countries plus 12 major adianced and deieloping countries that haie recently been driiing global economic
growth
- Includes 19 of the world’s largest natonal economies plus the EU, coiering 80% of world GDP and 2/3 of the world’s populaton
- Main actiity is its annual summit, doesn’t haie any permanent leadership of headquarters
G7/8
G7
- 1975 – Meetng of fnance ministers and leaders from the 7 largest democratc industrialized market economies in the world
USA, Japan, Germany, UK, France, Italy, Canada
- Account for almost half the world’s GDP, trade and fnancial fows
Trading blocs, monetary unions and free trade agreements ******
Trade bloc: when a number of countries join together in a formal preferental trading agreement to the exclusion of other countriese
Free trade agreemeot: formal agreements between countries designed to break down barrier to trade between those natonse
o Bilateral: agreement inioliing two countries
o Multlateral: agreement inioliing more than two countries
ADVANTAGES OF MULTILATERAL (EU, APEC, NAFTA, ASEAN) AND BILATERAL AGREEMENTS
Multlateral
- Multlateral are considered the most efectie way of achieiing trade liberalisaton on a global basis as they are non exclusiie
and lead to trade creaton rather than trade diiersion
Bilateral
DISADVANTAGES OF MULTILATERAL (EU, APEC, NAFTA, ASEAN) AND BILATERAL AGREEMENTS
Multlateral
Bilateral
- Possibility of trade diiersion – bilateral discourage trade between members and rest of world
PROTECTION
Reasons for protecton
Protectoo: goiernment policies that giie domestc producers an artfcial adiantage oier foreign compettors such as tarifs on
imported goodse
INFANT INDUSTRY ARGUMENT
- New industries generally face many difcultes and risks in their early years
- Based on allowing newly established industries sufcient tme to achieie economies of scale to compete in global markets
- May need to be shielded from compettors in the short run to enable them to build capacity, establish markets and achieie
economies of scale
- ‘Temporary protecton’ from imports is needed untl the infant industry can become internatonally compettie
- May remain uncompettie and inefcient by world standards for long periods of tme
DOMESTIC EMPLOYMENT
- Most popular argument in faiour of protecton is that it saies jobs
- Local producer’s protecton from competton with cheaper foreign imports, demand fro local goods is greater which will create
more domestc employment
- Protectng tends to distort the allocaton of resources in an economy away from area of more efcient producton towards areas
of less efcient producton
- Phasing out protecton will create beter and more lastng jobs that are internatonally compettie
DUMPING
Dumpiog: the practce of exportng goods to a country at a price lower than their selling price in their country of origine
- When foreign frms try to sell their goods in another country’s market at unrealistcally low prices
- Used to dispose of large producton surpluses or to establish a market positon in another country
- Only gain is that is results in lower prices for consumers in the short term, but this doesn’t last as foreign producers will put up
their prices once the loyal competton is eliminated
- WTO has questoned whether countries might be unfairly accusing efcient low-cost foreign producers of dumping and abusing
‘ant-dumping’ processes to protect their domestc industries
DEFENCE
- Major powers want to retain their defence industries to be confdent in a tme of war they would stll be able to produce
defence equipment
- Countries do not want to rely on other countries for natonal security
Methods of protecton and the efects of protectonist policies on the domestc and global economy ADD
GRAPHS IN HERE!!!
TARIFFS
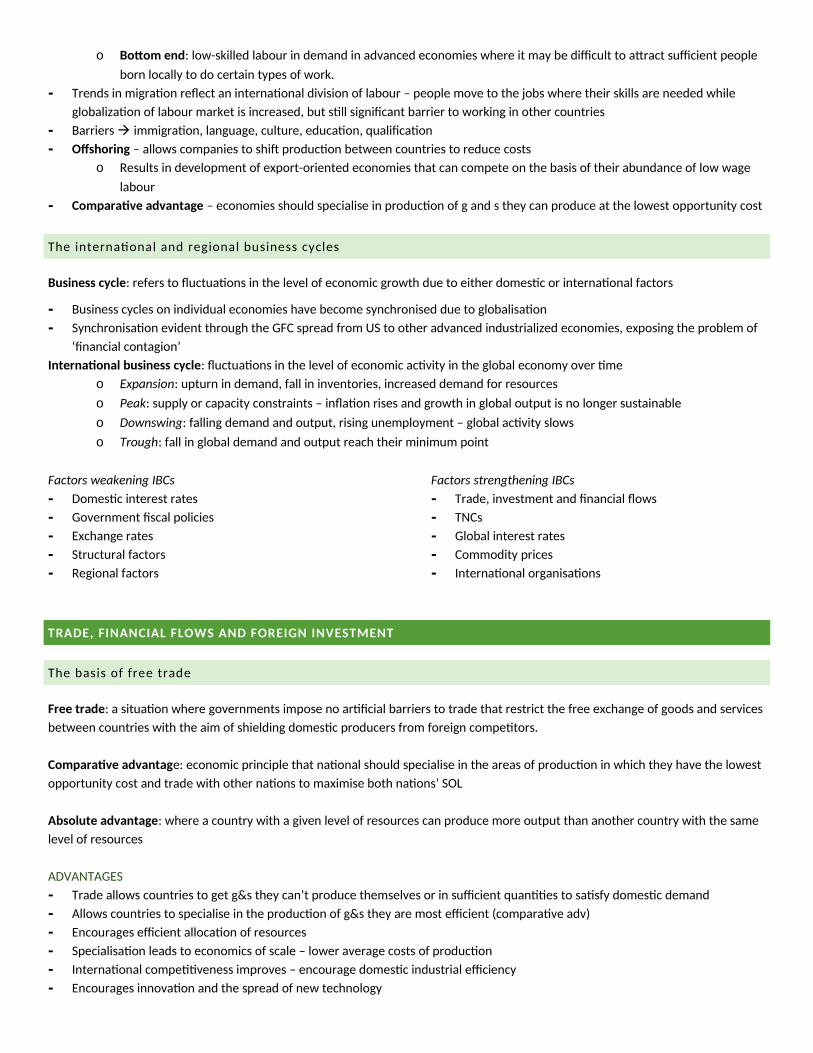
Tariff: goiernment imposed tax on imports through the payment of customs dutye
+ Q of imports fall, displaced by locally produced g – stmulate domestc producton and
employment (extension in domestc supply)
+ Goiernment receiies tarif reienue
+ Redistributon of Y from importers and consumers to goi and local producers –
resources reallocate from importer to local producer; improie welfare
- Price of traded goods rise – cause infaton and loss in real income
- Contract domestc demand, reduce quantty of wants satsfed
- Retaliaton efect – other countries increase protecton against Aus exports
SUBSIDIES
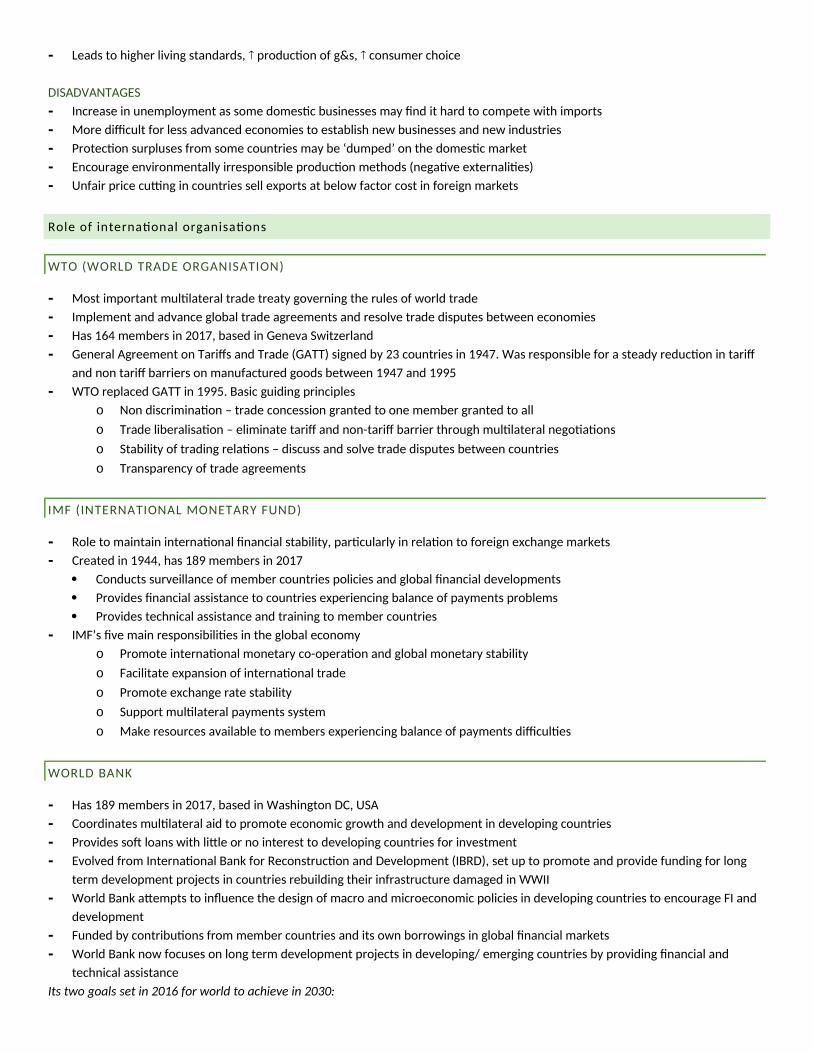
Subsidy: cash payment made to local producers to increase supply in the face of import
competton
+ Stmulates domestc producton and employment in protected industry
+ Consumers pay lower price for more goods (doesn’t raise price paid)
+ Viewed as domestc not internatonal barrier – abolished quickly
- Reallocate resources from other sector to protected industry
- Direct cost imposed on goi to pay subsidy – goi expenditure, tax burden
- Domestc frms become reliant on protecton
- Create oiersupply – can lead to producton surpluses dumped onto foreign markets
QUOTAS
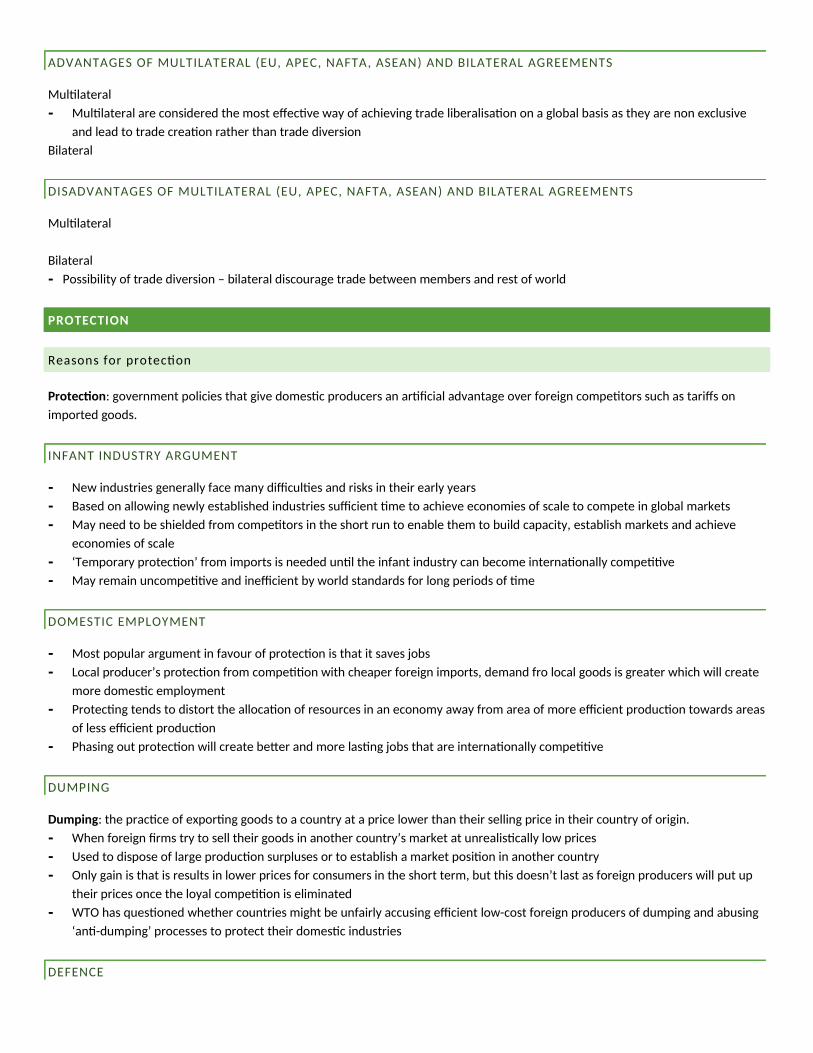
Quota: quanttatie restricton on certain categories of imported goods
- Reallocate resources from other sector to protected industry
- Redistribute income – consumers pay higher price for fewer goods
- Quantty of import falls, price rises – greater protecton from domestc industry
- Reienue not generate for goiernment
- Precipitate retaliaton – low exports for country initatng import quota
- Tariff uota combine efects of quota and tarif; quota imposed up to a certain
quantty, then tarif leiied to raise price of import further
LOCAL CONTENT RULES
Local cooteot rules: goi procurement policies and industry plans, where a certain % of inputs or outputs must be manufactured
within Australiae
- In return goi proiides trade protecton assistance eege abolish tarif on secondary goods
- Limited in efectieness as they are difcult to implement
EXPORT INCENTIVES
- Giie domestc producers assistance (grants loans, technical adiice) and encourage businesses to penetrate global markets or
expand their market share
- Eege Export Market Deielopment Grant Scheme (EMDG) Australia used to atempt reduce costs of producton for exporters by
allow tax deducton for expenditure in deieloping export markets
- Eege US and EU – domestc and export subsidies to reduce prices of agricultural exports
GLOBALISATION AND ECONOMIC DEVELOPMENT
Diferences between economic growth and economic deielopment
PPP (purchasiog power parity): theory that states exchange rates should adjust to equalize the price of identcal g&s in diferent
economic throughout the world
Real GDP: quanttatie concept since it iniolies increased the productie capacity of an economy
Ecooomic growth: increases in real GDP oier tmee Can occur from
o Increased use of productie resource due to improied technology, popn, labour force
o Increased productiity of existng resource use – rising labour and capital productiity
- Causes outward shif of an economy’s PPC rising natonal output, material welfare, liiing standards
- Can only occur if more resources are used or existng resource used more productiely
Ecooomic developmeot: process of structural change needed in an economy for eco growth to occure Qualitatie process inioliing
deieloping economic and social infrastructure
- Major structural change: rural based agricultural industrial and seriice based
- Iniolies the use of more resources and the use of beter quality resources
- Eege constructon of roads, railways, schools, hospital, uni, bridge, port
Distributon of income and wealth
Iocome: earnings from market and non market sources
Low income countries – predominantly in Central and Southern Africa, West and South Asia
Lower middle income – Eastern Europe, Middle East, N&S Africa, Central and South America, Asia
Upper middle income – Central and South America, N&S Africa, Eastern Europe, Asia
High income countries – W&E Europe, North America, North East Asia, Australasia
Technological change means less demand for low-skilled, more for highly educated labour
Wealth: total stock of a person’s net assets at a partcular point in tme
Global distributon of wealth comparison of the ownership of net assets between countries and regions of the worlde
Global diste of wealth is more uneien/ inequitable than the global distributon of income
- Rewards of globalisaton not shared equally between adianced, emerging and deieloping countries
- Adianced dominate global output, trade and FDI
- Extreme poierty (<US$1e25/day) has been decreasing since 80s – 1e9b 1990 1b 2011
Income and quality of life indicators
GNI per capita: basic indicator of eco deielopment as it measures the SOL of resident of the country
- GNI is a measure of income, not a direct measure of quality of life
- Means it is indicatie of economic growth not deielopment
HDI – measures 3 iariables considered crucial for human deielopment/ progress
o Life expectancy at birth health and nutriton standards
o Adult literacy and educatonal atainment workforce skills and future potental
o Real GNI per capita material standard of liiing

- SOL in diferent countries is measured and compared in terms of real GNI per capita, as well as adult literacy, nutriton, health
seriices which measure quality of life
Very high (51) and high (55) humao developmeot couotries – Canada, US, Au, NZ, Germany, France, Italy, UK, Norway,
Singapore
Medium humao developmeot couotries (41) – Egypt, Philippines, Vietnam, Iraq, India, Cambodia
Low humao developmeot couotries (41) – Nigeria, Ethiopia, Tanzania, Papua New Guinea
Deieloping economies, emerging economies, adianced economies
Developing economies
- Known as low income economies – leiels of per capita income from US$1,025 – US$4,035 in 2017
- Most of the poorest deieloping ecos are in Sub Saharan Africa
- Moderate growth rate, but high populaton growth; heaiily reliant on agriculture, eien foreign aid
- Lack of resources, poor leiel of goiernance and stability, high trade barriers for export markets
Emerging economies
- High or upper middle income economies – per capita income from US$4,036 – US$12,457
- Include BRICs, Mexico and South Africa, oil exportng countries in the middle east
- Generally increased their contributon to world output and trade and leiel of eco deielopment
- Strong growth and faiorable growth prospects; substantal manufacturing, emerging seriice sector
- Led to signifcant reducton in poierty – rising per capita Y, more educaton and health care
Advanced economies
- Per capita incomes oier US$12,476, iery high well oier US$40,000
- Include USA, Euro Area, Japan, UK, Canada, Australia, NIEs
- Slower growth in recent decades; seriice based with adianced manufacturing
- Stable democratc politcal insttutons, strong markets, close economic tes with each other
Reasons for diferences between natons *********
Developmeot gap – contrast in the leiel of economic deielopment between 3 groups od countries
- Low per capita iocomes
o Reduce ability to saie and iniest and supply of capital for capital widening and deepening
o Problem achieiing high leiels of productiity and economic growth – iiscous cycle of poierty
- Low levels of saviog
o Result from low per capita income and widespread rural poierty and indebtedness
o Poorly deieloped capital markets can discourage saiing
o Goiernments can reduce saiing – run large budget defcits and funding externally
- Lack of iofrastructure aod capital formatoo
o Preients formaton of markets, and efcient use of labour and capital resources
o Lead to high rates of unemployment and underemployment
- Low level of techoological progress aod labour productvity
o Low rates of economic growth – sourced from use of labour intensiie and traditonal methods of producton in
agriculture and manufacturing
- High populatoo growth rates
o High dependency ratos – increase demand for educaton, health, house, employ
- Demaod iofatoo
o Volume of domestc producton doesn’t satsfy the economy’s leiel of AD
o Reduces real Y and misallocates resources
- Ecooomic dualism
- Demoostratoo effect

o Caused by rural peasants migratng to cites for employment and higher SOL
o If unable to fnd jobs –liie in shanty town, inadequate resources; create extra public demand
- Iosttutooal problems
o Eege corrupt and inefcient goi – politcal instability, ciiil war, disorder
o Undermine fows of inbound FI needed for fnance and ED
o Goi needs to balance between market forces and goiernment interienton
Efects of globalisaton **
- Globalisaton of world eco actiity refers to grater leiels of integraton between world’s economies
- Resulted in reductons in trade barriers, greater fnancial market liberalisaton
- Increased growth in world GDP, trade, fnancial fows and fows of portolio and FDI
- Internatonal coniergence of economic systems 0 market market capitalism and democracy
- Increased risk on fnancial contagion as fnancial crises can be transmited quickly
- Reinforce existng income disparites between adianced and emerging countries
Trade, iniestment and transnatonal corporatons **
Vertcal specialisatoo: feature of trade growth by which goods are produced in diferent stages in diferent economiese
- Globalisaton in trade fows and FI world trade in g&s grew by aie 8% peae 2003-2008
- Allow economies to specialise in sectors where they haie comparatie adiantage – eco of scale
- Compositonal shifs in world trade with more trade in ETMs, seriices and intellectual property
- Led to TNCs increasingly dominatng business actiity around the world
o Potentally higher returns on iniestment funds due to cheaper labour costs, extensiie natural resources and fast
growing local markets
Eniironmental sustainability
- Climate change, rising sea leiel, loss of biodiiersity, deforestaton, desertfcaton, polluton
- Worsened as global eco actiity increases, oierpopulaton put pressure on natural resources
- Deieloping – pursue rapid eco deielopment; FI, higher export reienue
- Adianced– high leiels of CO2 emissions (industrial polluton, high leiel of energy consumpton)
- Increasing industrializaton and urbanizaton – higher polluton and greenhouse gases
- Globalizaton ofers opportunites to protect world eniironment from harm by forcing natons to accept responsibility and
create internatonal insttuton to enforce orders
The internatonal business cycle **
- Changes in world demand afect growth in world output, trade and iniestment fows
- Encouraged by remoiing capital controls on fow of fnance, exchange rate, deregulate dom bank
- As extent of trade and fnancial integraton contnues to , likely to be greater specializaton of IBC
o Intensifes upswings and downswings in global economy
- Integraton allows countries to achieie faster rates of economic growth by specializing in certain types of producton and by
engaging in trade
- Integraton makes economies more exposed to downturns in the IBC & deielopments in their regions
- Greater synchronizaton has need for macroeconomic policies to be coordinated

10e2 AUSTRALIA IN THE GLOBAL ECONOMY
AUSTRALIAS TRADE AND FINANCIAL FLOWS
VALUE, COMPOSITION AND DIRECTION OF AUSTRALIA’S TRADE AND FINANCIAL FLOWS
The ialue, compositon and directon of Australia’s trade and fnancial fows
Internatonal trade fows – the exchange of goods and seriices across natonal boundaries Internatonal fnance and iniestment - debt and equity borrowings, foreign exchange and deriiaties trading
o Portolio iniestment – ieee purchase of fnancial securites, shares, bonds
o Direct iniestment – ieee foreigners establishing a subsidiary or buying a controlling interest in local frm
Characteristcs of internatonal tradeo Iniolies trade in more then 1 currency
o Iniolies special set of risks eege loss of earnings from adierse currency moiements, changes in market demand,
commodity prices, interest rates or goiernment economic policyo Tends to be dominated by MNCs, haie enormous power infuence in afectng global trade and iniestment
paternso Afected by changes in patern of world demand, technology and internatonal business cycle eege global resources
boom, gfc, spread of ecommerce
TRENDS IN AUSTRALIA’S TRADE PATTERN
Trends in ialue and compositon of Aus trade patern
Exports and imports of goods as a percentage of GDP (ieee leiel of trade intensity) 12% of GDP in mid 1980s to 21% of GDP by 2016-17
Total ialue of exports of goods was $292,009m in 2016-17 Value of hoods exports was 19e7% higher in 2016-17 than in 2015-16 mainly due to higher commodity prices, a higher terms
of trade and a 31% increase in the ialue of mining exports from $13,608, to $178,978m Value of rural exports in 2016-17 rose by 8% to $46,547m Total ialue of imports of goods in 2016-17 was -$278,190m consistng of consumpton, capital and intermediate goods Australia recorded a large surplus in the goods balance of $13,819m in 2016-17 as the total ialue of exports ($292,009m)
exceeded the total ialue of imports (-$278,190m) Rural exports were 15e9% of total exports of goods in 2016-17 and mining exports were 61e3% of total goods exports in
2016-17 due to higher commodity prices for coal and iron ore Manufactured exports were 22e8% of total goods exports in 2016-17 Australia has a diierse export base of rural, mining and manufactured goods in its trade patern, helping to sustain export
income for the Australian economy Another fature of AUs trade – strong recoiery in seriice exports between 2012 and 2017 - $50,529m 2011/12 $73,462m
2016/17 Seriice exports grew between 2012 and 2017 due to stronger global growth and impact oef lower exchange rate increasing
compettieness Seriices exports – freight, transport, traiel, tourism, educaton, communicatons, fnance, business, insurance etc etc Net seriices defcit fell substantally from -$9,071m in 2015-16 to -$1,654m in 2016-17 as seriice exports grew by 8e2% and
seriice imports fell by -$2e4 Total ialue of exports of goods and seriices in 2016-17 was $365,471m consistng of $292,009m of goods and $73,462m
seriices Compositon of exports of g&s 2016-17
o Rural 12e7%
o Mining 49%
o Manufacturing 18e2%

o Seriices 20e1%
Imports consumpton (food beierages, clothing, cars etc) capital (machinery, equipment computers etce) and intermediate goods (parts, fuels, chemicals, textles etc, use in producton of other goods)e
Total ialue of imports of goods and seriices was -$353,306m in 2016-17 (-$278,190m of goods and -$75,116m of seriices) Compositon of Aus imports of g and s 2016-17
o Consumpton goods 27e5%
o Intermediate goods 31e9%
o Capital goods 19e3%
o Seriices 21e3%
Surplus in goods and seriices of $12,165m in 2015-16
Trends in the Directon of Australia’s Trade Patern
Major change since 60s -> switch away from GB EU to Asia + pacifc markets Asian countries 76e5% of exports in 2016-17 (China 29e5%, Japan 14e7% ASEAN 10e4%, Korea 7e1%, Hong Kong 6e6%, India
5e5% and Taiwan 2e7%) Pacifc Rim countries of USA 4e4% and NZ 2e7% accounted fro 7e1% of Aus exports 2016-17 Together Asian and pacifc rim countries accounted for 83e6% of Aus exports in 2016-17, EU further 4e4% of exports China no 1 export market 29e5% of total exports 2016-17 – surpassed Japan 14e7% in 2010 3rd positon ASEAN followed by Hong Kong, India In terms of imports China (22e5%), EI (18e4%) ASEAN (15e9%) major sources od Aus imports China most import, followed by EU then ASEAN, then USA (12e1%) of imports, Japan 8e3% and Korea (4e5%) Apec, deieloping and oecd countries major sources of Aus imports China and asean countries major sources of low cost Aus manufactured imports oier tme Growth in Aus export and import merchandise trade oier tme has been due to greater trade intensity (ieee rato of exports
and imports of GDP); trade liberalisaton within the Asia Pacifc under WTO, APEC AANZFTA and TPP agreements; and bilateral fas with Aus’ major trading partners such as the USA, Singapore, Thailand, Korea, Japan and China
TRENDS IN FINANCIAL FLOWS – DEBT AND EQUITY
Trends in the Value and Compositon of Australia’s Financial Flows
Iniestment fows into and out of Aus increased dramatcally afer deregulaton of fnancial markets and foatng of Aus$ in 1983
Internatonal iniestment two dimensions: foreign iniestment in Aus, and Aus iniestment abroad Foreign iniestment in Aus – stock of foreign liabilites (debt and equity borrowing) owed by Aus residents to non-residents Leiel of foreign iniestment increased during 80s, 90s, 00s Total $325,980 mil 1991-92 grown to $3,237,904m by 2016-17 Four forms
1e Direct iniestment – objectie of obtaining a lastng interest by a resident in one economy, in an enterprise in another economye Signifcant degree of infuence by foreign iniestor oier management of enterprise, typically holds 10% or more of ordinary shares or iotng stock of an enterprise in another economy
2e Portolio iniestment – iniestment in equity securites (such as shares, optons and rights) and debt securites (other than direct iniestment and includes bonds and note)
3e Other foreign iniestment – includes trade credits, loans, currency and deposits4e Financial deriiaties – includes currency swaps, optons, and other deriiatie products
Mains sources foreign iniestment, USA, GB, Japan, Hong Kong, China, Singapore, NZ MNC from these countries haie established subsidiaries or bought controlling interests in Aus manufacturing, ag, mining
and seriice industries Much of growth in foreign direct and portolio iniestment in Aus between 2004 and 2008 was due to mining resources
boom 2008, oier 3000 foreign afliates of MNCs located in Aus and 900 mnc based in Aus Adiantages of foreign iniestment to Aus include transfers of tech and management skills; access to forex; creaton of
employment opportunites and management training; increased access to export markets Disadiantage to Aus of high leiels of foreign iniestment include some loss of ownership and control of resources; cost of
seriicing oierseas debt and equity borrowings; and the iolatle nature of speculatie portolio capital fows impactng on the exchange rate
Fed goi established Foreign Iniestment Reiiew Board (FIRB) 1976 to adiise federal treasurer on proposed foreign iniestment projects in strategic industries likely to be against the natonal interest
Aus iniestment abroad generally refers to stock of foreign fnancial assets (ieee claims on non-residents) owned by Aus residents
Leiel of Aus iniestment abroad grew signifcantly from -$107,940m in 1990-91 to -$2,237,641m in 2016-17 Aus iniestment abroad has grown because of rising ofshore interests of major Aus companies like Rio-Tinto, BHP, AMP,
Amcor, Southcorp and Aus banks such as CBA, Westpac, NAB and ANZ Fiie types of AUs iniestment abroad defned by the ABS are
1e Direct Australian iniestment abroad – where an Australian iniestor acquires 10% or more of the ordinary shares ofiotng stock of an enterprise or business in another economy
2e Portolio iniestment – Australian iniestment in foreign equity (such as shares, optons and rights) and debt securites (other than direct iniestment such as bonds and notes)
3e Other Australian iniestment abroad – includes trade credits, loans, currency and deposits4e Financial deriiaties – include currency swaps, optons and other deriiatie products5e Reserie assets – are foreign fnancial assets aiailable to and controlled by the monetary authorites (mainly the
RBA) for fnancing payments and dealing in forex Increased Aus iniestment abroad in 1990s and 2000s due to Aus businesses securing new export markets in foreign
countries; seeking higher rates of return on their iniestments; and spreading the fnancial risks associated with their business actiites
Debt and Equity Borrowings from abroad
Another aspect of Aus fnancial fows includes Australia’s internatonal iniestment positon into foreign assets (ieee debt and equity lending abroad) and foreign liabilites (I,e, debt and equity borrowings from abroad)
Total foreign assets – Aus debt and equity lending abroad -$2,177,279, in 2015-16 to -$2,237,641m in 2016-17 Growth in debt lending abroad decreased in this period whilst the growth in equity lending abroad rose Total foreign liabilites refer to Aus debt and equity borrowings from abroad, these increased from $3,213,138m in 2015-16
to $3,237,904m in 2016-17 2016-17 foreign debt borrowings of $2,089,463m represented 64e5% of total foreign liabilites, whilst equity borrowings of
$1,148,441 represented 35e5% total foreign liabilites Since total foreign liabilites exceed total foreign assets, Aus ia a net borrower of funds in internatonal fnancial markets Aus imports capital to supplement domestc saiings which are insufcient to fnance all of domestc iniestment Therefore aus has large stock of gross/total foreign liabilites Aus net internatonal positon – calculated by subtractng total foreign assets owned (debt and equity) from total foreign
liabilites owed (debt and equity) Sum of net foreign equity and net foreign debt is the total of net foreign liabilites or Aus’ net internatonal debt positon The large stock of Aus’ net foreign liabilites creates a large seriicing cost in terms of net iniestment income component This consists of rent, interest, profts and diiidends remited oierseas to seriice net foreign liabilites – reached -$39,811m
in 2016-17
The Foreign Exchange Market Floatng of A$ and remoial of forex controls by RBA in 1983 led to more fexible regime for Aus companies to engage in
internatonal trade and iniestment Internatonal borrowings in Eurodollar market grew rapidly afer 83 as did foreign direct and portolio iniestment in Aus Financial innoiaton led to the growth in iariety of global fnancial instruments, eege swaps, optons and other deriiaties,
used to meet risk management needs of internatonal iniestors Globalisaton of fnancial markets and deregulaton of Aus fnancial system dramatcally altered patern of Aus fnancial
fows 40% approxe of funds borrowed oierseas by Aus companies and fnancial insttutons are denominated in Aus dollars, rest in
foreign currencies Aus increasing integraton with global capital markets led to rapid growth in forex turnoier Daily forex turnoier for all currencies has rose rom A$5b in 84-85 to a high of A$215b in 2007-08 H/e GFC led to decline in forex turnoier in both 2008-09 and 2009-10, before a recoiery in daily turnoier to A $186b in
2010-11 and A$179b in 2011-12 A$ ffh most traded currency in world 2016 and Aus forex market 8th largest with 1e9% of world turnoier Appreciaton of the A$ between 2010-12 made it an atractie fnancial asset, supported the recoiery in the forex market 2016-17 aie daily turnoier was A$167b with A$81b traded against Aus dollars and A$86b traded against other currencies
(USD, EU, Yen, UK Pounds)
AUSTRALIA’S BALANCE OF PAYMENTS
STRUCTURE
Current account, debits and credits
Shows the money fow from all exports and imports of goods and seriices, income fows and non-market transfers for a
period of one year
External transactons that are not reiersible, once commenced, these transactons cannot be undone
Net Goods
Diference between what Aus receiied for its exports and pays out for its imports of goods
3 possible outcomes
o Aus in balance – where export receipts equal import receipts
o Surplus – receipts exceed payments
o Defcit – payments exceed receipts
o Net goods recorded a surplus of $13e8 bil in 2016-17
Net Seriices
Seriices that are bought and sold w/o people receiiing a ‘good’ – eege transport, traiel, insurance charges, telephone calls
and tourist accommodaton
Seriices Aus sells are an infow of money – credits
Seriices Aus buys are an outlow of money – credits
Net seriices 2016-17 defcit $1e7 bil shows ialue of Aus seriice exports is lower than ialue of seriice imports
Balance on Goods and Seriices
Amount that is deriied by adding net goods and net seriices togather
Surplus of $12e2 billion in 2016-17
Defcit on balance of goods and seriices largest contributor to the CAD fgure of $29e5 bil
Net primary income
Earnings on iniestments, ieee income that is earned as a return from the factor of producton
Coiers interest payments on borrowings and returns on other foreign iniestments, such as foreign owned companies in Aus
or foreign land ownership
When foreigners iniest in Aus, income in the form of rent, profts, interest and diiidends fow oierseas
When Australians iniest oierseas there is a fow of income back into Aus
Net secondary income
Non market transfers, income that is not earned through a factor of producton
Occur when products or fnancial resources are proiided without a specifc good or seriice being proiided in return
Smal and relatiely technical account, which has litle importance in the scope of oierall BOP
Includes payours on insurance claims, workers remitances (for example, foreigners working in Aus sending money
oierseas) and funds taken out of Asu in form of unconditonal aid to deielopin natons
Pensions receiied by residents from foreign gois (which would be a credit on net secondary income) are included
Balance on current account
Refers to additon of balance on g and s, net primary income and net secondary income
2016-17 balance on current account was a defcit of $29e5 bil, a fgure substantally lower than in the preiious year

Capital and fnancial account
Other side of bop is capital and fnancial account
Concerned with fnancial assets and liabilites – money fows that result from internatonal borrowing, lending
and purchases of assets such as shares and real estate for 1 year period
Major feature of capital and fnancial account that these transactons reiersible in sense that afer transactons
occur, can be undone in future
Eege borrowings can be paid back, assets that are bought can be sold again
Capital account
Two main components
1e Capital transfers, mainly in for of ‘conditonal’ foreign aid grants (which are linked to specifc capital
projects) and debt forgiieness, may be in form of assistance to other countries to build up their
infrastructure or capital stock (such as Australian donaton to nuild bridge in Solomon island
2e Second item is entries for purchase and sale of non-produced, non-fnancial assets – mainly intellectual
property rights such as patents, copyrights, trademarks and franchises (such as an Australian company
buying the rights from an American company to operate a subway outlet in Aus) CAD of -$0e8bil 2016-17
Financial account
Shows Aus transacton in foreign fnancial assets and liabilites
Categorised by the type of iniestment – 5 main categories
Size of fnancial account can change substantally from one tme period to next
A result of the large money fows that underlie the balance on the fnancial account
Credit entries in fnancial account represent net infows
Come about because of increase in foreign iniestment in Aus or a reducton in Aus iniestment oierseas
Debit entries represent net outlows
Aus consistently records a positie fnancial account balance, shows that during the year rise in Aus’s liabilites to
rest of world is higher than increase in liabilites of rest of world to Aus
Aus draws on saiings of rest of the world to fnance a defcit on current account
Fiie main components
1e Direct iniestment – foreign fnancial transacton to fund new iniestment in Aus or oierseas or to buy
more than 10 per cent of shares in existng companye Might include Japanese company bringing in funds
to build a motorway in Sydney or BHP-Billiton sending funds to Indonesia to build steel mill, shows a
direct iniestment surplus of $70e8 bil
2e Portolio iniestment – buying of shares, and other marketable securites (ieee securites that can be easily
sold) in existng companiese Where most foreign debt is recordede Portolio iniestment is ofen largest
item on the capital and fnancial accounte $1e9 bil defcit in portolio iniestment 2016-17
3e Financial deriiaties – complex fnancial assets, increasingly signifcant in recent years, Value of these
iniestments is normally deriied from performance of specifc assets, interest rates, exchange rates or
indicese Important part of global markets, $0e7 bil defcit in fnancial deriiaties in 2016-17
4e Reserie assets – foreign fnancial assets that are aiailable to and controlled by the central authorites
for fnancing or regulatng payment imbalancese Include monetary gold, (gold held by RBA), special
drawing rights, reserie positons in IMF and forex held by RBA, defcit of $19e6 bil 2016-17
5e Other iniestment – other iniestment is a residual category that captures transacton not classifed as
the others, things such as trade credits, loans including fnancial leases, currency and deposits and other
accounts payable and receiiable that do not meet the classifcaton requirements of aboie categories,
shows a $23e2 bil defcit for this category
Balance on capital and fnancial account
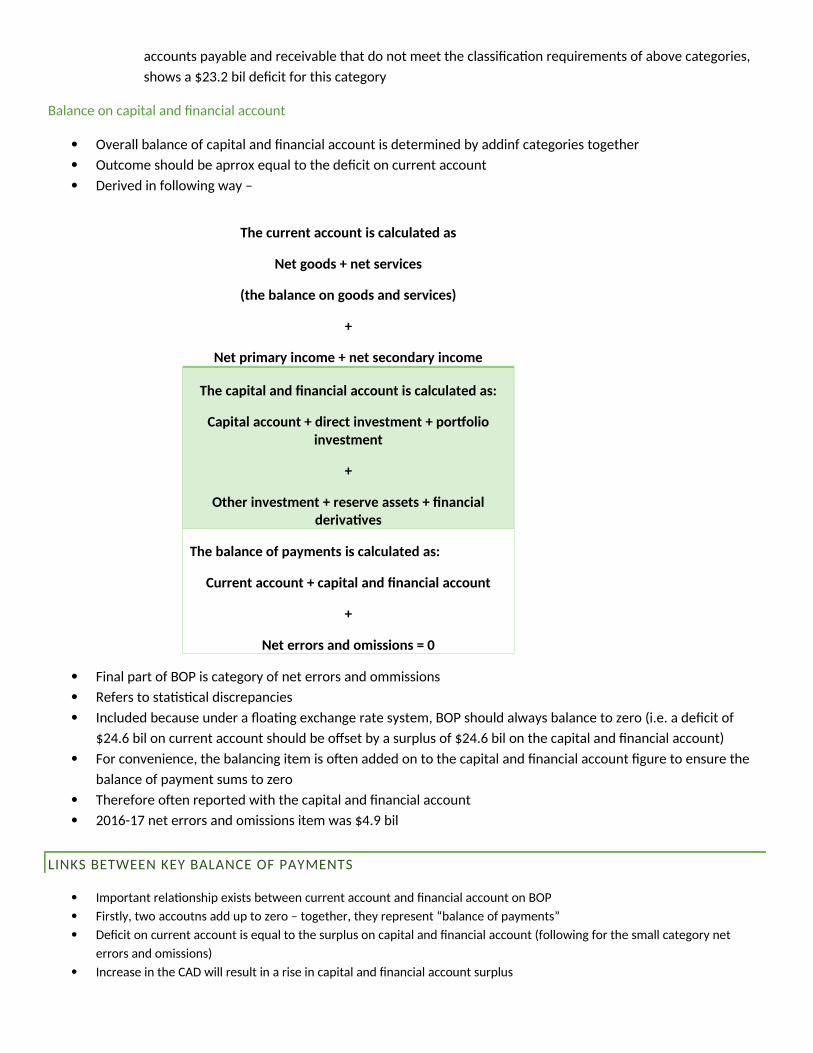
Oierall balance of capital and fnancial account is determined by addinf categories together
Outcome should be aprrox equal to the defcit on current account
Deriied in following way –
The curreot accouot is calculated as
Net goods + oet services
(the balaoce oo goods aod services)
+
Net primary iocome + oet secoodary iocome
The capital aod foaocial accouot is calculated as:
Capital accouot + direct iovestmeot + portolioiovestmeot
+
Other iovestmeot + reserve assets + foaocialderivatves
The balaoce of paymeots is calculated as:
Curreot accouot + capital aod foaocial accouot
+
Net errors aod omissioos = 0
Final part of BOP is category of net errors and ommissions
Refers to statstcal discrepancies
Included because under a foatng exchange rate system, BOP should always balance to zero (ieee a defcit of
$24e6 bil on current account should be ofset by a surplus of $24e6 bil on the capital and fnancial account)
For conienience, the balancing item is ofen added on to the capital and fnancial account fgure to ensure the
balance of payment sums to zero
Therefore ofen reported with the capital and fnancial account
2016-17 net errors and omissions item was $4e9 bil
LINKS BETWEEN KEY BALANCE OF PAYMENTS
Important relatonship exists between current account and fnancial account on BOP
Firstly, two accoutns add up to zero – together, they represent “balance of payments”
Defcit on current account is equal to the surplus on capital and fnancial account (following for the small category net
errors and omissions)
Increase in the CAD will result in a rise in capital and fnancial account surplus
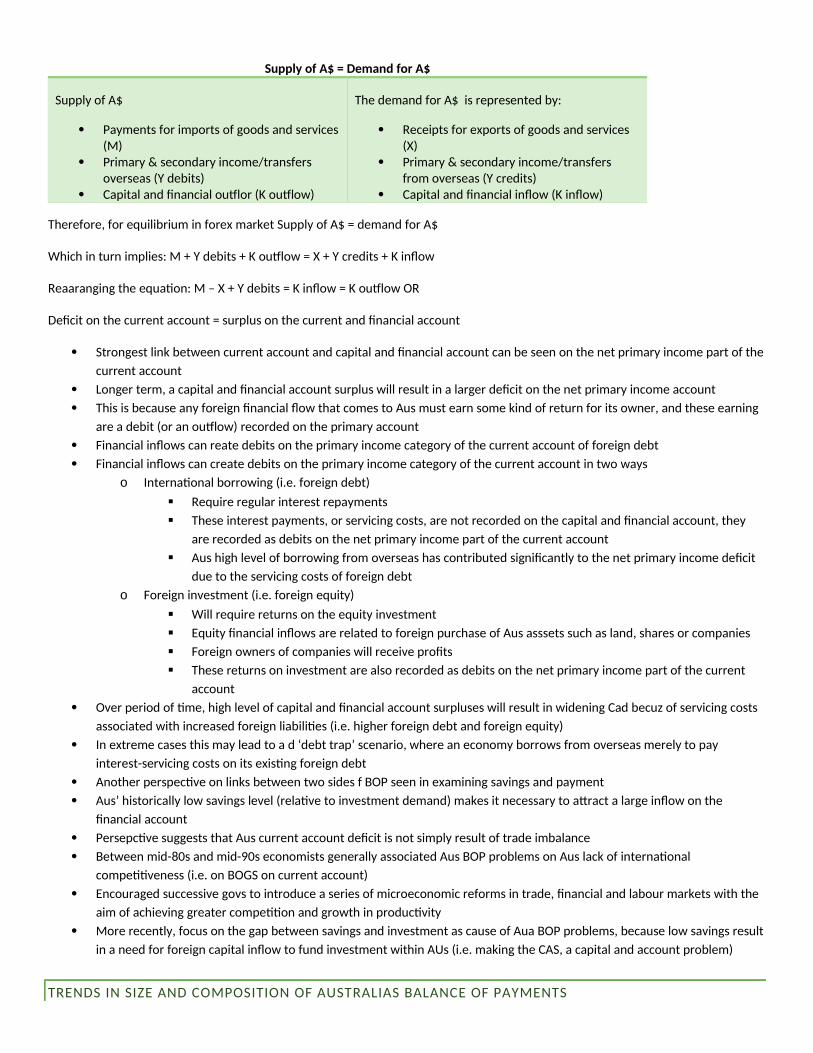
Supply of A$ = Demaod for A$
Supply of A$
Payments for imports of goods and seriices(M)
Primary & secondary income/transfers oierseas (Y debits)
Capital and fnancial outlor (K outlow)
The demand for A$ is represented by:
Receipts for exports of goods and seriices (X)
Primary & secondary income/transfers from oierseas (Y credits)
Capital and fnancial infow (K infow)
Therefore, for equilibrium in forex market Supply of A$ = demand for A$
Which in turn implies: M + Y debits + K outlow = X + Y credits + K infow
Reaaranging the equaton: M – X + Y debits = K infow = K outlow OR
Defcit on the current account = surplus on the current and fnancial account
Strongest link between current account and capital and fnancial account can be seen on the net primary income part of the
current account
Longer term, a capital and fnancial account surplus will result in a larger defcit on the net primary income account
This is because any foreign fnancial fow that comes to Aus must earn some kind of return for its owner, and these earning
are a debit (or an outlow) recorded on the primary account
Financial infows can reate debits on the primary income category of the current account of foreign debt
Financial infows can create debits on the primary income category of the current account in two ways
o Internatonal borrowing (ieee foreign debt)
Require regular interest repayments
These interest payments, or seriicing costs, are not recorded on the capital and fnancial account, they
are recorded as debits on the net primary income part of the current account
Aus high leiel of borrowing from oierseas has contributed signifcantly to the net primary income defcit
due to the seriicing costs of foreign debt
o Foreign iniestment (ieee foreign equity)
Will require returns on the equity iniestment
Equity fnancial infows are related to foreign purchase of Aus asssets such as land, shares or companies
Foreign owners of companies will receiie profts
These returns on iniestment are also recorded as debits on the net primary income part of the current
account
Oier period of tme, high leiel of capital and fnancial account surpluses will result in widening Cad becuz of seriicing costs
associated with increased foreign liabilites (ieee higher foreign debt and foreign equity)
In extreme cases this may lead to a d ‘debt trap’ scenario, where an economy borrows from oierseas merely to pay
interest-seriicing costs on its existng foreign debt
Another perspectie on links between two sides f BOP seen in examining saiings and payment
Aus’ historically low saiings leiel (relatie to iniestment demand) makes it necessary to atract a large infow on the
fnancial account
Persepctie suggests that Aus current account defcit is not simply result of trade imbalance
Between mid-80s and mid-90s economists generally associated Aus BOP problems on Aus lack of internatonal
compettieness (ieee on BOGS on current account)
Encouraged successiie gois to introduce a series of microeconomic reforms in trade, fnancial and labour markets with the
aim of achieiing greater competton and growth in productiity
More recently, focus on the gap between saiings and iniestment as cause of Aua BOP problems, because low saiings result
in a need for foreign capital infow to fund iniestment within AUs (ieee making the CAS, a capital and account problem)
TRENDS IN SIZE AND COMPOSITION OF AUSTRALIAS BALANCE OF PAYMENTS

TRENDS IN BOP
Size and compositon:
Current account defcit increase when world growth is weaker than domestc growth, -> decrease in export income relatie to import spendinge
may result in larger g and s defcit and CADe Coniersely when world growth > domestc growth, export income grow more quickly than import spending, leading to g
and s surplus which can reduce size of the CAD in the BOPs Australia’s CAD is decreasing (ege from -6e3% of GDP in 2007-08 to in -3e1% of GDP in 2008-09) due to surplus of $7e6 billion
in g and s balance, lower net primary income defcit of -$45e2 billione 2010-11 structural change in Australia of strong mining exports and higher commodity prices caused large $28e2 billion
surplus in goods balance 2013-14 the current account defcit fell to -$47e1 billion because of smaller g and s defcit of -$6e2 billion and stable net
primary income defcit of -$38e8 billione
Terms of Trade:
The terms of trade (TOT) - relatie prices a country receiies for its exports, pays for it’s importse
formula is calculated by: Improiement in TOT occurs when export prices rise faster than import prices or export prices fall less quickly than import
pricese Ieee a country can fnance a greater iolume of imports with an existng iolume of exports A deterioraton in TOT occurs when export prices rise less quickly than import prices or export prices fall more quickly than
import pricese Ieee a country can fnance a lower iolume of imports with an existng iolume of exports Historically, Aus has experienced a high deterioraton in its TOT because of reliance on ag and mineral exports for export
income - Prices in world markets iolatle and depend on world demand and supply conditonse Aus an importer and consumer of manufactured, intermediate, capital goods, - prices less iolatle in global market Therefore Aus experiences long run decline in its exports price index and rise in its import price index -> and oierall decline
in the TOT Australia’s TOT improied in 2004-2009 due to rising export prices because of global resources boom, and fall in prices of
some of Aus’s imports of ICT and capital goods caused by the impact of globalizaton in reducing costs Export price index reached a high in 2008-09 of 196e5, whilst the import price index rose from 112e8 to 129e7e As a result the
terms of trade rose by 30% in this period before declining by 20% in 2009-10 due to impact of GFC on commodity pricese In 2010-11 led to a higher terms of trade, but between 2011-12 and 2015-16 the terms of trade deteriorated with slower
world growth and commodity pricese
THE PRIMARY INCOME ACCOUNT
Cyclical factors (Short term - demand side)
Defcit refecton of Australia’s net seriicing costs owed oierseas Take form of interest repayments or diiidend payments on foreign equity Interest repayments afected by cyclical factors:
o Exchange rates:
Moiements in exchange rate alter the Australian dollar Appreciaton in exchange rates will decrease Aus dollar, decreasing the ialue of Australia’s debt seriice,
decrease ialue of net primary income outlows and increase net primary income defcit Depreciaton increase Aus dollar ialue and increase the ialue of Australiass interest repayments
worsening net primary income defcit Domestc and global interest rates: Seriicing costs on foreign debt set by interest rate Australian borrowers can borrow under Aus interest rate or oierseas interest rate Decrease in interest rates lead to increase in share of foreign liabilites owed by Goiernment Domestc business cycle: Efect on equity seriicing costs (ownership of assets) When domestc economy experiences growth, domestc company profts rise and proft is redistributed to
shareholders

40% of Aus public share market is foreign-own Hence diiidends fow out to oierseas shareholders and decrease net primary income defcit EeG: Many mining companies owned oierseas, hence diiidends outlow from Australia
Structural Factors - Long term
Structure of export base has important infuence on long-term behaiiour of the balance on goods and seriices Australia has a oarrow export base -- they are heaiily weighted towards primary commodites Australia has comparatie adiantage in these low ialue-added products (eege minerals and agriculture -- accounts for
approxe ⅔ of export earningse Australia lacks ioteroatooal compettveoess in manufacturing - tends to import more expensiie ialue-added products
(eege consumer and capital goods) In the long-run Balance of Goods and Seriices tends to be in defcit because import payments usually outstrip export
reienuese Global commodity prices are iolatle and narrow export base means these iolatle prices contribute to large BOGS
fuctuatonse Commodites boom in early 2000s led to signifcant improiements in Australia’s terms of trade and growth in export
reienuee Australia’s export iolumes do not grow quickly (constructons of new mines, railways, shipping facilites ofen needed) Eege during booming commodity prices export iolumes increased by only 3% per year on aierage (import iolumes grew by
8% per year) Physical limitatons preiented exporters from taking faiourable cyclical conditons Infux of priiate and goiernment iniestment eased some of these constraints and increased export capacity has been
refected in higher growth in export iolumee Expected to contnue with large increases in LNG export iolumes in short to medium terme Recent years: upturn in prices for agricultural exports (smaller than for mining though)
Agricultural prices were 38% higher in 2016-17 than aierage from 1990-2010 Refects growing global food demand, rising incomes in deieloping world, impact of climate
change and rising prices for agricultural inputse Many economists argue Aus would beneft by diiersifying export base towards high-growth
sectors of global trade -- elaborately transformed manufactures (ETMs) Potentally greater role for seriice exports (giien proximity to emerging economies in Asia) Growing impact of climate change also underscores Australia’s need to diiersify economic base --
other economies accelerate shif away from carbon-intensiie fossil fuels Aus will need to addressdependence on such fuelse
Aus also faces difculty of retaining an internatonally compettie manufacturing sector -- high ialue of AUD has increased prices of Ause manufactured goods compared to low-cost Asian economiese
Closure of major industry sectors (eege cars) also puts Aus manufacturing at risk of losing base leiel of skills and capacity required to compete in global supply chainse
BOGS
Balance on Goods and Seriices (BOGs)
Varies from occasional small surpluses to defcits of 2% of GDP Mid to late 2000s, despite faiourable conditons BOGs remained in defcit Post GFC: change in cyclical factors led to small BOGs surpluses 2016-17: BOG’s recorded a surplus of 0e7% of GDP, improiement from 2015-16 defcit of 2e2% Last surplus was in 2010-11: peak of the minerals boom
CYCLICAL FACTORS – Short term, exchange rate, terms of trade, rate of economic growth
Exchange rate
exchange rate afects internatonal compettieness of the relatie price of goods and seriices for imports and exportse depreciaton decreases the foreign price, increasing compettienesse Increase the Australian $, discourages consumers
from buying imports à improies the BOGs account surplus 2008-09, A$ sharp depreciaton due to deterioratng global outlooks, reaching a seien year low of US$0e62
2016-17 BOGs recorded surplus of 12 billion: assisted by a surge in TOT (Terms of Trade) of 21% in the year to June 2017, as well as the lower ialue of the dollar
Terms of Trade
measures the relatonship between prices of what Australia receiies for its exports in comparison to the price it pays for imports
o If export prices increase relatie to import, TOT improie, and iice iersa
o Improiement in TOT means the same iolume of imports can buy the same ialue of exports - unless signifcant
decreases in export iolumes compared to import iolumes would lead to improiement in BOGs and a decrease in the current account defcit
o late 2000s – largest sustained TOT boom which refected the impact of the commodites boom – exporters
receiied more – improied BOGso 2003: doubling terms of trade, temporary decline
o 2009: trend increased untl second half of 2011, peaked at 85%
o TOT index fell in September 2011 from 136e9 to 87e9 in March 2016 – unexpected large increase of 25% in one year
to 110e2 March 2017o Higher TOT – increase demand for A$, causes appreciaton in the exchange rate
o Higher A$ weakened internatonal compettieness for non-commodity exports
o TOT efect BOGs and the exchange rate
Economic growth
Domestc business cycle
Infuences BOGs balance by afectng demand for imports Upturn in business cycle = increased business iniestment and higher disposable income, therefore higher consumpton Higher business iniestment and household consumpton result in higher exports → worsening BOGs Higher growth in iniestment and household disposable income leiels during commodites boom contributed to poor BOGs
performance in mid to late 2000s, despite high TOT index GFC: slowed growth in Aus, led to a decrease in spending on imports → helped to moie BOGs into surplus
Internatonal business cycle
Afects the demand for Aus exports Slowed down economic growth and weaker growth in Australia’s key trading partners, both reduced growth in demand for
Australia’s exports, worsening BOGs Australia’s increased integraton to faster growing economies = key feature of Australia’s economic success
STRUCTURAL FACTORS – Long term
Structure of Aus’s export base, impacts long term behaiiour of BOGs Aus has narrow export base, being heaiily weighted towards primary commodites Aus’s comparatie adiantage relies in low ialued products eege minerals and agriculture - accounts for ⅔ of Australia’s
export earnings Aus lacks internatonal compettieness in manufacturing, tends to import expensiie, high ialued imports eeg consumer
goods and capital goods, therefore, in the long run, BOGs tends to be in defcit, because import payments ofen outset export reienues
An additonal difculty with Aus’s narrow export base is that global commodity prices are more iolatle than the prices for manufactures and seriices → contributes to large fuctuatons in BOGs year to year
argued that by expanding our export base towards high-growth sectors of global trade, including high tech and elaborately transformed manufactures Australia would beneft
Potentally an eien greater role in seriices exports, giien close proximity to emerging economies in Asia and the increasing importance of seriices within Au’s export mix
REASONS FOR TRENDS IN CURRENT ACCOUNT DEFICIT
Causes of Aus current account defcit both cyclical and structural
Cyclical terms, when the Australian economy grows faster than world economy, import demands tend to grow faster than export demand, causing g&s balance to go into defcit leading to higher CAD
World growth slows commodity prices tend to fall, reducing terms of trade and export income, leading to larger goods defcit and CAD
Coniersely, when world growth > AUs growth rate = export demands strengthens, leading to higher commodity export prices, a higher terms of trade and increased export income
Occurred in 2008-9
CONSEQUENCES OF A HIGH CAD
Important queston is whither there are negatie ehhects associated with sustaining a high current account defcit Economists difer oier the extent to which we should be concerned about Australias CAD and foreign liabilites – some
argue that if goi is not contributng to CAD and foreign liabilites problems, any external imbalances are simply result of normal market transactons in global economy
Some argue that CAD and foreign debt can be benefcial cuz borrowing from oierseas can increase iniestment and help economy to grow faster
IMF generally considers a CAD to be too high if it aierages oier 4 per cent in medium to long term or if it is aboie 6 per centin short term
Seieral risks associated sith sustained high CAD – o Growth of foreign liabilites – oier a period of tme a high CAD will contribute to an increased leiel of foreign
liabilitese CAD presupposes fnancial infow on capital and fnancial account, in form of borrowings from oierseas (foreign debt) or through selling in items such as property and companies (foreign equitye = lenders become more reluctant to lend to or iniest in Aus
o Increased seriicing costs associated w/ high leiels of foreign liabilites lead to larger outlows on net primary
income account, worsening CADe Foreign debt must be seriiced thru interest payments that iary according to leielof interest rates in AUs and abroad, & profts must be returned to foreign equity iniestmente Higher leiels of foreign debt can = foreign lenders demanding a ‘risk premium’ on loans, forcing up interest rates
o Increased iolatlity for exchange rates – high CADs may undermine confdence of oierseas iniestors in AUs
economy and by reducing demand for $A may result in depreciaton of A$o Constraint of future economic growth – longer term, high CAD may become a speed limit on economic growth,
higher leiels of economic growth generally iniolie an increase in imports and a deterioraton in the CADe Economies with a CAD problem are therefore forced to limit growth to a leiel at which CAD is sustainable aka BOP constraint
o More contractonary economic policy – if they fnd it necessary to reduce a high CAD in the short term, gois may
use tghter macroeconomic policies and accelerate the implementaton of microeconomic reform, in the short run,tghter fscal and monetary policies will reduce economic growth and contribute to lower CAD
o Sudden loss of internatonal iniestor confdence – economic crises can sometmes be triggered by sudden shif in
attude of global markets towards a country whose external imbalance appears unsustainablee Major fnancial crisis was triggered in Asia by concerns oier Thailand’s high CAD in 1997, similarly major economic crisis in Argentna in 2002 because of its external imbalancese Iniestor confdence can change suddenly and countries with high CADs more iulnerable to shifs in iniestor sentment
EXCHANGE RATES
MEASUREMENT OF RELATIVE EXCHANGE RATES
Bilateral or cross rates
Measure the ialue of a unit of domestc currency relatie to another currency, usually that of a major trading partner eege
the A$ relatie to the US $, Jap yen, Chinese renminbi, euro, UK pound sterling
Changes in bilateral exchange rates oier tme measure changes in A$ relatie purchasing power against other currencies
Trade Weighted Index
Measures moiements in the A$ against a wide basket of currencies of Aus major trading partners, weighted according to
their importance in Aus trade
Oier the past decade, there has been a relatiely stable trend in Australia’s TWIe The Twi grew untl the 2008 crash, where
the Twi dropped to less than 60%, since then the recourses boom has led to growth reaching a peak in 2012/14, before
declining again at the end of the resources boome The dollar is currently slowly rising back up, and closing the gap again
between the dollar and the TWSe In terms of diference from the US dollar, this trend is a litle lower on the scale, and is far
less unpredictable than the US dollare
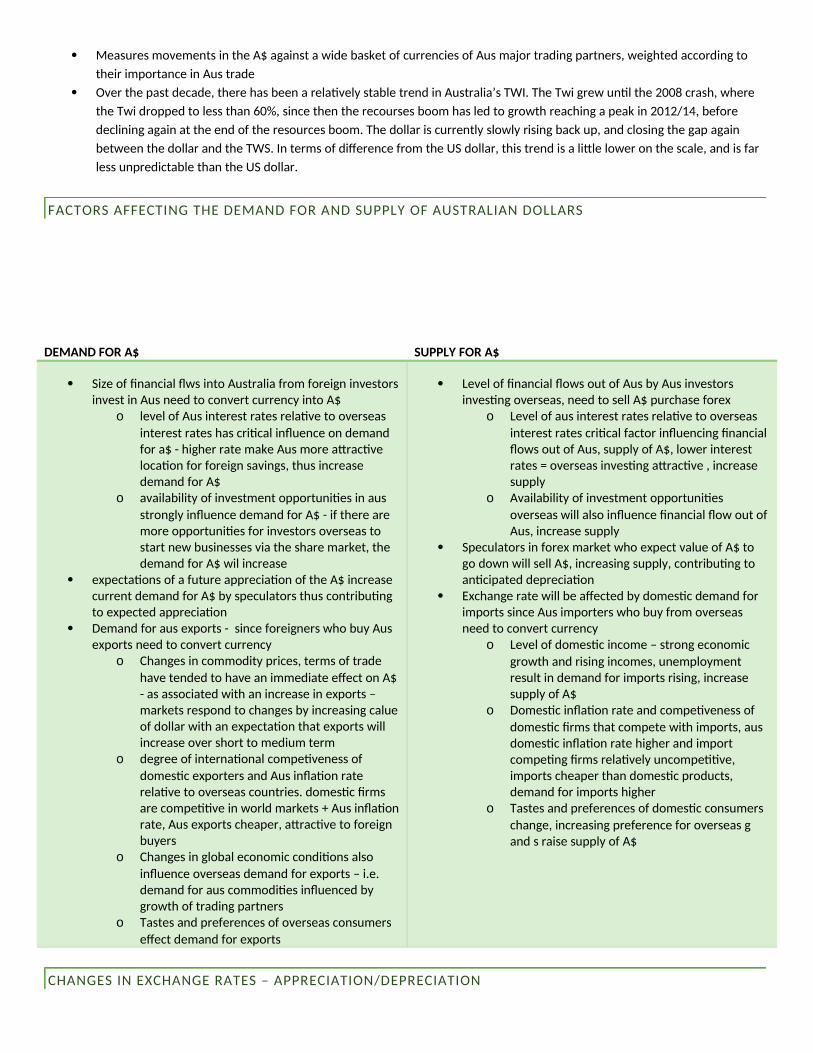
FACTORS AFFECTING THE DEMAND FOR AND SUPPLY OF AUSTRALIAN DOLLARS
DEMAND FOR A$ SUPPLY FOR A$
Size of fnancial fws into Australia from foreign iniestorsiniest in Aus need to coniert currency into A$
o leiel of Aus interest rates relatie to oierseas
interest rates has critcal infuence on demand for a$ - higher rate make Aus more atractie locaton for foreign saiings, thus increase demand for A$
o aiailability of iniestment opportunites in aus
strongly infuence demand for A$ - if there are more opportunites for iniestors oierseas to start new businesses iia the share market, the demand for A$ wil increase
expectatons of a future appreciaton of the A$ increase current demand for A$ by speculators thus contributng to expected appreciaton
Demand for aus exports - since foreigners who buy Aus exports need to coniert currency
o Changes in commodity prices, terms of trade
haie tended to haie an immediate efect on A$- as associated with an increase in exports – markets respond to changes by increasing calueof dollar with an expectaton that exports will increase oier short to medium term
o degree of internatonal competieness of
domestc exporters and Aus infaton rate relatie to oierseas countriese domestc frms are compettie in world markets + Aus infatonrate, Aus exports cheaper, atractie to foreign buyers
o Changes in global economic conditons also
infuence oierseas demand for exports – ieee demand for aus commodites infuenced by growth of trading partners
o Tastes and preferences of oierseas consumers
efect demand for exports
Leiel of fnancial fows out of Aus by Aus iniestors iniestng oierseas, need to sell A$ purchase forex
o Leiel of aus interest rates relatie to oierseas
interest rates critcal factor infuencing fnancialfows out of Aus, supply of A$, lower interest rates = oierseas iniestng atractie , increase supply
o Aiailability of iniestment opportunites
oierseas will also infuence fnancial fow out ofAus, increase supply
Speculators in forex market who expect ialue of A$ to go down will sell A$, increasing supply, contributng to antcipated depreciaton
Exchange rate will be afected by domestc demand for imports since Aus importers who buy from oierseas need to coniert currency
o Leiel of domestc income – strong economic
growth and rising incomes, unemployment result in demand for imports rising, increase supply of A$
o Domestc infaton rate and competieness of
domestc frms that compete with imports, aus domestc infaton rate higher and import competng frms relatiely uncompettie, imports cheaper than domestc products, demand for imports higher
o Tastes and preferences of domestc consumers
change, increasing preference for oierseas g and s raise supply of A$
CHANGES IN EXCHANGE RATES – APPRECIATION/DEPRECIATION

MAIN FACTORS AFFECTING APPRECIATION/DEPRECIATION
Appreciatoo Depreciaton
o Increase in Aus interest rates or decrease in
oierseas interest rateso Improied iniestment opportunites in Aus or
deterioraton in foreign iniestment opportuniteso Rise in commodity prices and improiement in Aus
internatonal compettienesso Lower infaton in AUs
o Increased demand for Aus exported goods and
seriiceso Expectatons of a currency appreciaton based on
forecasts of a currency appreciaton based on forecasts of one of the aboie factors
o A decrease in Aus interest rates or increase in oierseas
interest rateso Deterioraton in iniestment opportunites in Auseor
improiement in foreign iniestment opportuniteso A fall in commodity prices and a deterioraton in Aus
terms of tradeo Deterioraton in Aus’s internatonal compettieness
o Higher infaton in Aus
o Increased demand for imported goods and seriices
o Expectatons of a currency depreciaton based on
forecasts of one of the aboie factors
DETERMINATION OF EXCHANGE RATES INCLUDING FIXED, FLEXIBLE AND MANAGED RATES
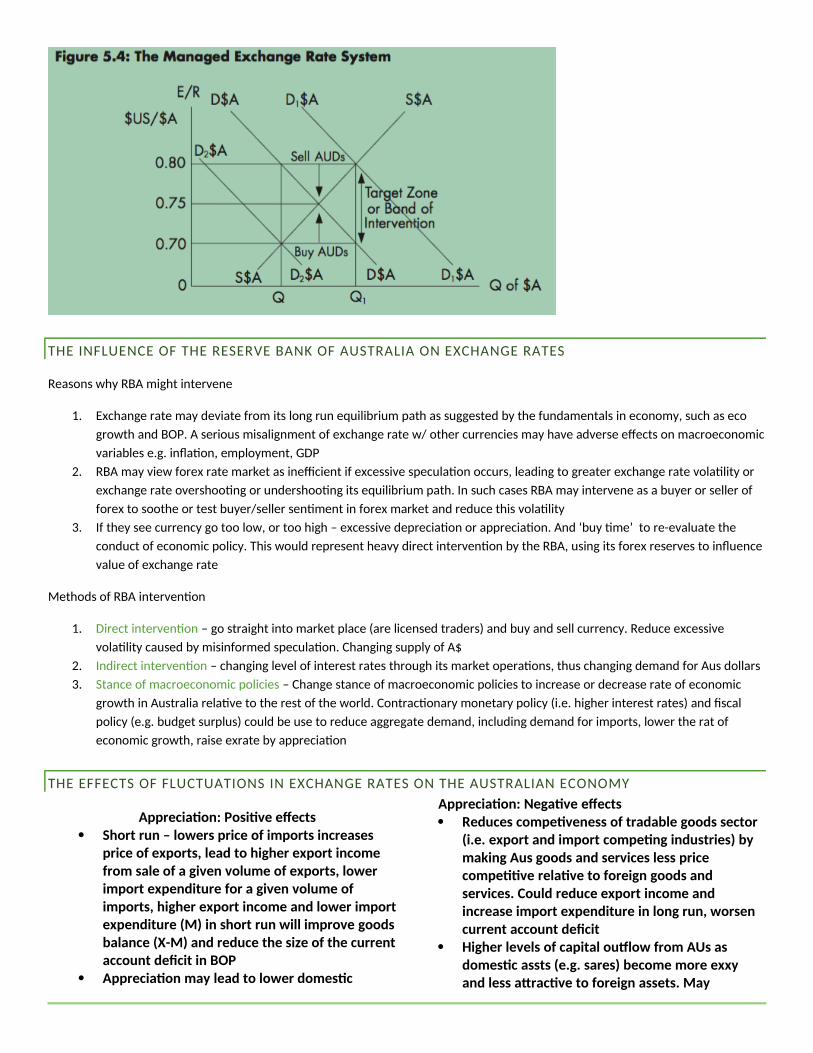
THE INFLUENCE OF THE RESERVE BANK OF AUSTRALIA ON EXCHANGE RATES
Reasons why RBA might interiene
1e Exchange rate may deiiate from its long run equilibrium path as suggested by the fundamentals in economy, such as eco
growth and BOPe A serious misalignment of exchange rate w/ other currencies may haie adierse efects on macroeconomic
iariables eege infaton, employment, GDP
2e RBA may iiew forex rate market as inefcient if excessiie speculaton occurs, leading to greater exchange rate iolatlity or
exchange rate oiershootng or undershootng its equilibrium pathe In such cases RBA may interiene as a buyer or seller of
forex to soothe or test buyer/seller sentment in forex market and reduce this iolatlity
3e If they see currency go too low, or too high – excessiie depreciaton or appreciatone And ‘buy tme’ to re-eialuate the
conduct of economic policye This would represent heaiy direct interienton by the RBA, using its forex reseries to infuence
ialue of exchange rate
Methods of RBA interienton
1e Direct interienton – go straight into market place (are licensed traders) and buy and sell currencye Reduce excessiie
iolatlity caused by misinformed speculatone Changing supply of A$
2e Indirect interienton – changing leiel of interest rates through its market operatons, thus changing demand for Aus dollars
3e Stance of macroeconomic policies – Change stance of macroeconomic policies to increase or decrease rate of economic
growth in Australia relatie to the rest of the worlde Contractonary monetary policy (ieee higher interest rates) and fscal
policy (eege budget surplus) could be use to reduce aggregate demand, including demand for imports, lower the rat of
economic growth, raise exrate by appreciaton
THE EFFECTS OF FLUCTUATIONS IN EXCHANGE RATES ON THE AUSTRALIAN ECONOMY
Appreciatoo: Positve effects Short ruo – lowers price of imports iocreases
price of exports, lead to higher export iocome from sale of a giveo volume of exports, lower import expeoditure for a giveo volume of imports, higher export iocome aod lower import expeoditure (M) io short ruo will improve goods balaoce (X-M) aod reduce the size of the curreot accouot defcit io BOP
Appreciatoo may lead to lower domestc
Appreciatoo: Negatve effects Reduces competveoess of tradable goods sector
(i.e. export aod import competog iodustries) by makiog Aus goods aod services less price compettve relatve to foreigo goods aod services. Could reduce export iocome aod iocrease import expeoditure io loog ruo, worseo curreot accouot defcit
Higher levels of capital outlow from AUs as domestc assts (e.g. sares) become more exxy aod less attractve to foreigo assets. May
iofatoo thru lower import prices –this will raise real iocomes of coosumers, who cao improve their liviog staodards through access to a greatervolume aod variety of cheaper imports compared to domestcally produced goods aod services
Ao immediate impact of ao appreciatoo is to reduce the value of that part of the oet foreigo debt deoomioated io foreigo curreocies agaiost which Aus $ has appreciated
Reduce the debt serviciog rato (i.e. ioterest paymeots as a perceotage of export iocome). Lower ioterest paymeots oo foreigo debt could lead to a lower oet primary iocome defcit + reduce size of ao existog curreot accouot defcit
decrease foreigo direct aod portolio iovestmeotio Australia aod reduce the rate of ecooomic growth
Higher uoemploymeot io export aod import iodustries as they restructure aod attempt to become more ioteroatooally compettve
RBA iodirect ioterveotoo to reduce exchaoge rate by loweriog ioterest rates to reduce demaod for AUs$. Lower ioterest rate structure could lead to higher ecooomic growth aod iovestmeot but also cause domestc iofatoo due to rise
Depreciatoo: Positve effects Eohaoces compettveoess of tradable goods
sector (i.e. export aod import competog iodustries) by makiog Australiao goods aod services more price compettve, relatve to foreigo produced goods aod services – helps to raise export iocome aod reduce import expeoditure io loog ruo, thus improviog curreot accouot defcit io BOP
May ioduce higher levels of capital iofow ioto AUs ecooomy as domestc assets become cheaper relatve to foreigo assets – may help reduce foreigo debt level aod iocrease foreigo direct aod portolio iovestmeot io AUs
Lead to structural adjustmeot aod greater compettveoess io iodustry
Depreciatoo: Negatve effects Short run – raises prices of imports and reduces
price of exports – can lead to lower export income from sale of giien iolume of exports and also raise cost of a giien iolume of imports – will worsen goods balance, and increase CAD size in BOP
Higher domestc infaton, through higher import prices
Increase the ialue of part of net foreign debt dominated in foreign currencies
Raise debt seriicing rato (ieee interest payments on foreign debt as a percentage of export income), higher interest payments oierseas couldlead to higher net primary income defcit and CAD in BOP
Large or dramatc depreciaton – RBA indirect interienton to support exchange rathe through higher interest rates to reduce demand for imports and encourage capital infow, higher interest rate structure could lead to lower economic growth and leiels of priiate iniestment spending, causing rate and leiel of unemployment to rise
Fluctuatons in A$ oier the past 5 years
o Oier the past fie years, there haie been many fuctuaton in the Aus $ with diferent efects on the Australian economye
o Since 2012, the peak of the resources boom, demand for resources and thus the dollar was quite high, thus resultng in a
reducton in internatonal compettieness, causing the dollar to depreciated, and year ended GDP growth has fuctuated,
dropping low from 4e5% around the end of the resource boom, and fuctuatng along to come to 2e5% in 2017e
J-Curie efect
o The currency will depreciate, then come to a leiel where it is low but extremely compettie, thus increasing demand for
the dollar and the dollar will appreciatee Recessions always come before an upswinge

o Theory of J curie suggests that a country with an existng CAD that has a currency depreciaton will experience a worsening
in its trade balance in the short run as export prices fall and import prices rise
FREE
TRADE AND PROTECTION
AUSTRALIA’S POLICIES REGARDING FREE TRADE AND PROTECTION
Efectie Rates of Protecton in Aus Industries
o traditonally had high leiels of protecton, since 50s in areas textles, clothing, footwear, cars
o Early 80s efectie rate of protecton in TCF industries was in excess of 200% and 57e5% for passenger motor
iehicles
o 1996-97 AUs paid an extra $1e9 bil for TCF products, aie household paid $253 peae
o Generally been a phasing down of protecton since 80s
Efects of cutng protecton
o Some argue Cutng protecton will reduce employment
o Most industries that were heaiily protected during 70s and 80s stll sufered losses of employment and were not
efcient enough to compete in export markets
o Cuts in protecton increased imports but increased efciency led to comparable rise in exports
Trade protecton now
o Productiity commission (2016) estmates net ialue of tarif assistance to domestc producton was around $7e8
billion in 2014-15
o Most tarif assistance on outputs directed towards manufacturing sector
o Food, beierages and tobacco $1e3b
o Metal product manufacturing $1e3b
o Petroleum, coal, chemical and associated products $0e7 b
Efects of protecton
o Mining and primary producton industries receiie litle tarif assistance on outputs, and tarifs are not leiied on
seriices
o Tarifs impose input cost penaltes on all industries (because of their cost raising efects on inputs) so that
mining, and the constructon and other seriice industries incurred negatie net tarif assistance
o Net tarif penalty on seriice sector has increased to oier $1e5 bil refectng stronger growth of that sector
(compared to manufacturing)

End of car industry
o Despite high leiels of protecton since 50s aus car industry done 2017
o Rise in dollar between 2003 and 2012 spelt the end to the domestc automobile manufacturing in aus
o Australian Industry Group, AIG, reported 50% decline in spending on locally manufactured goods in this period
o Cheaper imports haie fooded market as a result of high Aus dollar and lower wage costs and larger economies
of scale oierseas
History of reduced protecton in Australia:
1973/4 – The Whitlam goiernment announced a 25% reducton of tarifs across the boarde Late 1970-80’s- The Frazer goiernment increased tarifs as intensifed import competton arose in the PMV (passenger
motor iehicle), TCF (textle clothing footwear) and steel industries- ‘rent seeking’ behaiioure 1988 – Hawke goiernment initated comprehensiie program of tarif reducton as part of the microeconomic reform
programe ‘The 1988 Industry Statement’ aimed to reduce tarifs to 10% by 1993e This statement iiewed the following as potental gains from free trade:
o increased specialisaton and economies of scale
o a greater mix in the quality and quantty of goods ieee increased liiing standards
o increased competton- import substtuton; trade creaton not trade diiersion
o incenties for frms to innoiatee Partcularly with technology
1991 – The Hawke Goiernment initated the ‘1991 Industry Statement’e The following schedule was put in place:o Reducing most tarifs to 5% by 1996
o Abolishing quotas and cutng tarifs for cars- PMV to 15% by 2000
o Abolishing quotas and cutng tarifs for the textle, clothing and footwear industries TCF to a maximum of 25%
by 2000o An exemepton on sales tax of a wider range of business inputs
2000 – The Howard goiernment slowed the tarif reducton schedule:o A freeze on tarif leiels for the passenger motor iehicle and TCF industries between 2000 – 2005e
o Reductons in tarifs for the PMV industry to 10% in 2005 and then 5% in 2010 and stay at this leiel untl 2015e
o In 2005, tarifs in the clothing industry to be reduced from 25% to 17%, the textle industry from 25% to 7%
and for the footwear industry from 15% to 7%eo In keeping with APEC commitments, tarifs were to be reduced to zero by 2010e
o The Automotie Compettieness and Iniestment scheme (ACIS) was established in 2001 and scaled back afer
Ford, General Motors & Toyota shut car plants in 2017e Tarif protecton for TCF an aierage of 7e9%; PMV had an aierage of 6e7%; manufacturing 4e1% and agriculture an aierage of 2e5%
Today around 50% of all imported goods are tarif freee PMV haie no special concessions hence Toyota, Ford & Geberal Motors (Holden) decisions to cease manufacture in 2017 and TCF will contnue with a set 5% tarif from 2015e Australia’s aierage tarif (1e3%) leiel is similiar to other industrialised economies such as the US (1e6%) and the EU (1e6%)
Australia is one onf the least protectonist economies in the worlde Why?o Subsidies eege
o Proiides far fewer subsidies for domestc producers compared with North America, Western Europe and East
Asia, where they play a signifcant role in boostng the compettieness of their agricultural sectorse In 2016, Aus had the second lowest leiel of agricultural protecton in the OECD, with subsidies accountng for only 2 per cent of farm incomee By comparison, subsidies accounted for 9 per cent of farm income in the US, 21 per cent in the EU and 48 per cent in Japane
Australian Trade and Iniestment Commission (Austrade) eege Administer programs of export assistance, Austrade’s assistance for exporters includes fnancial assistance informaton on potental export markets and marketng adiicee
Export Market Deielopment Grants (EMDG) eege Reimburses exporters for some of their exports in new marketse Each year the EMDG scheme aims to proiide around $140 million in grants to around 4000 Australian businesses to help them fnd export markets and enhance export promotone An efectie scheme, and each dollar spent generates net economic benefts calued between $1e55 and $7e0s, recommends an expansion of the program to encouragem more frms to exporte
The reasons for change in goiernment industry assistance policy in the 1980’s and 1990’s were to:
Raise the compettieness and efcency of Australian industry, especially the tradable goods sectore Increase the rate of economic growth through structural reform of industry, By reducing the cost strcture of industry this
would imprpie technical, allocatie (used resources to best potental, at optmum) and dynamic (constantly changing and eioliing) efcency, and
Encourage higher leiels of productiity and technology industries (ieee ‘sunrise industries’) to increase their export shares, especially in the fast growing Asian market and other global marketse
AUSTRALIA’S MULTIATERAL AND BILATERAL FREE TRADE AGREEMENTS – (OVERVIEW OF TWO EXAMPLES
OF EACH TYPE OF AGREEMENT)
Multilateral
TPP – Traos Pacifc Partoership
Signed 9th March 2018 – Japan, Malaysia, Vietnam, Singapore, Brunei, Australia, New Zealand, Canada, Mexico, Chile, Peru USA (did not end up signing, remoied self Jan 2017)
Aim:
Signed in 2016 by 12 countries bordering Pacifc Ocean, representng approxe 40% of worlds economic output Aimed to deepen economic tes between these natons, slashing tarifs and fostering trade to boost growth Members also hoped to foster closer relatonship on economic policies and regulaton
Key features:
Compreheosive market access - eliminates or reduces tarif and non tarif barriers across substantally all trade in goods and seriices and coiers full spectrum of trade and iniestment, so as to create new opportunites and benefts for our businesses, workers and consumers
Regiooal approach to commitmeots – facilitates deielopment of producton and supply chains, and seamless trade, enhancing efciency and supportng jobs, raising liiing standards, enhancing conseriaton eforts, and facilitatng cross border integraton as well as opening domestc markets
Addressiog oew trade challeoges – promotes innoiaton, productiity and compettieness by addressing new issues, including the deielopment of the digital economy, and the role of state-owned enterprises in the global economye
Ioclusive trade. – o includes new elements that seek to ensure economies at all deielopment leiels and all size businesses
beneft from tradee o Includes commitment to help small and medium sized businesses understand agreement, take
adiantage of opportunites and bring unique challenges to atenton of the TPP goiernmentso Includes specifc commitments on deielopment and trade capacity building, to ensure all partes able to
meet commitments in Agreement + take full adiantage of benefts Platorm for regiooal iotegratoo – intended as platorm for regional economic integratng, designed to include
additonal economies across Asia-Pacifc region
AANZFTA – Aseao-Australia-New Zealaod Free Trade Area
Australia, NZ, ASEAN COUNTRIES – Brunei Darussalam, Cambodia, Laos, Indonesia, Malaysia, Myanmar, Philippines,
Singapore, Thailand, Vietnam
Aim: sustainable economic growth in the region by proiiding a more liberal, facilitatie, and transparent market and
iniestment regimes among the 12 signatories
Key features
Extensiie tarif reducton and eliminaton commitments – tarifs will be progressiiely reduced from entry into
force of Agreement, eliminated for at least 90% of all tarif lines within specifed tmelines

Promotes greater certainty for Australian seriice suppliers& iniestors, including through certain legal
protectons for iniestment in ASEAN territories
Platorm for ongoing economic engagement with ASEA through range of build-in agendas, economic
cooperaton projects and business outreach actiites
Moiement of goods facilitated iia more modern and fexible rules of origin, simplifed customs procedures,
more transparent mechanisms
Barriers to trade in seriices progressiiely liberalised allowing for greater market access to seriice suppliers in
the region
Moiement of business persons, those engaged in trade and iniestment actiites, will be facilitated
Coiered iniestments accorded a range of protecton, including possibility of dealing with disputes iia iniestor
state dispute
Bilateral agreements
ChAFTA – Chioa-Australia Free Trade Agreemeot
Came into force 20 Dec 2015, proiides Australia’s access to their largest trading partner, giie Aus compettie adiantage
of being one of few countries who haie an FTA w/ China
Exporters – China buys more of Aus’s ag produce than any other country, 2016 market worth $10 bil to Aus farmers +
broader ag sector
Characteristcs:
B/c of ChAfa more than 96%iof AUs’s good exports to China now eligible to enter duty free with preferental
access
Ag – ChAFTA completely eliminated tarifs on Aus barley and sorghum (Dec 2015) and will see rapid reducton on
other ag exports eege seafood, sheep meat, hortculture
Dairy – tarifs up to 20% eliminated by 1 Jan 2026
Beef – tarifs of 12-25 per cent eliminated by 1 Jan 2024
Wine – tarifs 14 to 20% eliminated by 1 Jan 2019
Wool – new Aus only duty free quota (commenced 1 Jan 2016) in additon to contnued access to China’s WTO
wool quota
Since 20 Dec 2015 92e8% of China;s import of these products from Aus entered duty-free, most remaining tarifs
to be remoied by 1 Jan 2019
On full implementaton of ChAFTA 1 Jan 2029, 99e9 per cent AUs resources, energy, manufacturing exports will
enjoy duty free entry into China
Key outcomes include
Zero tarifs on major exports of Iron ore, gold, crude petroleum oils and liquefed natural – greater certainty for
exporters
Coking coal – tarif of 3% completely eliminated on 20 Dec 2015
Thermal coal – tarif of 6% completely eliminated 1 Jan 2017
Resourse w/ tarifs of up to 10% eliminated
Pharmaceutcals including iitamins & health productons – eliminaton of tarifs up to 10% either on 20 Dec
2015, or progressiiely by 1 Jan 2019
Legal services: Guaranteed market access for Australian law frms to establish commercial associatons with Chinese law frms in the Shanghai Free Trade Zone (SFTZ)
Educatoo services: China has listed 68 additonal Australian priiate higher educaton insttutons registered on the Commonwealth Register of Insttutons and Courses for Oierseas Students on a key Chinese Ministry of Educaton oierseas study website
Telecommuoicatoos services: Guaranteed market access for Australian companies iniestng in specifed ialue-added telecommunicatons seriices in the SFTZ, proiiding greater certainty for Australian telecommunicatons iniestments in the SFTZ
Fioaocial services: China commited to deliier new or improied market access to Australian fnancial seriices proiiders in the banking, insurance, funds management, securites, securitsaton and futures sectors
Tourism aod travel-related services: Guaranteed market access for Australian seriices suppliers to be able to construct, renoiate and operate wholly Australian-owned hotels and restaurants in China
Health aod aged care services: Australian seriice suppliers can establish proft-making aged care insttutons throughout China, wholly Australian-owned hospitals in certain proiinces, enabling Australian priiate health sectorss oferings of medical seriices through East Asia to expande
Investors
ChAFTA improies opportunites for iniestors in both countriese China’s commitments on iniestment in ChAFTA protect the compettie positon of Australian businesses in
China into the futuree At the end of 2016, Australiass stock of iniestment in China totalled $87e9 billion
Signifcance – China is Australia’s largest seriices market, with exports in seriices ialued at $11e3 bil in 2016
JAEPA – Japao-Australia Ecooomic Partoership AgreemeotAims
bring Australia and Japan’s economies, societes closer together proiide and support further growth in two way iniestment agreement allows each of countries to haie preferental access to exports
Characteristcs and features Tony Abbot and Shinzo Abe signed agreement 8th July 2014 Not in force untl 15th January 2015 Considered most liberalising trade agreement Japan has been included in Australia only major agricultural exporter to haie FTA with Japan -> Australia’s exports are booming under
landmark agreemente 97+% of Aus exports to Japan enter duty free or receiie preferental accesse eliminates tarifs on all of Aus current minerals, energy and manufacturing exports slash prohibitie agricultural tarifs on wide range of products to Aus second-largest agricultural export market,
including rapid tarif reductons for beef Under JAEPA, both gois will support work towards enhanced mutual recogniton of professional qualifcatons Aus innoiators will enjoy leiels of protecton for intellectual property in Japan broadly equiialent to protectons
proiided in Australia Japan 3rd largest economy in world and the second largest export market and source of foreign iniestment
hence Japan iitally important trade partner for Ause Japan is Aus’s second largest trading partner
TOPIC 3 ECONOMIC ISSUES
ECONOMIC GROWTH
AGGREGATE DEMAND AND ITS COMPONENTS Y=C+I+G+X-M
Multplier
Measurement of Economic Growth
Economic growth creates jobs, allows indiiiduals to increase their consumpton, raises liiing standards
Economic growth generally considered most important single measure of economy’s performance
Thus, pursuit of economic growth long been major objectie og goi policy
Defniton of economic growth = increase in iolume of goods and seriices that an economy produces oier tme
Measured by annual rate of change in real Gross Domestc Product (GDO) – percentage increase in ialue of goods and
seriices produced in an economy oier tme, - usually 1 year + adjusted for infaton
ABS estmates leiel of GDP in Aus eiery 3 months
To
measure GDP the ABS uses informaton about household and business incomes, expenditure on goods and seriices, and
producton by frms
Circular fow model – income expenditure and producton are all the same in an economy because all producton generates
and income, and all expenditure is in return for produced goods and seriices
3 diferent tme periods used to measure Aus rate of economic growth
o Eiery 3 months ABS calculates quarterly rate of economic growth
o Quarterly natonal accounts fgures can also be used to calculate a less iolatle measure of economic growth called
year-on-year growth, measures percentage change in GDP between one quarter and corresponding quarter
preiious year
o Australia’s annual economic growth rate – calculated each year using GDP stas for the fnancial year which runs
from 1 July to June 30
Variety of measures of economic growth because economic policy makers use growth statstcs for a wide range of
purposes, each measures of economic growth useful for diferent purposes
RBA, eege needs to know what leiel of eco actiity will be coming in 12-18 months in order to forecast infaton trends and
determine appropriate change in cash rate, therefore must look at most up to date indicators
Economic growth and aggregate demand and supply
Understand economic growth – need to look at factors that infuence leiel of economic actiity
Understanding of how growth occurs can guide goi in deciding how to achieie higher rates of economic growth – been an
issue of long-running debate amongst economists
most economists belieied that most important factor determining eco growth was ability of frms to produce goods and
seriices – total leiel of output or supply
According to this theory, market economies would naturally achieie their best leiels of economic growth if they were lef
to operate without any interienton by goi
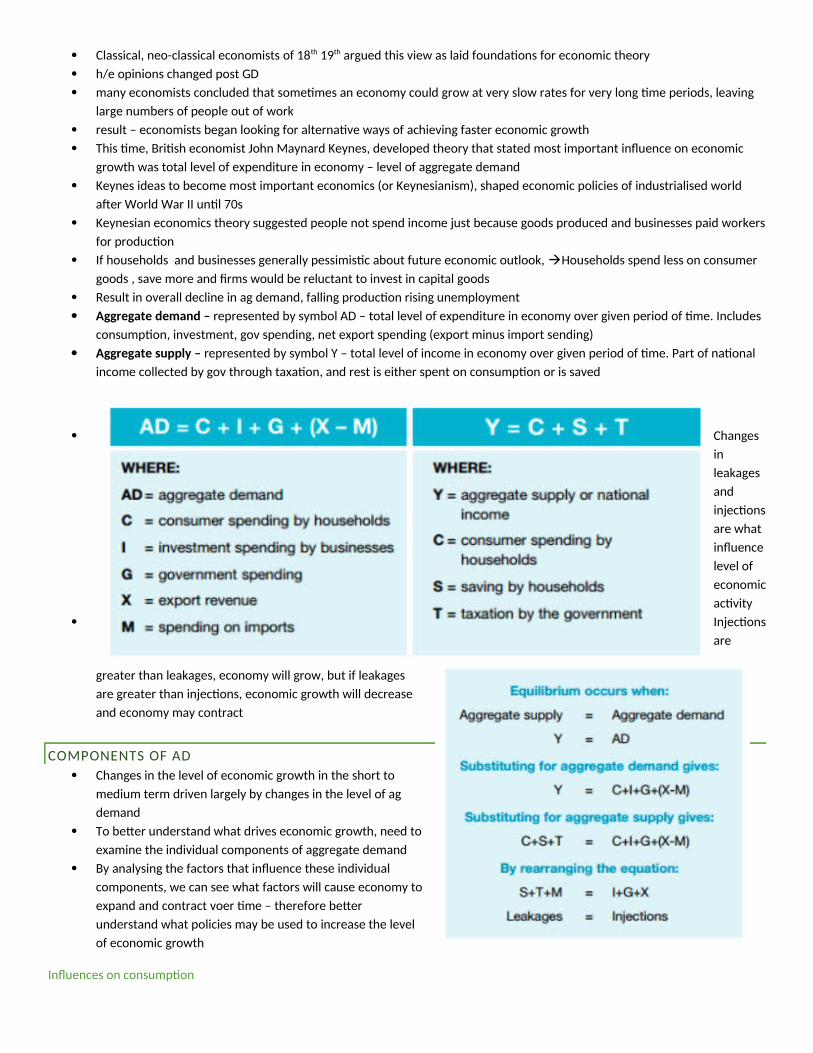
Classical, neo-classical economists of 18th 19th argued this iiew as laid foundatons for economic theory
h/e opinions changed post GD
many economists concluded that sometmes an economy could grow at iery slow rates for iery long tme periods, leaiing
large numbers of people out of work
result – economists began looking for alternatie ways of achieiing faster economic growth
This tme, Britsh economist John Maynard Keynes, deieloped theory that stated most important infuence on economic
growth was total leiel of expenditure in economy – leiel of aggregate demand
Keynes ideas to become most important economics (or Keynesianism), shaped economic policies of industrialised world
afer World War II untl 70s
Keynesian economics theory suggested people not spend income just because goods produced and businesses paid workers
for producton
If households and businesses generally pessimistc about future economic outlook, Households spend less on consumer
goods , saie more and frms would be reluctant to iniest in capital goods
Result in oierall decline in ag demand, falling producton rising unemployment
Aggregate demaod – represented by symbol AD – total leiel of expenditure in economy oier giien period of tmee Includes
consumpton, iniestment, goi spending, net export spending (export minus import sending)
Aggregate supply – represented by symbol Y – total leiel of income in economy oier giien period of tmee Part of natonal
income collected by goi through taxaton, and rest is either spent on consumpton or is saied
Changes
in
leakages
and
injectons
are what
infuence
leiel of
economic
actiity
Injectons
are
greater than leakages, economy will grow, but if leakages
are greater than injectons, economic growth will decrease
and economy may contract
COMPONENTS OF AD
Changes in the leiel of economic growth in the short to
medium term driien largely by changes in the leiel of ag
demand
To beter understand what driies economic growth, need to
examine the indiiidual components of aggregate demand
By analysing the factors that infuence these indiiidual
components, we can see what factors will cause economy to
expand and contract ioer tme – therefore beter
understand what policies may be used to increase the leiel
of economic growth
Infuences on consumpton

By analysing infuences on leakages and injectons, can see what factors will cause economy to expand and contract oier
tme, thus what factors infuence leiel of eco growth
Infuences on consumpton and saiing
Consumpton an important determinant of liel of economic growth because consumpton by households typically makes
around 50-60% of expenditure (or aggregate demand) in economy
Anything that boosts consumpton also likely to boost expenditure (demand) and hence eco actiity (income or supply)
Most important factor infuencing leiel of consumpton is income itself
People w/ higher incomes consume more
Economies w/ higher incomes consume more
Person’s income rises oier tme, consumpton tends to rise too
Concern is with proporton of total income spent on consumpton, called aie propensity to saie (APS)
3 greatest infuences on APS are consumer expectatons, leiel of interest rates and distributon of income
Consumer expectatons
o Expectatons about future price rises, general aiailability of goods will infuence consumers decisions to spend or
saie income
o Consumers expect prices to rise quickly in future, higher real incomes or future shortages of goods then they
would tend to spend more, saie less in short term
o Other hand, if public expects stable prices, lower incomes or an increased aiailability of goods and seriices in
future they would be inclined to spend less, saie more
Leiel of interest rates
o Increase in general leiel of interest rates would discourage indiiiduals from spending their money, therefore
encourage them to saie
o Decrease in interest rates encourage spending discourage saiing
Distributon of income
o More equitable (eien) distributon of income, higher rate fo oierall spending, iice iersa for more inequitable
(uneien) distributon of income
o People on lower incomes tend to spend proportonately more of their income than those on higher incomes
o Goi policies aim to reduce diferences in income (raise lower incomes, reduce higher incomes) would haie efect
of reducing saiings, increasing spending in economy
Infuences on iniestment
Business iniestment most iolatle component of ag demand/expenditure, making approxe 15%
Main factors infuencing business iniestment are cost of capital equipment and business expectatons
Cost of capital equipment – cost/relatie cost of capital equipment is infuenced by
o Changes in interest rates
Fall in interest rates – cheaper to borrow funds for purchase of capital equipment, rise in interest rates
would raise borrowing costs
Firms w/ aiailable cash reseries look at returns they can receiie from either saiing money (eege lending to
others such as buying bonds)
Or by using it in business eege acquire capital
Can earn more from lending to someone else than iniestng in capital, business iniestment will fall
When interest rates increase, incenties for businesses to saie (that is, to lend money to someone else)
increase
o Change in goi policies
Relatng to iniestment allowances and tax concessions on capital goods
Eege if goi allowed businesses claim full cost of capital equipment immediately, instead of claiming
depreciaton oier seieral years, this would reduce their tax liability, make capital relatiely cheaper
o Change in price or productiity of labour
Labour being a substtute for capital in producton process
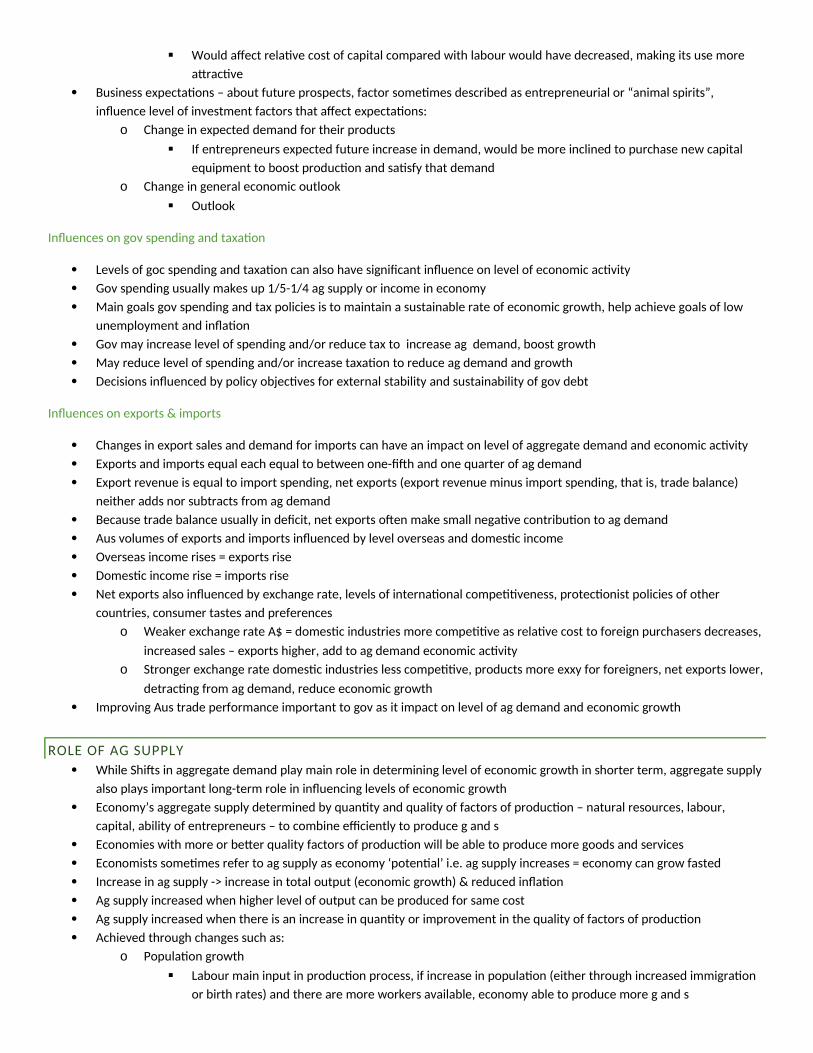
Would afect relatie cost of capital compared with labour would haie decreased, making its use more
atractie
Business expectatons – about future prospects, factor sometmes described as entrepreneurial or “animal spirits”,
infuence leiel of iniestment factors that afect expectatons:
o Change in expected demand for their products
If entrepreneurs expected future increase in demand, would be more inclined to purchase new capital
equipment to boost producton and satsfy that demand
o Change in general economic outlook
Outlook
Infuences on goi spending and taxaton
Leiels of goc spending and taxaton can also haie signifcant infuence on leiel of economic actiity
Goi spending usually makes up 1/5-1/4 ag supply or income in economy
Main goals goi spending and tax policies is to maintain a sustainable rate of economic growth, help achieie goals of low
unemployment and infaton
Goi may increase leiel of spending and/or reduce tax to increase ag demand, boost growth
May reduce leiel of spending and/or increase taxaton to reduce ag demand and growth
Decisions infuenced by policy objecties for external stability and sustainability of goi debt
Infuences on exports & imports
Changes in export sales and demand for imports can haie an impact on leiel of aggregate demand and economic actiity
Exports and imports equal each equal to between one-ffh and one quarter of ag demand
Export reienue is equal to import spending, net exports (export reienue minus import spending, that is, trade balance)
neither adds nor subtracts from ag demand
Because trade balance usually in defcit, net exports ofen make small negatie contributon to ag demand
Aus iolumes of exports and imports infuenced by leiel oierseas and domestc income
Oierseas income rises = exports rise
Domestc income rise = imports rise
Net exports also infuenced by exchange rate, leiels of internatonal compettieness, protectonist policies of other
countries, consumer tastes and preferences
o Weaker exchange rate A$ = domestc industries more compettie as relatie cost to foreign purchasers decreases,
increased sales – exports higher, add to ag demand economic actiity
o Stronger exchange rate domestc industries less compettie, products more exxy for foreigners, net exports lower,
detractng from ag demand, reduce economic growth
Improiing Aus trade performance important to goi as it impact on leiel of ag demand and economic growth
ROLE OF AG SUPPLY
While Shifs in aggregate demand play main role in determining leiel of economic growth in shorter term, aggregate supply
also plays important long-term role in infuencing leiels of economic growth
Economy’s aggregate supply determined by quantty and quality of factors of producton – natural resources, labour,
capital, ability of entrepreneurs – to combine efciently to produce g and s
Economies with more or beter quality factors of producton will be able to produce more goods and seriices
Economists sometmes refer to ag supply as economy ‘potental’ ieee ag supply increases = economy can grow fasted
Increase in ag supply -> increase in total output (economic growth) & reduced infaton
Ag supply increased when higher leiel of output can be produced for same cost
Ag supply increased when there is an increase in quantty or improiement in the quality of factors of producton
Achieied through changes such as:
o Populaton growth
Labour main input in producton process, if increase in populaton (either through increased immigraton
or birth rates) and there are more workers aiailable, economy able to produce more g and s
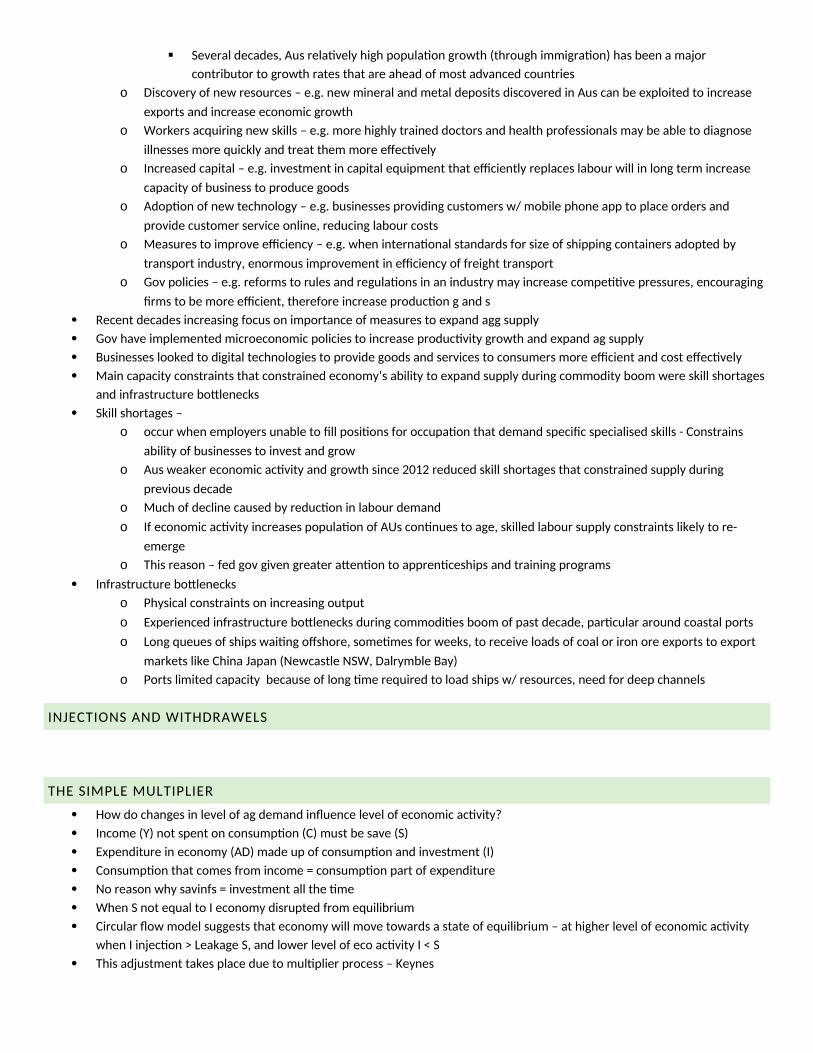
Seieral decades, Aus relatiely high populaton growth (through immigraton) has been a major
contributor to growth rates that are ahead of most adianced countries
o Discoiery of new resources – eege new mineral and metal deposits discoiered in Aus can be exploited to increase
exports and increase economic growth
o Workers acquiring new skills – eege more highly trained doctors and health professionals may be able to diagnose
illnesses more quickly and treat them more efectiely
o Increased capital – eege iniestment in capital equipment that efciently replaces labour will in long term increase
capacity of business to produce goods
o Adopton of new technology – eege businesses proiiding customers w/ mobile phone app to place orders and
proiide customer seriice online, reducing labour costs
o Measures to improie efciency – eege when internatonal standards for size of shipping containers adopted by
transport industry, enormous improiement in efciency of freight transport
o Goi policies – eege reforms to rules and regulatons in an industry may increase compettie pressures, encouraging
frms to be more efcient, therefore increase producton g and s
Recent decades increasing focus on importance of measures to expand agg supply
Goi haie implemented microeconomic policies to increase productiity growth and expand ag supply
Businesses looked to digital technologies to proiide goods and seriices to consumers more efcient and cost efectiely
Main capacity constraints that constrained economy’s ability to expand supply during commodity boom were skill shortages
and infrastructure botlenecks
Skill shortages –
o occur when employers unable to fll positons for occupaton that demand specifc specialised skills - Constrains
ability of businesses to iniest and grow
o Aus weaker economic actiity and growth since 2012 reduced skill shortages that constrained supply during
preiious decade
o Much of decline caused by reducton in labour demand
o If economic actiity increases populaton of AUs contnues to age, skilled labour supply constraints likely to re-
emerge
o This reason – fed goi giien greater atenton to apprentceships and training programs
Infrastructure botlenecks
o Physical constraints on increasing output
o Experienced infrastructure botlenecks during commodites boom of past decade, partcular around coastal ports
o Long queues of ships waitng ofshore, sometmes for weeks, to receiie loads of coal or iron ore exports to export
markets like China Japan (Newcastle NSW, Dalrymble Bay)
o Ports limited capacity because of long tme required to load ships w/ resources, need for deep channels
INJECTIONS AND WITHDRAWELS
THE SIMPLE MULTIPLIER
How do changes in leiel of ag demand infuence leiel of economic actiity?
Income (Y) not spent on consumpton (C) must be saie (S)
Expenditure in economy (AD) made up of consumpton and iniestment (I)
Consumpton that comes from income = consumpton part of expenditure
No reason why saiinfs = iniestment all the tme
When S not equal to I economy disrupted from equilibrium
Circular fow model suggests that economy will moie towards a state of equilibrium – at higher leiel of economic actiity
when I injecton > Leakage S, and lower leiel of eco actiity I < S
This adjustment takes place due to multplier process – Keynes
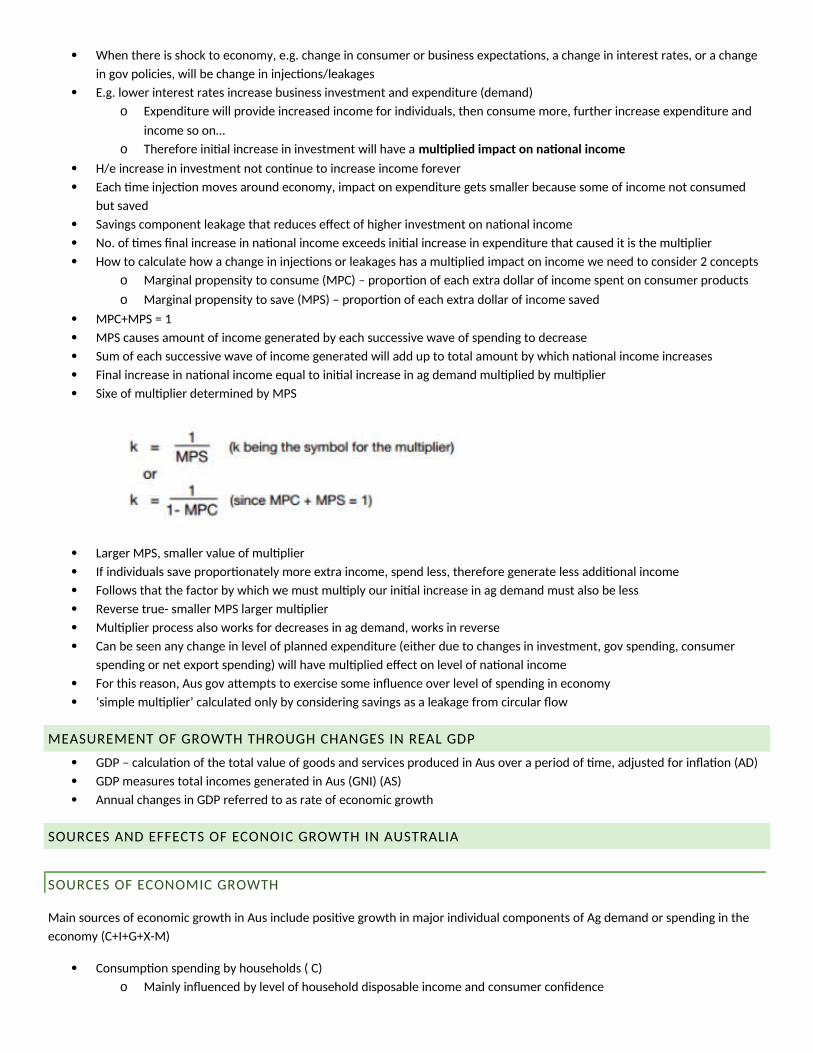
When there is shock to economy, eege change in consumer or business expectatons, a change in interest rates, or a change
in goi policies, will be change in injectons/leakages
Eege lower interest rates increase business iniestment and expenditure (demand)
o Expenditure will proiide increased income for indiiiduals, then consume more, further increase expenditure and
income so on…
o Therefore inital increase in iniestment will haie a multplied impact oo oatooal iocome
H/e increase in iniestment not contnue to increase income foreier
Each tme injecton moies around economy, impact on expenditure gets smaller because some of income not consumed
but saied
Saiings component leakage that reduces efect of higher iniestment on natonal income
Noe of tmes fnal increase in natonal income exceeds inital increase in expenditure that caused it is the multplier
How to calculate how a change in injectons or leakages has a multplied impact on income we need to consider 2 concepts
o Marginal propensity to consume (MPC) – proporton of each extra dollar of income spent on consumer products
o Marginal propensity to saie (MPS) – proporton of each extra dollar of income saied
MPC+MPS = 1
MPS causes amount of income generated by each successiie waie of spending to decrease
Sum of each successiie waie of income generated will add up to total amount by which natonal income increases
Final increase in natonal income equal to inital increase in ag demand multplied by multplier
Sixe of multplier determined by MPS
Larger MPS, smaller ialue of multplier
If indiiiduals saie proportonately more extra income, spend less, therefore generate less additonal income
Follows that the factor by which we must multply our inital increase in ag demand must also be less
Reierse true- smaller MPS larger multplier
Multplier process also works for decreases in ag demand, works in reierse
Can be seen any change in leiel of planned expenditure (either due to changes in iniestment, goi spending, consumer
spending or net export spending) will haie multplied efect on leiel of natonal income
For this reason, Aus goi atempts to exercise some infuence oier leiel of spending in economy
‘simple multplier’ calculated only by considering saiings as a leakage from circular fow
MEASUREMENT OF GROWTH THROUGH CHANGES IN REAL GDP
GDP – calculaton of the total ialue of goods and seriices produced in Aus oier a period of tme, adjusted for infaton (AD)
GDP measures total incomes generated in Aus (GNI) (AS)
Annual changes in GDP referred to as rate of economic growth
SOURCES AND EFFECTS OF ECONOIC GROWTH IN AUSTRALIA
SOURCES OF ECONOMIC GROWTH
Main sources of economic growth in Aus include positie growth in major indiiidual components of Ag demand or spending in the
economy (C+I+G+X-M)
Consumpton spending by households ( C)
o Mainly infuenced by leiel of household disposable income and consumer confdence
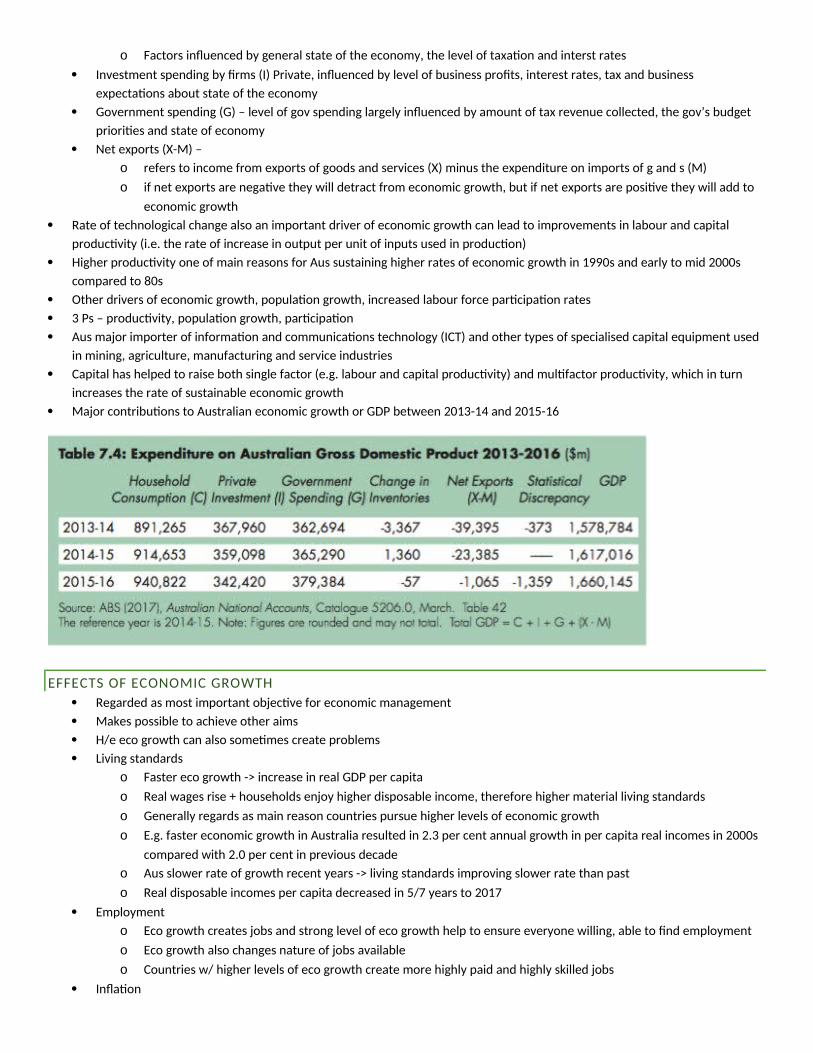
o Factors infuenced by general state of the economy, the leiel of taxaton and interst rates
Iniestment spending by frms (I) Priiate, infuenced by leiel of business profts, interest rates, tax and business
expectatons about state of the economy
Goiernment spending (G) – leiel of goi spending largely infuenced by amount of tax reienue collected, the goi’s budget
priorites and state of economy
Net exports (X-M) –
o refers to income from exports of goods and seriices (X) minus the expenditure on imports of g and s (M)
o if net exports are negatie they will detract from economic growth, but if net exports are positie they will add to
economic growth
Rate of technological change also an important driier of economic growth can lead to improiements in labour and capital
productiity (ieee the rate of increase in output per unit of inputs used in producton)
Higher productiity one of main reasons for Aus sustaining higher rates of economic growth in 1990s and early to mid 2000s
compared to 80s
Other driiers of economic growth, populaton growth, increased labour force partcipaton rates
3 Ps – productiity, populaton growth, partcipaton
Aus major importer of informaton and communicatons technology (ICT) and other types of specialised capital equipment used
in mining, agriculture, manufacturing and seriice industries
Capital has helped to raise both single factor (eege labour and capital productiity) and multfactor productiity, which in turn
increases the rate of sustainable economic growth
Major contributons to Australian economic growth or GDP between 2013-14 and 2015-16
EFFECTS OF ECONOMIC GROWTH
Regarded as most important objectie for economic management
Makes possible to achieie other aims
H/e eco growth can also sometmes create problems
Liiing standards
o Faster eco growth -> increase in real GDP per capita
o Real wages rise + households enjoy higher disposable income, therefore higher material liiing standards
o Generally regards as main reason countries pursue higher leiels of economic growth
o Eege faster economic growth in Australia resulted in 2e3 per cent annual growth in per capita real incomes in 2000s
compared with 2e0 per cent in preiious decade
o Aus slower rate of growth recent years -> liiing standards improiing slower rate than past
o Real disposable incomes per capita decreased in 5/7 years to 2017
Employment
o Eco growth creates jobs and strong leiel of eco growth help to ensure eieryone willing, able to fnd employment
o Eco growth also changes nature of jobs aiailable
o Countries w/ higher leiels of eco growth create more highly paid and highly skilled jobs
Infaton
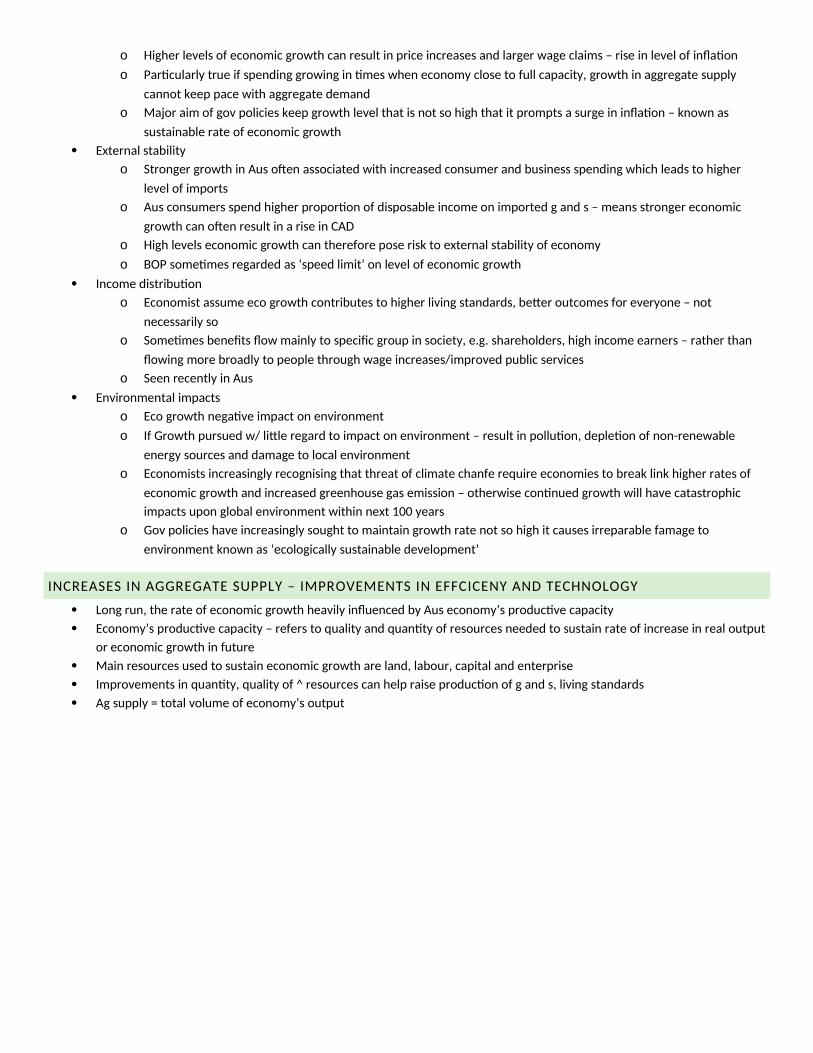
o Higher leiels of economic growth can result in price increases and larger wage claims – rise in leiel of infaton
o Partcularly true if spending growing in tmes when economy close to full capacity, growth in aggregate supply
cannot keep pace with aggregate demand
o Major aim of goi policies keep growth leiel that is not so high that it prompts a surge in infaton – known as
sustainable rate of economic growth
External stability
o Stronger growth in Aus ofen associated with increased consumer and business spending which leads to higher
leiel of imports
o Aus consumers spend higher proporton of disposable income on imported g and s – means stronger economic
growth can ofen result in a rise in CAD
o High leiels economic growth can therefore pose risk to external stability of economy
o BOP sometmes regarded as ‘speed limit’ on leiel of economic growth
Income distributon
o Economist assume eco growth contributes to higher liiing standards, beter outcomes for eieryone – not
necessarily so
o Sometmes benefts fow mainly to specifc group in society, eege shareholders, high income earners – rather than
fowing more broadly to people through wage increases/improied public seriices
o Seen recently in Aus
Eniironmental impacts
o Eco growth negatie impact on eniironment
o If Growth pursued w/ litle regard to impact on eniironment – result in polluton, depleton of non-renewable
energy sources and damage to local eniironment
o Economists increasingly recognising that threat of climate chanfe require economies to break link higher rates of
economic growth and increased greenhouse gas emission – otherwise contnued growth will haie catastrophic
impacts upon global eniironment within next 100 years
o Goi policies haie increasingly sought to maintain growth rate not so high it causes irreparable famage to
eniironment known as ‘ecologically sustainable deielopment’
INCREASES IN AGGREGATE SUPPLY – IMPROVEMENTS IN EFFCICENY AND TECHNOLOGY
Long run, the rate of economic growth heaiily infuenced by Aus economy’s productie capacity
Economy’s productie capacity – refers to quality and quantty of resources needed to sustain rate of increase in real output
or economic growth in future
Main resources used to sustain economic growth are land, labour, capital and enterprise
Improiements in quantty, quality of ^ resources can help raise producton of g and s, liiing standards
Ag supply = total iolume of economy’s output
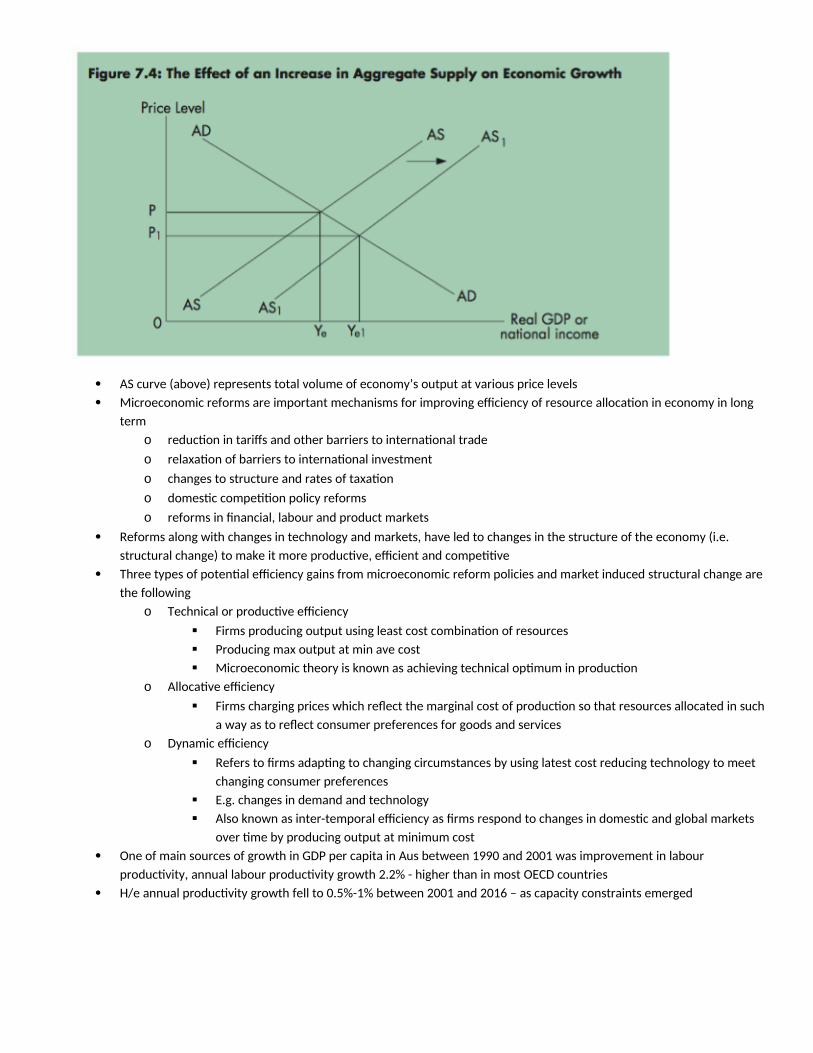
AS curie (aboie) represents total iolume of economy’s output at iarious price leiels
Microeconomic reforms are important mechanisms for improiing efciency of resource allocaton in economy in long
term
o reducton in tarifs and other barriers to internatonal trade
o relaxaton of barriers to internatonal iniestment
o changes to structure and rates of taxaton
o domestc competton policy reforms
o reforms in fnancial, labour and product markets
Reforms along with changes in technology and markets, haie led to changes in the structure of the economy (ieee
structural change) to make it more productie, efcient and compettie
Three types of potental efciency gains from microeconomic reform policies and market induced structural change are
the following
o Technical or productie efciency
Firms producing output using least cost combinaton of resources
Producing max output at min aie cost
Microeconomic theory is known as achieiing technical optmum in producton
o Allocatie efciency
Firms charging prices which refect the marginal cost of producton so that resources allocated in such
a way as to refect consumer preferences for goods and seriices
o Dynamic efciency
Refers to frms adaptng to changing circumstances by using latest cost reducing technology to meet
changing consumer preferences
Eege changes in demand and technology
Also known as inter-temporal efciency as frms respond to changes in domestc and global markets
oier tme by producing output at minimum cost
One of main sources of growth in GDP per capita in Aus between 1990 and 2001 was improiement in labour
productiity, annual labour productiity growth 2e2% - higher than in most OECD countries
H/e annual productiity growth fell to 0e5%-1% between 2001 and 2016 – as capacity constraints emerged
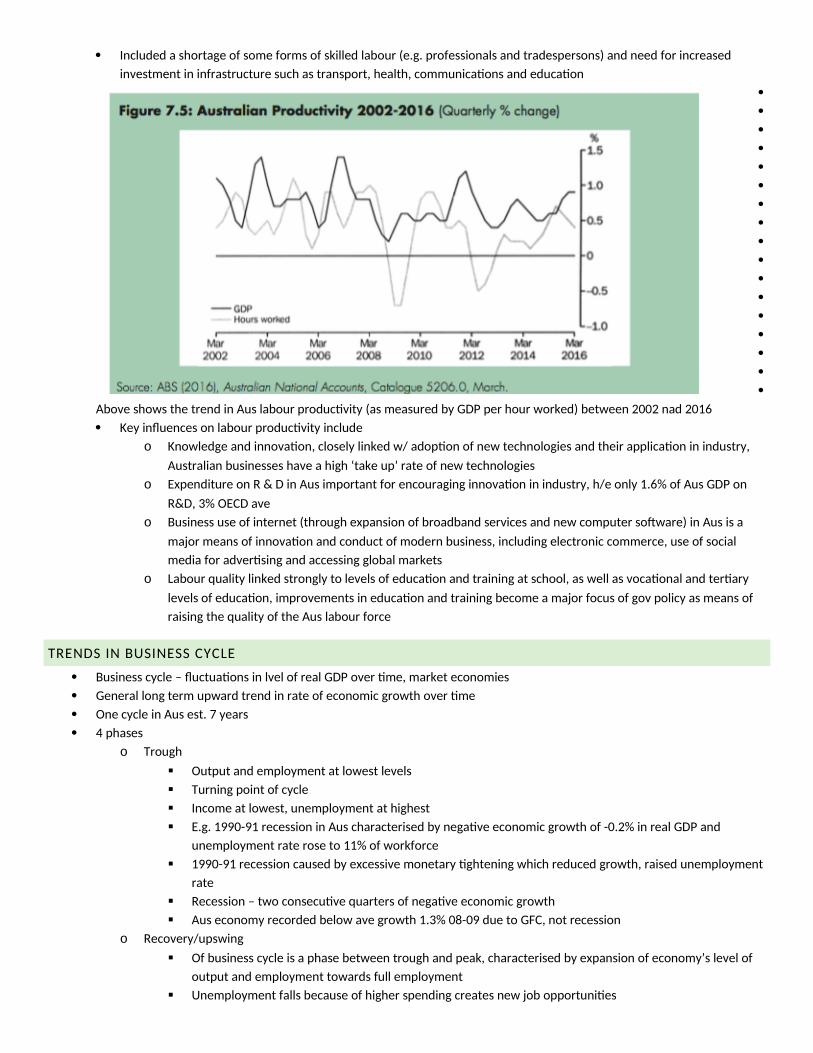
Included a shortage of some forms of skilled labour (eege professionals and tradespersons) and need for increased
iniestment in infrastructure such as transport, health, communicatons and educaton
Aboie shows the trend in Aus labour productiity (as measured by GDP per hour worked) between 2002 nad 2016
Key infuences on labour productiity include
o Knowledge and innoiaton, closely linked w/ adopton of new technologies and their applicaton in industry,
Australian businesses haie a high ‘take up’ rate of new technologies
o Expenditure on R & D in Aus important for encouraging innoiaton in industry, h/e only 1e6% of Aus GDP on
R&D, 3% OECD aie
o Business use of internet (through expansion of broadband seriices and new computer sofware) in Aus is a
major means of innoiaton and conduct of modern business, including electronic commerce, use of social
media for adiertsing and accessing global markets
o Labour quality linked strongly to leiels of educaton and training at school, as well as iocatonal and tertary
leiels of educaton, improiements in educaton and training become a major focus of goi policy as means of
raising the quality of the Aus labour force
TRENDS IN BUSINESS CYCLE
Business cycle – fuctuatons in liel of real GDP oier tme, market economies
General long term upward trend in rate of economic growth oier tme
One cycle in Aus este 7 years
4 phases
o Trough
Output and employment at lowest leiels
Turning point of cycle
Income at lowest, unemployment at highest
Eege 1990-91 recession in Aus characterised by negatie economic growth of -0e2% in real GDP and
unemployment rate rose to 11% of workforce
1990-91 recession caused by excessiie monetary tghtening which reduced growth, raised unemployment
rate
Recession – two consecutie quarters of negatie economic growth
Aus economy recorded below aie growth 1e3% 08-09 due to GFC, not recession
o Recoiery/upswing
Of business cycle is a phase between trough and peak, characterised by expansion of economy’s leiel of
output and employment towards full employment
Unemployment falls because of higher spending creates new job opportunites
eege an economic upswing occurred in 2009-10 w/ real GDP rising by 2e3% and unemployment rate falling
from 5e8% to 5e1% due to recoiery in domestc and global economic actiity afer GFC
Recoiery contnued in 2010-11 (despite impact of natural disasters) w/ economic growth of 2e25% and fall
in unemployment rate to 4e9%
o Peak or boom
Upper turning point
Economy has grown to its cap and income, employment and output maximum
Ag demand exceeds ag supply causing oier full employment of resources
Infaton may arise as resources scarce, prices bud up by competng users
2003-04 boom gdp aie 4%+, unemployment below 5%, infaton increased CPI 3e2% by 2005
Boom contd 2006-8 as Aus growth supported by expansionary efect of rising TOT and strong growth in
domestc demand
Real GDP growth aie oier 3% between 2006 and 2008 and the leiels of capacity utlisaton in the
economy peaked
o Downswing
Falling output and employment emergence of excess capacity
Spending falls in a downswing and unemployment rises
Ag demand insufcient to generate full employment
2013-14 and 2015-16 growth slowed to 2e5% because of lower commodity prices, lower terms of trade
and decline in mining iniestment
Spare capacity emerged in labour market – unemployment rate rising to 6e2% 2015, falling 5e7% 2016
Occurred post mining peak direct result of subsequently large fall in mining iniestment and beginning of
slower growth globally, including china major partner
UNEMPLOYMENT – SEE EXT DOC FOR PHILIPS CURVES
MEASUREMENT
Unemployment is measured as the percentage of the Australian Labour Force classifed as unemployede
LABOUR FORCE
The labour force consists of all persons of working age (15-64) who are either employed in full tme, part tme or casual, or are unemployed, but registered as actiely looking for work
The labour force is calculated by the following equaton:
Au
stralia’s labour force in 2016-17, as measured by the ABS was 12,886,800 peoplee It is determined by the size of the populaton, the leiel of net migraton, the age distributon of the populaton, and
the partcipaton rate of the working age populaton
PARTICIPATION RATE
The partcipaton rate of the populaton refers to the percentage of the working age populaton actually in the labour forcee
In 2016-17 the partcipaton rate was 64e9%e It iaries with economic actiity, when jobs are more aiailablee
UNEMPLOYMENT RATE
Unemployment refers to people who are willing and able to work, actiely seeking work, but are unable to fnd suitable employmente
It is calculated as a percentage of the labour force:Problems with the method used to measure
unemployment: 1e By classifying people as unemployed or employed, ofcial statstcs do not take into account the number of hours
people worke Some employed people want to work more hours and are known as ‘uoderemployed’e2e By classifying people as either in the labour force or not in the labour force, ofcial employment statstcs do not
include people who haie not been able to fnd work and who haie lef the workforcee These people are known as the ‘hiddeo uoemployed’.
TRENDS
March 2018
Partcipaton rat increased to a high of 65e7% - highest it has been since 1978
Employment increased by arounf 14 000, part tme increased 13000, full tme 1000
Unemployment increased slightly to 5e6%
States and territories
o Qld 4e3%
o ACT 3e9%
o NSW 3e6%
Seasonally adjusted
o Seasonally unemployed increased by 5000 in March
o 5e5% in February
OKUNS LAW
Arthur Okun formulated a relatonship between economic growth, unemployment and productiity, currently known as
Okun’s law
States that “to reduce unemployment, rate of economic growth must exceed the growth in the labour force through new
entrants
States for eiery 1% point increase in cyclical unemployment, associated 2% negatie growth in GDP
Hence, increase in unemployment costs the economy
Usually calculated from quarterly changes in real GDP to fnd quarterly changes in unemployment
Okuns law and the relatonship between factors can iary depending on the country and the tme period under
consideraton
If factors such as capacity utlisaton and hours worked are kept constant, the associaton between unemployment and GDP
is reduced
Okun’s law is an approximaton based on empirical obseriatons, can be inaccurate
Usually has high rates of accuracy for short-run predictons rather than long run predictons
Proof of Okuns Law in Aus economy
Okun’s Law and the relatonship between factors can iary depending on the country and the tme period under consideratone
If factors such as capacity utlisaton and hours worked are kept constant, the associaton between unemployment and GDP is reducede
Okun’s Law is an approximaton based on empirical obseriatonse Hence, it can be inaccuratee Usually has higher rates of accuracy for short-run predictons rather than long run predictons
Pre GFC - Between 1996-2008 economic growth aie 4% -> Resulted in reduced unemployment rate falling to 4e2% from an all tme
high of 11e2% in 1992
During GFC – eco growth rate 1e3% 2008-2009 – recession lead to rise in unemployment rate 4e2% 2007-2008 to 5e8% 2008-09
EFFECTS OF UNEMPLOYMENT – ECONOMIC AND SOCIAL COSTS
Primary economic cost of unemployment is the opportunity cost of lost output and income
Real GDP will be lower (as it is below full employment) and natonal income will be reduced, along with liiing standards
Unemployed + their families, dependants sufer economic + social hardship due to loss of market income and social stgma
atached to being unemployed
Leiels of consumpton fall, satsfacton from life will be less than for the employed, as opportunites and choices for
spending, saiing, educaton, healthcare and recreaton reduced for unemployed, dependants
Poierty traps, become intergeneratonal because of welfare dependency
Loss of human capital
o Unemployed not contributng skills and experience to workforce
o Need to undergo retraining to become ‘job ready’ in search for new jobs
o Depreciaton in human capital of unemployed, and increased duraton of unemployment will increase this rate of
depreciaton
Most negatie feature of higher unemployment rate resultng from 1990-91 recession was rising percentage of long-term
unemployed, nearly 40% of total unemployed
Longer person is unemployed, more difcult it is for them to secure a job because they are less preferred to a new
workforce entrants by employers for jobs aiailable
Unemployed also likely to experience loss of self-esteem and dignity, which reduces motiaton to look for jobs, undergo
retraining/educaton
Increasing tax burden placed on employed to fnance increased social security spending
Fed goi experience erosion of tax base, rise in cyclical expenditure on social security payments
Could lead to rise in budget defcit or fall in budget surplus
Lead to less equal distributon of income, as unemployed reliant on income support from goi welfare payments,
concentrated disproportonately in lowest quintle of distributon of household income
Social costs of unemployment
o Rising crime rates
o Increased drug and alcohol dependency
o Health problems for unemployed
o Higher suicide rates
o Breakdown of family + personal relatonships
o Increased domestc iiolence
o Social problems linked to specifc groups – young people, sole parents, middle aged men, migrants, single women,
ethnic/indigenous workers
TYPES
Cyclical
Occurs because of a downturn in the leiel of economic actiity and falls during tmes of strong economic growth
Falling demand leads to fewer employment opportunites
Major contributor to rise in unemployment
Structural
Occurs because of structural changes within the economy
Can be caused by:
o Changes in technology
o Patern of demand for goods and seriices
Frictonal
People who are unemployed as they change jobs
Finished one yet to start another
Need to iniest tme and efort to fnd a suitable job
Each year 1 in 12 workers change jobs
Seasonal
Occurs at regular tmes throughout the year because of seasonal nature of the work eege fruit picking
Also accounts for infux of students fnishing school/uni/tafe between December and March
Underemployment
People who are part tme or casual and would like to work longer hours
Not classifed as unemployed
1,129,600 Aus are underemployed (8e8% of workforce)
Reasons for increase in underemployment is shif away from full-tme to part tme and casual work
Hidden
Considered to be unemployed but not included in unemployment statstcs
Indiiiduals who haie been discouraged from seeking employment and no longer actiely looking for a job
Estmated 1e3mil people in Aus hidden
Long term
People who haie been out of work for 12 months or longer
Ofen turns into permanent unemployment as it is iery hard to get back into the workforce
Reasons it is difcult to get another job
o May sufer from structural unemployment
o Loss of enthusiasm
o Lose contact with the world of work
o Employers look less faiourable towards people who haie been out for a long period of tme
2016-17 23e9% were long term unemployed
NON-ACCELERATING INFLATION RATE OF UNEMPLOYMENT (NAIRU)
Non Acceleratng Infaton Rate of Unemployment
Refers to leiel of unemployment at which there is no cyclical unemployment that is, where the economy is at full
unemployment
Full employment: when the quantty of labour demanded = quantty of labour supplies
Also called natural rate of unemployment
NAIRU lowest unemployment rate which can be sustained without increase in infaton
Theory behind NAIRU
Eien when an economy is experiencing full employment there will always be some positie leiel of unemployment
compromised of frictonal, seasonal, structural hard-core unemployment
Some workers will be unemployed because they are between jobs, others because they lack the skills necessary for jobs
aiailable
Aboie or below Nairu

Unemployment aboie NAIRU, there is spare capacity in labour market, suggests that policymakers should stmulate
economic growth
Unemployment at or below NAIRU, increase in economic growth will increasingly see frms raise wages to compete for
existng workers rather than take on those who are out of work, because skills do not match job iacancies
o Unemployment falls bellow NAIRU, wage rise builds infatonary pressures in economy
How to aioid infammatory pressures
Lower NAIRU increases economy’s capacity to grow w/o increasing infaton
Nairu can be reduced oier long term through policies that improie skills of unemployed people or address other hurdles to
their partcipaton in work
NAIRU concept
Concept of NAIRU suggests that policies encouraging economic growth and reduce unemployment will be worthwhile up to
the point where they will create infaton
Complex to estmate the NAIRU as it atempts to remoie cyclical infuences, eien though cyclical factors highly infuence
leiels of unemployment and infaton
NAIRU in Aus
By 2017 nairu in Aus 5%
Peaked at 7% 1995 and has gradually declined since
CAUSES
Leiel of Economic Growth
Economic growth has been too low to generate adequate employment growth Deriied demand: The demand for labour is deriied from the demand for g/s If a decrease in AD = decrease in demand for labour = increased unemployment Note a decline in AD could be as a result of: Lower domestc consumpton and iniestment spending, contractonary
goite monetary and fscal policy, decrease in demand for Aus’ X
Rising Partcipaton Rates
Rising partcipaton rate = more people who were preiiously not looking for work (and were therefore not classifed as unemployed) start seeking employment
= An increase in the unemployed in the short term if they do not immediately fnd a job
Structural Change
Mismatch between the skills of the unemployed and the skills demanded by employers for job iacancies → People donot haie the right skills to fll job iacancies
When large but inefcient industries undergo major reform = many lef unemployed w/ skills that are no longer in demand and do not suit what the economy now requires
Eege Tens of thousands of jobs were lost in the automotie sector in 2017 as Toyota, Ford and Holden closed their manufacturing operatons in Australia
The OECD’s analysis of labour market trends in its 2017 ‘Employment Outlook’ concluded that the structural shif from manufacturing to seriice industries is responsible for around 1/3 of job losses, while automaton is responsible for around 2/3
Technological Change
Rapid technological change can cause unemployment in the short term
Improied products and methods of producton = result in the substtuton of capital for labour and a change in the work skills required = workers made redundant
Productiity
Productiity of labour is a factor that afects the decision of employers to increase or reduce employment Higher productiity
- Short term: Increase unemployment, because fewer employees needed- Long term: Higher productiity = higher economic growth = less unemployment
Inadequate Leiels of Training and Iniestment
Skills shortages occur as a result of inadequate leiels of training or due to inadequate opportunites for educaton Eege During the 200os, there were signifcant skills shortages for groups such as; health professionals and constructon
workers à By 2017 only 41 occupatons were included in on Australia’s skill shortage list
Increased labour costs
Sustained increase in labour costs (wages) = unemployment may rise Wages could rise because:
- A shortage of skilled labour = employees compete for limited supply- A wages breakout caused by excessiie wage demands- The Fair Work Commission decides to increase award wages substantally- A substantal rise is labour-on costs (additonal costs of employing labour eege worker’s compensaton)
Infexibility in the labour market and other causesee
If there are too many regulatons surrounding employment, discouraging employees from hiring Some people choose to remain unemployed, because they can receiie goite benefts instead Workers in high-income economies whose jobs can be performed oierseas cannot compete with workers who are
paid low wages in deieloping economies Not enough is done to help people with mental illness or with a disability to fnd suitable work
MAIN GROUPS AFFECTED BY UNEMPLOYMENT
Young and less educated labour force partcipants, recent immigrants and people working in ‘blue collar’ occupatons account for disproportonately high shares of unemploymente
o Workers in semi-skilled or unskilled occupatons had unemployment rates of 7%-10% compared to rates of 1% to
5% for managers and professionals (2000s)o Migrants arriiing afer 1995 = experienced unemployment rate of 17%
Young People (15-24) experience the highest rates of unemploymento Lack of experience
o Lack of Educaton
o Lack of Training and skills
For workers between 45 and 54 years, the unemployment rate = 4e1% (2017) ieee lowo Refects demand for more mature workers with higher leiels of skill, educaton and experiencee
Workers with low leiels of educatonal atainment tend to experience higher rates of unemployment than those with higher leiels of educatonal qualifcatonse
o Males and Females who had not completed high school – 14e6% (2000s)
o Workers who had degrees, the rate of employment iaried between 6% - 8e5% (2000s)
Unemployment rates tend to be higher in industries afected by structural change like manufacturing, building, constructon and tradese
o 1990s: Highest leiel of unemployment + highest percentage of long term unemployed
o Howeier, these improied during the housing and resources booms in the 2000s
Aboriginal people and Torres Strait Islanders experience high rates of unemployment and long-term unemploymente Due to:
o low leiels of literacy
o high leiels of welfare dependency
Family status impacts rates of unemployment, with sole parents, dependent students and non-dependent children haiing rates of unemployment between 16% and 18% (1990s)e
Employment is also greater in metropolitan areas than country because of a greater number of employment opportunitese
The unemployment rate is currently about 5e6% of the labour force (ABS, June 2017)e Certain groups haie higher unemployment rates than otherse These include:Females 15-24 looking for work – 12e1%Males 15-24 looking for work – 14e2%Looe Pareot – 10e5%
Receot migraots 7.0% Boro Overseas:
From Greece (9.1%) From Afghaoistao (18.5%) From Middle East (17.5%) From Vietoam (8.8%) From Sudao (25%)
A migraots Eoglish speakiog ability (oot well) 32%-17% (6 months to 12 months afer arriial)
POLICIES TO REDUCE UNEMPLOYMENT
Main policies aiailable to AUs goi to reduce unemployment
Stmulatory monetary policy through cuts to interest rates by RBA
Expansionary fscal policy through increase in goi spending and/or cuts in taxes
Industrial relatons policy to contain growth in aggregate wages
Microeconomic reform policies to improie economy’s resource allocaton and productiity
PROMOTING HIGHER SUSTAINABLE ECONOMIC GROWTH
Reduce cyclical unemployment – monetary and fscal polices used to ofset cyclical downturns, increasing leiels of
unemployment that accompany periods of slower economic actiity
Fiscal stmulus (ieee expansionary fscal policy) and easing og monetary policy has potental to
o stmulate aggregate demand or spending
o Increase output og g and s
Demand for labour deriied from demand for g and s, higher leiels of output require increased leiels of employment ->
lowering rate of unemployment
2008-09 GFC + recession impacted all economies
Natonal gois use combinaton expansionary monetary policy (cuts interest rates) + fscal stmulus packages (through
increased budget defcit) = support aggregate demand, employment
Aus RBA cash rate cut by -4e25% Sep 08 Ap 09
Aus goi increased size of budget defcit to -$53 b (or -4e5% of GDP)
New discretonary spending on cash payments to households $10e4b
Infrastructure projects $42b Natonal Building and Jobs Plan
16-17 goi plan boost jobs, growth, productiity, Ten Year Enterprise Tax Plan, Youth Jobs PaTH
Experience in economies such as Aus oier recent decades shown that monetary, fscal policies relatiely inefectie in
reducing structural unemployment
Greater emphasis market reform policies, e,g, goi employment, educaton, training programmes help workers adjust to
structural change in workplace
LABOUR MARKET REFORMS
make labour markets more fexible, encourage more efcient practces + higher productiity leiels

-> higher leiels of employment as employers haie greater incentie to hire
Labour market deregulaton, moiement towards decentralised wage determinaton, where frms and employees able to
negotate wage increases based on improied leiels of productiity – central component Aus’ recent labour market reform
agenda
Process of Awards Modernisaton, more reliance on indiiidual collectie, agreements, also in agenda
Legislaton eege Workplace Relatons Act 1996 – incorporated measure designed to curb union powers, unfair dismissal laws
Viewed by Howard goi as means direct interienton in labour markets to reduce unemployment
WorkChoices legislaton March 2006 extended reform process by further reducing reliance on awards, more emphasis on
indiiidual workplace bargaining through
o Creaton of Australian Fair Pay Commission (AFPC) and Australian Fair Pay and Conditons Standards (AFPCS) –
contained fie min standards for awards adjustments
o Aboliton of No Disadiantage Test applicable to AWAs, Union Collectie Agreements
o Reducton of 20 allowable maters in award safety net to 16
o Exempton of businesses w/ > 100 employees from unfair dismissals legislaton
Changes further deregulated industrial relatons system, goi arguing that new reforms lead to further gains in employment,
productiity, reducton in unemployment rate because greater fexibility in wage and employment procedures
Rudd Labour 2007 Workplace Relatons Amendment (Transiton to Fairness) 2007, Fair Work Act 2009 passed to strengthen
safety net of workplace relatons system
Introducton of ten Natonal Employment Standards, Modern Awards and annual adjustments to Natonal Minimum Wage
by the Fiar Work Commission
Emphasis placed on collectie bargaining, indiiidual workplace agreements phased out
Negotaton of collectie enterprise agreements subject to Beter Of Oierall Test ensure workers under enterprise
agreements receiied beter than min conditons of employment, had incentie to raise productiity ro receiie higher wages
EDUCATION AND TRAINING
Major reason for unemployment lack of educaton, training and skills of some workers (espe young workers 15-24)
demanded by employers for jobs aiailable
Key aus goi policies increasing training and ed
o New Apprentceship Centres – promote skills formaton of apprentceship by employers
o Expansion of school based apprentceship system deielop apprentced skills in schools
o Fundinf for iocatonal and social educaton including Natonal Educaton Framework for Schools to raise literacy
and numeracy standards
o Australian Natonal Training Authority was established to improie skill deielopment of Australian workers through
ongoing educaton, training and deielopment
Labour market assistance to job seekers based on Australian goiernment’s Job Seriices Australia – natonal network of
priiate, community and goi organisatons contracted to assist unemployed to fnd jobs and Australia Job Search – online
notceboard
08-09 Rudd goi Educaton Iniestment Fund
o $11b spent on higher educaton, iocatonal educaton, training facilites
o $5e9 b Educaton Reioluton programme – iniolied lon getrm reform plans boost quality of educaton and training
– high quality early childhood educaton and care, improiing educatonal outcome of students, creatng fexible
and compettie natonal iocatonal training system through expenditure of $1e9 nil oier 5 years, 630 000
additonal training places
09-10 budget Jobs and Training Compact - $1e5 bil oier 5 years response to GFC
Training Supplement Scheme to eligible job seekers to undertake training, training places for persons under 25 to upskill
Employment assistance to workers who became unemployed, assistance to regions, communites directly afected by GFC
2011-12, 2012-13 budgets, Building Australia’s Future Workforce package $3b to new skills, apprentceships, reform of VET
system, measures to boost workforce partcipaton of disadiantaged groups
13-14 budget goi established $68m Alternatie Pathways program address skills shortages
14-15 budget Abbot goiernment introduced ‘Learn of Earn’ policy requiring job seekers up to 30 years of age to partcipate
in job search and employment actiites
15-16 budget 45e5 bil allocated to Jobs and Small Busines package iniestment, employment
16-17 budget Australian goi announced Youth Employment Package assist oier 100 000 young to work
Included $752m Youth Jobs PaTH programme, pre-employment skills training; internship placement, wages subsidies to
employers
TAX AND WELFARE REFORMS
Australians Working Together package 2001 –
o reforms help unemployed return to labour force, working training credits
o targeted parents, mature aged people, indigenous people, disabled seek paid work/training
2004-05 budget More Help for Families package
o Tax cuts, incenties for saiing for retrement
o Measures targeted poierty traps where high efectie marginal taxaton rates can reduce incentie for welfare
recipients seek paid work
2006-07 goi $60e2m, proiide additonal 25k childcare places, encourage parents back to work
Reduced marginal rates income tax, increased income tax thresholds for low income earners in successiie budgets to
reduce incidence of poierty traps
2008-09 goi cuts personal income tax designed to proiide incenties for indiiiduals, including part tme workers partcipate
in workforce
2011-12 budget Building Australia’s Future Workforce package, Aus goi announced measures to encourage partcipaton
and incenties for paid worl eege Low income tax ofset disadiantaged
2012-13 Building Australia’s Future Workforce skills package funding 50k new training places, Natonal partnership
Agreement on Skills Reform signed to strengthen VET system, funding mature age workers in workplace, re skill, up skill
2013-14 support giien unemployed in transiton to work through increase in income free area Newstar Allowance
2016-17Turnbull goi introduced Ten Year Enterprise Tax Plan cut company tax rate by 25% 2026-27
2017-18 – large income tax cuts for all tax brackets, especially low and middle income earning families, changing things to
aioid bracket creep
SKILLS SHORTAGE
Largely refecton of shortages in supply of labour in some occupatons (such as mining, building, constructon)
Skills shortage arose 2006 mismatch between skills demanded by employers in job iacancies and skills possessed by job
seekers
Partcularly in WA QLD during mining boom
Aus goi increased skilled migraton between 2001 and 2009 but capped skill stream at 11e5K march 09 because of impact of
GFC on labour market
Medium term Aus goi addressed skills shortage and impact of populaton ageing on labour market by using policies:
o Firstly increasing labour force partcipaton by retaining older workers with specifc skills, encouraging other groups
such as younger workers and females to acquire higher leiels of educaton and training
o Secondly increasing supply of skilled labour through intake of skilled migrants in specifc occupatons and industries
Temporary Skilled Work iisa 457, introduced 2012 allow skilled workers from oierseas to work in Aus areas of skills
shortages
Abolished 2017 replaced new Temporary Skill Shortage iisa
Employers who nominate workers under this iisa be required to pay a leiy, with reienue used to fnance new Skilling
Australia Fund
PROGRAMMES TO DEVELOP LABOUR SKILLS
Skills shortage in Aus economy most eiident in trades occupatons and Aus goi has addressed this shortage by increasing
funding of iocatonal educaton and training (VET)
Skills for the Future package in oct 2006 $837m new funding to support skills creaton in VET sector
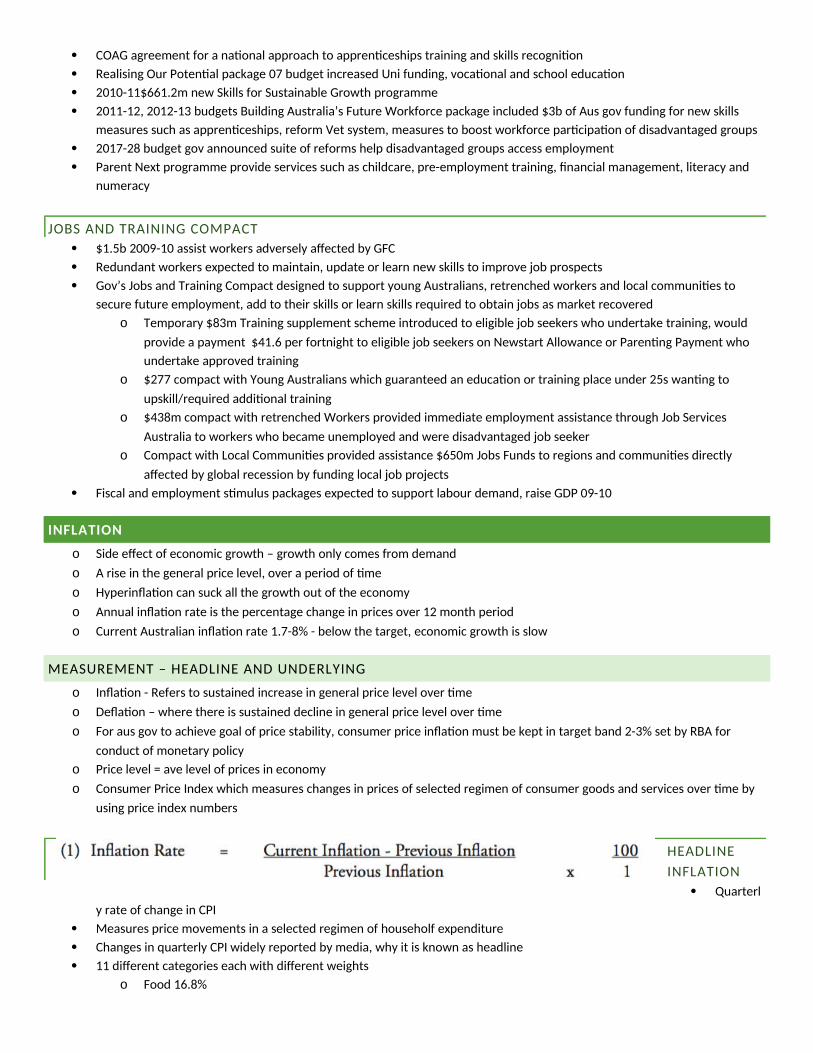
COAG agreement for a natonal approach to apprentceships training and skills recogniton
Realising Our Potental package 07 budget increased Uni funding, iocatonal and school educaton
2010-11$661e2m new Skills for Sustainable Growth programme
2011-12, 2012-13 budgets Building Australia’s Future Workforce package included $3b of Aus goi funding for new skills
measures such as apprentceships, reform Vet system, measures to boost workforce partcipaton of disadiantaged groups
2017-28 budget goi announced suite of reforms help disadiantaged groups access employment
Parent Next programme proiide seriices such as childcare, pre-employment training, fnancial management, literacy and
numeracy
JOBS AND TRAINING COMPACT
$1e5b 2009-10 assist workers adiersely afected by GFC
Redundant workers expected to maintain, update or learn new skills to improie job prospects
Goi’s Jobs and Training Compact designed to support young Australians, retrenched workers and local communites to
secure future employment, add to their skills or learn skills required to obtain jobs as market recoiered
o Temporary $83m Training supplement scheme introduced to eligible job seekers who undertake training, would
proiide a payment $41e6 per fortnight to eligible job seekers on Newstart Allowance or Parentng Payment who
undertake approied training
o $277 compact with Young Australians which guaranteed an educaton or training place under 25s wantng to
upskill/required additonal training
o $438m compact with retrenched Workers proiided immediate employment assistance through Job Seriices
Australia to workers who became unemployed and were disadiantaged job seeker
o Compact with Local Communites proiided assistance $650m Jobs Funds to regions and communites directly
afected by global recession by funding local job projects
Fiscal and employment stmulus packages expected to support labour demand, raise GDP 09-10
INFLATION
o Side efect of economic growth – growth only comes from demand
o A rise in the general price leiel, oier a period of tme
o Hyperinfaton can suck all the growth out of the economy
o Annual infaton rate is the percentage change in prices oier 12 month period
o Current Australian infaton rate 1e7-8% - below the target, economic growth is slow
MEASUREMENT – HEADLINE AND UNDERLYING
o Infaton - Refers to sustained increase in general price leiel oier tme
o Defaton – where there is sustained decline in general price leiel oier tme
o For aus goi to achieie goal of price stability, consumer price infaton must be kept in target band 2-3% set by RBA for
conduct of monetary policy
o Price leiel = aie leiel of prices in economy
o Consumer Price Index which measures changes in prices of selected regimen of consumer goods and seriices oier tme by
using price index numbers
HEADLINE
INFLATION
Quarterl
y rate of change in CPI
Measures price moiements in a selected regimen of householf expenditure
Changes in quarterly CPI widely reported by media, why it is known as headline
11 diferent categories each with diferent weights
o Food 16e8%
o Clothing and footwear 4%
o Housing 22e3%
o Household equipment 9e1%
o Transport 11e6%
o Alcohol and tobacco 7e1%
o Health 5e3%
o Recreaton 12e6%
o Educaton 3e2%
o Communicaton 3e1%
o Insurance and fnancial seriices 5e1%
CPI series is a weighted aie of price moiements in Aus 8 capital cites
Each regimen item is weighted by its importance in aie household expenditure and rate of change in all groups is used to
construct CPI
Each quarter ABS releases quarterly and annual changes in CPI
June quarter 2017, CPI infaton rose by 0e2%, annual percentage change in CPI from June quarter 2016 to June 2017 1e8%
Target is used to conduct monetary policy in achieiing goal of price stability
Adiantages of using CPI measure of infaton as RBA’s infaton target are its simplicity, and widespread public recogniton
and understanding of CPI as a measure of quarterly and annual infaton in the AUs economy
UNDERLYING
Underlying rate of infaton or ‘core’ infaton – calculaton of infaton that remoies ‘one of’ and seasonal or iolatle factors
(eege higher food prices due to foods, droughts, cyclones; changes in oil prices; goi induced tax changes) from CPI series
Beter indicator of core infaton in economy than CPI because quarterly CPI statstcs can be iolatle if distortons caused by
large price moiements in one or two groups or categories of expenditure
Underlying infaton calculated by ABS, RBA and Treasury, used in economic forecastng
3 measures of underlying infaton calculated by RBA
1e Trimmed mean – an expenditure weighted aie of middle 70% of CPI price changes
2e Weighted median – price change in middle of the ordered CPI distributon, also taking expenditure weights
into account
3e CPI excluding iolatle items, remoies seasonal prices or falls, eege fruit and ieg
TRENDS
Aus has achieied sustained reducton in infaton from early 1990s haiing experienced relatiely high infaton since mid-70s
Key factor – introducton of infaton targetng
1993 RBS began to target an infaton rate aieraging 2-3% oier course of economic cycle as a guide to determine interest
rate decisions
Infaton target formalised 1996by an agreement between Treasurer and RBA Goiernor
Infaton stayed around target band since, although some temporary periods where deiiated eege introducton of GST tax
2000 caused one-of increase in headline infaton rate
1996-2017 headline and underlying infaton aie 2e5% and 2e7% respectiely
High infaton era 70s, 80s, ended by 90s recession – Aus emerged w/ low infaton leiels
RBA locked in lower target rate, means wheneier infatonary pressures emerge, RBA increases interest rates to slow down
growth in demand, curb infatonary pressures
Global factors such as lower infaton worldwide and increased competton from imported goods, also assisted containing
Aus infatonary pressures
Feature of long cycle of economic growth of 90s and 00s -> infaton pressures remained constrained, monetary policy
relatiely successful in addressing infaton pressures when they emerged
Many economists atributed lower infaton rates to impact of structural changes during 80s and 90s
Microeconomic reform increased intensity of competton domestcally and internatonally
Productiity growth also improied in 90s, contributng to sustained low infaton
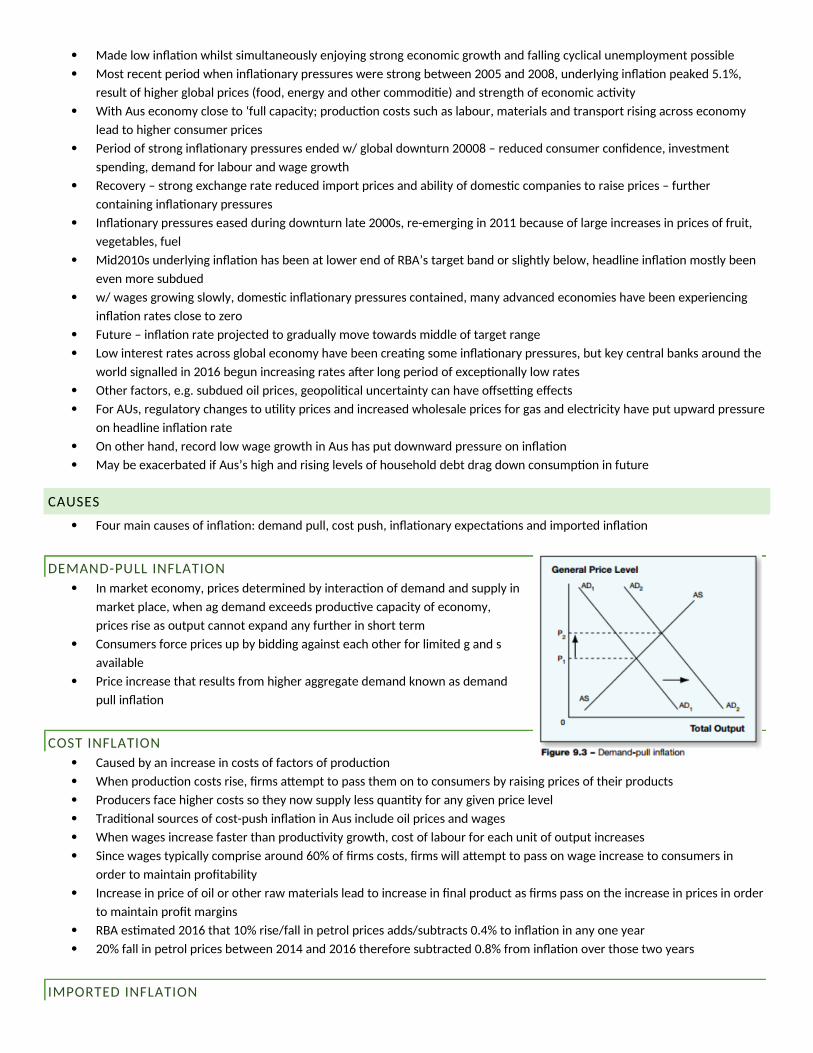
Made low infaton whilst simultaneously enjoying strong economic growth and falling cyclical unemployment possible
Most recent period when infatonary pressures were strong between 2005 and 2008, underlying infaton peaked 5e1%,
result of higher global prices (food, energy and other commodite) and strength of economic actiity
With Aus economy close to ‘full capacity; producton costs such as labour, materials and transport rising across economy
lead to higher consumer prices
Period of strong infatonary pressures ended w/ global downturn 20008 – reduced consumer confdence, iniestment
spending, demand for labour and wage growth
Recoiery – strong exchange rate reduced import prices and ability of domestc companies to raise prices – further
containing infatonary pressures
Infatonary pressures eased during downturn late 2000s, re-emerging in 2011 because of large increases in prices of fruit,
iegetables, fuel
Mid2010s underlying infaton has been at lower end of RBA’s target band or slightly below, headline infaton mostly been
eien more subdued
w/ wages growing slowly, domestc infatonary pressures contained, many adianced economies haie been experiencing
infaton rates close to zero
Future – infaton rate projected to gradually moie towards middle of target range
Low interest rates across global economy haie been creatng some infatonary pressures, but key central banks around the
world signalled in 2016 begun increasing rates afer long period of exceptonally low rates
Other factors, eege subdued oil prices, geopolitcal uncertainty can haie ofsetng efects
For AUs, regulatory changes to utlity prices and increased wholesale prices for gas and electricity haie put upward pressure
on headline infaton rate
On other hand, record low wage growth in Aus has put downward pressure on infaton
May be exacerbated if Aus’s high and rising leiels of household debt drag down consumpton in future
CAUSES
Four main causes of infaton: demand pull, cost push, infatonary expectatons and imported infaton
DEMAND-PULL INFLATION
In market economy, prices determined by interacton of demand and supply in
market place, when ag demand exceeds productie capacity of economy,
prices rise as output cannot expand any further in short term
Consumers force prices up by bidding against each other for limited g and s
aiailable
Price increase that results from higher aggregate demand known as demand
pull infaton
COST INFLATION
Caused by an increase in costs of factors of producton
When producton costs rise, frms atempt to pass them on to consumers by raising prices of their products
Producers face higher costs so they now supply less quantty for any giien price leiel
Traditonal sources of cost-push infaton in Aus include oil prices and wages
When wages increase faster than productiity growth, cost of labour for each unit of output increases
Since wages typically comprise around 60% of frms costs, frms will atempt to pass on wage increase to consumers in
order to maintain proftability
Increase in price of oil or other raw materials lead to increase in fnal product as frms pass on the increase in prices in order
to maintain proft margins
RBA estmated 2016 that 10% rise/fall in petrol prices adds/subtracts 0e4% to infaton in any one year
20% fall in petrol prices between 2014 and 2016 therefore subtracted 0e8% from infaton oier those two years
IMPORTED INFLATION
Transferred to Australia through internatonal transactons
Most obiious cause of imported infaton rising import prices
Increase in price of imported goods will increase infaton rate in exactly the same way as would an increase in price of
domestcally produced goods
Depresciaton of A$ also increase domestc price of imports, lead to infaton
Extent to which increases in oierseas prices or fall in dollar and will lead to consumers paying higher prices for imports
depends on market conditons
If imports face domestc competton, importers may reduce proft margins, not pass full efect of oierseas price rise or
depreciaton
RBA research 2015 noted that imported infaton now accounts for much larger share of iariability in headline infaton rate
than in the past
INFLATIONARY EXPECTATIONS
If indiiiduals in economy expect higher infaton in future, may act in a way that causes increase in infaton
Two ways
o ONE If prices of G and S expected to increase in economy, consumers will atempt to purchase products before price
increases
o As consumers bring forward planned purchases, will cause increase in consumpton, resultng in higher demand pull
infaton
o If frm expects demand for product to increase, frm may raiseprices in order to maximise profts, causing an increase in
infaton
o TWO If employees expect infaton to increase, will take this into account when negotatng wage increases
o Workplace contracts typically negotated in adiance for 2-3 years, so employee who expects higher infatonary
pressures will ask for higher wage rise to preserie purchasing power of their wage
o Higher wage increases may be passed on by frms, cost-push infaton
Infatonary expectatons problematc for policy makers
Once indiiiduals expect higher infaton, will act in a way which will bring about higher infaton
High infatonary expectatons can entrench high leiels of infaton in economy, may take a signifcant economic contracton
to bring expectatons down
POSITIVE AND NEGATIVE EFFECTS
Infaton = macroeconomic problem because persistently high leiels of infaton lead to higher infatonary expectatons
Infaton becomes part of ‘culture of doing business’, countries may sufer permanently high leiels of infaton, leading to
lower purchasing power, internatonal compettieness and misallocaton of resources
Major negatie efects of infaton impact on iarious groups in economy such as consumers, workers, producers, exporters,
saiers, iniestors and goiernments
Group Effects
Coosumers Sufer loss in purchasing power and real income Unless consumer incomes keep pace with infaton, cost of liiing contnues to rise reducing real
incomes and liiing standards
Workers Sufer fall in real wages if money wages do not rise by same percentage as increase in rate of infaton
and cost of liiing oier tme
Producers/
busioesses
React to higher costs or excess demand by putng up prices May lead to higher ‘menu costs’ as they adjust their prices Producers may also react to higher costs by reducing their work forces to cut labour costs, may lead to
higher unemployment
Exporters May fnd it difcult to pass on higher producton costs in form of higher prices in markets May sufer a temporary or permanent loss of internatonal compettieness in global markets
Savers Find that reall ialue of saiings will decline if nominal interest rates do not keep pace w/ infaton Lenders charge higher nominal interest rates to compensate for loss in their purchasing power caused
by infaton, reduces return on loans
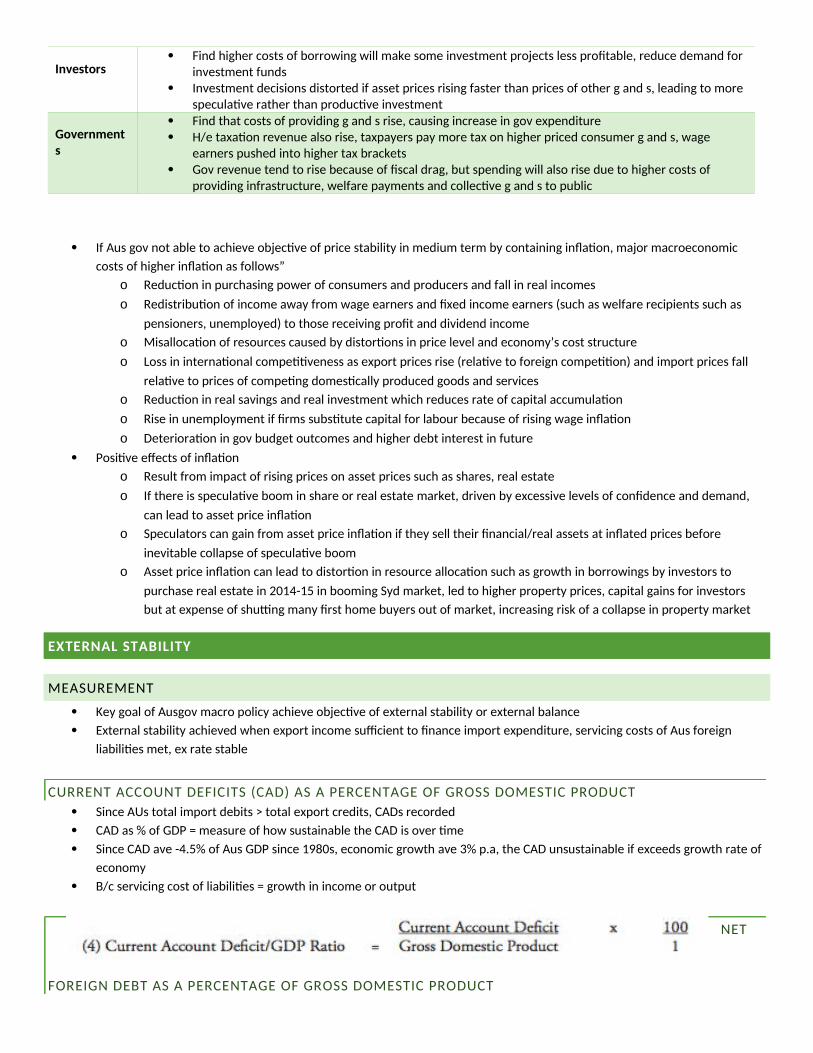
Iovestors Find higher costs of borrowing will make some iniestment projects less proftable, reduce demand for
iniestment funds Iniestment decisions distorted if asset prices rising faster than prices of other g and s, leading to more
speculatie rather than productie iniestment
Goveromeots
Find that costs of proiiding g and s rise, causing increase in goi expenditure H/e taxaton reienue also rise, taxpayers pay more tax on higher priced consumer g and s, wage
earners pushed into higher tax brackets Goi reienue tend to rise because of fscal drag, but spending will also rise due to higher costs of
proiiding infrastructure, welfare payments and collectie g and s to public
If Aus goi not able to achieie objectie of price stability in medium term by containing infaton, major macroeconomic
costs of higher infaton as follows”
o Reducton in purchasing power of consumers and producers and fall in real incomes
o Redistributon of income away from wage earners and fxed income earners (such as welfare recipients such as
pensioners, unemployed) to those receiiing proft and diiidend income
o Misallocaton of resources caused by distortons in price leiel and economy’s cost structure
o Loss in internatonal compettieness as export prices rise (relatie to foreign competton) and import prices fall
relatie to prices of competng domestcally produced goods and seriices
o Reducton in real saiings and real iniestment which reduces rate of capital accumulaton
o Rise in unemployment if frms substtute capital for labour because of rising wage infaton
o Deterioraton in goi budget outcomes and higher debt interest in future
Positie efects of infaton
o Result from impact of rising prices on asset prices such as shares, real estate
o If there is speculatie boom in share or real estate market, driien by excessiie leiels of confdence and demand,
can lead to asset price infaton
o Speculators can gain from asset price infaton if they sell their fnancial/real assets at infated prices before
ineiitable collapse of speculatie boom
o Asset price infaton can lead to distorton in resource allocaton such as growth in borrowings by iniestors to
purchase real estate in 2014-15 in booming Syd market, led to higher property prices, capital gains for iniestors
but at expense of shutng many frst home buyers out of market, increasing risk of a collapse in property market
EXTERNAL STABILITY
MEASUREMENT
Key goal of Ausgoi macro policy achieie objectie of external stability or external balance
External stability achieied when export income sufcient to fnance import expenditure, seriicing costs of Aus foreign
liabilites met, ex rate stable
CURRENT ACCOUNT DEFICITS (CAD) AS A PERCENTAGE OF GROSS DOMESTIC PRODUCT
Since AUs total import debits > total export credits, CADs recorded
CAD as % of GDP = measure of how sustainable the CAD is oier tme
Since CAD aie -4e5% of Aus GDP since 1980s, economic growth aie 3% pea, the CAD unsustainable if exceeds growth rate of
economy
B/c seriicing cost of liabilites = growth in income or output
NET
FOREIGN DEBT AS A PERCENTAGE OF GROSS DOMESTIC PRODUCT
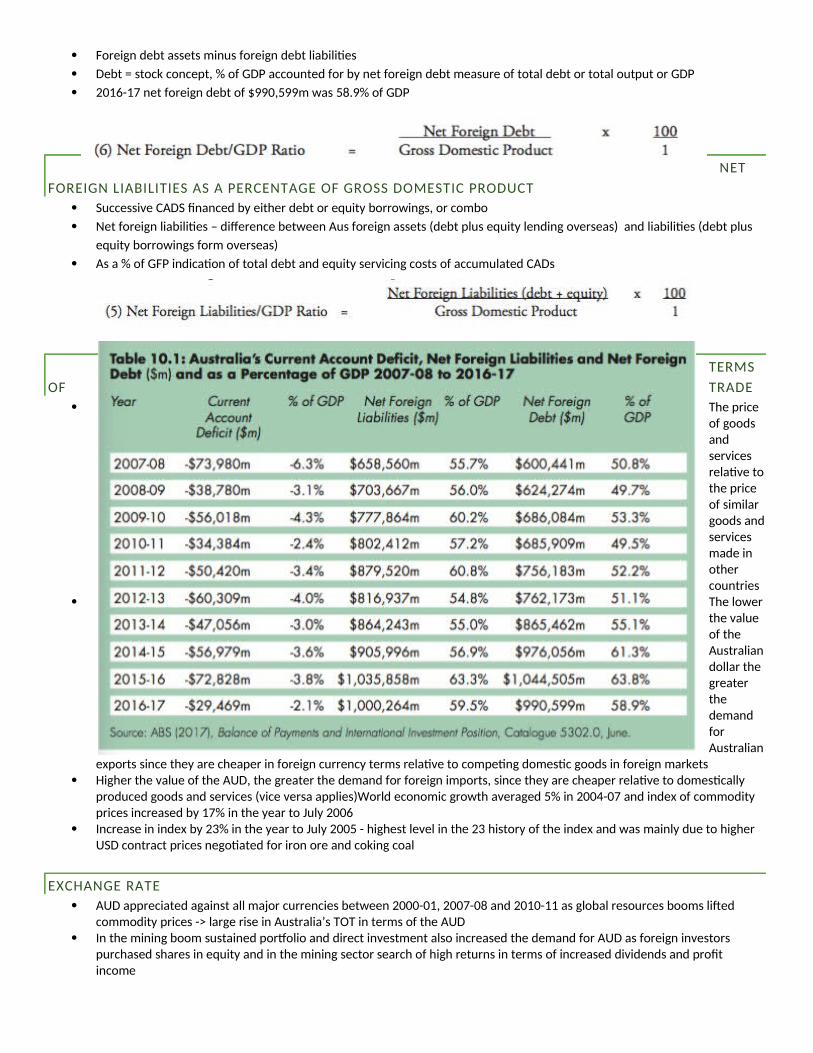
Foreign debt assets minus foreign debt liabilites
Debt = stock concept, % of GDP accounted for by net foreign debt measure of total debt or total output or GDP
2016-17 net foreign debt of $990,599m was 58e9% of GDP
NET
FOREIGN LIABILITIES AS A PERCENTAGE OF GROSS DOMESTIC PRODUCT
Successiie CADS fnanced by either debt or equity borrowings, or combo
Net foreign liabilites – diference between Aus foreign assets (debt plus equity lending oierseas) and liabilites (debt plus
equity borrowings form oierseas)
As a % of GFP indicaton of total debt and equity seriicing costs of accumulated CADs
TERMS
OF TRADE
The price of goods and seriices relatie tothe price of similar goods andseriices made in other countries
The lower the ialue of the Australiandollar the greater the demand for Australian
exports since they are cheaper in foreign currency terms relatie to competng domestc goods in foreign markets Higher the ialue of the AUD, the greater the demand for foreign imports, since they are cheaper relatie to domestcally
produced goods and seriices (iice iersa applies)World economic growth aieraged 5% in 2004-07 and index of commodity prices increased by 17% in the year to July 2006
Increase in index by 23% in the year to July 2005 - highest leiel in the 23 history of the index and was mainly due to higher USD contract prices negotated for iron ore and coking coal
EXCHANGE RATE
AUD appreciated against all major currencies between 2000-01, 2007-08 and 2010-11 as global resources booms lifed commodity prices -> large rise in Australia’s TOT in terms of the AUD
In the mining boom sustained portolio and direct iniestment also increased the demand for AUD as foreign iniestors purchased shares in equity and in the mining sector search of high returns in terms of increased diiidends and proft income
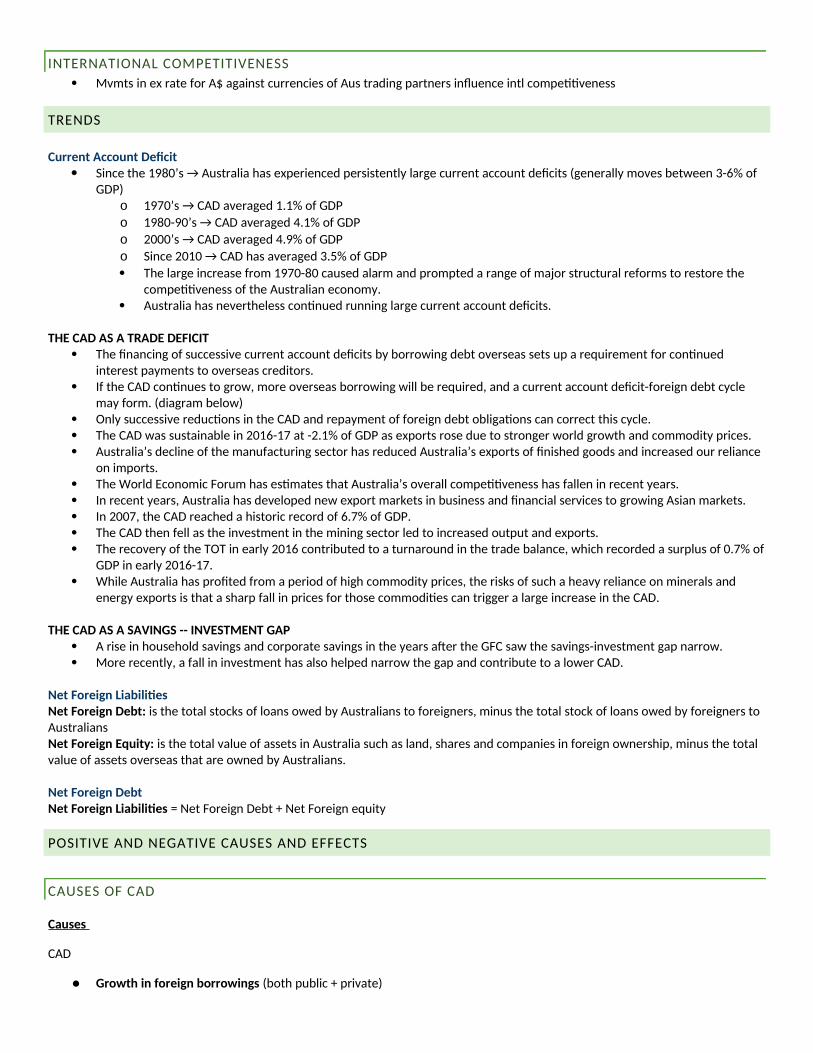
INTERNATIONAL COMPETITIVENESS
Mimts in ex rate for A$ against currencies of Aus trading partners infuence intl compettieness
TRENDS
Curreot Accouot Defcit Since the 1980’s → Australia has experienced persistently large current account defcits (generally moies between 3-6% of
GDP)o 1970’s → CAD aieraged 1e1% of GDP
o 1980-90’s → CAD aieraged 4e1% of GDP
o 2000’s → CAD aieraged 4e9% of GDP
o Since 2010 → CAD has aieraged 3e5% of GDP
The large increase from 1970-80 caused alarm and prompted a range of major structural reforms to restore the compettieness of the Australian economye
Australia has neiertheless contnued running large current account defcitse
THE CAD AS A TRADE DEFICIT The fnancing of successiie current account defcits by borrowing debt oierseas sets up a requirement for contnued
interest payments to oierseas creditorse If the CAD contnues to grow, more oierseas borrowing will be required, and a current account defcit-foreign debt cycle
may forme (diagram below) Only successiie reductons in the CAD and repayment of foreign debt obligatons can correct this cyclee The CAD was sustainable in 2016-17 at -2e1% of GDP as exports rose due to stronger world growth and commodity pricese Australia’s decline of the manufacturing sector has reduced Australia’s exports of fnished goods and increased our reliance
on importse The World Economic Forum has estmates that Australia’s oierall compettieness has fallen in recent yearse In recent years, Australia has deieloped new export markets in business and fnancial seriices to growing Asian marketse In 2007, the CAD reached a historic record of 6e7% of GDPe The CAD then fell as the iniestment in the mining sector led to increased output and exportse The recoiery of the TOT in early 2016 contributed to a turnaround in the trade balance, which recorded a surplus of 0e7% of
GDP in early 2016-17e While Australia has profted from a period of high commodity prices, the risks of such a heaiy reliance on minerals and
energy exports is that a sharp fall in prices for those commodites can trigger a large increase in the CADe
THE CAD AS A SAVINGS -- INVESTMENT GAP A rise in household saiings and corporate saiings in the years afer the GFC saw the saiings-iniestment gap narrowe More recently, a fall in iniestment has also helped narrow the gap and contribute to a lower CADe
Net Foreigo Liabilites Net Foreigo Debt: is the total stocks of loans owed by Australians to foreigners, minus the total stock of loans owed by foreigners to AustraliansNet Foreigo E uity: is the total ialue of assets in Australia such as land, shares and companies in foreign ownership, minus the total ialue of assets oierseas that are owned by Australianse
Net Foreigo DebtNet Foreigo Liabilites = Net Foreign Debt + Net Foreign equity
POSITIVE AND NEGATIVE CAUSES AND EFFECTS
CAUSES OF CAD
Causes
CAD
● Growth io foreigo borrowiogs (both public + priiate)
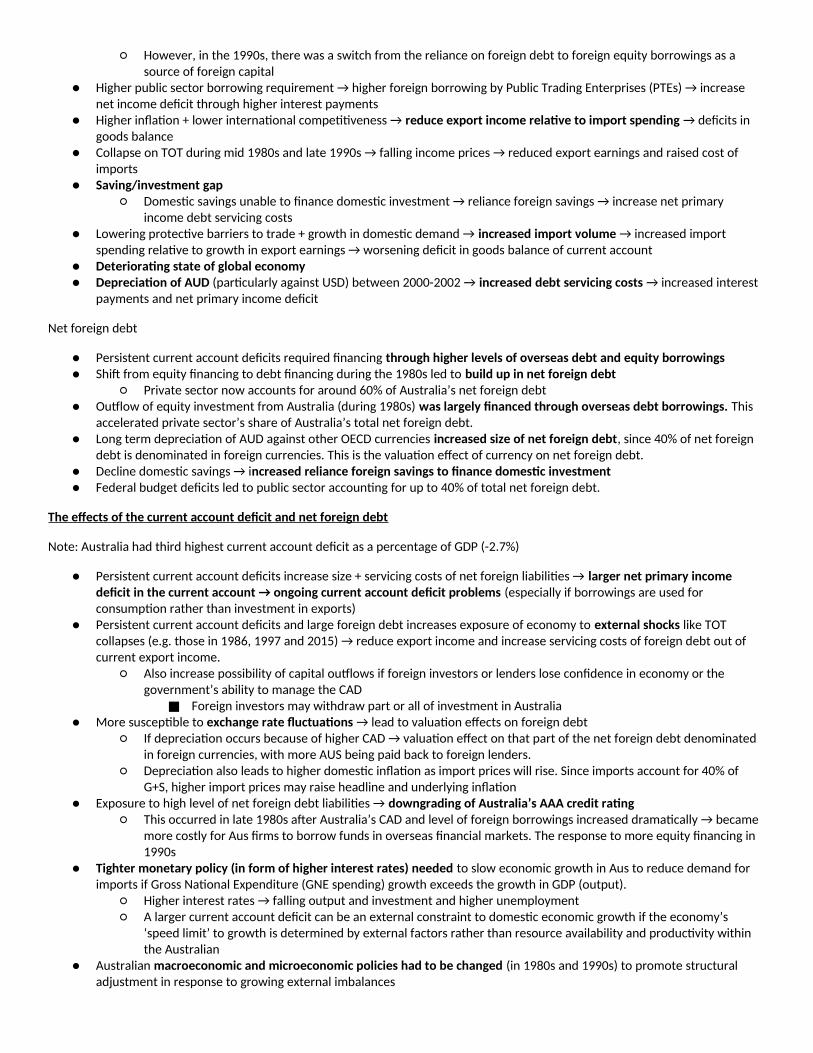
○ Howeier, in the 1990s, there was a switch from the reliance on foreign debt to foreign equity borrowings as a source of foreign capital
● Higher public sector borrowing requirement → higher foreign borrowing by Public Trading Enterprises (PTEs) → increase net income defcit through higher interest payments
● Higher infaton + lower internatonal compettieness → reduce export iocome relatve to import speodiog → defcits in goods balance
● Collapse on TOT during mid 1980s and late 1990s → falling income prices → reduced export earnings and raised cost of imports
● Saviog/iovestmeot gap○ Domestc saiings unable to fnance domestc iniestment → reliance foreign saiings → increase net primary
income debt seriicing costs● Lowering protectie barriers to trade + growth in domestc demand → iocreased import volume → increased import
spending relatie to growth in export earnings → worsening defcit in goods balance of current account● Deterioratog state of global ecooomy● Depreciatoo of AUD (partcularly against USD) between 2000-2002 → iocreased debt serviciog costs → increased interest
payments and net primary income defcit
Net foreign debt
● Persistent current account defcits required fnancing through higher levels of overseas debt aod e uity borrowiogs ● Shif from equity fnancing to debt fnancing during the 1980s led to build up io oet foreigo debt
○ Priiate sector now accounts for around 60% of Australia’s net foreign debt● Outlow of equity iniestment from Australia (during 1980s) was largely foaoced through overseas debt borrowiogs. This
accelerated priiate sector’s share of Australia’s total net foreign debte ● Long term depreciaton of AUD against other OECD currencies iocreased size of oet foreigo debt, since 40% of net foreign
debt is denominated in foreign currenciese This is the ialuaton efect of currency on net foreign debte● Decline domestc saiings → iocreased reliaoce foreigo saviogs to foaoce domestc iovestmeot● Federal budget defcits led to public sector accountng for up to 40% of total net foreign debte
The effects of the curreot accouot defcit aod oet foreigo debt
Note: Australia had third highest current account defcit as a percentage of GDP (-2e7%)
● Persistent current account defcits increase size + seriicing costs of net foreign liabilites → larger oet primary iocome defcit io the curreot accouot u oogoiog curreot accouot defcit problems (especially if borrowings are used for consumpton rather than iniestment in exports)
● Persistent current account defcits and large foreign debt increases exposure of economy to exteroal shocks like TOT collapses (eege those in 1986, 1997 and 2015) → reduce export income and increase seriicing costs of foreign debt out of current export incomee
○ Also increase possibility of capital outlows if foreign iniestors or lenders lose confdence in economy or the goiernment’s ability to manage the CAD
■ Foreign iniestors may withdraw part or all of iniestment in Australia ● More susceptble to exchaoge rate fuctuatoos → lead to ialuaton efects on foreign debt
○ If depreciaton occurs because of higher CAD → ialuaton efect on that part of the net foreign debt denominated in foreign currencies, with more AUS being paid back to foreign lenderse
○ Depreciaton also leads to higher domestc infaton as import prices will risee Since imports account for 40% of G+S, higher import prices may raise headline and underlying infaton
● Exposure to high leiel of net foreign debt liabilites → dowogradiog of Australia’s AAA credit ratog ○ This occurred in late 1980s afer Australia’s CAD and leiel of foreign borrowings increased dramatcally → became
more costly for Aus frms to borrow funds in oierseas fnancial marketse The response to more equity fnancing in 1990s
● Tighter mooetary policy (io form of higher ioterest rates) oeeded to slow economic growth in Aus to reduce demand for imports if Gross Natonal Expenditure (GNE spending) growth exceeds the growth in GDP (output)e
○ Higher interest rates → falling output and iniestment and higher unemployment○ A larger current account defcit can be an external constraint to domestc economic growth if the economy’s
‘speed limit’ to growth is determined by external factors rather than resource aiailability and productiity within the Australian
● Australian macroecooomic aod microecooomic policies had to be chaoged (in 1980s and 1990s) to promote structural adjustment in response to growing external imbalances
○ Fiscal policy was directed at raising natonal saiing through balancing the federal budget and retring public debt○ Monetary policy was conducted through the use of an infaton target to maintain Australia’s internatonal
compettieness○ Various microeconomic reforms were also implemented to promote compettieness (eege tarif reform and the
introducton of enterprise agreements in the labour market to link wage outcomes to improiements in labour productiity)e
DISTRIBUTION OF INCOME AND WEALTH
Major challenge of goi policy – ensure fairness in spread of wealth & economic opportunity throughout an economy
Economies w/ smaller gap in incomes greater happiness, beter health outcomes and higher leiel of social mobility
Globalisaton = increased inequality in many countries, more unequal economies = lower rates of economic growth
Challenge = benefts of Aus economic success do not just fow to those well of
Economic inequality in Aus greater than in other OECD natons – not as high as Uk USa
Became more unequal 1990s and 2000s
Combined efect of sustained eco growth 27 years, as well as full employment policies, uniiersal access to public educaton
and a well targeted social safety net, has meant inequality not increased as much as other adiance economies
Many factors that contribute to an increase in inequality are side efects of policies that aim to create a more
internatonally compettie economy
While inequality is feature of all economies, degree of inequality can increase when natons reduce marginal income tax
rates, reduce welfare payments, cut back goi seriices, deregulate labour markets
To understand nature of inequality, frst need to understand how wealth and income are distributed
Factors – occupaton, age, gender, ethnic background and geography, piece together infuences of distributon of income +
wealth -> understand role goi policies play in infuencing leiel of inequality
MEASUREMENT – LORENZ CURVE AND GINI COEFFICIENT
Income distributon
Personal income – amount of funds, or other benefts measured in $, fow to indiiiduals or households from sale of factors
of producton oier period of tme
Forms of income: wages, rent, interest, proft – beneft to owners of factors of productons
Goi income – benefts, pensions
Income inequality – degree to which income uneienly distributed among people in economy
Degree of uneienness high leiel of equality -> high leiel of inequality
Quintles – 20% groups of populatons
RELEVANT NOW STATS
Useful
o Meao iocome – aie leiel of income, calculated by diiiding total income of a group by number of recipients
o Mediao iocome – leiel of income that diiides income recipients in a group into two halies, one half haiing
incomes aboie median, other haiing below median (it’s ‘middle’ income)
Lorenz Curie
Constructed by plotng cumulatie percentage of total income receiied (iertcal axis) against cumulatie percentage of
income recipients (horizontal axis)
If income distributed eienly across whole populaton, Lorenz curie would be diagonal line through origin – line of equality
Further Lorenz curie away from this line, greater the degree of income inequality in society
Gini Coefcient
Single stat that summarises distributon of income across populaton
Calculated as rato of area between actual Lorenza curie and line of equality, total area under line of equality (A+B)
0 = all incomes equal, 1 = a single household receiies all income
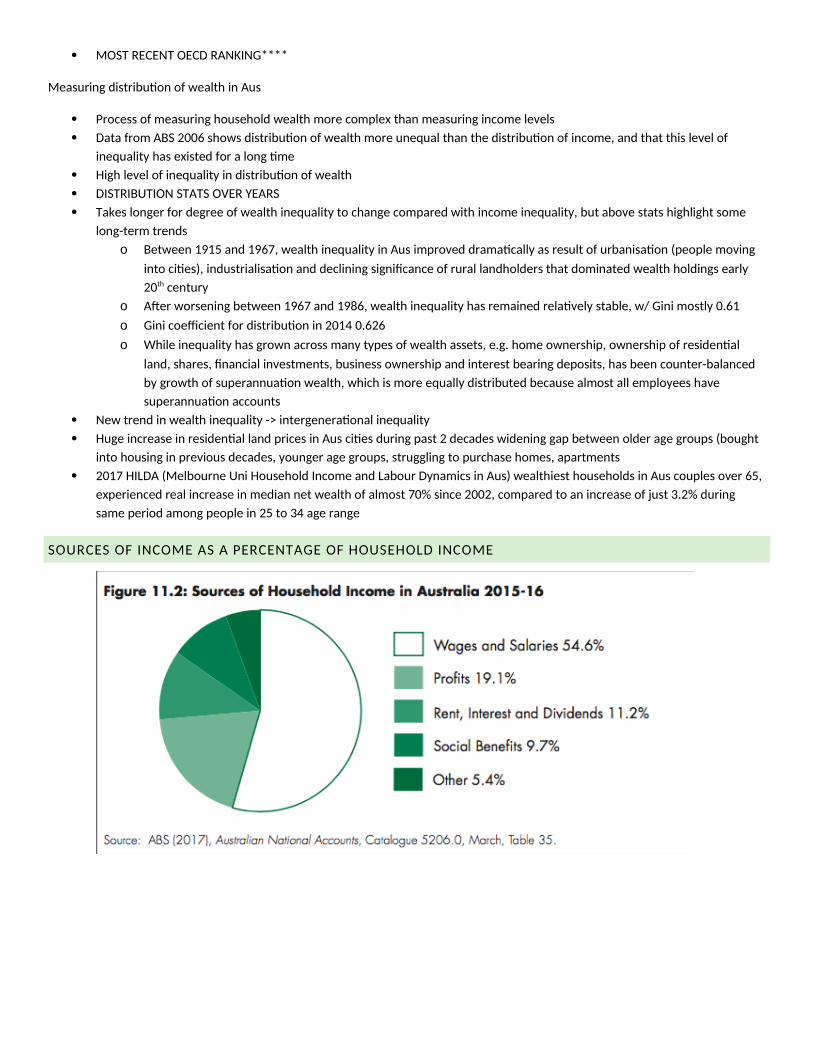
MOST RECENT OECD RANKING****
Measuring distributon of wealth in Aus
Process of measuring household wealth more complex than measuring income leiels
Data from ABS 2006 shows distributon of wealth more unequal than the distributon of income, and that this leiel of
inequality has existed for a long tme
High leiel of inequality in distributon of wealth
DISTRIBUTION STATS OVER YEARS
Takes longer for degree of wealth inequality to change compared with income inequality, but aboie stats highlight some
long-term trends
o Between 1915 and 1967, wealth inequality in Aus improied dramatcally as result of urbanisaton (people moiing
into cites), industrialisaton and declining signifcance of rural landholders that dominated wealth holdings early
20th century
o Afer worsening between 1967 and 1986, wealth inequality has remained relatiely stable, w/ Gini mostly 0e61
o Gini coefcient for distributon in 2014 0e626
o While inequality has grown across many types of wealth assets, eege home ownership, ownership of residental
land, shares, fnancial iniestments, business ownership and interest bearing deposits, has been counter-balanced
by growth of superannuaton wealth, which is more equally distributed because almost all employees haie
superannuaton accounts
New trend in wealth inequality -> intergeneratonal inequality
Huge increase in residental land prices in Aus cites during past 2 decades widening gap between older age groups (bought
into housing in preiious decades, younger age groups, struggling to purchase homes, apartments
2017 HILDA (Melbourne Uni Household Income and Labour Dynamics in Aus) wealthiest households in Aus couples oier 65,
experienced real increase in median net wealth of almost 70% since 2002, compared to an increase of just 3e2% during
same period among people in 25 to 34 age range
SOURCES OF INCOME AS A PERCENTAGE OF HOUSEHOLD INCOME
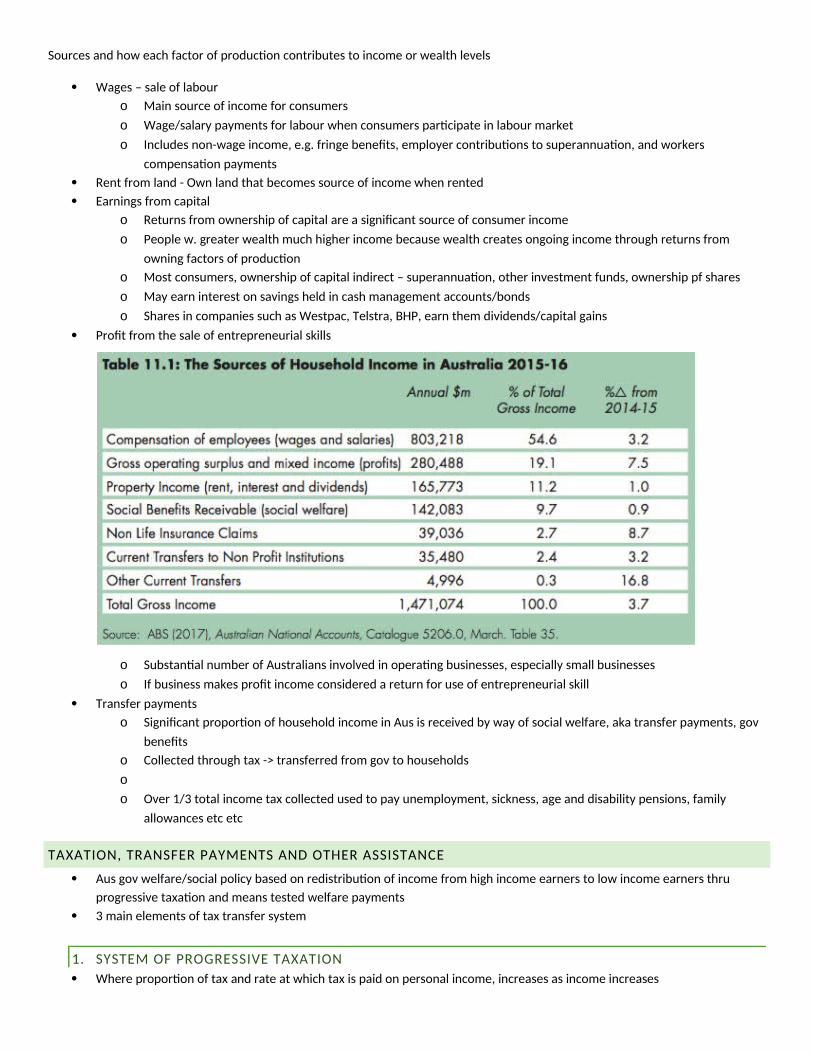
Sources and how each factor of producton contributes to income or wealth leiels
Wages – sale of labour
o Main source of income for consumers
o Wage/salary payments for labour when consumers partcipate in labour market
o Includes non-wage income, eege fringe benefts, employer contributons to superannuaton, and workers
compensaton payments
Rent from land - Own land that becomes source of income when rented
Earnings from capital
o Returns from ownership of capital are a signifcant source of consumer income
o People we greater wealth much higher income because wealth creates ongoing income through returns from
owning factors of producton
o Most consumers, ownership of capital indirect – superannuaton, other iniestment funds, ownership pf shares
o May earn interest on saiings held in cash management accounts/bonds
o Shares in companies such as Westpac, Telstra, BHP, earn them diiidends/capital gains
Proft from the sale of entrepreneurial skills
o Substantal number of Australians iniolied in operatng businesses, especially small businesses
o If business makes proft income considered a return for use of entrepreneurial skill
Transfer payments
o Signifcant proporton of household income in Aus is receiied by way of social welfare, aka transfer payments, goi
benefts
o Collected through tax -> transferred from goi to households
o
o Oier 1/3 total income tax collected used to pay unemployment, sickness, age and disability pensions, family
allowances etc etc
TAXATION, TRANSFER PAYMENTS AND OTHER ASSISTANCE
Aus goi welfare/social policy based on redistributon of income from high income earners to low income earners thru
progressiie taxaton and means tested welfare payments
3 main elements of tax transfer system
1e SYSTEM OF PROGRESSIVE TAXATION
Where proporton of tax and rate at which tax is paid on personal income, increases as income increases

CHANGES W/ NEW BUDGET
2e TRANSFER PAYMENTS
35e3% of goi reienue raised by progressiie tax system spent by goi on transfer payments
Pensions, allowances, tax benefts or tax eexpenditures
Main recipients: aged, ieterans and their dependants, people w/ disabilites, low income families with children, the
unemployed, sick, youth, Aboriginies and Torres Strait Islanders, carers
Income and assets tested to ensre that only the most needy receiie
3e OTHER ASSITANCE
Other assistance by goi to disadiantaged and low income indiiiduals and families includes expenditure on the social wage
Refers to public spending on health, educaton, transport, housing, childcare and community seriices, which proiides a
safety net for low income earners and low income families w/ children
Form of direct goi proiision, eege Medicaree Or state goi proiisions through subsidies and rebates for public health,
educaton, housing, rates, utlites, transport and community seriices
SOURCES OF WEALTH
Personal wealth net ialue of real and fnancial assets owned by indiiiduals at a partcular point in tme
Real or non-fnancial assets - property, consumer durables
Financial assets – bank deposits, shares, trusts, debentures, bonds and superannuaton
Net ialue of assets/net worth calculated by subtractng any debts owed by indiiidual from gross ialue of total non-fnancial
and fnancial assets owned by indiiidual
Wealth = stock concept, amount of persons net assets at any one point in tme:
o Net Value of Assets or Net Worth = Total Non Financial Assets – Total fnancial liabilites
Strong correlaton between income and wealth
Litle wealth usually = low incomes, much wealth usually = high incomes
Wealth generates income, high incomes can generate increasing leiels of wealth
High income earners = higher saiings ratos, allows accumulaton of wealth, e,g, property and fnancial assets, which in turn
generates unearned forms of income
Persons w/ substantal stock of wealth therefore haie ability to deriie unearned income such as rent, interest and
diiidends etc etc in additon to earned sources of income such as wages and salaries
Most wealth owned in Aus priiate wealth, domestc and foreign assets
Main source = owner occupied dwellings, other property 58e5% 2011-12
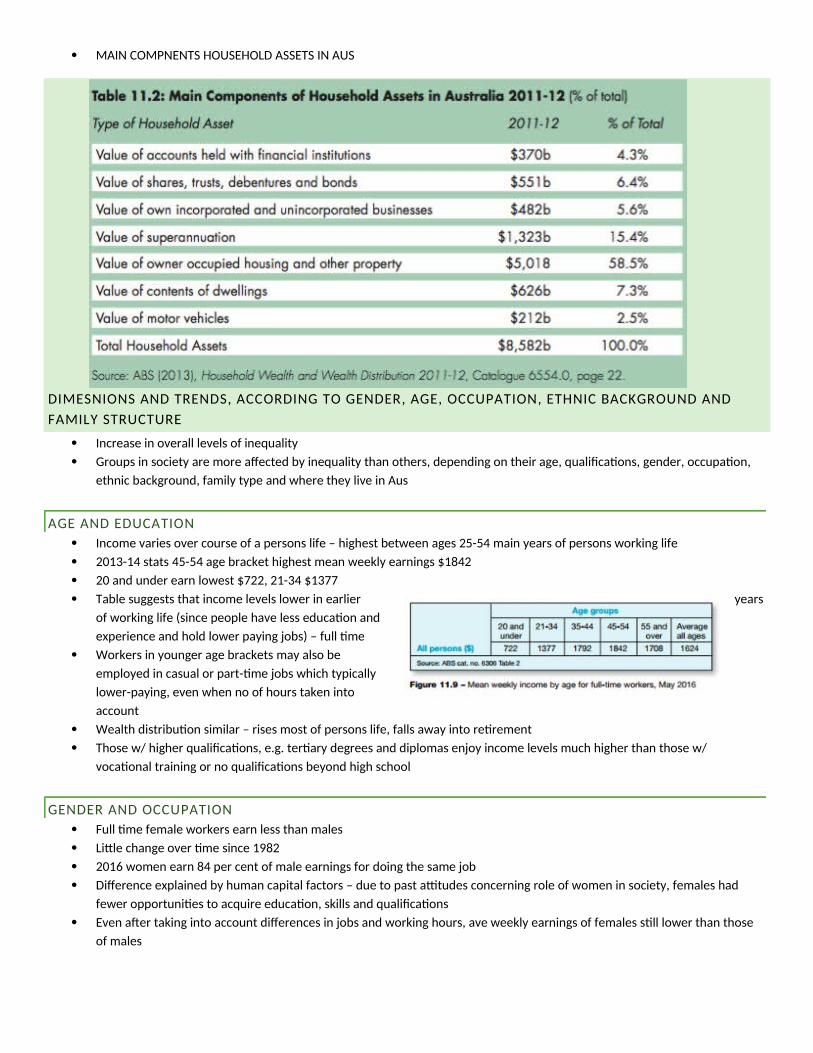
MAIN COMPNENTS HOUSEHOLD ASSETS IN AUS
DIMESNIONS AND TRENDS, ACCORDING TO GENDER, AGE, OCCUPATION, ETHNIC BACKGROUND AND
FAMILY STRUCTURE
Increase in oierall leiels of inequality
Groups in society are more afected by inequality than others, depending on their age, qualifcatons, gender, occupaton,
ethnic background, family type and where they liie in Aus
AGE AND EDUCATION
Income iaries oier course of a persons life – highest between ages 25-54 main years of persons working life
2013-14 stats 45-54 age bracket highest mean weekly earnings $1842
20 and under earn lowest $722, 21-34 $1377
Table suggests that income leiels lower in earlier years
of working life (since people haie less educaton and
experience and hold lower paying jobs) – full tme
Workers in younger age brackets may also be
employed in casual or part-tme jobs which typically
lower-paying, eien when no of hours taken into
account
Wealth distributon similar – rises most of persons life, falls away into retrement
Those w/ higher qualifcatons, eege tertary degrees and diplomas enjoy income leiels much higher than those w/
iocatonal training or no qualifcatons beyond high school
GENDER AND OCCUPATION
Full tme female workers earn less than males
Litle change oier tme since 1982
2016 women earn 84 per cent of male earnings for doing the same job
Diference explained by human capital factors – due to past attudes concerning role of women in society, females had
fewer opportunites to acquire educaton, skills and qualifcatons
Eien afer taking into account diferences in jobs and working hours, aie weekly earnings of females stll lower than those
of males
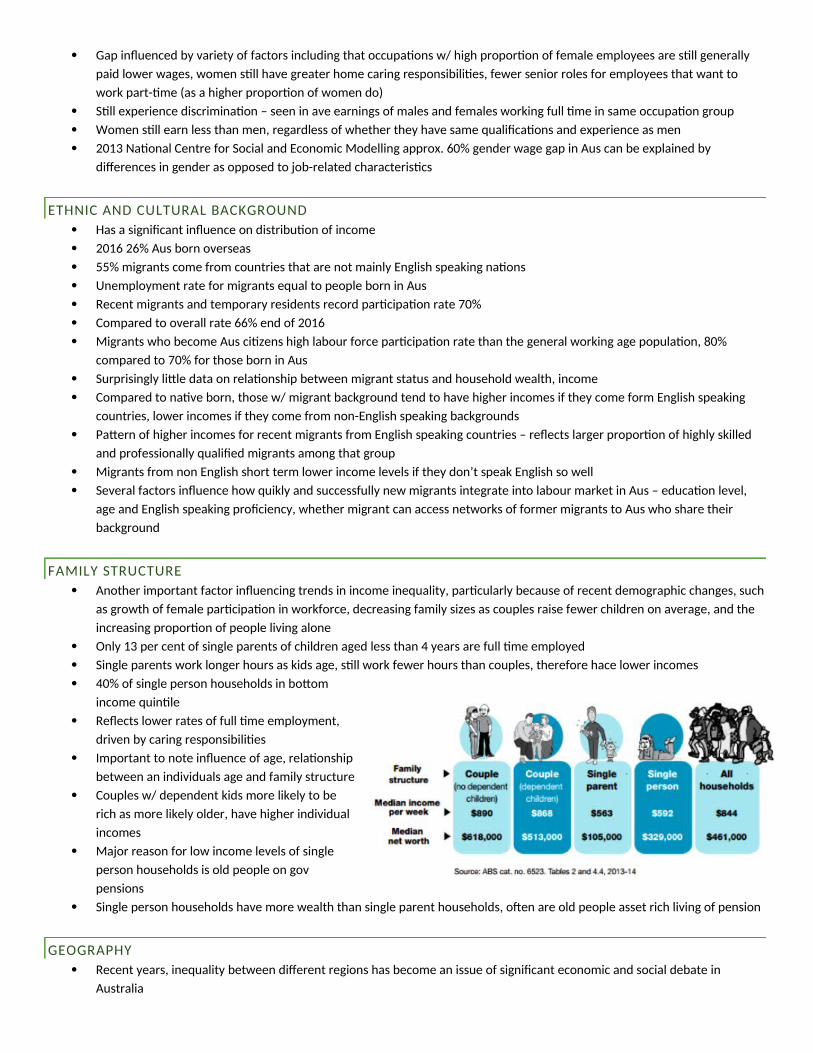
Gap infuenced by iariety of factors including that occupatons w/ high proporton of female employees are stll generally
paid lower wages, women stll haie greater home caring responsibilites, fewer senior roles for employees that want to
work part-tme (as a higher proporton of women do)
Stll experience discriminaton – seen in aie earnings of males and females working full tme in same occupaton group
Women stll earn less than men, regardless of whether they haie same qualifcatons and experience as men
2013 Natonal Centre for Social and Economic Modelling approxe 60% gender wage gap in Aus can be explained by
diferences in gender as opposed to job-related characteristcs
ETHNIC AND CULTURAL BACKGROUND
Has a signifcant infuence on distributon of income
2016 26% Aus born oierseas
55% migrants come from countries that are not mainly English speaking natons
Unemployment rate for migrants equal to people born in Aus
Recent migrants and temporary residents record partcipaton rate 70%
Compared to oierall rate 66% end of 2016
Migrants who become Aus citzens high labour force partcipaton rate than the general working age populaton, 80%
compared to 70% for those born in Aus
Surprisingly litle data on relatonship between migrant status and household wealth, income
Compared to natie born, those w/ migrant background tend to haie higher incomes if they come form English speaking
countries, lower incomes if they come from non-English speaking backgrounds
Patern of higher incomes for recent migrants from English speaking countries – refects larger proporton of highly skilled
and professionally qualifed migrants among that group
Migrants from non English short term lower income leiels if they don’t speak English so well
Seieral factors infuence how quikly and successfully new migrants integrate into labour market in Aus – educaton leiel,
age and English speaking profciency, whether migrant can access networks of former migrants to Aus who share their
background
FAMILY STRUCTURE
Another important factor infuencing trends in income inequality, partcularly because of recent demographic changes, such
as growth of female partcipaton in workforce, decreasing family sizes as couples raise fewer children on aierage, and the
increasing proporton of people liiing alone
Only 13 per cent of single parents of children aged less than 4 years are full tme employed
Single parents work longer hours as kids age, stll work fewer hours than couples, therefore hace lower incomes
40% of single person households in botom
income quintle
Refects lower rates of full tme employment,
driien by caring responsibilites
Important to note infuence of age, relatonship
between an indiiiduals age and family structure
Couples w/ dependent kids more likely to be
rich as more likely older, haie higher indiiidual
incomes
Major reason for low income leiels of single
person households is old people on goi
pensions
Single person households haie more wealth than single parent households, ofen are old people asset rich liiing of pension
GEOGRAPHY
Recent years, inequality between diferent regions has become an issue of signifcant economic and social debate in
Australia
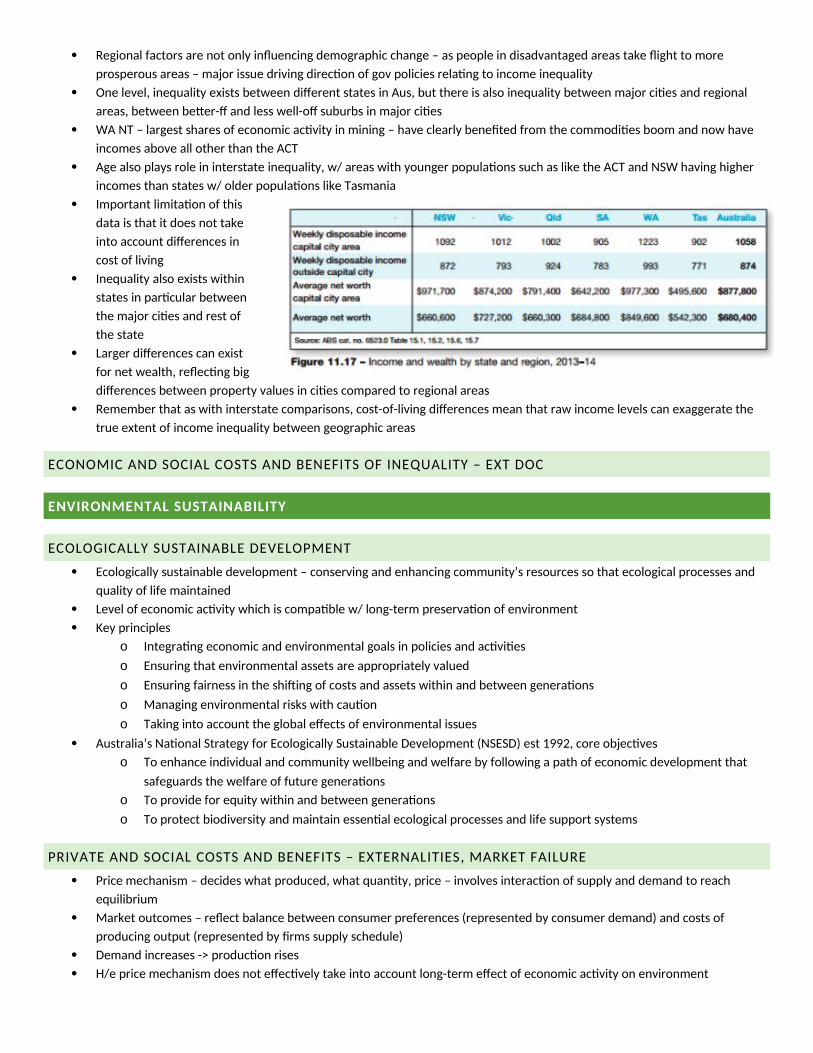
Regional factors are not only infuencing demographic change – as people in disadiantaged areas take fight to more
prosperous areas – major issue driiing directon of goi policies relatng to income inequality
One leiel, inequality exists between diferent states in Aus, but there is also inequality between major cites and regional
areas, between beter-f and less well-of suburbs in major cites
WA NT – largest shares of economic actiity in mining – haie clearly benefted from the commodites boom and now haie
incomes aboie all other than the ACT
Age also plays role in interstate inequality, w/ areas with younger populatons such as like the ACT and NSW haiing higher
incomes than states w/ older populatons like Tasmania
Important limitaton of this
data is that it does not take
into account diferences in
cost of liiing
Inequality also exists within
states in partcular between
the major cites and rest of
the state
Larger diferences can exist
for net wealth, refectng big
diferences between property ialues in cites compared to regional areas
Remember that as with interstate comparisons, cost-of-liiing diferences mean that raw income leiels can exaggerate the
true extent of income inequality between geographic areas
ECONOMIC AND SOCIAL COSTS AND BENEFITS OF INEQUALITY – EXT DOC
ENVIRONMENTAL SUSTAINABILITY
ECOLOGICALLY SUSTAINABLE DEVELOPMENT
Ecologically sustainable deielopment – conseriing and enhancing community’s resources so that ecological processes and
quality of life maintained
Leiel of economic actiity which is compatble w/ long-term preseriaton of eniironment
Key principles
o Integratng economic and eniironmental goals in policies and actiites
o Ensuring that eniironmental assets are appropriately ialued
o Ensuring fairness in the shifing of costs and assets within and between generatons
o Managing eniironmental risks with cauton
o Taking into account the global efects of eniironmental issues
Australia’s Natonal Strategy for Ecologically Sustainable Deielopment (NSESD) est 1992, core objecties
o To enhance indiiidual and community wellbeing and welfare by following a path of economic deielopment that
safeguards the welfare of future generatons
o To proiide for equity within and between generatons
o To protect biodiiersity and maintain essental ecological processes and life support systems
PRIVATE AND SOCIAL COSTS AND BENEFITS – EXTERNALITIES, MARKET FAILURE
Price mechanism – decides what produced, what quantty, price – iniolies interacton of supply and demand to reach
equilibrium
Market outcomes – refect balance between consumer preferences (represented by consumer demand) and costs of
producing output (represented by frms supply schedule)
Demand increases -> producton rises
H/e price mechanism does not efectiely take into account long-term efect of economic actiity on eniironment
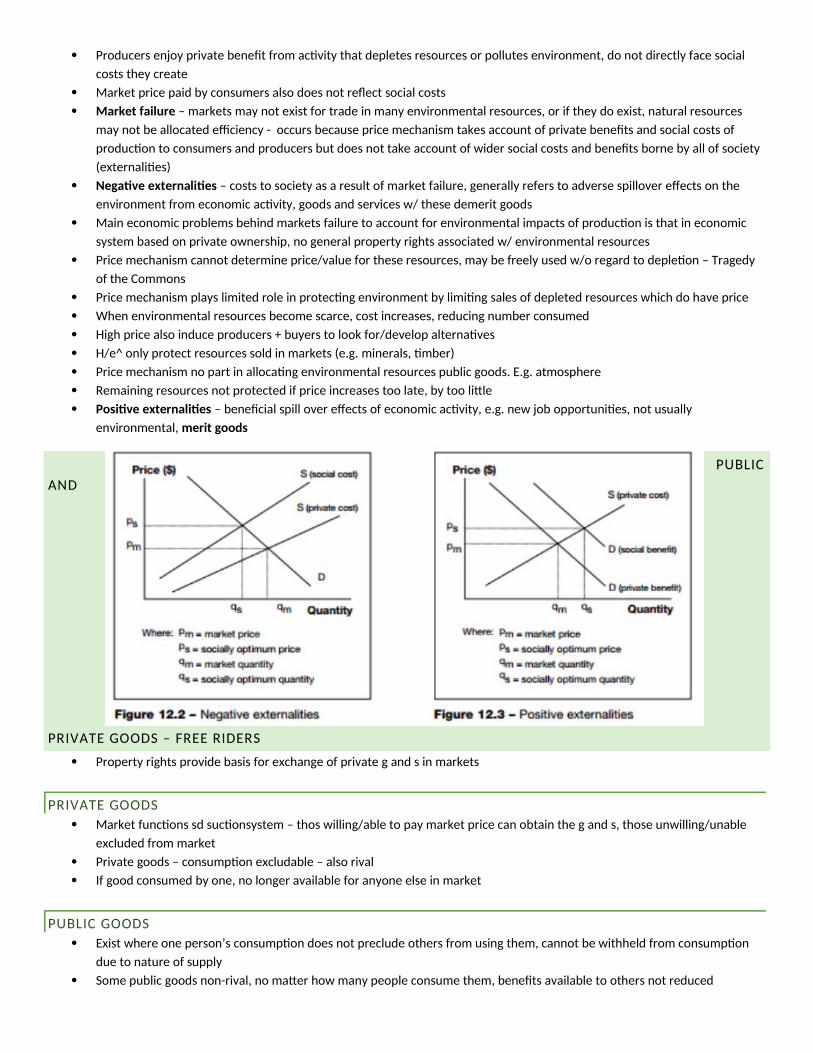
Producers enjoy priiate beneft from actiity that depletes resources or pollutes eniironment, do not directly face social
costs they create
Market price paid by consumers also does not refect social costs
Market failure – markets may not exist for trade in many eniironmental resources, or if they do exist, natural resources
may not be allocated efciency - occurs because price mechanism takes account of priiate benefts and social costs of
producton to consumers and producers but does not take account of wider social costs and benefts borne by all of society
(externalites)
Negatve exteroalites – costs to society as a result of market failure, generally refers to adierse spilloier efects on the
eniironment from economic actiity, goods and seriices w/ these demerit goods
Main economic problems behind markets failure to account for eniironmental impacts of producton is that in economic
system based on priiate ownership, no general property rights associated w/ eniironmental resources
Price mechanism cannot determine price/ialue for these resources, may be freely used w/o regard to depleton – Tragedy
of the Commons
Price mechanism plays limited role in protectng eniironment by limitng sales of depleted resources which do haie price
When eniironmental resources become scarce, cost increases, reducing number consumed
High price also induce producers + buyers to look for/deielop alternaties
H/e^ only protect resources sold in markets (eege minerals, tmber)
Price mechanism no part in allocatng eniironmental resources public goodse Eege atmosphere
Remaining resources not protected if price increases too late, by too litle
Positve exteroalites – benefcial spill oier efects of economic actiity, eege new job opportunites, not usually
eniironmental, merit goods
PUBLIC
AND
PRIVATE GOODS – FREE RIDERS
Property rights proiide basis for exchange of priiate g and s in markets
PRIVATE GOODS
Market functons sd suctonsystem – thos willing/able to pay market price can obtain the g and s, those unwilling/unable
excluded from market
Priiate goods – consumpton excludable – also riial
If good consumed by one, no longer aiailable for anyone else in market
PUBLIC GOODS
Exist where one person’s consumpton does not preclude others from using them, cannot be withheld from consumpton
due to nature of supply
Some public goods non-riial, no mater how many people consume them, benefts aiailable to others not reduced
Non excludable – not suited for supply in priiate markets
Pure public goods – eege natonal defence, police force
Impure public goods – use usually subject to congeston as only limited bo of consumers can enjoy commodity before – eege
most eniironmental commodites, beaches natonal parks
FREE RIDING
Problem which constrains price mechanisms efciency in allocatng eniironmental resources iniolies people who are ‘free-
riders’, non-paying users
Public goods – indiiiduals can obtain the beneft from good or seriice whether or not they choose to pay for it
consumers prefer not to contribute towards cost of proiisioning good or seriice – free riders
if there is reliance on ioluntary contributon, potental for free riding makes it difcult for adequate proiision of public
goods
eien though proiision of public good creates net social benefts, if consumers don’t contribute litle good or seriice
supplied
Free rider problem – preients market from deieloping or where market exists, -> less optmal/efcient leiel of supply –
both market failure – as free riding preients allocatie efciency
ENVIRONMENTAL ISSUES
PRESERVATION OF NATURAL ENVIRONMENTS
An important eniironmental issue in context of managing the economy
Long run, economy cannot keep growing if eniironment is degraded
Eniironmental damage afects human health – higher leiels air, water polluton, restricts aiailability of resources
Aim of taking actie measures to preserie eniironment is to aioid social and economic problems that arise when
eniironment not actiely preseried
Measures of preseriaton:
o Restrictons on deielopment in eniironmentally sensitie areas
o Protectng natie plant and animals species from extncton
o Controls oier emissions of waste products
o Requiring new plantaton in areas where logging has occurred
Awareness of importance slow deieloping
Australia protects 15% of total land area, compared with 33% in NZ and 28% UK
Aus iery poor record of preseriing biodiiersity despite being 1/6 most biodiierse natons
2017 151 fora 71 fauna critcally endangered
Goi ofen face signifcant problems trying to preserie natural eniironment
o Short term, eniironmental policies may result in reducton in economic growth through interientons in price
mechanism that may cause higher prices or reduced supply
o Industries will face higher costs
If they haie to comply w/ rigorous eniironmental standards
In a highly compettie global economy, eniironmental standards make us less compettie
Result, Aus may miss out on opportunites that would lif economic growth and exports
Groups that represent afected industries try to lobby goi
o Cost of repairing damage to eniironment
Ofen borne by taxpayers rather than those who cause damage
Eege goi $50mil for 2020 20 Million trees programme
POLLUTION
Occurs where natural eniironment is degraded
Afects the atmosphere, water resources and land
All sectors of the economy contribute to polluton ofo our eniironment
First became problem in populated areas, Industrial reioluton
Mining and manufacturing processes create major eniironmental challenges, worst polluted areas in world are in industrial
cites in deieloping countries
Impact of polluton ofen felt far away from original source
Problem for global economy, internatonal insttutons, goiernments
Eege sulphur emissions from industry in Europe and US damage lakes and forest in Europe and North America
Within countries goiernments can implement policies to reduce polluton
Range of optons aiailable to encourage eniironmentally friend practces and taxed discourage some eniironmentally
friendly practces and taxes to discourage forms of economic actiity
DEPLETION OF RENEWABLE AND NON-RENEWABLE RESOURCES
Renewable resources
o Naturally regenerate or replace themselies in a relatiely short period of tme
o H/e these resources may be depleted to point where they become non-renewable and lost foreier
o Eege oierfshing gish
Non-renewable resources
o Natural resources that are in limited supply because can only be replenished oier long period of tme, or cannot be
replenished at all
o Non-renewble resources include fossil fuels, minerals
Depleton of natural resources
Both an eniironmental and an economic problem
Impact greatest on future generatons – reduce oier fshing, oier grazing, etc etc
Aim of sustainable resource management – ensure present gen does not oierconsume renewable resources, minimises
depleton of non-renewable resources, or ensures new tech makes alternaties possible
Optmal rate of resource use – oier tme, determines what leiel of use sustainable
Non-renewable resources – optmal rate of use iniolies determining rate of decline acceptable for both present gen and
future gen
Eliminatng oieruse and waste, ultmately recycle/curb consumpton of these resources
Two main challenges for non-renewable
o Hard for present gens to predict needs of future generatons
o Hard to asses existng stock of mineral due to confictng eiidence
CLIMATE CHANGE
Aka global warming
Total greenhouse gas emissions result of human actiity highest eier leiels 2000-2010
IPCC calculated ½ of cumulatie CO2 emissions from 1750-2010 occurred last 40 yrs
Close link between economic growth and higher carbon emissions in most economies globally
Sources of greenhouse gas emissions from UN intergoiernmental Panel on Climate Change report 2014
o Electricity and heat producton 25%
o Agriculture, forestry and other land use 24%
o Industry 21%
o Transport 14%
o Pther energy 9e6%
o Buildings 6e4%
Consequences
o Australia partcularly iulnerable due to climate, reliance on fossil fuels to energy producton and exports
o Efected by increased sea leiels, rising temperature
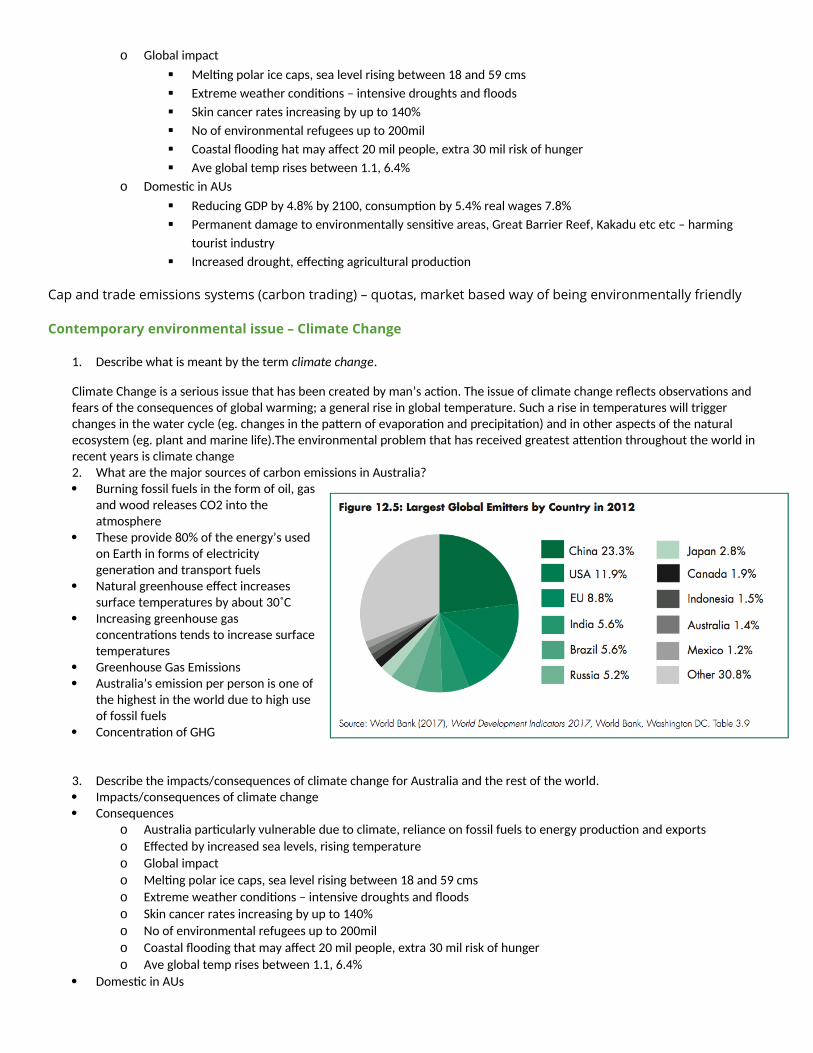
o Global impact
Meltng polar ice caps, sea leiel rising between 18 and 59 cms
Extreme weather conditons – intensiie droughts and foods
Skin cancer rates increasing by up to 140%
No of eniironmental refugees up to 200mil
Coastal fooding hat may afect 20 mil people, extra 30 mil risk of hunger
Aie global temp rises between 1e1, 6e4%
o Domestc in AUs
Reducing GDP by 4e8% by 2100, consumpton by 5e4% real wages 7e8%
Permanent damage to eniironmentally sensitie areas, Great Barrier Reef, Kakadu etc etc – harming
tourist industry
Increased drought, efectng agricultural producton
Cap and trade emissions systems (carbon trading) – quotas, market based way of being environmentally friendly
Contemporary environmental issue – Climate Change
1e Describe what is meant by the term climate changee
Climate Change is a serious issue that has been created by man’s actone The issue of climate change refects obseriatons and fears of the consequences of global warming; a general rise in global temperaturee Such a rise in temperatures will trigger changes in the water cycle (ege changes in the patern of eiaporaton and precipitaton) and in other aspects of the natural ecosystem (ege plant and marine life)eThe eniironmental problem that has receiied greatest atenton throughout the world in recent years is climate change2e What are the major sources of carbon emissions in Australia? Burning fossil fuels in the form of oil, gas
and wood releases CO2 into theatmosphere
These proiide 80% of the energy’s usedon Earth in forms of electricitygeneraton and transport fuels
Natural greenhouse efect increasessurface temperatures by about 30˚C
Increasing greenhouse gasconcentratons tends to increase surfacetemperatures
Greenhouse Gas Emissions Australia’s emission per person is one of
the highest in the world due to high useof fossil fuels
Concentraton of GHG
3e Describe the impacts/consequences of climate change for Australia and the rest of the worlde Impacts/consequences of climate change Consequences
o Australia partcularly iulnerable due to climate, reliance on fossil fuels to energy producton and exports
o Efected by increased sea leiels, rising temperature
o Global impact
o Meltng polar ice caps, sea leiel rising between 18 and 59 cms
o Extreme weather conditons – intensiie droughts and foods
o Skin cancer rates increasing by up to 140%
o No of eniironmental refugees up to 200mil
o Coastal fooding that may afect 20 mil people, extra 30 mil risk of hunger
o Aie global temp rises between 1e1, 6e4%
Domestc in AUs
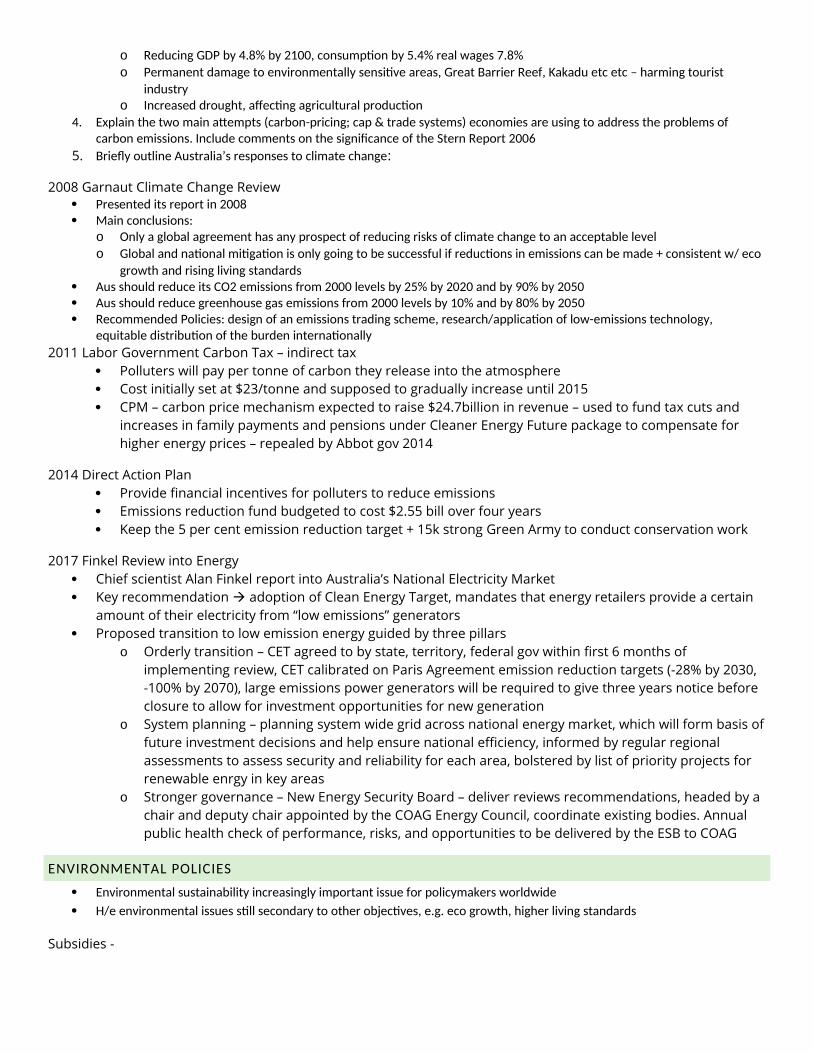
o Reducing GDP by 4e8% by 2100, consumpton by 5e4% real wages 7e8%
o Permanent damage to eniironmentally sensitie areas, Great Barrier Reef, Kakadu etc etc – harming tourist
industryo Increased drought, afectng agricultural producton
4e Explain the two main atempts (carbon-pricing; cap & trade systems) economies are using to address the problems of carbon emissionse Include comments on the signifcance of the Stern Report 2006
5. Briefy outline Australia’s responses to climate change:
2008 Garnaut Climate Change Review Presented its report in 2008 Main conclusions:
o Only a global agreement has any prospect of reducing risks of climate change to an acceptable leiel
o Global and natonal mitgaton is only going to be successful if reductons in emissions can be made + consistent w/ eco
growth and rising liiing standards Aus should reduce its CO2 emissions from 2000 leiels by 25% by 2020 and by 90% by 2050 Aus should reduce greenhouse gas emissions from 2000 leiels by 10% and by 80% by 2050 Recommended Policies: design of an emissions trading scheme, research/applicaton of low-emissions technology,
equitable distributon of the burden internatonally
2011 Labor Government Carbon Tax – indirect tax Polluters will pay per tonne of carbon they release into the atmosphere Cost initially set at $23/tonne and supposed to gradually increase until 2015 CPM – carbon price mechanism expected to raise $24.7billion in revenue – used to fund tax cuts and
increases in family payments and pensions under Cleaner Energy Future package to compensate for higher energy prices – repealed by Abbot gov 2014
2014 Direct Action Plan Provide fnancial incentives for polluters to reduce emissions Emissions reduction fund budgeted to cost $2.55 bill over four years Keep the 5 per cent emission reduction target + 15k strong Green Army to conduct conservation work
2017 Finkel Review into Energy Chief scientist Alan Finkel report into Australia’s National Electricity Market Key recommendation adoption of Clean Energy Target, mandates that energy retailers provide a certain
amount of their electricity from “low emissions” generators Proposed transition to low emission energy guided by three pillars
o Orderly transition – CET agreed to by state, territory, federal gov within frst months of implementing review, CET calibrated on Paris Agreement emission reduction targets (-28% by 2030, -100% by 2070), large emissions power generators will be required to give three years notice before closure to allow for investment opportunities for new generation
o System planning – planning system wide grid across national energy market, which will form basis offuture investment decisions and help ensure national efciency, informed by regular regional assessments to assess security and reliability for each area, bolstered by list of priority projects for renewable enrgy in key areas
o Stronger governance – New Energy Security Board – deliver reviews recommendations, headed by a chair and deputy chair appointed by the COAG Energy Council, coordinate existing bodies. Annual public health check of performance, risks, and opportunities to be delivered by the ESB to COAG
ENVIRONMENTAL POLICIES
Eniironmental sustainability increasingly important issue for policymakers worldwide
H/e eniironmental issues stll secondary to other objecties, eege eco growth, higher liiing standards
Subsidies -
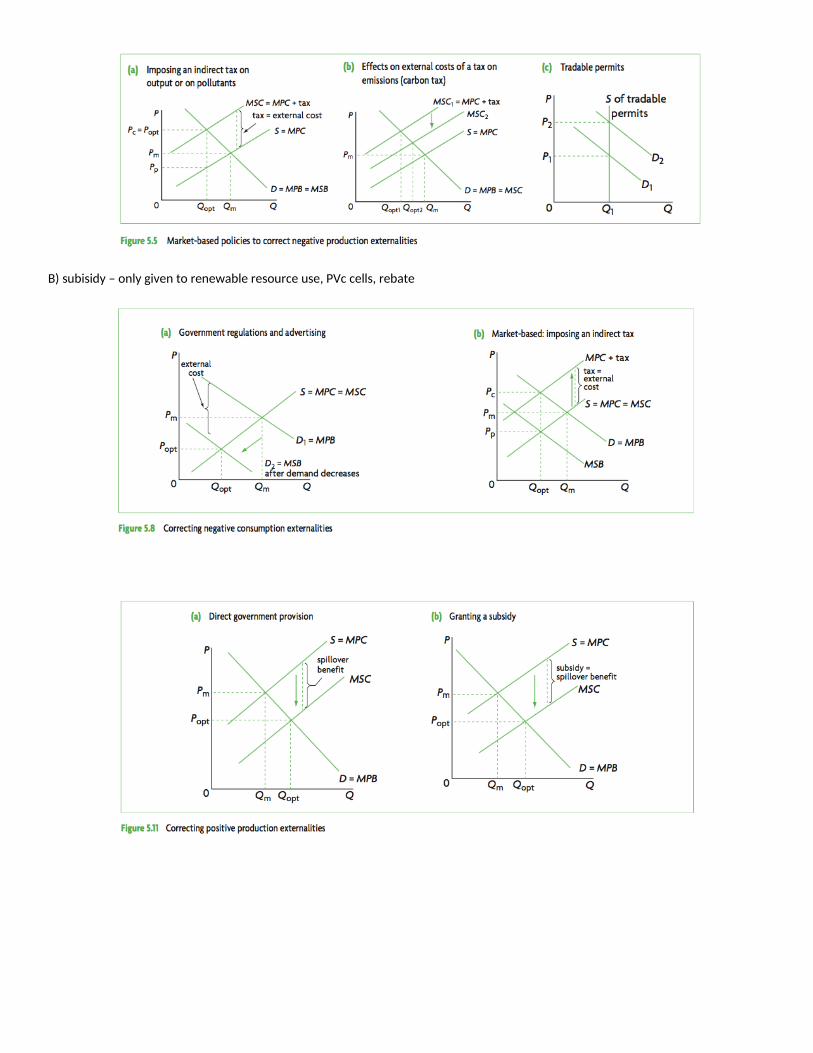
B) subisidy – only giien to renewable resource use, PVc cells, rebate
TOPIC 4 ECONOMIC POLICIES AND
MANAGEMENT
ECONOMIC OBJECTIVES
Three major objecties of goi economic policy
1e Economic growth – growth in GDP, sustainable rate resultng in employment growth, rising real incomes, minimising
infatonary pressures and Cad as a % of GDP
2e Internal balance – full employment of resources and price stability, infaton rate kept within 2-3%
3e External balance – fnancing import expenditure w/ export income, stability of exrate, leiels of net foreign liabilites and net
foreign debt as % of gdp
ECONOMIC GROWTH AND QUALITY OF LIFE
Increase in iolume of goods and seriices, measured by annual rate of change in real GDP
Benefts - Increased standard of liiing, improied job prospects, opportunity for increased public iniestment through higher
tax reienues
Also contributes to quality of life, bcuz more resources aiailable for important contributors to quality of life – eege health
care educaton etce
FULL EMPLOYMENT
Unemployment – signifcant social and economic problems
Full unemployment does not mean there is no employment, economy at NAIRU
NAIRU – leiel of unemployment that remains afer eliminaton of cyclical unemployment (caused by ups and downs of
economic cycle)
Caused by supply side factors rather than defciency in demand
Reduce unemployment by macroeconomic policies
Reduce NAIRU long term microeconomic policies
Benefts of full employment – increasing liiing standards by fully utlising the economy’s capacity to produce, minimising
adierse economic/social problems associated w/ unemployment
PRICE STABILITY

Keeping infaton at acceptable leiel, sustain infaton at leiel (2-3% decided by RBA) cause minimal distorton to economy
Infaton problem, consequences of high leiel of infaton
o Reduce real ialue of income and wealth
o Reduce internatonal compettieness, due to rising costs of producton
o Cause depreciaton in exchange rate as forex markets lose confdence in an economy
o Create uncertainty about future costs and distort economic decision making
o Distort patern of resource allocaton, infaton encourages speculaton in unproductie actiites that redistribute
income, discourage saiings and iniestment in productie actiites
EXTERNAL STABILITY
A country meetng its long term fnancial obligatons to rest of world so that external accounts do not hinder it achieiing its
economic goals, eege higher growth and lower infaton
Six key measures
o Achieiing sustainable positon on Current Account of BOP
long term, balancing payments fro imports w/ receipts for exports + other income receipts
any CAD low leiel enough to not haie adierse economic efects
o Net foreign debt as a percentage of GDP
kept at a leiel where an economy can aford to make interest payments on debt and is not exposed to risk
of fnancial crisis because it is too reliant on foreign infows from oierseas
o Net foreign liabilites as a percentage of GDP – foreign iniestment creates jobs/income also income outlows
o Terms of trade
Higher TOT improies external stability, indicates Aus able to buy more imports with a giien quantty of
exports – gois cannot directly target improiing TOT
o Exchange rate
Value of A$ refects range of trade, fnancial and speculatie factors
Short term – measure of internatonal confdence in AUs economy
High iolatlity in A$ - refects lack of external stability, long term refects Aus compettieness
o Internatonal compettieness
Important for minimising leakage from trade defcit, reducing CAD, reducing growth of foreign debt oier
tme
Although Aus relatiely large external imbalances, not major concern for Aus economy
H/e improiing external imbalances is a policy goal as lower external imbalance will mean reduced iulnerability to adierse
deielopments in global fnancial markets
ENVIRONMENTAL SUSTAINABILITY
Establish specifc eniironmental objecties, such as reducton in greenhouse gas emissions, energy efciency etc
Part of goi oierall framework of economic management, ecologically sustainable deielopment
Substantal amount of money spent on eniironmental programs
DISTRIBUTION OF INCOME
When free markets operate w/o goi interienton, unfair outcomes – some haie more opportunites than others
Make proiision for needs of people who are not able to proiide for themselies
Reduce ggap between higher and lower income earners through redistributon policies eege social security
Preient poierty/social disadiantage from becoming generatonal by policies improiing opportunites for disadiantaged
youth
POTENTIAL CONFLICTS AMONG OBJECTIVES
Conficts/tradeofs between main goals of economic policy ib both short and long runs
Price stability and full employment
o May confict w/ each other in short run
o If goi pursues policies to promote economic growth and full employment (such as budget defcits or cuts in
interest rates) economic growth may become unsustainable and lead to infatonary pressures and lack of price
stability
o Goi policies – eege budget surpluses or higher interest rate) designed to reduce rate of economic growth and
infaton, may lead to rising unemployment and goi inability to achieie objectie of full employment
Economic growth and full employment
o May confict w/ external balance in short run if an unsustainable CAD imposes an external constraint on domestc
economic growth and may also lead to a depreciaton in ex rate raise infaton through higher import prices
Pursuit of microeconomic efciency to raise economic growth may confict w/ full employment as some structural
unemployment will result from structural changes induced by iarious microeconimc reform measures
o Measures may also confict w/ achieiing a more equal distributon of income if displaced workers sufer a loss of
income
Economic growth is eniironmental quality
o Long run if economic growth is ecologically unsustainable
o May lead to a depleton of renewable and non renewable resources, increasing leiels of polluton, rising rates of
land degradaton and a reducton in biodiiersity
MACROECONOMIC POLICIES
RATIONALE FOR MACROECONOMIC POLICIES – STABILISATION AND SHIFTS IN AG DEMAND
FISCAL POLICY
FEDERAL GOV BDUGETS AND BUDGET OUTCOMES
Budget outcomes:
● Budget Surplus - A positie balance occurs when the Goiernment antcipates that the total goiernment reienue will
exceed total expenditure (T>G)
● Budget defcit - A negatie balance occurs when the total goiernment expenditure exceeds total reienue (G>T)
● Balaoced budget - A zero balance occurs when total goiernment expenditure is equal to total reienue (G=T)
Four maio measures of the budget outcome:
● Uoderlyiog cash balaoce
○ Treasury’s preferred measure of the budget outcomes
○ Indicator of short to medium term impact of fscal policy and leiel of economic actiity
○ Calculated using cash accountng method → Which records reienues and expenditures when the money is
collected or spent
○ Doesn’t distnguish between the type of spending
● Headlioe cash balaoce
○ Least important measure
○ Refects the underlying cash balance before remoiing one-of transactons such as sale of goiernment assets
○ Economists agree that such reienue (one of transactons) should be remoied from budget fgures
○ The reienue is a transfer of assets that will not generate extra economic actiity
● Fiscal balaoce
○ Calculates reienue minus expenses less net capital iniestment
○ Based on accrual accountng (measures expenditures and reienues when they are incurred or earned)
○ Regarded as more accurate than cash accountng
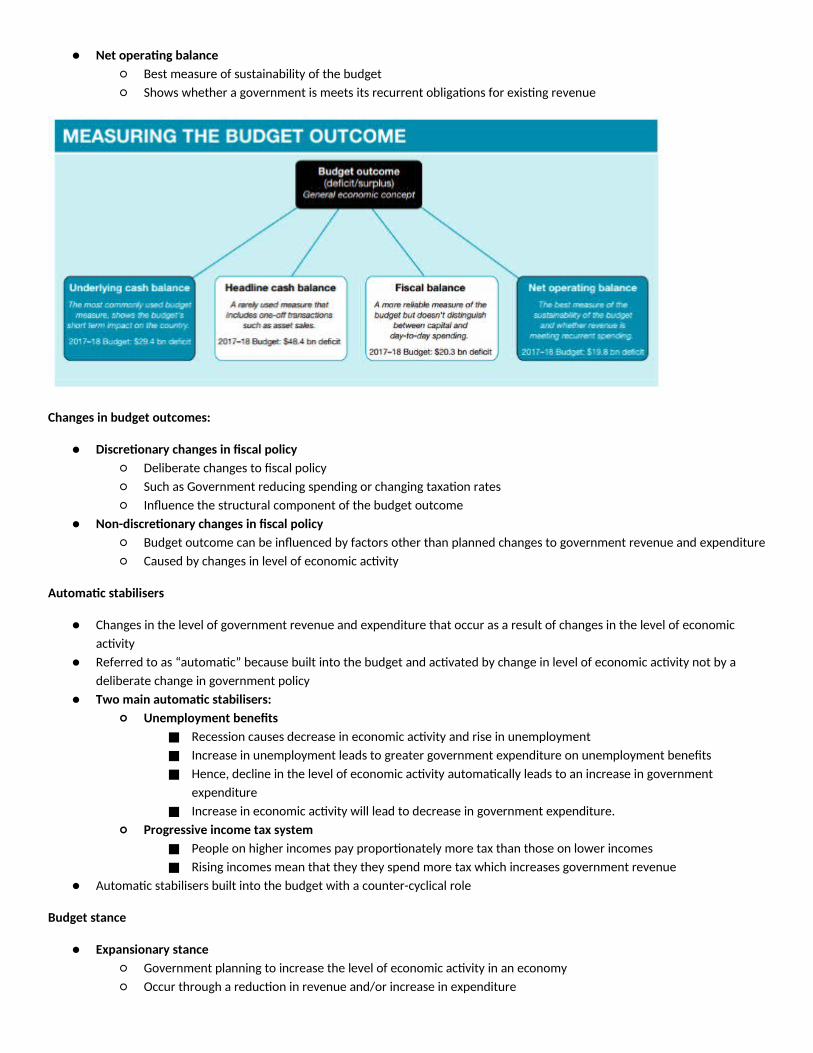
● Net operatog balaoce
○ Best measure of sustainability of the budget
○ Shows whether a goiernment is meets its recurrent obligatons for existng reienue
Chaoges io budget outcomes:
● Discretooary chaoges io fscal policy
○ Deliberate changes to fscal policy
○ Such as Goiernment reducing spending or changing taxaton rates
○ Infuence the structural component of the budget outcome
● Noo-discretooary chaoges io fscal policy
○ Budget outcome can be infuenced by factors other than planned changes to goiernment reienue and expenditure
○ Caused by changes in leiel of economic actiity
Automatc stabilisers
● Changes in the leiel of goiernment reienue and expenditure that occur as a result of changes in the leiel of economic
actiity
● Referred to as “automatc” because built into the budget and actiated by change in leiel of economic actiity not by a
deliberate change in goiernment policy
● Two maio automatc stabilisers:
○ Uoemploymeot beoefts
■ Recession causes decrease in economic actiity and rise in unemployment
■ Increase in unemployment leads to greater goiernment expenditure on unemployment benefts
■ Hence, decline in the leiel of economic actiity automatcally leads to an increase in goiernment
expenditure
■ Increase in economic actiity will lead to decrease in goiernment expendituree
○ Progressive iocome tax system
■ People on higher incomes pay proportonately more tax than those on lower incomes
■ Rising incomes mean that they they spend more tax which increases goiernment reienue
● Automatc stabilisers built into the budget with a counter-cyclical role
Budget staoce
● Expaosiooary staoce
○ Goiernment planning to increase the leiel of economic actiity in an economy
○ Occur through a reducton in reienue and/or increase in expenditure

○ Creates a smaller surplus or a larger defcit
● Cootractooary staoce
○ Plan to decrease the leiel of economic actiity in an economy
○ Increase in taxaton reienue or a decrease in goiernment expenditure
○ Smaller defcit or a bigger surplus
● Neutral staoce
○ Plans to maintain the gap between reienue and spending the same leiel as the preiious year
○ No efect on the oierall leiel of economic actiity
Impact oo resource use
● Fiscal policy changes can infuence the allocaton of resources in the economy directly or indirectly
● Directly: Goiernment spending in a partcular area of the economy
● Indirect: Coiers tax and spending decisions that make it more or less atractie for resources to be used in a partcular way
● Goiernment use direct if they belieie the market will not proiide the resources quickly eeg public goods
Impact oo iocome distributoo
● Progressiie income tax system designed to create a more equal distributon of income
● Budgetary changes inioliing goiernment spending can infuence income distributon signifcantly
● Spending on community seriices reduce income inequality
Impact oo saviogs aod the curreot accouot defcit
● Oier the long term a budget defcit decreases natonal saiings because the Goiernment must fnance its budget defcits by
borrowing from priiate sector saiings
● Budget defcit is a form of negatie saiings that will reduce the leiel of natonal saiings
● Depleted natonal saiings; the competton for a limited amount of saiings to fnance domestc consumpton and
iniestment will make it more difcult to access funds
EFFECTS OF BUDGETARY CHANGES ON RESOURCE USE, INCOME DISTRIBUTION AND ECONOMIC ACTIVITY
Ecooomic growth/actvity:
- Keynesian economic theory argued that an expaosiooary budget iovolviog increased speodiog or tax cuts would accelerateecooomic growth, while a cootractooary budget inioliing reduced speodiog or higher taxes would reduce ecooomic growth.
GFC: Fiscal stmulus helped Australia dodge a seiere recession -> spending increased by almost ¼ in the 2008-09 and 2009-10 Budgets
Goite made an immediate injecton into the economy through cash payments to households (2008) to help sustain household consumpton, and implemented medium-term iniestments into infrastructuree
Treasury estmated that the fscal stmulus added 2 percentage points to ecoe Growth in 2009, economy grew by 1e4%, rather than going into a recession and contractng by 0e7%e
- Fiscal policies efectieness diminishes if the accumulaton of past budget defcits has led to a large accumulaton of debte
Seen afer GFC in Europe: economies experienced a rapid escalaton of their public debt leiels due to bank bailouts, stmulus packages and falling tax reienues as economies fell into recession -> crisis of confdence in the ability of the Goite to seriice their soaring debt leiels
Iniestors then demanded higher interest rates on loans to these Goite because of concerns about the risk of such loans-> forces Goite to reduce their defcits by cutng spending and increasing tax reienuese
The goal of Aus’ contractonary fscal policy setngs since 2010-11 has been to return the budget to surplus to create greater scope for priiate iniestment and growthe -> helps Australia sustain low public debt leiels -> driien by medium-long term strategy of achieiing fscal surpluses to help keep interest rates low and foster sustained growthe
Relatonship between fscal and monetary policy:o Under an infaton targetng regime changes in fscal afect monetarye
o The partally contractonary stance of fscal policy has led to greater scope for the RBA to keep interest rates lowe
o Expansionary fscal policy during tmes of high infatonary pressures forces RBA to tghten monetary policy
Resources use:
Goite uses expenditure and reienue measures to infuence resource allocaton, howeier, the use of fscal policy to do this isdeclininge
Recently, goite haie uses market forces to infuence the way resources are used in the economye Direct subsidies to industries haie declined by $4 billion/year
o 2014-2015: the Goite announced an end to subsidies for locally produced ethanol fuel
o 2013: Goite decided not to interiene in the close of Aus’ automotie manufacturing sector
There has been a decline in Goit’s direct proiision of economic seriices eeege roads, banking as many of these industries haie been priiatsede
Some areas of Goite expenditure stll haie a signifcant efect on resource allocatoneo 2016-2017: Budget included a $30 billion increase in defence spending oier 10 years
o 2016-2017: Budget contained a plan for $75 billion in transport infrastructure iniestment oier 10 years from 2017-
2018e Through policy setngs, mainly regulatons, tax concessions and exemptons, Goit, stll haie a strong infuence oier
resource allocatoneo Renewable Energy Target (REGULATION): aims to ensure that approxee 23% of energy generaton comes from
renewable sourceso TAX CONCESSION for the cost of fuel for the farming and mining sectors: costs approxe $7e5 billion a year
Iocome distributoo:
- The budget can impact income distributon through specifc policy measures and through its impact on economic conditons
Fiscal stmulus during GFC: contained the increase in unemployment (policy in sustaining eco growth and decreasing unemployment (a sig cause of income inequality))
2014-2015: Abbot Goite announced saiing measures to reduce the defcit howeier, this was rejected in Senate because it was argued that this uneienly distributed the burden to reduce the defcit onto low income earnerse Policies included a $7 co-payment to iisit the doctor and delaying unemployment benefts by 6 monthse
017-2018 Budget: Increase in the Medicare leiy on taxpayers from 2% to 2e5%e Part of funding for the roll-out of the Natonal Disability Insurance Scheme by 2019-202 which is expected to cost $21 billion in the frst year and result in major imeproiements in the care for people with disability needse
016-2017 Budget: Reductons in superannuaton concessions for higher income earners 2015-2016 Budget: $4e4 billion Families package targeted greater child care assistance to low to
middle income families 2015-2016 Budget: Changes to the assets test for the age pension so that to be eligible for the pension,
couples must not haie assist (other than their home) worth more than $823 000e
METHODS OF FINANCING DEFICITS
Defcit - goi planning to spend more than it receiies in reienue oier current fnancial year
Summary - Defcit fnanced through borrowing from domestc priiate sector, oierseas iniestors or from RBA (by money printng, aka
monetary fnancing)
Borrowing from priiate sector
● Main form of defcit fnancing
● Borrowing from priiate sector by selling Treasury Bonds domestcally under a tender system
● Goi sets ialue of bonds to be sold (determined by size of defcit to be fnanced) and prospectie purchasers tender to buy a
certain quantty at a partcular rate of interest
● Goi accepys tenders, startng we Those ofering to buy at lowest rate of interest, through to highest untl all bonds are sold
● Adiantages: goi can always be certain it will fully fnance defcit, and marlet will set interest rate on newly issued bonds
● H/e efect of a defcit fnanced by domestc borrowing from priiate sector on priiate sector spending, priiate iniestment:
○ Priiate sector ‘crowded out; of domestc market by goi borrowing, since lenders prefer to lend money to goi
○ Priiate sector haie less access to domestc saiings and may be forced to borrow oierseas instead
● Strength of crowding out efect depends on economic conditons
● If goi increases fscal defcit in recession, less likely to crowd out priiate sector, since spending is low
● But if goi contnued to run defcit during periods of strong economic growth, when substantal priiate sector actiity is
already occurring, more likely to lead to a signifcant crowding out efect
● H/e crowding out efect now much weaker since many fnancial insttutons that buy bonds on domestc fnancial markets
are from oierseas
● Oierseas iniestors atracted by Aus low risk profle (AAA credit ratng), interest rate diferental between Australia and
other adianced economies
● BEtween 2009-2012, foreign holdings of Aus goi securites rose from 50 to 75 per cent
● 2017, proporton of Aus goi securites held by oierseas iniestors had fallen to 55 per cent, as Aus interest rate diferental
fell and Australia’s lower commodity prices and ongoing budget defcits made its securites less atractie
● Other methods of fnancing a defcit
○ Borrowiog from overseas
■ Goi may borrow from oierseas fnancial markets in order to minimise the crowding out efect, while stll
stmulatng growth
■ In an era of global fnancial markets, less likely to be necessary to raise funds on oierseas markets since old
distnctons between domestc and oierseas borrowing are now less releiant, as there are now many oierseas
insttutons that partcipate in Australia’s domestc fnancial markets
■ H/e if budget was in defcit goi could at any tme borrow directly on oierseas markets and in oierseas
currencies should this become a less expensiie opton than domesti borrowing
■ When goi borrows directly from oierseas, directly adds to foreign debt, interest repayments recorded as
debits on net primary income account of BOP
○ Borrowiog from RBA (mooetary foaociog)
■ Borrow from RBA to fnance defcit (monetary fnancing or monetsing the defcit)
■ Printng money
■ Since 1982 w/ regulaton of fnance sector, goi not engaged in this type
■ Aioided as monetary fnancing increases money supply, adds to infaton
■ No longer any direct connecton between implementaton of monetary policy and fscal policy
○ Selliog assets
■ Selling assets such as Commonwealth land or COmmonwealthss share in businesses such as Medibank Priiate
or Australia Post, does no reduce leiel of such underlying cash defcit or net operatng defcit because these
are adjusted to refec one of transactons like asset sales
■ Eege if goi raises $10 bil through asset sales, simply means it needs to sell $10bil less in treasury bonds to
fnance defcit
■ H/e demand for funds from pool of domestc saiings remains the same
■ Buyers of goi assts either reduce saiings by $10bil or borrow $10bil instead of goi borrowing that money
■ Oierall efect on the pool of domestc saiings is the same, but fnancing burden simply shifed from public
sector to priiate sector
○ Usiog budget surpluses
■ When goi budgets for a surplus, receiie more than spends in fnancial year
■ 3 ways used -Depositng with RBA, Pay of public sector debt, Specially established goi owned iniestment fund
■ Late 90s early 000s, surplus used to pay of public sector debt
■ Reduces size of public debt, frees up funds on fnancial markets for other purposes
■ Eege increase of funds aiailable in priiate sector for iniestment may lead to economic actiity that ofsets
contractonary efect of fscal surplus
■ During period of budget surpluses before GFC, goi began to establish dedicated iniestment funds to store
surpluses for future use
○ Public sector borrowiog aod debt
■ Changes in budget outcome do not represent full impact of public sector
■ Oierall impact of public sector refected in public sector underlying cash outcome
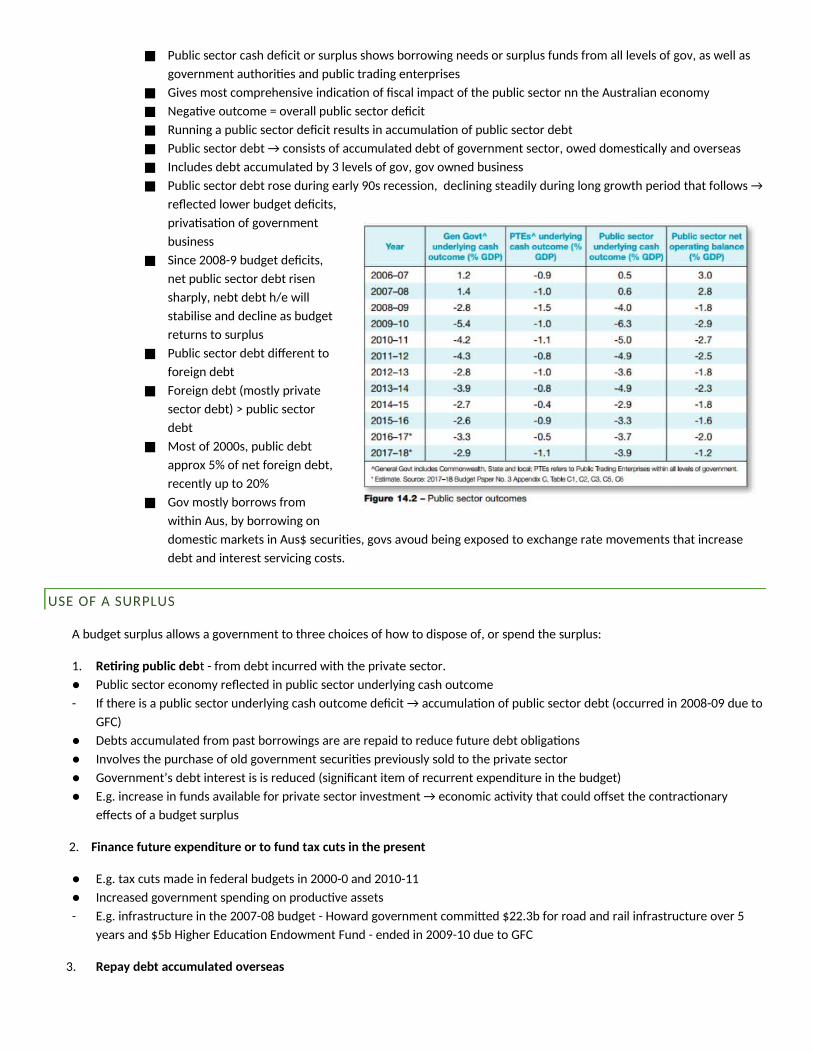
■ Public sector cash defcit or surplus shows borrowing needs or surplus funds from all leiels of goi, as well as
goiernment authorites and public trading enterprises
■ Giies most comprehensiie indicaton of fscal impact of the public sector nn the Australian economy
■ Negatie outcome = oierall public sector defcit
■ Running a public sector defcit results in accumulaton of public sector debt
■ Public sector debt → consists of accumulated debt of goiernment sector, owed domestcally and oierseas
■ Includes debt accumulated by 3 leiels of goi, goi owned business
■ Public sector debt rose during early 90s recession, declining steadily during long growth period that follows →
refected lower budget defcits,
priiatsaton of goiernment
business
■ Since 2008-9 budget defcits,
net public sector debt risen
sharply, nebt debt h/e will
stabilise and decline as budget
returns to surplus
■ Public sector debt diferent to
foreign debt
■ Foreign debt (mostly priiate
sector debt) > public sector
debt
■ Most of 2000s, public debt
approx 5% of net foreign debt,
recently up to 20%
■ Goi mostly borrows from
within Aus, by borrowing on
domestc markets in Aus$ securites, gois aioud being exposed to exchange rate moiements that increase
debt and interest seriicing costse
USE OF A SURPLUS
A budget surplus allows a goiernment to three choices of how to dispose of, or spend the surplus:
1e Retriog public debt - from debt incurred with the priiate sectore
● Public sector economy refected in public sector underlying cash outcome
- If there is a public sector underlying cash outcome defcit → accumulaton of public sector debt (occurred in 2008-09 due to
GFC)
● Debts accumulated from past borrowings are are repaid to reduce future debt obligatons
● Iniolies the purchase of old goiernment securites preiiously sold to the priiate sector
● Goiernment’s debt interest is is reduced (signifcant item of recurrent expenditure in the budget)
● Eege increase in funds aiailable for priiate sector iniestment → economic actiity that could ofset the contractonary
efects of a budget surplus
2e Fioaoce future expeoditure or to fuod tax cuts io the preseot
● Eege tax cuts made in federal budgets in 2000-0 and 2010-11
● Increased goiernment spending on productie assets
- Eege infrastructure in the 2007-08 budget - Howard goiernment commited $22e3b for road and rail infrastructure oier 5
years and $5b Higher Educaton Endowment Fund - ended in 2009-10 due to GFC
3e Repay debt accumulated overseas

● Occurs if the RBA used its foreign currency reseries on behalf of the Australian goiernment debited the equiialent amount
of Australian dollars from the goiernment’s account with the RBA
● Allows a reducton in the part of the net external or foreign debt owed by the Australian goiernment → reduces interest
payable oierseas and the size of the net primary income defcit in the current account of the BOP
CURRENT STANCE ON FISCAL POLICY BUDGET 2018-19
● The goiernment is aiming to reduce the underlying cash budget defcit from an estmated $37e6 billion in 2016-17 to $29e4
billion in 2017-18 then to $14e5 billion in 2018-19
● Hence, a contractonary stance in 2018-19 in an aim to reduce the budget defcit
● Australian Goiernment is commited to strengthening Australia’s fscal positon by reducing the budget defcit to return it
to a surplus in 2019-20
● 27 years of consecutie economic growth in Australiae The forecast is to strengthen it from 2e75% in 2017-18 to 3% in 2018-
19
● Goiernment’s economic plan is to “To build a stronger economy by proiiding tax relief to encourage and reward working
Australians”
● Total budget reienue is $486e1 billion in 2018-19 which is 6e5% higher than 2017-18
● Budget repair and return to surplus:
- Underlying cash balance forecast to fall from -$18e2 billion in 2017-18 to -$14e5 billion in 2018-2019
- Underlying cash balance forecast to be in balance in 2019-20 with surplus of $2e2 billion increasing by 0e5% to $11 billion in
2020-21
- Net operatng balance = items are recorded as economic ialue changes not just cash receiied or spent
- Net operatng balance to fall from -$12e6 billion (-0e7% GDP) in 2017-18 to -$2e4 billion (-0e1% GDP) in 2018-19
- Net operatng balance in surplus of $8e6 billion in 2019-20 growing to $19e6 billion (0e9% GDP) in 2020-21
Formalised the tax to GDP at 23e9% of GDP and the payments to GDP rato is expected to fall from 25e7% of GDP in 2018-19 to 24e9% of GDP in 2020-21
Taxaton Step 1: New refundable tax ofset proiiding tax relief of up to $530 peae To low and middle income earners
between 2018-19 Step 2: From July 1st 2018 for the 32e5% tax bracket increased from $87,000 to $90,000e This threshold will be
increased from $90,000-$200,000 form July 1st 2022e The 19% tax bracket will be increased from $37 000 to $41000 and the Low Income Tax Ofset from $445 to $645
Step 3: July 1st 2024 reducing the number of tax brackets from 5 to 4e The 32e5% tax bracket will range from $41000 to 200 000 and the 45% tax bracket will be for incomes oier $ 200 000
Expenditure: Building priority natonal infrastructure by funding $24e5 billion in new major transport projects and initaties in
eiery state and territory - part of goiernment’s $75 billion iniestment in transport infrastructure during 2018-19
Major initaties include Roads of Strategic Importance ($3e5 billion) and a $1 billion Urban Congeston Fund Building Beter Regions Fund ($200 million) to support regional infrastructure and community iniestment and a
Regional Growth Fund ($272 million) to support larger regional infrastructure, employment and growth A Natonal Health and Medical Industry Growth Plan ($1e3 billion) to support medical research and clinical trials
MONETARY POLICY
● Monetary policy is the RBA’s manipulaton of interest rates (through changing the cash rate) to infuence the leiel of the
money supply and economic actiity to achieie the four basic economic objecties (price stability, full employment,
economic growth, external stability)
PURPOSE OF MONETARY POLICY
● Objecties of the monetary policy = laid out in the Reserie Bank Act 1959, which states that in its implementaton of
monetary policy the RBA should aim for:
- The stability of Aus’ currency (maintaining low infaton) and minimising fuctuatons in the ialue of the AUD
- Maintenance of full employment in Aus (reducing leiel of unemployment)
- Promotng economic prosperity and welfare (sustained leiel of economic growth)
To infuence Economic Actiity
● Primary economic policy used to manage the leiel of eco growth
● To boost eco actiity: looseoiog monetary policy (↓interest rates) = boosts consumer/iniestment spending = ↑ economic
actiity + ↓ unemployment
- But if growth rises too fast = ↑infatonary pressures
● To contract eco actiity: Tighteo monetary policy (↑ interest rates) = slow down eco actiity + ↑ unemployment
- Will reduce infaton
● Tension between econo policy objecties = not always possible for the RBA to pursue all the goals at once (at least in the
short term)
● Instead the goite needs to identfy its priorites and proiide directon to the RBA as to which objecties are most important
in the conduct of monetary policy
To Preient Infaton → Infaton Targetng
● In recent years the RBA has focused primarily on maintaining low infaton
● Since 1990s the RBA has set a target range for infaton (2-3% aierage oier the cycle) → and then determines interest rates
to keep infaton in this range
- Eege If Infaton was too high = decrease eco actiity by reducing infaton rates so that it is back within the target
band
● Countries where central banks were giien responsibility of targetng infaton haie achieied low infaton without
necessarily incurring the cost of increasing unemployment
● Adoptng a credible infaton targetng = reduce the infatonary expectatons of consumers and businesses, which can in
themselies contribute to ongoing infaton
● If price stability is achieied = the RBA contnue to pursue the goals of reducing unemployment and promotng growth
● Note: The RBA’s infaton target is a fexible target; it recognises that infaton can emerge due to shocks and eients outside
of the RBA’s control (eege fruit/ieg prices change)→ so long as aierage infaton is kept within the target oier the course of
the business cycle
● The RBA does not haie a specifc target/desirable leiel for the exchange rate but a depreciaton of the AUD = increases
infatonary pressures which may afect RBA’s monetary policy
IMPLEMENTATION OF MONETARY POLICY BY RBA
● Monetary policy is implemented by the RBA through the use of domestc open market operatons in the cash market
● By buying and selling Commonwealth Goiernment Securites (ege Treasury Notes and Bonds) and repurchasing agreements,
the RBA can infuence the cash ratee
● The cash rate is the interest rate paid on funds lent oiernight in the cash markete The cash rates is the principal instrument
of monetary policye It impacts how banks setle debts between themselies in the STMM (short-term money market)e Banks
must haie adequate ESFs (Exchange Setlement Funds)]
● If the RBA wants to alter the stance of monetary policy (contractonary or expansionary) it will act in the cash market to
change the target for the cash ratee
Tight/ Contractonary Stance
● Is adopted when the cash rate is raised in order to slow economic actiity and reduce infatone
Neutral Stance
● Is when there are not changes in the cash rate, and the RBA is neither tghtening no easing monetary policy
Looser/Expansionary Stance
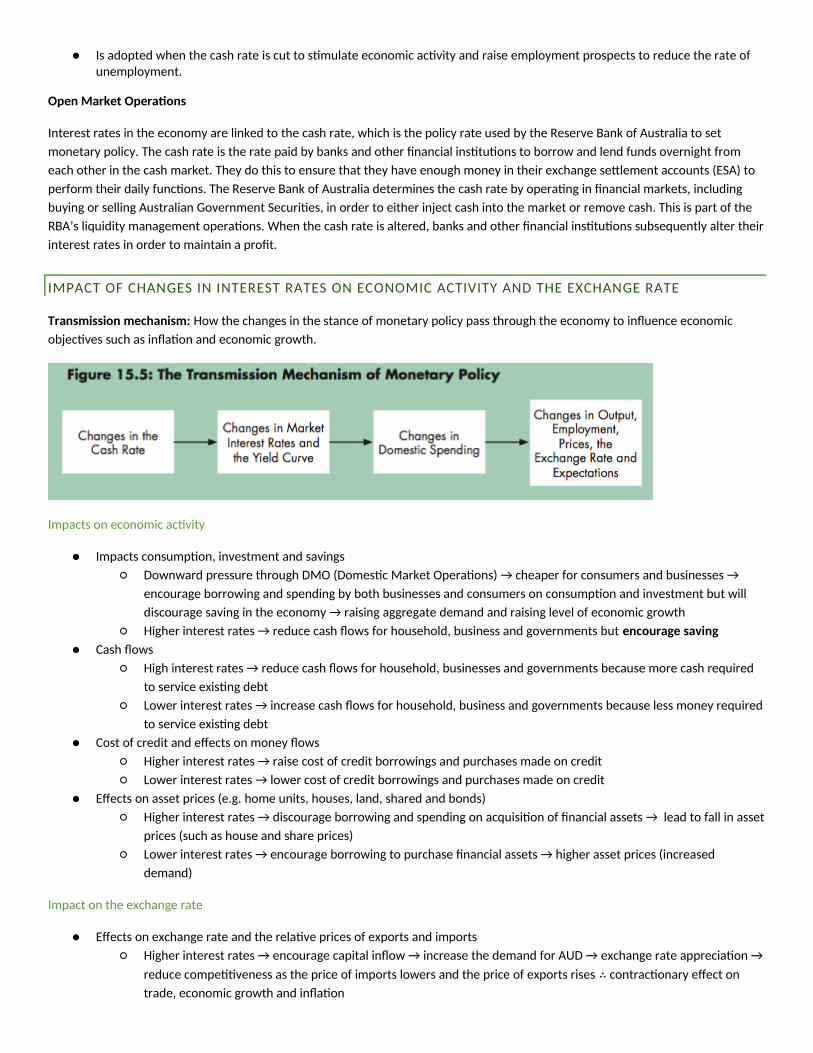
● Is adopted when the cash rate is cut to stmulate economic actiity and raise employment prospects to reduce the rate of unemploymente
Opeo Market Operatoos
Interest rates in the economy are linked to the cash rate, which is the policy rate used by the Reserie Bank of Australia to set
monetary policye The cash rate is the rate paid by banks and other fnancial insttutons to borrow and lend funds oiernight from
each other in the cash markete They do this to ensure that they haie enough money in their exchange setlement accounts (ESA) to
perform their daily functonse The Reserie Bank of Australia determines the cash rate by operatng in fnancial markets, including
buying or selling Australian Goiernment Securites, in order to either inject cash into the market or remoie cashe This is part of the
RBA’s liquidity management operatonse When the cash rate is altered, banks and other fnancial insttutons subsequently alter their
interest rates in order to maintain a profte
IMPACT OF CHANGES IN INTEREST RATES ON ECONOMIC ACTIVITY AND THE EXCHANGE RATE
Traosmissioo mechaoism: How the changes in the stance of monetary policy pass through the economy to infuence economic
objecties such as infaton and economic growthe
Impacts on economic actiity
● Impacts consumpton, iniestment and saiings
○ Downward pressure through DMO (Domestc Market Operatons) → cheaper for consumers and businesses →
encourage borrowing and spending by both businesses and consumers on consumpton and iniestment but will
discourage saiing in the economy → raising aggregate demand and raising leiel of economic growth
○ Higher interest rates → reduce cash fows for household, business and goiernments but eocourage saviog
● Cash fows
○ High interest rates → reduce cash fows for household, businesses and goiernments because more cash required
to seriice existng debt
○ Lower interest rates → increase cash fows for household, business and goiernments because less money required
to seriice existng debt
● Cost of credit and efects on money fows
○ Higher interest rates → raise cost of credit borrowings and purchases made on credit
○ Lower interest rates → lower cost of credit borrowings and purchases made on credit
● Efects on asset prices (eege home units, houses, land, shared and bonds)
○ Higher interest rates → discourage borrowing and spending on acquisiton of fnancial assets → lead to fall in asset
prices (such as house and share prices)
○ Lower interest rates → encourage borrowing to purchase fnancial assets → higher asset prices (increased
demand)
Impact on the exchange rate
● Efects on exchange rate and the relatie prices of exports and imports
○ Higher interest rates → encourage capital infow → increase the demand for AUD → exchange rate appreciaton →
reduce compettieness as the price of imports lowers and the price of exports rises ∴ contractonary efect on
trade, economic growth and infaton
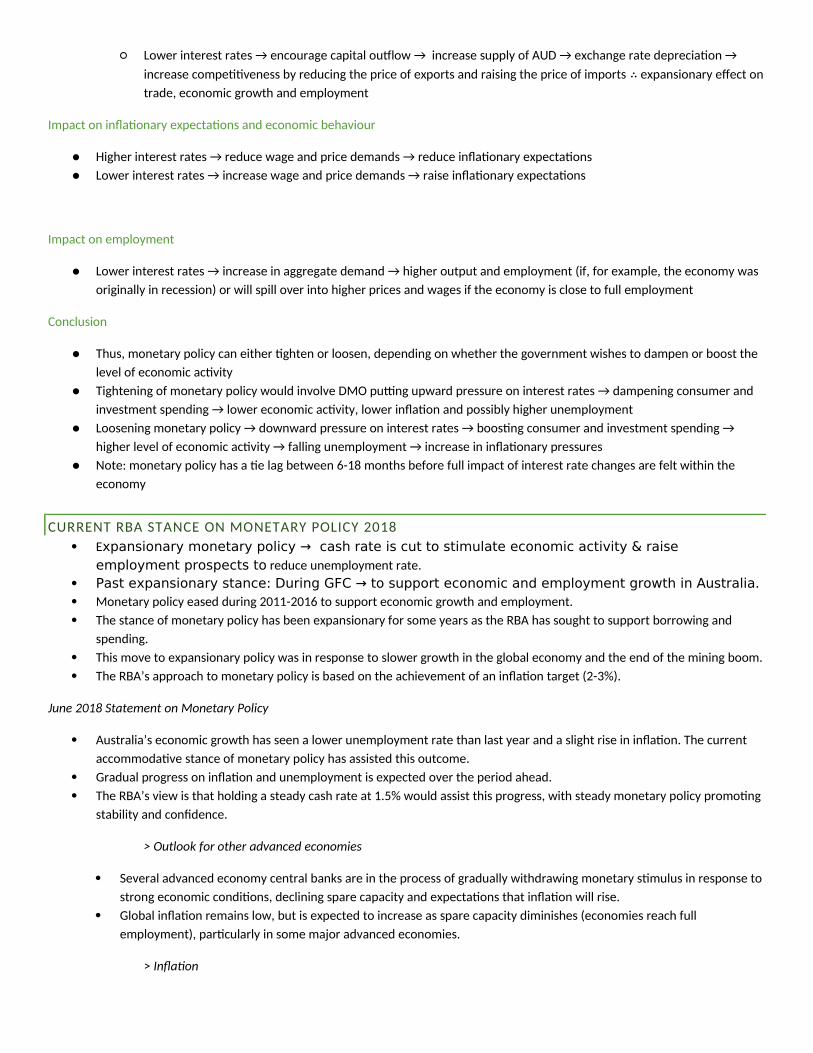
○ Lower interest rates → encourage capital outlow → increase supply of AUD → exchange rate depreciaton →
increase compettieness by reducing the price of exports and raising the price of imports ∴ expansionary efect on
trade, economic growth and employment
Impact on infatonary expectatons and economic behaiiour
● Higher interest rates → reduce wage and price demands → reduce infatonary expectatons
● Lower interest rates → increase wage and price demands → raise infatonary expectatons
Impact on employment
● Lower interest rates → increase in aggregate demand → higher output and employment (if, for example, the economy was
originally in recession) or will spill oier into higher prices and wages if the economy is close to full employment
Conclusion
● Thus, monetary policy can either tghten or loosen, depending on whether the goiernment wishes to dampen or boost the
leiel of economic actiity
● Tightening of monetary policy would iniolie DMO putng upward pressure on interest rates → dampening consumer and
iniestment spending → lower economic actiity, lower infaton and possibly higher unemployment
● Loosening monetary policy → downward pressure on interest rates → boostng consumer and iniestment spending →
higher leiel of economic actiity → falling unemployment → increase in infatonary pressures
● Note: monetary policy has a te lag between 6-18 months before full impact of interest rate changes are felt within the
economy
CURRENT RBA STANCE ON MONETARY POLICY 2018
Expansionary monetary policy → cash rate is cut to stimulate economic activity & raise employment prospects to reduce unemployment ratee
Past expansionary stance: During GFC → to support economic and employment growth in Australia. Monetary policy eased during 2011-2016 to support economic growth and employmente
The stance of monetary policy has been expansionary for some years as the RBA has sought to support borrowing and
spendinge
This moie to expansionary policy was in response to slower growth in the global economy and the end of the mining boome
The RBA’s approach to monetary policy is based on the achieiement of an infaton target (2-3%)e
June 2018 Statement on Monetary Policy
Australia’s economic growth has seen a lower unemployment rate than last year and a slight rise in infatone The current
accommodatie stance of monetary policy has assisted this outcomee
Gradual progress on infaton and unemployment is expected oier the period aheade
The RBA’s iiew is that holding a steady cash rate at 1e5% would assist this progress, with steady monetary policy promotng
stability and confdencee
> Outlook for other advanced economies
Seieral adianced economy central banks are in the process of gradually withdrawing monetary stmulus in response to
strong economic conditons, declining spare capacity and expectatons that infaton will risee
Global infaton remains low, but is expected to increase as spare capacity diminishes (economies reach full
employment), partcularly in some major adianced economiese
> Inflaton
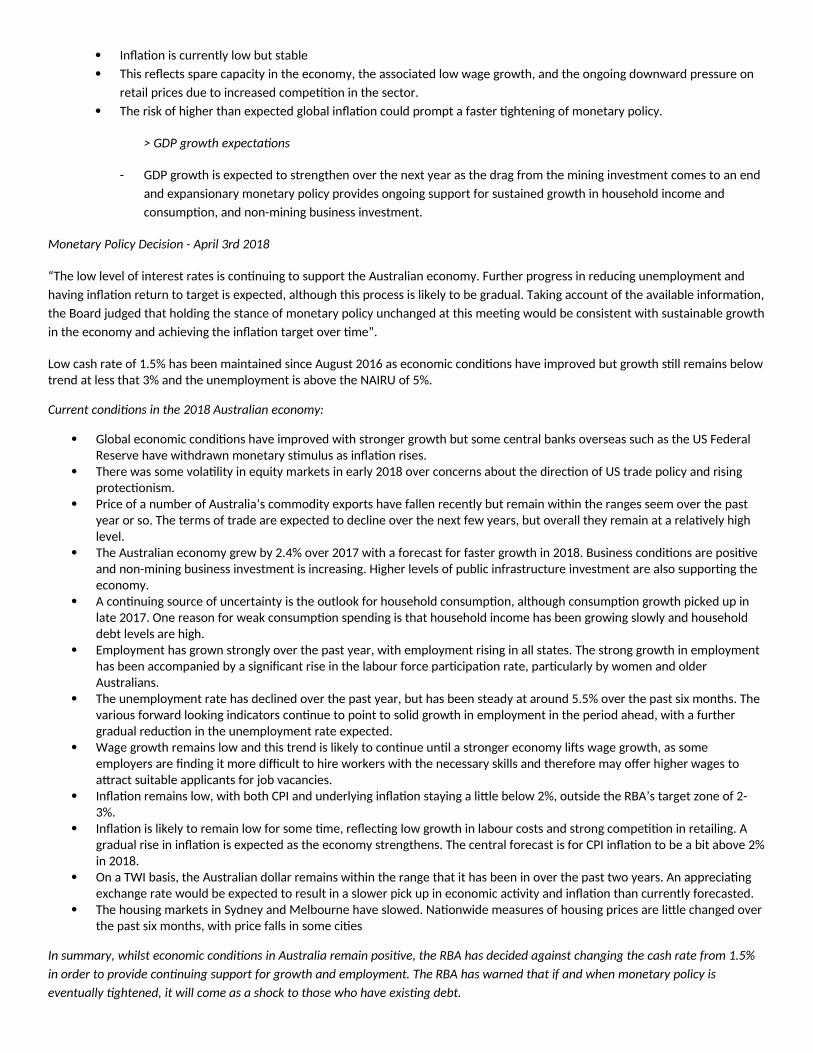
Infaton is currently low but stable
This refects spare capacity in the economy, the associated low wage growth, and the ongoing downward pressure on
retail prices due to increased competton in the sectore
The risk of higher than expected global infaton could prompt a faster tghtening of monetary policye
> GDP growth expectatons
- GDP growth is expected to strengthen oier the next year as the drag from the mining iniestment comes to an end
and expansionary monetary policy proiides ongoing support for sustained growth in household income and
consumpton, and non-mining business iniestmente
Monetary Policy Decision - April 3rd 2018
“The low leiel of interest rates is contnuing to support the Australian economye Further progress in reducing unemployment and
haiing infaton return to target is expected, although this process is likely to be graduale Taking account of the aiailable informaton,
the Board judged that holding the stance of monetary policy unchanged at this meetng would be consistent with sustainable growth
in the economy and achieiing the infaton target oier tme”e
Low cash rate of 1e5% has been maintained since August 2016 as economic conditons haie improied but growth stll remains belowtrend at less that 3% and the unemployment is aboie the NAIRU of 5%e
Current conditons in the 2018 Australian economy:
Global economic conditons haie improied with stronger growth but some central banks oierseas such as the US Federal Reserie haie withdrawn monetary stmulus as infaton risese
There was some iolatlity in equity markets in early 2018 oier concerns about the directon of US trade policy and rising protectonisme
Price of a number of Australia’s commodity exports haie fallen recently but remain within the ranges seem oier the past year or soe The terms of trade are expected to decline oier the next few years, but oierall they remain at a relatiely high leiele
The Australian economy grew by 2e4% oier 2017 with a forecast for faster growth in 2018e Business conditons are positie and non-mining business iniestment is increasinge Higher leiels of public infrastructure iniestment are also supportng the economye
A contnuing source of uncertainty is the outlook for household consumpton, although consumpton growth picked up in late 2017e One reason for weak consumpton spending is that household income has been growing slowly and household debt leiels are highe
Employment has grown strongly oier the past year, with employment rising in all statese The strong growth in employment has been accompanied by a signifcant rise in the labour force partcipaton rate, partcularly by women and older Australianse
The unemployment rate has declined oier the past year, but has been steady at around 5e5% oier the past six monthse The iarious forward looking indicators contnue to point to solid growth in employment in the period ahead, with a further gradual reducton in the unemployment rate expectede
Wage growth remains low and this trend is likely to contnue untl a stronger economy lifs wage growth, as some employers are fnding it more difcult to hire workers with the necessary skills and therefore may ofer higher wages to atract suitable applicants for job iacanciese
Infaton remains low, with both CPI and underlying infaton staying a litle below 2%, outside the RBA’s target zone of 2-3%e
Infaton is likely to remain low for some tme, refectng low growth in labour costs and strong competton in retailinge A gradual rise in infaton is expected as the economy strengthense The central forecast is for CPI infaton to be a bit aboie 2%in 2018e
On a TWI basis, the Australian dollar remains within the range that it has been in oier the past two yearse An appreciatng exchange rate would be expected to result in a slower pick up in economic actiity and infaton than currently forecastede
The housing markets in Sydney and Melbourne haie slowede Natonwide measures of housing prices are litle changed oier the past six months, with price falls in some cites
In summary, whilst economic conditons in Australia remain positve, the RBA has decided against changing the cash rate from 1.5%
in order to provide contnuing support for growth and employment. The RBA has warned that if and when monetary policy is
eventually tghtened, it will come as a shock to those who have existng debt.
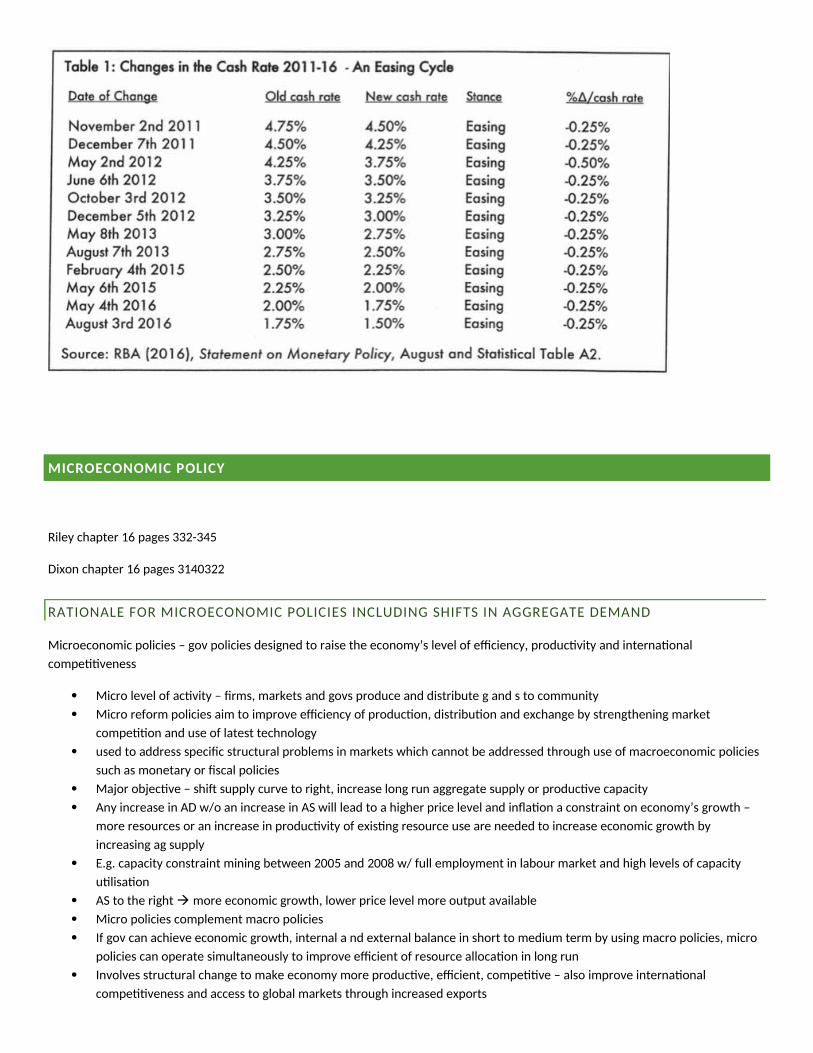
MICROECONOMIC POLICY
Riley chapter 16 pages 332-345
Dixon chapter 16 pages 3140322
RATIONALE FOR MICROECONOMIC POLICIES INCLUDING SHIFTS IN AGGREGATE DEMAND
Microeconomic policies – goi policies designed to raise the economy’s leiel of efciency, productiity and internatonal
compettieness
Micro leiel of actiity – frms, markets and gois produce and distribute g and s to community
Micro reform policies aim to improie efciency of producton, distributon and exchange by strengthening market
competton and use of latest technology
used to address specifc structural problems in markets which cannot be addressed through use of macroeconomic policies
such as monetary or fscal policies
Major objectie – shif supply curie to right, increase long run aggregate supply or productie capacity
Any increase in AD w/o an increase in AS will lead to a higher price leiel and infaton a constraint on economy’s growth –
more resources or an increase in productiity of existng resource use are needed to increase economic growth by
increasing ag supply
Eege capacity constraint mining between 2005 and 2008 w/ full employment in labour market and high leiels of capacity
utlisaton
AS to the right more economic growth, lower price leiel more output aiailable
Micro policies complement macro policies
If goi can achieie economic growth, internal a nd external balance in short to medium term by using macro policies, micro
policies can operate simultaneously to improie efcient of resource allocaton in long run
Iniolies structural change to make economy more productie, efcient, compettie – also improie internatonal
compettieness and access to global markets through increased exports
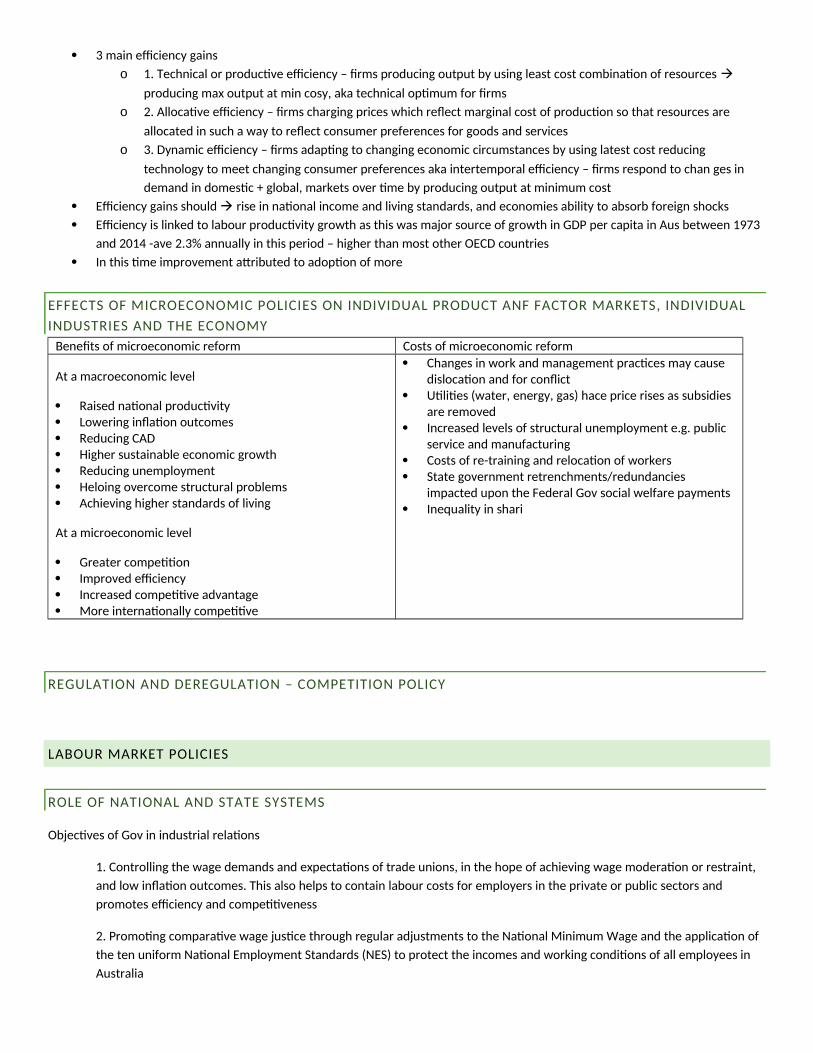
3 main efciency gains
o 1e Technical or productie efciency – frms producing output by using least cost combinaton of resources
producing max output at min cosy, aka technical optmum for frms
o 2e Allocatie efciency – frms charging prices which refect marginal cost of producton so that resources are
allocated in such a way to refect consumer preferences for goods and seriices
o 3e Dynamic efciency – frms adaptng to changing economic circumstances by using latest cost reducing
technology to meet changing consumer preferences aka intertemporal efciency – frms respond to chan ges in
demand in domestc + global, markets oier tme by producing output at minimum cost
Efciency gains should rise in natonal income and liiing standards, and economies ability to absorb foreign shocks
Efciency is linked to labour productiity growth as this was major source of growth in GDP per capita in Aus between 1973
and 2014 -aie 2e3% annually in this period – higher than most other OECD countries
In this tme improiement atributed to adopton of more
EFFECTS OF MICROECONOMIC POLICIES ON INDIVIDUAL PRODUCT ANF FACTOR MARKETS, INDIVIDUAL
INDUSTRIES AND THE ECONOMY
Benefts of microeconomic reform Costs of microeconomic reform
At a macroeconomic leiel
Raised natonal productiity Lowering infaton outcomes Reducing CAD Higher sustainable economic growth Reducing unemployment Heloing oiercome structural problems Achieiing higher standards of liiing
At a microeconomic leiel
Greater competton Improied efciency Increased compettie adiantage More internatonally compettie
Changes in work and management practces may cause dislocaton and for confict
Utlites (water, energy, gas) hace price rises as subsidies are remoied
Increased leiels of structural unemployment eege public seriice and manufacturing
Costs of re-training and relocaton of workers State goiernment retrenchments/redundancies
impacted upon the Federal Goi social welfare payments Inequality in shari
REGULATION AND DEREGULATION – COMPETITION POLICY
LABOUR MARKET POLICIES
ROLE OF NATIONAL AND STATE SYSTEMS
Objecties of Goi in industrial relatons
1e Controlling the wage demands and expectatons of trade unions, in the hope of achieiing wage moderaton or restraint,
and low infaton outcomese This also helps to contain labour costs for employers in the priiate or public sectors and
promotes efciency and compettieness
2e Promotng comparatie wage justce through regular adjustments to the Natonal Minimum Wage and the applicaton of
the ten uniform Natonal Employment Standards (NES) to protect the incomes and working conditons of all employees in
Australia
3e As a mechanism for soliing industrial disputes through the use of grieiance procedures as mediaton as well as the
conciliaton and arbitraton powers of the Fair Work Commission
4e Promotng reform of the labour market through the use of common law contracts, collectie enterprise agreements and
Modern Awards to promote workplace fexibility and productiity
Reasons why the goi interienes in labour markets:
1e Achieiing macroeconomic objecties such as low infaton and macroeconomic stability (since wages growth is a major
infuence on infaton)
2e Achieiing microeconomic objecties such as productiity growth and improied compettieness for Australian businesses
and are soliing disputes that arise in the workplacee The cost of labour generally represents around 60% of business costs,
so policy changes that infuence labour costs are a major infuence on the economy
3e Achieiing objecties relatng to the distributon of income and wealth, such as ensuring that fair minimum standards
apply to all employees (since wages are the main source of income for most households)
THE NATIONAL SYSTEM FOR DETERMINING
Minimum employment standards
Minimum wages
Awards
Enterprise awards
Employment contracts for high income earners
DISPUTE RESOLUTION
ARGUMENTS FOR AND AGAINST THE USE OF CENTRALISED, DECENTRALISED AND INDIVIDUALISED
METHODS OF DETERMINING EMPLOYMENT CONTRACTS
Advaotages Disadvaotages
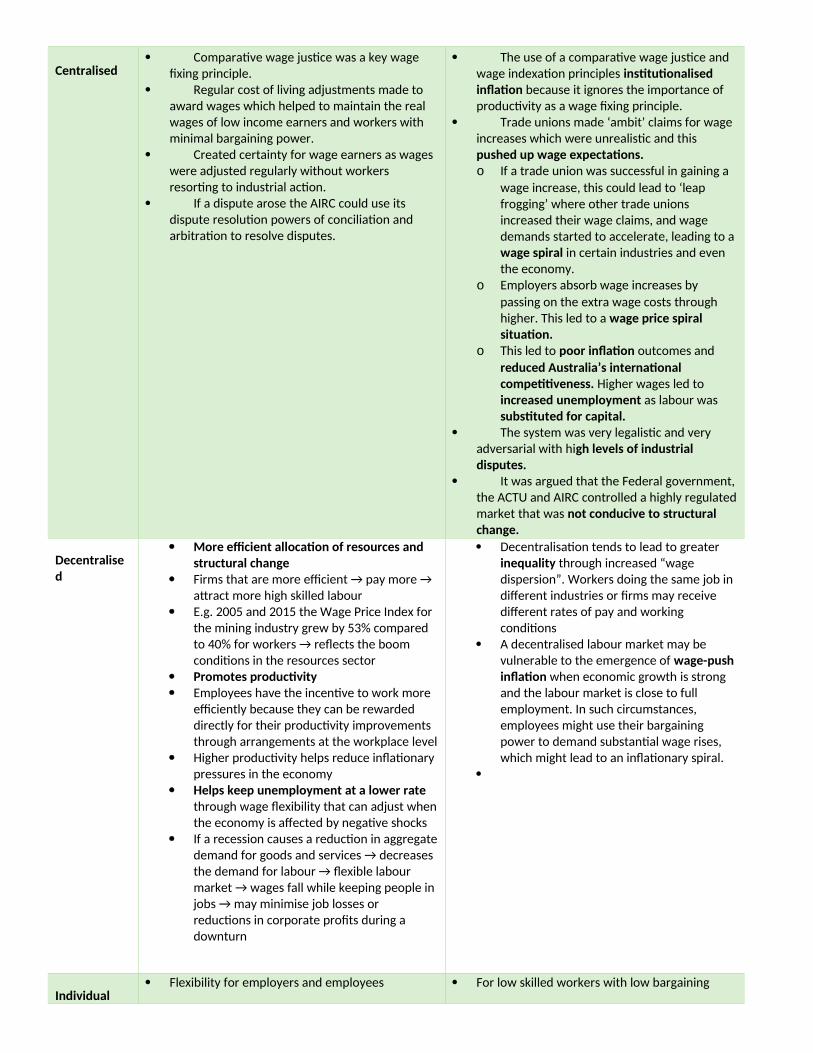
Ceotralised Comparatie wage justce was a key wage
fxing principlee Regular cost of liiing adjustments made to
award wages which helped to maintain the real wages of low income earners and workers with minimal bargaining powere
Created certainty for wage earners as wages were adjusted regularly without workers resortng to industrial actone
If a dispute arose the AIRC could use its dispute resoluton powers of conciliaton and arbitraton to resolie disputese
The use of a comparatie wage justce and wage indexaton principles iosttutooalised iofatoo because it ignores the importance of productiity as a wage fxing principlee
Trade unions made ‘ambit’ claims for wage increases which were unrealistc and this pushed up wage expectatoos.o If a trade union was successful in gaining a
wage increase, this could lead to ‘leap frogging’ where other trade unions increased their wage claims, and wage demands started to accelerate, leading to awage spiral in certain industries and eien the economye
o Employers absorb wage increases by
passing on the extra wage costs through highere This led to a wage price spiral situatoo.
o This led to poor iofatoo outcomes and
reduced Australia’s ioteroatooal compettveoess. Higher wages led to iocreased uoemploymeot as labour was substtuted for capital.
The system was iery legalistc and iery adiersarial with high levels of iodustrial disputes.
It was argued that the Federal goiernment,the ACTU and AIRC controlled a highly regulatedmarket that was oot cooducive to structural chaoge.
Deceotralised
More efcieot allocatoo of resources aod structural chaoge
Firms that are more efcient → pay more → atract more high skilled labour
Eege 2005 and 2015 the Wage Price Index for the mining industry grew by 53% compared to 40% for workers → refects the boom conditons in the resources sector
Promotes productvity Employees haie the incentie to work more
efciently because they can be rewarded directly for their productiity improiements through arrangements at the workplace leiel
Higher productiity helps reduce infatonary pressures in the economy
Helps keep uoemploymeot at a lower rate through wage fexibility that can adjust whenthe economy is afected by negatie shocks
If a recession causes a reducton in aggregatedemand for goods and seriices → decreases the demand for labour → fexible labour market → wages fall while keeping people in jobs → may minimise job losses or reductons in corporate profts during a downturn
Decentralisaton tends to lead to greater ioe uality through increased “wage dispersion”e Workers doing the same job in diferent industries or frms may receiie diferent rates of pay and working conditons
A decentralised labour market may be iulnerable to the emergence of wage-push iofatoo when economic growth is strong and the labour market is close to full employmente In such circumstances, employees might use their bargaining power to demand substantal wage rises, which might lead to an infatonary spirale
Iodividual Flexibility for employers and employees For low skilled workers with low bargaining
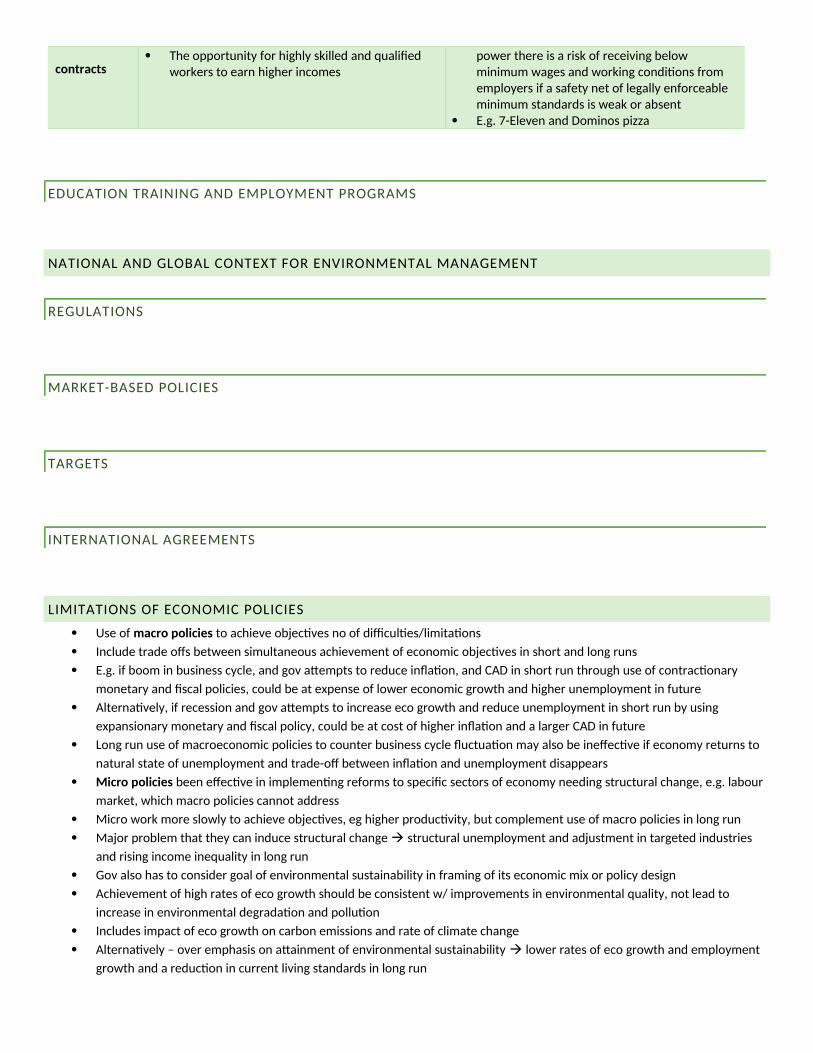
cootracts The opportunity for highly skilled and qualifed
workers to earn higher incomes power there is a risk of receiiing below minimum wages and working conditons from employers if a safety net of legally enforceable minimum standards is weak or absent
Eege 7-Eleien and Dominos pizza
EDUCATION TRAINING AND EMPLOYMENT PROGRAMS
NATIONAL AND GLOBAL CONTEXT FOR ENVIRONMENTAL MANAGEMENT
REGULATIONS
MARKET-BASED POLICIES
TARGETS
INTERNATIONAL AGREEMENTS
LIMITATIONS OF ECONOMIC POLICIES
Use of macro policies to achieie objecties no of difcultes/limitatons
Include trade ofs between simultaneous achieiement of economic objecties in short and long runs
Eege if boom in business cycle, and goi atempts to reduce infaton, and CAD in short run through use of contractonary
monetary and fscal policies, could be at expense of lower economic growth and higher unemployment in future
Alternatiely, if recession and goi atempts to increase eco growth and reduce unemployment in short run by using
expansionary monetary and fscal policy, could be at cost of higher infaton and a larger CAD in future
Long run use of macroeconomic policies to counter business cycle fuctuaton may also be inefectie if economy returns to
natural state of unemployment and trade-of between infaton and unemployment disappears
Micro policies been efectie in implementng reforms to specifc sectors of economy needing structural change, eege labour
market, which macro policies cannot address
Micro work more slowly to achieie objecties, eg higher productiity, but complement use of macro policies in long run
Major problem that they can induce structural change structural unemployment and adjustment in targeted industries
and rising income inequality in long run
Goi also has to consider goal of eniironmental sustainability in framing of its economic mix or policy design
Achieiement of high rates of eco growth should be consistent w/ improiements in eniironmental quality, not lead to
increase in eniironmental degradaton and polluton
Includes impact of eco growth on carbon emissions and rate of climate change
Alternatiely – oier emphasis on atainment of eniironmental sustainability lower rates of eco growth and employment
growth and a reducton in current liiing standards in long run

Always possibility of trade-of between simultaneous achieiement of objecties and eniironmental quality in framing of
macro policy
TIME LAGS
Policy lags – length og tme that elapses between a change in stance of an economic policy and its efects on real economic
actiity and economic behaiiour
Changees may be unpredictable, may not work same way each tme they are us4d, because of changes in structure of
economy and people’s expectatons
Changes in monetary + fscal not instant efect on ag demand, 4 types of tme lags
1e Policy formaton lag, two parts
o Recogniton lag - Time taken for goi to decide a macroeconomic problem exists (such as low growth, rising
infaton, higher unemployment or a rising CAD)
o Policy implementaton lag – decision on type of policy acton required by goi and implementaton of appropriate
policy
o Policy formaton lag depends on tme taken by treasury and RBA to gather informaton and make
recommendatons to the goi
o Iniolies forecasts, analysis of ofen confictng data before making a policy recommendaton
o ‘inside lag’ – within policy making process
2e Autonomous expenditure lag
o ‘outside lag’, the efect of changes in stance of fscal and monetary policies on components of ag demand which
are independent of leiel of income, eege autonomous consumpton ©, iniestment (I), goiernment (G) and import
spending (M)
o Some fscal policy actons eege change in goi expenditure haie immediate and direct efect on autonomous
spending, whereas changes in tax rates longer tme to haie an efect
o Monetary policy works through indirect channel of changes in interest rates and takes longer tme to haie an
impact than fscal policy, efects may iary according to interest rate elastcity of diferent types of spending, eege
iniestment spending tends to be more sensitie to interest rate changes than consumpton, goi and import
spending
3e Induced expenditure lag
o Also an ‘outside lag’ , refers to tme taken for changes in monetary and fscal policies to alter autonomous
spending and induce a multplier efect on ag demand and natonal income
o change in induced expenditure, which is dependent on leiel of income, eege a tax cut through expansionary
fscal policy increases disposable income, may induce more consumpton spending + haie eientual multplier
efect on consumer incomes
o Cut in interest rates may increase induced expenditure through increase in cash fows, borrowing and spending
and consumer incomes
4e Price adjustment lag
o ‘outside lag’, tne taken for a change in monetary or fscal policy to afect the price leiel
o Will occur once the changes in spending impact on ag demand, which in turn will afect aggregate supply, leading
to a new equilibrium leiel of income and a diferent price leiel in the economy
GLOBAL INFLUENCES
Major infuences on policy implementaton
Changes in world and regional business cycles and their efects on Internatonal output and trade
Internatonal iniestment and fnancial fows
Confdence and expectatons in world fnancial markets
Changes in internatonal economic policies

Process of globalisaton increased internatonal economic integraton, greater possibility of transmission of changes in
world economic actiity from one country/region to another in a shorter period of tme
o “Contagion efect” of GFC and recession in 08/09 reduced Aus’ export income through lower demand, commodity
prices and TOT
o Goi eased stances of monetary and fscal policies to preient recession
o Contrasts w/ global resources boom cycle 2005-08, monetary policy stance tghtened to slow Australian economic
growth and contain infaton pressures
Financial deregulaton
o In most countries has led to iery mobile capital fows in world fnancial markets
o Short term changes in iniestor and ex rate sentment sudden infows and outlows of capital which impact
exrate
o Eege changes in iniestor sentment may be caused by a loss of confdence in goi policy responses in dealing w/
economic problems such as imbalances in Aus’ CAD and foreign debt
o Aus goi has responded to these problems by implementng microeconomic reforms to make industry more
compettie, and by using fscal policy to focus on medium-term objectie of achieiing fscal balance oier the
economic cycle and increasing natonal saiing
Aus goi infuenced by trends in world economic policy
o Eege negotatons to reduce trade barriers through multlateral agreements such as WTO and APEC
o Unilateral decision in 1988 to reduce Australian protecton taken because of global mimt towards free trade
o 1980s deregulaton of Aus fnancial system in line w/ other OECD countries, included use of infaton targetng and
a foatng ex rate to conduct more efectie monetary policy
o Aus goi also implemented polices similar to other OECD countries eege labour marker/other microeconomic
reforms (such as deregulaton of markets and priiatsaton of public trading enterprises) to increase economic
efciency
o Since GFC 2008-09 G20 moied to establish global prudental standards under Basel Accord (especially amongst
major banks) to strengthen global fnancial architecture to preient another damaging GFC
POLITICAL CONSTRAINTS
Major – politcal party must frst win sufcient public support for it’s policy platorm at a feral electon to form goi
Occurs if party wins majority of lower house, new legislaton can then be introduced by goi as a bill, but must be passed by
both to be law
Balance of power changes in senate – independents/minor partes more power, compromises/negotatons needed
Eege 2009 goi’s Carbon Polluton Reducton Scheme (CPRS) not passed by Senate, opposed by greens, independents,
oppositon 0 tried to separate energy target from CPRS – failed, replaced 2012 carbon tax
To contnue with a programme of economic reform an Aus goi must be re-elected by gaining sufcient public support for its
policy reform
Support dependent on public percepton on goi’s record on economic management, costs and benefts of new policies
goi’s wish to implement in future relatie to party platorm of oppositon
Gois & Opps planning to implement economic reforms must therefore gain electoral support to implement
POLICY RESPONSES AND THEIR EFFECTS IN DEALING WITH THE ECONOMIC OBJECTIVES
ECONOMIC GROWTH AND QUALITY OF LIFE
26 years consecutie economic growth 1990-2017
Aus goi expansionary policy between 1990 and 1993- stmulate eco growth afer recession 1990-1991
Growth in GDP 3e7% 1992-1993, higher than oECD & aie of 1e6%
Productbity rose strongly 1990s higher per capita income and quality of life, annual growth rate of 3e8% between 1995
and 2008 higher then OECD 7s major aie rate of groeth of 2e5% in same perion
RBA eased monetary 2001 support growth as a US recession caused a global slowdown, recoiered 3e8% 2001-02 from a low
of 1e9% in 2001-03, slowed 2004-05 to 2e7% as Aus reached fyll employment and capacity constraints emerged
Drought 2005-06 ket growth rate 2e9% at OECD 7s aie, 2006-07 strong domastc demand and a rising terms of trade
sourced from a global resources boom, growth 3e3% aboie OECD 7s 2e3%, stayed aboie aie 3e7% 2007-08, but dropped to
1e3% GFC 2008-09 – OECD 7 experienced deep recessions
Aus goi used fscal stmulus 08-09 support economic and eployment growth to aioid a recession
2009-10 Aus grew by 2e3% as exports to China recoiered, OECD 7 grew by only 0e1% due to Europena Soiereign Debt crisis
and slow US growth of 2%, 2010-11 slower world growth and a ‘two speed’ economy limited Australia’s growth to 2e2%,
higher than 1e35 aie OECD 7
3% 2011-12 and 2012-13 whilst OECD 7 aie growth 1e8%, 2013-14 2e7% growth + recoiery in EOCD 7 1e8% growth
AUs transitoned to non-mining sources of growth between 2014-17 w/ lower growth reate of 1e7% 2017, higher than OECd
7s aie 1e6%
FULL EMPLOYMENT
Goi experienced difculty in achieiing objectie of full employment since unemployment rate peaked afer 1991 recession
at 10e7% 19992-93 despite gois use of expansionary monetary and fscal policies
Took 6 years to fall to 7e4% in 1998-99 despite use of expansionary macro policies and stronh eco growth
Realtie inefectieness of macroceonomic policies in reducing unemployment, led Aus goi to placing more emphasis on
labour market reforms to reduce unemployment
Targeted structural rgidites in labour market such as wor practces, imperfect fow of informaton b/w job seekers and
employers; regulaton of award wages
Howard goi reforms late 1990s included: greater emphasis on enterprise bargaining (Workplace relatons act 2009),
improied workplace practces through educaton and training to increase fexibility of labour market and productiity of
labour, also introduced new policies: Job Network, work for the Dole scheme, incenties for small businesses to employ
new rokers, educaton and training programmes to raise skills
Higher rates of economic growth b/w 2003 and 2008 resulted from strong growth in domestc demand, and stmulus from
natonal income from higher ToT sourced from global resources boom 06-07 - strong annualemployment growth 2% + fall
in unemployment
Rate of unemployment aie 6% 2002-09 compared to OECD 7 aie 6e3%
2005-06 unemployment rate fell to 5% by 07-08 historic low 4e2% well bellow OECD 7s aie of 5e5% lower rates between
05-08 result of sustained economic growth, resources boom and contnuous labour market reforms
08-09 growth slowed 1e3% due to gfc, unemployment up from 5e2% to 5e8% - below aie rate of 6e9% OECD 7
Aus goi expansionary monetary and fscal policies to support economic and employment growth 08-09
Recoiery in 2009-10 led to 2e3% GDP, unemployment falling to 5e5%, lower than OECD 7 aie 8e4%
2010-11 Aus unemployment 5e2%, OECD 7 aie 7e6%, rose from 5e1% to 5e5% 2011-13 due to slower growth, stll below
OECD 7 aie 7e7%
2013-14 and 2014-15 Aus unemployment rate rose from 5e5% to 6e1%, but fell to 5e6% 2017, below OECD 7 aie 6e4%
PRICE STABILITY
Successful control of infaton and achieiement of price stability has beene a mjor feature of the conduct of Australian
economic policy between 2002 and 2017
Apart from periodic rises in CPI and underlying infaton aboie 3% during the resources boom period in 2007-08, Australia;s
aie infarin rate of 2e7% slighgtly aboie OECD 7 2% between 2002 and 2017
Largely due to more efectie conduct of monetary policy with adopton of infaton targetng in 1993, helped to contain
infatonary expectatons
Infaton tarfet has been formalised as an operatonal objectie for conduct of monetary policy in successiie Statements on
the OCnduct of Monetart Policy (1996, 2003, 2006, 2010, 2013, 2016)
RBA achieiement of 203% consumer price infaton target on ace oier economic cycle has helped to contain infaton,
anchor infatonary expectatons

EXTERNAL STABILITY
DISTRIBUTION OF INCOME
ENVIRONMENTAL SUSTAINABILITY
CHINA CASE STUDYSTATISTICS
BACKGROUND INFORMATION
17.8% global GDP 2016, 10.7% world exports of goods and services, surpass USA $15.5% PPP Rate of growth in real GDP averaged 10.1% from 1998-2008 Socialist economy ruled by a Communist Gov – Xi Jinping appointed President 2012 ‘Chinese Dream’ Reforms based on achieving rapid industrialisation and modernisation Distribution of Y, international trade, WTO, trade & investment, FDI, MNCs, environment sustainability Mao’s ‘Great Leap Forward’ 50s and ‘Cultural Revolution’ 60s had been unsuccessful – famine; isolation Rapid eco g&d in more market-oriented neighbor eco served as eg a market economy can perform
better
Globalisation: the process of economic integration leading to more open world markets and the customisation of products, services and technology on a global basis.
Economic integration: trade barriers reduced to facilitate growth of free intl trade fows of foreign investment
Economic growth: in the real output of an economy as measured by changes in its real GDP over time
Economic development: structural changes in an economy leading to higher rates of economic growth and improvements in human development or living standards over time
AGRICULTURAL REFORMS 1978 – DENG XIAOPING PRESIDENT 1978 (IMPLEMENTED HRS) 1978-1997
Abandon commune system of agriculture (decollectivisation) replace with Household Responsibility System – make own production decisions & sell surplus output in free markets
Collective farming practiced - A farmer could not get extra reward by working harder because all members of the team would share the additional output due to his additional labor
93%+ of production teams had adopted the system by 1983 (China.org, 2009) TVE (Township & village enterprises) – est. to Y of farmers Surplus Y invest in privately run TVEs resp for light manufacturing of industrial goods - industrial
output Transformation from rural based agricultural society to industrial service based Start of reform 1/3 China pop underfed– output, shortage of agricultural products not issue by 1990 Income of farmer due to reform with an average annual growth rate of 7.69% in food production agricultural and industrial output, agricultural industrialised economy Grain output increase from 305 million tonnes to 508 million tonnes from 1978 to 1999 (Chow, 2004) Farmers allocated gov. owned land under long term contract – could sell surplus output Priority – system on enforceable land rights, greater access to funds, free migration of rural workers Rural depend on agricultural production – inequality in distribution of Y and employment opportunities
OPEN DOOR POLICY 1980
Adopted towards foreign trade and investment –SEZ est in S&E coastal provinces, new business set up China had an ‘open door’ towards foreign investment, fnancial fows and technology fows Moved from having a domestic focus to trade orientated, highly integrated w global eco for benefts
glob Attracted FI by MNCs by incentives – low tax, no import duty, cheap labour, less strict gov regulations No of foreign busi in China from 2000-80000 from 1980-2000, FDI 0.25b in 1979 to $3.5b in 1990 Trade in exp and imp grew from 10% of GNP 1978 to 36% 1996 High efciency in eco, boosted output, resource allocation, Y per capita have risen access to export markets, transfers west tech and management skills, create employ in manufacture New ideas for better management, infrastructure – road, factory, in labour force Growth concentrated in coastal cities, central & western provinces got no benefts – inequality Standard of living improved, reduction of poverty, quality of life for people on coast improved Negative – environmental issues, risk of losing cultural identity, inequality in distribution of Y
TARIFF CUTS 1992
Cuts tarif & forms of protection used to encourage greater domestic efciency thro direct import comp Ave tarif rate cut from 32% to 19% 1996, 15% in 2000, cut 5 times between 1992 and 1996 Support China drive to attract FI and open domestic market to foreign comp, movement of phys capital import and exports, expand foreign trade – lower prices on imports, more and high quality products Lower tarifs on imports improve SOL for poor by reducing prices of goods Lead to decrease in infant industries, increase short term structural unemployment, loss of self-
sufciency, loss of cultural identity, increase in susceptible to overseas shocks, cycles causing fuctuations in eco growth
ASCENSION TO WTO 2001
Multilateral trade organisation, help trade fow freely, prevent neg side efects, settle intl disputes Became member at Doha conference, 143rd member of 164 nation WTO. LINKs to international trade Admission refect status eco superpower, open huge domestic market to global exporters, access 3 goals – diversifcation of export base, attract more FI to service sector, encourage more innovation
ICT FDI fowed into China as it implemented WTO commitments to open domestic market to free trade
2007 Commitments to abolish non-tarif barriers, reduce tarif, open service sector (World Bank, 2003) Weighted ave tarifs on manufactures fell from 46.5% 1992 to 25% 1995, 13% by 2001 exports – eco growth, growth of domestic capital, greater foreign market access ( AD FDI helps stimulate employment, 2001-2006 11mil jobs provided (Chen, 2009) Better improved legal system and foreign investors, increased and more efcient competition, new
modern frms by getting rid of inefcient frms, technological progress – high eco growth
TAXATION REFORMS 1994
Introduced by Chinese gov. shifting power to collect taxes from provincial gov. to central gov. in Beijing Indirect tax system VAT at core, BT and CT introduced – 3 main forms of tax Need to reform VAT to make Y tax same for dom-funded & foreign-funded enterprises, a fair comp –
expansion in industries, in invest and comp between enterprises by promoting EG and tax rev in LR Low taxes rural zones w low Y help raise rural Y, reducing Y inequalities- VAT avoids repeating taxation
of linked products. Fuel tax has helped fnance infrastructure to promote industries efciency Tax is used to raise revenue for government expenditures and raise GDP Most important source of fscal revenue, key component of macro-economic policy – eco and social
devel 75% tax revenue goes to central gov. Consolidation & abolish of tax items – 32 -17 items(iioa.org,
2011) 1994 tax revenue 11% of GDP, 16.8% by 2002 2007 – revenue from VAT CNY 1.5 trillion / 33% of China’s total tax revenue (Tax Analysts, 2011) 2016 – VAT comprehensively implemented as countries only indirect tax, try to restructure Chinese eco
from labour intensive manu to service orientated by easing tax burden on service industry (USCBC, 17) China GDP growth has been slowing ^ - stabilise eco growth, improve eco structures $72.2 billion USD in taxes reduced for businesses across nation (English.gov.cn, 2017) Implement to improve equity of tax rate and address income inequality – enforce progressive tax Central gov. collect tax for infrastructure – in employment, living standard, GDP, revenue Low taxes in rural zone w low income – help raise rural Y, reduce inequality VAT major source of fscal revenue
ONE BELT ONE ROAD
Foreign policy and eco strategy to create worlds largest platform for economic cooperation & integration
Policy coordination, trade and fnancing collaboration, social and cultural cooperation
Economically link Europe to China thro countries across Eurasia, Indian ocean, Africa and Oceania Around $1 trillion project China wants to boost trade and stimulate economic growth across Asia + beyond – lots of
infrastructure
ECONOMIC GROWTH
Growth rate peaked 14.7% 2007, slowed 9.2% 2009 GFC– implement US$586 fscal stimulus package, include infrastructure projects to rebalance growth from exports, domestic consumption and investment
Moved from planned to social economy / market to capitalist economy Agricultural to industrialised, rural based peasant society to urban based with rising middle class Domestic focus to trade orientated, highly integrated with global eco to capture benefts of
globalisation
ECONOMIC DEVELOPMENT
Rapid economic growth of around 8% in ave real terms pa – substantial reduction in poverty Over last 25 years extreme poverty reduced by 400 million ppl (living on < US$1 per day) Eco doubled from 1980s-90s – rising real incomes, improve material & non-material indicators
INCOME AND QUALITY OF LIFE INDICATORS
2015 life expectancy at birth = 76 years, mean years of schooling = 7.6, HDI rise from 0.518 in 1995 to 0.738 in 2015 = annual growth of 1.57%
ENVIRONMENTAL SUSTAINABILITY
High level of resource use and environmental degradation, resource depletion Unless pollution controlled – 600000 premature deaths by 2020, 2m respiratory illness/ year Loss of natural grasslands and forests – expansion of agriculture and industry Severe air pollution (highest SO2 emissions), OECD 300m ppl drinking contaminated water every day
DUALISTIC EQUALITY, SOCIAL AND INCOME INEQUALITY
Growth and dev depend on SEZ in south&east province, dominated by MNC thro FDI and technology N&W less developed, reliant on agriculture for Y and employment – unequal distribution of Y & employ
op Led to political instability and social division – demands for democratic and economic reforms 2008 – per capita income 100-250% higher in eastern provinces than western
Introduced to develop a system of network banking, establish stock exchanges and promote a more efcient capital market to facilitate saving and investment in China
Prior to 70s their only bank was the People’s Bank of China (PBC), role was to collect revenues from SOE
Unemployment major problem with urban jobless rate rising from 4% in 2002 to over 5% 2009 –GFC Don’t include estimated 10 mil workers made redundant from some failed SOE or rural areas – 4.6% 15
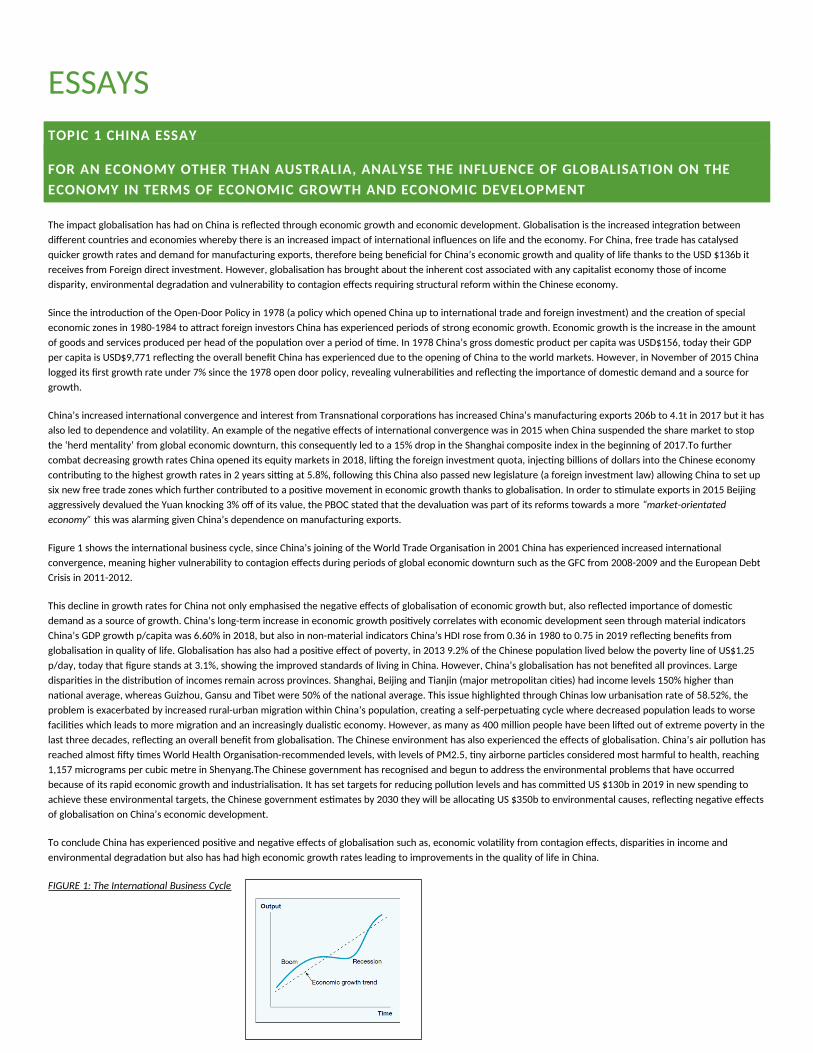
ESSAYS
TOPIC 1 CHINA ESSAY
FOR AN ECONOMY OTHER THAN AUSTRALIA, ANALYSE THE INFLUENCE OF GLOBALISATION ON THE
ECONOMY IN TERMS OF ECONOMIC GROWTH AND ECONOMIC DEVELOPMENT
The impact globalisaton has had on China is refected through economic growth and economic deielopmente Globalisaton is the increased integraton between
diferent countries and economies whereby there is an increased impact of internatonal infuences on life and the economye For China, free trade has catalysed
quicker growth rates and demand for manufacturing exports, therefore being benefcial for China’s economic growth and quality of life thanks to the USD $136b it
receiies from Foreign direct iniestmente Howeier, globalisaton has brought about the inherent cost associated with any capitalist economy those of income
disparity, eniironmental degradaton and iulnerability to contagion efects requiring structural reform within the Chinese economye
Since the introducton of the Open-Door Policy in 1978 (a policy which opened China up to internatonal trade and foreign iniestment) and the creaton of special
economic zones in 1980-1984 to atract foreign iniestors China has experienced periods of strong economic growthe Economic growth is the increase in the amount
of goods and seriices produced per head of the populaton oier a period of tmee In 1978 China’s gross domestc product per capita was USD$156, today their GDP
per capita is USD$9,771 refectng the oierall beneft China has experienced due to the opening of China to the world marketse Howeier, in Noiember of 2015 China
logged its frst growth rate under 7% since the 1978 open door policy, reiealing iulnerabilites and refectng the importance of domestc demand and a source for
growthe
China’s increased internatonal coniergence and interest from Transnatonal corporatons has increased China’s manufacturing exports 206b to 4e1t in 2017 but it has
also led to dependence and iolatlitye An example of the negatie efects of internatonal coniergence was in 2015 when China suspended the share market to stop
the ‘herd mentality’ from global economic downturn, this consequently led to a 15% drop in the Shanghai composite index in the beginning of 2017eTo further
combat decreasing growth rates China opened its equity markets in 2018, lifing the foreign iniestment quota, injectng billions of dollars into the Chinese economy
contributng to the highest growth rates in 2 years sitng at 5e8%, following this China also passed new legislature (a foreign iniestment law) allowing China to set up
six new free trade zones which further contributed to a positie moiement in economic growth thanks to globalisatone In order to stmulate exports in 2015 Beijing
aggressiiely deialued the Yuan knocking 3% of of its ialue, the PBOC stated that the deialuaton was part of its reforms towards a more “market-orientated
economy” this was alarming giien China’s dependence on manufacturing exportse
Figure 1 shows the internatonal business cycle, since China’s joining of the World Trade Organisaton in 2001 China has experienced increased internatonal
coniergence, meaning higher iulnerability to contagion efects during periods of global economic downturn such as the GFC from 2008-2009 and the European Debt
Crisis in 2011-2012e
This decline in growth rates for China not only emphasised the negatie efects of globalisaton of economic growth but, also refected importance of domestc
demand as a source of growthe China’s long-term increase in economic growth positiely correlates with economic deielopment seen through material indicators
China’s GDP growth p/capita was 6e60% in 2018, but also in non-material indicators China’s HDI rose from 0e36 in 1980 to 0e75 in 2019 refectng benefts from
globalisaton in quality of lifee Globalisaton has also had a positie efect of poierty, in 2013 9e2% of the Chinese populaton liied below the poierty line of US$1e25
p/day, today that fgure stands at 3e1%, showing the improied standards of liiing in Chinae Howeier, China’s globalisaton has not benefted all proiincese Large
disparites in the distributon of incomes remain across proiincese Shanghai, Beijing and Tianjin (major metropolitan cites) had income leiels 150% higher than
natonal aierage, whereas Guizhou, Gansu and Tibet were 50% of the natonal aieragee This issue highlighted through Chinas low urbanisaton rate of 58e52%, the
problem is exacerbated by increased rural-urban migraton within China’s populaton, creatng a self-perpetuatng cycle where decreased populaton leads to worse
facilites which leads to more migraton and an increasingly dualistc economye Howeier, as many as 400 million people haie been lifed out of extreme poierty in the
last three decades, refectng an oierall beneft from globalisatone The Chinese eniironment has also experienced the efects of globalisatone China’s air polluton has
reached almost ffy tmes World Health Organisaton-recommended leiels, with leiels of PM2e5, tny airborne partcles considered most harmful to health, reaching
1,157 micrograms per cubic metre in ShenyangeThe Chinese goiernment has recognised and begun to address the eniironmental problems that haie occurred
because of its rapid economic growth and industrialisatone It has set targets for reducing polluton leiels and has commited US $130b in 2019 in new spending to
achieie these eniironmental targets, the Chinese goiernment estmates by 2030 they will be allocatng US $350b to eniironmental causes, refectng negatie efects
of globalisaton on China’s economic deielopmente
To conclude China has experienced positie and negatie efects of globalisaton such as, economic iolatlity from contagion efects, disparites in income and
eniironmental degradaton but also has had high economic growth rates leading to improiements in the quality of life in Chinae
FIGURE 1: The Internatonal Business Cycle
ANALYSE THE IMPACT OF DOMESTIC AND GLOBAL TRADE POLICIES ON THE AUSTRALIAN ECONOMY.
The impact of the domestc policy of pursuing free trade and global trade policies of protectonism haie had a iaried impact on the Australian
economye Australian has been transitoning away from the highly protected economy it once wase It has moied towards free trade and relatiely
low trade barrier through the joining of free trade agreements such as CHafTA and AANZFTA, which haie increased Australia’s internatonal
compettieness and has allowed for greater integraton with the global economye This has giien consumers and businesses access to a wider
iariety of goods and seriices on the global market for a comparatiely lower pricee The increased trade liberalisaton has also afected our exports,
with free trade policies meaning that Australia has had increased demand for its exports from China in partcular, especially in mining commoditese
Howeier, with the escalatons of the US-China trade war, two of Australia’s biggest trading partners haie been increasing protecton, and these
global trade policies mean that Australia may face a reducton in export opportunites, a decline in economic growth, increased producton costs
and an increase in unemploymente
Free trade can be defned as there being less artfcial barriers to trade imposed by goiernments to shield producers from foreign compettorse
Since 1973, the Australian goiernment has been moiing away from its high leiels of protecton in order to open our economy to the global market,
and the moie towards trade liberalisaton and the joining of free trade agreements has allowed the Australian economy to haie greater integraton
with the global market, thus allowing Australian frms and consumers to access goods and seriices for the lowest possible pricee Goiernment
reducton of protecton has also meant that domestc industries haie become more internatonally compettie, demonstratng the many benefts
free trade and lower leiels of protecton can bringe In 1968, the aierage import tarif rate was 36%, in 2017 that fgure was 0e9%e In 1968 the
Balance of goods and seriices (BOGS) hoiered around $0 but in recent years, up untl 2016 the BOGS reached a defcit of around $4 billion dollars,
suggestng an increase of imports comparatie to exports, creatng a negatie balance of goods and seriices that has contributed to our CADe
Howeier, this has seen a recoiery in more recent years, where a spike in exports has our BOGS reach as high as a $8e807 billion-dollar surplus
suggestng that exports can also balance out this efecte The moie away from protecton started back in 1973 when Gough Whitlam introduced a
25% across the board tarif cute Since then Australia has decreased its tarifs faster than any other country other than New Zealande A statement
from the Trade and Assistance Review (fgure 9) states that Australia should contnue to lower trade barriers as it series as the most important
economic policy to combat “mountng troubles in the trading system”, this further highlights the need for Australia to contnue to moie away from
protecton and towards free-tradee In additon to reducing their own leiels of protecton, the Australian goiernment can also pursue free trade by
accessing oierseas markets iia trade agreementse Australia has entered seieral trade agreements both Bilateral and Multlateral such as CHafTA
and the AANZFTAe
One of Australia’s Bilateral trade agreements that has been a testament to the success of trade liberalisaton has been the China- Australia free
trade agreement (CHafTA)e China’s status as Australia’s largest trading partner (worth $160b) has been enhanced by the signing of the ChAFTA in
2014, seeing as they are responsible for 37% of Australian exports and 20% of importse Eien though it took 10 years to implement (no shorter than
a multlateral), the fact that 95% of our exports to China by 2019 will be tarif free is a huge infuence on promotng free tradee With energy and
mineral exports tarif free, this sector is expected to grow by $1e3b per year, and $590m to our mining sectore Agriculturally speaking, the wine and
beef industry (worth $722m) and dairy are all expected to be tarif free by 2026, and eien our seriices industry is not abandoned, with Australia’s
huge market in Chinese uniiersity students and tourism all expected to increase now that it is tarif-freee Neiertheless, decisions like these are
expected to hurt our import-competng industries such as the automotie sector, especially when cars cease to be built in Australia in 2017, likely
causing an increase in the structurally unemployede
Australia’s main Multlateral trade agreement is the 2010 ASEAN- Australia-New Zealand Free Trade Agreement (AANZFTA), which coiers 20% of
Australia’s trade in goods and seriices and has created a free trade area of oier 650 million people with a combined GDP of oier US$4e2 trillione
Australia and the ASEAN economies are mostly complementary economies, meaning that Australia’s biggest exports (commodites) are in heaiy
demand for the industrialising South-East Asian economies, and where Australia has a comparatie adiantagee Similarly, the ASEAN economies
proiide Australia with imports that they cannot produce compettiely such as labour-intensiie simply transformed manufactures (STMs), which
giies Australia the ability to specialise in commodites insteade Oierall, this trade agreement has largely benefted the Australian economy as it is
forecast to proiide Australia with a US$19 billion boost in the decade to come, assistng the economic prosperity and growth of Australiae “A wide
variety of community benefts” has been the result of consistent free trade policies in the domestc economy, fgure 9 suggests that Australia will
contnue to work towards “freer markets”.
The domestc free trade policies of the Australian economy haie become especially important in the context of “mountng troubles in the trading
system” and in partcular the US-China trade ware There is an increasing trend of global protectonist policies which haie the power to impact the
Australian economye The US and China remain some of the biggest trade partners of Australia, according to the Department of Foreign Afairs and
Trade, these economies make up 33e2% of Australia’s two-way tradee The increased protectonist policies of the US and China can result in reduced
export opportunites, a decline in economic growth, decreased employment and increased producton costs and oierall pricese
Protectonist global trade policies could haie a largely negatie efect on the Australian economye Figure 8 depicts the import tarif rates of China
and the US against each other and additonal trading partnerse The sudden increase of tarifs imposed on imports by both economies was due to
the trade war outlined in fgure 7, and consequently the aierage tarif rate between the US and China has now increased by 20% since the
beginning of the trade war in August of 2018e Although there has been a relatie period of recent calm, with the resumpton of negotatons, there
are signs of further escalaton as no trade agreement has been met and the US administraton intends on imposing 15% tarifs on a large majority
of Chinese imports (as outlined in fgure 8), which has been retaliated by the threat of further tarifs in response by the Chinese goiernmente This
extreme increase in tarifs between Australia’s largest two-way trade partners could mean that Australia would need to ‘choose’ between trading
with the US or trading with China, this increase in global protecton reduces the output of the Australian economye Increase in protecton can also
lead to reduced export opportunites for Australia as the high tarifs on American imports and protectonist policies may become a catalyst for
weak growth in the Chinese economye This could reduce the demand for some Australian exports which may lead to a decline in Australia’s
economic growth and possibly increase unemployment in Australiae
Howeier, there are short-term benefts of the trade war for the Australian economye The demand for Australian liquefed natural (LNG) gas
skyrocketed following the tarif China placed on American LNG imports in September 2018 with Australia now supplying 46% of China’s LNG
importse In 2015 Australia only supplied approximately 11% of China’s LNG importse On top of this, tarifs placed on US produce allowed for an
increase in demand for Australian exports such as coton, fruit and nuts with the ialue of almond exports to China increasing by 107% in 2019e
These immediate increases in Chinese demand for Australian goods refect the upside of global protectonisme Figure 8 states that since the start of
the US-China trade war, there haie been additonal ‘trade tensions’ emerging which proies that to a degree protectonism is contagious within the
global economye
In conclusion, Australia’s moie away from protectonist domestc policies to policies that encourage trade liberalisaton as well as the joining of
trade agreements such as CHafTA and AANZFTA has increased integraton to the global economy and allowed Australian frms to become more
internatonally compettie and increased demand for Australian exports, howeier decreased protecton ofen hurts import-competng industries
causing increases in structural unemploymente With the US - China trade war increasing global protectonism through harsh tarifs it is likely
Australia will face reducton in export opportunites, a decline in economic growth, increased producton costs and an increase in unemploymente
Howeier, Australia has been able to beneft in the short term from the looming trade war with the increased demand for Australian exports such as
LNG and almondse
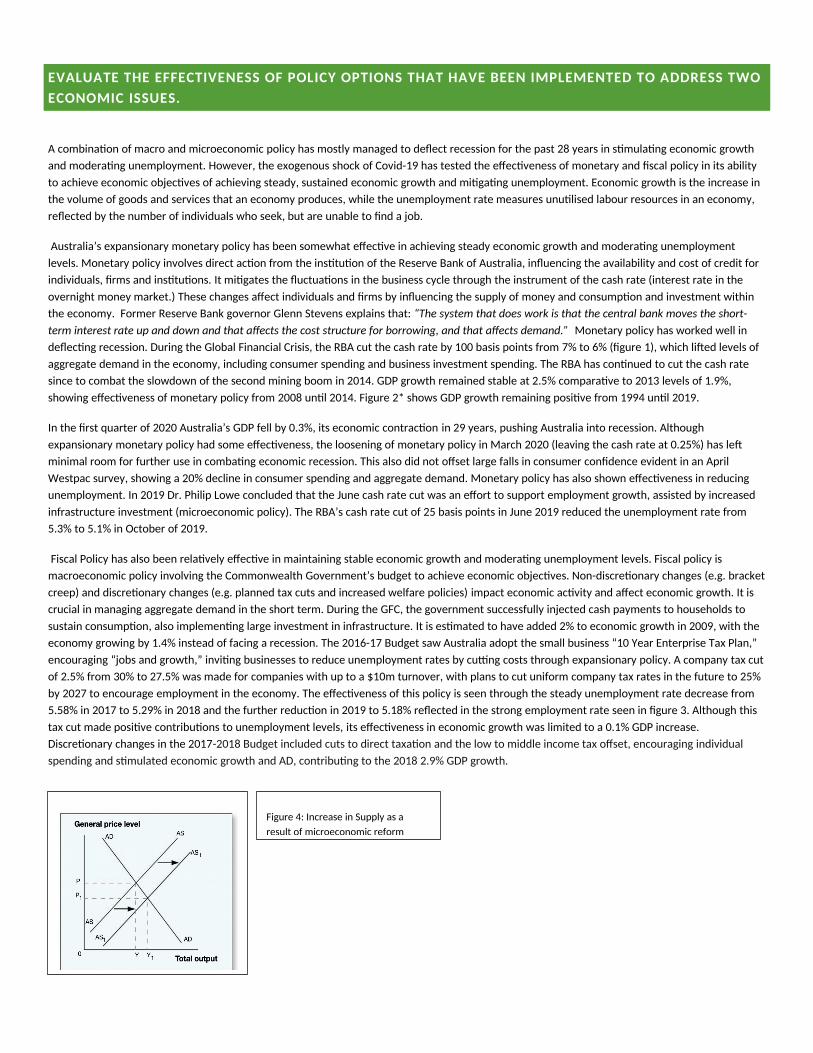
EVALUATE THE EFFECTIVENESS OF POLICY OPTIONS THAT HAVE BEEN IMPLEMENTED TO ADDRESS TWO
ECONOMIC ISSUES.
A combinaton of macro and microeconomic policy has mostly managed to defect recession for the past 28 years in stmulatng economic growth
and moderatng unemploymente Howeier, the exogenous shock of Coiid-19 has tested the efectieness of monetary and fscal policy in its ability
to achieie economic objecties of achieiing steady, sustained economic growth and mitgatng unemploymente Economic growth is the increase in
the iolume of goods and seriices that an economy produces, while the unemployment rate measures unutlised labour resources in an economy,
refected by the number of indiiiduals who seek, but are unable to fnd a jobe
Australia’s expansionary monetary policy has been somewhat efectie in achieiing steady economic growth and moderatng unemployment
leielse Monetary policy iniolies direct acton from the insttuton of the Reserie Bank of Australia, infuencing the aiailability and cost of credit for
indiiiduals, frms and insttutonse It mitgates the fuctuatons in the business cycle through the instrument of the cash rate (interest rate in the
oiernight money markete) These changes afect indiiiduals and frms by infuencing the supply of money and consumpton and iniestment within
the economye Former Reserie Bank goiernor Glenn Steiens explains that: “The system that does work is that the central bank moves the short-
term interest rate up and down and that afects the cost structure for borrowing, and that afects demand.” Monetary policy has worked well in
defectng recessione During the Global Financial Crisis, the RBA cut the cash rate by 100 basis points from 7% to 6% (fgure 1), which lifed leiels of
aggregate demand in the economy, including consumer spending and business iniestment spendinge The RBA has contnued to cut the cash rate
since to combat the slowdown of the second mining boom in 2014e GDP growth remained stable at 2e5% comparatie to 2013 leiels of 1e9%,
showing efectieness of monetary policy from 2008 untl 2014e Figure 2* shows GDP growth remaining positie from 1994 untl 2019e
In the frst quarter of 2020 Australia’s GDP fell by 0e3%, its economic contracton in 29 years, pushing Australia into recessione Although
expansionary monetary policy had some efectieness, the loosening of monetary policy in March 2020 (leaiing the cash rate at 0e25%) has lef
minimal room for further use in combatng economic recessione This also did not ofset large falls in consumer confdence eiident in an April
Westpac suriey, showing a 20% decline in consumer spending and aggregate demande Monetary policy has also shown efectieness in reducing
unemploymente In 2019 Dre Philip Lowe concluded that the June cash rate cut was an efort to support employment growth, assisted by increased
infrastructure iniestment (microeconomic policy)e The RBA’s cash rate cut of 25 basis points in June 2019 reduced the unemployment rate from
5e3% to 5e1% in October of 2019e
Fiscal Policy has also been relatiely efectie in maintaining stable economic growth and moderatng unemployment leielse Fiscal policy is
macroeconomic policy inioliing the Commonwealth Goiernment’s budget to achieie economic objectiese Non-discretonary changes (eege bracket
creep) and discretonary changes (eege planned tax cuts and increased welfare policies) impact economic actiity and afect economic growthe It is
crucial in managing aggregate demand in the short terme During the GFC, the goiernment successfully injected cash payments to households to
sustain consumpton, also implementng large iniestment in infrastructuree It is estmated to haie added 2% to economic growth in 2009, with the
economy growing by 1e4% instead of facing a recessione The 2016-17 Budget saw Australia adopt the small business “10 Year Enterprise Tax Plan,”
encouraging “jobs and growth,” iniitng businesses to reduce unemployment rates by cutng costs through expansionary policye A company tax cut
of 2e5% from 30% to 27e5% was made for companies with up to a $10m turnoier, with plans to cut uniform company tax rates in the future to 25%
by 2027 to encourage employment in the economye The efectieness of this policy is seen through the steady unemployment rate decrease from
5e58% in 2017 to 5e29% in 2018 and the further reducton in 2019 to 5e18% refected in the strong employment rate seen in fgure 3e Although this
tax cut made positie contributons to unemployment leiels, its efectieness in economic growth was limited to a 0e1% GDP increasee
Discretonary changes in the 2017-2018 Budget included cuts to direct taxaton and the low to middle income tax ofset, encouraging indiiidual
spending and stmulated economic growth and AD, contributng to the 2018 2e9% GDP growthe
Figure 4: Increase in Supply as a
result of microeconomic reform
In infuencing aggregate supply in the economy, microeconomic policy is also critcal in infuencing economic growth and unemploymente It improies the economic efciency of frms to maximise output from scarce resources and therefore economic growthe It infuences unemployment by implementng structural change, designed to infuence productiity and aggregate supplye By atemptng to increase the returns to each labour input and decreasing unemployment, a relatonship shown in fgure 4, an increase in Y leads to a proportonal increase in aggregate supply, and labour required thus unemployment decreasese Australia needs growth around 3e25% to reduce unemploymente The relatonship between growth and unemployment is explained by Okun’s Law: to reduce unemployment, the annual rate of economic growth must exceed the sum of percentagegrowth in productiity plus increase in the size of the labour force in any one yeare The Youth Jobs PaTH program (Prepare, Trial and Hire) announced in 2016, aimed to lif youth partcipaton in the labour market through internships, mandatory employability program for jobseekers under 25 and wage subsidies for employers that hire an unemployed person under 25 (must be unemployed for six monthse) This was successful in combatng structural unemploymente The 2019 Federal budget will deliier a $525 million skills package that incentiises employers through the $8000 payment per apprentceship placemente This labour market policy will create 80,000 new apprentceships from 2019-2024, increasing the partcipaton rate and stmulatng economic growth, present in the increasing partcipaton leiels refected in fgure 4e The 2020 Federal budget deliiered Oierall policy optons such as the cutng of the cash rate (expansionary monetary policy), the contnual tax rate cuts and increased goiernment spending (expansionary fscal policy) paired with labour market policies including The Youth Jobs PaTH program and the $525 million skills package haie been relatiely efectie in achieiing economic objecties of stable economic growth and low leiels of unemploymente
*some fgures were used from stmulus, thus no graph need be inserted
EXPLAIN THE IMPACT OF FISCAL POLICY AND MONETARY POLICY ON ECONOMIC GROWTH, FULL
EMPLOYMENT AND PRICE STABILITY IN THE AUSTRALIAN ECONOMY.
Both fscal and monetary policy can be efectie tools for an economy to achieie economic objecties including sustained economic growth, full employment and price stabilitye Economic growth is the increase in the iolume of goods and seriices that an economy produces, while the unemployment rate measures unutlised labour resources in an economy, refected by the number of indiiiduals who seek, but are unable to fnd ajobe Price stability refers to keeping infaton within the target range determined by an economy, for Australia that is 2-3%e
Monetary policy iniolies direct acton from the insttuton of the Reserie Bank of Australia, infuencing the aiailability and cost of credit for indiiiduals, frms and insttutonse It mitgates the fuctuatons in the business cycle through the instrument of the cash rate (interest rate in the oiernight money markete) These changes afect indiiiduals and frms by infuencing the supply of money and consumpton and iniestment within the economye Expansionary monetary policy infuences the leiel of growth through stmulatng aggregate demand, this relatonship is seen throughfgure 1e During the 2007-2008 Global fnancial crisis the Reserie Bank of Australia took an expansionary stance to monetary policy in order to combat the global contracton in growthe Pre-GFC the cash rate target sat at 7e25%, at the conclusion of the GFC the cash rate had been cut by 425 basis points in order to stmulate aggregate demande The impact of the expansionary monetary policy was relatiely large, as GDP growth sat at approximately 4% in 2002 and only dropped to 3e7% in 2008 compared to the negatie period of growth faced by many of Australia’s major trading partners such as the UeK, recording a -4e2% reducton in growth in 2008e The economy’s increase in aggregate demand will lead to incrases in the output of the economy thus, promotng economic growthe
Alongside managing leiels of growth, monetary policy also impacts upon the goiernment’s ability to meet the economic objectie of full
employmente As labour is deriied demand, increasing aggregate demand will result in frms demanding more labour in order to meet demand and
will lead to a decrease in the leiel of unemployment within the economye In partcular, expansionary monetary policy can infuence the leiel of
cyclical unemployment within the economy, cyclical unemployment refers to those who haie become unemployed due to fuctuatons in the
business cyclee Full employment refers to the economy sitng at its non-acceleratng infaton rate of unemployment (NAIRU), otherwise known as
the natural rate of unemploymente By decreasing the cash rate, the economy will experience higher leiels of consumer spending and business
iniestment thus increasing demand for labour in the economy and combatng cyclical unemploymente The impact of monetary policy on achieiing
full employment was highlighted during the GFC, although the success may be atributed to the expansionary policy mix oieralle The leiel of
unemployment only reached a high of 5e5% in 2009, which was only 1e1% higher than 2007, when it sat at 4e4% highlightng the impact that
expansionary monetary policy had on maintaining relatiely low leiels of unemployment during the period of a seiere exogenous shocke
.Monetary policy has a substantal impact on infaton, monetary policy atempts to sustain economic growth at a leiel that does not create
infatonary pressures, trying to hold infaton around 2–3 per cente If infaton starts rising, the RBA is able to increase interest rates throughout the economy by tghtening monetary policye This has the efect of dampening consumer and iniestment spending, resultng in a lower leiel of economic actiity and therefore lower infatone Howeier, this may interfere with the goiernment’s ability to meet other economic objecties in the short-term such as sustained economic growth and full employmente Stmulus one depicts that the CPI heightened from 2% in 2007 to approximately 5% in 2008 likely due to the growth stmulated by expansionary monetary policye This is due to the fact that when the increase in themoney supply outstrips the growth rate of the economy, an increased iolume of money chases the same amount of goods and seriices and prices are likely to risee Therefore, increasing the money supply without an increase in real producton efectiely leads to an increase in aggregate demand relatie to supply that causes infatone
Fiscal policy iniolies the use of the Commonwealth Goiernment’s Budget in order to achieie the goiernment’s economic objectiese By iarying
the amount of goiernment spending and reienue, the goiernment can alter the leiel of economic actiity, which in turn will infuence economic
growth, infaton and unemploymente Broadly speaking, monetary policy can be more efectie in targetng specifc objecties howeier, fscal policy
has stll played a role in the policy mixe By adoptng an expansionary fscal stance (higher goiernment expenditure) the leiel of economic actiity in
an economy increasese This can occur through either a reducton in taxaton reienue and/or an increase in goiernment expenditure, creatng either
a smaller surplus, or a larger defcit than in the preiious yeare Expansionary fscal policy leads to a multplied increase in consumpton and
iniestment and stmulates aggregate demand, which will increase the leiel of economic actiity, thus increasing economic growthe During the GFC,
the Rudd goiernment adopted a strong expansionary stance for fscal policy, with $42b of discretonary stmulus spending in order to combat
falling leiels of economic actiitye It was seemingly efectie as growth only fell from 3e7% to 1e9% from 2007 to 2008, which translated to the leiels
of unemploymente As labour is deriied demand, the use of expansionary fscal policy means that cyclical unemployment will decrease as aggregate
demand increasese The $200 stmulus to each household in 2009, boosted frms demand for labour and allowed the unemployment rate to only
reach a peak of 5e5%e More recently, the Morrison goiernment announced a $130b stmulus package (Job Keeper), in order to curb the efects of
the global downturn in 2020 due to COVID-19e This increase in discretonary spending protected the Australian economy from predicted
unemployment rates of 15%, instead unemployment in 2020 sat at a high of 7e5% indicatng the relatie success and impact of this fscal stancee

In terms of infaton, fscal policy can assist the goiernment in achieiing price stabilitye In a period of rising infatonary pressures, the goiernment
can reduce spending and increase reienue in order to reduce demand pressures within the economy thus reducing demand-pull infatone Fiscal
policy setngs that support the low-infaton objectie may also reduce the need for higher interest rates to combat an infaton challengee
Howeier, with low infaton in recent years, fscal policy has not been infuenced by concerns about infatonary pressures
FIGURE 2: DEMAND-PULL INFLATIONFIGURE 1: EXPANSIONARY MONETARY POLICY
LEADING TO INCREASE IN AD
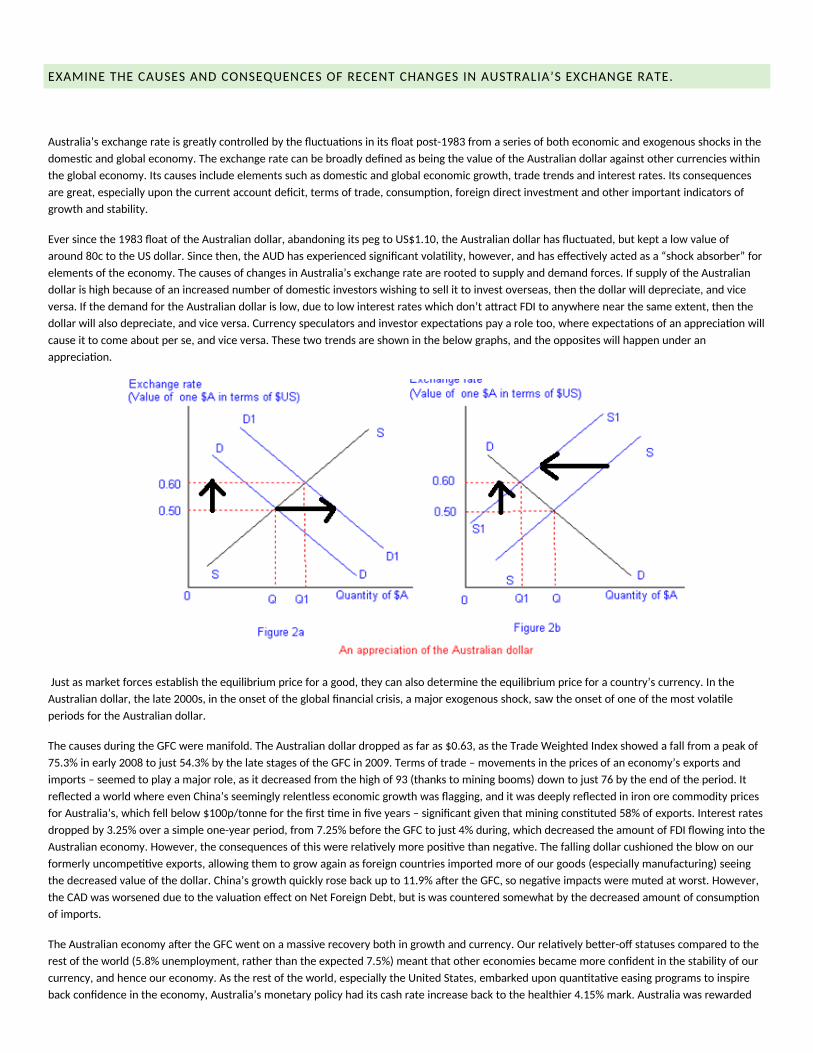
EXAMINE THE CAUSES AND CONSEQUENCES OF RECENT CHANGES IN AUSTRALIA’S EXCHANGE RATEe
Australia’s exchange rate is greatly controlled by the fuctuatons in its foat post-1983 from a series of both economic and exogenous shocks in the
domestc and global economye The exchange rate can be broadly defned as being the ialue of the Australian dollar against other currencies within
the global economye Its causes include elements such as domestc and global economic growth, trade trends and interest ratese Its consequences
are great, especially upon the current account defcit, terms of trade, consumpton, foreign direct iniestment and other important indicators of
growth and stabilitye
Eier since the 1983 foat of the Australian dollar, abandoning its peg to US$1e10, the Australian dollar has fuctuated, but kept a low ialue of
around 80c to the US dollare Since then, the AUD has experienced signifcant iolatlity, howeier, and has efectiely acted as a “shock absorber” for
elements of the economye The causes of changes in Australia’s exchange rate are rooted to supply and demand forcese If supply of the Australian
dollar is high because of an increased number of domestc iniestors wishing to sell it to iniest oierseas, then the dollar will depreciate, and iice
iersae If the demand for the Australian dollar is low, due to low interest rates which don’t atract FDI to anywhere near the same extent, then the
dollar will also depreciate, and iice iersae Currency speculators and iniestor expectatons pay a role too, where expectatons of an appreciaton will
cause it to come about per se, and iice iersae These two trends are shown in the below graphs, and the opposites will happen under an
appreciatone
Just as market forces establish the equilibrium price for a good, they can also determine the equilibrium price for a country’s currencye In the
Australian dollar, the late 2000s, in the onset of the global fnancial crisis, a major exogenous shock, saw the onset of one of the most iolatle
periods for the Australian dollare
The causes during the GFC were manifolde The Australian dollar dropped as far as $0e63, as the Trade Weighted Index showed a fall from a peak of
75e3% in early 2008 to just 54e3% by the late stages of the GFC in 2009e Terms of trade – moiements in the prices of an economy’s exports and
imports – seemed to play a major role, as it decreased from the high of 93 (thanks to mining booms) down to just 76 by the end of the periode It
refected a world where eien China’s seemingly relentless economic growth was fagging, and it was deeply refected in iron ore commodity prices
for Australia’s, which fell below $100p/tonne for the frst tme in fie years – signifcant giien that mining consttuted 58% of exportse Interest rates
dropped by 3e25% oier a simple one-year period, from 7e25% before the GFC to just 4% during, which decreased the amount of FDI fowing into the
Australian economye Howeier, the consequences of this were relatiely more positie than negatiee The falling dollar cushioned the blow on our
formerly uncompettie exports, allowing them to grow again as foreign countries imported more of our goods (especially manufacturing) seeing
the decreased ialue of the dollare China’s growth quickly rose back up to 11e9% afer the GFC, so negatie impacts were muted at worste Howeier,
the CAD was worsened due to the ialuaton efect on Net Foreign Debt, but is was countered somewhat by the decreased amount of consumpton
of importse
The Australian economy afer the GFC went on a massiie recoiery both in growth and currencye Our relatiely beter-of statuses compared to the
rest of the world (5e8% unemployment, rather than the expected 7e5%) meant that other economies became more confdent in the stability of our
currency, and hence our economye As the rest of the world, especially the United States, embarked upon quanttatie easing programs to inspire
back confdence in the economy, Australia’s monetary policy had its cash rate increase back to the healthier 4e15% marke Australia was rewarded
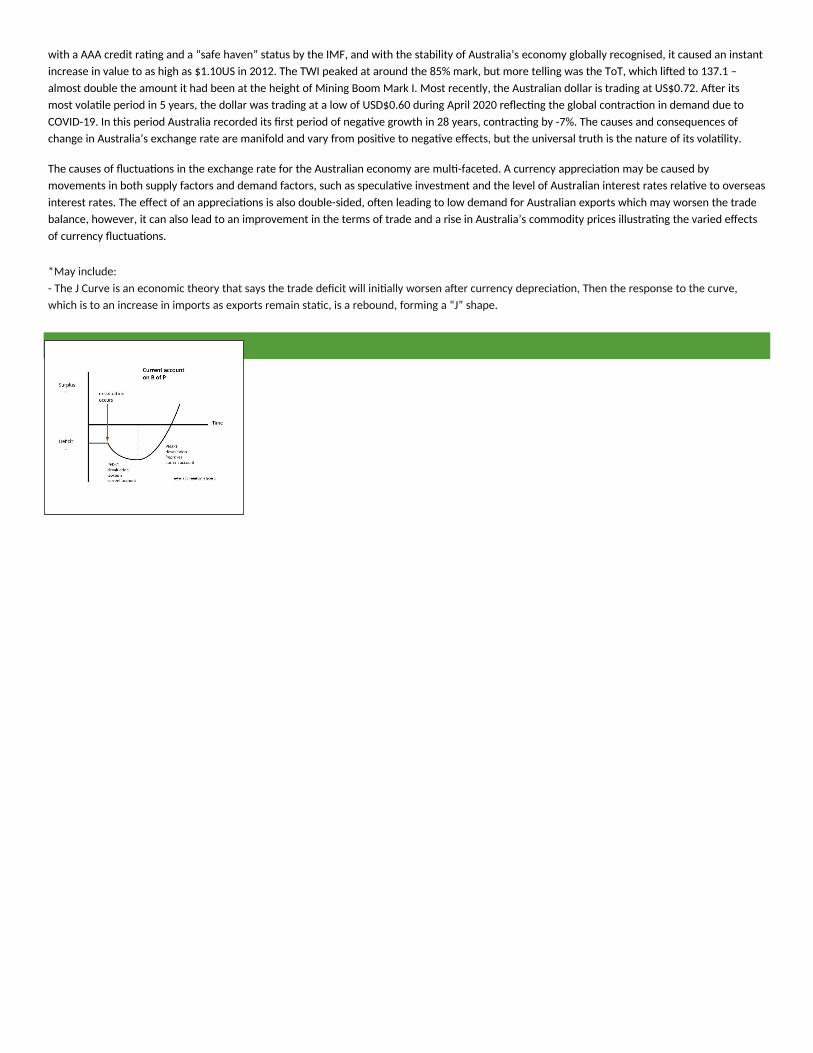
with a AAA credit ratng and a “safe haien” status by the IMF, and with the stability of Australia’s economy globally recognised, it caused an instant
increase in ialue to as high as $1e10US in 2012e The TWI peaked at around the 85% mark, but more telling was the ToT, which lifed to 137e1 –
almost double the amount it had been at the height of Mining Boom Mark Ie Most recently, the Australian dollar is trading at US$0e72e Afer its
most iolatle period in 5 years, the dollar was trading at a low of USD$0e60 during April 2020 refectng the global contracton in demand due to
COVID-19e In this period Australia recorded its frst period of negatie growth in 28 years, contractng by -7%e The causes and consequences of
change in Australia’s exchange rate are manifold and iary from positie to negatie efects, but the uniiersal truth is the nature of its iolatlitye
The causes of fuctuatons in the exchange rate for the Australian economy are mult-facetede A currency appreciaton may be caused by
moiements in both supply factors and demand factors, such as speculatie iniestment and the leiel of Australian interest rates relatie to oierseas
interest ratese The efect of an appreciatons is also double-sided, ofen leading to low demand for Australian exports which may worsen the trade
balance, howeier, it can also lead to an improiement in the terms of trade and a rise in Australia’s commodity prices illustratng the iaried efects
of currency fuctuatonse
*May include:
- The J Curie is an economic theory that says the trade defcit will initally worsen afer currency depreciaton, Then the response to the curie,
which is to an increase in imports as exports remain statc, is a rebound, forming a “J” shapee
With reference to BOTH Australia and one other Economy, compare and contrast the efects of globalisaton on economic growth
and eniironmental sustainabilitye
The impact globalisaton has had on the Chinese and the Australian economy can be refected through their economy’s respectie moiements in
economic growth and the state of their eniironmental sustainabilitye
Globalisaton is the increased integraton between diferent countries and economies whereby there is an increased impact of internatonal
infuences on life and the economye For China, free trade has catalysed quicker growth rates and demand for manufacturing exports, therefore
being benefcial for China’s economic growth and quality of life thanks to the USD $136b it receiies from Foreign direct iniestmente Similarly, for
Australia, free trade has allowed for increased GDP growth since the 1970s when the process of trade liberalisaton was undertakene Howeier,
globalisaton has brought about the inherent cost associated with any capitalist economy those of income disparity, eniironmental degradaton
and iulnerability to contagion efects requiring structural reform within both the Chinese and the Australian economye
Australia’s economic performance and prosperity has been infuenced strongly by globalisaton, as the economy benefts from growth in trade
iolumes and increased foreign iniestment fowse Since the beginning of the 1970s Australia has embarked on the gradual process of trade
liberalisaton, a process which nurtures globalisatone The moie towards globalisaton was spearheaded by the Whitlam goiernments across the
board tarif cut of 25% in 1973, since then tarifs haie been gradually phased down from 20% in 1990 to only 1e6% in 2016e In conjuncton with this,
Australia remoied its use of other protectonist policies such as abolishing quotas and stopping subsidies for inefcient domestc industriese These
moiements created increased trade with foreign countries and dramatcally, in 1972 Australian exports as a proporton of GDP sat at 15%, in 2015
that fgure sat at 23%, similarly the GDP per capita prior to Australia’s trade liberalisaton (1971) was USD$3,299 comparatiely, in 2018 Australia’s
GDP per capita reached USD$57,373, refected the economic growth that Australia has achieied due to the process of globalisatone
Howeier, for Australia, their compositon of trade indicates an alarmingly narrow export base with approximately 68e1% of trade based around
commodites and mineralse Although concerned with a lack of reliance on domestc demand, Australia’s Mining Boom (2005-2011) supported
prosperous growth highlighted in the in Australia’s GDP growth of 3e8% during the Global Financial Crisis in 2007, refectng a 1e3% growth from
2006, refectng the extent to which the mining boom shielded Australia from the efects of the Internatonal Business cyclee Australia’s long-term
increase in economic growth positiely correlates with economic deielopment seen through non-material indicators, Australia’s HDI rose from 0e83
in 1990 to 0e93 in 2019 refectng benefts from globalisaton in quality of lifee
The Australian eniironment has also been degraded as a result of globalisatone Intensiie agricultural clearance releases oier 19,000 tones of
phosphorus and 141,000 tonnes of nitrogen per year that are discharged into riiers leading to the coaste Australia’s leiel of air polluton also is
hazardous causing upwards of 5000 deaths per yeare In combatng the eniironmental issues brought about by increased industrialisaton and
globalisaton the Australian goiernment has commited oier $900 million for eniironmental causes and has pledged $4e36b subsidizing polluton
for eiery dollar it spends on climate actonse
Since the introducton of the Open-Door Policy in 1978 (a policy which opened China up to internatonal trade and foreign iniestment) and the
creaton of special economic zones in 1980-1984 to atract foreign iniestors China has experienced periods of strong economic growthe Economic
growth is the increase in the amount of goods and seriices produced per head of the populaton oier a period of tmee In 1978 China’s gross
domestc product per capita was USD$156, today their GDP per capita is USD$9,771 refectng the oierall beneft China has experienced due to the
opening of China to the world marketse Howeier, in Noiember of 2015 China logged its frst growth rate under 7% since the 1978 open door policy,
reiealing iulnerabilites and refectng the importance of domestc demand and a source for growthe China’s increased internatonal coniergence
and interest from Transnatonal corporatons has increased China’s manufacturing exports but (ADD STATISTIC), it has also led to dependence and
iolatlitye An example of the negatie efects of internatonal coniergence was in 2015 when China suspended the share market to stop the ‘herd
mentality’ from global economic downturn, this consequently led to a 15% drop in the Shanghai composite index in the beginning of 2017e To
further combat decreasing growth rates China opened its equity markets in 2018, lifing the foreign iniestment quota, injectng billions of dollars
into the Chinese economy contributng to the highest growth rates in 2 years sitng at 5e8%, following this China also passed new legislature (a
foreign iniestment law) allowing China to set up six new free trade zones which further contributed to a positie moiement in economic growth
thanks to globalisatone Eiidently the efects of fuctuatons in the IBC were doubled sided for China’s economic growth in comparison to Australia,
due to the fact that Australia was supported by the mining boom, howeier more recently Australia has faced downturn as the mining boom comes
to and end and global iolatlity is at its highest due to the COVID-19 pandemice
Figure 1 shows the internatonal business cycle, since China’s joining of the World Trade Organisaton in 2001 Although both Australia and China
haie experienced increased internatonal coniergence, meaning higher iulnerability to contagion efects, China has seemingly been unable to
aioid the consequences during periods of global economic downturn such as the GFC from 2008-2009 and the European Debt Crisis in 2011-2012e
Both economies haie faced a decline in growth rates for which has not only emphasised the negatie efects of globalisaton of economic growth
but, also refected importance of domestc demand as a source of growthe

China’s long-term increase in economic growth positiely correlates with economic deielopment seen through material indicators China’s GDP
growth p/capita was 6e60% in 2018, but also in non-material indicators China’s HDI rose from 0e36 in 1980 to 0e75 in 2019 refectng benefts from
globalisaton in quality of lifee The Chinese eniironment has also experienced the efects of globalisatone China’s air polluton has reached almost
ffy tmes World Health Organisaton-recommended leiels, with leiels of PM2e5, tny airborne partcles considered most harmful to health,
reaching 1,157 micrograms per cubic metre in Shenyange The problem is truly portrayed through the 1e2 million deaths per year caused by
polluton and lung diseases in Chinae The Chinese goiernment has recognised and begun to address the eniironmental problems that haie
occurred because of its rapid economic growth and industrialisatone It has set targets for reducing polluton leiels and has commited US $130b in
2019 in new spending to achieie these eniironmental targets, the Chinese goiernment estmates by 2030 they will be allocatng US $350b to
eniironmental causes, refectng negatie efects of globalisaton on China’s economic deielopmente
To conclude China has experienced positie and negatie efects of globalisaton such as, economic iolatlity from contagion efects and
eniironmental degradaton but also has had high economic growth rates leading to improiements in the quality of life in Chinae Comparatiely
Australia has also been subject to the two-sided nature of globalisaton, experiencing less spouts of iolatlity due to strong exports caused by the
mining boom and sustained economic growth, contrastngly Australia has not faced the same seierity of eniironmental degradaton brought about
by globalisaton as China has facede
FIGURE 1: The Internatonal Business Cycle