Embed Size (px)
Citation preview
TOPIC: INFORMATION SHARING, INVENTORY MANAGEMENT AND CUSTOMER SATISFACTION IN
THE DOWNSTREAM CHAIN OF MANUFACTURING FIRMS IN UGANDA.
BY
NAMAGEMBE SHEILA
REG NO. 2007/HD10/11460U
A RESEARCH REPORT SUBMITTED TO MAKERERE UNIVERSITY BUSINESS SCHOOL IN PARTIAL
FULFILLMENT OF THE REQUIREMENTS OF A MASTER OF SCIENCE IN PROCUREMENT AND SUPPLIES
MANAGEMENT OF MAKERERE UNIVERSITY.
OCTOBER, 2010.
i
DECLARATION
I Namagembe Sheila declare that the research report is my original work and has not been
submitted for any other degree to any university or higher institution.
……………………………………………………………………
Signature
Namagembe Sheila
2007/HD10/11460u
Date:…………………………………………..
ii
APPROVAL
This report has been submitted for examination with our approval as university supervisors
……………………………………..
Signature
Supervisor: Professor John Munene
Date:…………………….
………………….
Signature
Supervisor Dr. Muhwezi Moses
Date:……………………..

iii
DEDICATION
I dedicate this work to my parents, supervisors and friends for the over whelming support, advice
and encouragement that they gave to me during the research process.

iv
ACKNOWLEDGEMENT
I would like to take this opportunity to thank the business school for the opportunity granted to
me, my supervisors who gave me guidance as far as research was concerned, my parents, sisters,
brothers and friends who gave me the support when I was in need.
v
Table of contents
Declaration................................................................................................. ................................I
.
Approval ................................................................................................................ …...............11
Dedication .............................................................................................................. ………….111
Acknowledgement ................................................................................................. ………......IV
Table of contents .................................................................................................... ……..…….V
List of tables and figures …………..............................................................................................VI
Abstract ................................................................................................................. …………...IX
CHAPTER ONE: Introduction
1.1 Background of the problem................................................................................................ .......1
1.2 Statement of the problem ................................................................................. ……………..2
1.3 Purpose of the study ........................................................................................ …………..2-4
1.4 Research Objectives………………………………………………………………………...2-3
1.5 Research questions... ....................................................................................... ……………..3
1.6 Scope of the study …………….................................................................................................4
1.7 Significance of the Study……………………………………………………………………2-4
1.8 Conceptual framework…………….......................................................................................5-6
CHAPTER TWO: Literature review
2.0 Introduction ……………...........................................................................................................7
2.1 Information sharing and inventory management ……………..................................................7
,
2.1.1 Information sharing and inventory levels ............................ : ……………...........................8
1.2 Information sharing and inventory accuracy ...……………………………………………..8-9
2.1.3 Information sharing and inventory costs ………………......................................................10
2.1.4 Information sharing and order lead time ………………................................................11-12
.
vi
2.2 Inventory management and customer satisfaction…………………………………………...12
2.2.1 Inventory management and flexibility………………………………………………….13-14
2.2.2 Inventory management and customer loyalty ………………………………………….14-15
2.2.3 Inventory management and inventory returns ……………………………….……………15
2.2.4 Inventory management and quality ………………………………………….………...15-16
2.2.5 Inventory management and on time deli every ……………………………...………….…15
2.2.6 Inventory management and repeat purchases ……… ……………………………….……15
2.3 Information sharing and customer loyalty ……………………………………..………...17-18
-.
2.3.2 Information sharing and inventory returns ……………………………………..…………18
2.3.4. Information sharing and qualit…………………………………………..…………….18-19
2.3.5 Information sharing and repeat purchases …………………………………...……………19
2.3.6 Information sharing and flexibility.............. ~………………………………..……..…19-20
2.3.7 Information sharing and on time deli every . ……………………………………………...20
Conclusion………………………23
CHAPTER THREE: Methodology
3.0 Introduction ………………………………………………………………………………….21
3.1 Research design ……………………………………………………………….…………….21
3.2 Sample design ……………………………………………………………………………….21
3.3 Measurement of variables ……………………………….................................................21-.22
3.4 Target population and study area …………………………………………….………….…..22
35 Sample size …………………………………………………………………………………..23
3.6 Instruments and data collection ……………………………………………….…………….23
3.7 Sources of data ………………………………………………………………...…………….23
3.8 Data analysis……………………………………………………………….…… ..….23
vii
CHAPTER FOUR: Analysis and presentation of findings
4.0 Introduction…………………………………………..:...........................................................25
4.1 Descnptlvestatistics……..………………………………………......................................25-29
4.2 Correlation analysis............................................................................................................29-31
4.3 Regression analysis ………………………………………….................................................31
4.4Anova…………………………………………………………….………………………..32-35
4.5 T-test………………………………………………...........................................................35-39
CHAPTER FIVE: Discussion of findings, conclusions and recommendations
5.0. Introduction ………………………………………………………………….…………….37
5.1 Discussion of findings ……………………..………………………………….…………37-40
5.2 Conclusions... ..................................................................................................……………41
5.3 Recommendations ………………………………………………………………………41-42
5.4 Limitations of the study………………………………………………………………...42-43
5.4 Suggested areas for further research ………………………………………..…………….43
6.0 References. ................................................................................................………...…….44-56
viii
List of tables and figures
TABLE: I: SAMPLE SIZE. POPULATION SIZE AND RESPONSE RATE …...…………….23
TABLE: 2 TYPE OF BUSINESS ………………………………………………...…….............26
TABLE: 3 THE TYPE OF BUSINESS WITH HIGHEST QUALIFICATIONS OF
RESPONDENTS ……...........................................................................................................27
TABLE: 4 THE TYPE OF BUSINESS WITH AGE OF RESPONDENTS ……...…….............28
~
TABLE: 5 ZERO ORDER .CORRELATION ………………………………………………….29
TABLE: 6 REGRESSION ANALYSES ………………………………………….…………….31
TABLE: 7 HIGHEST QUALIFICATIONS OF RESPONDENTS WITH STUDY VARIABLE
............................................................................................................................. ……………32
TABLE 8: AGE OF RESPONDENTS WITH THE STUDY VARIABLE .............. …………...34
TABLE 9: T-TEST .SEX OF RESPONDENTS WITH THE STUDY VARIABLES…..……...35
TABLE 10: THE STUDY VARIABLES WITH THE TYPE OF BUSINESS………………….36
FIGURE I: CONCEPTUAL FRAME WORK …………………………………..………………5
ix
ABSTRACT
The purpose of the study was to investigate the relationship between information sharing,
inventory management and customer satisfaction in the down stream chain of manufacturing
firms in Uganda. A quantitative cross sectional survey research design was used to establish the
relationship between information sharing inventory management and customer satisfaction in the
down stream chain of manufacturing firms in Uganda. A sample size of 523 respondents
consisting of retailers and distributors was taken. The research findings indicated that there was a
significant positive relationship between information sharing, inventory management and
customer satisfaction.
Information sharing and customer satisfaction had Pearson correlation coefficient of 0.471 **
Information sharing and inventory management had Pearson correlation Coefficient=0.350**
and Inventory management and customer satisfaction had Pearson Correlation coefficient of
0.394** Information sharing and inventory management significantly influenced customer
satisfaction and this was supported by the value of R square which showed that they predicted
the dependent variable by 25%. In conclusion Channel partners required the installation of
information systems and customer collaboration in order to ensure better information sharing and
inventory management hence leading to high levels of customer satisfaction.
1
CHAPTER ONE
1.0 BACK GROUND TO THE PROBLEM.
Manufacturing firms in Uganda are characterized by elongated or overextended chains of
middlemen which include distributors and retailers (buyers/agents) which, in turn, mean long
chains of transactions between chain members and consumers (Bibangambah, 2002).These
chains are referred to as the downstream chains (Handfield , BarnHardt and Powel,2004).These
in turn have led to poor access to appropriate market information (UNACTAD, 2006).This has
been caused by lack of information networks within their downstream chain (Ministry of
Tourism and Trade, 2005).
Limited or no access to timely information regarding both domestic and export markets
especially with respect to such matters as supply volumes and quantities has led to supply
shortages because players are never aware of how many orders a customer has placed and how
much should be ordered from suppliers (Kaijuka, 1994-1999; Yorst, etal,2007). Okello (2007)
showed that leading manufacturers in Uganda, such as Coca-Cola, Pepsi, Mukwano, Uganda
Breweries, Nile Breweries, Britannia, Rafiki, Bata Uganda Ltd, British American Tobacco
(BAT), Royal Foam and Vita Foam are faced with problems of wrong forecasting due to an
availability of enough customer demand information. This has caused erratic deliveries in these
firms, late deliveries and inflexibility hence affecting customer satisfaction with in their
downstream chain (USAID, 2001: UNlDO, 2005).
Customers are concerned with the availability of the product and the ability of the firms to meet
2
their needs timely (Gunasekaran and Patel; 2001). They make repeat purchases based on the
service provided by the chain partner.
Unavailability of inventory has affected customer satisfaction with in the downstream chain
hence leading to loss of chain profits among the channel members (Verwijmeren, 1996).
In addition access to information in manufacturing firms and the down stream chain has been
hampered by technological impediments such as lack of an information technology that has a
greater orientation towards customer service (US AID, 1996). Individuals are unable to make
contacts with the appropriate information providers due to some technological problems as well
as ineffective collaboration (lack of market information net works) which has affected the better
use and sharing of information to reduce uncertainty about future demand, encouraging more
responsive manufacturing (Mayoni 2005;Okell, 2007)
1.2 Statement of the problem
Information sharing and inventory management are key important factors for the down stream
chain. They enable firms in the chain match demand with supply. How ever firms in the down
stream of manufacturing firms in Uganda face problems of lack of information sharing and poor
inventory management which has affected their ability to satisfy their customers.
1.3 Purpose of the study
The study sought to investigate the relationship between information sharing, inventory
management and customer satisfaction in downstream chains of manufacturing firms.
3
1.4 Research objectives
The research objectives were;
i). Establish the relationship between information sharing and inventory management in
downstream chain of manufacturing firms
ii). Establish the relationship between inventory management and customer satisfaction in
downstream chain of manufacturing firms
iii). Establish the relationship between information sharing and customer satisfaction in
downstream chain of manufacturing firms.
iv). Establish the relationship between information sharing, inventory management and customer
satisfaction in downstream chain of manufacturing firms.
1.5 Research questions.
The research questions were;
i). What is the relationship between information sharing and inventory management in
downstream chain of manufacturing firms?
ii). What is the relationship between inventory management and customer satisfaction in
downstream chain of manufacturing firms?
iii). What is the relationship between information sharing and customer satisfaction in
downstream chain of manufacturing firms?
4
iv). What is the relationship between information sharing, inventory management and customer
satisfaction in downstream chain of manufacturing firms?
1.6 Scope of the study
1.6.1 Content Scope
The research focused on information sharing, inventory management and customer satisfaction
in the downstream chain of manufacturing firms.
1.6.2 Geographical Scope
The study concentrated on the down stream chain of manufacturing firms in Uganda with
specific reference to Kampala.
1.7 Significance of the study
i). The research findings would help current and future firm owners and customers in designing
mechanisms that ensure that information is shared hence leading to better inventory management
that will improve customer satisfaction.
ii). The study adds to the existing literature on information sharing, inventory management and
customer satisfaction in downstream chain of manufacturing firm.
iii). Creates knowledge and provide more information to future researchers and academicians.
.
iv). The findings avail information that will be useful to academicians in this field

5
v). It is useful to UMA, USSIA in designing policies.
6
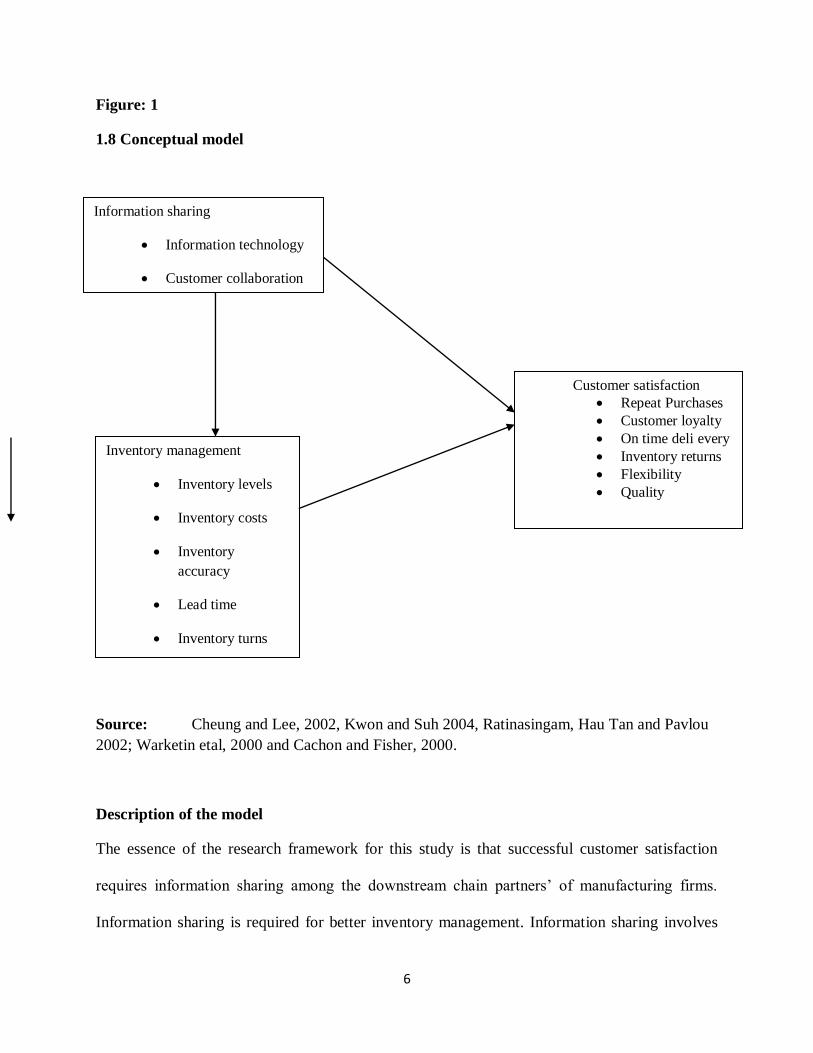
Figure: 1
1.8 Conceptual model
Source: Cheung and Lee, 2002, Kwon and Suh 2004, Ratinasingam, Hau Tan and Pavlou
2002; Warketin etal, 2000 and Cachon and Fisher, 2000.
Description of the model
The essence of the research framework for this study is that successful customer satisfaction
requires information sharing among the downstream chain partners’ of manufacturing firms.
Information sharing is required for better inventory management. Information sharing involves
Customer satisfaction
Repeat Purchases
Customer loyalty
On time deli every
Inventory returns
Flexibility
Quality
Inventory management
Inventory levels
Inventory costs
Inventory
accuracy
Lead time
Inventory turns
Information sharing
Information technology
Customer collaboration
7
sharing information about customer and inventory decisions made by different chain members.
Better inventory management reduces excess inventory, better product forecasts, sufficient
capacities and good customer service due to availability of products, certainty in production
planning (Cheung and Lee, 2002).
Due to better inventory management, channel partners can satisfy customers’ orders in better
way
with increased responsiveness and flexibility which lead to customer satisfaction (Kwon and suh
2004; Ratinasingam, Hau Tan and Pavlou 2002; Warketin et al, 2000). Information sharing
among the channel partners leads to better inventory management which leads to customer
satisfaction. It enables channel partners to match supply with the customer's demand
requirements. Through the use of information technology and customer collaborations, channel
partners are able to achieve a high degree of flexibility and responsiveness in meeting customer
needs (Cachon and Fisher, 2000).
1.9 Structure of the report
Chapter one looks at the back ground, statement of the problem, research objectives, research
questions, scope of the study, purpose of the study and conceptual model.
Chapter two reviews literature concerning the study. Literature on information sharing and
inventory management, inventory management and customer satisfaction, information sharing
and customer satisfaction and information sharing, inventory management and customer
satisfaction was reviewed.
8
Chapter three looks at the methodology. The chapter looks at the research design, sample design,
target population, sample size, and measurement of variables, researches, research instruments
and anticipated problems.
Chapter four looks at analysis, discussion and interpretation of findings.
Chapter five looks at the summary, conclusion and recommendations of the study.
9
CHAPTER TWO
LITERATURE REVIEW
2.0 Introduction
The chapter focuses on the literature of the study. The section was divided into three parts.
Literature was reviewed while basing on the conceptual frame work.
2.1 Information sharing and inventory management
Information sharing has been shown to be the key to successful downstream chains (Aviv,
2003).According to Lee and Wang (2000), it provides information regarding inventory levels and
position, sales data and forecasts, order status, production and delivery schedules and capacity. It
is considered as the most reliable "real time" tool to decrease uncertainty in the chain which
leads to the bullwhip effect (Lewis, 2003).This refers to variations in demand and supply which
are caused by information uncertainties in the chain (Taylor, 2000). This helps to reduce safety
stock at each stage which leads to a reduction in inventory carrying costs (Yao, Evers and
Dresner, 2000).
Product and delivery lead times are shortened making products available on time to customers
(Tachizawa and Ginemez, 2005).Access to information enables channel members to plan how
much to stock for a given period of time (Fasanghari, Roudsari and Kamal, 2008). In order for
information sharing to take place, chain partners should have a collaborative potential and IT
infrastructure (Shore and Venkatachalam, 2003).
10
2.1.1 Information sharing and Inventory levels
Information sharing plays an important role in inventory management (Sabbath, 2008). This
enables chain partners to plan properly, avoid inventory bottlenecks in the chain and avoid safety
stocks both for all the channel members (Chandra, 2000; Patel, 2001).Normally, when a buyer
needs a product, he places an order to a supplier. With information, chain partners are able to
know when and how much to order and what to put in the inventory plan (Elvander, Sarpola and
Mattson, 2007). In order to share information, a partnership is formed between the supplier and
buyer in which the supplier takes care of the-orders and replenishing (Ahmed 2004).To
accomplish this, the supplier (retailer or distributor) gets regularly information on the inventory
level and sales data of the buyer via the web or Electronic Data Interchange (EDI) (Homburg and
Grozdanovic & Klarmann, M, 2007). Thus, when inventory drops below a certain level, orders
are generated automatically on behalf of the buyer. In this case, it is the supplier who creates and
manages the inventory plan. Continuous replenishment (CR) and vendor managed systems are
used to share information that is used to manage inventory levels (Skjoett et al., 2003; Cooke,
1998; Bernstein et al., 2005).
2.1.2 Information sharing and inventory accuracy
According to Fisher (1997), inventory accuracy is the ability to predict the true demand of a
product. Trying to control inventory with bad information is futile (Taylor, 2000). All
replenishment decisions are based on the status of your inventory (Sahay, 2003).Information
sharing enables chain partners to make reliable delivery promises, keep inventory levels low and
11
.inventory records 98 percent accurate every day. Information systems provide -real time
information which enables chain partners forecast accurately (Cross, 2000).
Use of systems like electronic data interchange, point of sale systems, enterprise resource
planning systems enable inventory accuracy through the provision of accurate information
(Weber and kantamneni, 2002).According to Kang and Gershwin (2005), chain partners
experience inaccurate inventory records as a result of lack of collaboration while Raman et al.
(2001) says that inventory records do not match with physical stock in chain partners' stores due
to lack of collaboration.
2.1.3 Information sharing and Inventory costs
Silver et al. (1998) suggest, a partner's fate depends on how it manages its inventory. Much of
the chain partners' costs are attributed to the amount it invests in inventory and associated
holding, transportation, and management costs (Silver et al, 1998).According to Larry, Mulky
and Harrington (1996), inventory has the biggest cost hidden in most chain partners' businesses.
In addition, Fleisch and Tellkamp (2005) found out that inadequate information sharing results
into inventory inaccuracies which increases the chain partners' holding costs and increases the
out-of stock situations. The significant monetary investment in inventory only enhances the
importance of better inventory management (Brewer and Speke, 2000).
In response, chain partners seek cost improvements by enhancing the efficiency of their
inventory management systems (Verwijmeren, 1996). The use of systems like point of sale
systems and collaboration helps chain partners to acquire information which reduces losses from
12
obsolescence, damaged inventory, handling costs, stock outs costs, enables proper demand
planning and replenishment (Verwijmeren, 1996; Parks, 1999).Safety stocks are reduced through
vendor managed inventory, just in time and consignment inventory (Simatupang and Sridharan,
2008; Keong, 2005). All those can be operated through the use of integrated systems like vendor
managed systems and just in time systems (Keong, 2005). The reduction in safety tocks leads to
reduced obsolescence and storage (Ahmed et al, 2005). Stock out costs are reduced has a result
of parties in the chain sharing information which reduces demand variability (Simatupang and
Sridharan, 2008).
2.1.4 Information sharing and inventory turns
Inventory turns refer to the number of times inventory is converted into cash (Koumanakos,
2008). Chain partners boost earnings by addressing our stock issues (Corsen and Gruen, 2003).
High levels of inventories mean that there are low levels of inventory turns (Koumanakos, 2008).
Non availability of stocks results into losses to all chain partners because customers may decide
to buy another brand, buy items from another store or delay purchase. This comes as a result of
information inefficiencies where the order information sent up the chain does not reflect the true
consumer demand (Corsen and Gruen, 2003). A lack of inventory record accuracy clearly
reduces chain profits due to lost sales and inventory carrying costs, which may run as high as 10
percent of existing profits (Raman et al., 2001).
According to Rogers et al. (1992), chain partners utilizing information systems get information
which enables them to accommodate selected customer request and provide a greater number of
services to customers which will in turn improve chain members’ profits. Systems like
13
automatic purchase ordering systems enable chain partners not to evaluate inventories by moving
down the stores and making orders based on intuition and also improve inventory turns of
component stocks, and uniform the deviation between components (Corsen and Gruen, 2003).
Information sharing enables the chain partners to achieve revenue enhancements (Broersox,
1990; Lee et al., 1997). Information sharing through collaborative efforts enables chain partners
focus on co-managed inventory by considering different levels of demand uncertainty which
enables them to improve fill rate, increase inventory turnover and enhance sales (Parks, 1999).
They improve fill rates ensuring that all customer orders are delivered on time. This leads to
sales enhancement through repeat purchases and increased number of customers (Gunasekeran
and Tirtiroglu, 200I).It also leads to increased responsiveness to market demands, customer
service and increases market share (Anderson and Lee, 1999; Corbett et al 1999; Mentzer et al,
2000; Mc Laren et al, 2002).customer service and responsiveness are increased through
increased flexibility. Information sharing enables chain partners to make products or services
available to meet individual demand of customers and also making changes in products or
services or deli every dates based on the customer's requirement (Gunasekeran and Tirtiroglu,
200I).
Market share is increased through chain partners being able to have the best service level
compared to competitors. To be competitive, chain partners must compare their service to those
of their competitors (Gunasekeran and Tirtiroglu, 2001).
2.1.5 Information sharing and order lead time
14
Information sharing enables the chain partner to compress lead times, improve faster product to
market cycle times, higher flexibility in dealing with supply and demand uncertainties
(Bowersox, 1990; Lee et aI., 1997; Anderson and Lee, 1999; Corbett et al., 1999; Mentzer et al.,
2000; McLaren et al, 2002).With collaboration, customers are able to specify the kind of product
they want and in what quantities (McLaren et aI, 2002).Information sharing enables chain
partners to compress lead times know how much they should have in stocks to meet customer
demands. These stocks will enable chain partners to provide deliveries on time to their customers
(keong et al, 2005). In case of non standardized products, chain partners will be flexible when
the amount of time taken to fulfill customer orders is less than the amount of time the customer is
willing to wait when the order is placed (Wallin, 2006).
Product to market cycles times are reduced when manufacturing firms collaborate closely with
the downstream partners to obtain customer information and seize new market opportunities
(Holmstrom, 2006). Information technology systems are used to encourage close collaboration
and intensive information exchange between the down stream partners, thus creating a flexible
and efficient down stream net work (Omara, 2004).
2.2 Inventory management and customer satisfaction
Better inventory management enables better customer satisfaction (Eckert, 2007). Customers are
satisfied when suppliers fulfill their orders on time (Wilding ,2003).This makes channel partners
keep buffer stocks to fulfill customer orders or enter into long term relationships which require
commitment and trust (Wang,2002).Commitment is the desire to continue a relation ship and
15
may be defined in three dimensions; inputs to it, its durability and its on going consistency
(Wilson,1995,p.337;Mowen and Minor,1998).Trust is the belief that a party’s word or promise is
reliable and a party will fulfill its obligations in an exchange relation ship. High levels of trust
lead to high levels of customer satisfaction (Andaleeb, 1996).
Trust and commitment can be achieved through the use of vendor managed inventory,
consignment inventory and just in time inventory management (Centikaya and Lee,2000).these
enable channel partners to satisfy their customers’ needs through providing on time deliveries
which result into repeat purchases, positive word of mouth and reduced inventory carrying costs
on the customers’ side (Wang,2000).Malz, Arnold and Elliot (2008) point out that customer
satisfaction is obtained through reducing order cycle time which leads to on time deliveries to the
customer through reducing the manufacturer’s production lead time. Customers are satisfied
when suppliers are flexible and responsive (Verwijmeren, Vander and Donselaar, 1996).
2.2.1 Inventory management and flexibility
Flexibility is the extent to which the supplier is willing to make changes to accommodate the
customer's changing or unforeseen needs and to making available the products/ services to meet
the individual demand of customers (Humphrey and Tucker, 2003; Gunasekaran, 2001). It is
particularly valued in case of unforeseen problems or short-term changes in the needs of the
customer. Suppliers displaying flexibility will make quick responses to the buying firm's needs
(Tachizawa and Ginemezi, 2005). There is need for willingness to modify inventory policies or
procedures when this helps a customer (Cheung and Lee, 2002). Being flexible allows a supplier
to demonstrate a general readiness to respond to customer needs and this is supported by the use
16
of information technology which enables integration and information flow within the chain
(Romano, 2003).
Such technologies as flexible manufacturing systems (FMS), group technology (GT), and
computer-integrated manufacturing (CIM) (Ndubisi et al, 2005).The flexibility of downstream
chain is crucial in satisfying customers' changing needs in today's competitive and uncertain
environments (Ndubisi et al, 2005).Chain partners keep excess stock in order to be flexible. They
want to meet customer orders immediately the customer releases it, that is shortens the lead time
(Ayad, 2008).These enable them meet the delivery dates and fill customer orders (Cetinkaya and
lee, 2000).Customers may not return after experiencing many negative experiences and this
means many lost sales to chain partners (Gruen and Corsten, 2006).Firms with advanced
technology as their competitive edge can overcome stiff competition by introducing wide range
of products to meet the different market segments and able to deliver quickly to the hands of
customers before any of its competitors can do so (Ndubisi et al, 2005).
2.2.2 Inventory management and customer loyalty
Chain partners have got to be as efficient as possible (Introna, 1991). Customers have
information concerning all products and services provided by chain partners in the market
(Blather wick, 1996). They can very easily make a decision of taking their business elsewhere if
a retailer, distributor or manufacturer cannot provide first class service in terms of availability of
product (Blatherwick, 1996). Similarly, if retailers, distributors and manufacturers cannot
compete on price, customers will very quickly be aware of this failing and transfer their loyalty.
Customer expectations in terms of service, range, new products and promotions require chain
partners to be flexible indeed (Howgego, 2002).
17
,They have to provide pre and post purchase satisfaction to a customer which results into brand
loyalty of the customers (Agarwal, 2007).1n order to realize fully the benefits of downstream
chain, chain partners have to develop end-to-end integration of systems which will reduce costs,
improve distribution and inventory management and thus customer loyalty (Howgego,
2002).Such systems include the digital loyalty network (DLN) which enables chain partners to
continuously collect and monitor their customer, product and downstream chain data and more
precisely adjust engineering, production, distribution and sales/marketing activities to meet
current, future demand and enhance their partnership with suppliers (Introna, 1991).
2. 2.3 Inventory management and inventory returns
Having the desired products on hand when the customer wants them is critical to satisfy
customer needs. More and more chain partners are using inventory-management information to
improve their ability to fulfill key customer demand and having the right product at the right time
(Anonymous, 1998).Understanding consumer behaviors and market trends can help chain
partners to satisfy customer needs and to manage inventory information efficiently (Lee and
Kleiner, 200l).Customers will return the product if it does not meet their requirements (Stuart et
al, 2005). Products are returned on the sequential consideration of product condition,
obsolescence, back-order status and when products are not environmentally compliant (Stuart et
al, 2005; Blengini, 2008).
2.2.4 Inventory management and quality
Customers are interested in getting defect free products (Davidson et al, 200I). This means that
chain partners have to be flexible and responsive, so that they can be adapted to meet rapidly
18
changing customer expectations (Davidson et al, 2001).There is need for commitment, co
operation and integration among manufacturer, distributors and retailers to meet the changing
customer expectations (Neave, 1995; Chelsom, 1998). In order to satisfy customers, it is crucial
to meet their moment of value which means delivering the right product at the right time and in
the right place (Haag et aI, 1998). Chain partners ensure timely delivery of a product that the
customer really wants through the use of systems like just in time systems.
2.2.5 Inventory management and on time delivery
Customers are satisfied when suppliers (retailers, distributors and manufacturers) are able to deli
ever products or services as and when required. Chain partners maintain high levels of
inventories at their stock point (Koumanakos, 2007). These reduce the amount of time it takes to
deliver the product to the consumer (David et al, 2001). However having these high levels of
inventories only works for standardardised products ((David et al, 2001). They would actually be
counter –productive to meeting customers’ needs for non standardized products (Newman and
Sridharan, 1995; Johnson and Mattson, 2003; Vollmann et al, 2005)
Efforts would be directed to sell what they have rather than what they have rather than what the
customer wants in an attempt to use up inventory. Incase of non standardized products,
customers are satisfied when the amount of time it would take to satisfy the customers is less
than the amount he customer is willing to wait, once an order has been placed
(Wallin,2006).Chain partners have to be flexible in order to satisfy customers’ needs
immediately (Gunasekaran,2001).In order to be flexible, chain partners may be required to
maintain high stock levels or using information technology which helps chain partners to be
19
flexible through providing timely information which leads to better customer service and
inventory management (Ellram,1999).
2.2.6 Inventory management and repeat purchases
Chain partners are facing a challenge of retaining loyal customers (Agarwal, 2007) .They have to
provide pre and post purchase satisfaction to a customer resulting in repeat purchases. Pre-
purchase satisfaction takes into consideration quality, provision of transport, fair prices and
flexibility while post purchase satisfaction looks at service management activities such as repair
services which depend heavily on reverse logistics operations (Amini et al, 2005; Howgego,
2002).
Safety stocks are maintained to reduce the fear chain partners have of loosing a customer due to
un availability of a product (Anonymous,1998).Understanding consumer behaviors and market
trends can help chain partners to satisfy customer needs and to manage inventory information
efficiently (Lee and Kleiner,2001).Customers will return the product if it does not meet their
requirements (Stuart et al,2005).Products are returned on the sequential consideration of product
condition,obsolelecence,bark order status and when products are not environmentally compliant
(Stuart,2005;Blengini,2008).
2.3 Information sharing and customer satisfaction
Chain partners look at information as being power in the downstream chain. This information
enables chain partners gain competitive advantages through increased customer loyalty, repeat
purchases, improved quality products and increased flexibility (Fawcett et al, 2007).
20
Connectivity and collaboration enable chain partners to share such information. As a result,
chain partners are willing to share information that they perceive may place their organizations at
a competitive advantage. A company's willingness to share information that is, its openness to
sharing relevant information honestly and frequently ultimately determines the extent of sharing
that takes place (Lee et aI., 2000; Mendelson, 2000). Huge investments in technology can be
negated by an unwillingness to share needed information.
2.3.1 Information sharing and customer loyalty
Information sharing is conceptualized as the willingness of chain partners to voluntarily provide
focused chain-specific information that can be used to help build and maintain customer
relationships. Using focused individual customer relationships systems enables chain partners to
position their firms toward realizing strategic advantage (Campbell, 2003). Focused customer
information can help support the development of customized products and services that is
products that meet customer demand (Spekman and Carraway, 2006).Customers are considered
as the firm's most valuable asset (Blattberg and Deighton, 1996; Bolton et al., 2004; Peppers and
Rogers, 2004).
Firms increase customer lifetime value (CL V) by building and maintaining relationships with its
customers. Through information sharing, firms are able to get information on customer behaviors
and activities that affect firm profitability from each customer. In order to maintain customer
loyalty, chain partners employ business-to-business (B2B) loyalty programs (Capizzi, 2002).
Loyalty programs are coordinated, membership-based, marketing activities designed to enhance
closer, more cooperative relationships among pre-identified customers toward specific products
21
and services offered by the program sponsor (Lacey and Sneath, 2006). Through targeted
communications and customized delivery of goods and services, B2B loyalty programs attempt
to build stronger bonds with the customers.
2.3.2 Information sharing and inventory returns
Having the desired products on hand when the customer wants them is critical to satisfy
customer needs. More and more chain partners are using inventory-management information to
improve their ability to fulfill key customer demand and having the right product at the right time
(Anonymous, 1998).Having information on consumer behaviors and market trends can help
chain partners to satisfy customer needs and to manage inventory information efficiently (Lee
and Kleiner, 2001).Customers will return the product if it does not meet their requirements
(Stuart et al, 2005).
2.3.3 Information sharing and quality
Information sharing can lead to improved product quality (Menon et al., 1997).Modern
consumers are more demanding than ever and have come to expect to pay the lowest possible
cost for the highest possible quality (Avery, 1998; Cole, 1998; Reed et al, 1996; Scully and
Fawcett, 1997).Customers are interested in getting defect tree products (Davidson et al, 2001).
This means that chain partners have to ensure that they get information as far as the customer
requirements are concerned, so that they can adapt their products to meet rapidly changing
customer expectations (Davidson et al, 2001).There is need for commitment, co-operation and
integration among manufacturer, distributors and retailers to meet the changing customer
expectations (Neave, 1995; Chelsom, 1998).
22
2.3.4 Information sharing and repeat purchases.
Customers are concerned when chain partners do not deliver products that meet their
specifications (Agarwal, 2007). Chain partners employ strategies that enable customers disclose
their product information (Fritiche and Kim, 2003). The chain partner will then be able to
provide a product that meets the customers' product specifications and the customer will then
feel obligated to buy the product presented to him. In order to ensure that customers purchase
more, chain partners have to be committed and consistent with what they have already done
(Fritiche and Kim, 2003). Chain partners employ information systems and collaborate with their
customers in order to offer the best services to them. These enable chain partners reduce
purchase prices, save time and ensure on time availability of the products (Carter et aI, 2004; Dai
and Kauffman, 2002; Emiliani, 2004; Pinker et aI , 2003; Presutti, 2003; Smart and
Harrison,2003; Smeltzer and Carr, 2002, 2003).
2.3.5 Information sharing and flexibility
Flexibility is the extent to which the supplier is willing to make changes to accommodate the
Customer’s changing or unforeseen needs and to making available the products or services to
meet the individual demand of customers (Humphrey and Tucker, 2003; Gunasekaran,
2001).Frequent communication enables chain partners to react to demand changes (Kaipia et al
2002). This provides information on the changing customers' tastes and preferences. Chain
partners will respond to such changes through the use of information technology which enables
information flow within the chain and customer collaboration which shows the willingness of
chain partners to release the information (Romano, 2003). The flexibility of downstream chain is
23
crucial in satisfying customers' changing needs in today's competitive and uncertain
environments (Ndubisi et al, 2005).
2.3.6 Information sharing and on time delivery
Chain partners require information in order to make on time deliveries to their customers
(Koumanakos, 2007).Customers are satisfied when suppliers (retailers and distributors) are able
to deli ever products or services as and when required. Chain partners maintain high levels of
collaboration and information technology in order to receive information concerning their
customer needs .This reduces the amount of time it takes to deliver the product to the consumers
(Davidson et al, 200I). Customers are satisfied when the amount of time taken to satisfy them is
less than the amount of time they willing to wait, once an order has been placed (Wallin,
2006).Chain partners have to be flexible in order to beat the customer deli every dead lines
(Gunasekara, 2001). In order to be flexible, chain partners may be required to share information
which helps them deli ever with the customers specified deli every dates (Ellram, 1999).
,
Conclusion
As the foregoing indicates, information sharing is one of the downstream chain problems that
affect inventory management. Whereas information sharing is the focus for all chain partners,
there is need for establishment of customer collaborations and implementation of information
technology infrastructures. Information technology cannot work in isolation; there is need for
collaboration among chain partners. Information technology, customer collaboration and
inventory management have a signifinicant influence on customer satisfaction.
24
CHAPTER THREE
Methodology
3.0 Introduction
The chapter presents methods that were used in the study. It includes research design, sample
design, target population, sample size, and measurement of variables, research instruments,
measurement of reliability of research instruments, data analysis and limitations encountered
during the study.
3.1 Research design
The study used a quantitative and cross sectional correlational survey research design.
3.2 Sample design
The researcher used a disproportionate stratified sampling design. The researcher used a
disproportionate sample design because the number of the people in the strata was different.
Convenience sampling was used to select respondents who provided the required information
during the study. All respondents from the different strata were chosen using convenience
sampling.
3.3 Measurement of variables
Information sharing was measured using Morgan and Hunt (1994), Doney and cannon (1997) for
trust, Morgan and Hunt (1994) and McDonald and Gandz (1992) for commitment and Sabbath
(1998) for technology. The measurements looked at the retailer and vendor's benevolence,
vendor and retailer's long term orientation, vendor and retailer’s credibility. Measures for
25
information technology basically looked at the systems used in information sharing. Information
sharing retailer had a reliability coefficient of 0. 73 and Information sharing -distributor had a
reliability coefficient of 0.70
Customer satisfaction was measured using Vazquez et al (2004), Walter, Mentzer and Croxton
(2002) and Berry and Parasuraman (1991) .The measures included Customer loyalty, repeated
purchases, inventory returns, quality and flexibility. Customer satisfaction -retailer had a
reliability coefficient of 0. 76 and customer satisfaction -distributor had a reliability coefficient
of 0.77.
Inventory management was measured using Gunasekaran and Patel (2001) .Inventory
management measures included order lead time, inventory accuracy, inventory turns, inventory
costs and inventory levels. Inventory management -retailer had a reliability coefficient of 0.80
and inventory management -distributor had a reliability coefficient of 0.60.
3.4 Target population and Study Area
The researcher focused on an indirect chain consisting of registered distributors and retailers of
manufacturing firms both on large and small scale. Managers of the distribution centers and
retail businesses were interviewed regardless of whether they were owners or not owners of the
businesses. The target respondents included 504 distributors and 1544 retailers. The total
population was 2048. The researcher limited herself to Kampala because most of the
manufacturing firms have agents in Kampala and it's a strategic business area where information
technology is more developed compared to other area.
26
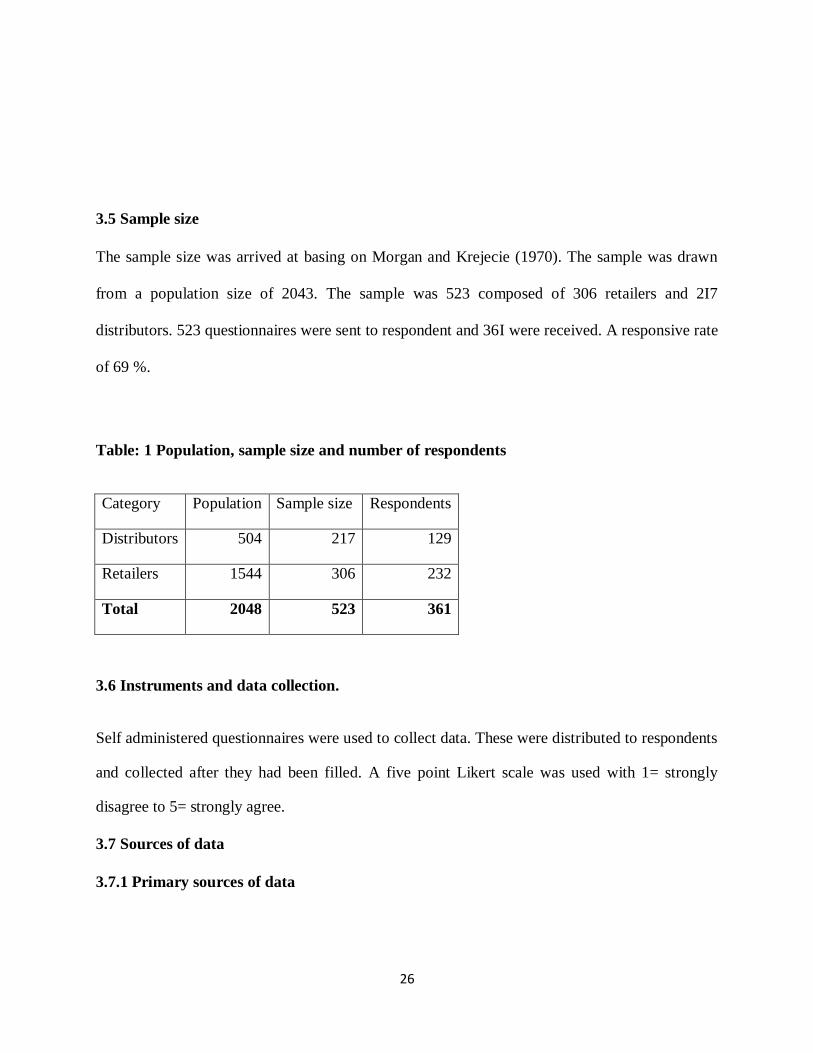
3.5 Sample size
The sample size was arrived at basing on Morgan and Krejecie (1970). The sample was drawn
from a population size of 2043. The sample was 523 composed of 306 retailers and 2I7
distributors. 523 questionnaires were sent to respondent and 36I were received. A responsive rate
of 69 %.
Table: 1 Population, sample size and number of respondents
Category Population Sample size Respondents
Distributors 504 217 129
Retailers 1544 306 232
Total 2048 523 361
3.6 Instruments and data collection.
Self administered questionnaires were used to collect data. These were distributed to respondents
and collected after they had been filled. A five point Likert scale was used with 1= strongly
disagree to 5= strongly agree.
3.7 Sources of data
3.7.1 Primary sources of data
27
Primary data was obtained from respondents using self administered questionnaires to get data
on the study variables.
3.7.2 Secondary data sources
Secondary data about the study variables was got from reports to strengthen the findings got the
primary data.
3.8 Data analysis
Editing and coding of data was done when questionnaires were collected and there after data was
analyzed. Data was analyzed using the Statistical Package for Social Scientists Software to find
the correlation between the variables. The relationship between information sharing, inventory
management and customer satisfaction was analyzed using Pearson correlation coefficient
(establishes the significance and direction of the relationships between variables being studied),
multiple regression (which determines the predictive strength of the independent variable on the
dependent variable) ,reliability tests were also carried out , cross tabulations which describe
sample characteristics and analysis of variance ANOVA tests and T-tests (which determine the
difference in perception about the variables in relation to the sample characteristics).
28
.
CHAPTER FOUR
PRESENTATION AND ANALYSIS OF FINDINGS
4.0 Introduction
This chapter is comprised of the presentation and analysis of findings. It includes descriptive
statistics, correlation analysis, regression analysis, analysis of variance test and T tests. These
show the results as tested by the objective of the study which were to;
i). Establish the relationship between information sharing and inventory management
downstream chain of manufacturing firms
ii). Establish the relationship between inventory management and customer satisfaction in
downstream chain of manufacturing firms
iii). Establish the relationship between information sharing and customer satisfaction
downstream chain of manufacturing firms.
29
iv). Establish the relationship between information sharing, inventory management and customer
satisfaction in downstream chain of manufacturing firms.
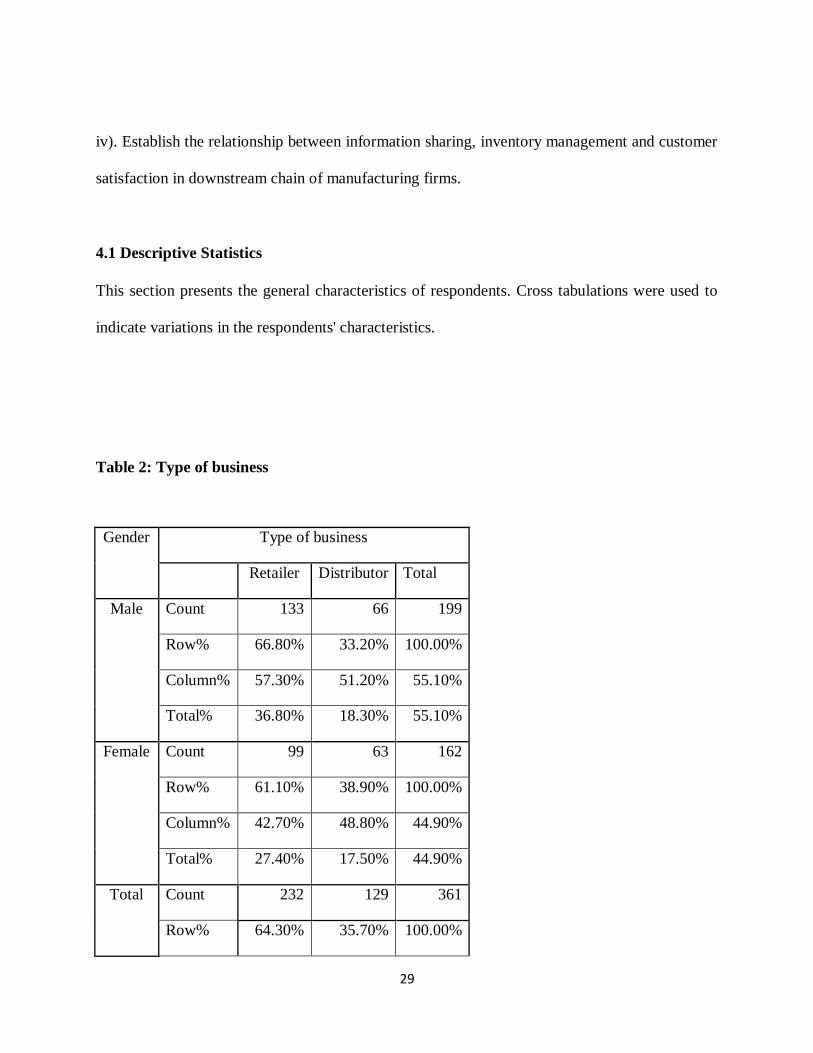
4.1 Descriptive Statistics
This section presents the general characteristics of respondents. Cross tabulations were used to
indicate variations in the respondents' characteristics.
Table 2: Type of business
Gender Type of business
Retailer Distributor Total
Male Count 133 66 199
Row% 66.80% 33.20% 100.00%
Column% 57.30% 51.20% 55.10%
Total% 36.80% 18.30% 55.10%
Female Count 99 63 162
Row% 61.10% 38.90% 100.00%
Column% 42.70% 48.80% 44.90%
Total% 27.40% 17.50% 44.90%
Total Count 232 129 361
Row% 64.30% 35.70% 100.00%
30
Column% 100.00% 100.00% 100.00%
Total% 64.30% 35.70% 100.00%
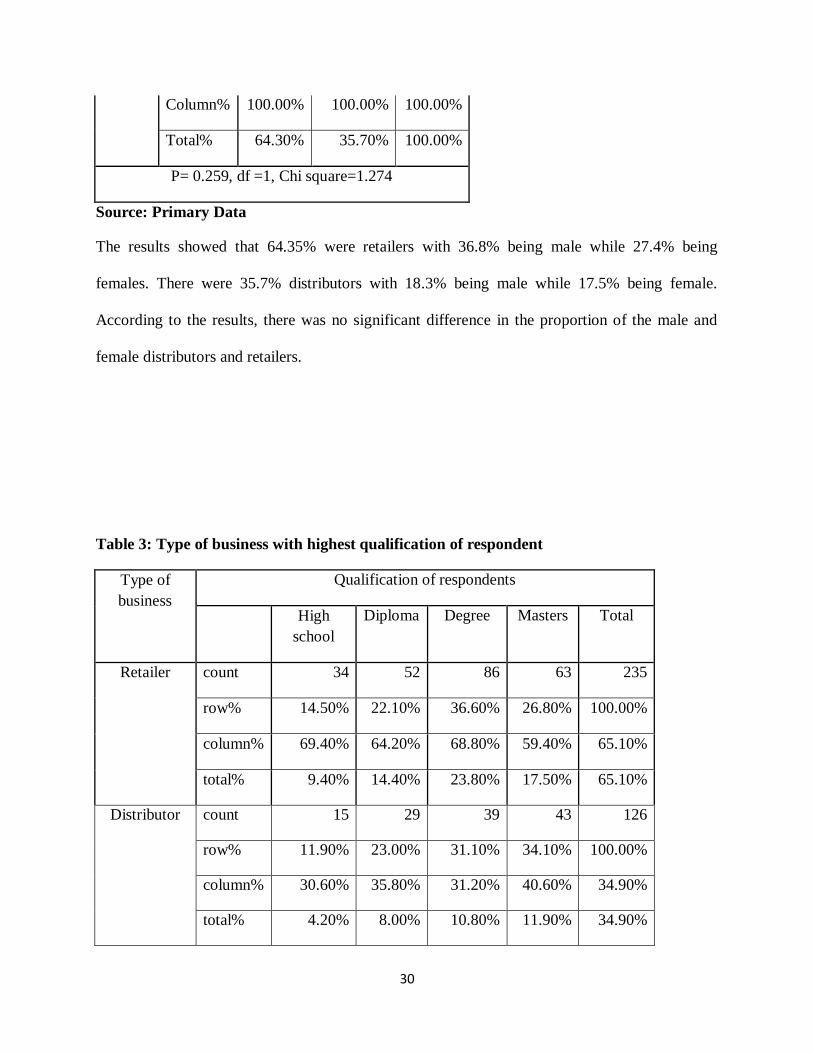
P= 0.259, df =1, Chi square=1.274
Source: Primary Data
The results showed that 64.35% were retailers with 36.8% being male while 27.4% being
females. There were 35.7% distributors with 18.3% being male while 17.5% being female.
According to the results, there was no significant difference in the proportion of the male and
female distributors and retailers.
Table 3: Type of business with highest qualification of respondent
Type of
business
Qualification of respondents
High
school
Diploma Degree Masters Total
Retailer count 34 52 86 63 235
row% 14.50% 22.10% 36.60% 26.80% 100.00%
column% 69.40% 64.20% 68.80% 59.40% 65.10%
total% 9.40% 14.40% 23.80% 17.50% 65.10%
Distributor count 15 29 39 43 126
row% 11.90% 23.00% 31.10% 34.10% 100.00%
column% 30.60% 35.80% 31.20% 40.60% 34.90%
total% 4.20% 8.00% 10.80% 11.90% 34.90%
31
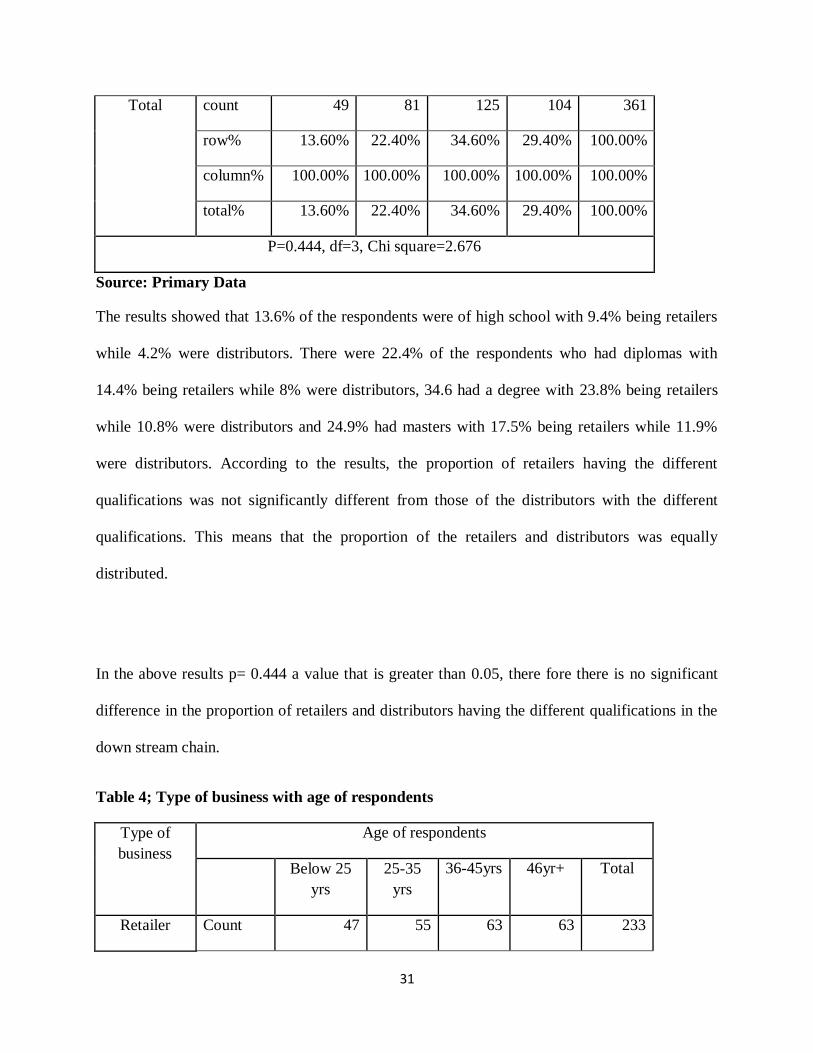
Total count 49 81 125 104 361
row% 13.60% 22.40% 34.60% 29.40% 100.00%
column% 100.00% 100.00% 100.00% 100.00% 100.00%
total% 13.60% 22.40% 34.60% 29.40% 100.00%
P=0.444, df=3, Chi square=2.676
Source: Primary Data
The results showed that 13.6% of the respondents were of high school with 9.4% being retailers
while 4.2% were distributors. There were 22.4% of the respondents who had diplomas with
14.4% being retailers while 8% were distributors, 34.6 had a degree with 23.8% being retailers
while 10.8% were distributors and 24.9% had masters with 17.5% being retailers while 11.9%
were distributors. According to the results, the proportion of retailers having the different
qualifications was not significantly different from those of the distributors with the different
qualifications. This means that the proportion of the retailers and distributors was equally
distributed.
In the above results p= 0.444 a value that is greater than 0.05, there fore there is no significant
difference in the proportion of retailers and distributors having the different qualifications in the
down stream chain.
Table 4; Type of business with age of respondents
Type of
business
Age of respondents
Below 25
yrs
25-35
yrs
36-45yrs 46yr+ Total
Retailer Count 47 55 63 63 233
32
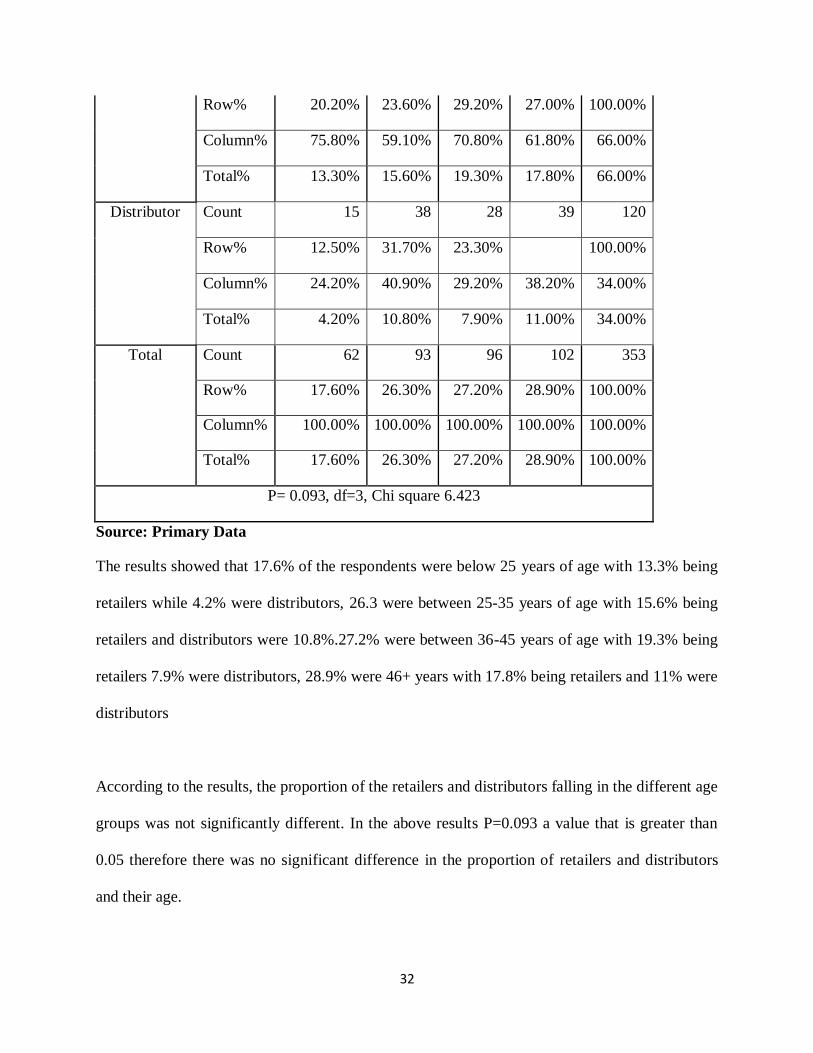
Row% 20.20% 23.60% 29.20% 27.00% 100.00%
Column% 75.80% 59.10% 70.80% 61.80% 66.00%
Total% 13.30% 15.60% 19.30% 17.80% 66.00%
Distributor Count 15 38 28 39 120
Row% 12.50% 31.70% 23.30% 100.00%
Column% 24.20% 40.90% 29.20% 38.20% 34.00%
Total% 4.20% 10.80% 7.90% 11.00% 34.00%
Total Count 62 93 96 102 353
Row% 17.60% 26.30% 27.20% 28.90% 100.00%
Column% 100.00% 100.00% 100.00% 100.00% 100.00%
Total% 17.60% 26.30% 27.20% 28.90% 100.00%
P= 0.093, df=3, Chi square 6.423
Source: Primary Data
The results showed that 17.6% of the respondents were below 25 years of age with 13.3% being
retailers while 4.2% were distributors, 26.3 were between 25-35 years of age with 15.6% being
retailers and distributors were 10.8%.27.2% were between 36-45 years of age with 19.3% being
retailers 7.9% were distributors, 28.9% were 46+ years with 17.8% being retailers and 11% were
distributors
According to the results, the proportion of the retailers and distributors falling in the different age
groups was not significantly different. In the above results P=0.093 a value that is greater than
0.05 therefore there was no significant difference in the proportion of retailers and distributors
and their age.
33
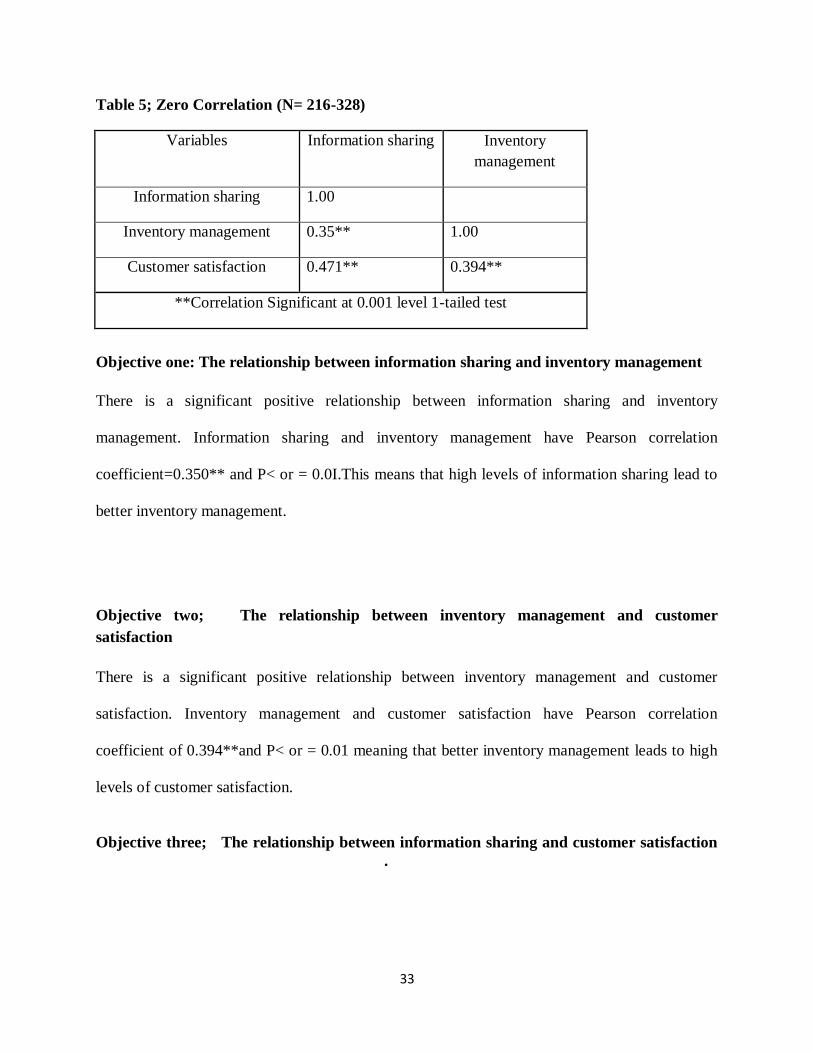
Table 5; Zero Correlation (N= 216-328)
Variables Information sharing Inventory
management
Information sharing 1.00
Inventory management 0.35** 1.00
Customer satisfaction 0.471** 0.394**
**Correlation Significant at 0.001 level 1-tailed test
Objective one: The relationship between information sharing and inventory management
There is a significant positive relationship between information sharing and inventory
management. Information sharing and inventory management have Pearson correlation
coefficient=0.350** and P< or = 0.0I.This means that high levels of information sharing lead to
better inventory management.
Objective two; The relationship between inventory management and customer
satisfaction
There is a significant positive relationship between inventory management and customer
satisfaction. Inventory management and customer satisfaction have Pearson correlation
coefficient of 0.394**and P< or = 0.01 meaning that better inventory management leads to high
levels of customer satisfaction.
Objective three; The relationship between information sharing and customer satisfaction
.
34
There is a significant positive relationship between information sharing and customer
satisfaction. Information sharing and customer satisfaction have Pearson correlation coefficient
of 0.471 ** and P< or = 0.01 meaning that high levels of information sharing leads to high levels
of customer satisfaction.
Objective four; The relationship between information sharing, inventory management and
customer satisfaction
There is a significant strong positive relationship between information sharing and inventory
management. Information sharing and inventory management have Pearson correlation,
coefficient=0.350** and P< or = 0.01. This means that high levels of information sharing lead to
better inventory management. There is a significant strong positive relationship between
inventory management and customer satisfaction. Inventory management and customer
satisfaction have Pearson correlation coefficient of 0.394**and P< or = 0.01 meaning that better
inventory management leads to high levels of customer satisfaction.
There is a significant strong positive relationship between information sharing and inventory
management. Information sharing and inventory management have Pearson correlation
coefficient=0.350** and P< or = 0.01. This means that high levels of information sharing lead to
better inventory management.
There is a significant positive relationship between information sharing and customer
satisfaction. Information sharing and customer satisfaction have Pearson correlation coefficient
35
of 0.471 ** and P< or = 0.01 meaning that high levels of information sharing leads to high levels
of customer satisfaction.
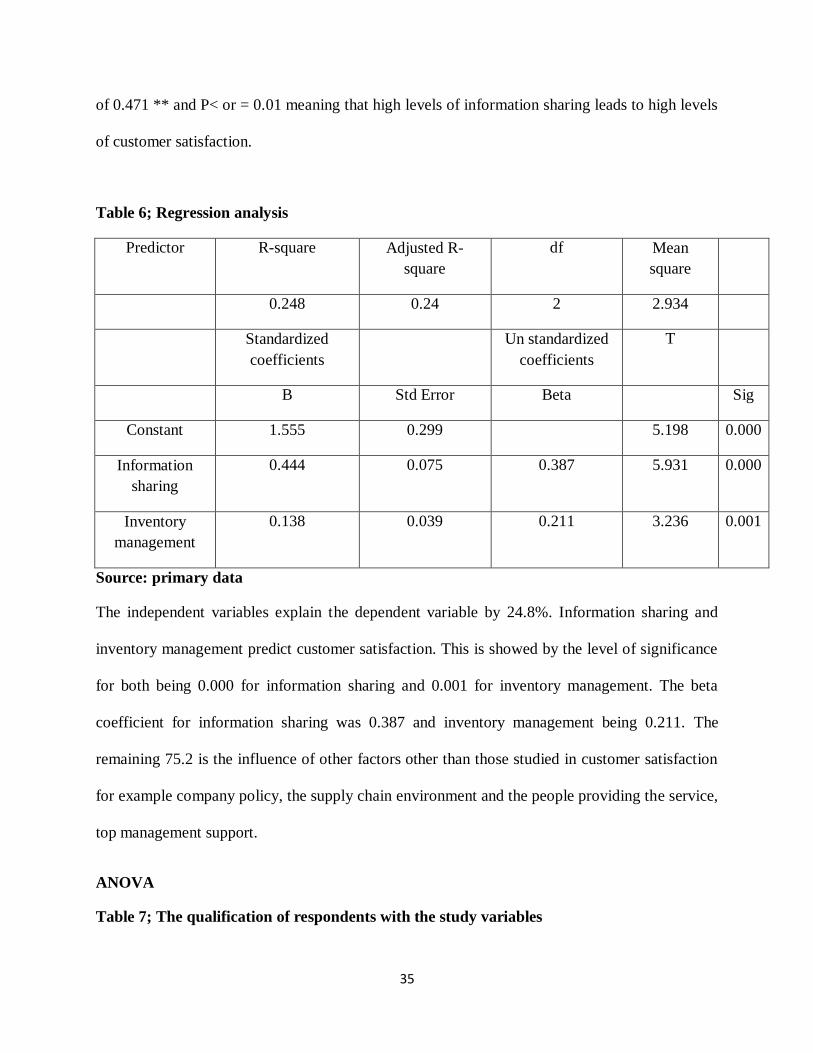
Table 6; Regression analysis
Predictor R-square Adjusted R-
square
df Mean
square
0.248 0.24 2 2.934
Standardized
coefficients
Un standardized
coefficients
T
B Std Error Beta Sig
Constant 1.555 0.299 5.198 0.000
Information
sharing
0.444 0.075 0.387 5.931 0.000
Inventory
management
0.138 0.039 0.211 3.236 0.001
Source: primary data
The independent variables explain the dependent variable by 24.8%. Information sharing and
inventory management predict customer satisfaction. This is showed by the level of significance
for both being 0.000 for information sharing and 0.001 for inventory management. The beta
coefficient for information sharing was 0.387 and inventory management being 0.211. The
remaining 75.2 is the influence of other factors other than those studied in customer satisfaction
for example company policy, the supply chain environment and the people providing the service,
top management support.
ANOVA
Table 7; The qualification of respondents with the study variables
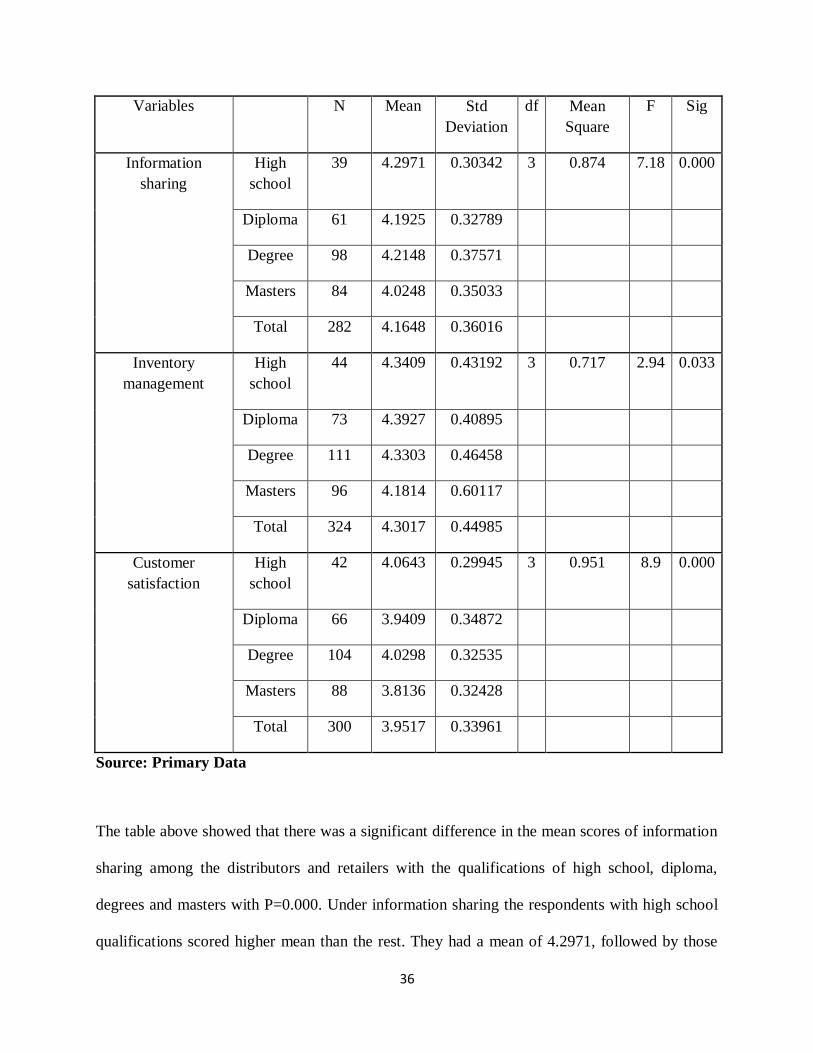
36
Variables N Mean Std
Deviation
df Mean
Square
F Sig
Information
sharing
High
school
39 4.2971 0.30342 3 0.874 7.18 0.000
Diploma 61 4.1925 0.32789
Degree 98 4.2148 0.37571
Masters 84 4.0248 0.35033
Total 282 4.1648 0.36016
Inventory
management
High
school
44 4.3409 0.43192 3 0.717 2.94 0.033
Diploma 73 4.3927 0.40895
Degree 111 4.3303 0.46458
Masters 96 4.1814 0.60117
Total 324 4.3017 0.44985
Customer
satisfaction
High
school
42 4.0643 0.29945 3 0.951 8.9 0.000
Diploma 66 3.9409 0.34872
Degree 104 4.0298 0.32535
Masters 88 3.8136 0.32428
Total 300 3.9517 0.33961
Source: Primary Data
The table above showed that there was a significant difference in the mean scores of information
sharing among the distributors and retailers with the qualifications of high school, diploma,
degrees and masters with P=0.000. Under information sharing the respondents with high school
qualifications scored higher mean than the rest. They had a mean of 4.2971, followed by those
37
with degrees with a mean of 4.2148, then diploma with a 4.1925 mean, followed by those with
masters with a mean of 4.0248. The respondents of high school have a high mean in information
sharing because there no collaboration with in the Uganda environment but where there is
collaboration, the highly learnt will share more information compared to those of high school.
There was a significant difference in the mean scores of inventory management among the
distributors and retailers with the qualifications of high school, diploma, degrees and masters
with P = 0.033 which is less than 0.05. The respondents of diploma scored the highest with a
4.3927, followed by the respondents with high school with a mean score of 4.3409, then degrees
school with a mean score of 0.46458 and lastly masters with a mean score of 4.1814.
There was a significant difference in the mean scores of customer satisfaction among the
distributors and retailers with the qualifications of high school, diploma, degrees, masters and
professional with p=0.000. the respondents of high school had the highest mean score which was
4.0643 ,followed by the respondents with degrees with a mean score of 4.0298 ,followed by
respondents with diplomas with a mean score of 3.9409 and lastly by the respondents who had
masters with a mean score of 3.9409
This means that distributors and retailers having the different qualifications had different
perceptions on information sharing, inventory management and customer satisfaction. This
means that having the different qualifications had an effect on the channel partners' perception of
the study variables.
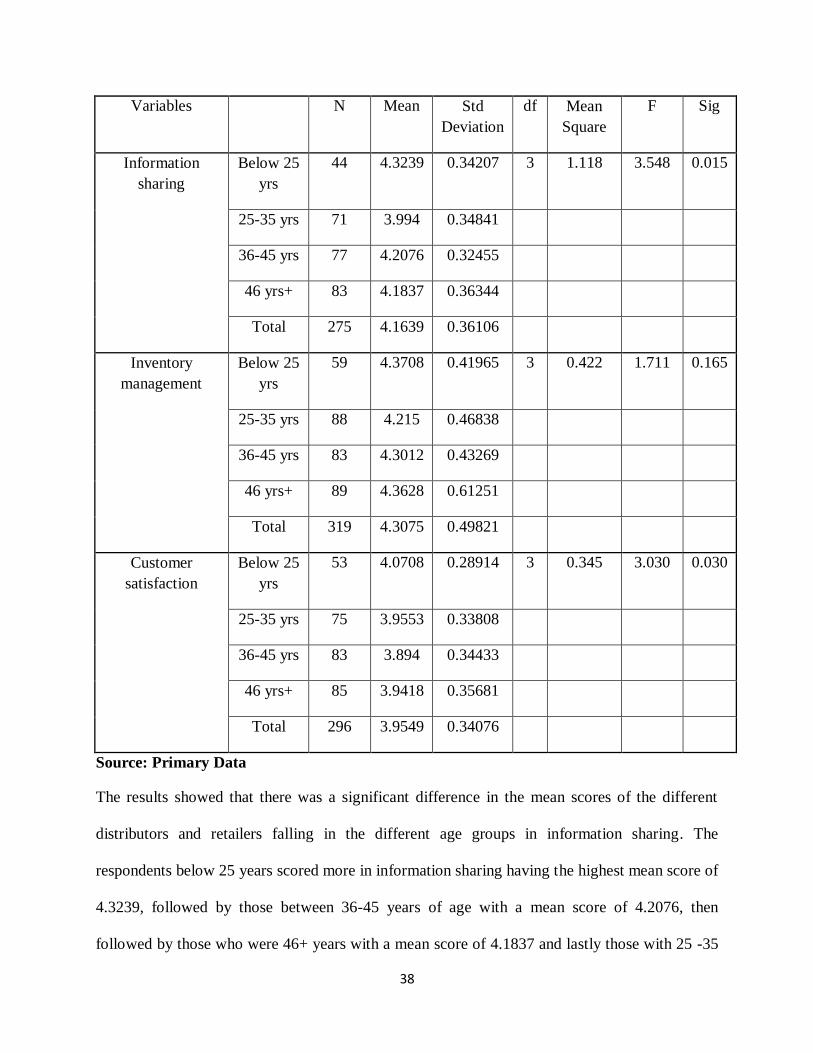
Table 8: Age of respondents with the study variables
38
Variables N Mean Std
Deviation
df Mean
Square
F Sig
Information
sharing
Below 25
yrs
44 4.3239 0.34207 3 1.118 3.548 0.015
25-35 yrs 71 3.994 0.34841
36-45 yrs 77 4.2076 0.32455
46 yrs+ 83 4.1837 0.36344
Total 275 4.1639 0.36106
Inventory
management
Below 25
yrs
59 4.3708 0.41965 3 0.422 1.711 0.165
25-35 yrs 88 4.215 0.46838
36-45 yrs 83 4.3012 0.43269
46 yrs+ 89 4.3628 0.61251
Total 319 4.3075 0.49821
Customer
satisfaction
Below 25
yrs
53 4.0708 0.28914 3 0.345 3.030 0.030
25-35 yrs 75 3.9553 0.33808
36-45 yrs 83 3.894 0.34433
46 yrs+ 85 3.9418 0.35681
Total 296 3.9549 0.34076
Source: Primary Data
The results showed that there was a significant difference in the mean scores of the different
distributors and retailers falling in the different age groups in information sharing. The
respondents below 25 years scored more in information sharing having the highest mean score of
4.3239, followed by those between 36-45 years of age with a mean score of 4.2076, then
followed by those who were 46+ years with a mean score of 4.1837 and lastly those with 25 -35
39
years of age with a mean score of 3.994. The respondents below 25 years shared information
more than the others due to lack of collaboration with in the environment.
The was a significant difference of the respondents in customer satisfaction with p= 0.030 for
customer satisfaction between retailers and distributors. The respondents below the age of 25
years had the highest mean score of 4.0708, followed by those with the age of 25-35 years with
a mean score of 3.9553, then followed by those with the ages of 46+ years with a mean score of
3.9418 and lastly those with the age of 36-45 years with a mean score of 3.894. The young were
more satisfied because it was easy for them to change their decisions to purchase a different
product than that they had come to purchase which could serve the same purpose unlike the old.
There was no significant difference in the mean scores of the respondents in inventory
management. P=0.165 for inventory management which was greater than 0.05.
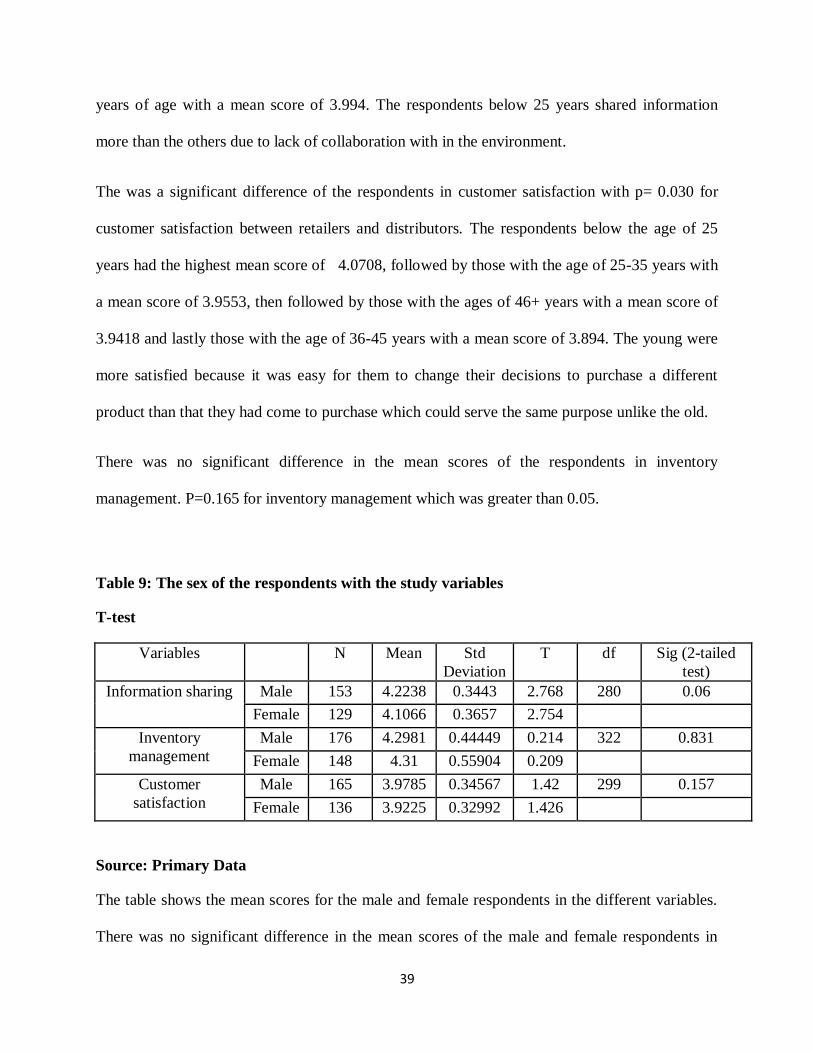
Table 9: The sex of the respondents with the study variables
T-test
Variables N Mean Std
Deviation
T df Sig (2-tailed
test)
Information sharing Male 153 4.2238 0.3443 2.768 280 0.06
Female 129 4.1066 0.3657 2.754
Inventory
management
Male 176 4.2981 0.44449 0.214 322 0.831
Female 148 4.31 0.55904 0.209
Customer
satisfaction
Male 165 3.9785 0.34567 1.42 299 0.157
Female 136 3.9225 0.32992 1.426
Source: Primary Data
The table shows the mean scores for the male and female respondents in the different variables.
There was no significant difference in the mean scores of the male and female respondents in
40
information sharing, inventory management and customer satisfaction. The P value for inventory
management was 0.831, customer satisfaction was 0.157 and information sharing was 0.06
which were all greater than 0.05. This meant that the sex of the respondents did not affect the
way these people perceived the study variables.
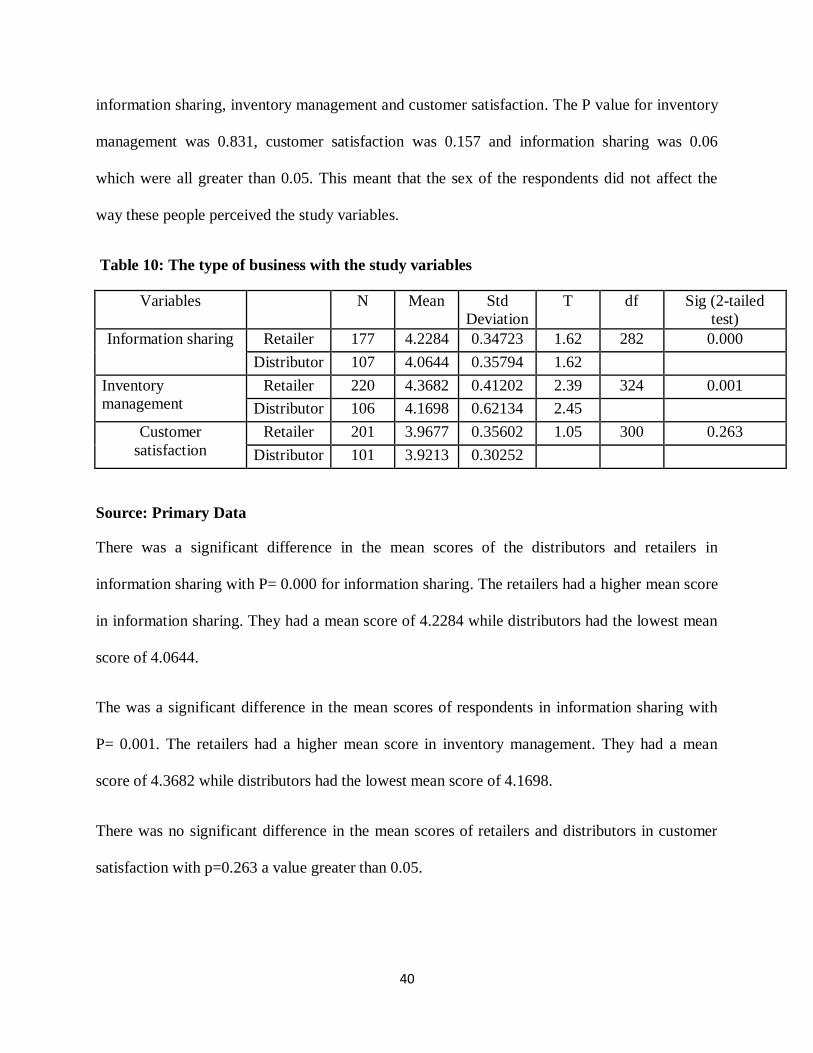
Table 10: The type of business with the study variables
Variables N Mean Std
Deviation
T df Sig (2-tailed
test)
Information sharing Retailer 177 4.2284 0.34723 1.62 282 0.000
Distributor 107 4.0644 0.35794 1.62
Inventory
management
Retailer 220 4.3682 0.41202 2.39 324 0.001
Distributor 106 4.1698 0.62134 2.45
Customer
satisfaction
Retailer 201 3.9677 0.35602 1.05 300 0.263
Distributor 101 3.9213 0.30252
Source: Primary Data
There was a significant difference in the mean scores of the distributors and retailers in
information sharing with P= 0.000 for information sharing. The retailers had a higher mean score
in information sharing. They had a mean score of 4.2284 while distributors had the lowest mean
score of 4.0644.
The was a significant difference in the mean scores of respondents in information sharing with
P= 0.001. The retailers had a higher mean score in inventory management. They had a mean
score of 4.3682 while distributors had the lowest mean score of 4.1698.
There was no significant difference in the mean scores of retailers and distributors in customer
satisfaction with p=0.263 a value greater than 0.05.
41
CHAPTER FIVE
DISCUSSION, CONCLUSIONS AND RECOMMENDATIONS OF FINDINGS
5.0 Introduction
The study focused on the relationship between information sharing, inventory management and
customer satisfaction. The study was carried out to find out whether customer satisfaction in the
downstream chain could be attributed to information sharing and inventory management levels.
This chapter is divided into four sections, .discussion of findings, conclusions, recommendations
and areas for further research. These sections are guided by the study objectives.
5.1 Discussion of findings
The discussion of the findings is in relation with the objectives of the study.
5.1.1 Objective one; The relationship between information sharing and inventory
management.
The Pearson correlation coefficient showed that there was a significant positive relationship
between information sharing and inventory management. This means that high levels of
information sharing lead to better inventory management.
42
Findings were supported by (Fasanghari, Roudsari and Kamal, 2008) who said that for better
inventory management, chain partners were required to share information among themselves.
High levels of information sharing were enhanced by high levels of information technology and
customer collaboration (Shore and Venkatachalam, 2003).
43
These led to better inventory management. They enabled chain partners to get information as far
as the inventory status was concerned, lead to inventory accuracy through better forecasting,
reduced order time and reduced inventory costs (Lee and Wang, 2000).
This is attributed to the fact that the chain partners are willing to give out the required
information to each other, implementation of information technologies like electronic data
interchange (EDI),point of sell systems (POS) ,mobile phones and many others as well as
collaboration among chain partners.
Objective two: The relationship between inventory management and customer satisfaction
The Pearson correlation coefficient showed that there was a significant positive relationship
between inventory management and customer satisfaction. This implies that better inventory
management within the downstream chain would lead to high levels of customer satisfaction.
Findings were supported by Eckert (2007) who asserts that better inventory management leads to
high levels of customer satisfaction. Customers were satisfied when suppliers fulfilled their
orders on time.
This made channel partners to keep buffer stocks to full fill customer orders or enter into long
term relationships which require commitment and trust (Wang, 2002).Better inventory
management enhanced chain partner flexibility, repeat purchases, customer loyalty, reduced
inventory returns due to improved quality (Wang, 2002). Without better inventory management
customer requirements cannot be met on time. Implementation of information technologies and
44
existence of collaboration among chain partners led to better inventory management which
enhanced customer satisfaction through on time availability of information concerning customer
need. This is showed by the significant positive relationship between inventory management and
customer satisfaction.
Objective three; The relationship between information sharing and customer satisfaction.
Pearson correlation coefficients indicated that there was a significant positive relationship
between information sharing and customer satisfaction. This means that if information sharing
increases, customer satisfaction is improved. According to Fawcett etal, 2007 information
sharing enables chain partners gain competitive advantages through increased customer loyalty,
repeat purchases, improved quality products and increased flexibility.
This enables them get information on the kind and type of products required by customers and
hence they will transfer that information up the chain such that manufacturers produce such
items.
Objective four; The relationship between information sharing, inventory management and
customer satisfaction
Pearson correlation coefficients indicated that there was a significant positive relationship
between information sharing and inventory management. This means that if information sharing
increases, inventory management is improved. Similarly there was a significant positive
relationship between inventory management and customer satisfaction. This means that high
levels of inventory management lead to high levels of customer satisfaction. This is attributed to
45
existence of high levels of information technology and collaborations among chain partners
(Shore and Venkatachalam, 2003).
Pearson correlation coefficients indicated that there was a significant positive relationship
between information sharing and customer satisfaction. This means that if information sharing
increases, customer satisfaction is improved. According to Fawcett eta!, 2007 information
sharing enables chain partners' gain competitive advantages through increased customer loyalty,
repeat purchases, improved quality products and increased flexibility.
Over all the findings showed significant relation ships among the variables and cases of ANOVA
and T-TESTS, the findings showed that the young gave out more information more than the old
because a collaborative environment was lacking in the Ugandan setting. Further still the
respondents with qualifications of high school shared more information in a non collaborative
environment than a collaborative environment. This meant that in order for old to share
information there was need for a collaborative environment.
Also the significance difference among retailers and distributors in the T-TEST, meant that the
retailers are smaller than the distributors so they old adopted the simple means to sharing
information and managing their inventory management compared to the distributors who could
afford to put the best systems in place and these could enable them share information and
manage their inventories well.
46
The findings found out that there was no relation ship between sex and the study variables that is
the sex of respondents did not affect their information sharing, inventory management and
customer satisfaction in the down stream chain.
Lastly the regression value showed that information sharing had the highest beta coefficient
which meant that more emphasis should be put on information sharing and then inventory
management.
5.2 Conclusion
It was established from the study that there was a significant positive relationship between
information sharing and inventory management, a significant strong positive relationship
between inventory management and customer satisfaction, a significant strong positive
relationship between information sharing and customer satisfaction and a significant strong
positive relationship between information sharing, inventory management and customer
satisfaction.
The study findings revealed that a significant positive relationship between information sharing
and inventory management meant that if chain partners implement information technologies and
collaborate among each other, then inventory management could improve.
47
The research findings also revealed a significant positive relationship between inventory
management and customer satisfaction. This implies that in order to obtain high levels of
customer satisfaction, there is need for better inventory management. The research findings
further showed significant positive relationship between information sharing and customer
satisfaction. This implies that increased levels of information sharing among chain partners lead
to improved levels in customer satisfaction.
5.3 Recommendations
,
The study focused on information sharing, inventory management and customer satisfaction in
the downstream chain. since there were significant positive relationships between information
sharing and inventory management, inventory management and customer satisfaction,
information sharing and customer satisfaction and information sharing ,inventory management
and customer satisfaction; the following recommendations were made,
It is recommended that chain partners should implement information systems. systems like EDI
(electronic data interchange),ERP systems (enterprise resource planning systems),POS (point of
sale systems and many others should be installed to provide information that will then be used to
manage inventories very well among chain partners hence leading to customer satisfaction.
These systems will be used to manage inventory levels, reduce inventory costs, lead time,
increase inventory turns and customer service. They will promote flexibility, on time delivery
hence leading to customer satisfaction.
48
Chain partners should collaborate amongst themselves which will facilitate information sharing,
lead to better inventory management hence leading to high levels of customer satisfaction. This
enables chain partners to develop willingness amongst them which will increase the level of
information sharing.
The ministry of trade should give loans to USSIA and PSFI which will be given to the retailers
and distributors to invest more in information technology which will then lead to improved
information sharing and inventory management.
5.4 Limitations of the study
i). The researcher incurred high costs when conducting the study. The researcher tried to utilize
the little money she had in order to finish her research.
ii). Since little research on information sharing, inventory management and customer satisfaction
in downstream chains of manufacturing firms had been carried out here in Uganda, there was
limited literature and scarcity of local secondary data hence foreign data was used in lieu. The
researcher tried to carry out an internet search on all web sites to find out if there was any
research in the area and she managed to get articles from the World Bank website, Google and
Yahoo. She also went to UMA library and UBOS library where she managed to secure some
information.
iii) Some respondents showed unwillingness and low cooperation in filling question. The
researcher secured willingness from them through buying them lunch and meeting them in their
free time.
49
iv). The researcher had to use a longitudinal research design but due to the time constraint, she
decided to use the quantitative and cross sectional correctional survey research design.
5.5 Areas for further research
The study concentrated on information sharing, inventory management and customer
Satisfaction. There is need for research in the following areas.
Collaborative Inventory management and customer satisfaction.
Information accessibility, Customer responsiveness and enhanced performance
.Supply chain environment and customer satisfaction
Relationship between qualifications and customer satisfaction in the down stream chain
Relation ship between qualifications and inventory management in the down stream
chain
50
References
Agarwal.V (2007). Contemporary Issues in Supply Chain Management: A case study of
Marico Industries, Supply Chain Management, New Century Publications, New Delhi, p.
152-165
Amini etal (2005) Quality in Supply Chain Management and Logistics
International Journal of Production Economics Volume 96, Issue 3, 18 June 2005, Pages
367-380
Anderson, D.L. and Lee, H.L. (199~), "Synchronized supply chains: the new IT frontier", in
Anderson, D. (Ed.), Achieving Supply Chain Excellence through Technology,
Montgomery Research, San Francisco, CA.
Angulo, A., Watchman, H. and Waller, M.A. (2004), "Supply chain information sharing in a
VMIpartnership", Journal of Business Logistics, Vol. 25 No.1, pp. 101-20.
Anthony, DR (2000), "A two-phased approach to the supply network reconfiguration problem",
European Journal of Operational Research, Vol. 122 No.1, pp. 18-30.
Anonymous. (1998). "Discount Stores ". Chain Store Age, pp.l0A-llA.
Arnold, Maltz & Elliot (2008) Customer service in the distributor channel empirical findings
Journal of Business Logistics
Ansari, A. and Modaress, B. (1990), Just in Time Purchasing, Free Press, New York, NY.
Aviv (2001) The effect of collaborative forecasting on supply chain performance Journal
of management science 47, pages: 1326 - 1343
Ayad.A,(2008) Optimizing inventory and store results in big box retail environment International
Journal of Retail & Distribution Management Vol. 36 No.3, 2008 pp. 180-191
Baganha, M.P. and Cohen, M.A. (1998), "The stabilizing effect of inventory in supply
chains", Operations Research, Vol. 46 No.3, pp. 72-83.
Baker, U. and Boyd, G.F. (1997), "Activity based costing in the operating room at Valley View
51
Hospital", Journal of Health Care Finance, Vol. 24 No.1, pp. 1
Baker, P. (2004), "Aligning distribution center operations to supply chain strategy",
International Journal of Logistics Management, Vol. IS No. I, pp. 111-23.
Barratt, M. and Oliveira, A. (2001), "Exploring the experiences of collaborative planning
initiatives", International Journal of Physical Distribution & Logistics
Management, Vol. 31 No, pp. 266-89.
Basioglu (2004) upstream information flow in the supply chain: The case of Finnish.
manufacturers. Research dissertation
Bermudez, J. (2003), Future Collaboration. AMR Research.
Bernstein, F., Chen, F. and Federg1en, A. (2005), Supply Chains with Simple Pricing Schemes:
The Role of Vendor Managed Inventories, The Fuqua School of Business, Duke
University,Durham, NC.
Bibangambah (2002) Review of information on marketing, processing and storage of
Uganda' s agricultural commodities http://www.foodnet.cgiar.org/SCRIP /
docs&databaseslifpri studies- U G-nonScri p/pdfslmore-reportslmarket
%20review%20consultancy"1020report%20PMA%20subcommittee, %20
May"102020. pdf
Blattberg, R.C. and Deighton, 1. (1996), "Managing marketing by the customer equity test",
Harvard BusinessReview, Vol. 75 No.4, pp. 136-44.
Blatherwick.A (1996) The supply chain balancing act - stock and service at a profit Logistics
Journal of Information Management Volume 9. Number 6. 1996. pp. 24-26
Bolton, R.N., Lemon, K.N. and Verhoef, P.C. (2004),"The theoretical underpinnings of customer
asset management: a framework and propositions for future research", Journal of
Academy of Marketing Science, Vol. 32No. 3, pp. 271-92
Borade and Bansod (2007) Domain of supply chain management-a "State of art journal of
technology and research innovations volume 2
52
Bowersox, DJ. (1990), "The strategic benefits of logistics alliances", Harvard Business
Review, Vol. 68 No, pp. 36-43.
Cachon.P and Fisher.M (2000) Supply chain inventory management and the value of
shared information Journal of management science volume 46, pages: 1032
Campbell, AJ. (2003), "Creating customer knowledge competence: managing customer
relationship management programs strategically", Industrial Marketing
Management, Vol. 32 No, pp. 375-83.
Cate and Staten (2006) The value of information sharing http://www.bbbonline.orgl
Understanding privacy/library/white paper value of information sharing
Carter, C., Kaufmann, 1, Bill, S., Carter, P., Hendrick, T. and Petersen, K. (2004), "Reverse
auctions - grounded theory from the buyer and supplier perspective", Transportation
.
Research Part E, Vol. 40.No. 3, pp. 229-54
Capizzi, M. (2002), "Small business, big pdtential", Colloquy White Paper
Cetinkaya.S and Lee (2000) Stock replenishment and shipment scheduling for vendor managed
inventory systems Journal of management science volume 46, pages: 217-232
Chandra (2000) Supply chain management, in theory and practice a passing fad or fundamental
change http://filebox. vt. edu/r/rvasu/Supply chain/Supply- Fundamental
Cheung. and Lee.H (2002) The inventory benefit of shipment coordination and stock
rebalancing in a supply chain Journal of management science 48, pages: 300-
306
Clark, T. and Hammond, J. (1997), "Reengineering channel reordering processes to improve
total supply chain performance", Production & Operations Management, Vol. 6
53
No.3, pp. 248-65.
Closs .J and Xu (2000) Logistics information technology practice in manufacturing and
merchandising firms: An international benchmarking study versus world class
logistics firms International Journal of Physical Distribution & Logistics
Management, Vol. 30 No. 10, 2000, pp. 869-886.
Cooke, l.A. (1998), "VMI: very mixed impact?", Logistics Management Distribution Report,
Vol. 37No. 12.
Corbett, C.l., Blackburn, J.D. and Wassen, 1.N.V. (1999), "Case study partnerships to
improve supply chains", Sloan Management Review, Vol. 40 No.4, pp. 71-82.
Corsten.D and Gruen.T (2003) Desperately seeking shelf availability: an examination of the
extent, the causes, and the efforts to address retail out of stock. International journal
of retail and distribution management vol .31, pp 605-617.
Cross, G. J. 2000. Howe-business is transforming supply chain management. Journal of
Business Strategy. 21 (2), 36-39
Dai and Kauffman (2006) To be or not to b2b: evaluating managerial choices for e
procurement channel adoption Journal of information technology and management
7, pages: 1385-951.
Dai, Q. and Kauffman, R. (2002), "Business models for internet-based B2B electronic
markets”, International Journal of Electronic Commerce, Vol. 6 No, pp. 41-72.
,
Daugherty, P.1., Myers, M.B. and Audrey, C.W. (1999), "Automatic replenishment programs: an
empirical examination", Journal of Business Logistics, Vol. 20 No.2, pp. 63-82.
Davidson .A etal (2004) A quality self-assessment model Managerial Auditing Journal Vol. 19
No. 7,pp. 859-868
Eckert (2007) Inventory management and its effects on Customer satisfaction Journal of
Business and Public Policy I, page 3
Ellram.etal. (1999), Retail logistics, International Journal of Physical Distribution & Logistics
54
Management, Vol. 29 No. 7/8, pp. 477-49
Emiliani, M. (2004a), "Sourcing in the global aerospace supply chain using online reverse
auctions", Industrial Marketing Management, Vol. 33 No. I, pp. 65-73.
Fasanghari, Roudsari and. Kamal Chaharsooghi (2008) Assessing the impact of
information technology on supply chain management world applied sciences
journal 4(1): 87-93
Forslund.H and Jonsson.P (2007) The impact of forecast information quality on supply chain
performance International Journal of Operations & Production Management
Vol. 27 No. 1,2007 pp. 90-107
. Fleisch, E. and Tellkamp, C. (2005), "Inventory inaccuracy and supply chain performance: a simulation study of a retail supply chain", International Journal of Production
Economics, Vol. 95 No.3, pp. 373-85.
FMI (2003), Efficient Consumer Response, http://www.fmi.orglmedialbglecrl.htm
Last Accessed on November 20, 2003
Fritiche.L and Kim.J, (2003). Personal selling approaches used in television
shopping joumal of fashion marketing and management Vol 7 No 3 pp 249-258
Gao, T., Sirgy, M. J. & Bird, M. M. (2005) Reducing buyer decision-making uncertainty
in organizational purchasing: can supplier trust, commitment, and dependence help?
Journal of Business Research. 58,397-405.
Ghosh.A and Fedorowicz.J (2008). Desrgn for supply chain collaboration Business Process
Management Journal Vol. 14 No, 2008 pp. 401-418
Grout, J.R. (1998), "Influencing a supplier using delivery windows: its effect on the variance of
flow time and on-time delivery", Decision Science, Vol. 29 No, pp. 747-64.
Gruen and corsen (2008) A Comprehensive Guide To Retail Out-of-Stock Reduction In
TheFast-MovingConsumerGoodIndustry http://www.gmaonline.orglpublications
55
/docs/007 /OOS-execsummary. pdf
Gruen, T.W., Corsten, D. and Bharadwaj, S. (2002), Retail Out of Stocks: A Worldwide
Examination of Causes, Rates, and Consumer Responses, Grocery Manufacturers of
America, Washington, DC.
Gunasekaran.A and Ngai .E.W.T (2004) Virtual supply chain management Journal of
Operations Management, Vol. 11, pp. 289-311.
Gunasekaran.A, Patel .C and Tirtiroglu.E, (2001) Performance measures and metrics in a supply
chain environment International Journal of Operations & Production Manageme1ll
Vol. 21, pp: 71-87
Hammer, M. (1990), "Reengineering work: don't automate, obliterate", Harvard Business
Review, Vol. 68 No. 4,pp. 104-13.
Heng.l and Zang.z (2007) Design and analysis of web-based inventory control system for
e-commerce Journal oj inventory control and production planning:
pages 1258-1261
Holmstrom, 1. (1998), "Implementing vendor-managed inventory the efficient way: a case study
of partnership in the supply chain", Production and Inventory Management Journal,
3rd Quarter, pp. 1-5.
Holweg, M., Disney, S., Holmstrom, 1. and Smaros, 1. (2005), "Supply chain collaboration:
making sense of the strategy .continuum", European Management Journal, Vol. 23
No. 2,pp. 170-81.
Holstrom.F.etal (2002) collaborative planning an, forecasting and replenishment new solutions
needed for mass collaboration. Supply chain management an international journal vol7
pp136-145
56
Homburg, C., Grozdanovic, M. & Klarmann, M. (2007) Responsiveness to Customers and
Competitors: The Role of Affective and Cognitive Organizational Systems. Journal oj
Marketing. volume71, 18-38.
Hult, G.T.M., Ketchen, DJ. Jr and Slater, S.F. (2004), "Information processing, knowledge
development, and strategic supply chain performance", Academy oj Management Journal. Vol.
47 No.2, pp. 241-54
Introna.D (1991) The Impact of information Technology on Logistics International journal of
physical distribution and logistics journal. Vol 21 pp 32-37
Kang, Y. and Gershwin, S.B. (2005), "Information inaccuracy in inventory systems: stock loss
and stockout", lIE Transactions, Vol. 37, pp. 843-59. .
Kaipia, R., Holmstrom, J. and Tanskanen, K. (2002), "VMI: What are you losing if you let your
customer place orders?", Production Planning & Control, Vol. 13 No. 13, pp. 17-25.
Keong.etal, (2005) Proposing a non-traditional ordering methodology in achieving optimal
flexibility with minimal inventory risk, Asia Pacific Journal ()f Market link and
Logistics vol 17 pp31-43
Krausse, DR, Handfield, R.B. and Scannel, T.v. (1998), "An empirical investigation of
supplier development: reactive and strategic processes", Journal of Operations
Management, Vol. 17, pp. 39-58.
Krishnamurthy. A and Claudio (2005) Pull systems with advance demand information
Journal of logistics, transportation, and distribution: inventory control iii pages:
1733 - 1742
Koumanakos.P (2008) The effect of inventory management on firm performance International
Journal of Productivity Performance Management Vol. 57 No.5, pp. 355-369
Kulp, S.C., Lee, H.L. and Ofek, E. (2004), "Manufacturer benefits from information integration
with retail customers", Journal of Management Science, Vol. 50 No, pp. 431-44.
Kurt Salmon Associates Inc. (1993), Efficient Consumer Response: Enhancing Consumer Value
in the Grocery Industry, Food Marketing Institute, Washington, DC.
57
K wan etal (200 I) Planning enterprise resources by use of an engineering approach to build a
global logistics management system Journal of industrial management and data
systems Vol 101/9 pp 483-491
Kwon.G and suh .T (2004) Factors affecting the level of trust and commitment in supply chain
relationships journal of supply chain management: global review of
purchasing and supply
Laxmidhar.M (2006) exploratory investigation of sales forecasting process and sales fore
casting system a case study of three companies Research dissertation
Lacey, R. and Sneath, 1.Z. (2006), "Customer loyalty programs: are they fair to consumers?",
Journal of Consumer Marketing, Vol. 23 No.7, pp. 464-70..
Lee and Tang (2000) The value of information sharing in a two-level supply chain
Journal of management science volume 46, pages: 626 - 643
Lee and Kleiner (2001) Inventory management in the women's retail and clothing industry.
Volume 24
Lee, H.L., Padmanabhan, V. and Whang, S. (1997), "The bullwhip effect in supply chains",
Sloan Management Review, Vol. 38 No, pp. 93-102.
Lee. H, and Whang, S (2001). "E-Business and Supply Chain Integration," Stanford Global
Supply Chain Management Forum, Stanford University Report SGSCMF-W2
2001, Stanford, CA, November 2001.
Lee (2003) Demand chain optimization pitfalls and key principles
http://www.stanford.edulgroup/scforum/welcome/white%20papers/demand
%20chain%0 Optimisation~20-%20Evant%20white%
Lewis (2006) Effects of information sharing;, organization capability and relationship
characteristics on out sourcing performance in the supply chain: an empirical
study http://www.ohiolink.eduletd/send-pdf.cgi?osuI154620550
,Lieberman etal (2004) Factors affecting the level of trust and commitment in supply
chain relationships journal of supply chain management
58
Lieberman etal (1996) Imperical determinants of inventory levels in high volume
manufacturing http://imvp. mit.edulpapers/96/lieber2. pdf.
Liu&kumar (2003) leveraging information sharing to increase supply chain.
configurability http://www.personal.psu.edulaxk41/icis03Jeprint.pdf
Mascarenhas.A, Kesavan.R and Bernacchi.M, (2004). Customer value-chain involvement for co-
creating customer delight Journal of Consumer Marketing Volume 21 . Number 7
2004. pp. 486-496
Mattsson, S-A. (2007), "Inventory control in environments with short lead times", International
Journal of Physical Distribution & Logistics Management, Vol. 37 No.2, pp. 115-30.
Menon, A.B., Jaworski, 1. and Kohli, A.K. (1997), "Product quality: impact of interdepartmental
interactions", Journal of the Academy of Marketing Science, Vol. 25 No.3, pp. 187-200.
Mentzer, J.T., Foggin, J.H and Golicic, S.L. (2000a), "Collaboration: the enablers, impediments,
and benefits", Supply Chain Management Review, September/October.
Mentzer, J.T., Min, S. and Zacharia, Z.G. (2000b), "The nature of inter-firm partnering in suppl~'
chain management", Journal of Retailing, Vol. 76 No.4, pp. 549-68.
McCarthy, T. M. and Golicic, S. L (2002). Implementing Collaborative Forecasting to
Improve Supply Chain Performance, International Journal of Physical
Distribution and Logistics Management, 32(6), 431-454.
McLaren, T., Head, M. and Yuan, Y. (2002), "Supply chain collaboration alternatives:
understanding the expected costs and benefits", Journal of Internet Research, Vol.
12 No.4, pp. 348-6j.
Ministry of tourism and trade (2005) Thj: marketing & agro-processing strategy
http://www.pma.go.ug!pmauploadsIMAPS _final_. pdf
Moyoni etal (2005) Policy analysis, improving markets for dry commodities in Uganda
http://www. undp. Org. dry lands/ docslmarketaccesslmarketaccesspolicystudyUganda.
doc
Muckstadt.a, Murray.S and Collins. A (2001) Guideline for collaborative supply chain
system design and operation Journal of information systems frontiers. 3, pages: 427 -
453
59
Ndubisi.N.etal (2005) Supplier selection and management strategies and manufacturing
flexibility The Journal of Enterprise Information Management Vol. 18 No.3, pp. 330-
349
Noble, David, Buck and Diana (2000). Metrics for Evaluation of Cognitive Architecture
Based Collaboration Tools. Phase 1 SBm Final Report. Evidence Based
Research, Inc
Okell, obura&majanja (2007) assessment of inforrnation business problems in Uganda
http://gir.uoguelph. calindex. php/perjl article/view PDF lpterstitial/306/5 73.
Parks, L. (1999), "CPFR programs facilitate inventory management", Drug Store News, Vol.
21, No.2, p. 27.
Patel (2008) Inventory Management System maintains good relationship between supply and
demand Frequency http://www\customer satisfaction\Inventory Management System
maintains good relationship between supply and demand - Free-Press-Release com.htm
Peppers, D. and Rogers, M. (2004), Managing Customer Relationship. A Strategic
Framework, Wiley, Hoboken.
Pinker, E., Seidmann, A. and Vakrat, Y. (2003), "Managing online auctions: current business
and research issues", Management Science, Vol. 49 No. II, pp. 1457-85.
Pramatari .K, (2007) Collaborative supply chain practices and evolving technological approaches
Supply Chain Management: An International Journal 12/3 (2007) 210-220
Presutti, W. (2003), "Supply management and e-procurement: creating value added in the supply
chain", Industrial Marketing MaRagement, Vol. 32 No, pp. 219-27.
Raman, A., DeHoratius, N. and Ton, Z. (2001), "Execution, the missing link in retail
operations”, California Management Review, Vol. 43 No, pp. 136-52.
Ratinasingam.P, Pavlou.p and Hau Tan.y (2002) Importance of technology trust for b2b
commerce electronic http://www.bledconference.orglproceedings.nsf/0/3eddOcb3
dfa76aa6cl56e9f0037a3da $FILE/ratnasingam. pdf
60
Reichheld, F.F. (1996), The Loyalty Effect, Harvard Business School Press, Boston, MA.
Rogers .etal (1994) Information accessibility: Customer responsiveness and enhanced
performance International Journal of Physical Distribution & Logistics
Management, Vol. 25 No. I, pp. 4-17.
Romano (2003) Co-ordination and integration mechanisms to manage logistics processes
across supply networks Received 4 June 2001; revised 9 July 2002; accepted 14
February 2003. ; Available online 15 April 2003.
Sahn.H and Lee.H (2004) An agent-based dynamic information network for supply chain
Management technology Journal 22, pages: 18 -27 year of publication: 2004
Sahin and, Mentzer (2005) supply chain coordination mechanism
http://bus.utk.edu/ivc/supplychainlReadings/SCMCoord.pdf
Samaranayake (2005), Supply Chain Management: An International Journal Volume
pp.47-59
Silver, E.A., Pyke, D.F. and Peterson, R (1998), Inventory Management and Production
Planning& Scheduling, 3rd ed., John Wiley, New York, NY.
Simatupang.M and Sridharan.R (2008). The role of trust in supply chain governance Business
Process Management Journal Vol. 14 No, 2008 pp. 453-470
Simatupang.M and Sridharan.R The collaboration index: a measure for supply chain
collaboration International Journal of Physical Distribution & Logistics Management
Vol. 35 No.1, 2005
Skjoen-Larsen, T., Thernoe, C. and,Andresen, C. (2003), "Supply chain collaboration:
theoretical perspectives and political evidence", Interernational Journal of Physical
Distribution &Logistics Management, Vol. 33 No, pp. 531-49.
Smaros, 1. (2003), "Collaborative forecasting: a selection of practical approaches", International
Journal of Logistics: Research and Applications, Vol. 6 NO.4.
Smart, A. and Harrison, A. (2003), "Online reverse auctions and their role in buyer-supplier
relationships", Journal of Purchasing & Supply Management, Vol. 9 Nos 5/6, pp.
257-69.
61
Smeltzer, 1. and Carr, A. (2002), "Reverse auctions in industrial marketing and buying",
Business
Smith.D (2008) A conceptual model of vendor retailer relationship best on commitment trust
theory http://www.edamba.eu/userfileslSmith%20Web.pdf.
Spekman, RE. and Carraway, R (2006), "Making the transition to collaborative buyer-seller
relationships: an emerging framework", Industrial Marketing Management, Vol. 35
No.
1, pp. 10-19.
Srinidhi.B and Tayi.K (2004) Just in time or just in case? An explanatory model with
informational and incentive effects Journal of Manufacturing Technology
Management Volume 15. Number 7, 2004. pp. 567-574
Storer.E.etal (2006) Review of published information system research, 7th international
Conference on agri business and food industry, Netherlands
Stuart .J etal (2005) Reducing costs through improved returns processing. International. journal
of Physical Distribution & Logistics Management Vol. 35 No.7, pp. 468-480
Taylor.D (2000) Demand amplification: has it got us beat? International Journal of Physical
Distribution & Logistics Management, Vol. 30 No.6, 2000, pp. 515-533.
.Tachizawa and Ginemez (2005) Drivers and sources of supply flexibility: An exploratory study
http://www .recercat. catlbitstream/2072/ 16 70/ 1/889. pdf.
Theodre.H and Lee.G (2000) Performance, interdependence and coordination in
Business-to-business electronic commerce and supply chain management Journal of
information technology and management, pages: 85 - 105
UNIDO (2005) Can African manufacturing firms become successful exporter
. UNCT AD (2006) Best practices and policy options in the promotion of SME-- TNC
business linkages http://www.unctad.orglenldocslc3em28d2_en.pdf
USAID (1996) Trip report Uganda September 21 to 27, 1996
62
http://www.USAIDAtTicaLinkReports.htm
USAID (2001) Agoa textiles and garments. What future for Uganda's exports?
http://www.foodnet.cgiar.orglSCRIP/docs&databaseslifpristudies-UG-non
Scrip/pdt7COMPLETE conference%20(February%202002)/ AGOA Textile
cotton Export Prospects AlRD June 2001.pdf
Vigtil, A. (2007), "Information exchange in vendor managed inventory", International Journal
of Physical Distribution & Logistics Management, Vol. 37 No.2, pp. 131-47.
Vazquez, R., Iglesias, V. & Alvarez-Gonzalez, L. I. (2005) Distribution Channel
relationships: The Conditions and Strategic Outcomes of Cooperation between
manufacturer and distributor. Journal International Review of Retail, Distribution &
. Consumer Research, 15,125-150
Verwijmeren, Vander Yoist and Donselaar,(1996) Networked inventory management
information
systems: terializing supply chain management International Journal of Physical
.
Distribution & Logistics Management, Vol. 26 No.6,
Yuliang .Y, Evers .P, Dresner (2007) Supply chain integration in vendor-managed
inventory, Journal of decision support systems, v.43 no.2, p.663-674, March, 2007
Wang (2007) Inventory management for Customers with alternative lead times
http://www.asom.sjtu.edu.cn/upload/publish/img/I 07112514650. pdf
Wang (2002) How to implement Customer Relationship Management system in third
party logistics companies http://www.bschool.nus.edu.sg/staff/bizteocp/jonathan.doc
Walter and Liu (2001) Consumer response to retail stock outs Journal of Business
Logistics
Warkentin etal (2000) Role of mass custpmization in enhancing supply chain relation
ships in B2B e-commerce markets Journal of electronic commerce research 1,.2
Weber and Kantmneni (2001) POS and EDI in retailing: An examination of underlying benefits
63
and barriers. vol 7 pp311-317
White.G.(2001) relationship life cycle and collaborative commerce
http://www.supplychaintoday.com/LogilityRelationship%20Life%20and%
20Collaborative%20Commerce%5B I %50. pdf
Wilding (2003) The 3ts of highly effective supply chains journal of Supply Chain Practice.
5. 3
Yorst etal (2007) Agro industrial supply chain management and concepts and
applicationshttp://www.fao.orglAg/ags/publications/docslAGSF
OccassionalPapers/ agsfop 17. pdf:
Waller, M., Johnson, M.E. and Davis, T. (1999), "Vendor-managed inventory in the retail supply
chain", Journal of Business Logistics, Vol. 20 No. I, pp. 183-203.
Waller.M, Nachtmann.H and Hunter.J (2006) Measuring the impact of inaccurate inventory
information on a retail outlet The International Journal of Logistics ManagementVol.
17 No.3, 2006 pp. 355-376
Zhenxin .Y ,Yan.H and Cheng.E ,(2001) Beneifits of information sharing with supply chain
partnerships journal of industry management and data systems vol 101/3 pp114-11
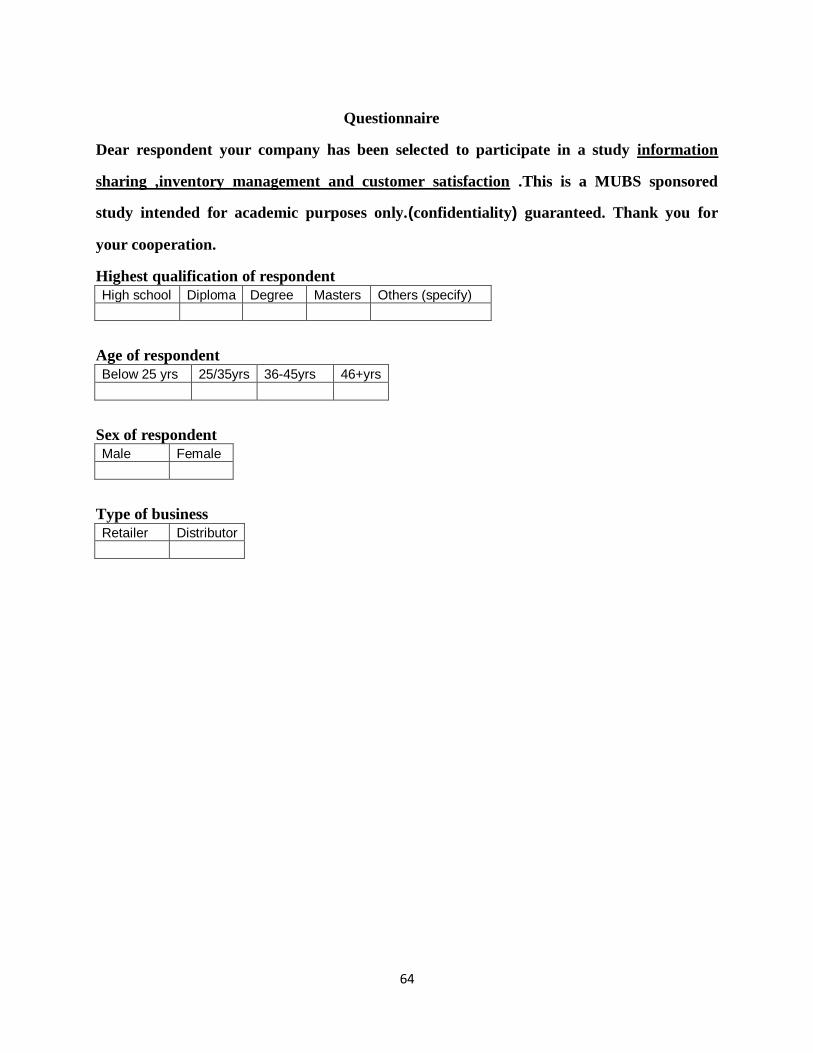
64
Questionnaire
Dear respondent your company has been selected to participate in a study information
sharing ,inventory management and customer satisfaction .This is a MUBS sponsored
study intended for academic purposes only.(confidentiality) guaranteed. Thank you for
your cooperation.
Highest qualification of respondent
High school Diploma Degree Masters Others (specify)
Age of respondent
Below 25 yrs 25/35yrs 36-45yrs 46+yrs
Sex of respondent
Male Female
Type of business
Retailer Distributor
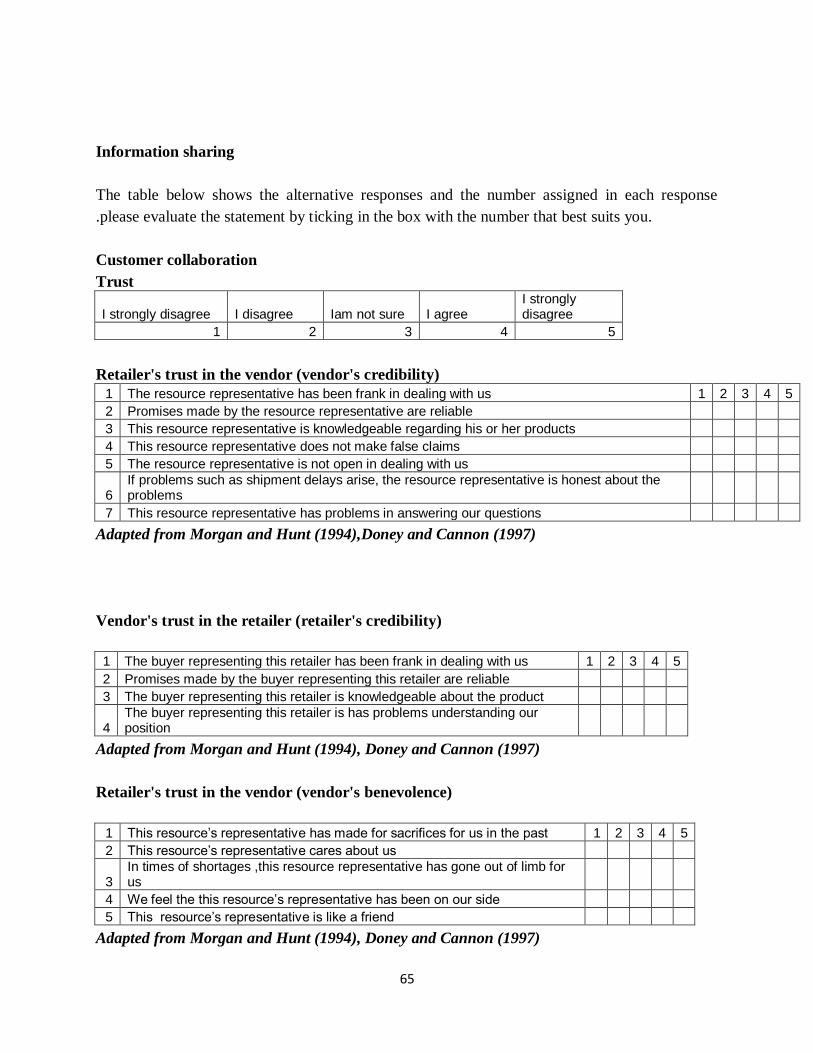
65
Information sharing
The table below shows the alternative responses and the number assigned in each response
.please evaluate the statement by ticking in the box with the number that best suits you.
Customer collaboration
Trust
I strongly disagree I disagree Iam not sure I agree I strongly disagree
1 2 3 4 5
Retailer's trust in the vendor (vendor's credibility)
1 The resource representative has been frank in dealing with us 1 2 3 4 5
2 Promises made by the resource representative are reliable
3 This resource representative is knowledgeable regarding his or her products
4 This resource representative does not make false claims
5 The resource representative is not open in dealing with us
6 If problems such as shipment delays arise, the resource representative is honest about the problems
7 This resource representative has problems in answering our questions
Adapted from Morgan and Hunt (1994),Doney and Cannon (1997)
Vendor's trust in the retailer (retailer's credibility)
1 The buyer representing this retailer has been frank in dealing with us 1 2 3 4 5
2 Promises made by the buyer representing this retailer are reliable
3 The buyer representing this retailer is knowledgeable about the product
4 The buyer representing this retailer is has problems understanding our position
Adapted from Morgan and Hunt (1994), Doney and Cannon (1997)
Retailer's trust in the vendor (vendor's benevolence)
1 This resource’s representative has made for sacrifices for us in the past 1 2 3 4 5
2 This resource’s representative cares about us
3 In times of shortages ,this resource representative has gone out of limb for us
4 We feel the this resource’s representative has been on our side
5 This resource’s representative is like a friend
Adapted from Morgan and Hunt (1994), Doney and Cannon (1997)
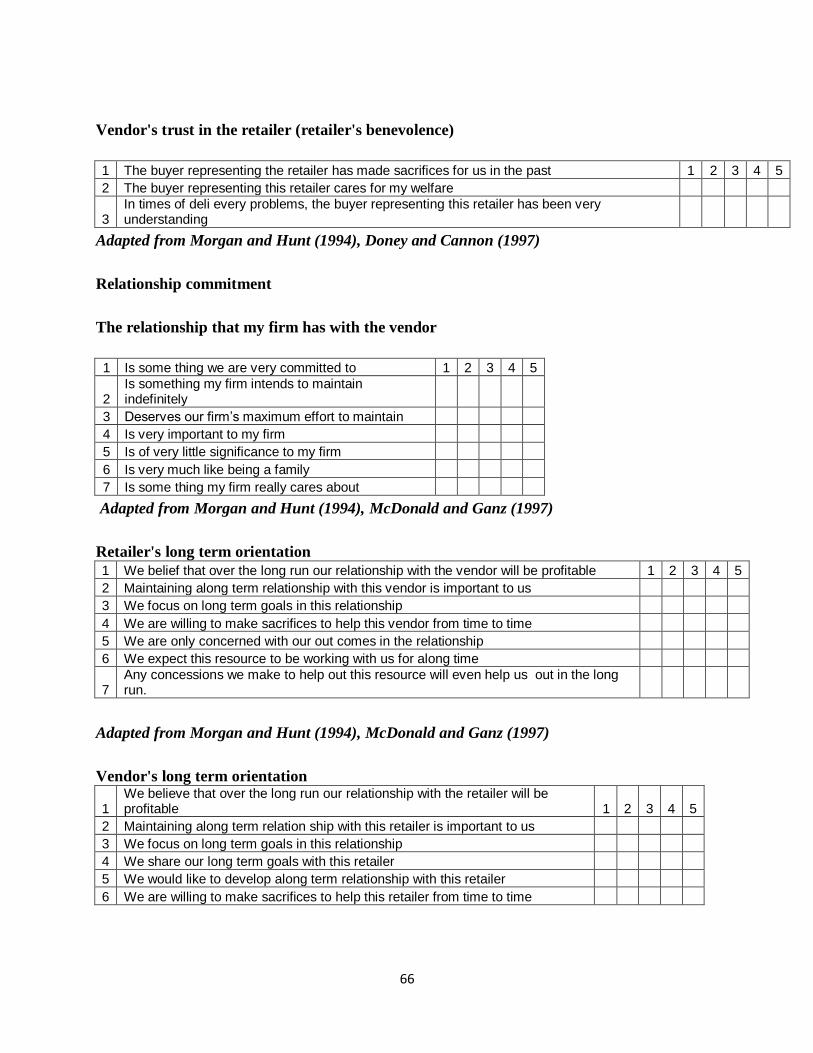
66
Vendor's trust in the retailer (retailer's benevolence)
1 The buyer representing the retailer has made sacrifices for us in the past 1 2 3 4 5
2 The buyer representing this retailer cares for my welfare
3 In times of deli every problems, the buyer representing this retailer has been very understanding
Adapted from Morgan and Hunt (1994), Doney and Cannon (1997)
Relationship commitment
The relationship that my firm has with the vendor
1 Is some thing we are very committed to 1 2 3 4 5
2 Is something my firm intends to maintain indefinitely
3 Deserves our firm’s maximum effort to maintain
4 Is very important to my firm
5 Is of very little significance to my firm
6 Is very much like being a family
7 Is some thing my firm really cares about
Adapted from Morgan and Hunt (1994), McDonald and Ganz (1997)
Retailer's long term orientation
1 We belief that over the long run our relationship with the vendor will be profitable 1 2 3 4 5
2 Maintaining along term relationship with this vendor is important to us
3 We focus on long term goals in this relationship
4 We are willing to make sacrifices to help this vendor from time to time
5 We are only concerned with our out comes in the relationship
6 We expect this resource to be working with us for along time
7 Any concessions we make to help out this resource will even help us out in the long run.
Adapted from Morgan and Hunt (1994), McDonald and Ganz (1997)
Vendor's long term orientation
1 We believe that over the long run our relationship with the retailer will be profitable 1 2 3 4 5
2 Maintaining along term relation ship with this retailer is important to us
3 We focus on long term goals in this relationship
4 We share our long term goals with this retailer
5 We would like to develop along term relationship with this retailer
6 We are willing to make sacrifices to help this retailer from time to time
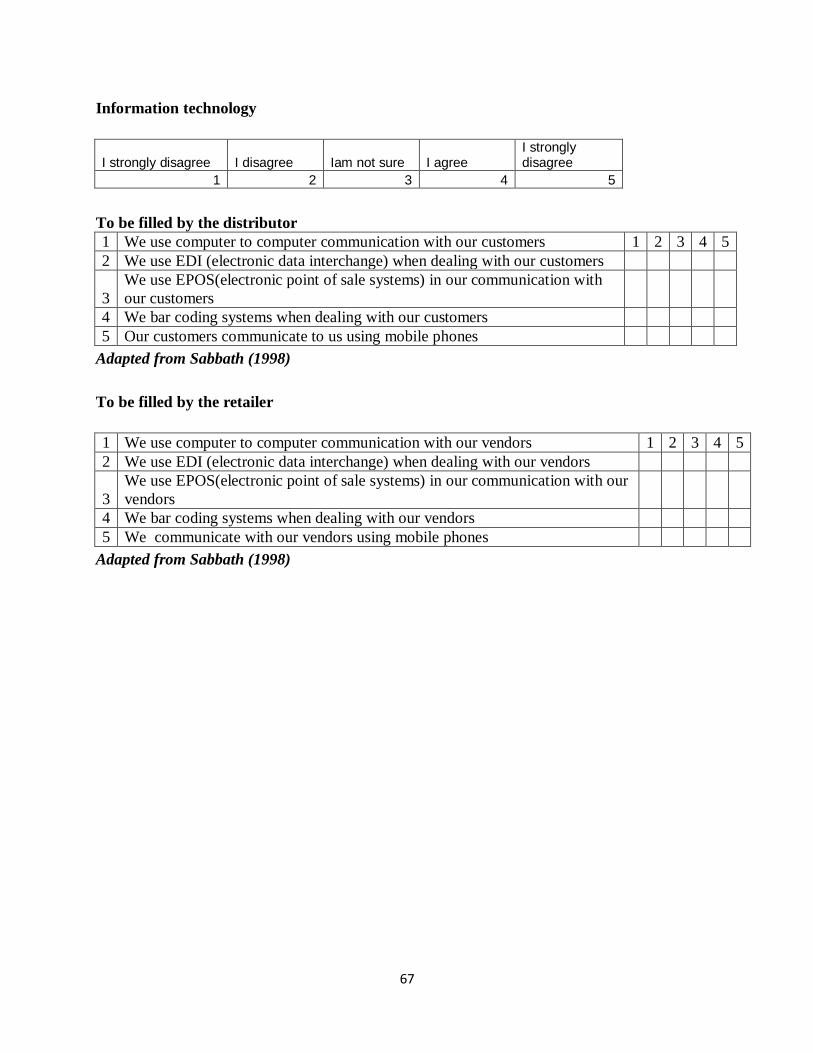
67
Information technology
I strongly disagree I disagree Iam not sure I agree I strongly disagree
1 2 3 4 5
To be filled by the distributor
1 We use computer to computer communication with our customers 1 2 3 4 5
2 We use EDI (electronic data interchange) when dealing with our customers
3
We use EPOS(electronic point of sale systems) in our communication with
our customers
4 We bar coding systems when dealing with our customers
5 Our customers communicate to us using mobile phones
Adapted from Sabbath (1998)
To be filled by the retailer
1 We use computer to computer communication with our vendors 1 2 3 4 5
2 We use EDI (electronic data interchange) when dealing with our vendors
3
We use EPOS(electronic point of sale systems) in our communication with our
vendors
4 We bar coding systems when dealing with our vendors
5 We communicate with our vendors using mobile phones
Adapted from Sabbath (1998)
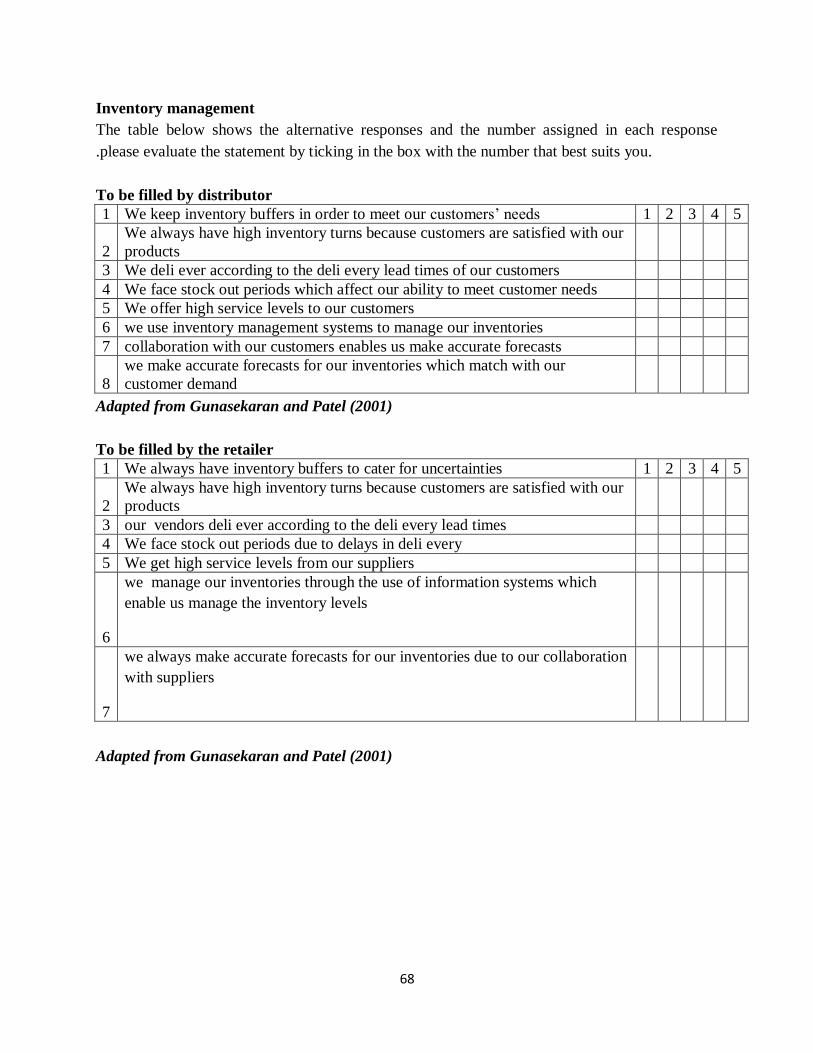
68
Inventory management
The table below shows the alternative responses and the number assigned in each response
.please evaluate the statement by ticking in the box with the number that best suits you.
To be filled by distributor
1 We keep inventory buffers in order to meet our customers’ needs 1 2 3 4 5
2
We always have high inventory turns because customers are satisfied with our
products
3 We deli ever according to the deli every lead times of our customers
4 We face stock out periods which affect our ability to meet customer needs
5 We offer high service levels to our customers
6 we use inventory management systems to manage our inventories
7 collaboration with our customers enables us make accurate forecasts
8
we make accurate forecasts for our inventories which match with our
customer demand
Adapted from Gunasekaran and Patel (2001)
To be filled by the retailer
1 We always have inventory buffers to cater for uncertainties 1 2 3 4 5
2
We always have high inventory turns because customers are satisfied with our
products
3 our vendors deli ever according to the deli every lead times
4 We face stock out periods due to delays in deli every
5 We get high service levels from our suppliers
6
we manage our inventories through the use of information systems which
enable us manage the inventory levels
7
we always make accurate forecasts for our inventories due to our collaboration
with suppliers
Adapted from Gunasekaran and Patel (2001)
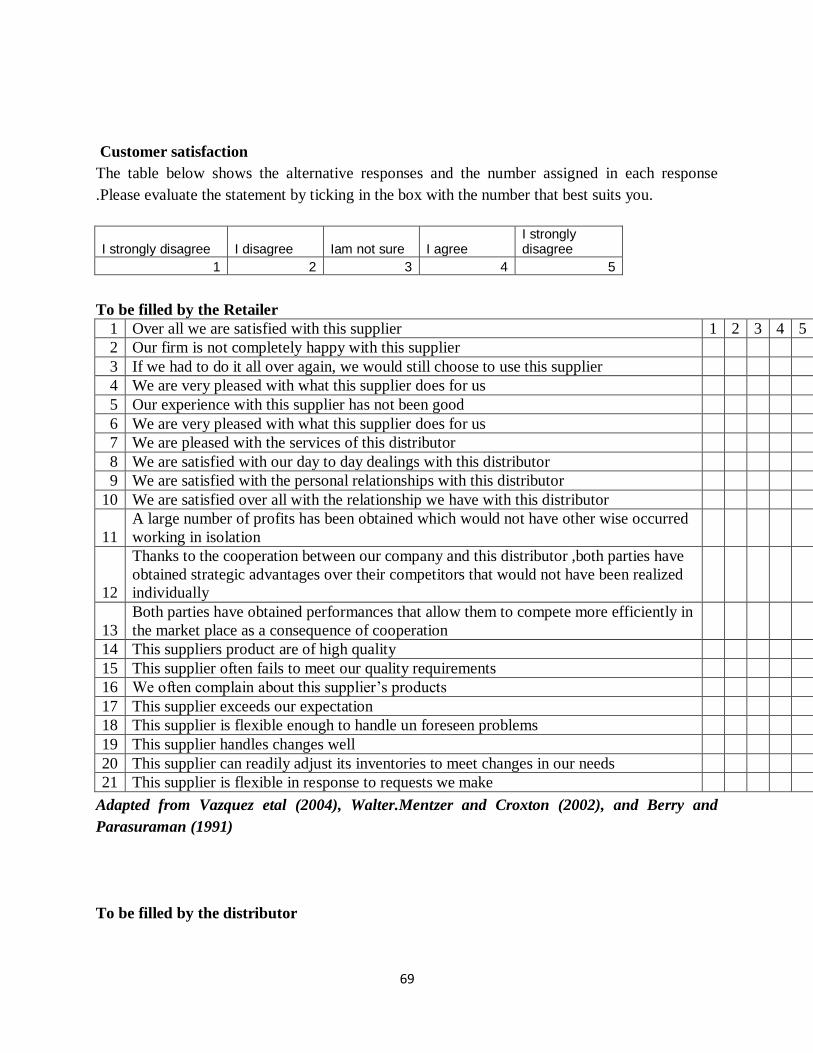
69
Customer satisfaction
The table below shows the alternative responses and the number assigned in each response
.Please evaluate the statement by ticking in the box with the number that best suits you.
I strongly disagree I disagree Iam not sure I agree I strongly disagree
1 2 3 4 5
To be filled by the Retailer
1 Over all we are satisfied with this supplier 1 2 3 4 5
2 Our firm is not completely happy with this supplier
3 If we had to do it all over again, we would still choose to use this supplier
4 We are very pleased with what this supplier does for us
5 Our experience with this supplier has not been good
6 We are very pleased with what this supplier does for us
7 We are pleased with the services of this distributor
8 We are satisfied with our day to day dealings with this distributor
9 We are satisfied with the personal relationships with this distributor
10 We are satisfied over all with the relationship we have with this distributor
11
A large number of profits has been obtained which would not have other wise occurred
working in isolation
12
Thanks to the cooperation between our company and this distributor ,both parties have
obtained strategic advantages over their competitors that would not have been realized
individually
13
Both parties have obtained performances that allow them to compete more efficiently in
the market place as a consequence of cooperation
14 This suppliers product are of high quality
15 This supplier often fails to meet our quality requirements
16 We often complain about this supplier’s products
17 This supplier exceeds our expectation
18 This supplier is flexible enough to handle un foreseen problems
19 This supplier handles changes well
20 This supplier can readily adjust its inventories to meet changes in our needs
21 This supplier is flexible in response to requests we make
Adapted from Vazquez etal (2004), Walter.Mentzer and Croxton (2002), and Berry and
Parasuraman (1991)
To be filled by the distributor
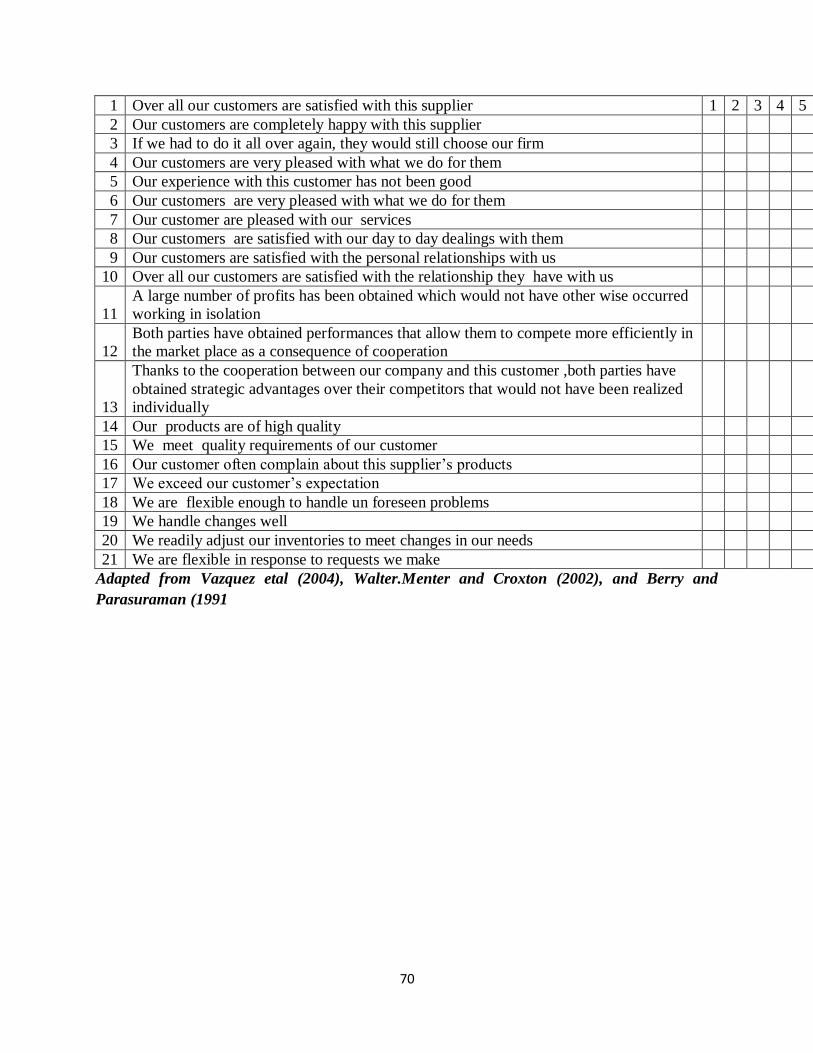
70
1 Over all our customers are satisfied with this supplier 1 2 3 4 5
2 Our customers are completely happy with this supplier
3 If we had to do it all over again, they would still choose our firm
4 Our customers are very pleased with what we do for them
5 Our experience with this customer has not been good
6 Our customers are very pleased with what we do for them
7 Our customer are pleased with our services
8 Our customers are satisfied with our day to day dealings with them
9 Our customers are satisfied with the personal relationships with us
10 Over all our customers are satisfied with the relationship they have with us
11
A large number of profits has been obtained which would not have other wise occurred
working in isolation
12
Both parties have obtained performances that allow them to compete more efficiently in
the market place as a consequence of cooperation
13
Thanks to the cooperation between our company and this customer ,both parties have
obtained strategic advantages over their competitors that would not have been realized
individually
14 Our products are of high quality
15 We meet quality requirements of our customer
16 Our customer often complain about this supplier’s products
17 We exceed our customer’s expectation
18 We are flexible enough to handle un foreseen problems
19 We handle changes well
20 We readily adjust our inventories to meet changes in our needs
21 We are flexible in response to requests we make
Adapted from Vazquez etal (2004), Walter.Menter and Croxton (2002), and Berry and
Parasuraman (1991