Embed Size (px)
Citation preview

Topic Detection and Tracking Pilot StudyFinal Report
James Allan�, Jaime Carbonelly, George Doddingtonz, Jonathan Yamronx, and Yiming Yangy�UMass Amherst,yCMU, zDARPA, xDragon Systems, andyCMU
ABSTRACTTopic Detection and Tracking (TDT) is a DARPA-sponsored initia-tive to investigate the state of the art in finding and following newevents in a stream of broadcast news stories. The TDT problemcon-sists of three major tasks: (1) segmenting a stream of data, especiallyrecognized speech, into distinct stories; (2) identifyingthose newsstories that are the first to discuss a new event occurring in the news;and (3) given a small number of sample news stories about an event,finding all following stories in the stream.
The TDT Pilot Study ran from September 1996 through October1997. The primary participants were DARPA, Carnegie MellonUniversity, Dragon Systems, and the University of Massachusettsat Amherst. This report summarizes the findings of the pilot study.
The TDT work continues in a new project involving larger trainingand test corpora, more active participants, and a more broadly de-fined notion of “topic” than was used in the pilot study.
The following individuals participated in the research reported.
James Allan, UMassBrian Archibald, CMUDoug Beeferman, CMUAdam Berger, CMURalf Brown, CMUJaime Carbonell, CMUIra Carp, DragonBruce Croft, UMass,George Doddington, DARPALarry Gillick, DragonAlex Hauptmann, CMUJohn Lafferty, CMU
Victor Lavrenko, UMassXin Liu, CMUSteve Lowe, DragonPaul van Mulbregt, DragonRon Papka, UMassThomas Pierce, CMUJay Ponte, UMassMike Scudder, UMassCharles Wayne, DARPAJon Yamron, DragonYiming Yang, CMU
1. OverviewThe purpose of the Topic Detection and Tracking (TDT) Pi-lot Study is to advance and accurately measure the state ofthe art in TDT and to assess the technical challenges to beovercome. At the beginning of this study, the general TDTtask domain was explored and key technical challenges wereclarified. This document defines these tasks, the performancemeasures to be used to assess technical capabilities and re-search progress, and presents the results of a cooperative in-vestigation of the state of the art.
To appear inProceedings of the DARPA Broadcast News Transcriptionand Understanding Workshop, February, 1998.
1.1. Background
The TDT study is intended to explore techniques for detect-ing the appearance of new topics and for tracking the reap-pearance and evolution of them. During the first portion ofthis study, the notion of a “topic” was modified and sharp-ened to be an “event”, meaning some unique thing that hap-pens at some point in time. The notion of an event differsfrom a broader category of events both in spatial/temporallocalization and in specificity. For example, the eruption ofMount Pinatubo on June 15th, 1991 is consider to be an event,whereas volcanic eruption in general is considered to be aclass of events. Events might be unexpected, such as the erup-tion of a volcano, or expected, such as a political election.
The TDT study assumes multiple sources of information, forexample various newswires and various news broadcast pro-grams. The information flowing from each source is assumedto be divided into a sequence of stories, which may provideinformation on one or more events. The general task is toidentify the events being discussed in these stories, in termsof the stories that discuss them. Stories that discuss unex-pected events will of course follow the event, whereas storieson expected events can both precede and follow the event.
The remainder of this section outlines the three major tasks ofthe study, discusses the evaluation testbed, and describes theevaluation measures that were used. Section presents the ap-proaches used by the study members to address the problemof text segmentation and discusses the results. The detectiontask is taken up and similarly described in Section . Sec-tion presents the approaches and results of the tracking task,including a brief section on tracking using a corpus createdfrom speech recognition output.
1.2. The Corpus
A corpus of text and transcribed speech has been developedto support the TDT study effort. This study corpus spans theperiod from July 1, 1994 to June 30, 1995 and includes nearly16,000 stories, with about half taken from Reuters newswireand half from CNN broadcast news transcripts. The tran-scripts were produced by the Journal of Graphics Institute(JGI). The stories in this corpus are arranged in chronolog-ical order, are structured in SGML format, and are available

from the Linguistic Data Consortium (LDC).1A set of 25 target events has been defined to support the TDTstudy effort. These events span a spectrum of event typesand include both expected and unexpected events. They aredescribed in some detail in documents provided as part ofthe TDT Corpus. The TDT corpus was completely anno-tated with respect to these events, so that each story in thecorpus is appropriately flagged for each of the target eventsdiscussed in it. There are three flag values possible: YES(the story discusses the event), NO (the story doesn’t dis-cuss the event), and BRIEF (the story mentions the eventonly briefly, or merely references the event without discus-sion; less than 10% of the story is about the event in ques-tion). Flag values for all events are available in the filetdt-corpus.judgments.21.3. The Tasks
The Topic Detection and Tracking Study is concerned withthe detection and tracking of events. The input to this pro-cess is a stream of stories. This stream may or may not bepre-segmented into stories, and the events may or may notbe known to the system (i.e., the system may or may not betrained to recognize specific events). This leads to the defini-tion of three technical tasks to be addressed in the TDT study.These are namely the tracking of known events, the detectionof unknown events, and the segmentation of a news sourceinto stories.
The Segmentation Task The segmentation task is definedto be the task of segmenting a continuous stream of text (in-cluding transcribed speech) into its constituent stories. Tosupport this task the story texts from the study corpus will beconcatenated and used as input to a segmenter. This concate-nated text stream will include only the actual story texts andwill exclude external and internal tag information. The seg-mentation task is to correctly locate the boundaries betweenadjacent stories, for all stories in the corpus.
The Detection Task The detection task is characterized bythe lack of knowledge of the event to be detected. In sucha case, one may wish to retrospectively process a corpus ofstories to identify the events discussed therein, or one maywish to identify new events as they occur, based on an on-linestream of stories. Both of these alternatives are supportedunder the detection task.
Retrospective Event Detection The retrospective detectiontask is defined to be the task of identifying all of the eventsin a corpus of stories. Events are defined by their association1Linguistic Data Consortium Telephone: 215 898-0464 3615 MarketStreet Fax: 215 573-2175 Suite 200 [email protected] Philadelphia, PA,19104-2608, USA.http://www.ldc.upenn.edu2Only values of YES and BRIEF are listed, thus reducing the size of thejudgment file by two orders of magnitude. (The vast majority of stories haveflag values of NO for all events.)
with stories, and therefore the task is to group the stories inthe study corpus into clusters, where each cluster representsan event and where the stories in the cluster discuss the event.It will be assumed that each story discusses at most one event.Therefore each story may be included in at most one cluster.3On-line New Event Detection The on-line new event detec-tion task is defined to be the task of identifying new events ina stream of stories. Each story is processed in sequence, anda decision is made whether or not a new event is discussedin the story, after processing the story but before processingany subsequent stories). A decision is made after each storyis processed. The first story to discuss an event should beflagged YES. If the story doesn’t discuss any new events, thenit should be flagged NO.
The Tracking Task The tracking task is defined to be thetask of associating incoming stories with events known to thesystem. An event is defined (“known”) by its association withstories that discuss the event. Thus each target event is de-fined by a list of stories that discuss it.
In the tracking task a target event is given, and each succes-sive story must be classified as to whether or not it discussesthe target event. To support this task the study corpus will bedivided into two parts, with the first part being the trainingset and the second part being the test set. (This division isdifferent for each event, in order to have appropriate trainingand test sets.) Each of the stories in the training set will beflagged as to whether it discusses the target event, and theseflags (and the associated text of the stories) will be the onlyinformation used for training the system to correctly classifythe target event. The tracking task is to correctly classify allof the stories in the test set as to whether or not they discussthe target event.
A primary task parameter is the number of stories used to de-fine (“train”) the target event,Nt. The division of the corpusbetween training and test will be a function of the event andthe value ofNt . Specifically, the training set for a particularevent and a particular value ofNt will be all of the stories upto and including theN tht story that discusses that event. Thetest set will be all subsequent stories.
1.4. The Evaluation
To assess TDT application potential, and to calibrate andguide TDT technology development, TDT task performancewill be evaluated formally according to a set of rules for each3While it is reasonable that a story will typically discuss a single event,this is not always the case. In addition to multifaceted stories, there are alsooverlapping events. For example, in the case of the TDT study’s corpus andtarget events, there are 10 stories that have a YES or BRIEF tag for more thanone event. One of these (story 8481) has a YES tag for two events (namelyCarter in Bosnia and Serbs violate Bihac). Nonetheless, theassumption thateach story discusses only one event will be used, because it is reasonable forthe large majority of stories and because it vastly simplifies the task and theevaluation.
of the three TDT tasks. In these evaluations, there will benumerous conditions and questions to be explored. Amongthese are:� How does performance vary when processing different
sources and types of sources?� How does selection of training source and type affectperformance?
In general evaluation will be in terms of classical detectiontheory, in which performance is characterized in terms of twodifferent kinds of errors, namely misses (in which the targetevent is not detected) and false alarms (in which the targetevent is falsely detected). In this framework, different eventswill be treated independently of each other and a system willhave separate outputs for each of the target events.
2. SegmentationThe segmentation task addresses the problem of automat-ically dividing a text stream into topically homogeneousblocks. The motivation for this capability in this study arisesfrom the desire to apply event tracking and detection tech-nology to automatically generated transcriptions of broadcastnews, the quality of which have improved considerably inrecent years. Unlike newswire, typical automatically tran-scribed audio data contains little information about how thestream should be broken, so segmentation must be done be-fore further processing is possible. Segmentation is there-fore an “enabling” technology for other applications, such astracking and new event detection.
Given the nature of the medium, “topically homogeneousblocks” of broadcast speech should correspond to stories,hence a segmenter which is designed for this task will findstory boundaries. The approaches described below, however,are quite general; there is no reason that the same technol-ogy, suitably tuned, cannot be applied to other segmentationproblems, such as finding topic breaks in non-news broadcastformats or long text documents.
There is a relatively small but varied body of previous workthat has addressed the problem of text segmentation. Thiswork includes methods based on semantic word networks[10], vector space techniques from information retrieval [7],and decision tree induction algorithms [11]. The research onsegmentation carried out under the TDT study has led to thedevelopment of several new and complementary approachesthat do not directly use the methods of this previous work,although all of the approaches share a common rationale andmotivation.
2.1. Evaluation
Segmentation will be evaluated in two different ways. First,segmentation will be evaluated directly in terms of its abil-
ity to correctly locate the boundaries between stories. Sec-ond, segmentation will be evaluated indirectly in terms of itsability to support event tracking and preserve event trackingperformance.
For the segmentation task, all of the TDT study corpus willbe reserved for evaluation purposes. This means that any ma-terial to be used for training the segmentation system mustcome from sources other than the TDT study corpus. Also,the nature of the segmentation task is that the segmentation isperformed on a single homogeneous data source. Therefore,for the purpose of evaluating the segmentation task, segmen-tation will be performed not only on the TDT Corpus as awhole, but also on its two separate sub-streams–one compris-ing just the Reuters stories, and the other comprising just theCNN stories. In addition, the segmentation task must be per-formed without explicit knowledge of the source of the text,whether from newswire or transcribed speech.
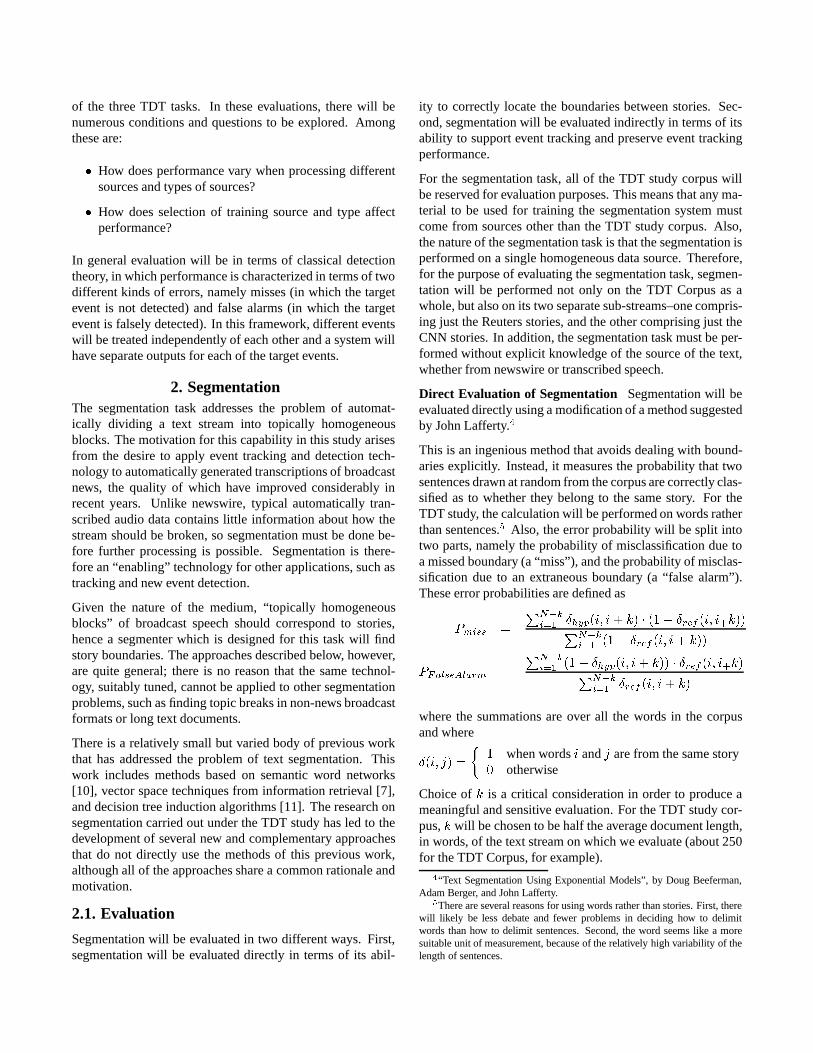
Direct Evaluation of Segmentation Segmentation will beevaluated directly using a modification of a method suggestedby John Lafferty.4This is an ingenious method that avoids dealing with bound-aries explicitly. Instead, it measures the probability that twosentences drawn at random from the corpus are correctly clas-sified as to whether they belong to the same story. For theTDT study, the calculation will be performed on words ratherthan sentences.5 Also, the error probability will be split intotwo parts, namely the probability of misclassification due toa missed boundary (a “miss”), and the probability of misclas-sification due to an extraneous boundary (a “false alarm”).These error probabilities are defined asPmiss = PN�ki=1 �hyp(i; i+ k) � (1� �ref (i; i+k))PN�ki=1 (1� �ref (i; i+ k))PFalseAlarm = PN�ki=1 (1� �hyp(i; i+ k)) � �ref (i; i+k)PN�ki=1 �ref (i; i+ k)where the summations are over all the words in the corpusand where�(i; j) = � 1 when wordsi andj are from the same story0 otherwise
Choice ofk is a critical consideration in order to produce ameaningful and sensitive evaluation. For the TDT study cor-pus,k will be chosen to be half the average document length,in words, of the text stream on which we evaluate (about 250for the TDT Corpus, for example).4“Text Segmentation Using Exponential Models”, by Doug Beeferman,Adam Berger, and John Lafferty.5There are several reasons for using words rather than stories. First, therewill likely be less debate and fewer problems in deciding howto delimitwords than how to delimit sentences. Second, the word seems like a moresuitable unit of measurement, because of the relatively high variability of thelength of sentences.

Indirect Evaluation of Segmentation Segmentation willbe evaluated indirectly by measuring event tracking perfor-mance on stories as they are defined by automatic segmen-tation means. A segment will contribute to detection errorsproportionate to how it overlaps with stories that would con-tribute to the error rates. Details of this evaluation are pre-sented in Section in the tracking chapter.
2.2. Dragon Approach
Theory Dragon’s approach to segmentation is to treat astory as an instance of some underlying topic, and to modelan unbroken text stream as an unlabeled sequence of thesetopics. In this model, finding story boundaries is equivalentto finding topic transitions.
At a certain level of abstraction, identifying topics in a textstream is similar to recognizing speech in an acoustic stream.Each topic block in a text stream is analogous to a phonemein speech recognition, and each word or sentence (depend-ing on the granularity of the segmentation) is analogous toan “acoustic frame”. Identifying the sequence of topics inan unbroken transcript therefore corresponds to recognizingphonemes in a continuous speech stream. Just as in speechrecognition, this situation is subject to analysis using classicHidden Markov Model (HMM) techniques, in which the hid-den states are topics and the observations are words or sen-tences.
More concretely, suppose that there arek topicsT (1), T (2),. . . , T (k). There is a language model associated with eachtopicT (i), 1 � i � k, in which one can calculate the prob-ability of any sequence of words. In addition, there are tran-sition probabilities among the topics, including a probabilityfor each topic to transition to itself (the “self-loop” probabil-ity), which implicitly specifies an expected duration for thattopic. Given a text stream, a probability can be attached toany particular hypothesis about the sequence and segmenta-tion of topics in the following way:
1. Transition from the start state to the first topic, accumu-lating a transition probability.
2. Stay in topic for a certain number of words or sen-tences, and, given the current topic, accumulate a self-loop probability and a language model probability foreach.
3. Transition to a new topic, accumulating the transitionprobability. Go back to step 2.
A search for the best hypothesis and corresponding seg-mentation can be done using standard HMM techniques andstandard speech recognition tricks (using thresholding if thesearch space gets too large, for example).
Implementation Details Since the entire TDT Corpus is setaside for evaluation, training data for a segmenter must comefrom other sources. One such source available to all sitesis the portion of Journal Graphics data from the period Jan-uary 1992 through June 1994. This data was restricted to theCNN shows included in the TDT Corpus, and stories of fewerthan 100 and more than 2,000 words were removed. This left15,873 stories of average length 530 words. A global unigrammodel consisting of 60,000 words was built from this data.
The topics used by the segmenter, which are referred to asbackgroundtopics, were constructed by automatically clus-tering news stories from this training set. The clustering wasdone using a multi-passk-means algorithm that operates asfollows:
1. At any given point there arek clusters. For each story,determine its distance to the closest cluster (based on themeasure described below), and if this distance is below athreshold, insert the story into the cluster and update thestatistics. If this distance is above the threshold, create anew cluster.
2. Loop through the stories again, but now consider switch-ing each story from its present topic to the others, basedon the same measure as before. Some clusters may van-ish; additional clusters may need to be created. Repeatthis step as often as desired.
The distance measure used in the clustering was a variationof the symmetric Kullback-Leibler (KL) metric:d = Xn (sn=S) log sn=S(cn + sn)=(C + S)+ Xn (cn=C) log cn=C(cn + sn)=(C + S) ;wheresn andcn are the story and cluster counts for wordwn,with S =P sn andC =P cn.
A background topic language model was built from each clus-ter. To simplify this task, the number of clusters was limitedto 100 and each topic was modeled with unigram statisticsonly. These unigram models were just smoothed versions ofthe raw unigram models generated from the clusters. Smooth-ing each model consisted of performing absolute discountingfollowed by backoff to the global unigram model. The uni-gram models were filtered against a stop list to remove 174common words.
Decoding of text was done by actually using code from aspeech recognizer with 100 underlying “single node” models(corresponding to the topics), each of which was representedby a unigram model as described above. As in speech, thetext was scored against these models oneframeat a time –

a frame corresponding, in these experiments, to a sentence.The topic-topic transition penalties were folded into a singlenumber, the topic-switch penalty, which was imposed when-ever the topic changed between frames/sentences.
The topic-switch penalty was tuned to produce the correctaverage number of words per segment on the first 100 storiesfrom the test set. There are no other parameters to tune exceptthe search beam width, which was set large enough to avoidsearch errors in the experiments.
Results
TDT Corpus. The segmentation error metric computed forDragon’s system on the full TDT Corpus was 12.9%. Thesegmenter produced 16,139 story boundaries, compared tothe 15,863 actual boundaries in the test set. Of these, 10,625were exact matches, yielding a recall rate of 67.0% and a pre-cision of 65.8%.
CNN vs. Reuters. One might expect that, because the dataused to train the segmenter’s background models was takenentirely from CNN broadcasts, the performance of the seg-menter on the CNN portion of the TDT Corpus would be sig-nificantly better than its performance on the Reuters portion.To explore this, Dragon ran the evaluation separately on thetwo subcorpora. The system returned a segmentation error of16.8% (worse than for the corpus as a whole!) on CNN, andan error of 12.3% (better!) on Reuters.
The most likely explanation for this anomaly is that the CNNis more difficult than Reuters for a content-based segmentersuch as Dragon’s. For example, written news tends to bemore concise than broadcast news, with none of the typi-cal “broadcast fillers”, such as introductions, greetings, andsign-offs. It is also the case that the length of CNN storiesvaries much more widely than Reuters stories, a problem forthis segmenter, which has a single parameter controlling forlength.
TWA Corpus. The closed-caption version of the corpuscontains punctuation marks, making it possible to introducesentence breaks in the usual way. The recognized transcrip-tions, of course, contain no punctuation, so breaks were in-troduced at arbitrary points in the segments in such a way asto produce approximately the same number of “sentences” asin the closed-caption case.
On the closed-caption data, the segmenter returned a segmen-tation error of 25.5%. On the recognized data the error was33.6%. The size of these numbers suggests that the problemof segmenting broadcasts may be harder than the TDT Cor-pus leads us to believe. In any event, it would be interestingto calibrate these error rates against the result on a clean tran-scription of the TWA Corpus.
The Future It is remarkable that this simple application ofHMM techniques to segmentation and tracking achieves such
promising results. This work represents just the beginningof what can be achieved with this approach; many improve-ments are possible, both by incorporating ideas found in im-plementations at the other sites and from generalizations ofthe techniques already employed.
In particular, some form of story modeling that attempts torecognize features around boundaries, which both UMass andCMU incorporate into their systems, should be incorporatedinto Dragon’s framework. One way to do this, which contin-ues in the spirit of the speech recognition analogy, is to use“multi-node” story models, in which a story is modeled as asequence of nodes (for example, one which models the storystart, one which models the middle, and one which modelsthe end) rather than a single topic model.
It is also possible to improve the topic modeling that alreadyforms the basis of the segmenter. Some methods of achievingthis include using bigram models in place of unigram modelsfor topics, including a “trigger model” of the kind employedby CMU, and adaptively training the background during seg-mentation. It is also likely that the basic speech-inspired lan-guage models can be improved by incorporating informationretrieval measures that are more informed about topic infor-mation, such as the local context analysis used by UMass.
2.3. UMass Approach
Content Based LCA Segmentation UMass has developedtwo largely complementary segmentation methods. The firstmethod makes use of the technique of local context analy-sis (LCA) [16]. LCA was developed as a method for auto-matic expansion of ad hoc queries for information retrieval.It is somewhat like the method of local feedback [5] but hasbeen shown to be more effective and more robust. For thesegmentation task, LCA can be thought of as an associationthesaurus which will return words and phrases which are se-mantically related to the query text and are determined basedon collection-wide co-occurrence as well as similarity to theoriginal sentence. Each sentence is run as a query against theLCA database and the top 100 concepts are returned. Theoriginal sentence is then replaced with the LCA concepts andthe effect is that sentences which originally had few or per-haps no words in common will typically have many LCA con-cepts in common.
The original LCA method was derived from that described in[12]. The text is indexed at the sentence level using offsets toencode the positions of the LCA features. For example, sup-pose the feature “O. J. Simpson” occurs in sentence 1, 3, and10. The index will encode these positions as 1, 2 and 7, theoffset from the previous occurrence of the concept. The mainidea of the LCA segmenter is to use these offsets to measureshifts in vocabulary over time. The original method, whichwas tested on the Wall Street Journal, used a simple func-tion of the offsets as a heuristic measure of the “surprise”

of seeing a particular concept in a particular sentence. Ina homogeneous collection such as the Wall Street Journal,this heuristic, in conjunction with LCA expansion, workedquite well. However, the TDT Corpus has stories from sev-eral sources and so it often happens that several stories onthe same topic will occur in close proximity. Moreover, sincethe TDT Corpus consists of transcribed speech, there is farmore off-topic language than in the Wall Street Journal. Forexample, throughout the corpus, one finds social interactionbetween speakers which does not relate to the current topic.These two difficulties were circumvented by means of an ex-ponential length model. Rather than looking at the total sizeof the offset, a model of the average segment size was used.The model was used to determine the probability that an oc-currence of a concept was in the same segment as the previ-ous occurrence. This method is more robust with respect tomultiple stories on same topic and to “social noise” than theoriginal method and performance is improved.
The LCA method can be thought of as a content-basedmethod. It works by looking at changes in content-bearingwords. It is somewhat similar to the topic models used inDragon’s method and to the relevance features in CMU’smethod. The strong point of the LCA method is that, otherthan the length model estimation, it is completely unsuper-vised. One weakness of this method is that the current im-plementation is somewhat slow since it requires a databasequery per sentence. However, it could be sped up consider-ably using standard information retrieval query optimizationtechniques. A second weakness is that performance of theLCA expansion currently requires sentence breaks. A modifi-cation of this approach would be to use a fixed-sized windowrather than sentences as the atomic unit for expansion.
Discourse Based HMM Segmentation The second seg-mentation method uses a Hidden Markov Model to model“marker words,” or words which predict a topic change. Themodel consists of one or more states for the firstN sentencesof a segment, one or more for the lastN sentences, and oneor more for the remainder of the segment. So while the LCAsegmenter relies on shifts in content, the HMM segmenter isrelying on words which predict the beginning or end of a seg-ment without regard to content. This is somewhat similar toCMU’s use of vocabulary features. The model is trained us-ing segmented data. Unknown word probabilities were han-dled with a very simple smoothing method.
Additional Features. In addition to the word probabilities,other features were modeled. These included sentence length(which would be implicit in a word based segmenter), serialclustering tendency [3], and distance from previous occur-rence. Each of these features was measured as a standardscore, and state probabilities were estimated from the train-ing data. These three features yielded a very slight improve-ment over the words alone. Part of the reason why they did
not help more is that, in the first place, the distributions of thefeatures are far from normal and, secondly, most of the datapoints cluster around the mean. This suggests that an adaptivebinning technique would work better than using standardizedscores.
In order to shed some light on this conjecture, all of thedata points lying more than one standard deviation from themean were discarded and a new mean and standard deviationwere computed and the scores restandardized. This admit-tedly poor modification yielded a modest improvement overthe initial standard scores and therefore suggests that adap-tive binning would be appropriate. However, it is not knownto what extent the results would improve from better binning.
One advantage of the HMM implementation is that it is veryfast. Training time is approximately 15 minutes on the TDTtraining corpus and segmentation is extremely fast as onewould expect from an HMM with a small number of states.Also, unlike the LCA method, the HMM method can be usedat the word level (although the current implementation worksat the sentence level). The disadvantage of the HMM methodis that it requires segmented training data.
Results and Discussion
LCA Method. The LCA segmenter achieves a 17.6% errorrate on the TDT Corpus. The new method is still heuris-tic in nature and a more principled use of the LCA con-cepts would, in all likelihood, improve performance further.Two additional improvements could be made to the LCA ap-proach. First, one difficulty with the LCA method is thatwhen one gives a query to LCA such as “Thank you andgood-night,” the concepts one gets back are essentially ran-dom. The current method is fairly robust with respect to areasonable amount of random noise, but perhaps a better ap-proach would be to model the noise words and not pass themto LCA at all. The second approach is to make use of thediscourse features as well. This is discussed further below.
HMM Method. The HMM segmenter has a 23% error rateon the TDT Corpus. One caveat is that this approach may relyon the similarity of the training data to the test data somewhatheavily. Still, it shows that very simple discourse modelingcan provide useful information. This method could be mademore robust by explicitly modeling “segues” and other regu-larities of the source. For example, it would be more generalto tag place names and names of reporters and to learn theprobability of segment boundaries relative to the tags ratherthan to the specific names as the current approach does.
The Future One obvious question is to what extent a hybridapproach would improve performance over either methodalone. For example, one could use an HMM based segmenterand sample the LCA concepts at locations where the distri-bution is less peaked, i.e. use LCA in places where one leastsure about a break. A second reasonable hybrid would be to

combine the content-based HMM segmenter used by Dragonwith a simple discourse-based HMM segmenter.
It may also be possible to leverage the strengths of the two ap-proaches as follows. The LCA segmenter works in an unsu-pervised manner but is somewhat slow. The HMM segmenteris very fast, but requires training data. Over time, one coulduse the LCA segmenter on a sample of the incoming data inorder to provide “up to the minute” training data for the fasterHMM segmenter in order to keep the distributions up to dateas the language use shifts over time.
2.4. CMU Approach
Motivation The original motivation for the CMU segmen-tation research arose in the context of multimedia informa-tion retrieval applications. In particular, both the News-on-Demand and video library projects within Informedia DigitalLibraries project require segmentation of the video stream foraccurate and useful indexing, retrieval, browsing, and sum-marization.
In order to find natural breaks in a video stream, it is impor-tant to make use of the concurrent and often complementaryinformation in the text (closed captions or speech output), au-dio, and image streams. The CMU approach was designedaround the idea that various “features” of these multiple me-dia sources should be extracted and then combined into astatistical model that appropriately weighs the evidence, andthen decides where to place segment boundaries. For multi-media, the relevant features might include questions such as:Does the phraseCOMING UP appear in the last utterance ofthe decoded speech? Is there a sharp change in the videostream in the last20 frames? Is there a “match” between thecurrent image and an image near the last segment boundary?Are there blank video frames nearby? Is there a significantchange in the frequency profile of the audio stream in the nextutterance?
There are several key ingredients in this basic approach ap-plied to the subproblem of text segmentation:
1. Content-based features derived from a pair of languagemodels that are used to help gauge “large scale” changesof topic.
2. Lexical features that extract information about the locallinguistic and discourse structure of the context.
3. A new machine learning algorithm that incrementallyselects the best lexical features and combines them withthe information provided by the language models toform a unified statistical model.
The use of language models, as described below, is gearedtoward finding changes of topic—whether within or acrosssegment boundaries. This component is similar in spirit to
Dragon’s use of unigram language models trained on clus-ters of segments, and the UMass local context analysis tech-nique. The lexical features complement this informationby making more fine-grained judgments about those wordsthat correlate—both positively and negatively—with segmentboundaries. The feature selection algorithm automatically“learns” how to segment by observing how segmentationboundaries are placed in a sample of training text. This algo-rithm incrementally constructs an increasingly detailed modelto estimate the probability that a segment boundary is placedin a given context. Each of these ingredients is described inmore detail below.
Language Models. In the CMU approach the relative be-havior of anadaptivelanguage model is compared to astatictrigram language model in an on-line manner. The basic ideais that the adaptive model generally gets better and better asit sees more material that is relevant to the current “topic”of a segment. However, when the topic changes, the perfor-mance of the adaptive model degrades relative to the trigrammodel since it is making its predictions based upon the con-tent words of the previous topic. These language models areessentially the same as those employed for the speech recog-nition system used in CMU’s entry in the recent TREC eval-uation for spoken document information retrieval.
Two static trigram models are used—one for the CNN ex-periments and one for Reuters experiments. The CNN ex-periments use a static trigram modelptri(w jw�2; w�1) witha vocabulary of roughly 60,000 words that is trained on ap-proximately150million words (four and a half years) of tran-scripts of various news broadcasts, including CNN news, butexcluding those Journal Graphics transcriptions that overlapwith the time frame of the TDT Corpus. The Reuters exper-iments use a trigram model that has a vocabulary of 20,000words and is trained on approximately 38 million words ofWall Street Journal data. Both models use the Katz backoffscheme [9] for smoothing.
The method used to construct the adaptive model is to treatthe static trigram model as a default distribution, and then toadd certain features based on semantic word classes in or-der to form a family of conditional exponential models. Thedetails of this model are described in [1]. Since the adap-tive model should improve as it sees more material fromthe current topic (or event), a segment boundary is likelyto exist when the adaptive model suddenly shows a dip inperformance—a lower assigned probability to the observedwords—compared to the short-range model. Conversely,when the adaptive model is consistently assigning higherprobabilities to the observed words, a partition is less likely.
Lexical Features. The use of simple lexical features is in-tended to capture words or phrases that are commonly usedto begin or end a segment in a particular domain, as well as toextract simple linguistic and discourse clues that a boundary

is near.
As an example, in the domain of CNN broadcast news, astory often will end with a reporter giving his or her nameand the location of the report:THIS IS WOLF BLITZER RE-PORTING LIVE FROM THE WHITE HOUSE. In the domainof Reuters newswire, on the other hand, which originates aswritten communication, a story is often introduced by record-ing the day on which the event occurred:A TEXAS AIR NA -TIONAL GUARD FIGHTER JET CRASHED FRIDAY IN A RE-MOTE AREA OF SOUTHWEST TEXAS.
The lexical features enable the presence or absence of partic-ular words in the surrounding context to influence the statisti-cal segmenter. Thus, the presence of the wordREPORTINGinthe broadcast news domain, or the presence of the wordFRI-DAY in the newswire domain might indicate that a segmentboundary is nearby. The way in which the learning algorithmactually chooses and uses these features is described brieflyin the next section.
Feature Induction The procedure for combining the evi-dence in the language models and the lexical features is basedon a statistical framework calledfeature inductionfor randomfields and exponential models [2, 4]. The idea is to constructa model which assigns to each position in the data streama probability that a boundary belongs at that position. Thisprobability distribution is incrementally constructed as a log-linear model that weighs different “features” of the data. Forsimplicity, it is assumed that the features are binary questions.
One way to cast the problem of determining segment bound-aries in statistical terms is to construct a probability distri-bution q(b j!), whereb 2 fYES; NOg is a random variabledescribing the presence of a segment boundary in context!. Consider distributions in thelinear exponential familyQ(f; q0) given byQ(f; q0) = �q(b j!) = 1Z�(!)e��f(!) q0(b j!)�whereq0(b j!) is a prior ordefaultdistribution on the pres-ence of a boundary, and� � f(!) is a linear combination ofbinary featuresfi(!) 2 f0; 1g with real-valuedfeature pa-rameters�i:� � f(!) = �1f1(!) + �2f2(!) + � � ��nfn(!) :The normalization constantsZ�(!) = 1+ e��f(!) insure thatthis is indeed a family of conditional probability distributions.
The judgment of the merit of a modelq 2 Q(f; q0) relative toa reference distributionp 62 Q(f; q0) during training is madein terms of the Kullback-Leibler divergenceD(p k q) =X!2 p(!) Xb2fYES;NOg p(b j!) log p(b j!)q(b j!) :
Thus, whenp is chosen to be the empirical distribution of asample of training eventsf(!; b)g, the maximum likelihoodcriterion is used for model selection. The training algorithmfor choosing the parameters to minimize the divergence is theImproved Iterative Scalingalgorithm presented in [4].
This explains how a model is chosen once the featuresf1; : : : ; fn are known, but how are these features to be found?One possibility is a greedy algorithm akin to growing a deci-sion tree, although the models are closer to the form of cer-tain neural networks. In brief, thegainof a candidate is esti-mated as the improvement to the model that would result fromadding the feature and adjusting its weight to the best value.After calculating the gain of each candidate feature, the onewith the largest gain is chosen to be added to the model, andall of the model’s parameters are then adjusted using iterativescaling. In this manner, an exponential model is incremen-tally built up using the most informative features. See [4] fordetails.
Results The exponential models derived using feature in-duction give a probabilityp(b = YES j!) that a boundaryexists at a given position in the text. In order to actually seg-ment text, this probability is computed in an “on-line” man-ner, scanning the text sequentially. It is assumed that sentenceboundaries have been identified, and segment boundaries areonly placed between sentences. A segment boundary is hy-pothesized if (1) the probabilityp(b = YES j!) exceeds apre-specified threshold�, and (2) a boundary has not beenpreviously placed in the immediately preceding� sentences.The parameters� and� were chosen on a portion of heldouttraining data to minimize the error probability, and were setto� = 0:15 and� = 5 for CNN data, and� = 0:25 and� = 2on newswire data.
As described in the TDT Evaluation Plan, the direct evalu-ation for a hypothesized segmentationhyp with respect tothe reference segmentationref is computed as a probabil-ity p(errorjref;hyp; k). This is the probability that a ran-domly chosen pair of words a distance ofk words apart isinconsistently classified; that is, for one of the segmentationsthe pair lies in the same segment, while for the other the pairspans a segment boundary.
The CNN segmentation model was trained on approximatelyone million words of broadcast news data not included in theTDT Corpus, using the broadcast news language models de-scribed above as the basis for language model features. Atotal of 50 features were induced, and the model was trainedusing the Improved Iterative Scaling algorithm. The selec-tion of each feature from the pool of several hundred thou-sand candidates takes on the order of 30 minutes, and thentraining all of the weights takes roughly five minutes, on ahigh-end workstation. No cross-validation was done to de-termine the best stopping point, nor was the resulting modelsmoothed in any way. One of the advantages of feature induc-

tion for exponential models, versus more standard machinelearning techniques such as decision trees, is that the proce-dure is quite robust against over-fitting. When the resulting50 feature model was then evaluated on the CNN portion ofthe TDT Corpus, the error rate was 12.5%. The exact matchprecision and recall were 72.2% and 72.3% respectively.
The segmentation model for the Reuters portion of the TDTCorpus was built using a collection of approximately 250,000words of AP newswire data, Wall Street Journal articles, andReuters headline news segments extracted from the Internet.The language models used were trained on 38 million wordsof Wall Street Journal data. Because of the lack of trainingdata from the Reuters domain, as well as the general absenceof strong cue phrases for story transitions in this written do-main, it was expected that the resulting segmentation perfor-mance would be inferior to that obtained for broadcast news,and this was indeed what happened in the CMU results. A 50feature model was induced on the training set, and when eval-uated on the Reuters portion of the TDT Corpus, the resultingerror rate was 15.5%.
The Future The CMU segmentation research carried outunder the TDT project is clearly only a beginning, and thereare many directions in which this work can be extended, im-proved, and made more practical. There is current work goingon at CMU to build on these results to develop segmentationalgorithms for multimedia data, making use of parallel text,audio, and video streams.
The CMU approach has an economy of scale since the lan-guage models that are used are identical to those that are usedfor speech recognition systems constructed in the same do-main. Improved language models for speech recognition canbe expected to yield improved performance for segmentation.The exponential models resulting from feature induction arevery “concrete” in the sense that only a handful of specificfeatures are extracted, and the behavior of the resulting seg-menter can be well understood—there are specific “explana-tions” of the decisions that it makes. Moreover, since themodel directly assigns a probability distribution to bound-aries, a confidence in the decisions is easy to assign.
The challenge of future work is to preserve these strengthswhile integrating the complementary strengths of the Dragonand UMass approaches.
2.5. Discussion
One of the remarkable outcomes of the TDT study on seg-mentation is the diversity of ideas and techniques that havebeen brought to bear on this problem. Broadly speaking,these ideas and techniques fall into two classes: those thatfocus on storycontentand those that focus on story struc-ture ordiscourse. In the details, however, there is very littlesimilarity between approaches. Dragon’s content-based sys-
TWATDT CNN Reuters cc rec
Dragon 12.9 16.8 12.3 25.5 33.6UMass 17.6 — — — —CMU — 12.5 15.5 — —
Table 1: Segmentation error rates (percentages).
tem models stories as instances of topics described by sim-ple unigram statistics; UMass, in one approach, treats storiesas collections of similar queries to an information retrievalsystem, and in another approach, as a set of words boundedby marker words and phrases; and CMU’s system exploitsboth content and discourse features simultaneously, trainingan exponential model to combine information from a trig-ger/trigram language model with features that are associatedwith story boundaries.
This variety of approaches bodes well for the future of workon segmentation. It not only means that improvements on thecurrent task are likely to be realized by combining some ofthese different ideas, but also that a variety of different taskscan be addressed by selecting the approach with the appro-priate strengths. For example, on the CNN task, for whicha large amount of well-matched training data was available,CMU’s feature-learning mechanism proved to be very effec-tive; on the Reuters task, for which well-matched training ma-terial was not available, Dragon’s content-based system wasmore robust (see Table 1).
The indirect evaluation of segmentation (described in Sec-tion ) shows that carefully transcribed broadcast data canprobably be segmented well enough with the current meth-ods that subsequent processing (tracking, at least) will notsuffer much. It remains to be seen if the same can be saidof not-so-carefully transcribed data, such as that produced byclosed-captioning or recognition. The one small test that hasbeen done using the TWA Corpus indicates that this may be ahard problem. On the other hand, in TDT segmentation of thebroadcast stream is not an end in itself, but an enabling tech-nology for subsequent tracking and detection processes, andit may prove to be the case that methods of the type developedhere will be adequate to support these technologies.
3. New Event Detection
Eventdetectionis the problem of identifying stories in sev-eral continuous news streams that pertain to new or previ-ously unidentified events. In other words, detection is an un-supervised learning task (without labeled training examples).Detection may consist of discovering previously unidenti-fied events in an accumulated collection (“retrospective de-tection”), or flagging the onset of new events from live news

feeds or incoming intelligence reports in an on-line fashion(“on-line detection”). Both forms of detection by design lackadvance knowledge of the new events, but do have access to(unlabeled) historical data as a contrast set.
In the TDT study, the input toretrospective detectionis theentire corpus. The required output by a detection system isa partition of the corpus, consisting of story clusters whichdivide the corpus into event-specific groups according to thesystem’s judgment. (CMU’s and UMass’s methods exhibitconsiderably better performance when they are allowed toplace stories within multiple event groups.)
The input toon-line detectionis the stream of TDT storiesin chronological order, simulating real-time incoming newsevents. The output of on-line detection is a YES/NO deci-sion per story made at the time when the story arrives, in-dicating whether this story is the first reference to a newlyreported event. A confidence score per decision is also re-quired. These scores are used later to investigate potentialtrade-offs between different types of errors(misses and falsealarms) by applying different thresholds on these scores andthus shifting the decision boundary.
How to use the above information to detect unknown eventspresents new research challenges. There are multiple ways toapproach the problem.� The CMU approach to retrospective event detection is to
cluster stories in a bottom-up fashion based on their lexi-cal similarity and proximity in time. The CMU approachto on-line detection combines lexical similarity (or dis-tance) with a declining influence look-back window ofk days when judging the current story, and determineNEW or OLD based on how distant of the current storyfrom the closest story in thek days window.� The UMass approach to on-line detection is similar tothe extent that it uses a variant of single-link clusteringand builds up (clusters) groups of related stories to rep-resent events. New stories are compared to the groupsof older stories. The matching threshold is adjusted overtime in recognition that an event is less likely to be re-ported as time passes. UMass’ retrospective detectionmethod focuses on rapid changes by monitoring suddenchanges in term distribution over time.� The Dragon approach is also based on observations overterm frequencies, but using adaptive language modelsfrom speech recognition. When prediction accuracy ofthe adapted language models drops relative to the back-ground model(s), a novel event is hypothesized.
3.1. Detection evaluation
The detection task used the entire TDT study corpus as in-put. However, detection performance was evaluated only on
those stories which discuss only one of the 25 target eventsand which are flagged as such with a YES flag for that story.There are 1131 such stories.6Retrospective Event Detection System output for the ret-rospective event detection task is the clustering informationnecessary to associate each of the stories with a cluster. (Eachstory is constrained to appear in only one cluster.) This in-formation is recorded in a file, one record per story, withrecords separated by newline characters and with fields in arecord separated by white space. Each record has five fields inthe following format: “Cluster Nt Story DecisionScore”, where:� Clusteris an index number in the rangef1, 2, . . .gwhich
indicates the cluster (event) affiliation of the story.� Nt is the number of stories used to train the system to theevent. (Since this is a detection task,Nt = 0, but it iskept in the output to maintain format uniformity acrossdifferent tasks.)� Story is the TDT corpus index number in the rangef1,2, . . . 15863g which indicates the story being processed.� Decisionis either YES or NO, where YES indicates thatthe system believes that the story being processed dis-cusses the cluster event, and NO indicates not. (Again,Decision should always be YES since the story is amember of its cluster, but it is retained in the output for-mat so as to maintain format uniformity across differenttasks.)� Scoreis a real number which indicates how confidentthe system is that the story being processed discussesthe cluster event. More positive values indicate greaterconfidence.
The performance of retrospective detection is evaluated bymeasuring how well the stories belonging to each of the targetevents match the stories belonging to the corresponding clus-ter. This presents a problem, because it is not known whichof the clusters corresponds to a particular target event. Thus itis necessary to associate each target event with (exactly) onecluster to determine this correspondence. This was accom-plished by associating each target event with the cluster thatbest matches it. The degree of match between an event anda cluster is defined to be the number of stories that belong toboth the event and the cluster.
Note that retrospective detection uses the entire TDT corpusof 15,863 stories, but is evaluated only on the manually la-beled stories of 25 events (containing about 7% of the totalstories).6There are a total of 1382 non-NO event flags and 1372 flagged stories.(10 stories were flagged by two events.) However, 240 of thesestories wereflagged as BRIEF, and one was flagged as YES by two events.
On-line New Event Detection The on-line new event detec-tion task is to output a new event flag each time a story dis-cusses a new event. Since evaluation is performed only overthe set of target events, the small number (25) of type I trialspresents a problem for estimating performance. This problemis addressed by artificially changing the corpus so as to mul-tiply the number of type I trials byNskip (with Nskip = 10).This is done in the following way:� The corpus is processed once after deleting all stories
with BRIEF event tags.� The corpus is processed a second time after further delet-ing the first story which discusses each of the targetevents.� The corpus is processedNskip�1more times, each timefurther deleting the subsequent first (next) story whichdiscusses each of the target events, until the firstNskipstories discussing each of the target events have beenskipped.
System output for the on-line detection task will be a dec-laration for each story processed. This output is to indicatewhether or not the story discusses a new event. This infor-mation was recorded in a file in ASCII format, one recordper story, with records separated by newline characters andwith fields in a record separated by white space. Each recordhas six fields in the following format: “Event Nt StoryDecision Score jskip”, where:� Eventis an event index number. (Since there is no event
affiliation for the on-line detection task, Event is set tozero, but it is retained in the output format so as to main-tain format uniformity across different tasks.)� Nt is the number of stories used to train the system tothe event. (Since this is a detection task,Nt is identi-cally zero, but it is retained in the output format so as tomaintain format uniformity across different tasks.)� Story is the TDT corpus index number in the rangef1,2, . . . 15863g which indicates the story being processed.� Decisionis either YES or NO, where YES indicates thatthe system believes that this story is the first to discussthe event which the story discusses, and NO indicatesnot.� Scoreis a real number which indicates how confidentthe system is that the story being processed is the first todiscuss the event. More positive values indicate greaterconfidence.� jskip is the number of initial stories that have beenskipped for each of the target events, in the rangef0,1, . . .Nskip g.
Evaluation measures Given a story and a particular eventin consideration, the output of a detection system is aYES/NO decision with a confidence score. The performanceaverage over a set of test stories is used to evaluate the de-tection system. Five evaluation measures are reported in thisstudy: miss rate, false alarm rate, recall, precision, and theF1measure. The miss and false alarm rates were the “official”measures of the pilot study.
The F1 measure[14] was used as a way of balancing re-call and precision, in a way that each of them is givenequal weight. A more general form of theF-measureisF�(r; p) = (�2+1)pr�2p+r where� is the parameter allowing dif-ferential weighting ofp andr. The F-measure is commonlyused as an optimization criterion in binary decision making,when recall and precision are considered as the primary per-formance measures.
In addition to optimizing binary decisions, another objectiveof the TDT study is the ability to achieve a tradeoff betweendifferent types of performance scores at any level desired. ADecision Error Trade-off (DET) curve between misses andfalse alarms is used for this part of the evaluation.
3.2. The CMU Approach
Given the lack of knowledge about events, event detectionis essentially a discovery problem—i.e.,mining the datafornew patterns, in a new paradigm ofquery-freeretrieval. CMUtakes an approach based on group average agglomerative textclustering, aiming the discovery of natural patterns of newsstories over concepts (lexicon terms) and time. This ap-proach creates a hierarchical tree of clusters, with the top lay-ers representing a rough division into general topics, and thelower ones a finer division into narrower topics and events.CMU also investigated an incremental average-link cluster-ing method that produces a single level partition of the TDTcorpus.
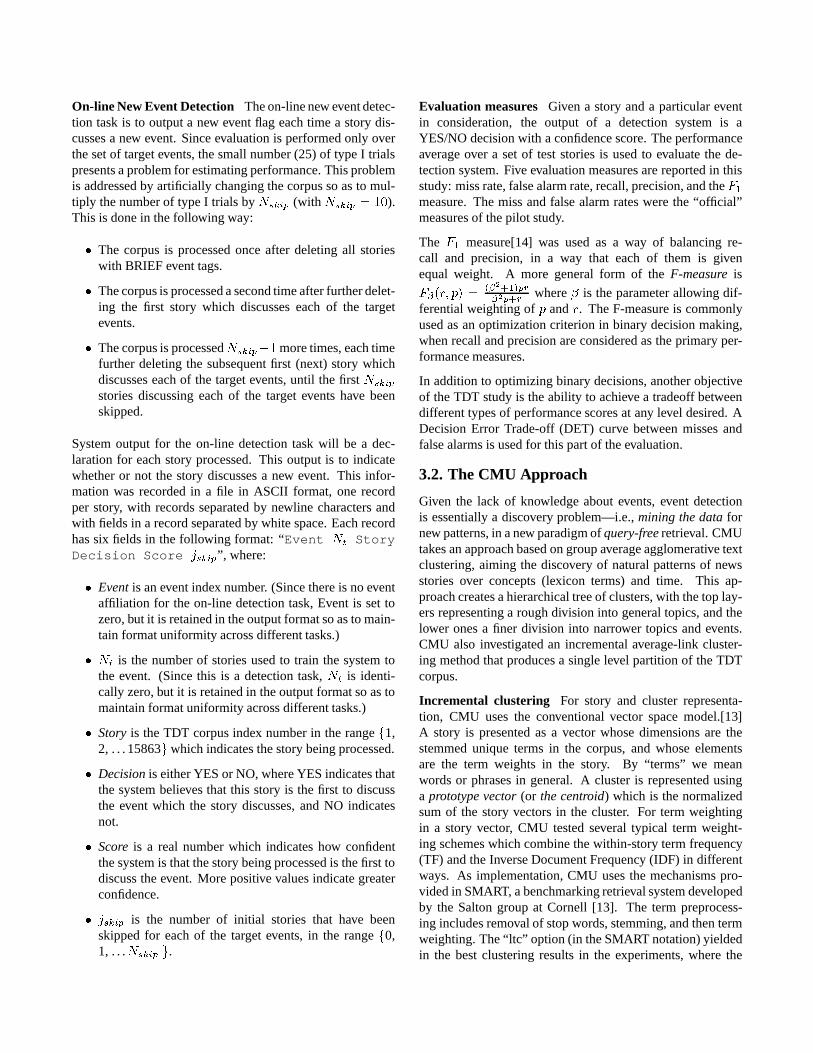
Incremental clustering For story and cluster representa-tion, CMU uses the conventional vector space model.[13]A story is presented as a vector whose dimensions are thestemmed unique terms in the corpus, and whose elementsare the term weights in the story. By “terms” we meanwords or phrases in general. A cluster is represented usinga prototype vector(or the centroid) which is the normalizedsum of the story vectors in the cluster. For term weightingin a story vector, CMU tested several typical term weight-ing schemes which combine the within-story term frequency(TF) and the Inverse Document Frequency (IDF) in differentways. As implementation, CMU uses the mechanisms pro-vided in SMART, a benchmarking retrieval system developedby the Salton group at Cornell [13]. The term preprocess-ing includes removal of stop words, stemming, and then termweighting. The “ltc” option (in the SMART notation) yieldedin the best clustering results in the experiments, where the

weight of termt in storyd is defined to be:w(t; d) = (1 + log2 TF(t;d))� IDFt=k~dk:The denominatork~dk is the 2-norm of vector~d, i.e., thesquare root of the squared sum of all the elements in that vec-tor. The similarity of two stories is defined as the cosine valueof the corresponding story vectors. Similarly, the similarity oftwo clusters is defined as the cosine value of the correspond-ing prototype vectors.
Having stories and clusters represented in vectors, the incre-mental clustering is straightforward. For each consecutivestory, compute the cosine similarity of this story and eachcluster centroid in the accumulated set. If the similarity scorebetween this story and the closest cluster is above a threshold(pre-selected), then add this story to the cluster as a member,and update the prototype vector correspondingly. Otherwise,add this story as a new cluster in the set. Repeat the aboveuntil the corpus is done.
This algorithm results in a flat partition of the TDT corpus.The number of clusters in the partition depends on the clus-tering threshold in Step 3. When setting the threshold to avalue of 0.23, we obtained a partition of 5,907 clusters whichyielded the optimal result evaluated using the 25 events la-beled by humans (see Section ).
Group-average based clustering The core part of CMU’smethod is an agglomerative algorithm namedGroup AverageClustering[8, 6] which maximizes the average pairwise simi-larity between stories in each cluster. This algorithm uses thesame vector representation for documents and clusters andproduces a binary tree of story clusters in a bottom-up fash-ion: the leaf nodes tree are single-story clusters; a middle-level node is the centroid of the two most proximate lower-level clusters; and the root node of the tree (if the algorithmis allowed to reach this point) is the universal cluster whichcontains all sub-clusters will all the stories. The GAC al-gorithm has a quadratic complexity in both time and space,although envisioned improvements based on [15] and otherwork at CMU should yield sub-quadratic space complexity,without increasing time complexity. In order to reduce the ef-fective complexity and to exploit natural temporal groupingsof events in news-streams CMU used the following modifiedform of GAC clustering:
1. Sort the TDT stories in chronological order, and use thisas the initial partition of the corpus where each clusterstarts with a single story.
2. Divide the partition (a cluster series) into non-overlapping and consecutive buckets whose size is fixedin terms of the number of clusters they contain.
3. Apply GAC to each bucket, i.e., combine lower-levelclusters into higher-level ones in a bottom-up fashion
until the bucket size (number of clusters in it) is reducedby a factor of�.
4. Remove the bucket boundaries (assemble all the GACclusters) while reserving the time order of the clusters.Use the resulting cluster series as the updated partitionof the corpus.
5. Repeat Step 2-4, until a pre-determined number of clus-ters is achieved in the final partition.
6. Periodically (say, once per 3 iterations in Step 2-4) flat-ten each cluster, and apply GAC internally to each flat-tened cluster for re-clustering. This is CMU’s augmenta-tion to Cutting and Pedersen’s algorithm. It enables sto-ries belonging to the same event, but initially assigned todifferent buckets, to be re-assigned to a common cluster.
On-line Detection Algorithm CMU’s on-line detection isimplemented as below:
1. The algorithm starts with an empty set (“PAST”) of clus-ters, with the pre-determined values for the followingparameters:� the detection thresholdwhich is the minimum
score for the system to say that the current storybelongs to a new event;� the combining thresholdwhich is the minimumsimilarity score for adding a story as a new mem-ber of an existing cluster;� the window sizewhich is the maximum number ofclusters in PAST, or the aging limit (in terms ofdays) of a cluster to be a member in PAST.
2. Read the next story as “the current”. Compute the simi-larity of this story and all the clusters in PAST.� If the largest similarity value is above thedetection
threshold, then announce “YES” as the detectionof a new event; otherwise, announce “NO”.� If the largest similarity value is above thecluster-ing threshold, then add the current story to the clos-est cluster, and update the prototype vector of thecluster correspondingly; otherwise, add the currentstory an a new cluster in PAST, and remove the old-est cluster from PAST if it exceeded the windowsize.
3. Repeat the above step until the end of the input series.
This algorithm is similar to the incremental clustering algo-rithm used for retrospective detection (Section ), except fortwo modifications:

� The PAST reference is restricted to a time window offixed number of stories or days which are closest to thecurrent story, instead of referring an infinite past.� A detection threshold, independent from the clustercombining threshold, is used to differentiate NEW fromOLD.
3.3. The UMass Approach
Retrospective Detection UMass used two different ap-proaches to retrospective event detection:
In the first approach, the TDT collection was examined andall words and noun phrases that occur very often in the col-lection that donot also occur often in a separate training col-lection were identified as potential triggers for clusters. Eachof those terms was then examined to see if its occurrence indocuments was heavily concentrated in some small range oftime. If not, the term did not trigger an event.
For a term that did trigger an event, all documents containingthe term within a time range (determined by the standard de-viation of daily occurrence) were handed to a relevance feed-back algorithm and a query representing event was created.UMass applied that query to the collection as a whole to finddocuments that matched the event. A final trimming step re-moved outlier stories by considering the concentration of sto-ries over a range of days.
The second approach was a bottom-up agglomerative clus-tering of the documents similar to CMU’s. Document sim-ilarity was accomplished using the same queries created byon-line detection (described below). Documenti andj arecompared by running queryi against documentj, then queryj against documenti, and averaging the resulting two beliefscores. Only document pairs that are more than two standarddeviations away from the mean comparison score are eligibleto invoke clustering. This provides a stopping criterion forthe clustering.
On-Line Detection The UMass algorithm for on-line eventdetection follows these steps:
1. For each document, extract then most important fea-tures needed to build a query representation of this doc-ument.
2. Calculate a belief threshold for this document’s corre-sponding query by running the query against its sourcedocument. That belief value is an upper bound on thethreshold; it is adjusted downward as described below.
3. Compare the new document against all previous queries.If the document does not exceed the the threshold of anexisting query flag the document as containing a newevent.
4. If the document exceeds the the threshold of any existingquery flag the document as not containing a new event.
5. Save the document’s query (and threshold) in the queryset.
For the type of query used in this system, InQuery’s beliefvalues can range from 0.40 to 1.00. UMass used a thresholdabove in step 2 that is somewhere between 0.40 and the beliefof the document against its own query. We tried various val-ues, but found that values from 20-30% of the way betweenthe two worked well in general, with a lower threshold wasmore useful with a larger set ofn features.
UMass also applied an aging factor to the thresholds: overtime, the threshold for matching grew higher and higher. Thiswas meant to model the idea that an event is less and lesslikely to be reported as time passes—i.e., it slowly becomesnews that is no longer worth reporting. UMass found thatthe aging factor was an important factor in achieving goodresults.
3.4. Dragon Approach
Dragon’s online and retrospective detection systems are ap-plications of the clustering technology used to train back-ground models for the segmenter. As described in the seg-mentation report, this technology is an implementation of ak-means clustering algorithm.
Online Detection Dragon followed CMU’s lead and ap-proached the online detection task as a clustering problemin which the stories being clustered could be examined onlyonce. With this interpretation, online detection is a natural ap-plication ofk-means clustering, in which one executes onlythe first pass of the algorithm. Following this procedure, thefirst story in the corpus defines an initial cluster. The remain-ing stories in the corpus are processed sequentially; for eachone the “distance” to each of the existing clusters is com-puted. A story is inserted into the closest cluster unless thisdistance is greater than a threshold, in which case a new clus-ter is created. The decision to create a new cluster is equiva-lent to declaring the appearance of a new event.
The old distance measure Given that several iterations ofDragon’s implementation of thek-means algorithm producesgood clusters for the segmenter, one would expect that thefirst pass alone would provide a credible basis for an onlinedetection system. This turns out not to be the case. In fact,the performance of Dragon’s clustering algorithm in its firstiteration turns out to be horrible, essentially dividing the cor-pus into chunks of about 50 consecutive stories and declaringthese to be clusters.
The problem in the first pass arises due to a subtle property of

the distance measure,d = Xn (sn=S) log sn=S(cn + sn)=(C + S)+ Xn (cn=C) log cn=C(cn + sn)=(C + S) ;wheresn and cn are the story and cluster counts for wordwn, with S =P sn andC =P cn. The two terms have thefollowing interpretation: the first is the distance between thestory and the cluster after the story has been inserted into it,and the second is the distance that the cluster itself moves asa result of incorporating the story.
A problem arises for very small clusters: because of the merg-ing of the story and cluster distributions in the denominatorof the log, a story can actually “drag” a small cluster closeenough that the distance to it is small, and therefore belowthreshold. Thus whenever a new cluster is created by the clus-tering algorithm, all subsequent stories are found to be closein distance until the cluster gets big enough (about 50 stories,given our threshold settings), at which point a new cluster iscreated and the cycle begins again.
The new measure Dragon fixed the measure for the onlinetask by smoothing the cluster distribution used in the dis-tance computation with a background distribution, and thenpreventing the cluster from being “dragged” by the storydistribution. Two improvements were also made: a story-background distance was subtracted from the story-clusterdistance (to compensate for the fact that small clusters tendto look a lot like background after smoothing), and a decayterm was introduced to cause clusters to have a limited du-ration in time. This term is just a decay parameter times thedifference between the number of the story represented by thedistributionsn and the number midway between the first andlast stories in the cluster.
The new measure has the formd =Xn (sn=S) log un=Uc0n=C + decay term;wherec0n is the smoothed cluster count for wordwn, andunis the background unigram count withU =Pun.
Tuning the online detection system means adjusting the decayparameter and the overall threshold. Currently these can onlybe tuned on the test corpus.
3.5. Results, Analysis, and Future Work
The three sites have obtained results for retrospective and on-line detection, evaluated using the various metrics discussed,including F1 and DET curves. Tables 2, 3 and 4 list the re-ported results for several of the runs from the various sites.Figure 1 shows the DET curves of the best online runs, one
for each site. Figures 3, 2 and 4 are the DET plots of retro-spective detection systems.
CMU optimization efforts In order to optimize results,CMU is investigating the following: dealing with out-of-vocabulary (OOV) terms; incremental updating of IDF; usingtime windows and declining weighting factors; dynamicallysetting Clustering thresholds; and, unsupervised incrementallearning.
The incremental updating of Inverted Document Frequency(IDF) is defined to be:IDF(x;t) = log2(N(x)=n(x;t))wheret is a term,x is the current story,N(x) is the numberof stories in the sequence from the first story in the corpus(TDT or JGI+TDT) to the current pointx, andn(x;t) is thenumber of stories which constrain termt in the sequence tothe current pointx.
In terms of using time constraints in on-line detection, CMUtried two methods. The first method was to use a time windowof k stories, denoted asWk , which is prior to the current story.The detection decision on the correct story,x, is based on thecomparison of this story with each story in the window:score(x) = 1� maxdi2Wkfcos(~x; ~di)gAnother method was to use a decaying weighting function toadjust the influence of stories in the window. Thescore(x)in this method is modified asscore(x) = 1� maxdi2Wkf ik cos(~x; ~di)g:This modification makes the decision rely more on the storieswhich are closer to the current time, than the stories far in thepast. In other words, it is a smoother way to use a time win-dow than a uniformly weighted window. CMU found that awindow size of 700 is about optimal when not using the de-caying weighting function, and a size of 2500 optimal whenusing the decay weighting. The relative improvement fromusing decaying weights is about 2% in theF1 measure over afixed window.
UMass optimization efforts The word-trigger approachprovided reasonably high-precision clusters, but realized badrecall: the cluster sizes were too small. UMass believes thatthe recall can be improved by relaxing some constraints.
For the bottom-up agglomerative approach, UMass found theunsurprising result that higher-dimensionality query repre-sentations were more effective. 100- and 50-term querieswere noticeably more effective than 10-term queries, in thesame way that they were for on-line detection. However,in this case the 50-term queries outperformed the 100-termqueries.

1
2
5
10
20
40
60
80
90
.01 .02 .05 0.1 0.2 0.5 1 2 5 10 20 40 60 80 90
Mis
s P
roba
bilit
y (in
%)
False Alarm Probability (in %)
random performanceCMU
UMass.100tUMass.400t
Dragon
Figure 1: TDT On-line Detection Runs
1
2
5
10
20
40
60
80
90
.01 .02 .05 0.1 0.2 0.5 1 2 5 10 20 40 60 80 90
Mis
s P
roba
bilit
y (in
%)
False Alarm Probability (in %)
TDT Retrospective Detection Runs, Averaged Over Events
random performanceCMU
DragonUMass
CMU (bestfit)UMass (dupls)
Figure 2: TDT Retrospective Detection Runs, Averaged Over Events

1
2
5
10
20
40
60
80
90
.01 .02 .05 0.1 0.2 0.5 1 2 5 10 20 40 60 80 90
Mis
s P
roba
bilit
y (in
%)
False Alarm Probability (in %)
TDT Retrospective Detection Runs, By Event
random performancecmu
dragonumass-100T
Figure 3: TDT Retrospective Detection Runs, By Event
1
2
5
10
20
40
60
80
90
.01 .02 .05 0.1 0.2 0.5 1 2 5 10 20 40 60 80 90
Mis
s P
roba
bilit
y (in
%)
False Alarm Probability (in %)
TDT Retrospective Detection Runs DUPLICATES ALLOWED, By Event
random performancecmu-bestfit
umass-100T-dupls
Figure 4: TDT Retrospective Detection Runs,duplicates allowed, By Event

Run %Miss %f/a %Recall %Prec micro-avg F1 macro-avg F1CMU incremental 38 0.09 62 67 0.64 .77CMU gac top-level 17 0.32 83 43 0.56 .63Dragon 39 0.08 61 69 0.65 .75UMass 100T 66 0.09 34 53 0.42 .60UMass 10T 67 0.50 33 16 0.21 .53
Table 2: Retrospective Detection Results: Partition Required. (Official evaluation)
For retrospective detection, UMass did only a small amountof work with alternate types of features (e.g., phrases) forthese experiments; preliminary results suggest that multi-word features are helpful.
Similar to CMU’s time-windows UMass found that the timesensitive nature of event reporting can be captured by agingthe belief thresholds. For a given documents’ query, UMassraised the threshold incrementally as each subsequent storywas processed, making it more and more difficult for laterstories to pass the threshold. This aging of the thresholdsprovided substantial improvements in precision without im-pacting recall noticeably. Note, however, that the aging helpsperformance of unexpected events (e.g., disasters) but hurtsperformance of long-running events such as the O.J. Simpsontrial.
Dragon’s Optimization Directions Dragon believes thatfurther careful research on the clustering measure can pro-duce performance gains in its system. The fact that the ret-rospective evaluation indicates that the new distance measuredoes better than the old one suggests that the clustering of thebackground topics used by the segmenter should be revisited,and the segmentation experiments rerun with topics based onthe new measure. This is an area for future work.
3.6. Open Issues
Some related issues pertaining to event detection have notbeen addressed in the pilot TDT study, but evolve naturallytherefrom, including:� How to provide a global view of the information space
to users and navigation tools for effective and efficientsearch?� Some approaches generate a cluster hierarchy automati-cally. How to choose the right level of clusters for user’sattention that best fits the information need of the user?� How to summarize the information at different degreesof granularity, i.e., at a corpus level, a cluster level, astory level, and a sub-story level? How to provide user-specific or query-specific summaries? How to remove
redundant parts and maximize the information in a sum-mary?� How to make a better use of temporal information inevent detection and tracking than we have done? Inthe case of on-line detection, for example, we have onlytaken the simplest approach of imposing a time windowto the data stream.� How to improve the accuracy of on-line detection by in-troducing limited look-ahead? For instance, noting thattwo or three stories arriving very close in time are highlyrelated to each other but different than anything in a pre-vious time interval would be a very good indicator of anew breaking event.
4. Event TrackingThe TDT event tracking task is fundamentally similar to thestandard routing and filtering tasks of Information Retrieval(IR). Given a few sample instances of stories describing anevent (i.e., stories that provide a description of the event), thetask is to identify any and all subsequent stories describingthe same event. Event tracking is different from those IRtasks in that events rather than queries are tracked, and in thatevents have a temporal locality that more general queries lack.These differences shift the nature of the problem slightly butat the same time shift the possible solutions significantly. Thenarrowing of the scope of information filtering encouragesmodifications to existing approaches and invites entirely newapproaches that were not feasible in a more general query-centric setting.
This report discusses approaches to Event Tracking by re-search teams from CMU, the University of Massachusetts,and Dragon Systems.
4.1. Tracking evaluation
Each event is to be treated separately and independently. Intraining the system for any particular target event, allowableinformation includes the training set, the test set, and eventflags for that target event only. (No information is given onany other target event).
Evaluation will be conducted for five values ofNt , namely

Run %Miss %f/a %Recall %Prec micro-avg F1 macro-avg F1CMU gac hierarchy 25 0.02 75 90 0.82 .84UMass 100T-dups 27 0.06 73 78 0.75 .81UMass 10T-dups 31 0.05 69 80 0.74 .81
Table 3: Retrospective Detection Results: Duplicates Allowed.f1, 2, 4, 8, 16g. In training,Nt will count just the number ofYES tags for the target event and will exclude the BRIEF tags.However, the full classification of each story in the trainingset (i.e., YES, BRIEF, and NO) may be used in training.
All of the stories in the test set must be processed, but therewill be two evaluations – one over all of the test data (for eachvalue ofNt), and one over a fixed set of test data, namelythe test set corresponding to(Nt)Max = 16. (Tabulatingperformance for a fixed test set asNt varies will allow a morestable comparison of performance across the various valuesof Nt , because the test set will be the same for all values ofNt .)
The test stories are to be processed in chronological order,and decisions must be made “on line”. That is, the detectiondecision for each test story must be output before processingany subsequent stories. Decisions may not be deferred.
The event tracking system may adapt to the test data as itis processed, but only in an unsupervised mode. Supervisedfeedback is not allowed. (Evaluating over a set ofNt’s pro-vides essentially equivalent information.)
In calculating performance, those stories tagged as BRIEF forthe target event will not be included in the error tally.
There will be a TDT tracking trial for each story, and for eachevent, and for each value ofNt . This will make a total ofabout 1,000,000 trials. This number is derived by multiplyingthe number of target events (25) by the average number oftest stories (assumed to number about 8,000) by the numberof values ofNt (5). Of these trials, less than one percent willbe type I (true) trials.
For each trial, there will be two outputs - first, a logical de-tection indication, YES or NO, indicating whether the systembelieves that the story discusses the target event; and second,a score indicating how confident the system is in this decision.This confidence indicator will be used to compute a detectionerror trade-off (DET) between misses and false alarms.
The trials for the tracking task will be recorded in a file inASCII format, one record per trial, with trials separated bynewline characters and with fields in a record separated bywhite space. Each record will have 5 fields in the format,“Event Nt Story Decision Score”, where:
� Event is an index number in the rangef1, 2, . . . , 25gwhich indicates the target event being detected.� Nt is the number of stories used to train the system tothe target event.� Story is the TDT corpus index number in the rangef1,2, . . . 15863g which indicates the story being processed.� Decisionis either YES or NO, where YES indicates thatthe system believes that the story being processed dis-cusses the target event, and NO indicates not.� Scoreis a real number which indicates how confidentthe system is that the story being processed discusses thetarget event. More positive values indicate greater con-fidence. (Large negative numbers indicate lack of confi-dence, while large positive number indicate high confi-dence.)
Indirect Evaluation of Segmentation Segmentation (seeSection ) will be evaluated indirectly by measuring eventtracking performance on stories as they are defined by auto-matic segmentation means. A straightforward three-step pro-cedure will be used:
1. Segment the whole corpus using the segmentation sys-tem under test.
2. Using an event tracker that has been evaluated on theTDT corpus previously, run this system on the auto-segmented corpus. Follow the standard event trackingrules, with the following exceptions:� Train the event tracking system on the original cor-
rectly segmented stories.� Begin evaluation on the first auto-segmented storywhich follows the last training story and which isdisjoint from it.
3. Evaluate the event tracker results and compare these re-sults with results on the original correctly segmentedstories.
The evaluation is complicated by the fact that there are noevent flags for the auto-segmented stories. This problem willbe solved by creating scores for the original stories from those
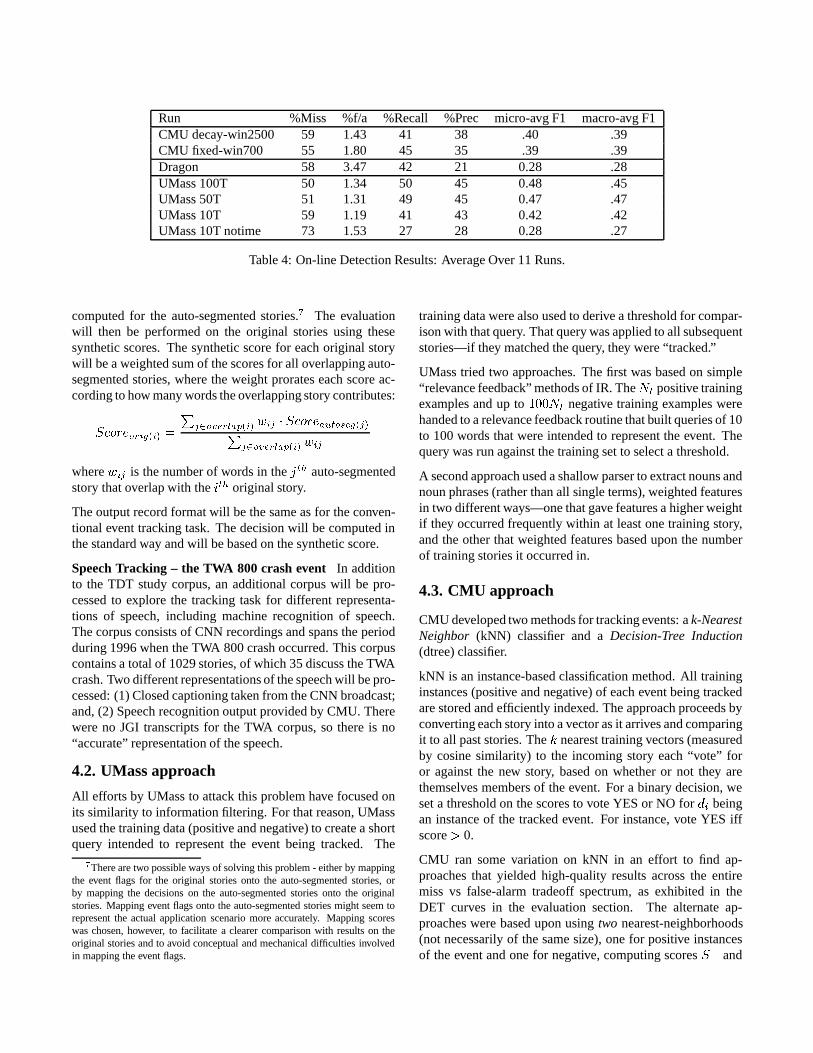
Run %Miss %f/a %Recall %Prec micro-avg F1 macro-avg F1CMU decay-win2500 59 1.43 41 38 .40 .39CMU fixed-win700 55 1.80 45 35 .39 .39Dragon 58 3.47 42 21 0.28 .28UMass 100T 50 1.34 50 45 0.48 .45UMass 50T 51 1.31 49 45 0.47 .47UMass 10T 59 1.19 41 43 0.42 .42UMass 10T notime 73 1.53 27 28 0.28 .27
Table 4: On-line Detection Results: Average Over 11 Runs.
computed for the auto-segmented stories.7 The evaluationwill then be performed on the original stories using thesesynthetic scores. The synthetic score for each original storywill be a weighted sum of the scores for all overlapping auto-segmented stories, where the weight prorates each score ac-cording to how many words the overlapping story contributes:Scoreorig(i) = Pj2overlap(i) wij � Scoreautoseg(j)Pj2overlap(i) wijwherewij is the number of words in thejth auto-segmentedstory that overlap with theith original story.
The output record format will be the same as for the conven-tional event tracking task. The decision will be computed inthe standard way and will be based on the synthetic score.
Speech Tracking – the TWA 800 crash event In additionto the TDT study corpus, an additional corpus will be pro-cessed to explore the tracking task for different representa-tions of speech, including machine recognition of speech.The corpus consists of CNN recordings and spans the periodduring 1996 when the TWA 800 crash occurred. This corpuscontains a total of 1029 stories, of which 35 discuss the TWAcrash. Two different representations of the speech will be pro-cessed: (1) Closed captioning taken from the CNN broadcast;and, (2) Speech recognition output provided by CMU. Therewere no JGI transcripts for the TWA corpus, so there is no“accurate” representation of the speech.
4.2. UMass approach
All efforts by UMass to attack this problem have focused onits similarity to information filtering. For that reason, UMassused the training data (positive and negative) to create a shortquery intended to represent the event being tracked. The7There are two possible ways of solving this problem - either by mappingthe event flags for the original stories onto the auto-segmented stories, orby mapping the decisions on the auto-segmented stories ontothe originalstories. Mapping event flags onto the auto-segmented stories might seem torepresent the actual application scenario more accurately. Mapping scoreswas chosen, however, to facilitate a clearer comparison with results on theoriginal stories and to avoid conceptual and mechanical difficulties involvedin mapping the event flags.
training data were also used to derive a threshold for compar-ison with that query. That query was applied to all subsequentstories—if they matched the query, they were “tracked.”
UMass tried two approaches. The first was based on simple“relevance feedback” methods of IR. TheNt positive trainingexamples and up to100Nt negative training examples werehanded to a relevance feedback routine that built queries of 10to 100 words that were intended to represent the event. Thequery was run against the training set to select a threshold.
A second approach used a shallow parser to extract nouns andnoun phrases (rather than all single terms), weighted featuresin two different ways—one that gave features a higher weightif they occurred frequently within at least one training story,and the other that weighted features based upon the numberof training stories it occurred in.
4.3. CMU approach
CMU developed two methods for tracking events: ak-NearestNeighbor (kNN) classifier and aDecision-Tree Induction(dtree) classifier.
kNN is an instance-based classification method. All traininginstances (positive and negative) of each event being trackedare stored and efficiently indexed. The approach proceeds byconverting each story into a vector as it arrives and comparingit to all past stories. Thek nearest training vectors (measuredby cosine similarity) to the incoming story each “vote” foror against the new story, based on whether or not they arethemselves members of the event. For a binary decision, weset a threshold on the scores to vote YES or NO fordi beingan instance of the tracked event. For instance, vote YES iffscore> 0.
CMU ran some variation on kNN in an effort to find ap-proaches that yielded high-quality results across the entiremiss vs false-alarm tradeoff spectrum, as exhibited in theDET curves in the evaluation section. The alternate ap-proaches were based upon usingtwo nearest-neighborhoods(not necessarily of the same size), one for positive instancesof the event and one for negative, computing scoresS+ and

S� respectively, using the same similarity-weighted voting asbefore. The overall score was a linear combination or a ratioof the two neighborhoods’ scores.
Decision Trees Decision trees (dtrees) are classifiers builtbased on the principle of a sequential greedy algorithm whichat each step strives to maximally reduce system entropy. De-cision trees select the feature with maximal information gain(IG) as the root node, dividing the training data according tothe values of this feature, and then for each branch findingthe next featurefk such thatIG(S(fj); fkjfj) is maximized,and so on recursively. Decision trees are typically good whenthere are sufficient training instances belonging to each class.One disadvantage of dtrees is that they cannot output contin-uously varying tradeoff scores and thus are unable to generatemeaningful DET curves (some efforts were made to produceDET curves from the dtrees, but they were not highly suc-cessful).
4.4. Dragon approach
Dragon’s event tracker is an adaptation of its segmenter,which is described in more detail in the segmentation report.As discussed there, the segmentation algorithm does segmen-tation and topic assignment simultaneously. In general, thetopic labels assigned by the segmenter (which are drawn fromthe set of automatically derived background topics) are notuseful for classification, as they are few in number and do notnecessarily correspond to categories a person would find in-teresting. However, by supplementing the background topicmodels with a language model for a specific event of inter-est, and allowing the segmenter to score segments against thismodel, it becomes possible for the the segmenter to output anotification of an occurrence of that event in the news streamwhenever it assigns that event model’s label to a story. In thisimplementation, the topic models have the role of determin-ing the background against which the event model must scoresufficiently well to be identified.
In this incarnation, the segmenter is not asked to identify storyboundaries. Its job is merely to score each story against itsset of background models, as well as against the event model,and report the score difference between the best backgroundmodel and the event model. A threshold is applied to thisdifference to determine whether a story is about the event ornot, and this threshold can be adjusted to tune the tracker’soutput characteristics. For example, a low threshold meansthat a story does not have to score much better in the eventmodel than it does in the best background model (or, perhaps,may even fail to score as well by a specified amount) for itto be declared an instance of the event. This tuning tends toresult in missing very few stories on the event, but probablywill generate a high number of false alarms.
Event models were built from the words in theNt trainingstories, after stopwords were removed with some appropriate
Run %Miss %F/A F1 % PrecCMU kNN 29 0.40 0.66 61
Dragon 71 0.12 0.39 60
UMass nonRF-comb 55 0.10 0.60 88UMass nonRF-20T 13 2.35 0.41 27UMass RF100 39 0.27 0.62 62
Table 5: Tracking results forNt = 4, pooled average acrossall 15 events evaluated (evaluation atNt = 16). (Note thatrecall is 1 minus the miss rate.)
smoothing. In this case, in order to provide a more accuratesmoothing for the event model, we take as the backoff distri-bution the mixture of the background topic models that bestapproximates the unsmoothed event model. There is there-fore a different backoff model for every event and every valueof Nt.4.5. Evaluation methodology
The first 16 stories on each event8 are set aside for trainingpurposes. A system’s ability to track events is tested on allstories from the one immediately following the16th trainingstory through the end of the TDT corpus. Note that this meansthat the test sets for each event are different.
A system is evaluated based on varying amounts of trainingdata. Each system is allowedNt positive training examples,whereNt takes on values 1, 2, 4, 8, and 16. The system ispermitted to train on allNt positive stories as well as all sto-ries that occur in the corpusprior to theN tht story. Note thatthe training subset may include some stories that were judgedBRIEF for a particular event; those stories may be used (alongwith the knowledge that it was judged BRIEF). The test set isalways the collection minus theNt = 16 training data.
Evaluations may be averaged across events withinNt values.It is not particularly meaningful to average acrossNt values.Results are reported using the standard TDT evaluation mea-sures and the Detection Error Tradeoff curves.
4.6. Evaluation results
Basic results Table 5 lists the reported results for several ofthe runs from the various sites. These report the exact evalu-ation of error rates at the thresholds chosen by the sites, av-eraged across all events, atNt = 4 (averaging is by poolingall the results), but evaluated using theNt = 16 test set. Thetable shows that the sites are able to generate results that varywidely in their error rates. The preferred run from UMass is8Only stories that are judged YES count; those judged BRIEF donotcount as part of the 16, nor as part of the test set.

nonRF-comb. Comparing it to the run from the other sitesshows dramatic differences in miss rates. The UMass andDragon runs have similar false alarm rates (the 0.02% differ-ence is the difference between 4 and 7 false alarms per eventon average). CMU’s substantially lower miss rate comes atthe expense of a much larger false alarm rate.
These results are not particularly surprising. CMU tuned itsdecision points on the false alarm/miss tradeoff based uponthe F1 measure that attempts to balance recall and precisionvalues. UMass, on the other hand, tuned its approach usingaverage precision numbers. The effect is clear in the numbers,where UMass achieves very high precision for the task, butCMU attains a better balance between the two.
DET curves Figure 5 shows the DET curves for three sam-ple runs, one from each site. To make some comparisonpossible, only theNt = 4 run is given for each. A singlepoint is plotted on the curve to represent the specific detec-tion error tradeoff made by the threshold values each systemchose. The detached point is associated with the CMU deci-sion tree approach: this is the result of a confidence thresholdthat does not entirely conform to the YES/NO decisions madefor tracking.
The UMass RF2 run and the Dragon run are very similar ineffectiveness. The graph shows onlyNt = 4, but when allNtvalues are plotted, the UMass run turns out to be the quickestapproach to converge to “good” values asNt increases. Infact, the use of additional training stories appears toharmthe overall tradeoff between the errors. UMass hypothesizesthat the stability is a result of using noun phrases as features.Dragon’s event models did not work as well with very smallvalues ofNtThe UMass RF run performs less well, primarily because ituses a small number of features. It is shown to make it clearthat minor variations in the query formation process can resultin substantial differences in effectiveness.
The CMU k-NN run is fairly insensitive toNt at low falsealarm rates, but when the miss rate drops below 10%, thetraining instances become more and more important. This re-sult is not surprising, because as the size of the neighborhoodneeded to match grows (in order to reduce the miss rate), itis very likely that mismatches will occur and the supportingevidence of other training examples will help prevent that. (Itis more surprising that UMass’s run does not degrade in thisfashion, than that CMU’s does.)
The CMU decision tree approach results in an unusual DETcurve because its decisions result in a very small number ofconfidence scores. When the curve makes huge jumps to theright, that indicates a large number of stories with the sameconfidence value: when the threshold hits that point, all sto-ries at that value get included and the false alarm rate leaps.The decision tree approach is tuned to a specific point on the
Nt value1 2 4 8 16
Dragon -55% -26% – +12% +40%CMU, Dtree -90% -30% – +12% +15%CMU, kNN -25% -9% – +11% +32%UMass -39% -5% – +5% +5%
Table 6: Shows changes in pooledF1 measure for severalsystems asNt varies, withNt = 4 as the baseline. Actualeffectiveness numbers forNt = 4 are reported in Table 5.
curve: here, the leftmost knee at about 0.1% false alarm ratewas the goal.
The DET curves also show the tradeoffs that each site madefor selecting a threshold for YES/NO decisions. UMass andDragon both show decision points in the extreme upper leftof the curves, reflecting an emphasis on precision or low falsealarms. CMU, on the other hand, selected points much closerto the middle of the graph, illustrating their goal of balancingrecall and precision.
Varying Values of Nt The results presented above are ata single value ofNt (i.e., four). That limited presentationsimplifies some points of comparison, but also ignores the in-teresting question of how the number of training stories (Nt)affects performance. Rather than present DET curves for ev-ery run discussed in the previous section, we will considerjust the increase in effectiveness each system achieves asNtchanges.
Table 6 shows the impact that varyingNt has on the effec-tiveness of the systems, as measured by pooled values ofF1,a measure that balances recall and precision. Only a fewof the systems made an effort to optimize forF1 values, so
-100%
-80%
-60%
-40%
-20%
0%
20%
40%
60%
CMU,DtreeDragon
CMU, kNN UMass
1 2 48
16
Figure 6: Graph of data in Table 6, showing impact of variousvalues ofNt on a pooledF1 measure for several systems.

1
2
5
10
20
40
60
80
90
.01 .02 .05 0.1 0.2 0.5 1 2 5 10 20 40 60 80 90
Mis
s P
roba
bilit
y (in
%)
False Alarm Probability (in %)
TDT Tracking Runs, Nt=4
CMU.dtreeCMU.kNN
Dragonumass-RF
UMass.RF2random performance
Figure 5: DET curve for sample tracking runs from each site. All runs were performed withNt = 4 training stories, andevaluated atNt = 4.
the actual effectiveness numbers are less important than thechanges that varyingNt causes. For that reason, only percentchanges from theNt = 4 value are reported (Table 5 reportsthe baseline effectiveness for thatNt value for those who areconcerned).
It is clear from the figure that the decision tree approach is ex-tremely sensitive to the amount of training data. AtNt = 1,it has very poor effectiveness, but it learns rapidly, with onlymodest gains after four training instances. The Dragon ap-proach and the kNN approach both show more consistentgains with each additional training example, though Dragon’sapproach appears to continue to benefit from learning themost. The UMass approach stands out as the most stable afterNt = 2 training instances: it learns a good event representa-tion very rapidly and gains almost nothing in effectivenessbeyond that point.
4.7. Indirect Evaluation of Segmentation
Figure 7 shows a comparison of a tracking run done with ac-tual TDT stories and one with stories generated by a segmen-tation run. The runs were both done by Dragon, though arebased on an earlier version of their tracker than that presentedin Figure 5, so the baseline performance is slightly lower.
The two runs are nearly identical, except that the segmentedcorpus has noticeably degraded performance below a false
alarm rate of 0.04% and above a rate of roughly 15%. Itshows a modest loss in effectiveness in the 2-15% range.Another indirect evaluation done by UMass (not presentedhere) showed a similar effect, except that the degradation wasslightly larger and consistent everywhere except in the 10-20% false alarm rate were the two runs were almost identical.
Those two sets of runs suggest that segmentation of the qual-ity reported in Section has only a modest impact on trackingeffectiveness.
4.8. Speech-Recognized Audio Transcripts
The tracking methods developed and discussed above workedrelatively well for accurate transcripts and newswire stories:transcribed CNN and Reuters, respectively. However, cantracking also be performed on a much noisier channel, such asthe automatically-recognized audio track of broadcast news?If so, at what price in accuracy? In order to investigate thesequestions the CMU Informedia group provided TDT withabout 1,000 CNN news stories, including their close cap-tions and their speech-recognized audio. Speech recognitionwas performed with the SPHINX-II system, which generatesabout 50% word accuracy for raw broadcast news. The lowaccuracy of CSR is due in part to the quality of the news audio(often there is background interference: music, noise, othervoices) and a significant number of out-of-vocabulary words.

1
2
5
10
20
40
60
80
90
.01 .02 .05 0.1 0.2 0.5 1 2 5 10 20 40 60 80 90
Mis
s P
roba
bilit
y (in
%)
False Alarm Probability (in %)
Combined DET plots
random performancedragon-truthdragon-seg
Figure 7: DET curves for an early Dragon tracking run using true story boundaries compared to the same run using calculatedsegment boundaries.
One event, the crash of TWA flight 800, was heavily repre-sented in this small corpus, and was used for the preliminaryinvestigation. All the TWA-800 events were hand-labeled byInformedia, and made available to the TDT research groups.CMU tried both kNN and dtrees on close-captions and speechdata. Dragon (with less preparation time than CMU) alsotried their trackers, producing the following summary results,as measured by F1 micro-average acrossNt values.
Classifier CC transcript CSR OutputD-tree 0.34 0.20kNN 0.31 0.21Dragon 0.29 0.08
These results indicate a drop in accuracy from perfect tran-scripts to imperfect close captions, and a further drop in ac-curacy to speech recognized audio. However, tracking stillworks under conditions of 50% error rates. This is encourag-ing as speech recognition accuracy on broadcast news willonly improve, and tracking technology will also improve.Moreover, the latter may be tunable to different expectednoise levels in the input channel. These results are quite pre-liminary, especially given the small data set and single-eventtracking.
4.9. Analysis and Conclusions
The tracking task is difficult to analyze because it is some-what vaguely stated. There was no preference specified forminimizing misses or false alarms, so it was difficult for anyof the sites to tune their systems appropriately. (The DETcurve shows a tradeoff for a particular tracking algorithm notacross algorithms.)
For this task, the events had an average of 54 stories that couldhave been tracked, and an average of 8377 stories that shouldnot have been tracked. Achieving a miss rate of 50% and afalse alarm rate of less than 0.25% would mean 27 correctlytracked, and less than 20 incorrectly tracked.
As reported in Table 5, each of these systems falls into ap-proximately that range, but just barely. At a miss rate of50%, the systems achieve about 0.15%, 0.20%, and 0.05%,meaning that on average 12, 16, or 4 uninteresting stories aretracked in order to get 27 interesting ones. To that extent,then, these systems are successful.
However, for low-miss (high-recall) applications, these re-sults are less impressive. At a miss rate of 20% (43 of 54tracked), anywhere from 42 to 320 false alarms will arise (as-suming at least 2 training examples).
These numbers are not out of line with typical IR ranked re-

trieval tasks, though the comparison is not necessarily obvi-ous. 50% precision at 80% recall would be quite good for asearch system, and suggests that this problem or this corpusis simpler than basic IR.
What works The tracking task works by creating someform of model of the event being tracked. The above experi-ments suggest the following:� If the event is modeled by a set of single terms (and
weights), the evidence indicates that 20-50 terms ispreferable. Smaller sets of terms provide higher preci-sion, but do not cast a wide enough net to bring in muchrelevant material. Very large sets appear to cast too wideand undifferentiated a net, bringing in more relevant sto-ries, but swamping it with unrelated material.� A better set of features (e.g., noun phrases) is even moreeffective at producing high quality results. UMass be-lieves that it is the higher quality features used in itsnonRF-comb20 run that gave it superior performance.� Combining multiple approaches to deciding that a storyshould be tracked can be helpful. The evidence com-bination applied by UMass substantially stabilized thealgorithm’s handling of very small numbers of trainingstories.� One idea addresses the problem of small event models.To smooth an event model consisting of one story, usethat story as a query into a training database, and usethe stories retrieved as smoothing material. Given thatDragon’s performance improves rapidly with more train-ing examples, this might dramatically improve the be-havior of the system at smallNt. In general, Dragonbelieves that this task requires a smoothing algorithmthat aggressively preserves topic, something that is muchmore suited to information retrieval techniques.
These results are consistent with IR searching results and arenot particularly surprising for that reason. However, it doesmean that methods that have helped IR are likely to help inthis task, too: for example, query expansion techniques basedon pseudo-relevance feedback may be a fruitful means of ad-dressing the problem of tracking with a very small set of pos-itive stories. For example, the following may be appropriateareas to explore: (1) evidence combination beyond that ex-plored briefly by UMass; unsupervised learning; interactivetracking (supervised learning).
This study has shown that fairly simple techniques canachieve very high quality results, but that substantial workis needed to reduce the errors to manageable numbers. For-tunately, that the TDT problem focuses on Broadcast Newsand not on arbitrary forms of information, means that there ishope that more carefully crafted approaches can improve thetracking results substantially.
5. Conclusions
This section presents some broad conclusions that can bedrawn from the Topic Detection and Tracking pilot study. Itwas not known at the start of the TDT pilot study whetherthe state of the art could effectively and efficiently addressany of the TDT tasks. The conclusions below show that thetechnologies applied solve large portions of the problem, butleave substantial room—and hope—for improvement.
The success of existing approaches has two implications.First, because quick efforts yielded good results, continuedand more concentrated work on these problems is likely toyield even better results. Second, because the current ap-proaches are adequate, it is possible to move forward and in-vestigate the more complicated problems suggested by TDT:handling of degraded text (from automatic speech recogni-tion), differences between “topics” and “events,” building de-scriptions of the events being tracked or detected, and so on.
General conclusions. The reporting pattern for a typicalevent is a rapid onset followed by a gradual decline over pe-riod ranging from 1 week to 4 weeks. Some events “re-ignite”(such as Hall’s Helicopter, upon his release and homecom-ing). A few atypical events are “sagas” with sporadic report-ing over long periods (such as OJ’s DNA).
Segmentation conclusions.Segmentation is a tractable taskusing known technologies (HMM, IR, machine learning).This fact was not at all certain when the pilot study began.
Segmentation is possible by several methods, each of whichhas strengths and weaknesses. This suggests (a) that futurework will yield improvements as different ideas are merged,and (b) different kinds of segmentation problems can be ad-dressed.
The tracking task shows negligible degradation when ap-plied to segmented text rather than “correct” segmentation,suggesting that automatic segmentation technologies may re-quire little improvementfor this task.
Detection conclusions. Pure retrospective detection can beperformed quite reliably for most events (except OJ, etc.) byclustering methods, with significant differences attributableto the clustering methods used. Permitting overlappingclusters improves performance over strict partitions, thoughpresents some evaluation concerns.
Online detection cannot yet be performed reliably. Whereasthe onset of some events are detected well, others (e.g., differ-ent airline disasters) are confused with earlier similar eventsand thus frequently missed. Further basic research is needed,not just tuning or incrementally improving existing methods.
Intermediate points of detection, such as on-line with a vari-able deferral period offer interesting intermediate solutions

between retrospective and immediate detection.9Tracking conclusions. Tracking is basically a simpler ver-sion of the classic Information Retrieval (IR) “filtering” task,but one shouldnot therefore conclude that it is uninterestingbecause it is already “solved”. Rather, the fact that it lies ina slightly more restricted domain than IR deals with, meansthat some more domain-specific techniques can be applied(from IR, speech, and machine learning) to possibly give bet-ter performance than one might expect from unrestricted ap-proaches.
Tracking of typical events can be accomplished fairly reliablyif at least 4 instance documents are provided. Some eventscan be tracked with fairly reliably with only 1 or 2 traininginstances.
Different technologies for tracking (kNNs, decision trees,probabilistic queries, language-model differentials, etc.)show remarkably similar performance on aggregate, but sub-stantial differences on specific events.
Degraded text conclusions. A preliminary study by CMUand Dragon indicated that tracking with automated speechrecognition output may prove more difficult than with per-fect transcriptions, especially with small numbers (under 4)training instances. Results show a 50% or more drop ineffectiveness,10 suggesting that this area is ripe for furtherresearch. Note that the TDT2 study will focus centrally onCSR-generated text for segmentation, detection, and track-ing.
References1. D. Beeferman, A. Berger, and J. Lafferty,A model of lexical
attraction and repulsion,In Proceedings of the ACL, Madrid,Spain, 1997.
2. A. Berger, S. Della Pietra, and V. Della Pietra,A maximumentropy approach to natural language processing,Computa-tional Linguistics, 22(1):39–71, 1996.
3. A. Bookstein and S.T. Klein,Detecting content-bearing wordsby serial clustering,Proceedings of the Nineteenth Annual In-ternational ACM SIGIR Conference on Research and Devel-opment in Information Retrieval, pp. 319–327, 1995.
4. S. Della Pietra, V. Della Pietra, and J. Lafferty,Inducing fea-tures of random fields,IEEE Trans. on Pattern Analysis andMachine Intelligence, 19(4):380–393, April 1997.
5. W.B. Croft and D.J. Harper,Using probabilistic models of doc-ument retrieval without relevance information,Journal of Doc-umentation, 37:285–295, 1979.
6. D.R. Cutting, D.R. Karger, J.O. Pedersen, and J.W. Tukey,Scatter/Gather: a Cluster-based Approach to Browsing LargeDocument Collections, In 15th Ann Int ACM SIGIR Confer-ence on Research and Development in Information Retrieval(SIGIR’92), 1992.9The TDT2 study will focus on this mode of detection.10Effectiveness numbers should be viewed skeptically because of the very
small sample size of the test corpus.
7. M.A. Hearst, Multi-paragraph Segmentation of ExpositoryText,in Proceedings of the ACL, 1994.
8. T. Feder and D. Greene, Optimal Algorithms for ApproximateClustering. In Proceedings of the 20th Annual ACM Sympo-sium on the Theory of Computing (STOC), pp. 434-444, 1988.
9. S. Katz,Estimation of probabilities from sparse data for thelanguage model component of a speech recognizer,IEEETransactions on Acoustics, Speech and Signal Processing,ASSP-35(3):400–401, March, 1997.
10. H. Kozima,Text Segmentation Based on Similarity betweenWords,in Proceedings of the ACL, 1993.
11. D.J. Litman and R.J. Passonneau,Combining Multiple Knowl-edge Sources for Discourse Segmentation,in Proceedings ofthe ACL, 1995.
12. J.M. Ponte and W.B. Croft,Text Segmentation by Topic,inProceedings of the First European Conference on Researchand Advanced Technology for Digitial Libraries, pp. 120–129,1997.
13. G. Salton, Automatic Text Processing: The Transformation,Analysis, and Retrieval of Information by Computer, Addison-Wesley, 1989.
14. C.J. van Rijsbergen, Information Retrieval (2nd edition), But-terworths, London, 1979.
15. E.M. Voorhees, Implementing agglomerative hierarchicclus-tering algorithms for use in document retrieval,InformationProcessing & Management, 22:6, 465-476, 1986.
16. J. Xu and W.B. Croft,Query Expansion Using Local andGlobal Document Analysis,in Proceedings of the NineteenthAnnual International ACM SIGIR Conference on Researchand Development in Information Retrieval, pp. 4–11, 1996.


![Online Learning - Carnegie Mellon Universitynyc.lti.cs.cmu.edu/classes/11-745/S15/Slides/Online...[Online; accessed 15-Mar-2015]. 24/24 Title Online Learning Author Fei Xia Language](https://img.pdfslide.us/doc/110x75/5f8a8f9515555b05907ce378/online-learning-carnegie-mellon-online-accessed-15-mar-2015-2424-title.jpg)
![Computer Simulation of Thermal Processing for Food€¦ · Computer Simulation of Thermal Processing for Food 187 = ( 6 6− 5)/[( 6 5)− H K C( 6 & 6 6)] (4) Where TDT1 and TDT2](https://img.pdfslide.us/doc/110x75/5f6b7297a8d0970391149c36/computer-simulation-of-thermal-processing-for-food-computer-simulation-of-thermal.jpg)
