Embed Size (px)
Citation preview
AFIN352 Applied Portfolio Management
Topic 1: Portfolio Management
Overview
What is Portfolio Management?
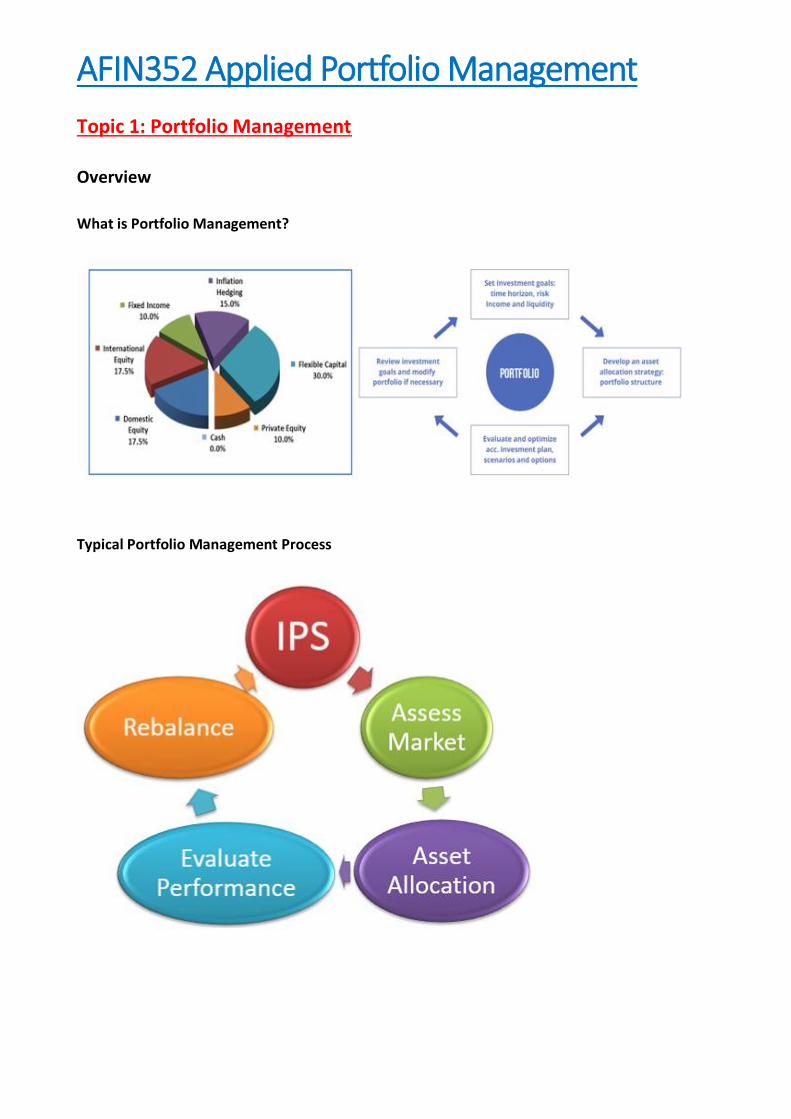
Typical Portfolio Management Process
What decisions does a Portfolio Manager make?
1. Asset Allocation
- Determination of weights on assets classes (stocks, bonds, commodities etc.) in light of
objectives
- Key determinants of cash flow pattern and performance- particularly long- term
performance
- Client-dependent
2. Manage Money within a Style or Asset Class
- Performance is usually measured with respect to a clearly defined benchmark
- Client-independent
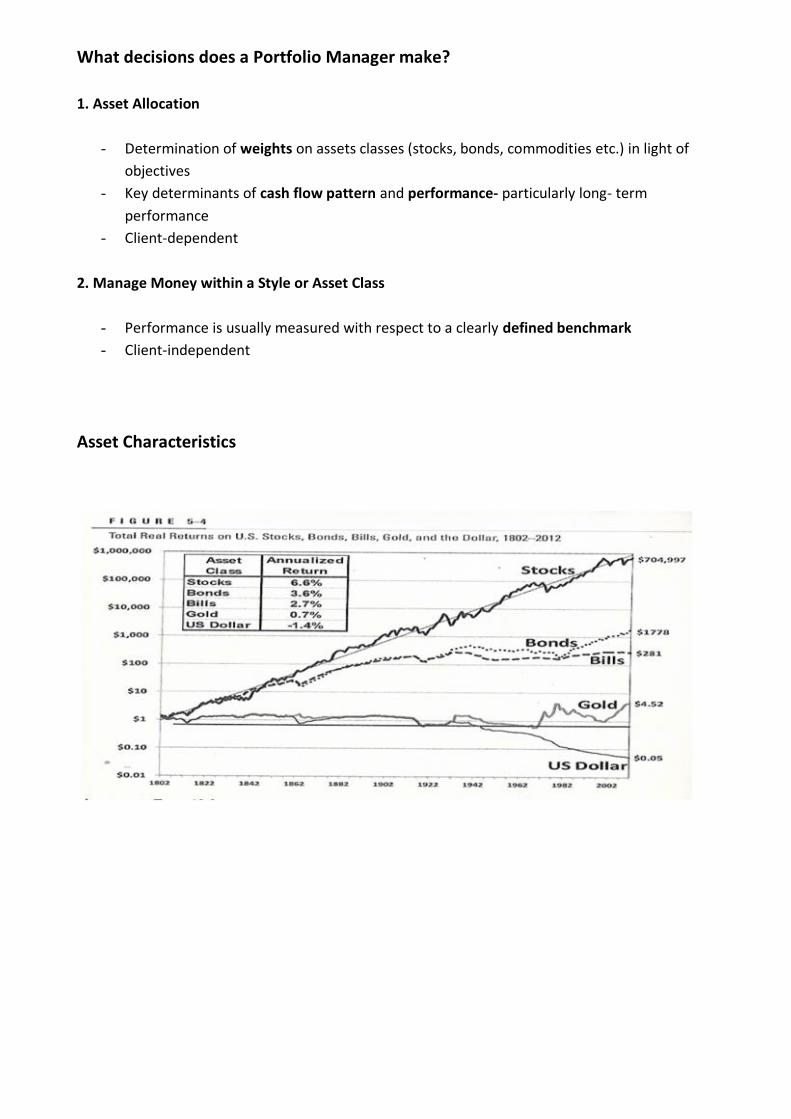
Asset Characteristics
Portfolio Management Steps
The CFA curriculum breaks the process into eight steps:
1. Evaluate client characteristics
2. Assess market opportunities
3. Define objectives and constraints
4. Set overall investment strategy, including asset allocation
5. Select investment managers and investment vehicles
6. Implement strategy
7. Measure and evaluate performance
8. Monitor and adjust
Clearly, the process involves a mixture of science and art!
Investment Objectives
Once the investment objectives are clarified, it should be possible to formulate:
Investment Policy: Long-term decision(s) about eligible investment activities and the allocation
of funds. Investment policy statements should:
1. Outline of expectations and responsibilities
2. Identify objectives and constraints
3. Outline eligible asset classes and their permitted use
4. Provide a mechanism for evaluation
Investment Strategy: Short-term activity consistent with policy
Traditional investment objectives include:
1. Stability of principal
2. Income
3. Growth of income
4. Capital appreciation
In identifying objectives, other issues need to be considered. These include:
1. Consistency of the objectives
2. Portfolio splits
3. Risk and liquidity
4. The risk of an adverse outcome
5. Client reaction to an adverse outcome
6. Legal restrictions, other constraints
7. Overall financial position of client(s)
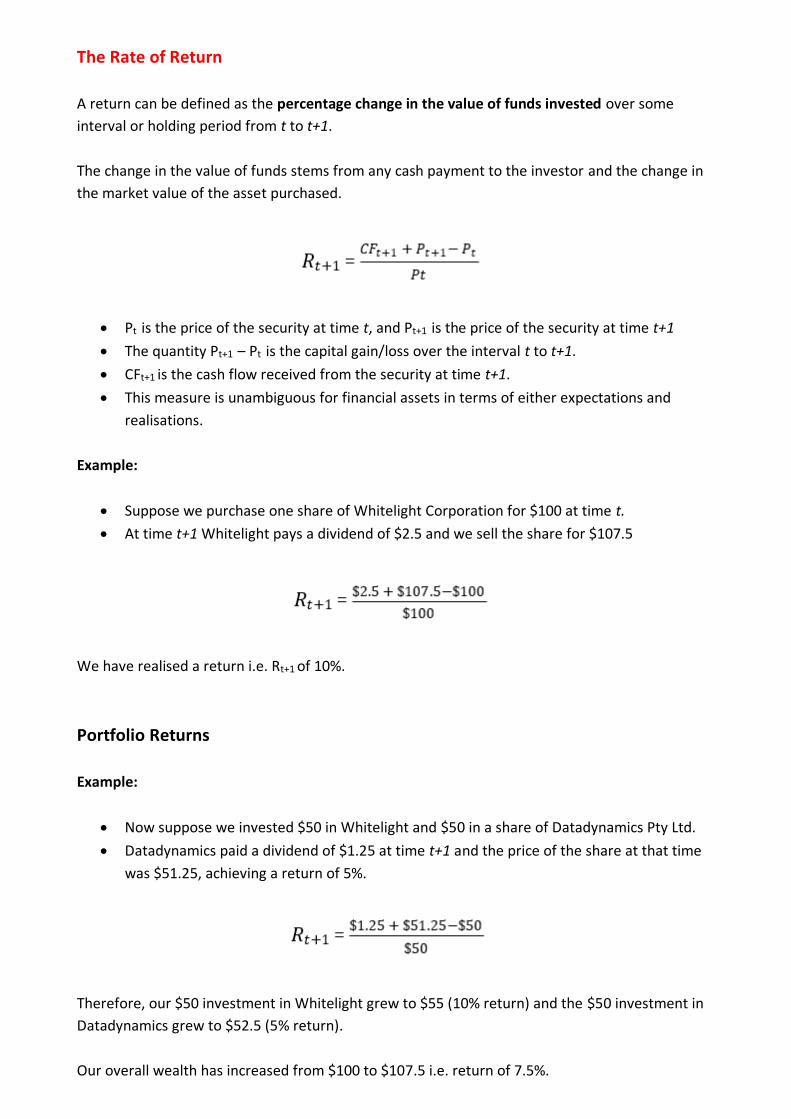
The Rate of Return
A return can be defined as the percentage change in the value of funds invested over some
interval or holding period from t to t+1.
The change in the value of funds stems from any cash payment to the investor and the change in
the market value of the asset purchased.
• Pt is the price of the security at time t, and Pt+1 is the price of the security at time t+1
• The quantity Pt+1 – Pt is the capital gain/loss over the interval t to t+1.
• CFt+1 is the cash flow received from the security at time t+1.
• This measure is unambiguous for financial assets in terms of either expectations and
realisations.
Example:
• Suppose we purchase one share of Whitelight Corporation for $100 at time t.
• At time t+1 Whitelight pays a dividend of $2.5 and we sell the share for $107.5
We have realised a return i.e. Rt+1 of 10%.
Portfolio Returns
Example:
• Now suppose we invested $50 in Whitelight and $50 in a share of Datadynamics Pty Ltd.
• Datadynamics paid a dividend of $1.25 at time t+1 and the price of the share at that time
was $51.25, achieving a return of 5%.
Therefore, our $50 investment in Whitelight grew to $55 (10% return) and the $50 investment in
Datadynamics grew to $52.5 (5% return).
Our overall wealth has increased from $100 to $107.5 i.e. return of 7.5%.
Formula:
The return on an N-asset portfolio Rp is the weighted average of the returns on the assets in the
portfolio.
Defining Risk
For now we will think of risk as the volatility/variance of the rate of return. The variance is
computed using the following formula:
and pi is the probability of state i=1 …M
• It captures the total variability (squared deviations from the expected value)
• One criticism: makes no distinction between upside and downside variation.
• Note: the standard deviation is the square root of the variance denoted by σ
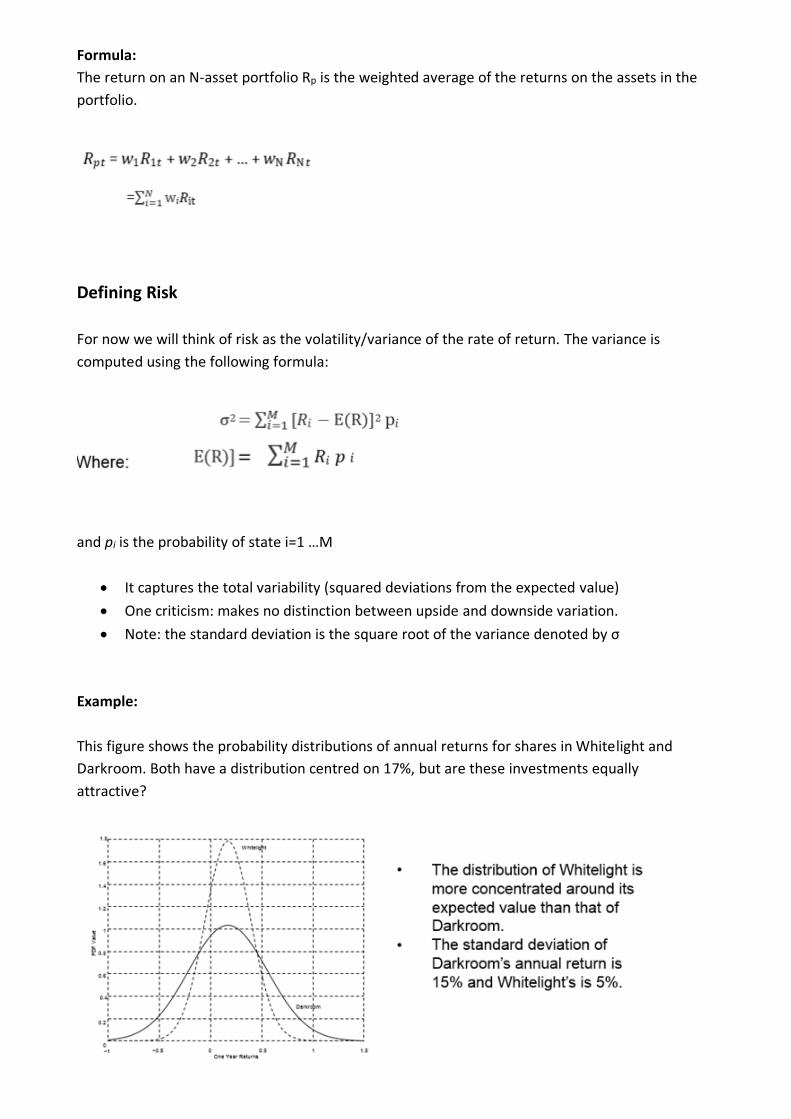
Example:
This figure shows the probability distributions of annual returns for shares in Whitelight and
Darkroom. Both have a distribution centred on 17%, but are these investments equally
attractive?
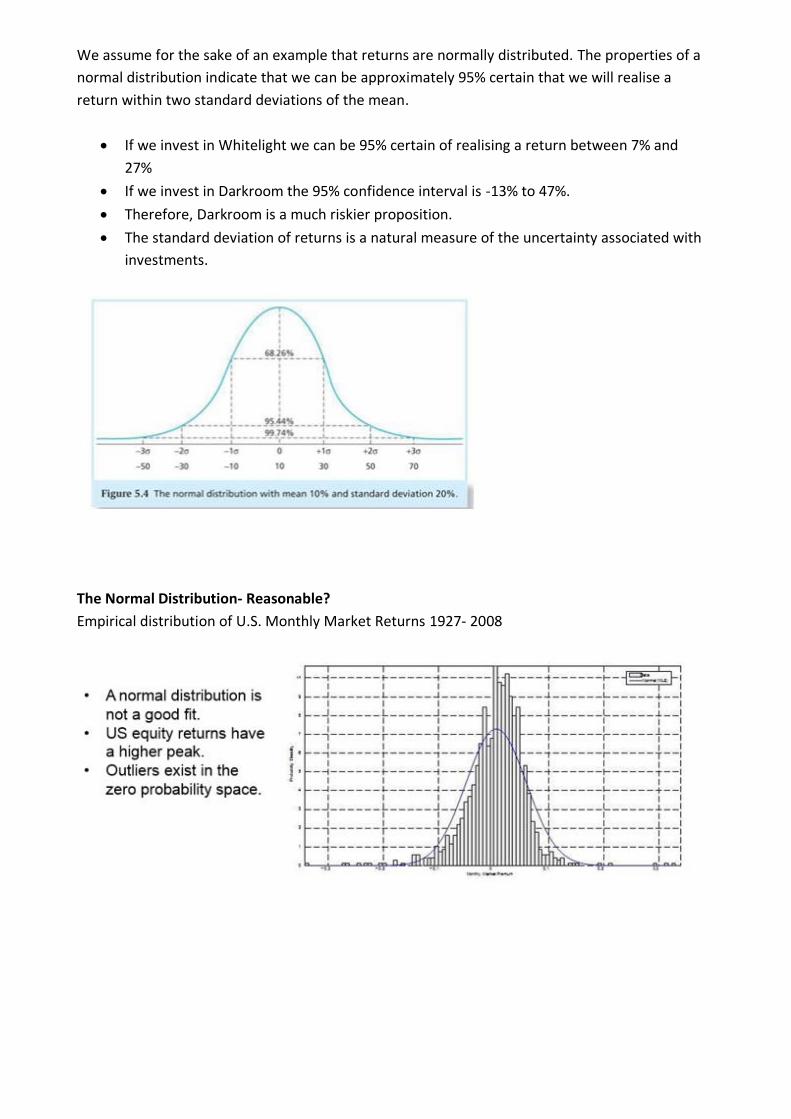
We assume for the sake of an example that returns are normally distributed. The properties of a
normal distribution indicate that we can be approximately 95% certain that we will realise a
return within two standard deviations of the mean.
• If we invest in Whitelight we can be 95% certain of realising a return between 7% and
27%
• If we invest in Darkroom the 95% confidence interval is -13% to 47%.
• Therefore, Darkroom is a much riskier proposition.
• The standard deviation of returns is a natural measure of the uncertainty associated with
investments.
The Normal Distribution- Reasonable?
Empirical distribution of U.S. Monthly Market Returns 1927- 2008
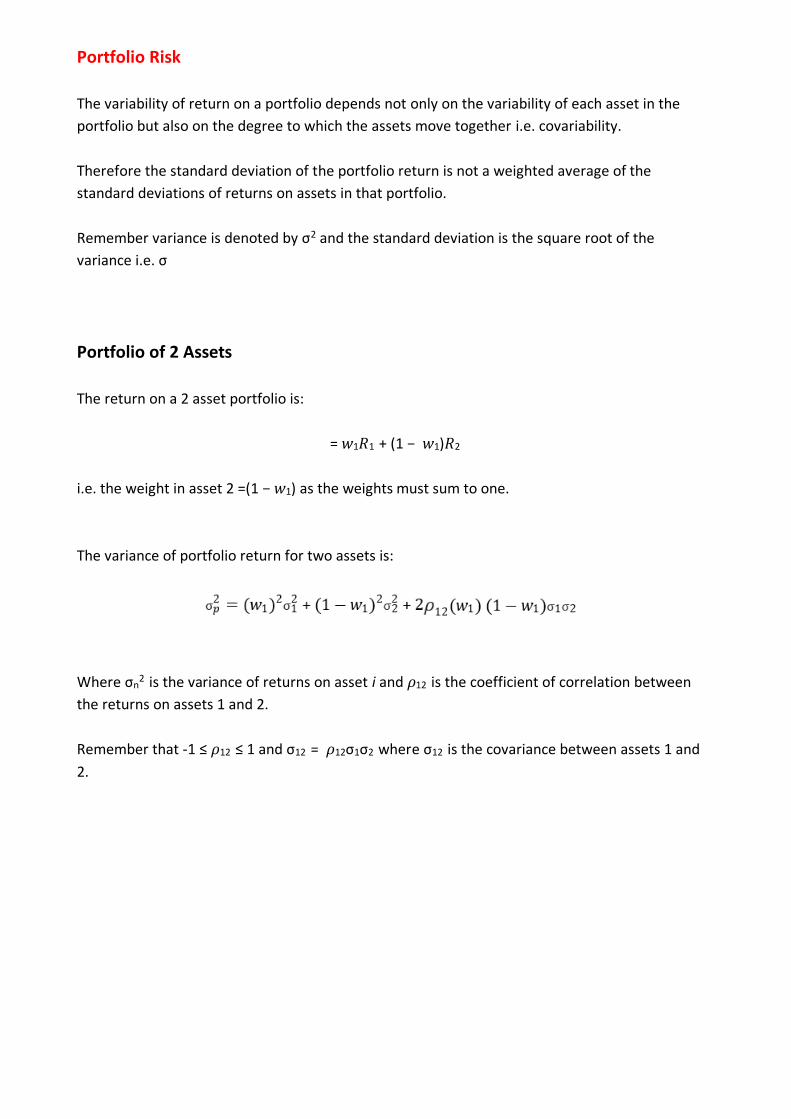
Portfolio Risk
The variability of return on a portfolio depends not only on the variability of each asset in the
portfolio but also on the degree to which the assets move together i.e. covariability.
Therefore the standard deviation of the portfolio return is not a weighted average of the
standard deviations of returns on assets in that portfolio.
Remember variance is denoted by σ2 and the standard deviation is the square root of the
variance i.e. σ
Portfolio of 2 Assets
The return on a 2 asset portfolio is:
= 𝑤1𝑅1 + (1 − 𝑤1)𝑅2
i.e. the weight in asset 2 =(1 − 𝑤1) as the weights must sum to one.
The variance of portfolio return for two assets is:
Where σn2
is the variance of returns on asset i and 𝜌12 is the coefficient of correlation between
the returns on assets 1 and 2.
Remember that -1 ≤ 𝜌12 ≤ 1 and σ12 = 𝜌12σ1σ2 where σ12 is the covariance between assets 1 and
2.
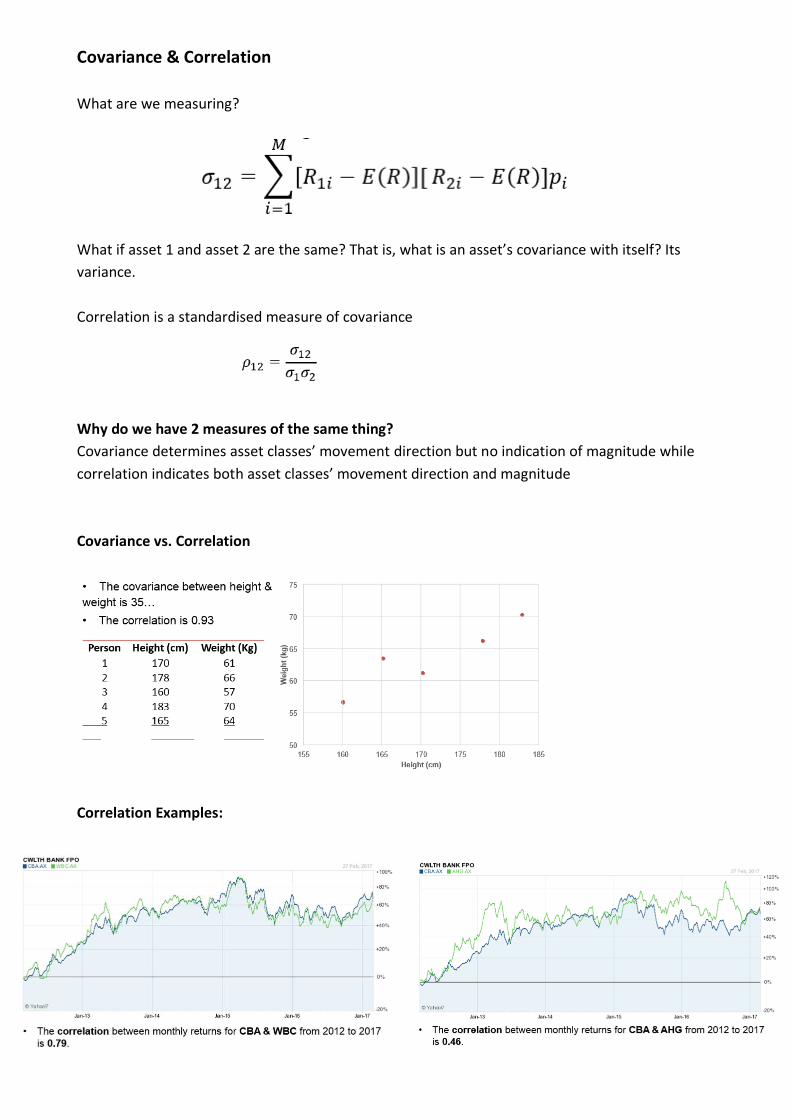
Covariance & Correlation
What are we measuring?
What if asset 1 and asset 2 are the same? That is, what is an asset’s covariance with itself? Its
variance.
Correlation is a standardised measure of covariance
Why do we have 2 measures of the same thing?
Covariance determines asset classes’ movement direction but no indication of magnitude while
correlation indicates both asset classes’ movement direction and magnitude
Covariance vs. Correlation
Correlation Examples:
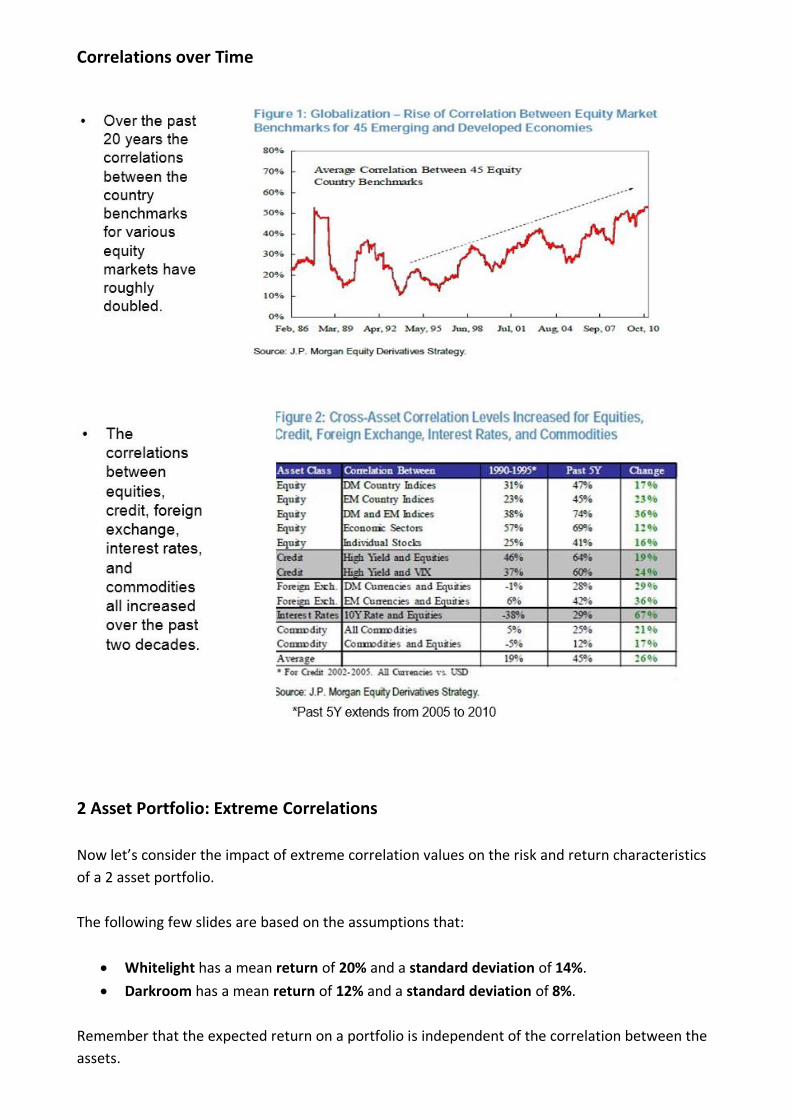
Correlations over Time
2 Asset Portfolio: Extreme Correlations
Now let’s consider the impact of extreme correlation values on the risk and return characteristics
of a 2 asset portfolio.
The following few slides are based on the assumptions that:
• Whitelight has a mean return of 20% and a standard deviation of 14%.
• Darkroom has a mean return of 12% and a standard deviation of 8%.
Remember that the expected return on a portfolio is independent of the correlation between the
assets.
Risk Averse Investor
A risk averse investor is an investor who prefers lower returns with known risks rather than
higher returns with unknown risks.
For example, a risk-averse investor might choose to put his or her money into a bank account
with a low but guaranteed interest rate, rather than into a stock that may have high expected
returns, but also involves a chance of losing value.
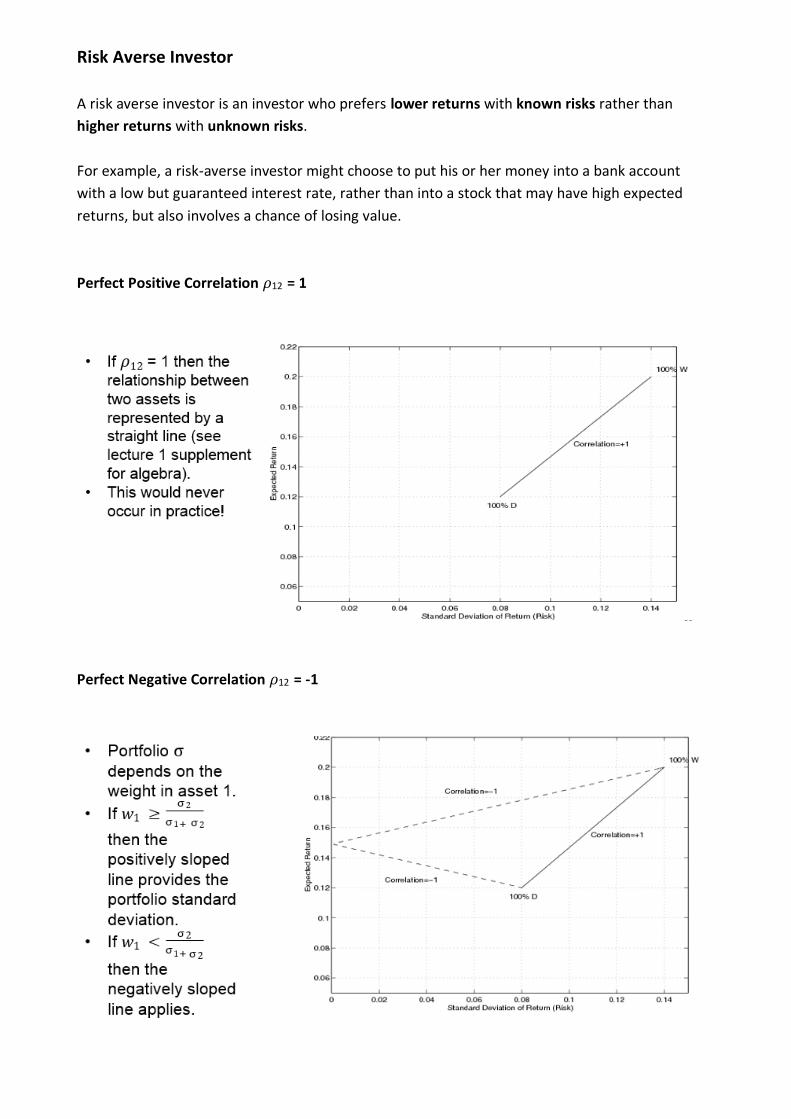
Perfect Positive Correlation 𝜌12 = 1
Perfect Negative Correlation 𝜌12 = -1
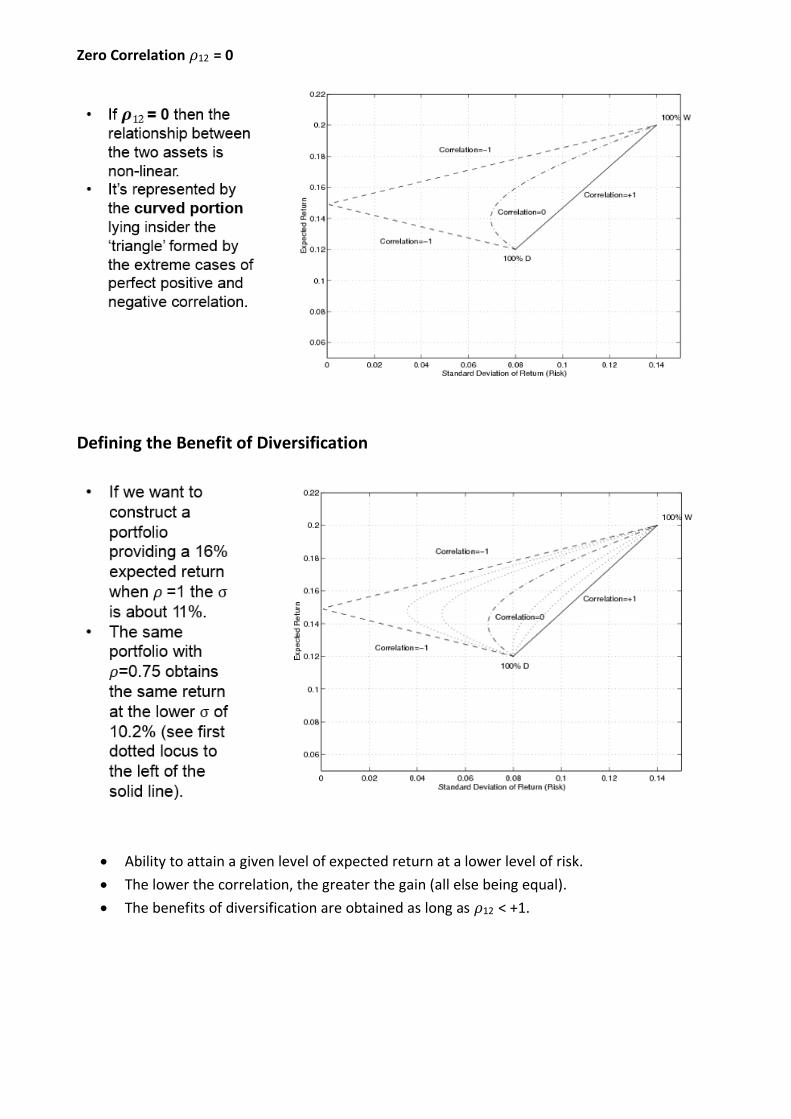
Zero Correlation 𝜌12 = 0
Defining the Benefit of Diversification
• Ability to attain a given level of expected return at a lower level of risk.
• The lower the correlation, the greater the gain (all else being equal).
• The benefits of diversification are obtained as long as 𝜌12 < +1.
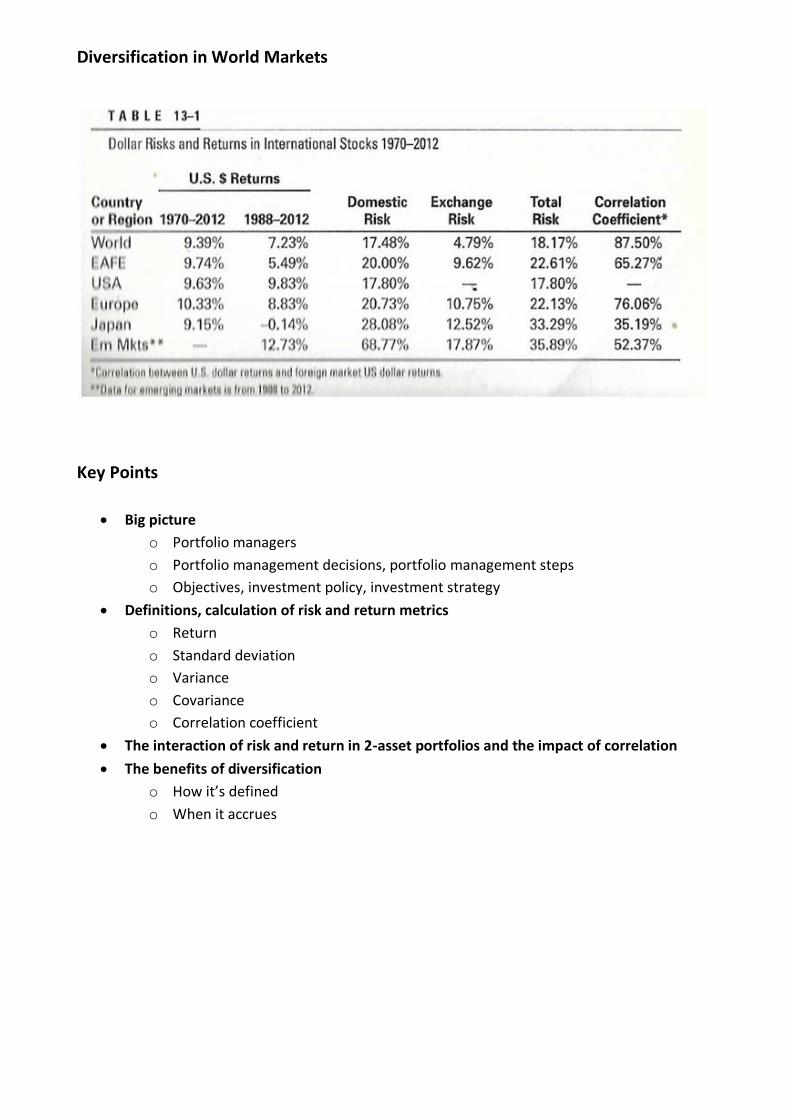
Diversification in World Markets
Key Points
• Big picture
o Portfolio managers
o Portfolio management decisions, portfolio management steps
o Objectives, investment policy, investment strategy
• Definitions, calculation of risk and return metrics
o Return
o Standard deviation
o Variance
o Covariance
o Correlation coefficient
• The interaction of risk and return in 2-asset portfolios and the impact of correlation
• The benefits of diversification
o How it’s defined
o When it accrues


![OVERVIEW OF THE IMPACT OF PROJECT PORTFOLIO MANAGEMENT … · 2020. 10. 5. · authors [32]–[41] cover this topic, and the current edition of the Project Portfolio Management Standard](https://img.pdfslide.us/doc/110x75/60d33a44c02da80d4a7d14ee/overview-of-the-impact-of-project-portfolio-management-2020-10-5-authors-32a41.jpg)