Embed Size (px)
Citation preview

1
TOPIC 1 - INTRODUCTION TO ECONOMICS
What Economic Outcomes do we aim to achieve in this topic?
You will demonstrate understanding of economic terms, concepts and relationships.
You will be able to explain the economic role of individuals, firms and government
in an economy.
You will identify the nature and causes of economic problems and issues for
individuals, firms and governments.
What Economics Issues will be examined?
You will identify the opportunity costs involved in economic decisions made by
individuals, businesses and governments at local, state and national levels.
You will examine the ways that the economic problem affects individuals at
different income levels.
You will examine the implications of unemployment and technological change using
production possibility frontiers.
You will compare and contrast the ways that different economies deal with specific
problems or issues.
What Economic Skills will you develop in this topic?
You will construct and interpret graphs including production possibility frontiers.
You will distinguish between equilibrium and disequilibrium situations in the
circular flow of income model and understand the implications of this.
You will identify key features of an economy through analysis of a variety of
information types and sources.
You will communicate in groups to investigate aspects of economics and economies.

2
Preliminary Topic 1 - An Introduction to Economics
Glossary of Terms
TERM DEFINITION
Business Cycle The name given to the sequence of business fluctuations which
occur over a period years in a regular cyclical pattern. The
phases of the cycle may be referred to as expansion (recovery),
boom, recession, and contraction (downswing or slump).
Capital goods The produced means of production used in the production of
other goods and services, such as factories and machinery.
Circular Flow of
Income
A theoretical model, based on certain assumptions, that
describes the transfer of money, goods, and services between
the major sectors of an economy.
Consumer goods These are goods used by consumers to satisfy their wants.
Consumer
sovereignty
Occurs when it is the consumer who decides the production in
the economy through casting dollar votes for goods and
services in the market.
Demand The quantity a consumer is willing to buy at a certain price.
Economic Growth A sustained increase in a nation's output over time, generally
measured as real Gross Domestic Product per annum.
Enterprise The factor of production that an entrepreneur contributes to
production. It consists of innovation, organisation, and risk
taking.
Exports Goods sold to other countries. It is also an injection into the
circular flow and has an economic symbol of X.
Factors of
production
See Resources.
Fair Work
Commission
Fair Work Commission is the national workplace relations
tribunal that manages Australia’s industrial relations.
Financial sector Intermediaries (or go betweens) who get funds in the form of
savings and lend it out to businesses for investment.
Firms sector Businesses who employ resources, carry out production and sell
goods and services.
Government
Expenditure
Money spent by the government. It is also an injection into the
circular flow and has an economic symbol of G.
Government
sector
The government who raise money through taxation and spend
money to provide basic services and redistribute income.
Gross Domestic
Product
Gross domestic product (GDP) refers to the market value of all
final goods and services produced within a country in a given
period of time. Y= C+I+G+(X-M).
Gross National
Income
Gross National Income (GNI) equals GDP plus income receipts
from the rest of the world minus income payments to the rest of
the world.
3
TERM DEFINITION
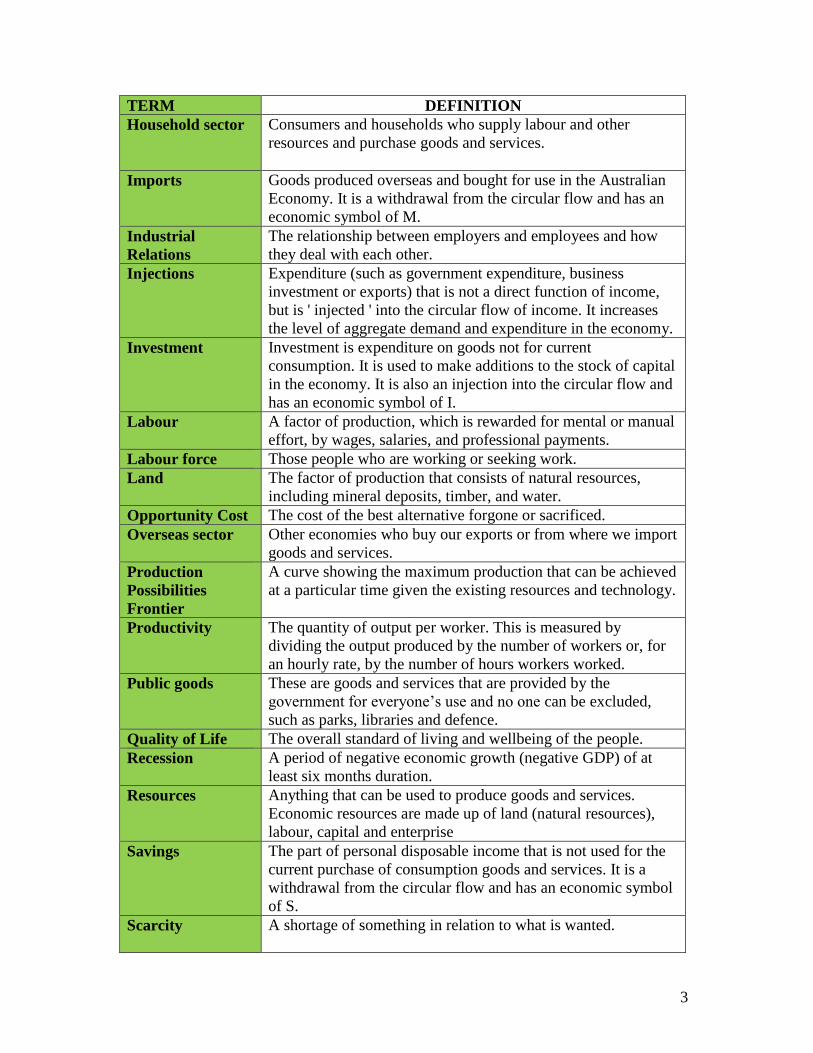
Household sector Consumers and households who supply labour and other
resources and purchase goods and services.
Imports Goods produced overseas and bought for use in the Australian
Economy. It is a withdrawal from the circular flow and has an
economic symbol of M.
Industrial
Relations
The relationship between employers and employees and how
they deal with each other.
Injections Expenditure (such as government expenditure, business
investment or exports) that is not a direct function of income,
but is ' injected ' into the circular flow of income. It increases
the level of aggregate demand and expenditure in the economy.
Investment Investment is expenditure on goods not for current
consumption. It is used to make additions to the stock of capital
in the economy. It is also an injection into the circular flow and
has an economic symbol of I.
Labour A factor of production, which is rewarded for mental or manual
effort, by wages, salaries, and professional payments.
Labour force Those people who are working or seeking work.
Land The factor of production that consists of natural resources,
including mineral deposits, timber, and water.
Opportunity Cost The cost of the best alternative forgone or sacrificed.
Overseas sector Other economies who buy our exports or from where we import
goods and services.
Production
Possibilities
Frontier
A curve showing the maximum production that can be achieved
at a particular time given the existing resources and technology.
Productivity The quantity of output per worker. This is measured by
dividing the output produced by the number of workers or, for
an hourly rate, by the number of hours workers worked.
Public goods These are goods and services that are provided by the
government for everyone’s use and no one can be excluded,
such as parks, libraries and defence.
Quality of Life The overall standard of living and wellbeing of the people.
Recession A period of negative economic growth (negative GDP) of at
least six months duration.
Resources Anything that can be used to produce goods and services.
Economic resources are made up of land (natural resources),
labour, capital and enterprise
Savings The part of personal disposable income that is not used for the
current purchase of consumption goods and services. It is a
withdrawal from the circular flow and has an economic symbol
of S.
Scarcity A shortage of something in relation to what is wanted.

4
TERM DEFINITION
Taxation The main source of government revenue and an instrument of
economic policy. The main functions of taxation are to release
resources from the private sector and make these available to
the public sector. It is a withdrawal from the circular flow and
has an economic symbol of T.
Technological
Change
The introduction of new or improved products, new or modified
production processes or improvements in the productivity of
resources.
Underemployed
workers
Employed persons who express the desire to have additional
hours of work in their present job or to have an additional job,
or to have a new job with longer working hours are considered
underemployed.
Wants Peoples' desires for those goods and services which give them
satisfaction.
Welfare A government payment to the needy or worthy without them
providing anything in return, such as pensions, Austudy.
Withdrawals Deductions or leakages from the circular flow. They include
savings, net taxes, and imports.
5
THE NATURE OF ECONOMICS
1. What is economics all about?
Here is an introductory powerpoint discussing the nature of economics and what
economics is all about. So let’s start our study of economics here.
N.B. Press on the control (ctrl) key and click on the link to see the powerpoint:
What is Economics?
1.1 What is the economic problem?
The economic problem is about the need to make choices. In any economy there is a
limited supply of goods and services. This limited supply is a result of the scarce
availability of resources. There is only a certain amount of natural resources, human
resources, machinery and people who are willing and able to start businesses in any
economy. On the other hand there are many more things that we would like to have i.e.
wants. As a result of many and in some cases unlimited wants and scarce resources the
individual, businesses and the government have to make decisions to solve this
economic problem.
Economics is really about solving problems. The basic economic problem is due to
scarcity. If we had an infinite supply of resources, there would be reason to charge
people to purchase goods and services. We would not have to pay tax to the government
and we could have all that we wanted. Well let’s stop dreaming and return to the real
world now! There are four basic economic questions that have to be answered in any
economy. Different economies answer them in different ways but they all still have to
decide:
What goods and services are to be produced?
How many of these goods and services will be produced?
How will these goods and services be produced?

6
How will these limited quantities of goods and services be allocated among the
members of the economy?
(1) What goods and services are to be produced?
In Australia’s case, the decision of what goods and services are to be produced is
determined by:
Consumers – The more demand consumers have for a product the more likely that
product will be produced. In market based economies the consumer is the dominant
force in determining what goods and services will be produced. This is known as
consumer sovereignty. The more demand there is for products then, generally, the more
products that will be produced.
Business - The profit motive drives business decisions. Businesses seek to maximize
profit, i.e. where revenue minus expenses is greatest.
Government – All economies have at least some government intervention in the
market. In Australia the government is a consumer, an employer, a business and a
regulator. The government can prohibit or limit the production of certain goods and
services, if they are not in the best interests of society, such as drugs and under age
drinking and smoking. The government also creates a demand for goods and services
that they consider society should have, such as defense and art galleries.
(2) How many goods and services will be produced?
This involves deciding the quantity of goods and services to be produced. Over-supply
means wasted scarce resources. More use of finite resources now means less availability
of both resources and output in the future. Again the consumer is the main factor in this
decision. Greater demand usually means more production by businesses. Again the
government may decide to regulate the quantity that will be supplied. This may involve
a quota, a limit on production, or limiting suppliers, such as Telstra’s control of the
telephone lines that provide communication for homes in Australia.

7
(3) How will these goods and services be produced?
The decision process of how goods and services will be produced is really one for
businesses to consider. While there may be some government regulation of hours of
work or zoning of land for industrial and other purposes, businesses will base production
decisions on the cost and production possibilities of the resources they will use. For
example, relatively higher costs of labour will lead to greater use of capital in the
production process.
(4) How will these limited quantities of goods and services be allocated among the
members of the economy?
In a market economy the value of the resources that you contribute to the market largely
determines the income that you have and as a result your share of goods and services.
For example, if you earn a high wage then you can purchase goods and services with
that. If you have no income or low income, then you will rely on the government to
redistribute income through social security and welfare to allow you to purchase goods
and services. The government also decides certain goods and services should be
produced in the interests of society. As a result taxes are used to redistribute income and
resources to these areas, such as defence, public housing, libraries and parks.
APPLY YOUR LEARNING 1.1
Group Work - Stranded on a deserted island
You are to break into groups of 3-4 students. You are to assume that you are stranded on
a deserted tropical island, 500 kms off the coast of Queensland. You have the task of
setting up an economic system on that island. You need to decide the basic economic
questions of:
What and how much to produce?
How to produce it?
Who will get it?
What will be done to increase efficiency and economic growth?
It is important to develop a system that will sustain economic development. The role of
8
each person in the group should be clearly explained. The group will have 20 minutes to
plan their economic system and each group will give a 3-5 minute report.
REVIEWING AND APPLYING YOUR LEARNING 1.2
Now that you have an idea of what Economics is about, watch the following video and
write your own definition incorporating the terms: resources, scarce, needs and wants.
http://www.youtube.com/watch?v=yoVc_S_gd_0
1.2 The need for choice by individuals and society
As we have already seen consumers, businesses and the government have to make
choices due to the limited supply of resources available to any economy. You, as a
student, have made choices about whether to go on to Year 11 or choose to go to TAFE
or to go to work. You can not do all of these at the same time as time is also a scarce
resource.
1.3 Opportunity cost and its application through production possibility
frontiers
In making this decision you have considered an economic principle that of opportunity
cost. The decision to produce or consume a product involves giving up another product.
The real cost of an action is the next best alternative forgone.
Opportunity cost is the main alternative that you have given up. You can not be in
school, at TAFE, at work and at the beach at the same time. You have to make a choice.
The best alternative that you have given up is your opportunity cost. If you weren’t at
school now, where would you be? That is your opportunity cost. If you would be at
TAFE then that is your opportunity cost.

9
Just as individuals make choices, businesses and society also have to consider
opportunity cost. The business can not produce an unlimited quantity of output as
resources are scarce. The business has to decide the goods and services that they will
produce and the quantities with their limited resources. The business considers its
production possibilities. With the resources it has a business has a number of alternative
levels and types of output that it can produce.
Let’s consider a farmer in Australia. They have a certain size farm which limits the
amount that they can produce. The farmer has to decide between producing a number of
products. Finally the farmer decided to produce wheat and sheep. This is not the end of
the problem the farmer needs to consider how much land will be allocated between the
wheat and sheep production. This is shown in the production possibilities schedule
below.

10
Table 1.1: Wheat V Wool Production
Wheat (tonnes) 1000 800 600 400 200 0
Wool (bales) 0 200 300 350 380 400
If the farm only produces wheat, then 1000 tonnes can be produced. If the farmer wants
to produce 200 bales of wool, land will have to be diverted from wheat production. This
reduces the output of wheat to 800 tonnes. The opportunity cost is 200 tonnes of wheat
to produce 200 bales of wool. Similarly if the farmer only has sheep to produce wool on
the farm then 400 bales of wool can be produced. To produce 200 tonnes of wheat, the
transfer of resources leads to a loss of wool production of 20 bales. The opportunity cost
of producing 200 tonnes of wheat is 20 bales of wool.
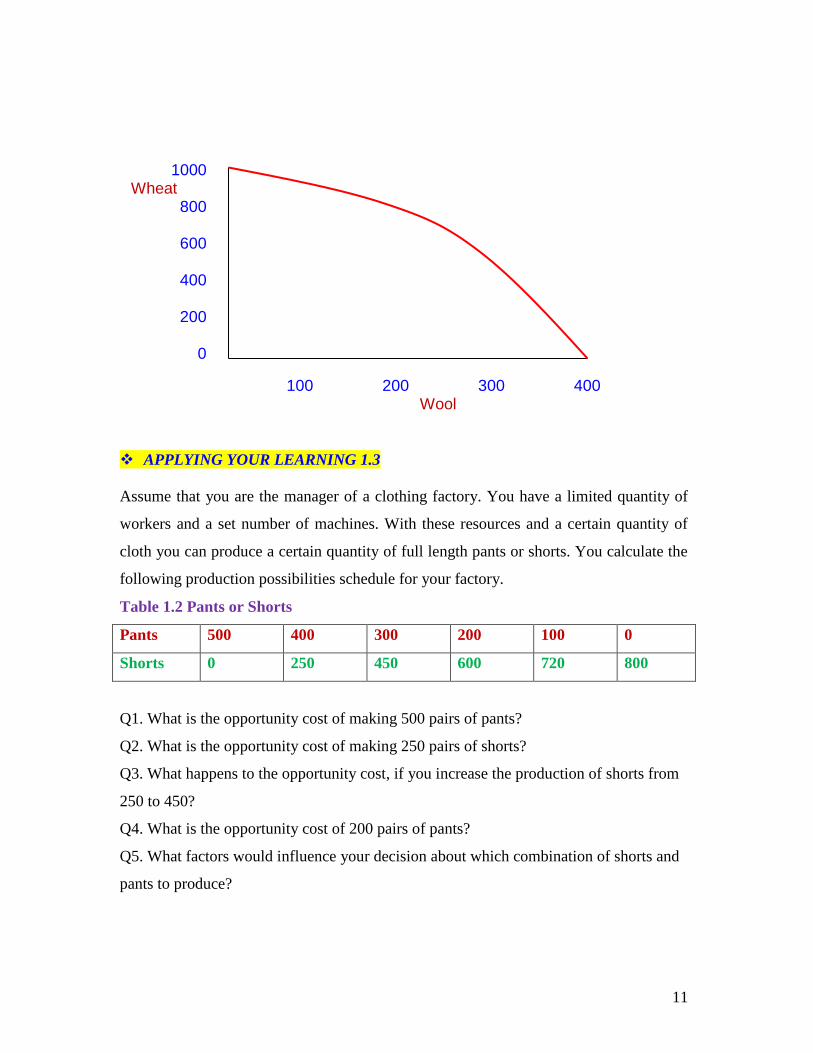
These production possibilities for the farmer can be plotted on a graph as a production
possibilities frontier. This is shown in the figure below.
11
APPLYING YOUR LEARNING 1.3
Assume that you are the manager of a clothing factory. You have a limited quantity of
workers and a set number of machines. With these resources and a certain quantity of
cloth you can produce a certain quantity of full length pants or shorts. You calculate the
following production possibilities schedule for your factory.
Table 1.2 Pants or Shorts
Pants 500 400 300 200 100 0
Shorts 0 250 450 600 720 800
Q1. What is the opportunity cost of making 500 pairs of pants?
Q2. What is the opportunity cost of making 250 pairs of shorts?
Q3. What happens to the opportunity cost, if you increase the production of shorts from
250 to 450?
Q4. What is the opportunity cost of 200 pairs of pants?
Q5. What factors would influence your decision about which combination of shorts and
pants to produce?
1000 Wheat
800
600
400
200
0
100 200 300 400 Wool

12
Plot your production schedule on a graph showing a production possibilities frontier.
Remember to draw you graph to scale and label your axis.
REVIEW YOUR ANSWERS
Did you get the right answers? Click here to see the correct answers. There is a
powerpoint of the instructor showing you how to work out the correct answers and
showing you how to draw a production possibilities frontier.
The choices we make have future implications for the individual, businesses and society.
By deciding to pursue further study in Years 11 and 12 you are giving up the
opportunity to earn income in the present. However, you are increasing your chances of
earning a higher income over your lifetime. The business that applies good
environmental policies, such as adopting solar energy in production, may have increased
costs in the present period, but this may ensure long term efficient resource use by the
firm and higher profits over the long run for the firm. The government may decide to
increase university fees to reduce their spending and increase the budget surplus. In the
long run, though, this may lead to a less qualified workforce, leading to lower
productivity and lower economic growth. This could lead to the government getting less
revenue and paying more out in social welfare for those out of work.
An important consideration for any economy is the proportion of scarce resources
allocated between consumer goods and capital goods. Consumer goods are the goods
and services that we consume that give us present satisfaction such as food and clothes.
Capital goods are goods that are used in future production that may increase the quantity
of goods and services we have in the future. As resources are scarce we need to limit our
consumption of consumer goods in the present to allow for the production of capital
goods that will supply the consumer goods and other capital goods in the future.
In the case of Australia and many western economies we tend to have a high level of
spending on consumer goods which leave few resources for producing capital. In turn
many Asian economies have lower levels of consumer spending and as a result more

13
savings that are diverted to investing in capital goods production. The effect of this has
been that economies that divert a higher proportion of resources to capital goods
production have higher rates of economic growth compared to those who do not.
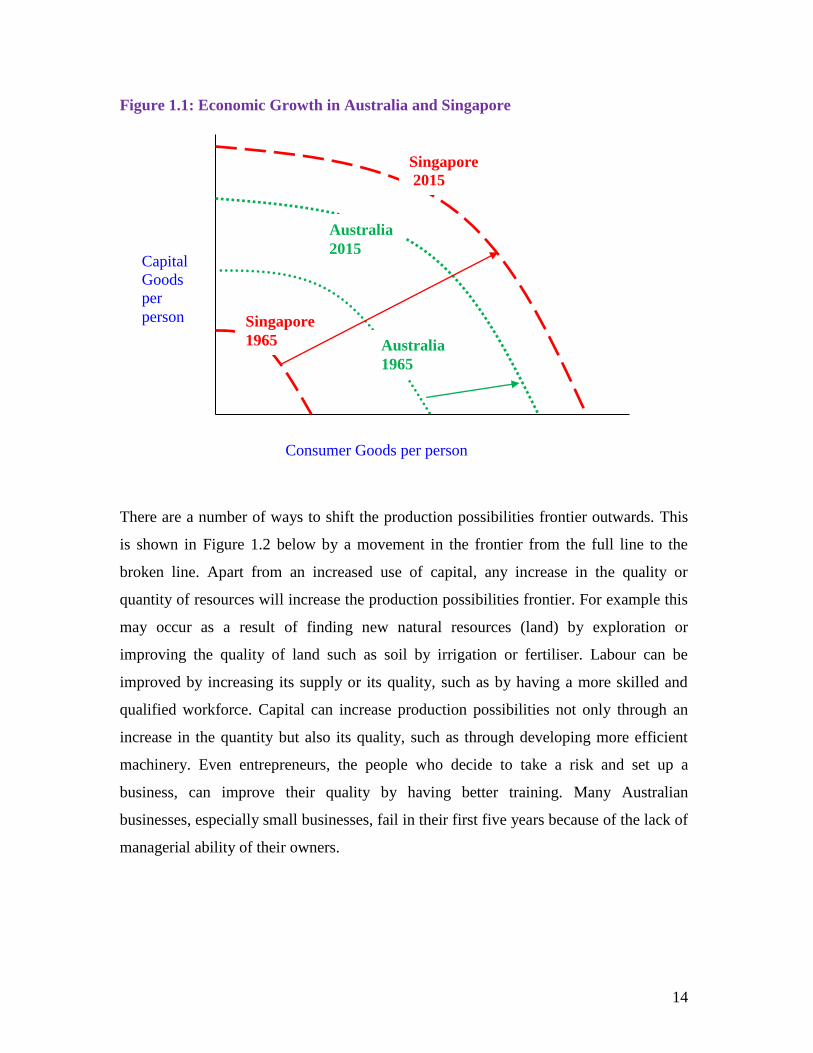
Let us look at the case of Australia and Singapore. In 1965, Singapore became an
independent state. It was faced with a lack of physical resources, a small domestic
market and a low standard of living compared to Australia. In response, the Singapore
Government adopted a pro-business, pro-foreign investment, export-oriented economic
policy framework, combined with state-directed investments in strategic government-
owned corporations. Singapore's economic strategy proved a success, producing real
growth that averaged 8% from 1965 to 2015. In the same period Australia had lower
levels of capital goods production and grew at a much slower rate so that by 2015 the
value of Singapore’s production per person had overtaken that of Australia’s. This
relationship is shown in Figure 1.1.
REVIEW YOUR LEARNING 1.4
Click on the powerpoint link of the instructor showing you the relationship
between capital goods production and consumer goods production and economic
growth in an economy. Capital Goods V Consumer Goods.
APPLYING YOUR LEARNING 1.5
(a) Which country do you think will have the highest level of economic growth per
person in 2025?
(b) Would you reduce your spending on consumer goods in the present to increase
Australia’s living standards in the future?
14
Figure 1.1: Economic Growth in Australia and Singapore
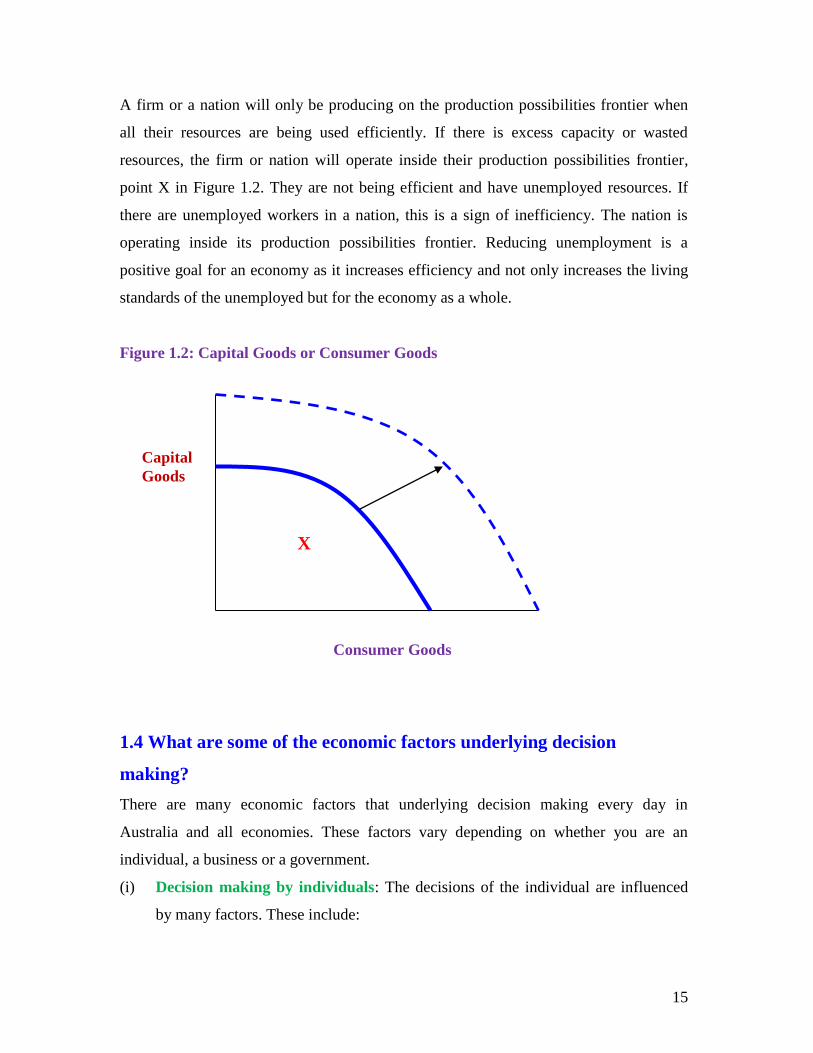
There are a number of ways to shift the production possibilities frontier outwards. This
is shown in Figure 1.2 below by a movement in the frontier from the full line to the
broken line. Apart from an increased use of capital, any increase in the quality or
quantity of resources will increase the production possibilities frontier. For example this
may occur as a result of finding new natural resources (land) by exploration or
improving the quality of land such as soil by irrigation or fertiliser. Labour can be
improved by increasing its supply or its quality, such as by having a more skilled and
qualified workforce. Capital can increase production possibilities not only through an
increase in the quantity but also its quality, such as through developing more efficient
machinery. Even entrepreneurs, the people who decide to take a risk and set up a
business, can improve their quality by having better training. Many Australian
businesses, especially small businesses, fail in their first five years because of the lack of
managerial ability of their owners.
Capital
Goods
per
person Singapore
1965 Australia
1965
Australia
2015
Consumer Goods per person
Singapore
2015
15
A firm or a nation will only be producing on the production possibilities frontier when
all their resources are being used efficiently. If there is excess capacity or wasted
resources, the firm or nation will operate inside their production possibilities frontier,
point X in Figure 1.2. They are not being efficient and have unemployed resources. If
there are unemployed workers in a nation, this is a sign of inefficiency. The nation is
operating inside its production possibilities frontier. Reducing unemployment is a
positive goal for an economy as it increases efficiency and not only increases the living
standards of the unemployed but for the economy as a whole.
Figure 1.2: Capital Goods or Consumer Goods
1.4 What are some of the economic factors underlying decision
making?
There are many economic factors that underlying decision making every day in
Australia and all economies. These factors vary depending on whether you are an
individual, a business or a government.
(i) Decision making by individuals: The decisions of the individual are influenced
by many factors. These include:
Capital
Goods
Consumer Goods
X

16
i. Spending v saving: The individual is limited in their ability to spend or
save by their level of disposable income (income after tax). A high income
earner has greater choices than a low income earner. The individual can
choose to spend or save their income. However, the low income earner
needs to spend a higher proportion of their income for basic needs and
survival. In many cases low income earners will have no savings and may
even be in debt. The high income earner will generally save some of their
income for the future and this accumulates as wealth.
ii. Work, education and retirement: Once a person turns 15 years old in
Australia they have to make decisions about work and school. By returning
to school to start year 11 you have given up current income as a worker to
pursue higher income as a result of greater qualifications. At the end of
year 12 you will have to make the work v education decision again. Will
you go to work or go to TAFE or university? Each of these factors affects
your income level and purchasing ability in the present compared to your
lifetime earnings. Eventually you will go to work as this will maximise
your income and allow you to purchase goods and services. You still will
have to make the decision of when you are going to give up work and
retire. The longer you work the more income you receive and as a result the
more wealth you accumulate to spend during your retirement. You may
make the decision to retire yourself or it may be made for you by an
employer or employers who decide that you are no longer required as a
worker. Family and health factors also influence the work v retirement
relationship. Many women quit work to have children and do not return to
paid employment or only work part-time. In some cases, early retirement
may occur due to ill health. All these decisions affect your lifetime income
and spending capacity. People will make different decisions over their
lifetime because they are individuals and have different wants, interests,
capabilities and opportunities.
iii. Voting and participation in the political process: Australian citizens and
residents over the age of 18 are required to vote. This gives you the right to

17
influence the selection of the politicians who will make many important
decisions that will influence not only your life but also businesses, the
nation and the economy. Decisions on areas such as health care, education,
and taxation will all influence your quality of life and the choices you are
able to make. For example increases in the cost of university fees have led
to a decline in the proportion of students from low income areas going to
university and as a result affects their work v education decision. This may
also reduce their lifetime earnings potential, as university graduates on
average have higher lifetime earnings than students who only study till the
end of Year 12. A government decision for a tax cut in the present has to
be weighed up against a possible loss of services such as roads, hospitals,
welfare and education in the future. Many short term decisions have much
larger long term implications that may not always be considered but it is
the job of an economist to consider these implications.
(ii) Decision making by business: The decisions of business are influenced by such
economic factors as:
i. Pricing: Businesses seek to maximise profits. This is generally achieved by
maximising revenue compared to costs. Profits are maximised where the
gap between the business’ total revenue and total costs are greatest. If the
market price for a product rises, such as oil or wheat, then this generally
increases total revenue and as a result profits. Rising prices for a good or
service in the market is an incentive for a firm to produce more of that
product.
ii. Production and resource use: Businesses have to decide their method of
production. The aim will be to produce efficiently, that is at minimum cost.
The firm considers the various methods of production and the various
combinations of resources such as capital, land and labour to achieve their
production target. The firm then considers the cost of those resources and
finds the cheapest and most efficient way to achieve that production target.
As technology and methods of production change so will the ways to

18
produce. Changes in the costs of the resources such as wages and
machinery will also change the most efficient combination of resources in
production.
iii. Industrial Relations: Industrial relations is the relationship between
employers and employees. This relationship not only involves the
determination of wages and conditions of work but also the way each deal
with the other and their level of co-operation. A positive working
environment leads to increased productivity but an unhappy workplace
leads to lower productivity, absenteeism and staff turnover.
(iii) Decision making by the government: The government also has limited
resources and great demands on those resources. People ask for increased
spending on schools, roads, health, social welfare and many other areas, while
also demanding cuts to tax and government charges. The governments of
Australia therefore have to make decisions about revenue and expenditure that
influence the decisions of consumers and business. A change in the rate of
personal income tax affects the spending behaviour of individuals. This change
in spending will influence the production decisions of businesses. Greater
spending by the government on child care will divert resources to that area and
businesses will produce goods and services to meet that demand. The
government also regulates the operation of the market and influences consumer
and business decisions in that manner. For example, to limit environmental
damage the government may have charges for cleaning up the environment or
have requirements in place to prevent possible damage, such as pollution control
devices on cars and phasing out leaded petrol.

19
THE OPERATION OF THE ECONOMY
1.5 Production of goods and services from resources
The first stage of production is to decide what resources are required to produce the
goods and services the firm aims to produce. These resources, or factors of production,
can be grouped into four main areas:
Land: The factor of production that consists of natural resources, including
mineral deposits, timber, and water.
Labour: The factor of production, which is rewarded for mental or manual
effort, by wages, salaries, and professional payments. It includes the skill and
effort of cleaners, carpenters and nurses.
Capital: The produced means of production used in the production of other
goods and services, such as factories and machinery. It is important to note that
money is not capital in economics but money used by a business to purchase
machinery is known as investment.
Enterprise: The factor of production where an entrepreneur (the person who
starts the business) organises production. It consists of innovation, organisation,
and risk taking. The entrepreneur is responsible for coordinating the other three
factors of production in the production process. In modern business practice, the
entrepreneur may employ a manager (labour) to supervise the day to day
operation of the business.
To be a factor of production in economics the resource must be usable in the production
process. As a result reserves of oil and other natural resources that have been discovered
and are usable are considered land. However, areas of property, for example, that have
no use in production (at least at some point in time) such as desert would not be
considered land in economics.
Let us look at the production process for steel manufacturing. The inputs are land, labour
and capital, but there is also the need for an entrepreneur to take the risk to purchase
these factors of production in order to carry out production. The risk is that the business

20
may fail and the entrepreneur will lose their money and other contributions that they
have made to the business.
Figure 1.3: The production process
REVIEWING AND APPLYING YOUR LEARNING 1.6
Complete the following Table:
FACTOR OF
PRODUCTION
EXPLANATION RETURN
Land
(Natural Resources)
Labour
The produced means of production e.g.
computers and machinery
Profit

21
Group activity: Join into a group of three to four students and prepare a flow chart
similar to that above (Figure 1.3) to show the production process of another good or
service. What similarities and differences do you find between your flow chart and the
ones for steel and those of your other classmates?
1.6 Exchange of goods and services:
The exchange or purchasing of goods and services vary. When a service is produced it is
usually available directly to the consumer. When a train or a bus service is produced the
consumer uses the service as they choose. It is directly available to them for purchase.
With goods often there is another stage in the distribution process, that involving a retail
outlet. Consumers do not but steel products directly from the steel manufacturer. The
steel products may go through another stage of processing to make them into a form that
is usable by consumers such as a car or a stove. They are then sold to retailers who then
sell them to consumers. Often factories will not be near consumers so that is why a retail
sector is important. It would be difficult for us to buy a car directly from a car
manufacturer in Germany or Japan but through a retail network this is easy and also
more efficient.
1.7 Provision of income and distribution of goods and services:
A person’s or family’s income largely determines their ability to purchase goods and
services in the economy. The level of income one receives is largely determined by the
value of the resources that they possess to the market and how much of those resources
they sell to the market. For example, workers will generally be paid based on their level
of skill, qualifications, productivity and the number of hours that they work. University
graduates on average are paid 50% more than workers with no post-school
qualifications. University graduates also have less than half the unemployment rate of
those with no post-school qualifications. Apart from work, income can be gained by
owning resources and receiving rent for them, by saving money and earning interest and
by investing and earning dividends and profit. For those with limited sources of income
the government provides support through the social security and welfare system, such as

22
with pensions and public housing. The government also has decided that in Australia
certain goods and services will be provided free to the community without any direct
payment. These include public goods such as parks, libraries and defence. They also
include goods and services that are provided free or at a very low cost such as public
schooling and health care, through Medicare. These are funded through taxation revenue
and the amount of tax that you pay does not affect your ability to use these goods and
services.
1.8 The business cycle and its impact on the quality of life and
employment
The business cycle is the pattern of fluctuations in the level of economic growth in the
economy. Economic growth in Australia is measured by the nation’s Gross Domestic
Product (GDP) i.e. the total value of goods and services produced in the economy in a
set period of time. The economy tends to go through a cycle of levels of growth as a
result of changes in the level of spending and as a result production over time. The
pattern of these changes in spending and growth creates the business cycle.
There are four main stages in the business cycle. They are:
the upswing (expansion);
boom (peak);
the downswing (contraction);
trough (recession).
Not all downswings and eventual troughs will lead to a recession. A recession is
classified as two consecutive quarters of negative growth. This means that production in
the economy declined over a period of six months. Sometimes economies go into
depressions. This is a sustained long period of negative growth usually leading to very
high levels of unemployment and increased poverty. The great depression of the 1930s
lasted for more than 10 years and had an unemployment rate of over 25 %.

23
Figure 1.4: The business cycle
APPLYING YOUR LEARNING 1.7
Use the information in the following table to plot the business cycle for economy X. On
the graph mark in the stages of the business cycle.
Table 1.3: Business cycle
Economy X Year 1 Year 2 Year 3 Year 4 Year 5 Year 6 Year 7
GDP $billions 130 100 90 120 150 130 110
Fluctuations in the business cycle have a major impact on the level of unemployment
and the quality of life. Economic growth increases the quantity of goods and services
produced in the economy and, as a result, make more products available for consumers.
Having more goods and services is one way of increasing living standards and the
quality of ones life.
REVIEWING AND APPLYING YOUR LEARNING 1.8
Click on the powerpoint link of the instructor showing you how the business cycle
operates and the effect of different stages of the business cycle. Business Cycle link.
GDP Upswing
Boom
Downswing
Trough
Years

24
In Australia, some economists consider that an economic growth rate of three percent is
very significant. When economic growth rises above three percent then there is
sufficient demand to lower the rate of unemployment. This view relates to Okun’s Law.
So that an increase in labour productivity together with an increase in the size of the
labour force can mean that output grows without the overall unemployment rate falling.
For example, if labour productivity is 1.5% and the labour force grows by 1.5%, as a
result of new workers entering the market, then GDP would need to increase by more
than 3.0% to reduce the unemployment rate. In a country such as China with higher
productivity and labour force growth, GDP may need to grow by as much as 7% before
the unemployment rate is lowered.
In the recession of the early 1990s in Australia, unemployment peaked at 11.4% in
1993-94. This also created a long-term unemployment rate of 36.6% in 1993. The long-
term unemployment is the percentage of the unemployed who have been out of work for
al least 12 months. The problem of the long-term unemployed has grown with each
recession Australia has had since 1980. In 1980 the number of long-term unemployed
was less than 80,000 people. Following the recession of 1982-83 the long-term
unemployment level rose to over 200,000 and during the recession of 1992-93 exceeded
350,000. This created a major problem for the structure and employability of the labour
force. Long-term unemployment was still high at 179,000 people in 2016 see Figure 1.6.
Growth in the long-term unemployment rate leads to the loss of skill, experience and
confidence for the unemployed. Many give up looking for work when they are
unemployed for lengthy periods of time. This is a loss of human capital and a loss of
potential output for the economy. Human capital is the value of a person’s education,
skills and experience. The longer a person is out of work and not using or developing
these skills the less productive they will be when they return to work. Many employers
when they have a choice of selecting from many workers will select those with the most
up-to-date skills and recent or current work experience.

25
Figure 1.6: Long-term unemployment in Australia, 1991-2016
Source: ABS, 6291.0.55.001 Labour Force, Australia
This increases the problem and the duration of long-term unemployment. Some of these
workers have been unemployed for 5 years or more and would need retraining to re-
enter the workforce. Even in 2016 when the general level of unemployment has declined
to 6.0%, the long-term unemployment rate stood at 22%, with more than 71,000
unemployed for more than two years. So as you can see recessions and unemployment
are not good for the economy or the individual. A steady growth path is desirable for all
economies but difficult to achieve. Ways of achieving this will be considered later in
this course.
1.9 The circular flow of income
The circular flow of income is like a map that shows the paths that money, income and
goods and services travel in the economy. The transfer of income takes place between
five main groups or sectors in the economy. A simple model with only two sectors
shows the transfer of income, resources and goods and services between the household
sector (or consumers) and the firms sector (or businesses). By looking at these two
sectors we can start to see the relationships that exist in the economy. The household

26
sector is comprised of all individuals, groups and families who buy goods and services
in the economy. The household sector also has another function as they also provide the
factor of production labour to the firms sector to carry out production. The firms sector
is made up of businesses that produce goods and services and employ the labour used in
production. The firms sector includes small individual producers up to large
transnational corporations, such as McDonalds and Coca-Cola.
In the two-sector model the household sector buys the goods and services that
businesses produce. In exchange the consumers pay money or income to the firms
sector. The consumers earn that money that allows them to purchase goods and services
by contributing their resources, mostly labour, to production. The household sector’s
spending becomes the firms sector’s income. This income is then used to cover the costs
of production, including labour. This relationship is shown in the simple circular flow
model Figure 1.7.
While the basic two sector model may not seem too complicated in the real world it does
not always operate smoothly. Decisions that are made by one sector can have major
effects on the other sector and lead to further consequences for itself. Let us consider a
situation where the firms sector decides that they can increase profit by sacking workers
and making all the other workers, who still have a job, work harder. The goal of greater
profits may not be achieved as workers are also consumers. Unemployed workers have
less income to spend. This leads to less demand for the firms’ production and less goods
and services are sold. Lower sales may lead to less profit. The firm may decide that due
to the fall in sales that they will sack more workers. This in turn means less consumer
expenditure, reduced sales and a further lowering of profits. So as you can see the
decisions made by these two sectors have major influences on each other.

27
Figure 1.7: A basic two-sector circular flow of income model
In the full operation of the economy there are five main sectors. Apart from the
households and firms sectors there are also the financial sector, the government sector
and the overseas sector. In the basic two sector model it is assumed that households
spend all their income. The introduction of the financial sector allows consumers to save
part of their income and to deposit those savings in the financial sector. The financial
sector in Australia is comprised of financial enterprises (such as banks) and financial
markets (for example, the bond market or share market). The financial sector enables
funds for investment to be made available from savings to other parts of the national or
international economy. The financial sector acts as an intermediary or a ‘middle man’.
They take savings (S) from the household sector and pay interest for the money and lend
the money to businesses to carry out investment (I). The return from the investment is
known as profit. Savings is a withdrawal of money from the circular flow. When the
money is lent out to business this then becomes an injection of funds. An important
issue to consider is that the level of savings does not have to equal the level of
investment in the economy. Savings (S) is carried out by consumers to earn interest, to
purchase things in the future and for security. High interest rates tend to increase the
level of savings in the economy. Investment (I) on the other hand is used to purchase
capital to increase production. Interest is a cost for the investor. It is the price they pay
Household
Sector
Labour, enterprise
Consumer expenditure
Wages, salaries and profits
Goods and services
Firms
sector
28
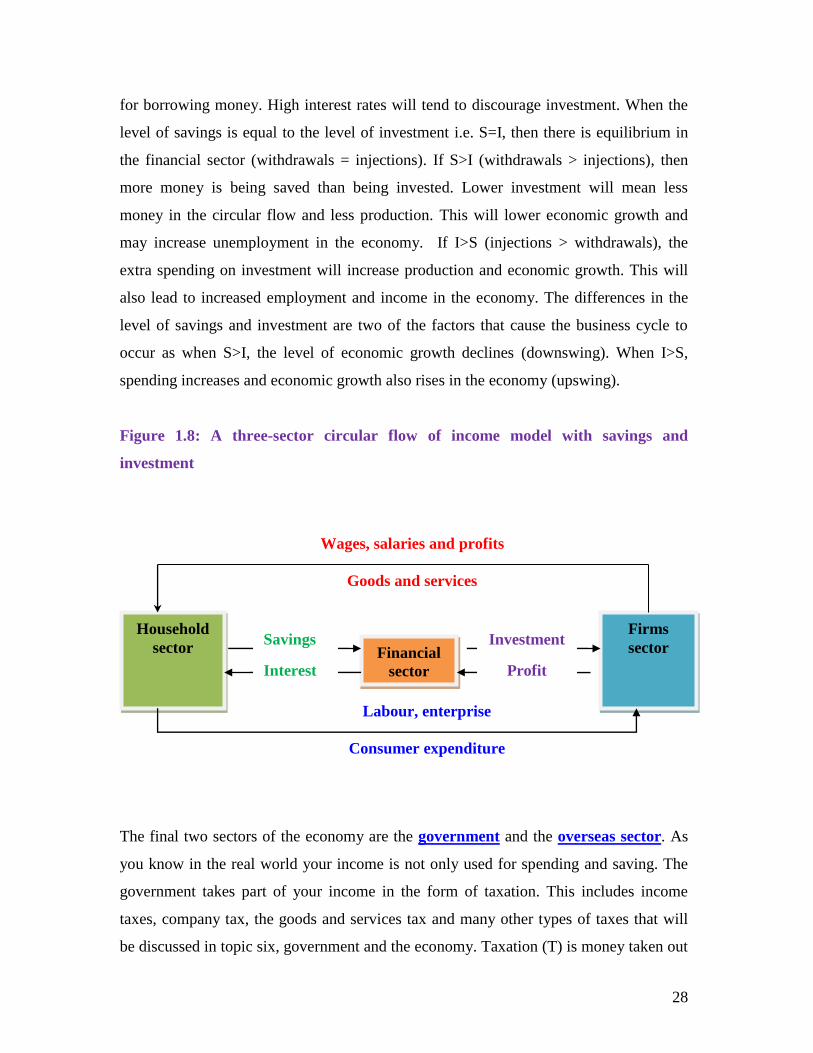
for borrowing money. High interest rates will tend to discourage investment. When the
level of savings is equal to the level of investment i.e. S=I, then there is equilibrium in
the financial sector (withdrawals = injections). If S>I (withdrawals > injections), then
more money is being saved than being invested. Lower investment will mean less
money in the circular flow and less production. This will lower economic growth and
may increase unemployment in the economy. If I>S (injections > withdrawals), the
extra spending on investment will increase production and economic growth. This will
also lead to increased employment and income in the economy. The differences in the
level of savings and investment are two of the factors that cause the business cycle to
occur as when S>I, the level of economic growth declines (downswing). When I>S,
spending increases and economic growth also rises in the economy (upswing).
Figure 1.8: A three-sector circular flow of income model with savings and
investment
The final two sectors of the economy are the government and the overseas sector. As
you know in the real world your income is not only used for spending and saving. The
government takes part of your income in the form of taxation. This includes income
taxes, company tax, the goods and services tax and many other types of taxes that will
be discussed in topic six, government and the economy. Taxation (T) is money taken out
Household
sector
Firms
sector
Labour, enterprise
Consumer expenditure
Wages, salaries and profits
Goods and services
Financial
sector
Savings
Interest
Investment
Profit

29
of the circular flow and like savings is a withdrawal. The government injects money into
the circular flow when they engage in government expenditure (G). The government
spends money to provide roads, education, health, defence and many other essential
requirements for a modern economy. If the level of government revenue (T) equals the
level of government expenditure (G), then the government budget is said to be balanced.
A balanced budget is only one option for a government. The government may have a
deficit budget where G>T. The excess government expenditure over taxation will
increase spending in the economy and make the economy grow. This is often referred to
as an expansionary budget. If T>G, then there will be more money withdrawn from the
economy than injected. This is a surplus budget. This reduces spending levels and
economic growth. This is also known as a contractionary budget. There are times when
all three budget outcomes will be appropriate. If the economy is growing too quickly
then a surplus budget will slow the level of spending. If there is high unemployment and
low economic growth then a deficit budget will increase spending and create jobs and
economic growth. In the early years of the 1990s the Federal government ran deficit
budgets because of the high unemployment levels. However in the period after 1998 the
government had relative high economic growth and falling unemployment so ran surplus
budgets up till 2007. As a result of the Global Financial Crisis, Australia has run budget
deficits since 2008.
If there is too much spending in the economy this may cause prices to rise (inflation) and
a boom may occur. A boom generally means the economy has reached its capacity and
prices have risen and the growth can not be sustained that is why we see a downswing
following the boom in the business cycle. When the economy is growing at a steady rate
then a balanced budget may be most appropriate. The final sector is the overseas sector.
This involves transfers of money to and from overseas in exchange for goods and
services. When we sell goods and services overseas (exports) we receive money in
return. This money comes into the economy and is seen as an injection into the circular
flow. When we buy goods and services from overseas (imports) we pay money for them
and the money is withdrawn from the circular flow. The money is not being spent in
Australia creating demand and economic growth but is being spent buying overseas

30
production and as a result reduces income in Australia. Changes in our exports and
imports also influence economic activity in Australia. If exports (X) are greater than
imports (M), then the extra income being used to buy Australian goods and services will
lead to increased demand and higher economic growth in Australia. If M>X, then more
income is withdrawn from the circular flow and this slows the economy down (Figure
1.9).
Figure 1.9: The five sector circular flow of income model
It is not easy to control the level of exports and imports. Our export income is very
dependent on the demand from countries overseas, which we have no control over. Our
import levels often depend on whether we can buy the products in Australia and whether
we are having increased incomes and want to buy more goods and services from
31
overseas. In the period 2003 to 2012 Australia’s exports increased as a result of
increased demand from Asia, especially China. Similarly exports fall whenever we have
droughts, as rural output declines. The difference between exports and imports i.e. X
minus M is known as net exports. A positive level of net exports is expansionary and a
negative value is contractionary.
Equilibrium in the five sector model
The circular flow is in equilibrium when injections equal withdrawals. The injections
into the circular flow are investment (I), government expenditure (G) and exports (X).
The withdrawals are savings (S), taxation (T) and imports (M). The economy is stable at
equilibrium, so there is no incentive to change the levels of spending and economic
growth. Equilibrium occurs when I + G + X = S + T + M. This does not mean that at
this time that I=S and T=G and X=M but rather that the total level of injections equals
the total level of withdrawals from the circular flow. This is why many economists
consider that changes to the budget (G and T) are important in bringing about
equilibrium in the economy as the other factors, S, I, X and M are largely outside the
control or influence of the government.
Equilibrium in the circular flow does not occur very often as the levels of injections and
withdrawals continually change over time and the decisions especially to save, invest,
purchase exports and imports are done for different reasons by different groups both
within and outside the Australian economy.
When injections (I+G+X) are greater than withdrawals (S+T+M) more income is going
into the circular flow and that leads to increased demand and subsequently production.
The rise in production increases the economy’s economic growth and subsequently the
demand for labour and other resources. The economy will expand until injections and
leakages are equal. Economic growth in the economy is limited by the scarcity of
resources. An economy can not expand its production past full employment of resources.
When full employment is reached any increase in injections or demand creates inflation
(a rise in the general price level) not economic growth.
32
When injections are less than withdrawals less spending is taking place in the circular
flow. This reduces demand for production. Workers and other resources are laid off. The
unemployed workers reduce their spending as their income has declined. They may need
to draw on their savings to survive. So demand falls further and production and
economic growth continue to fall. The level of growth will decline until injections and
withdrawals are again equal. This time there will be higher unemployment and a lower
level of economic growth in the economy.
REVIEW YOUR LEARNING 1.9
Click on the powerpoint link of the instructor showing you how the Circular Flow
of Income operates and the effect of different levels of injections and withdrawals
on the Circular Flow and the economy. Circular Flow link.
REVIEW YOUR LEARNING 1.10
Copy the following passages and fill in the gaps.
The five main sectors of the economy, _________________, ___________________,
___________________, ___________________________, ____________________,
transfer funds between each other in exchange for __________________ and
________________. In a simple model, firms pay money to households in the form of
____________________________________________________. These payments are
made in return for the services of the factors of production, __________________,
_______________ and _________________________. The households use this money
to purchase __________________ produced goods and services.
Not all of the income in the economy is spent on domestically produced goods and
services. Some is withdrawn from the ________________ flow. The main withdrawals
or ________________ are __________________, _________________, and
_________________. The economic symbols for these are S, T and M.
33
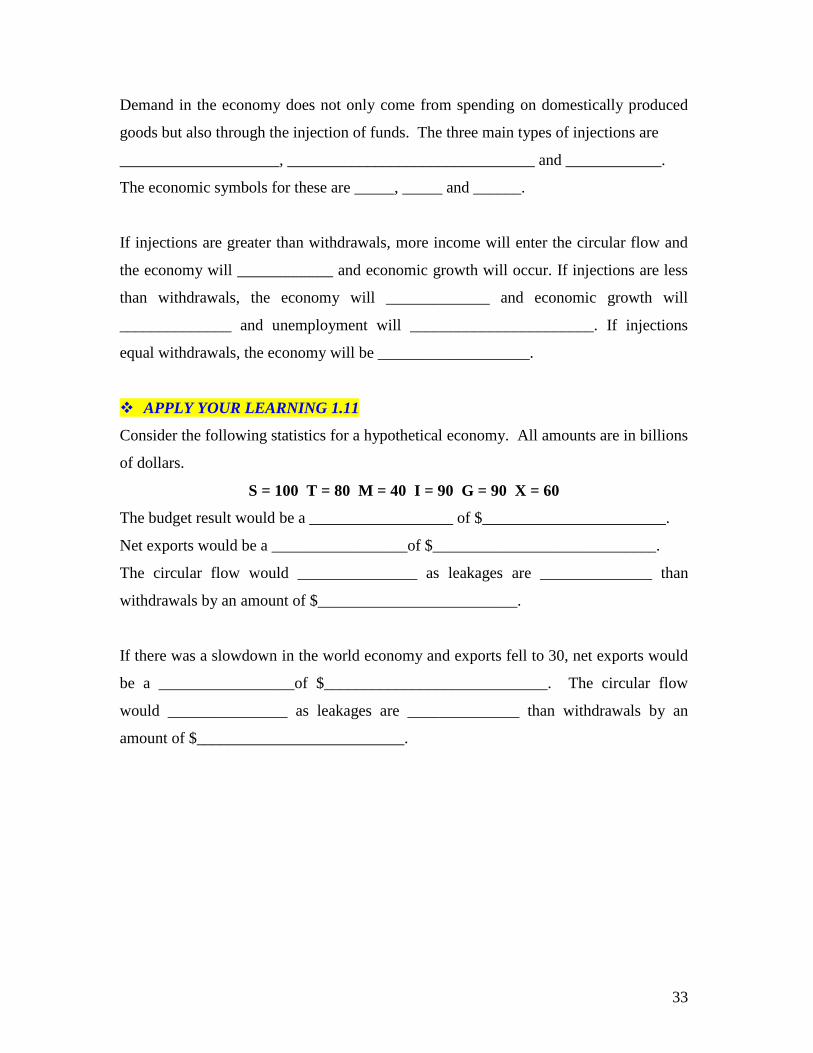
Demand in the economy does not only come from spending on domestically produced
goods but also through the injection of funds. The three main types of injections are
____________________, _______________________________ and ____________.
The economic symbols for these are _____, _____ and ______.
If injections are greater than withdrawals, more income will enter the circular flow and
the economy will ____________ and economic growth will occur. If injections are less
than withdrawals, the economy will _____________ and economic growth will
______________ and unemployment will _______________________. If injections
equal withdrawals, the economy will be ___________________.
APPLY YOUR LEARNING 1.11
Consider the following statistics for a hypothetical economy. All amounts are in billions
of dollars.
S = 100 T = 80 M = 40 I = 90 G = 90 X = 60
The budget result would be a __________________ of $_______________________.
Net exports would be a _________________of $____________________________.
The circular flow would _______________ as leakages are ______________ than
withdrawals by an amount of $_________________________.
If there was a slowdown in the world economy and exports fell to 30, net exports would
be a _________________of $____________________________. The circular flow
would _______________ as leakages are ______________ than withdrawals by an
amount of $__________________________.

34
ECONOMIES AND THEIR SIMILARITIES AND
DIFFERENCES
1.10 Similarities and differences between Australia and our Asian
neighbours
While all economies have the same basic five sectors, the influence each sector has over
the economy varies. Some countries have more people, some more land and some more
capital and technology. All of these factors, as well as the country’s history and
traditions impact on the type of economy that exists and the quality of life of its people.
The quality of life for the majority of Australians is quite high compared to other
economies. The 2014 Human Development Report (HDR) (based on 2013 data) ranks
Australia’s quality of life as the second highest in the world, after Norway. The main
factors that give Australia such a high ranking are our high life expectancy of 82.5 years
and the amount of education we receive, where Australia is ranked first in the world.
Australia’s economic growth as measured by Gross National Income (GNI) per capita
(PPP) is ranked only 20th in the world. These three criteria are used to measure quality of
life as it is believed that they will reflect a country’s overall standard of living.
Education is seen as a source of productivity and growth and a high quantity of
education ranking is considered as an indicator of opportunity for the people in a
country. In some countries in the world such as Niger, in Africa, less than 50 % of
children finish primary school and the rate for female completions is below 25 %. Life
expectancy also reflects your living standards. Countries with low living standards tend
to have short life expectancies. For example the life expectancy in Sierra Leone is less
than 46 years. A long life expectancy usually reflects good quantities and quality of
food, health and general living standards. The GNI per capita is measured in terms of
purchasing power parity (PPP). This tells you how much people living in a country can
buy with their money compared to someone in a different country. So a high GNI per
capita (PPP) means that the average person’s ability to buy goods and services is high

35
compared to the average person in a country with a low GNI per capita (PPP). For
example Australia’s GNI per capita (PPP) was $41,524 US in 2013 compared to only
$588 US in the Central African Republic, and $444 US in Congo. There are countries
with higher income than Australia who do not have as high a human development index.
For example the GNI of Qatar was $119,029 US and Kuwait $85,820 US. These nations
are highly reliant on income from oil exports. So the fall in world oil prices in the period
2014-16 had a considerable impact on their GNI and the overall standard of living of
their people.
1.11 Economic Growth and the Quality of Life in Asia
If we compare our quality of life with our Asian neighbours, we find that inhabitants of
East Asia and the Pacific have a life expectancy of 74.0 years and South Asia has a life
expectancy of 67.2 years. Income levels are also lower with an average GNI per capita
(PPP) of $10,499 US in East Asia and the Pacific and $5195 US in South Asia. Literacy
rates are also much lower in these regions with 95% in East Asia and the Pacific and
63% in South Asia, compared to 100% in Australia. It is important to note that a person
is measured as literate if they are over 15 years old and have completed Year 6 at school.
Let us consider what life is like in one of our closest neighbours in Asia, the Philippines.
The Philippines consists of 7107 islands. With a population of over 100 million people it
is the 7th most populated country in Asia and the 12th most populated country in the
world. The 2014 HDR ranked the Philippines 117 out of 187 nations. The life
expectancy at birth in the Philippines is 68.7 years and the GDP per capita is $2765 US.
The Philippines is considered a newly industrialised economy. It is moving from an
economy based on agricultural production to one based on manufacturing and service
industries. Since 2010, the Philippines’s Economic Growth Rate has averaged 6% per
annum.
1.12 Employment and unemployment in the Philippines
Despite rapid economic growth in the Philippines in recent years, unemployment
remains a persistent problem. Under President Benigno Aquino, in office since 2010,

36
unemployment has fallen. The latest figures show the rate at 5.6% in October 2015,
down from 6% a year earlier. But progress has been uneven and the Philippines still has
one of the highest rates of unemployment in the ASEAN region. One reason is that job
creation has struggled to keep pace with an ever-expanding population. In many years,
the number of people entering the job market has been greater than the number of jobs
created.
Table 1.4: Employment indicators in the Philippines
Indicator Oct 2015 Jul 2015 Oct 2014
Employment Rate 94.4 93.5 94.0
Underemployment
Rate 17.7 21.0 18.7
Labor Force
Participation Rate 63.3 62.9 64.3
Unemployment
Rate 5.6 6.5 6.0
In addition to the unemployment problem, there is also the issue of underemployed
workers. The total number of underemployed in October 2015 was estimated at 8
million. This corresponds to an underemployment rate of 17.7%.
1.13 Distribution of income in the Philippines
Despite the transition from agricultural production to one based on manufacturing and
service industries and a 6% annual growth rate in the last 5 years, the daily income of
45% of the population of the Philippines is less than $2 a day. For those who have a job,
the minimum wage is around 270 pesos1 a day but it varies between regions and
occupations. The gap between the country’s rich and poor is widening, with high-
earning individuals enjoying significantly faster growth in incomes compared with
people from the middle- and low-income classes.
1 There were approximately 33 pesos to an Australian dollar in 2016.

37
Figure 1.9: Poverty in the Philippines: A child collecting trash for income on a
dumpsite in the Philippines.
Source: Photo by Nigel Dickinson.
One of the main causes of income inequality in the Philippines can be traced to
educational inequality. Inequalities in income, as well as inequalities in labour and
education have provided barriers for Filipinos to participate in economic activities and
achieve higher living standards. Table demonstrated the relationship between the head of
the household’s level of educational achievement and poverty level.
Table 1.5: Poverty in 2009 by household head's educational attainment and their
level of poverty
Educational
Attainment of
Household Head
Poverty
Headcount Rate
Distribution of the
Poor
Distribution of the
Population
At Most Primary
Graduate 32.6 96.1 78.0
Some High School 7.5 3.3 11.7
Beyond High
School 1.6 0.6 10.3
Total 26.5 100.0 100.0
Source: Albert, Ramon Jose; Dumagan, Jesus; Martinez, Arturo (January 2015). "Inequalities
in Income, Labor, and Education: The Challenge of Inclusive Growth”

38
1.14 Environmental Sustainability in the Philippines
Despite the general view that the Philippines has a beautiful natural environment, it does
have considerable environmental issues. The Philippines suffers from human-caused
environmental degradation aggravated by a high annual population growth rate,
including loss of agricultural lands, deforestation, soil erosion, air and water pollution,
improper disposal of solid and toxic wastes, mismanagement and abuse of coastal
resources, and overfishing.
The neglect of a coherent environmental policy, in the past, has led to the situation,
where almost 60% of the groundwater is contaminated. The main source of pollution is
untreated domestic and industrial wastewater. Only one third of Philippine river systems
are considered suitable for public water supply. Many people rely on bottled water as
their only source of safe water. Besides severe health concerns, water pollution also
leads to problems in the fishing and tourism industries.
In addition, only 5% of the total population is connected to a sewer network. The vast
majority uses flush toilets connected to septic tanks. Since sludge treatment and disposal
facilities are rare, most effluents are discharged without treatment. While the Philippines
does have a Strategy for Sustainable Development (PSSD), the effects so far have been
limited.
Further environmental issues can be viewed at https://www.youtube.com/watch?v=2tPl-
jjLHCc
1.15 Role of the Philippines’s Government in health care, education
and social welfare.
The Philippines has limited social welfare and financial support for health and
education. The Philippine government through its Department of Social Welfare and
Development (DSWD) is mandated to protect poor households. But given limited
resources, the department has a limited scope for providing social welfare.

39
i. Unemployment Benefits: The current situation in the Philippines is that workers,
who lose their jobs, mostly (except GSIS-means public sector social insurance
members) have no unemployment insurance. However, there is a variety of laws and
benefits that give workers some kind of protection. Public employees can avail of a
regular unemployment benefit from GSIS (50% of the average monthly
compensation, maximum 6 months). To date, many public employees are on fixed
term contracts, so they are not protected by this provision.
ii Health Cover: The Philippine Health Insurance Corporation or Phil-Health, a
government agency, implements the National Health Insurance Act of 1995 through
the National Health Insurance Program (NHIP). Its mandate is to provide all citizens
with the mechanism to gain financial access to health services, in combination with
other government health programs. To date total coverage is estimated to be around
66% of the population. The biggest problem with the scheme is that it only pays part
of the cost of health care and the patients have to pay the rest. People, who are not
able to pay the part that exceeds PhilHelath reimbursement, get no treatment.
iii Age Pension: The Philippines has a retirement benefit, that is a cash benefit either in
monthly pension or lump sum paid to a member who can no longer work due to old
age. The value of that benefit is around 1200 pesos a month. That is equivalent to
less than $10 a week in Australian currency.
Education: From 1945 until 2011, the basic education system was composed of six years
of elementary education starting at the age of 6, and four years of high school education
starting at the age of 12. Further education was provided by technical or vocational
schools, or in higher education institutions such as universities. In 2011, the country
started to move from its old 10-year basic educational system to a K–12 educational
system, as mandated by the Department of Education. The new 12-year system is now
compulsory.
Higher Education in the Philippines is not available to everyone largely due to the cost.
The cost of university education varies widely, depending on the public or private nature
of the university or college. While some universities have tuition fees of around seven

40
thousand pesos per semester (P 7,000), other universities have tuition fee ranging from
P30,000 - P250,000 per semester. Many Filipinos can’t afford to send their children to
college or university because of the high tuition fee and other miscellaneous fees that
they need to pay.
The government has recognised the importance of education and good health. To
alleviate poverty and inequality, the Philippines has a conditional cash transfer (CCT)
program called Pantawid Pamilya, where over 4 million families get cash from the
government in exchange for keeping their children in school and taking them to regular
medical check-ups.
RESEARCHING AND APPLYING YOUR ECONOMIC LEARNING 1.12
Now let us consider life in the Philippines compared to that in Australia.
Using the information above, for the Philippines, and Google,
https://www.google.com.au for Australia, complete the following table comparing
economic indicators in the two nations.
Economic indicators Australia Philippines
Economic Growth Rate (GDP)
Unemployment rate
Minimum wage per day ($)
Percentage living in poverty (as measured
by income of less than $2 a day)
Weekly age pension ($)
Percentage of the population with
education above high school level
(a) What are the people in the picture doing? Why?
(b) Does this generally happen in Australia? What are some of the basic difference
between the two countries?

41
(c) How do the government’s provision of basic services like health care and education
compare in the Philippines and Australia?
(d) Do you think that you could live on the minimum wage in the Philippines? How do
you think they manage to live?
(e) How do the two countries compare in terms of environmental sustainability?
(f) How would you compare the quality of life in Australia compared to that in the
Philippines?
(g) Do you think that the people in the Philippines are benefitting from the higher
economic growth rate compared to Australia? Explain your answer.
APPLYING YOUR LEARNING 1.13
Multiple Choice Questions
1. Which of the following would apply in a world without scarcity?
(a) It would still be necessary to choose among alternatives.
(b) Opportunity costs would determine choices.
(c) All goods would be free.
(d) The market would determine all prices.
2. Which of the following is an example of capital in economics?
(a) The purchase of shares.
(b) Savings in a bank account.
(c) Stocks and bonds
(d) A factory
42
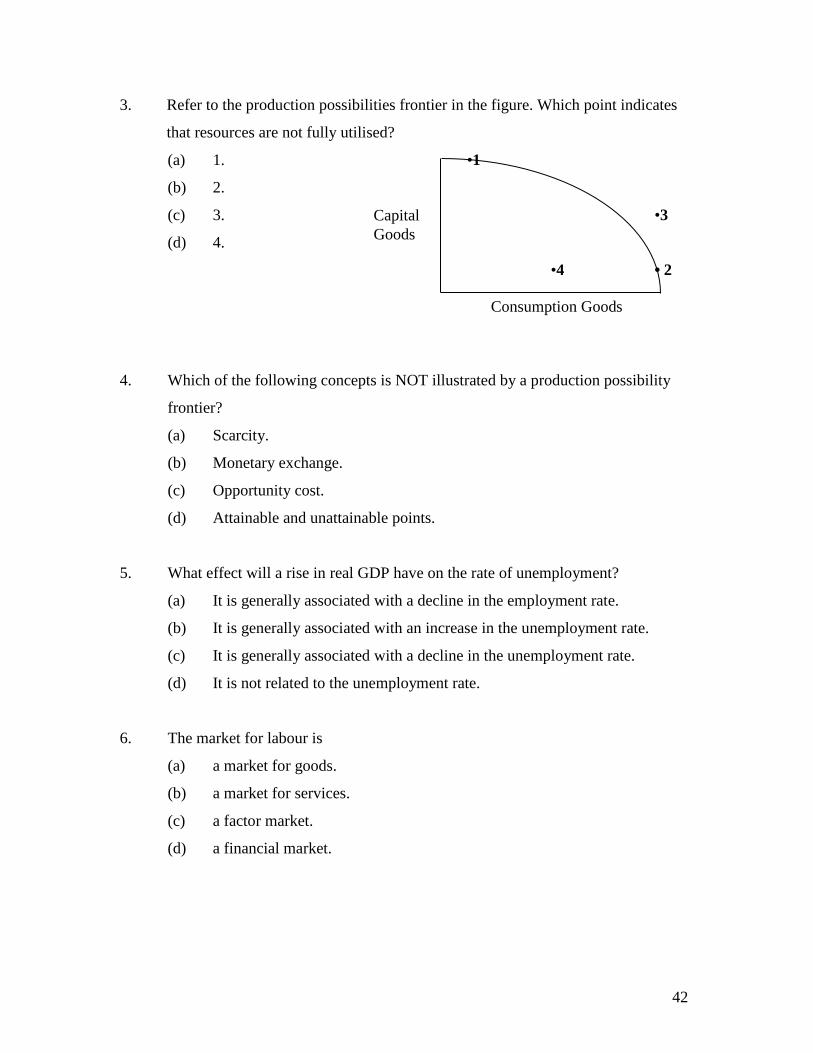
3. Refer to the production possibilities frontier in the figure. Which point indicates
that resources are not fully utilised?
(a) 1. •1
(b) 2.
(c) 3. •3
(d) 4.
•4 • 2
Consumption Goods
4. Which of the following concepts is NOT illustrated by a production possibility
frontier?
(a) Scarcity.
(b) Monetary exchange.
(c) Opportunity cost.
(d) Attainable and unattainable points.
5. What effect will a rise in real GDP have on the rate of unemployment?
(a) It is generally associated with a decline in the employment rate.
(b) It is generally associated with an increase in the unemployment rate.
(c) It is generally associated with a decline in the unemployment rate.
(d) It is not related to the unemployment rate.
6. The market for labour is
(a) a market for goods.
(b) a market for services.
(c) a factor market.
(d) a financial market.
Capital
Goods

43
7. What does the circular flow model demonstrate?
(a) It shows how nominal GDP is distinct from real GDP.
(b) It shows the effects of inflation in a simple economy.
(c) It shows the real flows and money flows between different sectors of the
economy.
(d) It shows the stocks of various sectors of the economy.
8. Which of the following is an example of an injection into the circular flow of
income?
(a) Exports.
(b) Taxation.
(c) Saving.
(d) Imports
9. Which of the following is an example of a leakage from the circular flow of
income?
(a) Exports.
(b) Investment.
(c) Saving.
(d) Subsidies.
10. The phases of the business cycle, in order, are
(a) contraction, expansion, boom, recession.
(b) expansion, boom, contraction, recession.
(c) boom, upswing, recession, downswing.
(d) recession, contraction, boom, expansion.

44
11. What does Australia's GDP measure?
(a) It is the wealth owned by Australians.
(b) It is the value of goods produced by Australian and overseas businesses.
(c) It is the value of intermediate goods and services produced in Australia.
(d) It is the value of final goods and services produced in Australia.
12. Which of the following is NOT a major economic resource?
(a) Land.
(b) Capital.
(c) Enterprise.
(d) Money.
13. What are the incomes received as payment for the four factors of production?
(a) money, profit, dividends, wages.
(b) interest, wages, salaries, commissions.
(c) wages, rent, interest, profit.
(d) rent, capital, wages, shares.
14. At which stage of the business cycle will economic growth be highest?
(a) Boom
(b) Expansion
(c) Contraction
(d) Recession
15. Which groups are directly involved in the industrial relations process?
(a) Employers and financial organisations.
(b) Employees and employers.
(c) Governments and employees.
(d) Governments and employers.

45
16. What is Investment used for?
(a) To earn interest.
(b) To earn profit.
(c) To purchase capital.
(d) To increase the level of savings.
17. What is production?
(a) The transformation of inputs into outputs by firms.
(b) The resources allocated by the government to industries.
(c) The value of all goods and services produced in a country.
(d) The provision of goods and services based on peoples' incomes.
18. Refer to the production possibility frontier below. If 20 units of X are currently
being produced, what would be the opportunity cost of producing 40 more units
of X?
(a) 40 units of X.
(b) 30 units of Y
(c) 40 units of Y
(d) 60 units of Y

46
The following information relates to questions 19 and 20.
S = 100, I = 80, G = 60, T = 50, X = 80, M = 80
19. In what phase would this economy be?
(a) Contracting.
(b) Expanding.
(c) In equilibrium.
(d) Highly inflationary.
20. What budget outcome would this economy have?
(a) Balanced.
(b) A surplus.
(c) A deficit.
(d) Undefined.
![Australian Centre for Education (ACE) for All Campuses.pdf · GEP Beginners 2 [j] GEP 1, arious GEP Various GEP6 arious GEP 7A, 7B, 8 [Various] GEP 9A, 9B, 10 Various GEP ITA, 11B](https://img.pdfslide.us/doc/110x75/5fa44d495ec9ac37f767e1bf/australian-centre-for-education-ace-for-all-campusespdf-gep-beginners-2-j.jpg)