Embed Size (px)
Citation preview
TOP MALAYSIA
SMALL CAP COMPANIES
30 JEWELS
2014 Edition
Disclosure & Disclaimer
All research is based on material compiled from data considered to be reliable at the time of writing, but RHB does not make any representation or warranty, express or implied, as to its accuracy, completeness or correctness. No part of this report is to be construed as an offer or solicitation of an offer to transact any securities or financial instruments whether referred to herein or otherwise. This report is general in nature and has been prepared for information purposes only. It is intended for circulation to the clients of RHB and its related companies. Any recommendation contained in this report does not have regard to the specific investment objectives, financial situation and the particular needs of any specific addressee. This report is for the information of addressees only and is not to be taken in substitution for the exercise of judgment by addressees, who should obtain separate legal or financial advice to independently evaluate the particular investments and strategies.
This report may further consist of, whether in whole or in part, summaries, research, compilations, extracts or analysis that has been prepared by RHB’s strategic, joint venture and/or business partners. No representation or warranty (express or implied) is given as to the accuracy or completeness of such information and accordingly investors should make their own informed decisions before relying on the same.
RHB, its affiliates and related companies, their respective directors, associates, connected parties and/or employees may own or have positions in securities of the company(ies) covered in this research report or any securities related thereto, and may from time to time add to, or dispose off, or may be materially interested in any such securities. Further, RHB, its affiliates and related companies do and seek to do business with the company(ies) covered in this research report and may from time to time act as market maker or have assumed an underwriting commitment in securities of such company(ies), may sell them or buy them from customers on a principal basis and may also perform or seek to perform significant investment banking, advisory or underwriting services for or relating to such company(ies), as well as solicit such investment, advisory or other services from any entity mentioned in this research report.
RHB and its employees and/or agents do not accept any liability, be it directly, indirectly or consequential losses, loss of profits or damages that may arise from any reliance based on this report or further communication given in relation to this report, including where such losses, loss of profits or damages are alleged to have arisen due to the contents of such report or communication being perceived as defamatory in nature.
The term “RHB” shall denote where applicable, the relevant entity distributing the report in the particular jurisdiction mentioned specifically herein below and shall refer to RHB Research Institute Sdn Bhd, its holding company, affiliates, subsidiaries and related companies.
All Rights Reserved. This report is for the use of intended recipients only and may not be reproduced, distributed or published for any purpose without prior consent of RHB and RHB accepts no liability whatsoever for the actions of third parties in this respect.
Malaysia
This report is published and distributed in Malaysia by RHB Research Institute Sdn Bhd (233327-M), Level 11, Tower One, RHB Centre, Jalan Tun Razak, 50400 Kuala Lumpur, a wholly-owned subsidiary of RHB Investment Bank Berhad (RHBIB), which in turn is a wholly-owned subsidiary of RHB Capital Berhad. This book was printed by: Xpress Print (KL) Sdn. Bhd. No. 17 Jalan Lima, Off Jalan Chan Sow Lin, 55200 Kuala Lumpur, Malaysia.
Singapore
This report is published and distributed in Singapore by DMG & Partners Research Pte Ltd (Reg. No. 200808705N), a wholly-owned subsidiary of DMG & Partners Securities Pte Ltd, a joint venture between Deutsche Asia Pacific Holdings Pte Ltd (a subsidiary of Deutsche Bank Group) and OSK Investment Bank Berhad, Malaysia which have since merged into RHB Investment Bank Berhad (the merged entity is referred to as “RHBIB”, which in turn is a wholly-owned subsidiary of RHB Capital Berhad). DMG & Partners Securities Pte Ltd is a Member of the Singapore Exchange Securities Trading Limited. DMG & Partners Securities Pte Ltd may have received compensation from the company covered in this report for its corporate finance or its dealing activities; this report is therefore classified as a non-independent report.
As of 8 April 2014, DMG & Partners Securities Pte Ltd and its subsidiaries, including DMG & Partners Research Pte Ltd do not have proprietary positions in the securities covered in this report, except for: a) -
As of 8 April 2014, none of the analysts who covered the securities in this report has an interest in such securities, except for:a) -
Special Distribution by RHB
Where the research report is produced by an RHB entity (excluding DMG & Partners Research Pte Ltd) and distributed in Singapore, it is only distributed to “Institutional Investors”, “Expert Investors” or “Accredited Investors” as defined in the Securities and Futures Act, CAP. 289 of Singapore. If you are not an “Institutional Investor”, “Expert Investor” or “Accredited Investor”, this research report is not intended for you and you should disregard this research report in its entirety. In respect of any matters arising from, or in connection with this research report, you are to contact our Singapore Office, DMG & Partners Securities Pte Ltd

Kuala Lumpur Hong Kong SingaporeMalaysia Research Office
RHB Research Institute Sdn BhdLevel 11, Tower One, RHB Centre
Jalan Tun RazakKuala Lumpur
MalaysiaTel : +(60) 3 9280 2185Fax : +(60) 3 9284 8693
RHB OSK Securities Hong Kong Ltd. (formerly known as OSK Securities
Hong Kong Ltd.)12th Floor
World-Wide House19 Des Voeux RoadCentral, Hong Kong
Tel : +(852) 2525 1118Fax : +(852) 2810 0908
DMG & Partners Securities Pte. Ltd.
10 Collyer Quay#09-08 Ocean Financial Centre
Singapore 049315Tel : +(65) 6533 1818Fax : +(65) 6532 6211
Jakarta Shanghai Phnom PenhPT RHB OSK Securities Indonesia
(formerly known as PT OSK NusadanaSecurities Indonesia)
Plaza CIMB Niaga14th Floor
Jl. Jend. Sudirman Kav.25Jakarta Selatan 12920, Indonesia
Tel : +(6221) 2598 6888Fax : +(6221) 2598 6777
RHB OSK (China) Investment Advisory Co. Ltd. (formerly known as OSK (China)
Investment Advisory Co. Ltd.)Suite 4005, CITIC Square1168 Nanjing West Road
Shanghai 20041China
Tel : +(8621) 6288 9611Fax : +(8621) 6288 9633
RHB OSK Indochina Securities Limited (formerly known as OSK Indochina Securities
Limited)No. 1-3, Street 271
Sangkat Toeuk Thla, Khan Sen SokPhnom Penh
CambodiaTel: +(855) 23 969 161Fax: +(855) 23 969 171
BangkokRHB OSK Securities (Thailand) PCL (formerly
known as OSK Securities (Thailand) PCL)10th Floor, Sathorn Square Office Tower
98, North Sathorn Road, SilomBangrak, Bangkok 10500
ThailandTel: +(66) 862 9999Fax : +(66) 108 0999
Hong Kong
This report is published and distributed in Hong Kong by RHB OSK Securities Hong Kong Limited (“RHBSHK”) (formerly known as OSK Securities Hong Kong Limited), a subsidiary of OSK Investment Bank Berhad, Malaysia which have since merged into RHB Investment Bank Berhad (the merged entity is referred to as “RHBIB”), which in turn is a wholly-owned subsidiary of RHB Capital Berhad.
RHBSHK, RHBIB and/or other affiliates may beneficially own a total of 1% or more of any class of common equity securities of the subject company. RHBSHK, RHBIB and/or other affiliates may, within the past 12 months, have received compensation and/or within the next 3 months seek to obtain compensation for investment banking services from the subject company.
Risk Disclosure Statements
The prices of securities fluctuate, sometimes dramatically. The price of a security may move up or down, and may become valueless. It is as likely that losses will be incurred rather than profit made as a result of buying and selling securities. Past performance is not a guide to future performance. RHBSHK does not maintain a predetermined schedule for publication of research and will not necessarily update this report
Indonesia
This report is published and distributed in Indonesia by PT RHB OSK Securities Indonesia (formerly known as PT OSK Nusadana Securities Indonesia), a subsidiary of OSK Investment Bank Berhad, Malaysia, which have since merged into RHB Investment Bank Berhad, which in turn is a wholly-owned subsidiary of RHB Capital Berhad.
Thailand
This report is published and distributed in Thailand by RHB OSK Securities (Thailand) PCL (formerly known as OSK Securities (Thailand) PCL), a subsidiary of OSK Investment Bank Berhad, Malaysia, which have since merged into RHB Investment Bank Berhad, which in turn is a wholly-owned subsidiary of RHB Capital Berhad.
Other Jurisdictions
In any other jurisdictions, this report is intended to be distributed to qualified, accredited and professional investors, in compliance with the law and regulations of the jurisdictions.

<This page has been left blank intentionally>
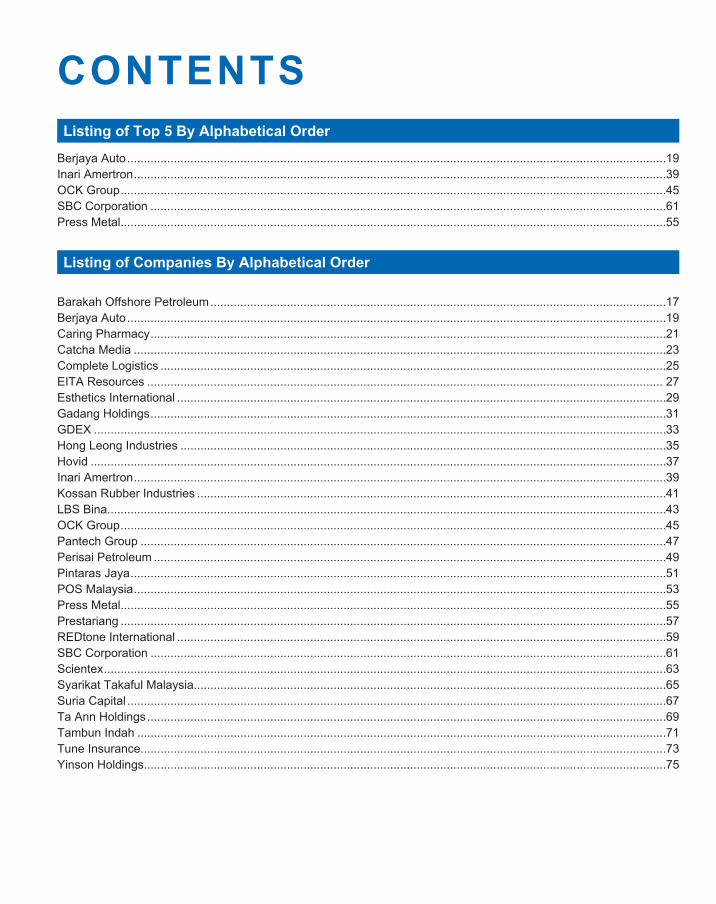
Berjaya Auto ..................................................................................................................................................................19Inari Amertron ................................................................................................................................................................39OCK Group ....................................................................................................................................................................45 SBC Corporation ...........................................................................................................................................................61Press Metal....................................................................................................................................................................55
Listing of Companies By Alphabetical Order
Barakah Offshore Petroleum .........................................................................................................................................17Berjaya Auto ..................................................................................................................................................................19Caring Pharmacy ...........................................................................................................................................................21Catcha Media ................................................................................................................................................................23 Complete Logistics ........................................................................................................................................................25EITA Resources ........................................................................................................................................................... 27Esthetics International ...................................................................................................................................................29Gadang Holdings ...........................................................................................................................................................31GDEX ............................................................................................................................................................................33Hong Leong Industries ..................................................................................................................................................35Hovid .............................................................................................................................................................................37Inari Amertron ................................................................................................................................................................39Kossan Rubber Industries .............................................................................................................................................41LBS Bina........................................................................................................................................................................43OCK Group ....................................................................................................................................................................45Pantech Group ..............................................................................................................................................................47Perisai Petroleum ..........................................................................................................................................................49Pintaras Jaya .................................................................................................................................................................51POS Malaysia ................................................................................................................................................................53Press Metal....................................................................................................................................................................55Prestariang ....................................................................................................................................................................57REDtone International ...................................................................................................................................................59SBC Corporation ...........................................................................................................................................................61Scientex .........................................................................................................................................................................63Syarikat Takaful Malaysia..............................................................................................................................................65Suria Capital ..................................................................................................................................................................67Ta Ann Holdings ............................................................................................................................................................69Tambun Indah ...............................................................................................................................................................71Tune Insurance..............................................................................................................................................................73Yinson Holdings.............................................................................................................................................................75
CONTENTSListing of Top 5 By Alphabetical Order
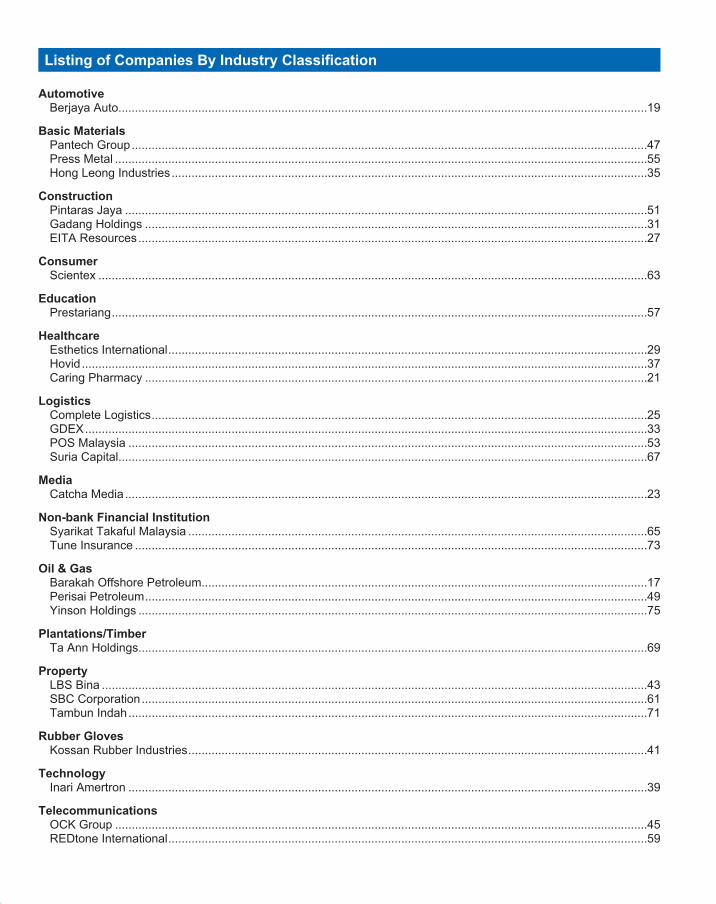
Listing of Companies By Industry Classification
Automotive Berjaya Auto...............................................................................................................................................................19
Basic Materials Pantech Group ...........................................................................................................................................................47 Press Metal ................................................................................................................................................................55 Hong Leong Industries ...............................................................................................................................................35
Construction Pintaras Jaya .............................................................................................................................................................51 Gadang Holdings .......................................................................................................................................................31 EITA Resources .........................................................................................................................................................27
Consumer Scientex .....................................................................................................................................................................63
Education Prestariang .................................................................................................................................................................57
Healthcare Esthetics International ................................................................................................................................................29 Hovid ..........................................................................................................................................................................37 Caring Pharmacy .......................................................................................................................................................21
Logistics Complete Logistics .....................................................................................................................................................25 GDEX .........................................................................................................................................................................33 POS Malaysia ............................................................................................................................................................53 Suria Capital...............................................................................................................................................................67
Media Catcha Media .............................................................................................................................................................23
Non-bank Financial Institution Syarikat Takaful Malaysia ..........................................................................................................................................65 Tune Insurance ..........................................................................................................................................................73
Oil & Gas Barakah Offshore Petroleum......................................................................................................................................17 Perisai Petroleum .......................................................................................................................................................49 Yinson Holdings .........................................................................................................................................................75
Plantations/Timber Ta Ann Holdings.........................................................................................................................................................69
Property LBS Bina ....................................................................................................................................................................43 SBC Corporation ........................................................................................................................................................61 Tambun Indah ............................................................................................................................................................71
Rubber Gloves Kossan Rubber Industries ..........................................................................................................................................41
Technology Inari Amertron ............................................................................................................................................................39
Telecommunications OCK Group ................................................................................................................................................................45 REDtone International ................................................................................................................................................59

FOREWORDWe proudly welcome you back to the RHB Top Malaysia Small Cap Companies book. This edition marks
the 10th anniversary of a publication that saw its humble beginnings in 2005.
RHB Investment Bank fully intends to continue the OSK legacy of sifting through lesser known companies in search of undiscovered and under-researched gems that we hope to nurture and promote into glittering Jewels. Our small cap franchise has been painstakingly built-up over the past decade, with the Malaysia book complemented by similar publications from our research teams in Singapore, Thailand and Indonesia. This compendium offers a unique Pan-Asean repository of reports and ideas on 125 companies that remain unmatched in the region.
RHB Research continues to have the broadest investment research coverage in Malaysia. We actively cover 170 stocks – up from 155 last year – that are a blend of large, mid and small cap companies, supplemented by a steady stream of non-rated research ideas. Our team of experienced analysts continuously seek out new ideas and go where no investor has been to uncover alpha for our clients. The continuous addition of new smaller capitalised companies into our coverage list reflects the vibrant Malaysian economy and strong entrepreneurial spirit. In time, we hope to see these companies graduating to the mid and large tier categories.
RHB Research is always grateful to the management teams of the companies we cover, for their time freely given to explain how their business models operate and to elaborate on their future growth strategies. The 2014 Edition of the Top Malaysia Small Cap Companies book is the culmination of endless hours of visits, meetings with managements, fact checking and re-checking by the RHB Malaysia Research Team, and is the distillation of our best ideas. We remain motivated by, and thankful for, the support and encouragement of the esteemed clients of RHB Investment Bank.
RHB Malaysia ResearchRHB Research Institute Sdn Bhd
29 April 2014
Research

11Top Malaysia Small Cap Companies 2014
Introduction
We proudly present the 10th Anniversary Edition of the RHB Top Malaysia Small Cap Companies Book. The 2014 Edition also returns to its normal slot in our event calendar after being delayed in 2013 due to the then ongoing RHB-OSK merger process. The RHB Asean Small Cap Compendium comprising of complementary publications from Malaysia, Singapore, Thailand and Indonesia is still believed to be the largest annual repository of small cap stock ideas from across the region. This year’s book continues to feature 30 “Jewels”. We have tried to ensure that the selection provides a diverse mix of companies representing a broad spectrum of the overall market.
Since last year’s book, smaller cap companies continue to provide superior returns. Small cap stocks, as measured by the FBM Small Cap Index (FBMSCI) and FBM Fledgling Index (FBMFI) have generated returns of 14.0% and 29.5% respectively compared to the 3.2% for the FBMKLCI over the same period. In addition to coming from a smaller base, we believe the strong outperformances of these companies are a reflection of their strong entrepreneurial drive and sprit that encourages innovation and ingenuity.
In this year’s stock selection process, the rules of engagement were relatively simple. We limited the market capitalisation of the stocks to not more than MYR3bn (no lower limit) and not impose any liquidity hurdle as we expect liquidity concerns to gradually diminish as the companies grow. Kossan Rubber is the largest cap stock at MYR2.73bn, while at the opposite end, Complete Logistics is the smallest at MYR87m. We note that 83% of this year’s Jewels have a market cap of less than MYR2bn. Our effort to provide a broad selection of stocks has also been successful with 15 sectors represented compared to 13 last year and 12 the year before. As in previous years, other than spread and size considerations, key screening variables include management credibility, industry fundamentals, earnings growth potential and track record.
Our 2014 Jewels are broadly in line with the RHB top down view of the market where our key OVERWEIGHT sectors are Banks, Oil & Gas, Property, Plantations and Construction. While the banking sector is comprised of large cap entities, we have strong representation from the Oil & Gas, Property, Construction, Logistics, Basic Materials and Healthcare sectors. The 12 Jewels unearthed in 2014 include Hong Leong Industries (Basic Materials), Gadang (Construction), EITA (Construction), Hovid (Healthcare), Complete Logistics (Logistics), GDEX (Logistics), Barakah (O&G), LBS Bina (Property), SBC Corporation (Property), Inari Amertron (Technology), OCK and REDtone International (both Telecommunications). The average P/E of our 2014 Jewels is 16.6x with a three-year net profit CAGR of 32%.
While investment in small cap companies can be hugely profitable, they are also sometimes not for the faint of heart owing to their greater inherent volatility. Other investment risks that are typical for these stocks include liquidity constrictions, more limited financial and corporate governance track record. We hope this book will come in useful to help you make your investment decisions.
Happy investing!
Top Malaysia Small Cap Companies 2014

22Top Malaysia Small Cap Companies 2014
Figure 1: Distribution by sector
Auto3%
Basic Materials10%
Construction10%
Consumer3%
Education3%
Healthcare10%
Logistics13%
Media3%
NBFI7%
Oil & Gas10%
Plantations/Timber
3%
Property10%
Rubber Gloves3%
Technology3%
Telecoms7%
Source: RHB
Figure 2: Distribution by market cap (MYRm)
2,500m-3,000m7%
2,000m-2,500m10%
1,500m-2,000m13%
1,000m-1,500m13%
500m -1,000m23%
0-500m34%
Figure 3: FBMSCI vs FBMKLCI vs FBMFI
0
2,000
4,000
6,000
8,000
10,000
12,000
14,000
16,000
18,000
20,000
1,550
1,600
1,650
1,700
1,750
1,800
1,850
1,900
Jul2013
Aug2013
Sep2013
Oct2013
Nov2013
Dec2013
Jan2014
Feb2014
Mar2014
FBMKLCI (LHS) FBMSCI (RHS) FBMFL (RHS)
Figure 4: Number of stocks by sector
Sector 2013 2012 2011Auto 1 0 2Basic Materials 3 3 0Conglomerate 0 0 0Construction 3 5 2Consumer 1 4 6Education 1 1 2Finance 0 0 0Industrials 0 1 0Insurance 2 1 2Healthcare 3 0 0Logistics 4 2 2Media 1 1 1Oil and Gas 3 5 5Others 0 0 1Plantations/Timber 1 2 0Ports 0 1 0Property 3 3 3REIT 0 0 0Rubber gloves 1 0 2Steel and Metals 0 0 2Technology 1 0 0Telecoms 2 1 0Total 30 30 30
Source: RHB
Source: Bloomberg
Source: RHB
Top Malaysia Small Cap Companies 2014

33Top Malaysia Small Cap Companies 2014
Figure 5: 2013’s small caps relative share price performance
-40% -20% 0% 20% 40% 60% 80% 100% 120%
TDMScientex
Malton BhdKKB Engineering
DayangIntegrax
Freight ManagementTambun Indah
WellcallNTPM Holdings^
ProtascoUzma
Syarikat Takaful MalaysiaCBIP
PrestariangCahya Mata Sarawak
Brahim'sDeleum
FBMKLCIFBM Small Cap
FBMFl
% change 30 Jul 2013 - 8 Apr 2014
Wah SeongPos Malaysia^NaimPantech^Alam MaritimKimLunHai -O^Media PrimaHua Yang Bhd^Ahmad Zaki ResourcesInstacomEversendai
How our 2013 picks fared
Looking back at the stocks featured in the 2013 Edition, 18 of the 30 stocks recorded positive returns and outperformed the FBM KLCI with an average gain of 44.4%. With the FBM Small Cap Index (FBM SCI) having outperformed the FBM KLCI in 2013 by over 10%, 14 stocks delivered returns in excess of the 14.0% posted by the FBM SCI, or an average 54.2% outperformance. The top ranking stocks by share price returns were Deleum, up 97.1% followed by Brahim (+82.8%), Cahya Mata Sarawak (+82.1%) and Prestariang (+74.1%). With the exception of Instacom which underwhelmed expectations, four of the five top picks posted spectacular returns averaging 63.5% in 2013. Eversendai (-31.4%) was the worst performer of our 2013 small cap selection.
Source: Bloomberg
Top Malaysia Small Cap Companies 2014

44Top Malaysia Small Cap Companies 2014
Market capitalisation of the Top 30 (MYRm)
0 400 800 1,200 1,600 2,000 2,400 2,800
Complete Logistics
Catcha Media
EITA Resources
Esthetics International
Gadang Holdings
Hovid
SBC Corporation
REDtone International
OCK Group
Caring Pharmacy
Pintaras Jaya
Pantech Group
Suria Capital
Tambun Indah
LBS Bina
Prestariang
Barakah OffshorePetroleum
Press Metal
Scientex
Inari Amertron
GDEX
Tune Insurance
Ta Ann Holdings
Perisai Petroleum
Berjaya Auto
Hong Leong Industries
Takaful Malaysia
Yinson Holdings
POS Malaysia
Kossan RubberIndustries
Source: Bloomberg
FY13 Return on Equity (ROE) of the Top 30 (%)
Catcha Media
-20% 0% 20% 40% 60% 80%
Press Metal
Esthetics International
Suria Capital
Gadang Holdings
Ta Ann Holdings
SBC Corporation
Perisai Petroleum
EITA Resources
Hong Leong Industries
Complete Logistics
Pantech Group
Yinson Holdings
Hovid
POS Malaysia
Scientex
OCK Group
Pintaras Jaya
Kossan Rubber Industries
GDEX
Tambun Indah
Takaful Malaysia
REDtone International
Barakah Offshore Petroleum
Tune Insurance
Inari Amertron
Berjaya Auto
Caring Pharmacy
Prestariang
LBS Bina
Source: Company Data
Top Malaysia Small Cap Companies 2014
55Top Malaysia Small Cap Companies 2014
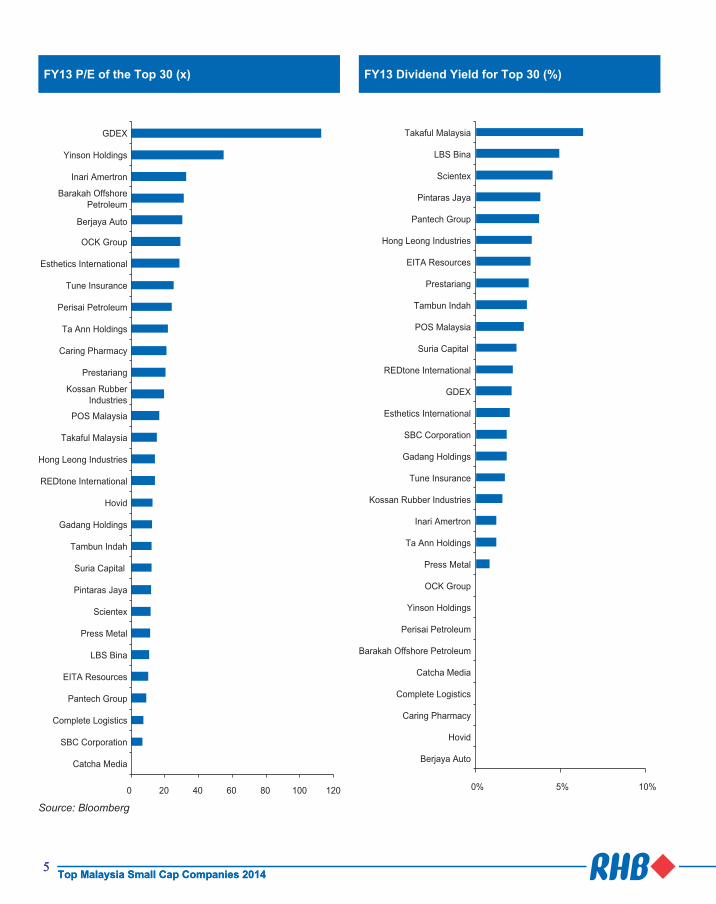
FY13 P/E of the Top 30 (x)
0 20 40 60 80 100 120
Catcha Media
SBC Corporation
Complete Logistics
Pantech Group
EITA Resources
LBS Bina
Press Metal
Scientex
Pintaras Jaya
Suria Capital
Tambun Indah
Gadang Holdings
Hovid
REDtone International
Hong Leong Industries
Takaful Malaysia
POS Malaysia
Kossan RubberIndustries
Prestariang
Caring Pharmacy
Ta Ann Holdings
Perisai Petroleum
Tune Insurance
Esthetics International
OCK Group
Berjaya Auto
Barakah OffshorePetroleum
Inari Amertron
Yinson Holdings
GDEX
FY13 Dividend Yield for Top 30 (%)
0% 5% 10%
Berjaya Auto
Hovid
Caring Pharmacy
Complete Logistics
Catcha Media
Barakah Offshore Petroleum
Perisai Petroleum
Yinson Holdings
OCK Group
Press Metal
Ta Ann Holdings
Inari Amertron
Kossan Rubber Industries
Tune Insurance
Gadang Holdings
SBC Corporation
Esthetics International
GDEX
REDtone International
Suria Capital
POS Malaysia
Tambun Indah
Prestariang
EITA Resources
Hong Leong Industries
Pantech Group
Pintaras Jaya
Scientex
LBS Bina
Takaful Malaysia
Source: Bloomberg
Top Malaysia Small Cap Companies 2014

66Top Malaysia Small Cap Companies 2014
The Screening Methodology
The selection of the 30 companies are guided by the following:-
• Market Capitalisation* (<= MYR3bn)• Profit and management track record• Price earnings ratio (P/E)• Price to NTA (P/NTA)• Net gearing• Return on Equity (ROE)• Compounded Annual Growth Rate (CAGR)• Dividend prospects• Stock and industry related factors
* the actual market capitalisation of the stocks may differ slightly based on the closing stock prices used for publication
The companies are ranked by the following parameters:-
• Lowest FY14 P/E• Lowest FY14 Price/Book Value• Highest FY14 Dividend Yield• Highest FY14 ROE• Highest 3 year EPS CAGR• Lowest Price/Earnings Growth (PEG)• Lowest Relative Sector P/E
The sectors represented in the 2014 Edition are:
• Automotive• Basic Materials• Construction• Consumer• Education• Healthcare• Logistics• Media• Non-bank financial institutions/Insurance• Oil & Gas• Plantations/Timber• Property• Rubber Gloves• Technology• Telecoms
Top Malaysia Small Cap Companies 2014

77Top Malaysia Small Cap Companies 2014
Ranking Based on Forward FY14 P/E (x)
Stock (X)
1 Press Metal 5.97
2 Complete Logistics 6.02
3 SBC Corporation 6.91
4 Gadang Holdings 7.06
5 EITA Resources 8.55
6 Tambun Indah 8.64
7 Scientex 8.92
8 Pintaras Jaya 9.88
9 Pantech Group 9.90
10 Barakah Offshore Petroleum 10.35
Source: RHB estimates
Ranking Based on Forward FY14 P/BV(x)
Stock (X)
1 GDEX 19.72
2 Prestariang 7.07
3 Catcha Media 6.16
4 Berjaya Auto 6.04
5 Inari Amerton 5.49
6 Yinson Holdings 4.15
7 Barakah Offshore Petroleum 4.02
8 OCK Group 3.90
9 Tune Insurance 3.82
10 Caring Pharmacy 3.71
Source: RHB estimates
Top Malaysia Small Cap Companies 2014
88Top Malaysia Small Cap Companies 2014
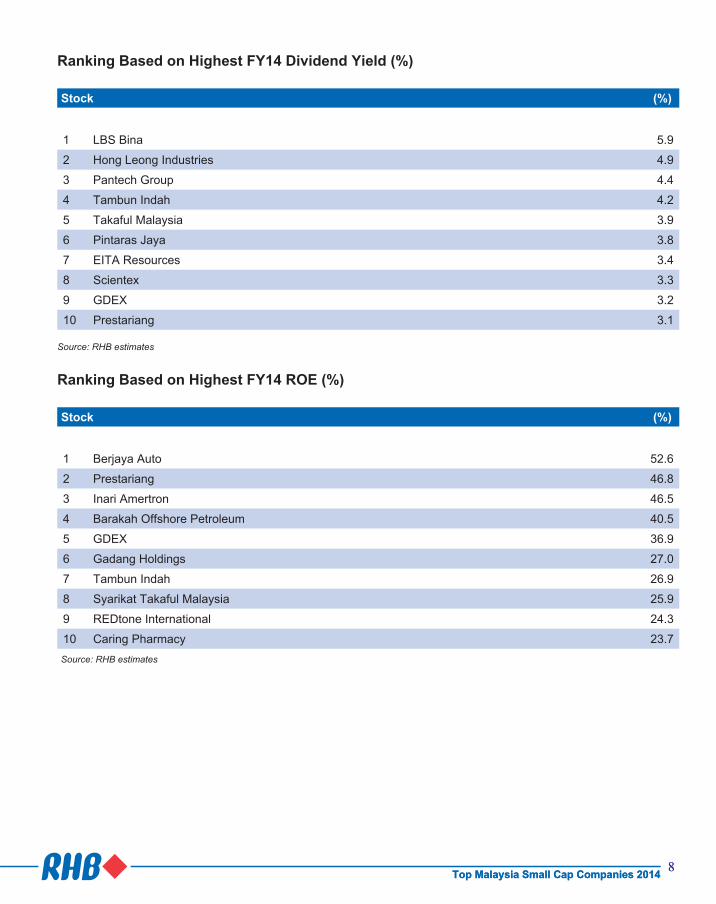
Ranking Based on Highest FY14 Dividend Yield (%)
Stock (%)
1 LBS Bina 5.9
2 Hong Leong Industries 4.9
3 Pantech Group 4.4
4 Tambun Indah 4.2
5 Takaful Malaysia 3.9
6 Pintaras Jaya 3.8
7 EITA Resources 3.4
8 Scientex 3.3
9 GDEX 3.2
10 Prestariang 3.1
Source: RHB estimates
Ranking Based on Highest FY14 ROE (%)
Stock (%)
1 Berjaya Auto 52.6
2 Prestariang 46.8
3 Inari Amertron 46.5
4 Barakah Offshore Petroleum 40.5
5 GDEX 36.9
6 Gadang Holdings 27.0
7 Tambun Indah 26.9
8 Syarikat Takaful Malaysia 25.9
9 REDtone International 24.3
10 Caring Pharmacy 23.7 Source: RHB estimates
Top Malaysia Small Cap Companies 2014

99Top Malaysia Small Cap Companies 2014
Ranking based on Highest 3-Year CAGR (FY11-FY14) (%)
Stock (%)
1 Inari Amertron 71.24
2 Tambun Indah 58.72
3 GDEX 57.33
4 Complete Logistics 55.36
5 Perisai Petroleum 51.48
6 Berjaya Auto 48.46
7 Takaful Malaysia 45.68
8 SBC Corporation 37.08
9 Yinson Holdings 36.15
10 Kossan Rubber Industries 26.50
Ranking based on lowest PEG (x)
Stock (X)
1 Complete Logistics 0.11
2 Tambun Indah 0.15
3 SBC Corporation 0.19
4 Inari Amertron 0.20
5 Press Metal 0.24
6 Berjaya Auto 0.29
7 Takaful Malaysia 0.29
8 Scientex 0.39
9 Pantech Group 0.41
10 LBS Bina 0.44
Source: RHB estimates
Top Malaysia Small Cap Companies 2014
1010Top Malaysia Small Cap Companies 2014
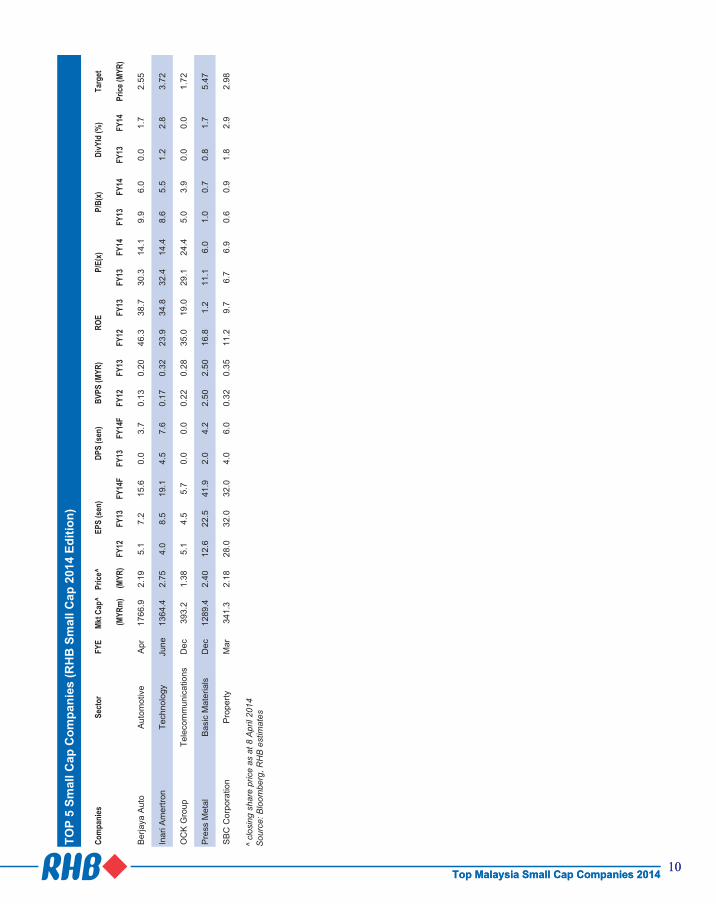
TOP
5 S
mal
l Cap
Com
pani
es (R
HB
Sm
all C
ap 2
014
Edi
tion)
Com
pani
es
Sect
orFY
EMk
t Cap
^Pr
ice^
)EPS
(sen
)DP
S (s
en)
BVPS
(MYR
) RO
E P/
E(x)
P/B(
x)Di
vYld
(%)
Targ
et
(MYR
m)
(MYR
)FY
12FY
13FY
14F
FY13
FY14
FFY
12FY
13FY
12FY
13FY
13FY
14FY
13FY
14FY
13FY
14Pr
ice (M
YR)
Ber
jaya
Aut
oA
utom
otiv
eA
pr17
66.9
2.19
5.1
7.2
15.6
0.0
3.7
0.13
0.20
46.3
38.7
30.3
14.1
9.9
6.0
0.0
1.7
2.55
Inar
i Am
ertro
nTe
chno
logy
June
1364
.42.
754.
08.
519
.14.
57.
60.
170.
3223
.934
.832
.414
.48.
65.
51.
22.
83.
72
OC
K G
roup
Tele
com
mun
icat
ions
Dec
393.
21.
385.
14.
55.
70.
00.
00.
220.
2835
.019
.029
.124
.45.
03.
90.
00.
01.
72
Pre
ss M
etal
Bas
ic M
ater
ials
Dec
1289
.42.
4012
.622
.541
.92.
04.
22.
502.
5016
.81.
211
.16.
01.
00.
70.
81.
75.
47
SB
C C
orpo
ratio
nP
rope
rtyM
ar34
1.3
2.18
28.0
32.0
32.0
4.0
6.0
0.32
0.35
11.2
9.7
6.7
6.9
0.6
0.9
1.8
2.9
2.98
^ cl
osin
g sh
are
pric
e as
at 8
Apr
il 20
14S
ourc
e: B
loom
berg
, RH
B e
stim
ates
Top Malaysia Small Cap Companies 2014

1111Top Malaysia Small Cap Companies 2014
Top
Sec
tor
Pic
ks (R
HB
Sm
all C
ap 2
014
Edi
tion)
Sect
orCo
mpa
nies
FY
EMk
t Cap
^Pr
ice^
EPS
(sen
)DP
S (s
en)
BVPS
(MYR
) RO
E (%
) P/
E(x)
P/B(
x)Di
vYld
(%)
Targ
et
(MYR
m)
(MYR
)FY
12FY
13FY
14F
FY13
FY14
FFY
12FY
13FY
12FY
13FY
13FY
14F
FY12
FY13
FY13
FY14
F(M
YR)
Aut
oB
erja
ya A
uto
Apr
il17
66.9
2.19
5.7
7.2
15.6
0.0
3.7
0.2
0.2
46.6
38.7
30.3
14.1
14.6
9.9
0.0
1.7
2.6
Bas
ic M
ater
ials
Pre
ss M
etal
Dec
1289
.35
2.50
13.5
22.5
41.9
2.0
4.2
2.5
2.5
16.8
1.2
11.1
6.0
1.0
1.0
0.8
1.7
5.47
Con
stru
ctio
nP
inta
ras
Jaya
Jun
522.
023.
2622
.428
.033
.012
.513
.01.
51.
715
.720
.611
.69.
92.
21.
93.
83.
84.
61
Con
sum
erS
cien
tex
Jul
1293
.76
5.85
39.0
51.2
65.6
26.6
19.4
2.4
2.9
16.9
19.1
11.4
8.9
2.4
2.0
4.5
3.3
7.19
Edu
catio
nP
rest
aria
ngD
ec85
8.00
3.90
16.9
19.1
23.1
12.0
12.0
0.4
0.4
50.9
47.6
20.4
16.9
10.8
8.8
3.1
3.1
4.90
Hea
lthca
reC
arin
g P
harm
acy
May
426.
711.
978.
49.
411
.74.
75.
7-
0.5
-41
.220
.816
.7-
4.28
0.0
2.4
2.57
Logi
stic
sS
uria
Cap
ital
Dec
733.
822.
5918
.821
.723
.06.
28.
02.
83.
08.
37.
511
.911
.30.
90.
92.
43.
13.
5
Med
iaC
atch
a M
edia
Dec
115.
790.
86-1
0.3
-5.5
-2.6
0.0
0.0
0.2
0.2
18.8
-12.
3nm
nm4.
15.
30.
00.
00.
86
NB
FIS
yarik
at T
akaf
ul
Mal
aysi
aD
ec21
17.0
12.3
659
.285
.496
.882
.050
.43.
13.
520
.325
.915
.213
.44.
03.
706.
33.
915
.00
Oil
& G
asY
inso
n H
oldi
ngs
Jan
2294
.80
8.88
9.2
16.2
21.0
0.0
0.0
0.6
1.1
19.0
15.4
54.9
42.3
14.5
8.2
0.0
0.0
10.9
0
Tim
ber
Ta A
nn H
oldi
ngs
Dec
1545
.14
4.17
18.0
19.2
34.6
5.0
10.5
2.6
2.7
6.0
9.3
55.0
43.4
1.6
8.00
1.2
2.5
5.00
Pro
perty
SB
C C
orpo
ratio
nM
ar34
1.32
2.18
28.0
32.0
32.0
4.0
6.0
3.2
2.9
9.0
9.7
6.7
6.9
0.7
0.62
1.8
2.9
2.98
Rub
ber G
love
sK
ossa
n R
ubbe
r In
dust
ries
Dec
2736
.80
4.28
16.0
22.0
28.5
6.6
8.5
0.9
1.1
18.6
21.4
19.5
15.0
4.5
3.9
1.5
2.0
5.10
Tech
nolo
gyIn
ari A
mer
tron
June
1364
.45
2.75
4.0
8.5
19.1
4.5
7.6
0.2
0.3
23.9
34.8
32.4
14.4
16.3
8.62
1.2
2.8
3.72
Tele
com
sO
CK
Gro
upD
ec39
3.16
1.38
5.9
4.5
5.7
0.0
0.0
0.2
0.3
13.5
19.1
29.1
24.4
6.4
4.97
0.0
0.0
1.72
^ cl
osin
g sh
are
pric
e as
at 8
Apr
il 20
14S
ourc
e: B
loom
berg
, RH
B e
stim
ates
Top Malaysia Small Cap Companies 2014

<This page has been left blank intentionally>
1313Top Malaysia Small Cap Companies 2014
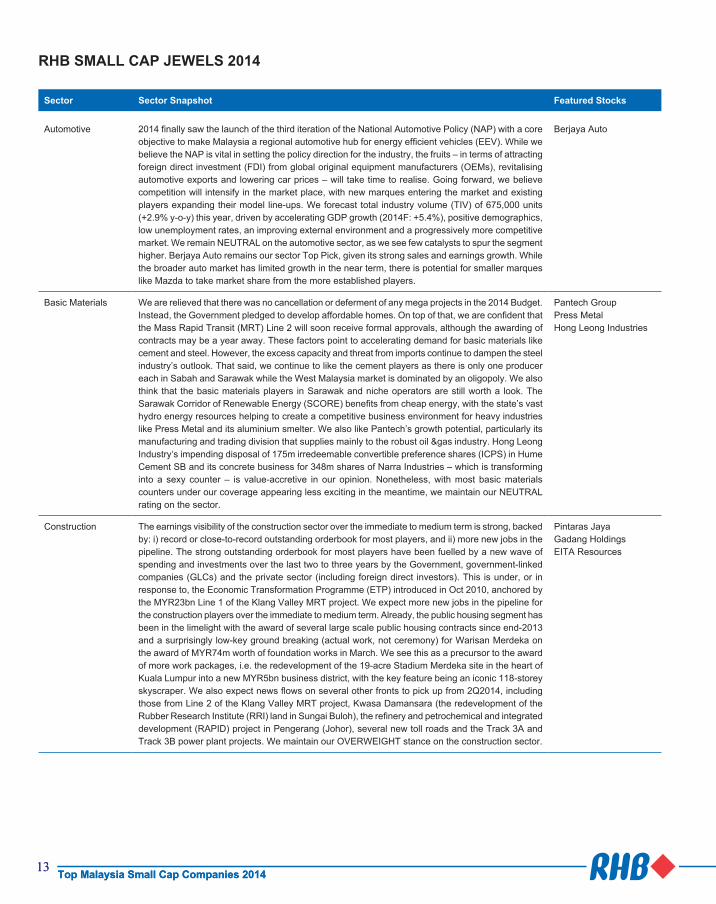
Sector Sector Snapshot Featured Stocks
Automotive 2014 finally saw the launch of the third iteration of the National Automotive Policy (NAP) with a core objective to make Malaysia a regional automotive hub for energy efficient vehicles (EEV). While we believe the NAP is vital in setting the policy direction for the industry, the fruits – in terms of attracting foreign direct investment (FDI) from global original equipment manufacturers (OEMs), revitalising automotive exports and lowering car prices – will take time to realise. Going forward, we believe competition will intensify in the market place, with new marques entering the market and existing players expanding their model line-ups. We forecast total industry volume (TIV) of 675,000 units (+2.9% y-o-y) this year, driven by accelerating GDP growth (2014F: +5.4%), positive demographics, low unemployment rates, an improving external environment and a progressively more competitive market. We remain NEUTRAL on the automotive sector, as we see few catalysts to spur the segment higher. Berjaya Auto remains our sector Top Pick, given its strong sales and earnings growth. While the broader auto market has limited growth in the near term, there is potential for smaller marques like Mazda to take market share from the more established players.
Berjaya Auto
Basic Materials We are relieved that there was no cancellation or deferment of any mega projects in the 2014 Budget. Instead, the Government pledged to develop affordable homes. On top of that, we are confident that the Mass Rapid Transit (MRT) Line 2 will soon receive formal approvals, although the awarding of contracts may be a year away. These factors point to accelerating demand for basic materials like cement and steel. However, the excess capacity and threat from imports continue to dampen the steel industry’s outlook. That said, we continue to like the cement players as there is only one producer each in Sabah and Sarawak while the West Malaysia market is dominated by an oligopoly. We also think that the basic materials players in Sarawak and niche operators are still worth a look. The Sarawak Corridor of Renewable Energy (SCORE) benefits from cheap energy, with the state’s vast hydro energy resources helping to create a competitive business environment for heavy industries like Press Metal and its aluminium smelter. We also like Pantech’s growth potential, particularly its manufacturing and trading division that supplies mainly to the robust oil &gas industry. Hong Leong Industry‘s impending disposal of 175m irredeemable convertible preference shares (ICPS) in Hume Cement SB and its concrete business for 348m shares of Narra Industries – which is transforming into a sexy counter – is value-accretive in our opinion. Nonetheless, with most basic materials counters under our coverage appearing less exciting in the meantime, we maintain our NEUTRAL rating on the sector.
Pantech GroupPress MetalHong Leong Industries
Construction The earnings visibility of the construction sector over the immediate to medium term is strong, backed by: i) record or close-to-record outstanding orderbook for most players, and ii) more new jobs in the pipeline. The strong outstanding orderbook for most players have been fuelled by a new wave of spending and investments over the last two to three years by the Government, government-linked companies (GLCs) and the private sector (including foreign direct investors). This is under, or in response to, the Economic Transformation Programme (ETP) introduced in Oct 2010, anchored by the MYR23bn Line 1 of the Klang Valley MRT project. We expect more new jobs in the pipeline for the construction players over the immediate to medium term. Already, the public housing segment has been in the limelight with the award of several large scale public housing contracts since end-2013 and a surprisingly low-key ground breaking (actual work, not ceremony) for Warisan Merdeka on the award of MYR74m worth of foundation works in March. We see this as a precursor to the award of more work packages, i.e. the redevelopment of the 19-acre Stadium Merdeka site in the heart of Kuala Lumpur into a new MYR5bn business district, with the key feature being an iconic 118-storey skyscraper. We also expect news flows on several other fronts to pick up from 2Q2014, including those from Line 2 of the Klang Valley MRT project, Kwasa Damansara (the redevelopment of the Rubber Research Institute (RRI) land in Sungai Buloh), the refinery and petrochemical and integrated development (RAPID) project in Pengerang (Johor), several new toll roads and the Track 3A and Track 3B power plant projects. We maintain our OVERWEIGHT stance on the construction sector.
Pintaras JayaGadang HoldingsEITA Resources
RHB SMALL CAP JEWELS 2014
Top Malaysia Small Cap Companies 2014

1414Top Malaysia Small Cap Companies 2014
RHB SMALL CAP JEWELS 2013
Sector Sector Snapshot Featured Stocks
Consumer We believe Malaysia’s economic outlook will brighten in tandem with the gradual recovery in the US and Eurozone economies. Our economist projects that Malaysia’s real GDP will likely expand to 5.4% in 2014 from 4.7% in 2013.We expect consumer spending to continue to grow due to high savings, low unemployment and better tourist arrivals, albeit at a more moderate 6% pace in 2014, after the relatively strong 7.6% expansion in 2013. We expect to see consumers spending more prudently given the higher cost of living on the back of the government’s subsidy rationalisation programme and relatively high household debt. QL Resources is our Top Pick in the sector given its strong earnings for the next two years.
Scientex
Education We continue to see a challenging environment for the education sector as student enrolment remains slow amidst increasing competition. We also expect the delays in foreign student visa approvals to crimp foreign student enrolment and turn prospective students away, thus hampering industry growth. Hence, we maintain our NEUTRAL call on the industry. Prestariang remains the sole bright spot as we are positive on its long-term solid fundamentals as well as its expansion into oil&gas-related training, which will drive future earnings.
Prestariang
Healthcare We reiterate our NEUTRAL call on the healthcare sector due to rich valuations and limited upside expected from the major healthcare players, i.e. KPJ Healthcare and IHH Healthcare. Hidden gems – in the form of small players in the pharmaceutical industry – are more appealing. We believe the sector will continue to see rising demand from health-conscious and ageing consumers, spurred by greater affluence. The Government’s incentives to promote local drug manufacturing will in turn drive the demand for generic drugs, health supplements and other pharmaceutical-related products. Our Top Picks are Caring and Hovid, which enjoy: i) robust revenue pipeline, ii) rapid expansion plans, iii) resilience against business seasonality or cyclicality, and iv) decent ROEs.
Esthetics InternationalHovidCaring Pharmacy
Logistics We believe that global economy has strengthened and is on track to chart stronger growth this year, which will likely boost the country’s trade activities in the period ahead. This, in general, will be favourable for logistics companies. Our economists expect domestic demand to remain resilient and act as the main engine of growth for the economy in 2014. This will be driven by a new investment cycle arising from the Government’s efforts to transform the economy,and investments in the various economic corridors and oil & gas projects. This will likely be aided by sustained growth in consumer spending. As a whole, we expect real GDP to expand at a faster 5.4% in 2014 after moderating to 4.7% in 2013. The growth of e-commerce is becoming more apparent while the demand for fast, efficient and safe delivery is on the rise. This is evidenced by the revenue growth recorded by Pos Malaysia’s logistics arm where turnover surged 45% y-o-y in 3QFY14. Courier companies have since evolved and now offer third-party logistics services by providing warehousing and inventory management services. We keep our OVERWEIGHT stance on the logistics sector, as we believe the industry has strong growth potential backed by improved trade activities and buoyant domestic demand, and driven by a growing e-commerce segment.
Complete LogisticsGDEXPOS MalaysiaSuria Capital
Media FIFA’s World Cup 2014 is one of the key events that will kick off on 12 June in Brazil. Based on historical data, the tournament plays an important role in boosting advertising expenditure (adex) growth during the period. In 2010, overall adex grew 15.7% y-o-y and 6.2% m-o-m during the World Cup season, and 17.0% q-o-q during that quarter. As such, we are hopeful that World Cup 2014 will boost 2014 adex. That said, we are concerned that market sentiment may affect overall adex growth, given the rise in the cost of living. This was evident in 4Q13, when the Government began to dial back subsidies for fuel and sugar. This caused adex growth to slow to 11.4% q-o-q vs a strong 14.0% q-o-q growth in 4Q12. We are of the view that the internet will eventually become an important medium - shown by Media Prima’s and Astro’s ventures into the Internet TV space. Media Prima’s Internet platform, TonTon, has been growing strongly with total subscribers hitting 3.5m as at Dec 2013. Astro’s Internet platform, Astro On The Go, has also been well received by its subscribers. In the meantime, Catcha Media has also joined the fray by capturing a large base in the social media space following its merger with Says SB. With the improvement in data infrastructure and a higher penetration rate, the internet will eventually evolve to become the main media platform. We keep our NEUTRAL recommendation unchanged for the sector, as we think that an 8% growth in overall adex is mediocre.
Catcha Media
Top Malaysia Small Cap Companies 2014
1515Top Malaysia Small Cap Companies 2014
Sector Sector Snapshot Featured Stocks
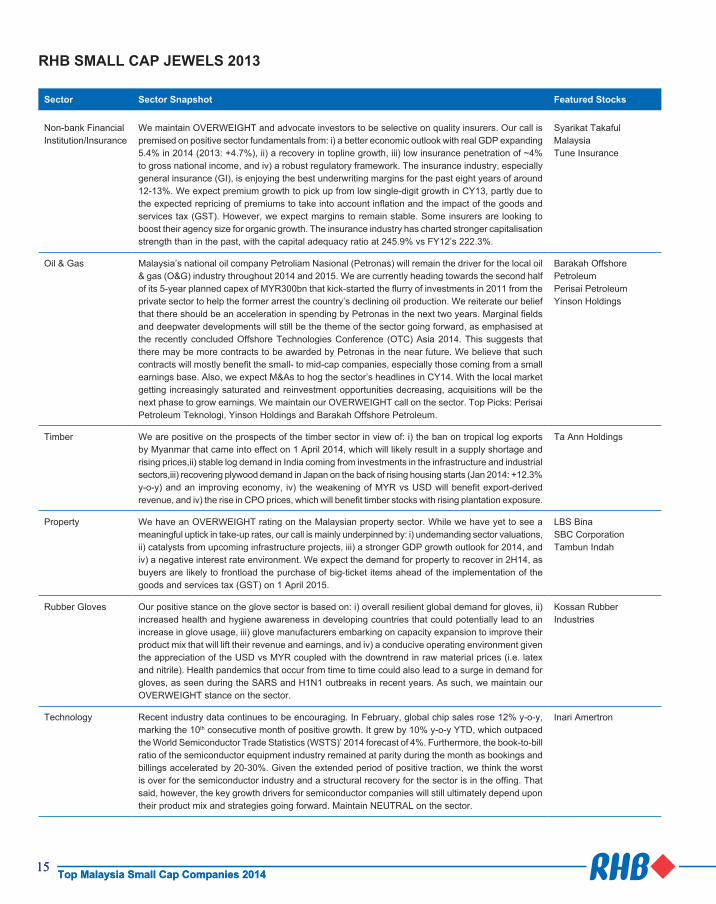
Non-bank Financial Institution/Insurance
We maintain OVERWEIGHT and advocate investors to be selective on quality insurers. Our call is premised on positive sector fundamentals from: i) a better economic outlook with real GDP expanding 5.4% in 2014 (2013: +4.7%), ii) a recovery in topline growth, iii) low insurance penetration of ~4% to gross national income, and iv) a robust regulatory framework. The insurance industry, especially general insurance (GI), is enjoying the best underwriting margins for the past eight years of around 12-13%. We expect premium growth to pick up from low single-digit growth in CY13, partly due to the expected repricing of premiums to take into account inflation and the impact of the goods and services tax (GST). However, we expect margins to remain stable. Some insurers are looking to boost their agency size for organic growth. The insurance industry has charted stronger capitalisation strength than in the past, with the capital adequacy ratio at 245.9% vs FY12’s 222.3%.
Syarikat Takaful MalaysiaTune Insurance
Oil & Gas Malaysia’s national oil company Petroliam Nasional (Petronas) will remain the driver for the local oil & gas (O&G) industry throughout 2014 and 2015. We are currently heading towards the second half of its 5-year planned capex of MYR300bn that kick-started the flurry of investments in 2011 from the private sector to help the former arrest the country’s declining oil production. We reiterate our belief that there should be an acceleration in spending by Petronas in the next two years. Marginal fields and deepwater developments will still be the theme of the sector going forward, as emphasised at the recently concluded Offshore Technologies Conference (OTC) Asia 2014. This suggests that there may be more contracts to be awarded by Petronas in the near future. We believe that such contracts will mostly benefit the small- to mid-cap companies, especially those coming from a small earnings base. Also, we expect M&As to hog the sector’s headlines in CY14. With the local market getting increasingly saturated and reinvestment opportunities decreasing, acquisitions will be the next phase to grow earnings. We maintain our OVERWEIGHT call on the sector. Top Picks: Perisai Petroleum Teknologi, Yinson Holdings and Barakah Offshore Petroleum.
Barakah Offshore PetroleumPerisai PetroleumYinson Holdings
Timber We are positive on the prospects of the timber sector in view of: i) the ban on tropical log exports by Myanmar that came into effect on 1 April 2014, which will likely result in a supply shortage and rising prices,ii) stable log demand in India coming from investments in the infrastructure and industrial sectors,iii) recovering plywood demand in Japan on the back of rising housing starts (Jan 2014: +12.3% y-o-y) and an improving economy, iv) the weakening of MYR vs USD will benefit export-derived revenue, and iv) the rise in CPO prices, which will benefit timber stocks with rising plantation exposure.
Ta Ann Holdings
Property We have an OVERWEIGHT rating on the Malaysian property sector. While we have yet to see a meaningful uptick in take-up rates, our call is mainly underpinned by: i) undemanding sector valuations, ii) catalysts from upcoming infrastructure projects, iii) a stronger GDP growth outlook for 2014, and iv) a negative interest rate environment. We expect the demand for property to recover in 2H14, as buyers are likely to frontload the purchase of big-ticket items ahead of the implementation of the goods and services tax (GST) on 1 April 2015.
LBS BinaSBC CorporationTambun Indah
Rubber Gloves Our positive stance on the glove sector is based on: i) overall resilient global demand for gloves, ii) increased health and hygiene awareness in developing countries that could potentially lead to an increase in glove usage, iii) glove manufacturers embarking on capacity expansion to improve their product mix that will lift their revenue and earnings, and iv) a conducive operating environment given the appreciation of the USD vs MYR coupled with the downtrend in raw material prices (i.e. latex and nitrile). Health pandemics that occur from time to time could also lead to a surge in demand for gloves, as seen during the SARS and H1N1 outbreaks in recent years. As such, we maintain our OVERWEIGHT stance on the sector.
Kossan Rubber Industries
Technology Recent industry data continues to be encouraging. In February, global chip sales rose 12% y-o-y, marking the 10th consecutive month of positive growth. It grew by 10% y-o-y YTD, which outpaced the World Semiconductor Trade Statistics (WSTS)’ 2014 forecast of 4%. Furthermore, the book-to-bill ratio of the semiconductor equipment industry remained at parity during the month as bookings and billings accelerated by 20-30%. Given the extended period of positive traction, we think the worst is over for the semiconductor industry and a structural recovery for the sector is in the offing. That said, however, the key growth drivers for semiconductor companies will still ultimately depend upon their product mix and strategies going forward. Maintain NEUTRAL on the sector.
Inari Amertron
RHB SMALL CAP JEWELS 2013
Top Malaysia Small Cap Companies 2014
1616Top Malaysia Small Cap Companies 2014
RHB SMALL CAP JEWELS 2013
Sector Sector Snapshot Featured Stocks
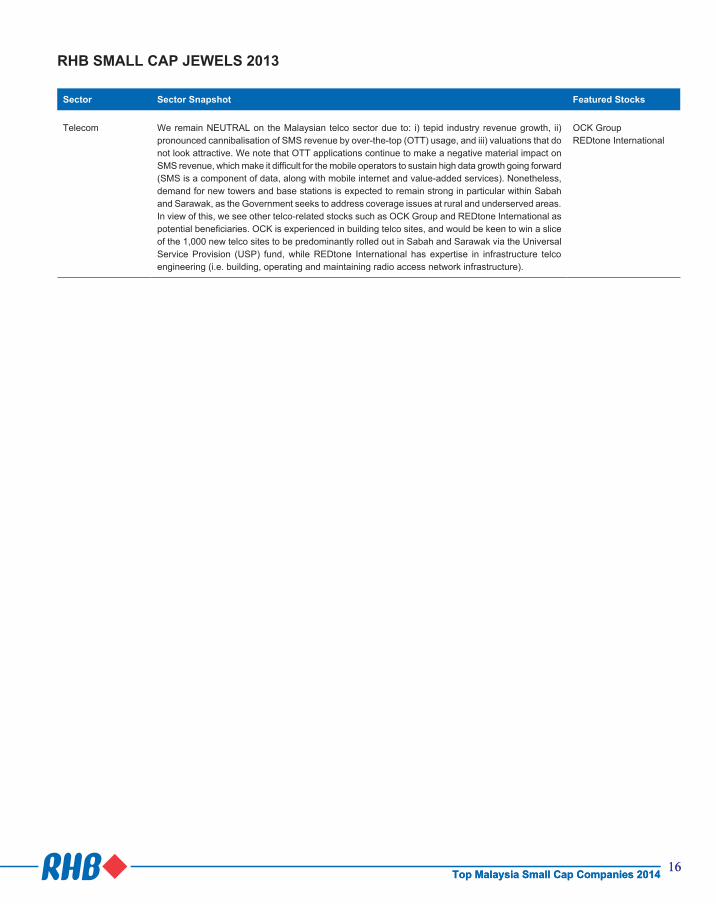
Telecom We remain NEUTRAL on the Malaysian telco sector due to: i) tepid industry revenue growth, ii) pronounced cannibalisation of SMS revenue by over-the-top (OTT) usage, and iii) valuations that do not look attractive. We note that OTT applications continue to make a negative material impact on SMS revenue, which make it difficult for the mobile operators to sustain high data growth going forward (SMS is a component of data, along with mobile internet and value-added services). Nonetheless, demand for new towers and base stations is expected to remain strong in particular within Sabah and Sarawak, as the Government seeks to address coverage issues at rural and underserved areas. In view of this, we see other telco-related stocks such as OCK Group and REDtone International as potential beneficiaries. OCK is experienced in building telco sites, and would be keen to win a slice of the 1,000 new telco sites to be predominantly rolled out in Sabah and Sarawak via the Universal Service Provision (USP) fund, while REDtone International has expertise in infrastructure telco engineering (i.e. building, operating and maintaining radio access network infrastructure).
OCK GroupREDtone International
Top Malaysia Small Cap Companies 2014

17
Barakah Offshore Petroleum Target (diluted): MYR1.90
Price: MYR1.51
Expanding Beyond Its Domestic Dominance
0
1,000
2,000
3,000
4,000
5,000
6,000
7,000
8,000
9,000
10,000
0.0
0.2
0.4
0.6
0.8
1.0
1.2
1.4
1.6
1.8
2.0
Barakah Offshore Petroleum (Barakah MK)Price Close Relative to FTSE Bursa Malaysia KLCI Index (RHS)
10203040506070
Ap
r-13
Jun
-13
Au
g-1
3
Oct-
13
Dec-1
3
Feb
-14
Vol m
Source: Bloomberg
Stock Profile
Bloomberg Ticker Barakah MK
Avg Turnover (MYR/USD) 8.63m/2.62m
Net Gearing (%) 23.5
Market Cap (MYRm) 971m
Beta (x) na
BVPS (MYR) 0.36
52-wk Price low/high (MYR) 0.98 - 1.87
Free float (%) 39
Major Shareholders (%)
Nik Hamdan Bin Daud 57.7
(Major RCULS Holder) Areca Capital SB
66.2
Share Performance (%)
1m 3m 6m 12m
Absolute 2.0 2.6 7650.0 7650.0
Relative 0.3 1.5 7645.2 7639.9
Kong Ho Meng +603 9207 7620
Investment Merits
Experienced management with long-standing Petronas relationship
Current orderbook of MYR2.1bn provides 3-year visibility
High hit rate for local jobs
Actively bidding for a total of >70 jobs worth MYR3bn, with half of this tenderbook amount being overseas jobs
Company Profile
Barakah Offshore Petroleum (Barakah) specialises in offshore transportation, installation and maintenance works. The company has carried out over MYR1.6bn worth of projects in the last 13 years that comprise pipeline and commissioning works (59% of revenue), and installation and construction (41% of revenue).
Highlights
Milestone transportation and installation (T&I) projects. Barakah was a major beneficiary of the MYR1.5bn Pan Malaysia T&I (Package A). Its 300-pax accommodation/pipelay barge, KL101 – the key tool to carry out Package A jobs – is expected to be deployed to Petronas by mid 2014. The contract period is three years up to Dec 2016. Elsewhere, management is looking for short accommodation contracts for KL101. In the past, the barge’s contracts garnered rates of USD40,000-50,000/day. Meanwhile, the company is also developing in-house diving services.
Overseas projects. Barakah is bidding for more than 70 projects worth about MYR3bn in Saudi Arabia and Indonesia over a 3-year horizon. The outcome of the tenders the company submitted for Saudi Arabian T&I jobs was supposed to be made known by end-February but this has been delayed. That said, announcements of any positive progress in these project bids will be positive catalysts for Barakah. While the hit rate may not be as high as that for Malaysian jobs, we understand that the company stands a better chance over international bidders due to its track record and the fact that it has a marketing office in Saudi Arabia. These potential contracts are expected to fetch higher day rates than the current ones from Package A, although third-party chartering may be a consideration.
Refinancing opportunities. Management said at our recent oil & gas (O&G) corporate day that it is looking at refinancing its existing borrowings. The loans it secured in 2010 to fund KL101 carried a high 8.1% interest rate. Given the currently favourable conditions – KL101 being operational and soon to be deployed for Petronas’ T&I jobs – there are opportunities to refinance at lower rates. Our forecasts assume cheaper finance costs.
Profit & Loss Sep-12 Sep-13 Dec-14F
Total turnover (MYRm) 202 299 716
Reported net profit (MYRm) 33 41 117
Recurring net profit (MYRm) 33 41 124
Recurring net profit growth (%) (2.9) 23.8 201.7
Recurring EPS (MYR) 0.04 0.05 0.15
Recurring P/E (x) 38.66 31.23 10.35
Return on average equity (%) 29.1 27.1 40.5
P/B (x) 9.82 7.43 4.02
P/CF (x) 18.31 84.08 17.00
Source: Company data, RHB estimates
Balance Sheet (MYRm) Sep-12 Sep-13 Dec-14F
Total current assets 95 165 334
Total assets 415 471 690
Total current liabilities 59 74 152
Total non-current liabilities 226 223 219
Total liabilities 284 298 371
Shareholders' equity 131 173 319
Minority interests 0 0 0
Total equity 131 173 319
Total liabilities & equity 415 471 690
Total debt 232 244 268
Net debt 192 188 193
Source: Company data, RHB estimates
Cash Flow (MYRm) Sep-12 Sep-13 Dec-14F
Cash flow from operations 71 15 95
Cash flow from investing activities (45) (4) (20)
Cash flow from financing activities (4) (5) (30)
Cash at beginning of period 12 34 39
Total cash generated 21 6 45
Forex effects 0 0 (0)
Implied cash at end of period 34 39 24
Source: Company data, RHB estimates
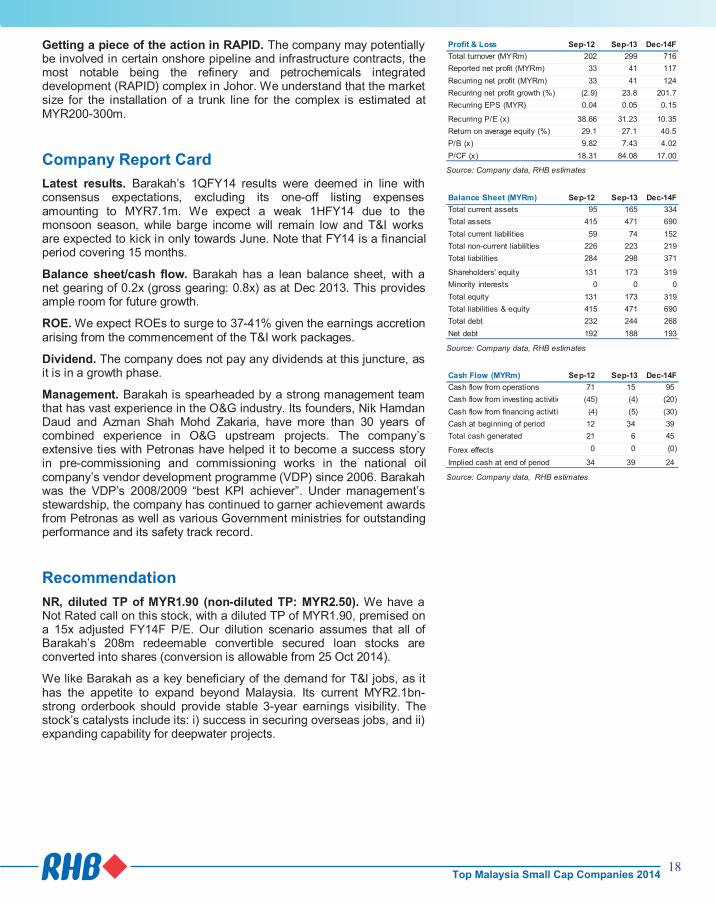
Getting a piece of the action in RAPID. The company may potentially be involved in certain onshore pipeline and infrastructure contracts, the most notable being the refinery and petrochemicals integrated development (RAPID) complex in Johor. We understand that the market size for the installation of a trunk line for the complex is estimated at MYR200-300m.
Company Report Card
Latest results. Barakah’s 1QFY14 results were deemed in line with consensus expectations, excluding its one-off listing expenses amounting to MYR7.1m. We expect a weak 1HFY14 due to the monsoon season, while barge income will remain low and T&I works are expected to kick in only towards June. Note that FY14 is a financial period covering 15 months.
Balance sheet/cash flow. Barakah has a lean balance sheet, with a net gearing of 0.2x (gross gearing: 0.8x) as at Dec 2013. This provides ample room for future growth.
ROE. We expect ROEs to surge to 37-41% given the earnings accretion arising from the commencement of the T&I work packages.
Dividend. The company does not pay any dividends at this juncture, as it is in a growth phase.
Management. Barakah is spearheaded by a strong management team that has vast experience in the O&G industry. Its founders, Nik Hamdan Daud and Azman Shah Mohd Zakaria, have more than 30 years of combined experience in O&G upstream projects. The company’s extensive ties with Petronas have helped it to become a success story in pre-commissioning and commissioning works in the national oil company’s vendor development programme (VDP) since 2006. Barakah was the VDP’s 2008/2009 “best KPI achiever”. Under management’s stewardship, the company has continued to garner achievement awards from Petronas as well as various Government ministries for outstanding performance and its safety track record.
Recommendation
NR, diluted TP of MYR1.90 (non-diluted TP: MYR2.50). We have a Not Rated call on this stock, with a diluted TP of MYR1.90, premised on a 15x adjusted FY14F P/E. Our dilution scenario assumes that all of Barakah’s 208m redeemable convertible secured loan stocks are converted into shares (conversion is allowable from 25 Oct 2014).
We like Barakah as a key beneficiary of the demand for T&I jobs, as it has the appetite to expand beyond Malaysia. Its current MYR2.1bn-strong orderbook should provide stable 3-year earnings visibility. The stock’s catalysts include its: i) success in securing overseas jobs, and ii) expanding capability for deepwater projects.
Top Malaysia Small Cap Companies 2014
18
Barakah Offshore Petroleum Target (diluted): MYR1.90
Price: MYR1.51
Expanding Beyond Its Domestic Dominance
0
1,000
2,000
3,000
4,000
5,000
6,000
7,000
8,000
9,000
10,000
0.0
0.2
0.4
0.6
0.8
1.0
1.2
1.4
1.6
1.8
2.0
Barakah Offshore Petroleum (Barakah MK)Price Close Relative to FTSE Bursa Malaysia KLCI Index (RHS)
10203040506070
Ap
r-13
Jun
-13
Au
g-1
3
Oct-
13
Dec-1
3
Feb
-14
Vol m
Source: Bloomberg
Stock Profile
Bloomberg Ticker Barakah MK
Avg Turnover (MYR/USD) 8.63m/2.62m
Net Gearing (%) 23.5
Market Cap (MYRm) 971m
Beta (x) na
BVPS (MYR) 0.36
52-wk Price low/high (MYR) 0.98 - 1.87
Free float (%) 39
Major Shareholders (%)
Nik Hamdan Bin Daud 57.7
(Major RCULS Holder) Areca Capital SB
66.2
Share Performance (%)
1m 3m 6m 12m
Absolute 2.0 2.6 7650.0 7650.0
Relative 0.3 1.5 7645.2 7639.9
Kong Ho Meng +603 9207 7620
Investment Merits
Experienced management with long-standing Petronas relationship
Current orderbook of MYR2.1bn provides 3-year visibility
High hit rate for local jobs
Actively bidding for a total of >70 jobs worth MYR3bn, with half of this tenderbook amount being overseas jobs
Company Profile
Barakah Offshore Petroleum (Barakah) specialises in offshore transportation, installation and maintenance works. The company has carried out over MYR1.6bn worth of projects in the last 13 years that comprise pipeline and commissioning works (59% of revenue), and installation and construction (41% of revenue).
Highlights
Milestone transportation and installation (T&I) projects. Barakah was a major beneficiary of the MYR1.5bn Pan Malaysia T&I (Package A). Its 300-pax accommodation/pipelay barge, KL101 – the key tool to carry out Package A jobs – is expected to be deployed to Petronas by mid 2014. The contract period is three years up to Dec 2016. Elsewhere, management is looking for short accommodation contracts for KL101. In the past, the barge’s contracts garnered rates of USD40,000-50,000/day. Meanwhile, the company is also developing in-house diving services.
Overseas projects. Barakah is bidding for more than 70 projects worth about MYR3bn in Saudi Arabia and Indonesia over a 3-year horizon. The outcome of the tenders the company submitted for Saudi Arabian T&I jobs was supposed to be made known by end-February but this has been delayed. That said, announcements of any positive progress in these project bids will be positive catalysts for Barakah. While the hit rate may not be as high as that for Malaysian jobs, we understand that the company stands a better chance over international bidders due to its track record and the fact that it has a marketing office in Saudi Arabia. These potential contracts are expected to fetch higher day rates than the current ones from Package A, although third-party chartering may be a consideration.
Refinancing opportunities. Management said at our recent oil & gas (O&G) corporate day that it is looking at refinancing its existing borrowings. The loans it secured in 2010 to fund KL101 carried a high 8.1% interest rate. Given the currently favourable conditions – KL101 being operational and soon to be deployed for Petronas’ T&I jobs – there are opportunities to refinance at lower rates. Our forecasts assume cheaper finance costs.
Profit & Loss Sep-12 Sep-13 Dec-14F
Total turnover (MYRm) 202 299 716
Reported net profit (MYRm) 33 41 117
Recurring net profit (MYRm) 33 41 124
Recurring net profit growth (%) (2.9) 23.8 201.7
Recurring EPS (MYR) 0.04 0.05 0.15
Recurring P/E (x) 38.66 31.23 10.35
Return on average equity (%) 29.1 27.1 40.5
P/B (x) 9.82 7.43 4.02
P/CF (x) 18.31 84.08 17.00
Source: Company data, RHB estimates
Balance Sheet (MYRm) Sep-12 Sep-13 Dec-14F
Total current assets 95 165 334
Total assets 415 471 690
Total current liabilities 59 74 152
Total non-current liabilities 226 223 219
Total liabilities 284 298 371
Shareholders' equity 131 173 319
Minority interests 0 0 0
Total equity 131 173 319
Total liabilities & equity 415 471 690
Total debt 232 244 268
Net debt 192 188 193
Source: Company data, RHB estimates
Cash Flow (MYRm) Sep-12 Sep-13 Dec-14F
Cash flow from operations 71 15 95
Cash flow from investing activities (45) (4) (20)
Cash flow from financing activities (4) (5) (30)
Cash at beginning of period 12 34 39
Total cash generated 21 6 45
Forex effects 0 0 (0)
Implied cash at end of period 34 39 24
Source: Company data, RHB estimates
Getting a piece of the action in RAPID. The company may potentially be involved in certain onshore pipeline and infrastructure contracts, the most notable being the refinery and petrochemicals integrated development (RAPID) complex in Johor. We understand that the market size for the installation of a trunk line for the complex is estimated at MYR200-300m.
Company Report Card
Latest results. Barakah’s 1QFY14 results were deemed in line with consensus expectations, excluding its one-off listing expenses amounting to MYR7.1m. We expect a weak 1HFY14 due to the monsoon season, while barge income will remain low and T&I works are expected to kick in only towards June. Note that FY14 is a financial period covering 15 months.
Balance sheet/cash flow. Barakah has a lean balance sheet, with a net gearing of 0.2x (gross gearing: 0.8x) as at Dec 2013. This provides ample room for future growth.
ROE. We expect ROEs to surge to 37-41% given the earnings accretion arising from the commencement of the T&I work packages.
Dividend. The company does not pay any dividends at this juncture, as it is in a growth phase.
Management. Barakah is spearheaded by a strong management team that has vast experience in the O&G industry. Its founders, Nik Hamdan Daud and Azman Shah Mohd Zakaria, have more than 30 years of combined experience in O&G upstream projects. The company’s extensive ties with Petronas have helped it to become a success story in pre-commissioning and commissioning works in the national oil company’s vendor development programme (VDP) since 2006. Barakah was the VDP’s 2008/2009 “best KPI achiever”. Under management’s stewardship, the company has continued to garner achievement awards from Petronas as well as various Government ministries for outstanding performance and its safety track record.
Recommendation
NR, diluted TP of MYR1.90 (non-diluted TP: MYR2.50). We have a Not Rated call on this stock, with a diluted TP of MYR1.90, premised on a 15x adjusted FY14F P/E. Our dilution scenario assumes that all of Barakah’s 208m redeemable convertible secured loan stocks are converted into shares (conversion is allowable from 25 Oct 2014).
We like Barakah as a key beneficiary of the demand for T&I jobs, as it has the appetite to expand beyond Malaysia. Its current MYR2.1bn-strong orderbook should provide stable 3-year earnings visibility. The stock’s catalysts include its: i) success in securing overseas jobs, and ii) expanding capability for deepwater projects.
Top Malaysia Small Cap Companies 2014

19
Berjaya Auto Target: MYR2.55
Price: MYR2.19
A Compelling Growth Story
Source: Bloomberg
Stock Profile
Bloomberg Ticker BAUTO MK
Avg Turnover (MYR/USD) 1.83m/0.54m
Net Gearing (%) -38.3
Market Cap (MYRm) 1,767m
Beta (x) NA
BVPS (MYR) 0.36
52-wk Price low/high (MYR) 0.70 - 2.19
Free float (%) 25
Major Shareholders (%)
Berjaya Group Berhad 67.6
Podium Success Sdn BhdSB 7.1
Share Performance (%)
1m 3m 6m 12m
Absolute 21.7 25.9
Relative 20.0 24.2
Alexander Chia +603 9207 7621
79
107
135
162
190
218
246
273
301
0.5
0.7
0.9
1.1
1.3
1.5
1.7
1.9
2.1
2.3
Berjaya Auto (BAUTO MK)Price Close Relative to FTSE Bursa Malaysia KLCI Index (RHS)
1020304050607080
No
v-1
3
De
c-1
3
Ja
n-1
4
Ja
n-1
4
Fe
b-1
4
Ma
r-1
4
Vol m
Investment Merits
The sole importer and distributor of Mazda vehicles in Malaysia and the Philippines
Compelling growth story with a 3-year (2013-2016F) earnings CAGR of 54.4%, backed by aggressive expansion in both its model line-up and completely-knocked-down (CKD) operations
BUY with a MYR2.55 TP, based on 11.5x CY15 EPS
Company Profile
Berjaya Auto Berhad is involved in the distribution, assembling, retailing and also the provision of after sales service of Mazda vehicles in Malaysia. The Group is also involved in the domestic distribution of locally assembled Mazda vehicles and the export of the locally assembled Mazda vehicles.
Highlights
Strong product pipeline. Mazda sales in Malaysia are set to enjoy exponential growth (2013: +45.2% y-o-y) over the next several years, with sales beginning from a low base and helped by a pipeline of attractive new products. Five all-new models are set to be introduced between now and 2016, one of them being the new Mazda 2.
Mazda to enjoy market share gains. We are forecasting for Mazda sales in Malaysia to grow at a FY13-16F CAGR of 26.7%, coming off a low base. Mazda’s 2013 new vehicle registrations of 9,197 units in Malaysia were merely a tenth of Toyota sales and a fifth each of Honda and Nissan’s. Mazda Malaysia’s expected robust sales growth will be fuelled by gaining market share not only from its Big 3 Japanese peers – ie Toyota, Honda and Nissan – but also from Korean and other continental marques.
Increased localisation. Berjaya Auto’s new assembly facility within the Inokom plant – commissioned in April – will ramp up production of Mazda’s CX-5 sport utility vehicle (two-thirds of which are slated for export to Thailand). The facility is set to introduce locally-assembled variants of the Mazda 3 by October and the Mazda 6 in 2015. The higher rate of localisation will bring about lower effective excise duty rates, enabling Mazda to price its products more competitively. This, in turn, will boost sales volume, with improved operating leverage helping to lift total profit.
Philippines’ contribution trending up. With only 657 units sold in FY13, we see Mazda’s Philippines sales growing at a FY13-16F CAGR of 89%. BAP adopts a simpler business model, ie the wholesale distribution of fully-imported vehicles, spare parts, accessories and tools. The models distributed include the 2, 3, 6, CX-5, CX-9 and BT-50.
Source: Company data, RHB estimates
Source: Company data, RHB estimates
Source: Company data, RHB estimates
Profit & Loss Apr-13 Apr-14F Apr-15F
Total turnover (MYRm) 1,064 1,551 2,113
Reported net profit (MYRm) 52 119 156
Recurring net profit (MYRm) 52 126 156
Recurring net profit growth (%) 27.8 141.5 24.1
Recurring EPS (MYR) 0.07 0.16 0.19
DPS (MYR) - 0.04 0.05
Dividend Yield (%) - 1.7 2.2
Recurring P/E (x) 30.32 14.06 11.32
Return on average equity (%) 38.7 52.6 44.4
P/B (x) 9.93 6.04 4.31
P/CF (x) 29.72 22.55 13.09
Balance Sheet (MYRm) Apr-13 Apr-14F Apr-15F
Total current assets 423 497 660
Total assets 485 589 787
Total current liabilities 285 250 320
Total non-current liabilities 35 35 35
Total liabilities 319 284 355
Shareholders' equity 159 292 410
Minority interests 7 13 22
Other equity 0 0 -
Total equity 166 305 431
Total liabilities & equity 485 589 787
Total debt 129 29 29
Net debt (53) (117) (182)
Cash flow (MYRm) Apr-13 Apr-14F Apr-15F
Cash flow from operations 53 78 135
Cash flow from investing activities (39) (28) (31)
Cash flow from financing activities 91 (87) (40)
Cash at beginning of period 77 182 146
Total cash generated 105 (37) 65
Implied cash at end of period 182 145 210
Potential beneficiary of 2014 National Automotive Policy (NAP). In line with the Government’s plan to promote Malaysia as a regional energy-efficient vehicle (EEV) hub, it is offering customised incentives that include a mix of lower taxes, grants and other incentives for the production of such vehicles in Malaysia. Berjaya Auto could be a beneficiary of the new NAP as its key growth drivers, i.e. the CX-5, 3 and 6, all qualify as EEVs.
Company Report Card
Latest results. Berjaya Auto’s 9MFY14 net profit of MYR84.3m (+214.5% y-o-y) was solid and reached 77.5% of our previous estimates. We have lifted our earnings estimates since then in view of higher sales volume assumptions.
Balance sheet/cash flow. It has a solid balance sheet with a net cash pile of MYR196.2 as at end-Jan 2014.
ROE. The company’s strong earnings growth will enable it to deliver double-digit ROEs for FY14F/15F.
Dividend. Berjaya Auto’s dividend policy is to pay out up to 40% of its earnings to shareholders. It declared a single-tier dividend of 1.75 sen per share in 1H14.
Management. The company’s experienced management team is helmed by CEO Dato’ Sri Ben Yeoh, who has more than 40 years of experience in the automotive industry. Dato’ Sri Yeoh has held various positions from technical manager to executive director, and led the team that successfully turned Hyundai into a major player in the domestic automotive market. He managed the South Korean marque’s distribution and retailing operations in Malaysia between 1997 and 2007.
Recommendation
Berjaya Auto is our Top Pick in the automotive sector as we continue to like its strong growth potential and attractive product offerings going forward. We are confident that the group will deliver high double-digit earnings growth for FY14/15, backed by an expanding model line-up and CKD operations. Our valuation of MYR2.55 is derived from an 11.5x CY15F EPS, in line with its peer target valuation of 9-12x. Maintain BUY.
Top Malaysia Small Cap Companies 2014
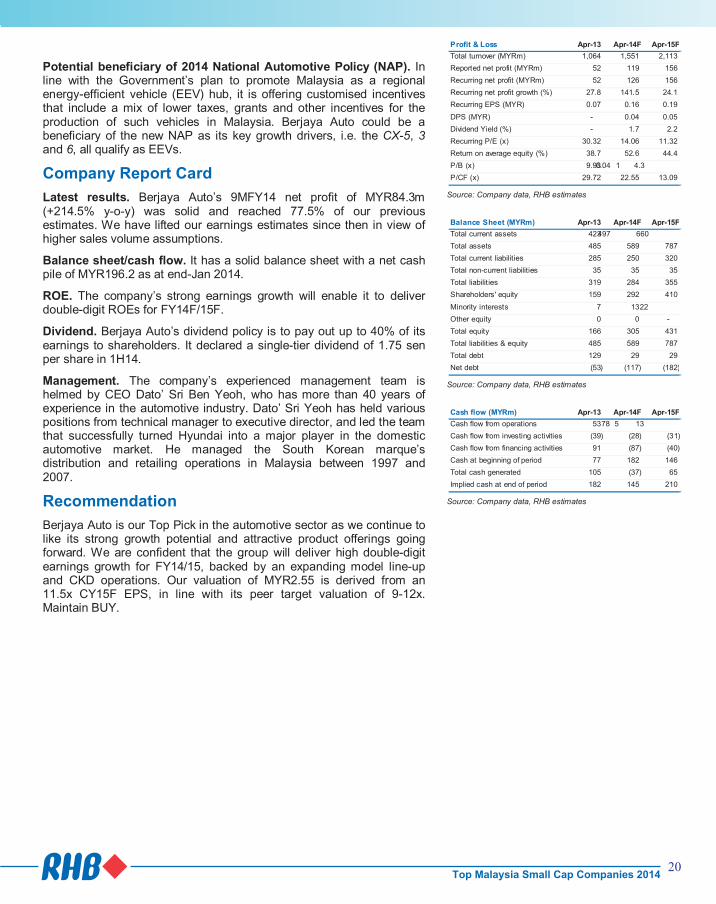
20
Berjaya Auto Target: MYR2.55
Price: MYR2.19
A Compelling Growth Story
Source: Bloomberg
Stock Profile
Bloomberg Ticker BAUTO MK
Avg Turnover (MYR/USD) 1.83m/0.54m
Net Gearing (%) -38.3
Market Cap (MYRm) 1,767m
Beta (x) NA
BVPS (MYR) 0.36
52-wk Price low/high (MYR) 0.70 - 2.19
Free float (%) 25
Major Shareholders (%)
Berjaya Group Berhad 67.6
Podium Success Sdn BhdSB 7.1
Share Performance (%)
1m 3m 6m 12m
Absolute 21.7 25.9
Relative 20.0 24.2
Alexander Chia +603 9207 7621
79
107
135
162
190
218
246
273
301
0.5
0.7
0.9
1.1
1.3
1.5
1.7
1.9
2.1
2.3
Berjaya Auto (BAUTO MK)Price Close Relative to FTSE Bursa Malaysia KLCI Index (RHS)
1020304050607080
No
v-1
3
De
c-1
3
Ja
n-1
4
Ja
n-1
4
Fe
b-1
4
Ma
r-1
4
Vol m
Investment Merits
The sole importer and distributor of Mazda vehicles in Malaysia and the Philippines
Compelling growth story with a 3-year (2013-2016F) earnings CAGR of 54.4%, backed by aggressive expansion in both its model line-up and completely-knocked-down (CKD) operations
BUY with a MYR2.55 TP, based on 11.5x CY15 EPS
Company Profile
Berjaya Auto Berhad is involved in the distribution, assembling, retailing and also the provision of after sales service of Mazda vehicles in Malaysia. The Group is also involved in the domestic distribution of locally assembled Mazda vehicles and the export of the locally assembled Mazda vehicles.
Highlights
Strong product pipeline. Mazda sales in Malaysia are set to enjoy exponential growth (2013: +45.2% y-o-y) over the next several years, with sales beginning from a low base and helped by a pipeline of attractive new products. Five all-new models are set to be introduced between now and 2016, one of them being the new Mazda 2.
Mazda to enjoy market share gains. We are forecasting for Mazda sales in Malaysia to grow at a FY13-16F CAGR of 26.7%, coming off a low base. Mazda’s 2013 new vehicle registrations of 9,197 units in Malaysia were merely a tenth of Toyota sales and a fifth each of Honda and Nissan’s. Mazda Malaysia’s expected robust sales growth will be fuelled by gaining market share not only from its Big 3 Japanese peers – ie Toyota, Honda and Nissan – but also from Korean and other continental marques.
Increased localisation. Berjaya Auto’s new assembly facility within the Inokom plant – commissioned in April – will ramp up production of Mazda’s CX-5 sport utility vehicle (two-thirds of which are slated for export to Thailand). The facility is set to introduce locally-assembled variants of the Mazda 3 by October and the Mazda 6 in 2015. The higher rate of localisation will bring about lower effective excise duty rates, enabling Mazda to price its products more competitively. This, in turn, will boost sales volume, with improved operating leverage helping to lift total profit.
Philippines’ contribution trending up. With only 657 units sold in FY13, we see Mazda’s Philippines sales growing at a FY13-16F CAGR of 89%. BAP adopts a simpler business model, ie the wholesale distribution of fully-imported vehicles, spare parts, accessories and tools. The models distributed include the 2, 3, 6, CX-5, CX-9 and BT-50.
Source: Company data, RHB estimates
Source: Company data, RHB estimates
Source: Company data, RHB estimates
Profit & Loss Apr-13 Apr-14F Apr-15F
Total turnover (MYRm) 1,064 1,551 2,113
Reported net profit (MYRm) 52 119 156
Recurring net profit (MYRm) 52 126 156
Recurring net profit growth (%) 27.8 141.5 24.1
Recurring EPS (MYR) 0.07 0.16 0.19
DPS (MYR) - 0.04 0.05
Dividend Yield (%) - 1.7 2.2
Recurring P/E (x) 30.32 14.06 11.32
Return on average equity (%) 38.7 52.6 44.4
P/B (x) 9.93 6.04 4.31
P/CF (x) 29.72 22.55 13.09
Balance Sheet (MYRm) Apr-13 Apr-14F Apr-15F
Total current assets 423 497 660
Total assets 485 589 787
Total current liabilities 285 250 320
Total non-current liabilities 35 35 35
Total liabilities 319 284 355
Shareholders' equity 159 292 410
Minority interests 7 13 22
Other equity 0 0 -
Total equity 166 305 431
Total liabilities & equity 485 589 787
Total debt 129 29 29
Net debt (53) (117) (182)
Cash flow (MYRm) Apr-13 Apr-14F Apr-15F
Cash flow from operations 53 78 135
Cash flow from investing activities (39) (28) (31)
Cash flow from financing activities 91 (87) (40)
Cash at beginning of period 77 182 146
Total cash generated 105 (37) 65
Implied cash at end of period 182 145 210
Potential beneficiary of 2014 National Automotive Policy (NAP). In line with the Government’s plan to promote Malaysia as a regional energy-efficient vehicle (EEV) hub, it is offering customised incentives that include a mix of lower taxes, grants and other incentives for the production of such vehicles in Malaysia. Berjaya Auto could be a beneficiary of the new NAP as its key growth drivers, i.e. the CX-5, 3 and 6, all qualify as EEVs.
Company Report Card
Latest results. Berjaya Auto’s 9MFY14 net profit of MYR84.3m (+214.5% y-o-y) was solid and reached 77.5% of our previous estimates. We have lifted our earnings estimates since then in view of higher sales volume assumptions.
Balance sheet/cash flow. It has a solid balance sheet with a net cash pile of MYR196.2 as at end-Jan 2014.
ROE. The company’s strong earnings growth will enable it to deliver double-digit ROEs for FY14F/15F.
Dividend. Berjaya Auto’s dividend policy is to pay out up to 40% of its earnings to shareholders. It declared a single-tier dividend of 1.75 sen per share in 1H14.
Management. The company’s experienced management team is helmed by CEO Dato’ Sri Ben Yeoh, who has more than 40 years of experience in the automotive industry. Dato’ Sri Yeoh has held various positions from technical manager to executive director, and led the team that successfully turned Hyundai into a major player in the domestic automotive market. He managed the South Korean marque’s distribution and retailing operations in Malaysia between 1997 and 2007.
Recommendation
Berjaya Auto is our Top Pick in the automotive sector as we continue to like its strong growth potential and attractive product offerings going forward. We are confident that the group will deliver high double-digit earnings growth for FY14/15, backed by an expanding model line-up and CKD operations. Our valuation of MYR2.55 is derived from an 11.5x CY15F EPS, in line with its peer target valuation of 9-12x. Maintain BUY.
Top Malaysia Small Cap Companies 2014

21
CARiNG Pharmacy Target: MYR2.57
Price: MYR1.97
The CARiNG Way Forward
92
107
122
137
152
167
182
1.1
1.3
1.5
1.7
1.9
2.1
2.3
Caring Pharmacy (CARING MK)Price Close Relative to FTSE Bursa Malaysia KLCI Index (RHS)
510152025303540
Nov-1
3
Dec-1
3
Jan-1
4
Jan-1
4
Feb-1
4
Mar-
14
Vol m
Source: Bloomberg
Stock Profile
Bloomberg Ticker CARING MK
Avg Turnover (MYR/USD) 0.64m/0.19m
Net Gearing (%) -41.6
Market Cap (MYRm) 429m
Beta (x) n/a
BVPS (MYR) 0.53
52-wk Price low/high (MYR) 1.25 - 2.15
Free float (%) 31
Major Shareholders (%)
Motivasi Optima SB 50.4
Jitumaju SB 17.1
Share Performance (%)
1m 3m 6m 12m
Absolute 2.6 3.1 - -
Relative 0.9 2.0 - -
The Research Team +603 9207 7663
Investment Merits
Third-largest leading community pharmacy chain in Malaysia with a total of 88 outlets nationwide
High growth potential expected from 12-15 new outlets per year, concentration on healthcare business, further penetration into greater Klang Valley as well as suburban areas and potential M&As
We arrive at a TP of MYR2.57 for Caring derived from 18x FY15 EPS. The valuation is a discount to the larger cap healthcare stocks and comparable to mid-cap consumer players
Company Profile
Caring Pharmacy (Caring) was founded by a group of four pharmacists bonded by friendship and passion for the pharmaceutical field. Caring’s journey began with the opening of its first branch in Taman Muda, Cheras, in 1994. The company was incorporated in 2012 in preparation for its listing on Bursa Malaysia. To date, Caring has 88 outlets under its CARiNG brand name nationwide.
Highlights
Healthcare-centric business. Caring is currently the only pure pharmacy retail operator in Malaysia with more than 50% of its revenue coming from pharmaceutical products – comprising scheduled, over the counter (OTC) products and health supplements – while the rest are from personal care products. Caring’s competitive edge comes in the form of consultation provided by qualified pharmacists at each outlet throughout its operating hours to ensure customers are able to make informed purchases on their pharmaceutical products. We think the relationship built between pharmacists and customers will forge loyalty helping to build recurring future revenue.
Expansion plan to drive growth. Caring has recently disclosed its plan to open 12-15 new outlets per year moving forward to cement its growth prospect. At the same time, it has also expressed its intention to concentrate on further penetrating the Greater Klang Valley and other suburban areas,which includes an outlet in the newly constructed KLIA2 airport terminal.This is due to the higher profit generated from these outlets and the far lower rental costs incurred typically. As at Feb 2014, Caring has opened an additional 10 new outlets, taking its total nationwide to 88. We believe this could be the catalyst for a sustainable profit growth in the near future. Potential M&As to accelerate earnings. The current state of Malaysia’s fragmented pharmacy industry gives room for M&A opportunities between the local players. To date, out of 605 corporate companies registered with Malaysian Pharmacy Board, only eight operators have more than 20 outlets each. Caring sees earnings could potentially further accelerate if M&As between the players were to take place. This would also indirectly expand its reach to untapped areas.
Profit & Loss May-13 May-14F May-15F
Total turnover (MYRm) 321 355 407
Reported net profit (MYRm) 21 26 31
Recurring net profit (MYRm) 21 26 31
Recurring net profit growth (%) 12.5 24.2 21.8
Recurring EPS (MYR) 0.09 0.12 0.14
Recurring P/E (x) 20.76 16.71 13.72
Return on average equity (%) 41.2 23.8 25.0
P/B (x) 4.28 3.71 3.19
P/CF (x) 41.43 14.01 10.20
Source: Company data, , RHB estimates
Balance Sheet (MYRm) May-11 May-12 May-13
Total current assets - - 130
Total assets - - 176
Total current liabilities - - 62
Total non-current liabilities - - 9
Total liabilities - - 71
Shareholders' equity - - 100
Minority interests - - 5
Total equity - - 105
Total liabilities & equity - - 176
Total debt - - 9
Net debt - - (44)
Source: Company data, , RHB estimates
Source: Company data, RHB estimates
Cash flow (MYRm) May-11 May-12 May-13
Cash flow from operations - - 10
Cash flow from investing activities - - (34)
Cash flow from financing activities - - 36
Total cash generated - - 12
Implied cash at end of period - - 12
Company Report Card
Latest results. Caring’s 1HFY14 results were broadly within expectations. Net profit was recorded at MYR7.2m, or only 28% of our FY14 forecasts. This was mainly due to the one-off IPO-related costs and expenses incurred during the opening of seven new outlets during this period. Despite the weak 1H financial performance, we believe earnings will rebound and normalise in 2H, with sales from newly-opened stores starting to kick in as well as bettereconomies of scale.
Balance sheet/cashflow. Caring’s balance sheet is healthy with net gearing at just 5.0% in FY13. This is expected to reduce to 3.0-1.3% in FY14-15 respectively. Caring generates strong cash flow with free cash flow of MYR9.3mln in FY13.
ROE. Caring is forecast to registerROEof about 24-25% in FY14-15. The decline is mainly due to expenses incurred on the opening of new outlets in the coming years.
Dividend. Caring’s current dividend policy stands at 30%. However, management recently expressed its intention to increase the payout going forward. In the current FY14, Caring has paid out an interim dividend of 1.5sen.
Management. Caring’s management team consists of a group of registered pharmacists. Managing director Chong Yeow Siang, who is also the founder, has 20 years experience as a pharmacist. He was appointed in 2002 after joining the company in 1997. He is also assisted by a 10-member senior management team, with eight out of the 10 being registered pharmacists.
Recommendation
We value Caring at MYR2.57, which is derived from 18x FY15 EPS. The valuation is a discount to the larger cap healthcare stocks and comparable to mid-cap consumer counters. We like this stock due to: i) its focus in maintaining a pure pharmacy retail business structure, ii) the lack of pure pharmacy players locally and regionally, iii) its resilient store sales against any seasonality or cyclicality iv) its experienced management team, and v) solid 20% ROE.
Top Malaysia Small Cap Companies 2014
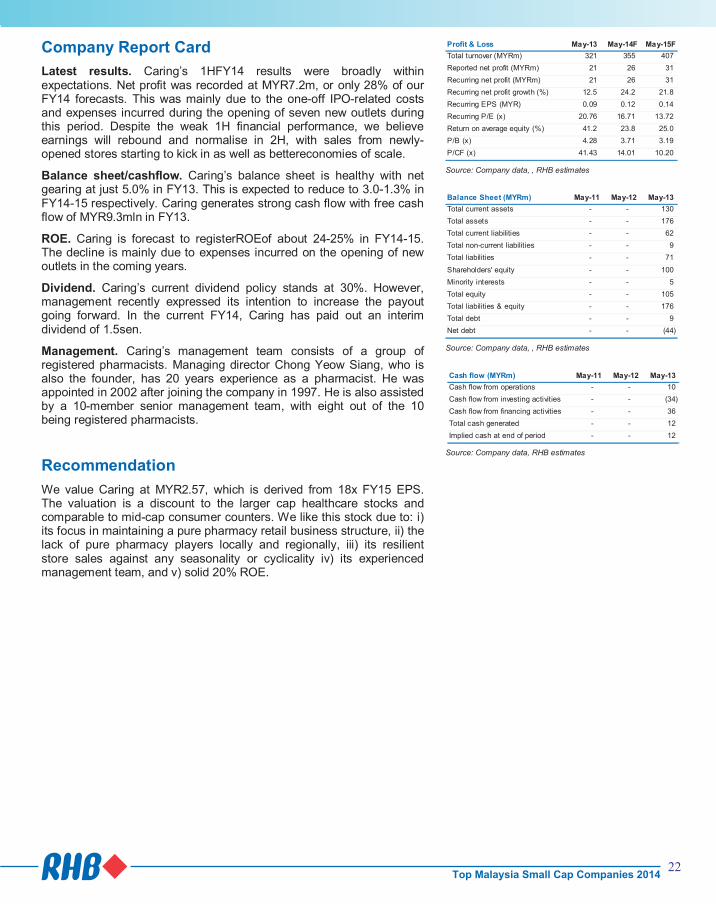
22
CARiNG Pharmacy Target: MYR2.57
Price: MYR1.97
The CARiNG Way Forward
92
107
122
137
152
167
182
1.1
1.3
1.5
1.7
1.9
2.1
2.3
Caring Pharmacy (CARING MK)Price Close Relative to FTSE Bursa Malaysia KLCI Index (RHS)
510152025303540
Nov-1
3
Dec-1
3
Jan-1
4
Jan-1
4
Feb-1
4
Mar-
14
Vol m
Source: Bloomberg
Stock Profile
Bloomberg Ticker CARING MK
Avg Turnover (MYR/USD) 0.64m/0.19m
Net Gearing (%) -41.6
Market Cap (MYRm) 429m
Beta (x) n/a
BVPS (MYR) 0.53
52-wk Price low/high (MYR) 1.25 - 2.15
Free float (%) 31
Major Shareholders (%)
Motivasi Optima SB 50.4
Jitumaju SB 17.1
Share Performance (%)
1m 3m 6m 12m
Absolute 2.6 3.1 - -
Relative 0.9 2.0 - -
The Research Team +603 9207 7663
Investment Merits
Third-largest leading community pharmacy chain in Malaysia with a total of 88 outlets nationwide
High growth potential expected from 12-15 new outlets per year, concentration on healthcare business, further penetration into greater Klang Valley as well as suburban areas and potential M&As
We arrive at a TP of MYR2.57 for Caring derived from 18x FY15 EPS. The valuation is a discount to the larger cap healthcare stocks and comparable to mid-cap consumer players
Company Profile
Caring Pharmacy (Caring) was founded by a group of four pharmacists bonded by friendship and passion for the pharmaceutical field. Caring’s journey began with the opening of its first branch in Taman Muda, Cheras, in 1994. The company was incorporated in 2012 in preparation for its listing on Bursa Malaysia. To date, Caring has 88 outlets under its CARiNG brand name nationwide.
Highlights
Healthcare-centric business. Caring is currently the only pure pharmacy retail operator in Malaysia with more than 50% of its revenue coming from pharmaceutical products – comprising scheduled, over the counter (OTC) products and health supplements – while the rest are from personal care products. Caring’s competitive edge comes in the form of consultation provided by qualified pharmacists at each outlet throughout its operating hours to ensure customers are able to make informed purchases on their pharmaceutical products. We think the relationship built between pharmacists and customers will forge loyalty helping to build recurring future revenue.
Expansion plan to drive growth. Caring has recently disclosed its plan to open 12-15 new outlets per year moving forward to cement its growth prospect. At the same time, it has also expressed its intention to concentrate on further penetrating the Greater Klang Valley and other suburban areas,which includes an outlet in the newly constructed KLIA2 airport terminal.This is due to the higher profit generated from these outlets and the far lower rental costs incurred typically. As at Feb 2014, Caring has opened an additional 10 new outlets, taking its total nationwide to 88. We believe this could be the catalyst for a sustainable profit growth in the near future. Potential M&As to accelerate earnings. The current state of Malaysia’s fragmented pharmacy industry gives room for M&A opportunities between the local players. To date, out of 605 corporate companies registered with Malaysian Pharmacy Board, only eight operators have more than 20 outlets each. Caring sees earnings could potentially further accelerate if M&As between the players were to take place. This would also indirectly expand its reach to untapped areas.
Profit & Loss May-13 May-14F May-15F
Total turnover (MYRm) 321 355 407
Reported net profit (MYRm) 21 26 31
Recurring net profit (MYRm) 21 26 31
Recurring net profit growth (%) 12.5 24.2 21.8
Recurring EPS (MYR) 0.09 0.12 0.14
Recurring P/E (x) 20.76 16.71 13.72
Return on average equity (%) 41.2 23.8 25.0
P/B (x) 4.28 3.71 3.19
P/CF (x) 41.43 14.01 10.20
Source: Company data, , RHB estimates
Balance Sheet (MYRm) May-11 May-12 May-13
Total current assets - - 130
Total assets - - 176
Total current liabilities - - 62
Total non-current liabilities - - 9
Total liabilities - - 71
Shareholders' equity - - 100
Minority interests - - 5
Total equity - - 105
Total liabilities & equity - - 176
Total debt - - 9
Net debt - - (44)
Source: Company data, , RHB estimates
Source: Company data, RHB estimates
Cash flow (MYRm) May-11 May-12 May-13
Cash flow from operations - - 10
Cash flow from investing activities - - (34)
Cash flow from financing activities - - 36
Total cash generated - - 12
Implied cash at end of period - - 12
Company Report Card
Latest results. Caring’s 1HFY14 results were broadly within expectations. Net profit was recorded at MYR7.2m, or only 28% of our FY14 forecasts. This was mainly due to the one-off IPO-related costs and expenses incurred during the opening of seven new outlets during this period. Despite the weak 1H financial performance, we believe earnings will rebound and normalise in 2H, with sales from newly-opened stores starting to kick in as well as bettereconomies of scale.
Balance sheet/cashflow. Caring’s balance sheet is healthy with net gearing at just 5.0% in FY13. This is expected to reduce to 3.0-1.3% in FY14-15 respectively. Caring generates strong cash flow with free cash flow of MYR9.3mln in FY13.
ROE. Caring is forecast to registerROEof about 24-25% in FY14-15. The decline is mainly due to expenses incurred on the opening of new outlets in the coming years.
Dividend. Caring’s current dividend policy stands at 30%. However, management recently expressed its intention to increase the payout going forward. In the current FY14, Caring has paid out an interim dividend of 1.5sen.
Management. Caring’s management team consists of a group of registered pharmacists. Managing director Chong Yeow Siang, who is also the founder, has 20 years experience as a pharmacist. He was appointed in 2002 after joining the company in 1997. He is also assisted by a 10-member senior management team, with eight out of the 10 being registered pharmacists.
Recommendation
We value Caring at MYR2.57, which is derived from 18x FY15 EPS. The valuation is a discount to the larger cap healthcare stocks and comparable to mid-cap consumer counters. We like this stock due to: i) its focus in maintaining a pure pharmacy retail business structure, ii) the lack of pure pharmacy players locally and regionally, iii) its resilient store sales against any seasonality or cyclicality iv) its experienced management team, and v) solid 20% ROE.
Top Malaysia Small Cap Companies 2014
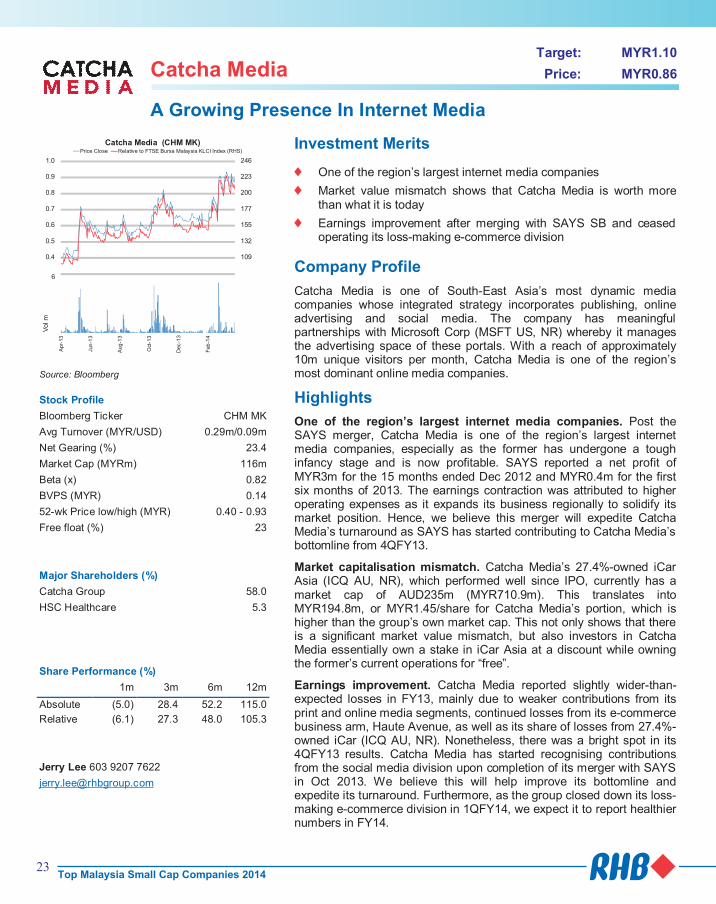
23
Catcha Media Target: MYR1.10
Price: MYR0.86
A Growing Presence In Internet Media
86
109
132
155
177
200
223
246
0.3
0.4
0.5
0.6
0.7
0.8
0.9
1.0
Catcha Media (CHM MK)Price Close Relative to FTSE Bursa Malaysia KLCI Index (RHS)
1
2
3
4
5
6
Apr-
13
Jun
-13
Aug
-13
Oct
-13
Dec-1
3
Feb
-14
Vol m
Source: Bloomberg
Stock Profile
Bloomberg Ticker CHM MK
Avg Turnover (MYR/USD) 0.29m/0.09m
Net Gearing (%) 23.4
Market Cap (MYRm) 116m
Beta (x) 0.82
BVPS (MYR) 0.14
52-wk Price low/high (MYR) 0.40 - 0.93
Free float (%) 23
Major Shareholders (%)
Catcha Group 58.0
HSC Healthcare 5.3
Share Performance (%)
1m 3m 6m 12m
Absolute (5.0) 28.4 52.2 115.0
Relative (6.1) 27.3 48.0 105.3
Jerry Lee 603 9207 7622
Investment Merits
One of the region’s largest internet media companies
Market value mismatch shows that Catcha Media is worth more than what it is today
Earnings improvement after merging with SAYS SB and ceased operating its loss-making e-commerce division
Company Profile
Catcha Media is one of South-East Asia’s most dynamic media companies whose integrated strategy incorporates publishing, online advertising and social media. The company has meaningful partnerships with Microsoft Corp (MSFT US, NR) whereby it manages the advertising space of these portals. With a reach of approximately 10m unique visitors per month, Catcha Media is one of the region’s most dominant online media companies.
Highlights
One of the region’s largest internet media companies. Post the SAYS merger, Catcha Media is one of the region’s largest internet media companies, especially as the former has undergone a tough infancy stage and is now profitable. SAYS reported a net profit of MYR3m for the 15 months ended Dec 2012 and MYR0.4m for the first six months of 2013. The earnings contraction was attributed to higher operating expenses as it expands its business regionally to solidify its market position. Hence, we believe this merger will expedite Catcha Media’s turnaround as SAYS has started contributing to Catcha Media’s bottomline from 4QFY13.
Market capitalisation mismatch. Catcha Media’s 27.4%-owned iCar Asia (ICQ AU, NR), which performed well since IPO, currently has a market cap of AUD235m (MYR710.9m). This translates into MYR194.8m, or MYR1.45/share for Catcha Media’s portion, which is higher than the group’s own market cap. This not only shows that there is a significant market value mismatch, but also investors in Catcha Media essentially own a stake in iCar Asia at a discount while owning the former’s current operations for “free”.
Earnings improvement. Catcha Media reported slightly wider-than-expected losses in FY13, mainly due to weaker contributions from its print and online media segments, continued losses from its e-commerce business arm, Haute Avenue, as well as its share of losses from 27.4%-owned iCar (ICQ AU, NR). Nonetheless, there was a bright spot in its 4QFY13 results. Catcha Media has started recognising contributions from the social media division upon completion of its merger with SAYS in Oct 2013. We believe this will help improve its bottomline and expedite its turnaround. Furthermore, as the group closed down its loss-making e-commerce division in 1QFY14, we expect it to report healthier numbers in FY14.
Profit & Loss Dec-12 Dec-13 Dec-14F
Total turnover (MYRm) 38 36 46
Reported net profit (MYRm) 5 (3) (4)
Recurring net profit (MYRm) (14) (7) (4)
Recurring net profit growth (%) (4,949.3) (46.5) (52.4)
Recurring EPS (MYR) (0.10) (0.05) (0.03)
Recurring P/E (x) na na na
Return on average equity (%) 18.8 (12.3) (17.3)
P/B (x) 4.08 5.30 6.16
P/CF (x) 71.04 na na
Source: Company data, RHB estimates
Balance Sheet (MYRm) Dec-12 Dec-13 Dec-14F
Total current assets 14 18 15
Total assets 41 42 40
Total current liabilities 13 18 19
Total non-current liabilities 0 3 3
Total liabilities 13 21 22
Shareholders' equity 28 22 19
Minority interests - (1) (1)
Other equity - 0 -
Total equity 28 21 18
Total liabilities & equity 41 42 40
Total debt - 5 6
Net debt (1) 3 4
Source: Company data, RHB estimates
Cash flow (MYRm) Dec-12 Dec-13 Dec-14F
Cash flow from operations 2 (14) (3)
Cash flow from investing activities (6) 14 (1)
Cash flow from financing activities - 5 4
Cash at beginning of period 9 1 2
Total cash generated (4) 5 (0)
Implied cash at end of period 5 6 1
Source: Company data, RHB estimates
Company Report Card
Latest results. Catcha Media’s MYR7.4m FY13 core net loss, after stripping out the MYR4.3m in exceptional items that include: i) a windfall gain received from the Catcha Group, ii) dilution of interest in associates, and iii) impairments made, was slightly below our estimates. While its publishing and online media businesses continued to contribute positively, the group’s overall performance was again dragged down by investment losses incurred by its e-commerce division as it seeks to capture market share.
Balance sheet/cash flow. Slightly geared, but this does not pose much concern as the company’s cash flow is still healthy. However, it is necessary to monitor the cash burn rate.
ROE. Not meaningful as we still expect it to report losses, mainly due to its share of losses from its iCar associate.
Dividend. No dividend payout.
Management. Catcha Media is helmed by CEO Patrick Grove. Together with Kensuke Tsurumaru and Luke Elliot, the trio earlier founded Asia’s most successful property web portal, iProperty.com (Catcha’s sister company), which was listed on the Australia Stock Exchange in 2007 under the company’s name IPGA Ltd. iProperty’s market cap has grown 172% to AUD220m since its listing.
Recommendation
We remain positive on Catcha Media’s outlook in view of its merger with SAYS and its ongoing efforts to garner a larger market share. Maintain BUY, with our SOP-based FV maintained at MYR1.10, ascribing a 20% discount to the valuation of iCar. There are also no changes to our earnings forecasts.
Top Malaysia Small Cap Companies 2014
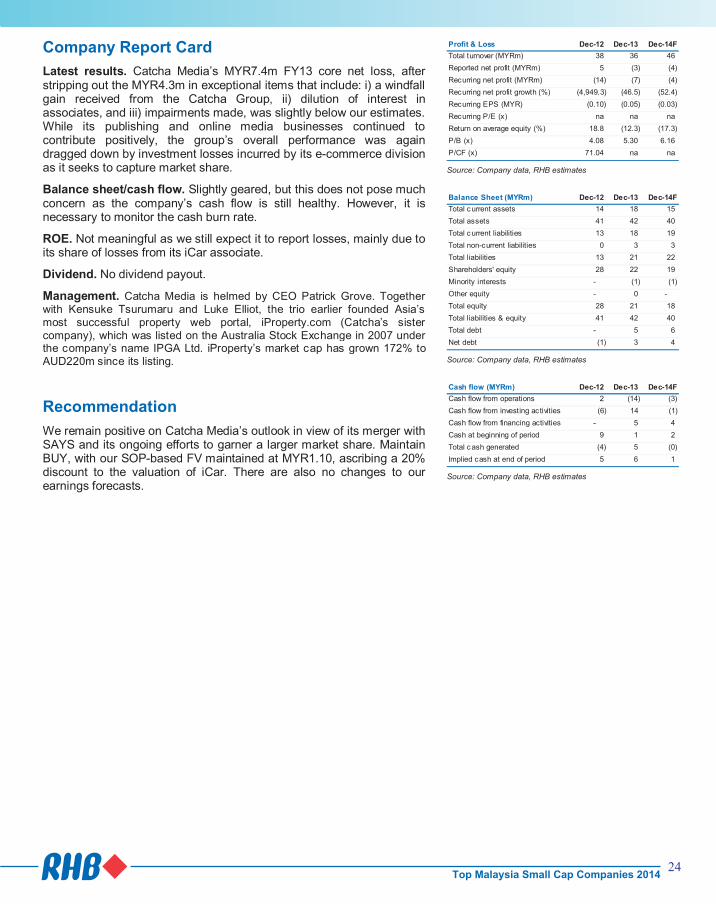
24
Catcha Media Target: MYR1.10
Price: MYR0.86
A Growing Presence In Internet Media
86
109
132
155
177
200
223
246
0.3
0.4
0.5
0.6
0.7
0.8
0.9
1.0
Catcha Media (CHM MK)Price Close Relative to FTSE Bursa Malaysia KLCI Index (RHS)
1
2
3
4
5
6
Apr-
13
Jun
-13
Aug
-13
Oct
-13
Dec-1
3
Feb
-14
Vol m
Source: Bloomberg
Stock Profile
Bloomberg Ticker CHM MK
Avg Turnover (MYR/USD) 0.29m/0.09m
Net Gearing (%) 23.4
Market Cap (MYRm) 116m
Beta (x) 0.82
BVPS (MYR) 0.14
52-wk Price low/high (MYR) 0.40 - 0.93
Free float (%) 23
Major Shareholders (%)
Catcha Group 58.0
HSC Healthcare 5.3
Share Performance (%)
1m 3m 6m 12m
Absolute (5.0) 28.4 52.2 115.0
Relative (6.1) 27.3 48.0 105.3
Jerry Lee 603 9207 7622
Investment Merits
One of the region’s largest internet media companies
Market value mismatch shows that Catcha Media is worth more than what it is today
Earnings improvement after merging with SAYS SB and ceased operating its loss-making e-commerce division
Company Profile
Catcha Media is one of South-East Asia’s most dynamic media companies whose integrated strategy incorporates publishing, online advertising and social media. The company has meaningful partnerships with Microsoft Corp (MSFT US, NR) whereby it manages the advertising space of these portals. With a reach of approximately 10m unique visitors per month, Catcha Media is one of the region’s most dominant online media companies.
Highlights
One of the region’s largest internet media companies. Post the SAYS merger, Catcha Media is one of the region’s largest internet media companies, especially as the former has undergone a tough infancy stage and is now profitable. SAYS reported a net profit of MYR3m for the 15 months ended Dec 2012 and MYR0.4m for the first six months of 2013. The earnings contraction was attributed to higher operating expenses as it expands its business regionally to solidify its market position. Hence, we believe this merger will expedite Catcha Media’s turnaround as SAYS has started contributing to Catcha Media’s bottomline from 4QFY13.
Market capitalisation mismatch. Catcha Media’s 27.4%-owned iCar Asia (ICQ AU, NR), which performed well since IPO, currently has a market cap of AUD235m (MYR710.9m). This translates into MYR194.8m, or MYR1.45/share for Catcha Media’s portion, which is higher than the group’s own market cap. This not only shows that there is a significant market value mismatch, but also investors in Catcha Media essentially own a stake in iCar Asia at a discount while owning the former’s current operations for “free”.
Earnings improvement. Catcha Media reported slightly wider-than-expected losses in FY13, mainly due to weaker contributions from its print and online media segments, continued losses from its e-commerce business arm, Haute Avenue, as well as its share of losses from 27.4%-owned iCar (ICQ AU, NR). Nonetheless, there was a bright spot in its 4QFY13 results. Catcha Media has started recognising contributions from the social media division upon completion of its merger with SAYS in Oct 2013. We believe this will help improve its bottomline and expedite its turnaround. Furthermore, as the group closed down its loss-making e-commerce division in 1QFY14, we expect it to report healthier numbers in FY14.
Profit & Loss Dec-12 Dec-13 Dec-14F
Total turnover (MYRm) 38 36 46
Reported net profit (MYRm) 5 (3) (4)
Recurring net profit (MYRm) (14) (7) (4)
Recurring net profit growth (%) (4,949.3) (46.5) (52.4)
Recurring EPS (MYR) (0.10) (0.05) (0.03)
Recurring P/E (x) na na na
Return on average equity (%) 18.8 (12.3) (17.3)
P/B (x) 4.08 5.30 6.16
P/CF (x) 71.04 na na
Source: Company data, RHB estimates
Balance Sheet (MYRm) Dec-12 Dec-13 Dec-14F
Total current assets 14 18 15
Total assets 41 42 40
Total current liabilities 13 18 19
Total non-current liabilities 0 3 3
Total liabilities 13 21 22
Shareholders' equity 28 22 19
Minority interests - (1) (1)
Other equity - 0 -
Total equity 28 21 18
Total liabilities & equity 41 42 40
Total debt - 5 6
Net debt (1) 3 4
Source: Company data, RHB estimates
Cash flow (MYRm) Dec-12 Dec-13 Dec-14F
Cash flow from operations 2 (14) (3)
Cash flow from investing activities (6) 14 (1)
Cash flow from financing activities - 5 4
Cash at beginning of period 9 1 2
Total cash generated (4) 5 (0)
Implied cash at end of period 5 6 1
Source: Company data, RHB estimates
Company Report Card
Latest results. Catcha Media’s MYR7.4m FY13 core net loss, after stripping out the MYR4.3m in exceptional items that include: i) a windfall gain received from the Catcha Group, ii) dilution of interest in associates, and iii) impairments made, was slightly below our estimates. While its publishing and online media businesses continued to contribute positively, the group’s overall performance was again dragged down by investment losses incurred by its e-commerce division as it seeks to capture market share.
Balance sheet/cash flow. Slightly geared, but this does not pose much concern as the company’s cash flow is still healthy. However, it is necessary to monitor the cash burn rate.
ROE. Not meaningful as we still expect it to report losses, mainly due to its share of losses from its iCar associate.
Dividend. No dividend payout.
Management. Catcha Media is helmed by CEO Patrick Grove. Together with Kensuke Tsurumaru and Luke Elliot, the trio earlier founded Asia’s most successful property web portal, iProperty.com (Catcha’s sister company), which was listed on the Australia Stock Exchange in 2007 under the company’s name IPGA Ltd. iProperty’s market cap has grown 172% to AUD220m since its listing.
Recommendation
We remain positive on Catcha Media’s outlook in view of its merger with SAYS and its ongoing efforts to garner a larger market share. Maintain BUY, with our SOP-based FV maintained at MYR1.10, ascribing a 20% discount to the valuation of iCar. There are also no changes to our earnings forecasts.
Top Malaysia Small Cap Companies 2014

25
Complete Logistic Services Target: MYR0.97
Price: MYR0.73
An Undervalued Gem With Great Potential
89
104
119
134
149
164
0.30
0.40
0.50
0.60
0.70
0.80
0.90
Complete Logistic Services (CLSB MK)Price Close Relative to FTSE Bursa Malaysia KLCI Index (RHS)
100
200
300
400
500
Apr-
13
Jun
-13
Aug
-13
Oct
-13
Dec-1
3
Feb
-14
Vol th
Source: Bloomberg
Stock Profile
Bloomberg Ticker CLSB MK
Avg Turnover (MYR/USD) 0.03m/0.01m
Net Gearing (%) 0.6
Market Cap (MYRm) 87.4m
Beta (x) 0.64
BVPS (MYR) 0.85
52-wk Price low/high (MYR) 0.43 - 0.79
Free float (%) 27
Major Shareholders(%)
Dolphin Assets SB 29.2
Law Hee Ling 19.9
Pusaka Unggul SB 9.2
Share Performance (%)
1m 3m 6m 12m
Absolute 3.5 14.1 7.4 69.8
Relative 2.2 12.7 3.7 61.3
Jerry Lee 603 9207 7622
Investment Merits
Restructuring of business model yields positive results
Innovative logistics business model to drive earnings growth
Trading at an undemanding P/E of 5.3x, which is below the peer average of 13x
Company Profile
Principally an investment holding company, Complete Logistic Services (Complete Logistic)’ wholly-owned subsidiaries are involved in owning ships, trading of freight, as well as providing services in marine transportation, container haulage, custom brokerage & forwarding and warehousing. It also provides lorry and trucking as well as total logistics services. It went through a restructuring process about 4-5 years ago, aiming to develop its land logistic unit to offset the effects of an anticipated deterioration in the shipping industry.
Highlights
A new beginning in FY13. Complete Logistic began restructuring its business model 4-5 years ago, to focus on land logistic services in order to counter effects of the then-anticipated deterioration in the shipping industry. It completed the acquisition of Guper Integrated Logistics SB in FY12, followed by Pengangkutan Sekata SB in FY13, to expand its land logistics arm. The group also made a provision for impairment losses on certain vessels amounting to MYR18.6m in order to clean up its books in FY12. These changes were proven successful as core earnings jumped >100% y-o-y in FY13, while its profit margin improved from low single digits to 11.7%. Complete Logistic continued to grow positively in 9MFY14, with net profit surging 51% y-o-y.
Shipping is profitable despite a challenging environment. As the shipping business has been a very challenging one in the past few years, Complete Logistic has decided to downsize its fleet. As a result, it is now placing greater focus on land logistic services. Nonetheless, with an experienced management team and prudent cost controls, its shipping division has always recorded profits even though low freight rates have caused most shipping companies to be in the red. Its shipping division reported a pre-tax profit of MYR2.5m in FY13.
New business plan for logistics unit to propel earnings. We understand that Complete Logistic is currently restructuring the business model of its logistics unit to drive growth. One of the initiatives is to expand its land logistic services by expanding its fleet and warehousing facilities. As management has realised the traditional logistics industry is both fragmented and competitive, it is working on more innovative solutions to drive earnings growth.
Profit & Loss Mar-12 Mar-13 Mar-14F
Total turnover (MYRm) 103 102 116
Reported net profit (MYRm) (16) 12 15
Recurring net profit (MYRm) 2 12 15
Recurring net profit growth (%) (39.3) 411.7 20.9
Recurring EPS (MYR) 0.02 0.10 0.12
Recurring P/E (x) 37.27 7.28 6.02
Return on average equity (%) (19.4) 14.7 15.3
P/B (x) 1.15 1.00 0.85
P/CF (x) 2.61 6.06 5.48
Source: Company data, RHB estimates
Balance Sheet (MYRm) Mar-12 Mar-13 Mar-14F
Total current assets 40 45 50
Total assets 122 126 136
Total current liabilities 28 20 17
Total non-current liabilities 19 18 17
Total liabilities 46 38 34
Shareholders' equity 76 88 102
Minority interests 0 0 0
Other equity (0) (0) (0)
Total equity 76 88 102
Total liabilities & equity 122 126 136
Total debt 21 19 18
Net debt 11 7 1
Source: Company data, RHB estimates
Cash flow (MYRm) Mar-12 Mar-13 Mar-14F
Cash flow from operations 33 14 16
Cash flow from investing activities (21) 1 (7)
Cash flow from financing activities 3 (11) (4)
Cash at beginning of period 12 10 12
Total cash generated 16 5 5
Forex effects 1 (3) -
Implied cash at end of period 29 12 17
Source: Company data, RHB estimates
Trading at an undemanding valuation. Complete Logistic is currently trading at a mere 5.3x P/E, which is far below its logistics peers’ average 13x. As such, we believe that the stock is a hidden gem that has yet to be uncovered.
Company Report Card
Latest results. Complete Logistic’s 9MFY14 net profit grew by 51% y-o-y to MYR13.2m on the back of a surge in revenue to MYR92.7m (15% y-o-y). Of its divisions (ie shipping, logistics and trading), logistics chartered the strongest growth in net profit. Earnings from logistics segment expanded by 17% y-o-y, mainly contributed by newly-acquired Pengangkutan Sekata SB during the financial year.
Balance sheet/cash flow. Its net gearing was at 7.7% in 9MFY14, compared with 8.1% in FY13. Cash flow remains healthy.
ROE. Complete Logistic achieved a ROE of 14.7% in FY13.
Dividend. There were no dividends paid in the last two financial years.
Management. The management team is helmed by Mr Johnny Law, the managing director and founder of the group. Mr Law has over 30 years of experience in the shipping industry, and expanded the group’s fleet and grew its business activities to cover marine transportation services, logistics operations and general trading. He is responsible for the overall management and operations of the group.
Recommendation
We think that Complete Logistic is an undervalued gem, based on its potential earnings growth and low P/E. At the current price, the stock is currently trading at a 5.3x P/E, which is 60% below the local logistics peer average of 13x. We value the stock at an 8x forward P/E, which is still 38% below the industry average. Our FV of MYR0.97 implies an upside of 33% from its last closing price of MYR0.73.
Top Malaysia Small Cap Companies 2014

26
Complete Logistic Services Target: MYR0.97
Price: MYR0.73
An Undervalued Gem With Great Potential
89
104
119
134
149
164
0.30
0.40
0.50
0.60
0.70
0.80
0.90
Complete Logistic Services (CLSB MK)Price Close Relative to FTSE Bursa Malaysia KLCI Index (RHS)
100
200
300
400
500
Apr-
13
Jun
-13
Aug
-13
Oct
-13
Dec-1
3
Feb
-14
Vol th
Source: Bloomberg
Stock Profile
Bloomberg Ticker CLSB MK
Avg Turnover (MYR/USD) 0.03m/0.01m
Net Gearing (%) 0.6
Market Cap (MYRm) 87.4m
Beta (x) 0.64
BVPS (MYR) 0.85
52-wk Price low/high (MYR) 0.43 - 0.79
Free float (%) 27
Major Shareholders(%)
Dolphin Assets SB 29.2
Law Hee Ling 19.9
Pusaka Unggul SB 9.2
Share Performance (%)
1m 3m 6m 12m
Absolute 3.5 14.1 7.4 69.8
Relative 2.2 12.7 3.7 61.3
Jerry Lee 603 9207 7622
Investment Merits
Restructuring of business model yields positive results
Innovative logistics business model to drive earnings growth
Trading at an undemanding P/E of 5.3x, which is below the peer average of 13x
Company Profile
Principally an investment holding company, Complete Logistic Services (Complete Logistic)’ wholly-owned subsidiaries are involved in owning ships, trading of freight, as well as providing services in marine transportation, container haulage, custom brokerage & forwarding and warehousing. It also provides lorry and trucking as well as total logistics services. It went through a restructuring process about 4-5 years ago, aiming to develop its land logistic unit to offset the effects of an anticipated deterioration in the shipping industry.
Highlights
A new beginning in FY13. Complete Logistic began restructuring its business model 4-5 years ago, to focus on land logistic services in order to counter effects of the then-anticipated deterioration in the shipping industry. It completed the acquisition of Guper Integrated Logistics SB in FY12, followed by Pengangkutan Sekata SB in FY13, to expand its land logistics arm. The group also made a provision for impairment losses on certain vessels amounting to MYR18.6m in order to clean up its books in FY12. These changes were proven successful as core earnings jumped >100% y-o-y in FY13, while its profit margin improved from low single digits to 11.7%. Complete Logistic continued to grow positively in 9MFY14, with net profit surging 51% y-o-y.
Shipping is profitable despite a challenging environment. As the shipping business has been a very challenging one in the past few years, Complete Logistic has decided to downsize its fleet. As a result, it is now placing greater focus on land logistic services. Nonetheless, with an experienced management team and prudent cost controls, its shipping division has always recorded profits even though low freight rates have caused most shipping companies to be in the red. Its shipping division reported a pre-tax profit of MYR2.5m in FY13.
New business plan for logistics unit to propel earnings. We understand that Complete Logistic is currently restructuring the business model of its logistics unit to drive growth. One of the initiatives is to expand its land logistic services by expanding its fleet and warehousing facilities. As management has realised the traditional logistics industry is both fragmented and competitive, it is working on more innovative solutions to drive earnings growth.
Profit & Loss Mar-12 Mar-13 Mar-14F
Total turnover (MYRm) 103 102 116
Reported net profit (MYRm) (16) 12 15
Recurring net profit (MYRm) 2 12 15
Recurring net profit growth (%) (39.3) 411.7 20.9
Recurring EPS (MYR) 0.02 0.10 0.12
Recurring P/E (x) 37.27 7.28 6.02
Return on average equity (%) (19.4) 14.7 15.3
P/B (x) 1.15 1.00 0.85
P/CF (x) 2.61 6.06 5.48
Source: Company data, RHB estimates
Balance Sheet (MYRm) Mar-12 Mar-13 Mar-14F
Total current assets 40 45 50
Total assets 122 126 136
Total current liabilities 28 20 17
Total non-current liabilities 19 18 17
Total liabilities 46 38 34
Shareholders' equity 76 88 102
Minority interests 0 0 0
Other equity (0) (0) (0)
Total equity 76 88 102
Total liabilities & equity 122 126 136
Total debt 21 19 18
Net debt 11 7 1
Source: Company data, RHB estimates
Cash flow (MYRm) Mar-12 Mar-13 Mar-14F
Cash flow from operations 33 14 16
Cash flow from investing activities (21) 1 (7)
Cash flow from financing activities 3 (11) (4)
Cash at beginning of period 12 10 12
Total cash generated 16 5 5
Forex effects 1 (3) -
Implied cash at end of period 29 12 17
Source: Company data, RHB estimates
Trading at an undemanding valuation. Complete Logistic is currently trading at a mere 5.3x P/E, which is far below its logistics peers’ average 13x. As such, we believe that the stock is a hidden gem that has yet to be uncovered.
Company Report Card
Latest results. Complete Logistic’s 9MFY14 net profit grew by 51% y-o-y to MYR13.2m on the back of a surge in revenue to MYR92.7m (15% y-o-y). Of its divisions (ie shipping, logistics and trading), logistics chartered the strongest growth in net profit. Earnings from logistics segment expanded by 17% y-o-y, mainly contributed by newly-acquired Pengangkutan Sekata SB during the financial year.
Balance sheet/cash flow. Its net gearing was at 7.7% in 9MFY14, compared with 8.1% in FY13. Cash flow remains healthy.
ROE. Complete Logistic achieved a ROE of 14.7% in FY13.
Dividend. There were no dividends paid in the last two financial years.
Management. The management team is helmed by Mr Johnny Law, the managing director and founder of the group. Mr Law has over 30 years of experience in the shipping industry, and expanded the group’s fleet and grew its business activities to cover marine transportation services, logistics operations and general trading. He is responsible for the overall management and operations of the group.
Recommendation
We think that Complete Logistic is an undervalued gem, based on its potential earnings growth and low P/E. At the current price, the stock is currently trading at a 5.3x P/E, which is 60% below the local logistics peer average of 13x. We value the stock at an 8x forward P/E, which is still 38% below the industry average. Our FV of MYR0.97 implies an upside of 33% from its last closing price of MYR0.73.
Top Malaysia Small Cap Companies 2014
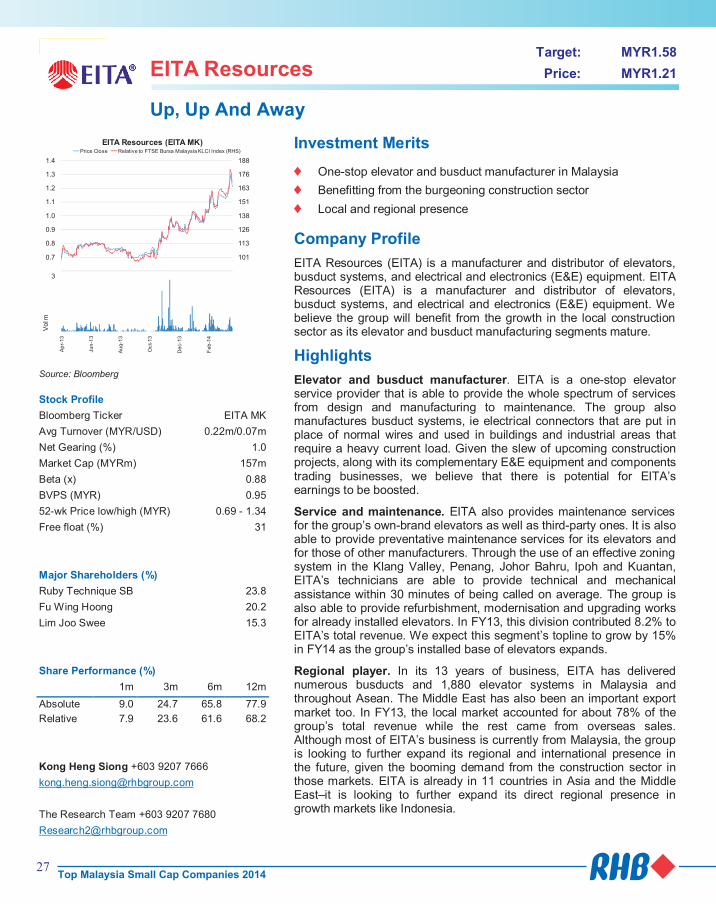
27
Corp Logo
EITA Resources Target: MYR1.58
Price: MYR1.21
Up, Up And Away
88
101
113
126
138
151
163
176
188
0.6
0.7
0.8
0.9
1.0
1.1
1.2
1.3
1.4
EITA Resources (EITA MK)Price Close Relative to FTSE Bursa Malaysia KLCI Index (RHS)
1
1
2
2
3
3
Ap
r-13
Jun
-13
Au
g-1
3
Oct-
13
Dec-1
3
Feb
-14
Vol m
Source: Bloomberg
Stock Profile
Bloomberg Ticker EITA MK
Avg Turnover (MYR/USD) 0.22m/0.07m
Net Gearing (%) 1.0
Market Cap (MYRm) 157m
Beta (x) 0.88
BVPS (MYR) 0.95
52-wk Price low/high (MYR) 0.69 - 1.34
Free float (%) 31
Major Shareholders (%)
Ruby Technique SB 23.8
Fu Wing Hoong 20.2
Lim Joo Swee 15.3
Share Performance (%)
1m 3m 6m 12m
Absolute 9.0 24.7 65.8 77.9
Relative 7.9 23.6 61.6 68.2
Kong Heng Siong +603 9207 7666
The Research Team +603 9207 7680
Investment Merits
One-stop elevator and busduct manufacturer in Malaysia
Benefitting from the burgeoning construction sector
Local and regional presence
Company Profile
EITA Resources (EITA) is a manufacturer and distributor of elevators, busduct systems, and electrical and electronics (E&E) equipment. EITA Resources (EITA) is a manufacturer and distributor of elevators, busduct systems, and electrical and electronics (E&E) equipment. We believe the group will benefit from the growth in the local construction sector as its elevator and busduct manufacturing segments mature.
Highlights
Elevator and busduct manufacturer. EITA is a one-stop elevator service provider that is able to provide the whole spectrum of services from design and manufacturing to maintenance. The group also manufactures busduct systems, ie electrical connectors that are put in place of normal wires and used in buildings and industrial areas that require a heavy current load. Given the slew of upcoming construction projects, along with its complementary E&E equipment and components trading businesses, we believe that there is potential for EITA’s earnings to be boosted.
Service and maintenance. EITA also provides maintenance services for the group’s own-brand elevators as well as third-party ones. It is also able to provide preventative maintenance services for its elevators and for those of other manufacturers. Through the use of an effective zoning system in the Klang Valley, Penang, Johor Bahru, Ipoh and Kuantan, EITA’s technicians are able to provide technical and mechanical assistance within 30 minutes of being called on average. The group is also able to provide refurbishment, modernisation and upgrading works for already installed elevators. In FY13, this division contributed 8.2% to EITA’s total revenue. We expect this segment’s topline to grow by 15% in FY14 as the group’s installed base of elevators expands.
Regional player. In its 13 years of business, EITA has delivered numerous busducts and 1,880 elevator systems in Malaysia and throughout Asean. The Middle East has also been an important export market too. In FY13, the local market accounted for about 78% of the group’s total revenue while the rest came from overseas sales. Although most of EITA’s business is currently from Malaysia, the group is looking to further expand its regional and international presence in the future, given the booming demand from the construction sector in those markets. EITA is already in 11 countries in Asia and the Middle East–it is looking to further expand its direct regional presence in growth markets like Indonesia.
Profit & Loss Sep-13 Sep-14F Sep-15F
Total turnover (MYRm) 191 204 224
Reported net profit (MYRm) 15 18 20
Recurring net profit (MYRm) 15 18 20
Recurring net profit growth (%) (14.4) 55.3 9.9
Recurring EPS (MYR) 0.12 0.14 0.16
DPS (MYR) 0.04 0.04 0.05
Dividend Yield (%) 3.2 3.4 3.8
Recurring P/E (x) 10.15 8.55 7.78
Return on average equity (%) 11.1 15.8 15.6
P/B (x) 1.43 1.28 1.15
P/CF (x) 106.03 27.78 11.74
Source: Company data, RHB estimates.
Balance Sheet (MYRm) Sep-13 Sep-14F Sep-15F
Total current assets 146 164 177
Total assets 159 189 205
Total current liabilities 47 64 66
Total non-current liabilities 1 1 1
Total liabilities 48 65 67
Shareholders' equity 110 123 137
Minority interests 1 1 1
Other equity 0 - 0
Total equity 111 124 138
Total liabilities & equity 159 189 205
Total debt 12 20 18
Net debt (12) 1 1
Source: Company data, RHB estimates.
Cash flow (MYRm) Sep-13 Sep-14F Sep-15F
Cash flow from operations 1 6 13
Cash flow from investing activities (0) (13) (6)
Cash flow from financing activities (8) 2 (9)
Cash at beginning of period 35 24 19
Total cash generated (7) (5) (2)
Forex effects 0 - -
Implied cash at end of period 24 19 17
Source: Company data, RHB estimates.
Company Report Card
Latest results. Note that EITA recently changed its financial year-end from December to September, for comparison purposes we are annualising the group’s FY13 numbers. For EITA’s recently ended FY13, it posted revenue of MYR142.1m (MYR190.9m annualised), with elevator and busduct manufacturing making up 52% of this total, and its marketing & distribution and technical services contributing 40% and 8% respectively. EITA registered a PAT of MYR11.7m (MYR15.3m annualised) with an 8.2% PAT margin – a 7.1% y-o-y increase.
Balance sheet/cash flow. EITA has a healthy net cash balance sheet, with its operations generating a positive cash flow.
ROE. We expect EITA to return an ROE of 15.8% in FY14, driven by the demand for its manufacturing segment’s products.
Dividend. We expect a full-year DPS of 4.1 sen for FY14, based on a 30% payout ratio assumption. Given its net cash position, we do not discount the possibility of management increasing this ratio.
Management. The company is currently led by group chairman Dato’ Siew Kim Lun while the management team is led by MD Mr Fu Wing Hoong. The latter is an engineer by training and is a co-founder of EITA. He is ably assisted by Mr Lim Joo Swee and Mr Chong Yoke Peng, who are both executive directors and co-founders of the group.
Recommendation
Ascribing a CY14F P/E of 11.0x for EITA, we arrive at our FV of MYR1.58. We believe the growth potential for the group will be driven by the growing demand for its elevators and busducts from the local, regional and international construction sector.
Top Malaysia Small Cap Companies 2014
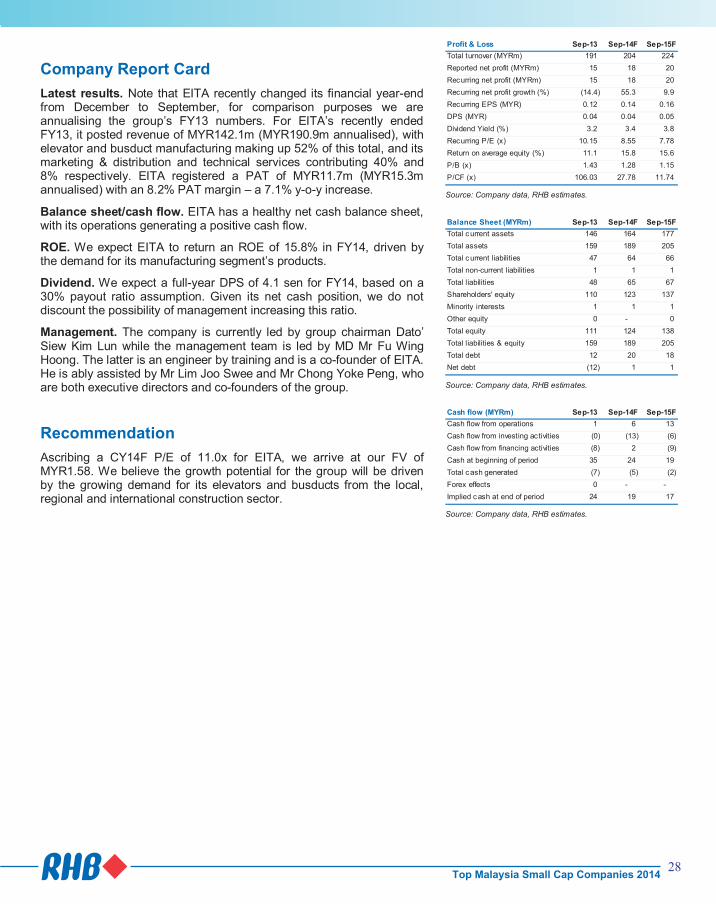
28
Corp Logo
EITA Resources Target: MYR1.58
Price: MYR1.21
Up, Up And Away
88
101
113
126
138
151
163
176
188
0.6
0.7
0.8
0.9
1.0
1.1
1.2
1.3
1.4
EITA Resources (EITA MK)Price Close Relative to FTSE Bursa Malaysia KLCI Index (RHS)
1
1
2
2
3
3
Ap
r-13
Jun
-13
Au
g-1
3
Oct-
13
Dec-1
3
Feb
-14
Vol m
Source: Bloomberg
Stock Profile
Bloomberg Ticker EITA MK
Avg Turnover (MYR/USD) 0.22m/0.07m
Net Gearing (%) 1.0
Market Cap (MYRm) 157m
Beta (x) 0.88
BVPS (MYR) 0.95
52-wk Price low/high (MYR) 0.69 - 1.34
Free float (%) 31
Major Shareholders (%)
Ruby Technique SB 23.8
Fu Wing Hoong 20.2
Lim Joo Swee 15.3
Share Performance (%)
1m 3m 6m 12m
Absolute 9.0 24.7 65.8 77.9
Relative 7.9 23.6 61.6 68.2
Kong Heng Siong +603 9207 7666
The Research Team +603 9207 7680
Investment Merits
One-stop elevator and busduct manufacturer in Malaysia
Benefitting from the burgeoning construction sector
Local and regional presence
Company Profile
EITA Resources (EITA) is a manufacturer and distributor of elevators, busduct systems, and electrical and electronics (E&E) equipment. EITA Resources (EITA) is a manufacturer and distributor of elevators, busduct systems, and electrical and electronics (E&E) equipment. We believe the group will benefit from the growth in the local construction sector as its elevator and busduct manufacturing segments mature.
Highlights
Elevator and busduct manufacturer. EITA is a one-stop elevator service provider that is able to provide the whole spectrum of services from design and manufacturing to maintenance. The group also manufactures busduct systems, ie electrical connectors that are put in place of normal wires and used in buildings and industrial areas that require a heavy current load. Given the slew of upcoming construction projects, along with its complementary E&E equipment and components trading businesses, we believe that there is potential for EITA’s earnings to be boosted.
Service and maintenance. EITA also provides maintenance services for the group’s own-brand elevators as well as third-party ones. It is also able to provide preventative maintenance services for its elevators and for those of other manufacturers. Through the use of an effective zoning system in the Klang Valley, Penang, Johor Bahru, Ipoh and Kuantan, EITA’s technicians are able to provide technical and mechanical assistance within 30 minutes of being called on average. The group is also able to provide refurbishment, modernisation and upgrading works for already installed elevators. In FY13, this division contributed 8.2% to EITA’s total revenue. We expect this segment’s topline to grow by 15% in FY14 as the group’s installed base of elevators expands.
Regional player. In its 13 years of business, EITA has delivered numerous busducts and 1,880 elevator systems in Malaysia and throughout Asean. The Middle East has also been an important export market too. In FY13, the local market accounted for about 78% of the group’s total revenue while the rest came from overseas sales. Although most of EITA’s business is currently from Malaysia, the group is looking to further expand its regional and international presence in the future, given the booming demand from the construction sector in those markets. EITA is already in 11 countries in Asia and the Middle East–it is looking to further expand its direct regional presence in growth markets like Indonesia.
Profit & Loss Sep-13 Sep-14F Sep-15F
Total turnover (MYRm) 191 204 224
Reported net profit (MYRm) 15 18 20
Recurring net profit (MYRm) 15 18 20
Recurring net profit growth (%) (14.4) 55.3 9.9
Recurring EPS (MYR) 0.12 0.14 0.16
DPS (MYR) 0.04 0.04 0.05
Dividend Yield (%) 3.2 3.4 3.8
Recurring P/E (x) 10.15 8.55 7.78
Return on average equity (%) 11.1 15.8 15.6
P/B (x) 1.43 1.28 1.15
P/CF (x) 106.03 27.78 11.74
Source: Company data, RHB estimates.
Balance Sheet (MYRm) Sep-13 Sep-14F Sep-15F
Total current assets 146 164 177
Total assets 159 189 205
Total current liabilities 47 64 66
Total non-current liabilities 1 1 1
Total liabilities 48 65 67
Shareholders' equity 110 123 137
Minority interests 1 1 1
Other equity 0 - 0
Total equity 111 124 138
Total liabilities & equity 159 189 205
Total debt 12 20 18
Net debt (12) 1 1
Source: Company data, RHB estimates.
Cash flow (MYRm) Sep-13 Sep-14F Sep-15F
Cash flow from operations 1 6 13
Cash flow from investing activities (0) (13) (6)
Cash flow from financing activities (8) 2 (9)
Cash at beginning of period 35 24 19
Total cash generated (7) (5) (2)
Forex effects 0 - -
Implied cash at end of period 24 19 17
Source: Company data, RHB estimates.
Company Report Card
Latest results. Note that EITA recently changed its financial year-end from December to September, for comparison purposes we are annualising the group’s FY13 numbers. For EITA’s recently ended FY13, it posted revenue of MYR142.1m (MYR190.9m annualised), with elevator and busduct manufacturing making up 52% of this total, and its marketing & distribution and technical services contributing 40% and 8% respectively. EITA registered a PAT of MYR11.7m (MYR15.3m annualised) with an 8.2% PAT margin – a 7.1% y-o-y increase.
Balance sheet/cash flow. EITA has a healthy net cash balance sheet, with its operations generating a positive cash flow.
ROE. We expect EITA to return an ROE of 15.8% in FY14, driven by the demand for its manufacturing segment’s products.
Dividend. We expect a full-year DPS of 4.1 sen for FY14, based on a 30% payout ratio assumption. Given its net cash position, we do not discount the possibility of management increasing this ratio.
Management. The company is currently led by group chairman Dato’ Siew Kim Lun while the management team is led by MD Mr Fu Wing Hoong. The latter is an engineer by training and is a co-founder of EITA. He is ably assisted by Mr Lim Joo Swee and Mr Chong Yoke Peng, who are both executive directors and co-founders of the group.
Recommendation
Ascribing a CY14F P/E of 11.0x for EITA, we arrive at our FV of MYR1.58. We believe the growth potential for the group will be driven by the growing demand for its elevators and busducts from the local, regional and international construction sector.
Top Malaysia Small Cap Companies 2014
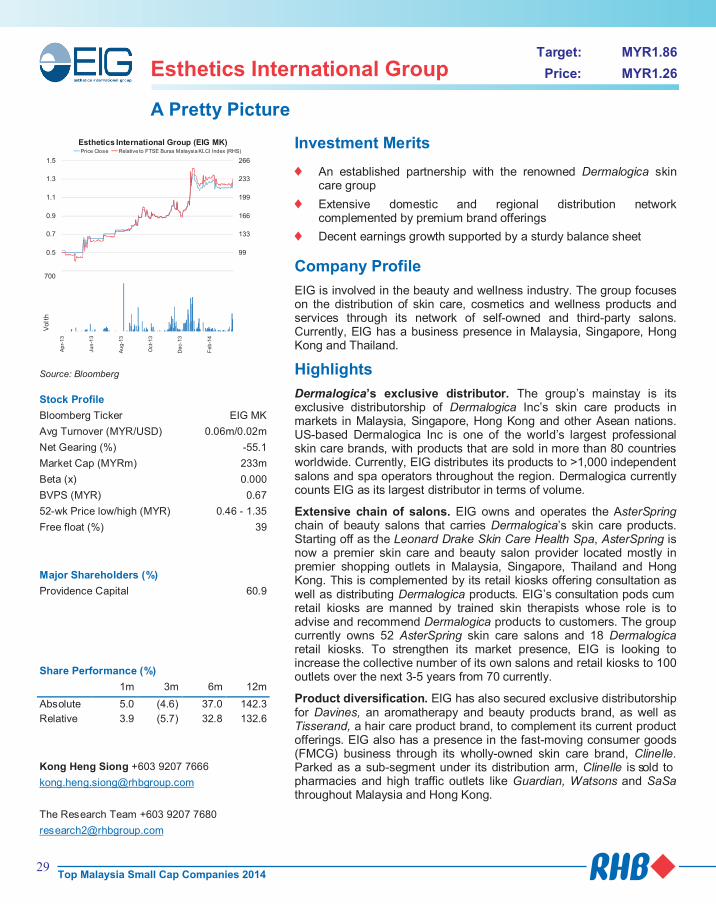
29
Esthetics International Group Target: MYR1.86
Price: MYR1.26
A Pretty Picture
66
99
133
166
199
233
266
0.3
0.5
0.7
0.9
1.1
1.3
1.5
Esthetics International Group (EIG MK)Price Close Relative to FTSE Bursa Malaysia KLCI Index (RHS)
100200300400500600700
Ap
r-13
Jun
-13
Au
g-1
3
Oct-
13
Dec-1
3
Feb
-14
Vol t
h
Source: Bloomberg
Stock Profile
Bloomberg Ticker EIG MK
Avg Turnover (MYR/USD) 0.06m/0.02m
Net Gearing (%) -55.1
Market Cap (MYRm) 233m
Beta (x) 0.000
BVPS (MYR) 0.67
52-wk Price low/high (MYR) 0.46 - 1.35
Free float (%) 39
Major Shareholders (%)
Providence Capital 60.9
Share Performance (%)
1m 3m 6m 12m
Absolute 5.0 (4.6) 37.0 142.3
Relative 3.9 (5.7) 32.8 132.6
Kong Heng Siong +603 9207 7666
The Research Team +603 9207 7680
Investment Merits
An established partnership with the renowned Dermalogica skin care group
Extensive domestic and regional distribution network complemented by premium brand offerings
Decent earnings growth supported by a sturdy balance sheet
Company Profile
EIG is involved in the beauty and wellness industry. The group focuses on the distribution of skin care, cosmetics and wellness products and services through its network of self-owned and third-party salons. Currently, EIG has a business presence in Malaysia, Singapore, Hong Kong and Thailand.
Highlights
Dermalogica’s exclusive distributor. The group’s mainstay is its exclusive distributorship of Dermalogica Inc’s skin care products in markets in Malaysia, Singapore, Hong Kong and other Asean nations. US-based Dermalogica Inc is one of the world’s largest professional skin care brands, with products that are sold in more than 80 countries worldwide. Currently, EIG distributes its products to >1,000 independent salons and spa operators throughout the region. Dermalogica currently counts EIG as its largest distributor in terms of volume.
Extensive chain of salons. EIG owns and operates the AsterSpring chain of beauty salons that carries Dermalogica’s skin care products. Starting off as the Leonard Drake Skin Care Health Spa, AsterSpring is now a premier skin care and beauty salon provider located mostly in premier shopping outlets in Malaysia, Singapore, Thailand and Hong Kong. This is complemented by its retail kiosks offering consultation as well as distributing Dermalogica products. EIG’s consultation pods cum retail kiosks are manned by trained skin therapists whose role is to advise and recommend Dermalogica products to customers. The group currently owns 52 AsterSpring skin care salons and 18 Dermalogica retail kiosks. To strengthen its market presence, EIG is looking to increase the collective number of its own salons and retail kiosks to 100 outlets over the next 3-5 years from 70 currently.
Product diversification. EIG has also secured exclusive distributorship for Davines, an aromatherapy and beauty products brand, as well as Tisserand, a hair care product brand, to complement its current product offerings. EIG also has a presence in the fast-moving consumer goods (FMCG) business through its wholly-owned skin care brand, Clinelle. Parked as a sub-segment under its distribution arm, Clinelle is sold to pharmacies and high traffic outlets like Guardian, Watsons and SaSa throughout Malaysia and Hong Kong.
Profit & Loss Mar-13 Mar-14F Mar-15F
Total turnover (MYRm) 134 146 160
Reported net profit (MYRm) 7 16 19
Recurring net profit (MYRm) 7 16 19
Recurring net profit growth (%) 438.2 118.0 18.2
Recurring EPS (MYR) 0.04 0.09 0.10
DPS (MYR) 0.03 0.03 0.04
Dividend Yield (%) 2.0 2.4 3.2
Recurring P/E (x) 28.55 14.74 12.47
Return on average equity (%) 6.5 13.4 14.5
P/B (x) 2.06 1.89 1.73
P/CF (x) 13.08 12.07 11.00
Source: Company data, RHB estimates
Balance Sheet (MYRm) Mar-13 Mar-14F Mar-15F
Total current assets 105 118 133
Total assets 149 160 173
Total current liabilities 36 37 39
Total liabilities 36 37 39
Shareholders' equity 113 123 134
Minority interests 0 0 0
Other equity (0) (0) (0)
Total equity 113 123 134
Total liabilities & equity 149 160 173
Net debt (58) (68) (78)
Source: Company data, RHB estimates
Cash flow (MYRm) Mar-13 Mar-14F Mar-15F
Cash flow from operations 16 19 21
Cash flow from investing activities (2) (4) (4)
Cash flow from financing activities (5) (6) (7)
Cash at beginning of period 49 58 68
Total cash generated 9 10 10
Forex effects 0 - -
Implied cash at end of period 58 68 78
Source: Company data, RHB estimates
Company Report Card
Latest results. EIG’s 9MFY14 revenue of MYR109.3m (+8.7% y-o-y) was in line with our forecast, with its corporate salon segment contributing MYR62.3m (+10.9 y-o-y) owing to higher contributions from its new and existing outlets in Malaysia and Singapore. The product distribution segment contributed revenue of MYR46.9m (+6.1% y-o-y), mainly buoyed by higher distribution and sales in Malaysia and Hong Kong. 9MFY14 net profit jumped to MYR13.3m (+113.3% y-o-y) due to higher margins from the corporate salons and professional distribution segments.
Balance sheet/cash flow. EIG possesses a solid balance sheet with a net cash position, while its operations generate positive cash flow.
ROE. We expect EIG to deliver ROE of 13.4% in FY14F, backed by strong growth in its professional distribution and corporate salons segment.
Dividend. We expect a full-year DPS of 3.0 sen for FY14, based on an assumption of a 30% payout ratio. In view of EIG’s healthy balance sheet, we expect management to increase the company’s payout ratio to 40-50% in the future.
Management. Management is currently led by executive chairman Eddy Chieng, who founded of Nationwide Express Courier (NAT MK, NR) and was responsible for bringing FedEx (FDX US, NR) to Malaysia. He is currently assisted by his sons – group MD and CEO Roderick Chieng (a former investment banker with Macquarie Group Australia) and non-executive non-independent director Brian Chieng, also an ex-investment banker. EIG’s headquarters in Bukit Jelutong, Shah Alam, is equipped with facilities for training its own professional skin care therapists.
Recommendation
Maintain BUY. Our FV of MYR1.86 is based on an unchanged CY14F P/E of 15x. We see growth potential for EIG, backed by its extensive distribution segment as well as its corporate salon arm, complemented by its strong balance sheet.
Top Malaysia Small Cap Companies 2014

30
Esthetics International Group Target: MYR1.86
Price: MYR1.26
A Pretty Picture
66
99
133
166
199
233
266
0.3
0.5
0.7
0.9
1.1
1.3
1.5
Esthetics International Group (EIG MK)Price Close Relative to FTSE Bursa Malaysia KLCI Index (RHS)
100200300400500600700
Ap
r-13
Jun
-13
Au
g-1
3
Oct-
13
Dec-1
3
Feb
-14
Vol t
h
Source: Bloomberg
Stock Profile
Bloomberg Ticker EIG MK
Avg Turnover (MYR/USD) 0.06m/0.02m
Net Gearing (%) -55.1
Market Cap (MYRm) 233m
Beta (x) 0.000
BVPS (MYR) 0.67
52-wk Price low/high (MYR) 0.46 - 1.35
Free float (%) 39
Major Shareholders (%)
Providence Capital 60.9
Share Performance (%)
1m 3m 6m 12m
Absolute 5.0 (4.6) 37.0 142.3
Relative 3.9 (5.7) 32.8 132.6
Kong Heng Siong +603 9207 7666
The Research Team +603 9207 7680
Investment Merits
An established partnership with the renowned Dermalogica skin care group
Extensive domestic and regional distribution network complemented by premium brand offerings
Decent earnings growth supported by a sturdy balance sheet
Company Profile
EIG is involved in the beauty and wellness industry. The group focuses on the distribution of skin care, cosmetics and wellness products and services through its network of self-owned and third-party salons. Currently, EIG has a business presence in Malaysia, Singapore, Hong Kong and Thailand.
Highlights
Dermalogica’s exclusive distributor. The group’s mainstay is its exclusive distributorship of Dermalogica Inc’s skin care products in markets in Malaysia, Singapore, Hong Kong and other Asean nations. US-based Dermalogica Inc is one of the world’s largest professional skin care brands, with products that are sold in more than 80 countries worldwide. Currently, EIG distributes its products to >1,000 independent salons and spa operators throughout the region. Dermalogica currently counts EIG as its largest distributor in terms of volume.
Extensive chain of salons. EIG owns and operates the AsterSpring chain of beauty salons that carries Dermalogica’s skin care products. Starting off as the Leonard Drake Skin Care Health Spa, AsterSpring is now a premier skin care and beauty salon provider located mostly in premier shopping outlets in Malaysia, Singapore, Thailand and Hong Kong. This is complemented by its retail kiosks offering consultation as well as distributing Dermalogica products. EIG’s consultation pods cum retail kiosks are manned by trained skin therapists whose role is to advise and recommend Dermalogica products to customers. The group currently owns 52 AsterSpring skin care salons and 18 Dermalogica retail kiosks. To strengthen its market presence, EIG is looking to increase the collective number of its own salons and retail kiosks to 100 outlets over the next 3-5 years from 70 currently.
Product diversification. EIG has also secured exclusive distributorship for Davines, an aromatherapy and beauty products brand, as well as Tisserand, a hair care product brand, to complement its current product offerings. EIG also has a presence in the fast-moving consumer goods (FMCG) business through its wholly-owned skin care brand, Clinelle. Parked as a sub-segment under its distribution arm, Clinelle is sold to pharmacies and high traffic outlets like Guardian, Watsons and SaSa throughout Malaysia and Hong Kong.
Profit & Loss Mar-13 Mar-14F Mar-15F
Total turnover (MYRm) 134 146 160
Reported net profit (MYRm) 7 16 19
Recurring net profit (MYRm) 7 16 19
Recurring net profit growth (%) 438.2 118.0 18.2
Recurring EPS (MYR) 0.04 0.09 0.10
DPS (MYR) 0.03 0.03 0.04
Dividend Yield (%) 2.0 2.4 3.2
Recurring P/E (x) 28.55 14.74 12.47
Return on average equity (%) 6.5 13.4 14.5
P/B (x) 2.06 1.89 1.73
P/CF (x) 13.08 12.07 11.00
Source: Company data, RHB estimates
Balance Sheet (MYRm) Mar-13 Mar-14F Mar-15F
Total current assets 105 118 133
Total assets 149 160 173
Total current liabilities 36 37 39
Total liabilities 36 37 39
Shareholders' equity 113 123 134
Minority interests 0 0 0
Other equity (0) (0) (0)
Total equity 113 123 134
Total liabilities & equity 149 160 173
Net debt (58) (68) (78)
Source: Company data, RHB estimates
Cash flow (MYRm) Mar-13 Mar-14F Mar-15F
Cash flow from operations 16 19 21
Cash flow from investing activities (2) (4) (4)
Cash flow from financing activities (5) (6) (7)
Cash at beginning of period 49 58 68
Total cash generated 9 10 10
Forex effects 0 - -
Implied cash at end of period 58 68 78
Source: Company data, RHB estimates
Company Report Card
Latest results. EIG’s 9MFY14 revenue of MYR109.3m (+8.7% y-o-y) was in line with our forecast, with its corporate salon segment contributing MYR62.3m (+10.9 y-o-y) owing to higher contributions from its new and existing outlets in Malaysia and Singapore. The product distribution segment contributed revenue of MYR46.9m (+6.1% y-o-y), mainly buoyed by higher distribution and sales in Malaysia and Hong Kong. 9MFY14 net profit jumped to MYR13.3m (+113.3% y-o-y) due to higher margins from the corporate salons and professional distribution segments.
Balance sheet/cash flow. EIG possesses a solid balance sheet with a net cash position, while its operations generate positive cash flow.
ROE. We expect EIG to deliver ROE of 13.4% in FY14F, backed by strong growth in its professional distribution and corporate salons segment.
Dividend. We expect a full-year DPS of 3.0 sen for FY14, based on an assumption of a 30% payout ratio. In view of EIG’s healthy balance sheet, we expect management to increase the company’s payout ratio to 40-50% in the future.
Management. Management is currently led by executive chairman Eddy Chieng, who founded of Nationwide Express Courier (NAT MK, NR) and was responsible for bringing FedEx (FDX US, NR) to Malaysia. He is currently assisted by his sons – group MD and CEO Roderick Chieng (a former investment banker with Macquarie Group Australia) and non-executive non-independent director Brian Chieng, also an ex-investment banker. EIG’s headquarters in Bukit Jelutong, Shah Alam, is equipped with facilities for training its own professional skin care therapists.
Recommendation
Maintain BUY. Our FV of MYR1.86 is based on an unchanged CY14F P/E of 15x. We see growth potential for EIG, backed by its extensive distribution segment as well as its corporate salon arm, complemented by its strong balance sheet.
Top Malaysia Small Cap Companies 2014

31
Gadang Holdings Target: MYR1.79
Price: MYR1.27
Staying Relevant With Earthworks
84
97
111
124
137
151
164
177
191
0.5
0.6
0.7
0.8
0.9
1.0
1.1
1.2
1.3
1.4
Gadang Holdings (GADG MK)Price Close Relative to FTSE Bursa Malaysia KLCI Index (RHS)
5
10
15
20
Apr-
13
Ju
n-1
3
Au
g-1
3
Oct
-13
De
c-1
3
Fe
b-1
4
Vo
l m
Source: Bloomberg
Stock Profile
Bloomberg Ticker GADG MK
Avg Turnover (MYR/USD) 1.73m/0.53m
Net Gearing (%) n.m.
Market Cap (MYRm) 250m
Beta (x) 1.16
BVPS (MYR) 1.34
52-wk Price low/high (MYR) 0.61 - 1.27
Free float (%) 64
Major Shareholders (%)
Tan Sri Dato' Kok Onn 36.2
Share Performance (%)
1m 3m 6m 12m
Absolute 9.5 10.4 54.9 96.9
Relative 8.4 9.3 50.7 87.2
Joshua Ng +603 9207 7606
Investment Merits
Gadang has reinvented itself by moving into large-scale earthworks, allowing it to stay relevant in the highly-crowded and competitive construction sector
It is a strong contender for Phase 2 earthworks of the refinery and petrochemical integrated development (RAPID) project worth MYR400m-500m, given its involvement in Phase 1
Its property profits will be underpinned by MYR3bn-4bn GDV from various projects in the Klang Valley and Johor
Company Profile
Gadang is a construction company that is also engaged in property development. It also owns a small oil palm plantation of about 2,000 ha in Sabah and three water concessions in Indonesia. Its current outstanding construction orderbook of MYR1.1bn, which can last the company for 2-3 years, comprises of: i) Package V2 of the Klang Valley MRT project (MYR725m), ii) a hospital project in Shah Alam (MYR191m), and iii) Phase 1 earthworks of RAPID in Pengerang, Johor. For 1HFY14, construction contributed 50% of its earnings, followed by property development (36%) and water concessions (14%). The plantation division is currently still loss-making due to the young age of its trees.
Highlights
Reinvented itself by moving into earthworks. Gadang has reaped the benefits of its key strategies back in 2010, ie aggressively bidding for the KLIA2’s earthworks package (which it eventually won for MYR291.2m) and investing heavily in a new earthworks equipment fleet. Having established itself as a niche player in the large-scale earthworks segment, in addition to general contracting, Gadang has successfully reinvented itself, allowing it to stay relevant in the highly-crowded and competitive construction sector.
Earthworks offer high margins. Large-scale earthworks jobs still offer high margins (estimated at about 10% vs ≤5% for general contracting) due to limited competition from a handful of established players other than Gadang like: i) Sunway (SWB MK, BUY, FV: MYR3.33), ii) WCT (WCTHG MK, NEUTRAL, FV: MYR2.21), and iii) privately-owned Menta Construction SB. The entry barrier for new players is high due to steep ownership costs (costs incurred whether or not the equipment is used, including depreciation and funding costs) of earthworks equipment. For the same reason, established players also will not aggressively expand their capacity unless it is backed by firm contracts.
Profit & Loss May-12 May-13 May-14F
Total turnover (MYRm) 246 356 522
Reported net profit (MYRm) 14 20 35
Recurring net profit (MYRm) 14 20 35
Recurring net profit growth (%) na 41.7 73.0
Recurring EPS (MYR) 0.07 0.10 0.18
DPS (MYR) 0.02 0.02 0.03
Dividend Yield (%) 1.2 1.8 2.4
Recurring P/E (x) 17.29 12.20 7.06
Return on average equity (%) 6.1 8.1 27.0
P/B (x) 1.02 0.95 na
P/CF (x) 5.92 2.17 na
Source: Company data, RHB estimates
Balance Sheet (MYRm) May-11 May-12 May-13
Total current assets 364 321 364
Total assets 514 465 511
Total current liabilities 247 157 161
Total non-current liabilities 31 58 84
Total liabilities 279 215 244
Shareholders' equity 230 246 263
Minority interests 5 4 4
Other equity (0) - (0)
Total equity 235 250 266
Total liabilities & equity 514 465 511
Total debt 144 93 83
Net debt 87 43 (53)
Source: Company data, RHB estimates
Cash flow (MYRm) May-11 May-12 May-13
Cash flow from operations (20) 42 115
Cash flow from investing activities (9) 6 (4)
Cash flow from financing activities 61 (53) (18)
Cash at beginning of period 26 56 50
Total cash generated 31 (5) 93
Forex effects (0) 1 1
Implied cash at end of period 57 52 143
Source: Company data, RHB estimates
Sizeable earthworks contracts in the offing. On the other hand, the prospects for the large-scale earthworks segment over the immediate term are strong, underpinned by at least two imminent sizeable contracts in the pipeline, namely: i) Phase 2 of RAPID in Pengerang, Johor, worth MYR400m-500m, and ii) Phase 1 of Kwasa Damansara (redevelopment of the 2,330-acre Rubber Research Institute in Sungai Buloh) worth about MYR1bn. We believe Gadang stands the best chance of winning RAPID’s Phase 2 earthworks given its in-depth knowledge of the facility’s sites and ground conditions after having carried out RAPID’s MYR313m Phase 1 earthworks (40% completed).
Gadang is also a small-cap proxy to the MYR73bn Klang Valley MRT project. It is the main contractor for Line 1 (16% completed)’s MYR863m Package V2 (viaduct between Kota Damansara and Dataran Sunway). Gadang intends to bid for Line 2’s work packages, which are expected to break ground in 1Q2016.
Gadang’s current property projects are in Kuala Lumpur (MYR500m Residensi Vyne condominium project in Sungai Besi) and Johor Bahru (MYR174m Jentayu Residensi mixed project in Tampoi). Both projects have been well-received with: i) a sell-out of non-bumiputera units for the MYR165m Phase 1 of Residensi Vyne, and ii) take-up rates of 93% and 33% for serviced apartments and retail/office units for Jentayu Residensi. Over the medium to long term, Gadang’s property profits will be underpinned by MYR3bn-4bn GDV from the remaining phases of Residensi Vyne, Capital City (a MYR2.2bn integrated project with a mall, hotels and office blocks on a 14-acre site next to Jentayu Residensi), the K-Workers housing project (a MYR1.06bn housing project on an 109-acre site in Cyberjaya), and a MYR300m township project on a 200-acre site in Pokok Sena, Kedah.
Company Report Card
Latest results. Gadang’s FY13 net profit surged 42%, thanks to improved construction billings and substantial gains from land disposal.
Balance sheet/cash flow. As at end-FY13, Gadang was in a net cash of MYR53.4m position, translating into 27 sen per share. Commendable operating performance coupled with limited capex gave rise to a substantial free cash flow of MYR111.3m, or 57 sen per share in FY13.
ROE. Its ROE of 8.1% in FY13 was below industry average of 11%, but should rise to 12.7% in FY14 based on our projection on improved earnings.
Dividend. FY13 DPS was 3 sen less 25% tax, translating into a net yield of 1.8%.
Management. At the helm of the company is managing director cum chief executive officer Tan Sri Dato’ Kok Onn. He has had more than 40 years of experience in the construction sector.
Recommendation
Our valuation is MYR1.79, based on 10x fully-diluted (for 19.7m outstanding warrants with an exercise price of MYR1.00) CY14 EPS of 17.9 sen. This is in line with our 1-year forward target P/E for the construction sector of 10-16x.
Top Malaysia Small Cap Companies 2014

32
Gadang Holdings Target: MYR1.79
Price: MYR1.27
Staying Relevant With Earthworks
84
97
111
124
137
151
164
177
191
0.5
0.6
0.7
0.8
0.9
1.0
1.1
1.2
1.3
1.4
Gadang Holdings (GADG MK)Price Close Relative to FTSE Bursa Malaysia KLCI Index (RHS)
5
10
15
20
Apr-
13
Ju
n-1
3
Au
g-1
3
Oct
-13
De
c-1
3
Fe
b-1
4
Vo
l m
Source: Bloomberg
Stock Profile
Bloomberg Ticker GADG MK
Avg Turnover (MYR/USD) 1.73m/0.53m
Net Gearing (%) n.m.
Market Cap (MYRm) 250m
Beta (x) 1.16
BVPS (MYR) 1.34
52-wk Price low/high (MYR) 0.61 - 1.27
Free float (%) 64
Major Shareholders (%)
Tan Sri Dato' Kok Onn 36.2
Share Performance (%)
1m 3m 6m 12m
Absolute 9.5 10.4 54.9 96.9
Relative 8.4 9.3 50.7 87.2
Joshua Ng +603 9207 7606
Investment Merits
Gadang has reinvented itself by moving into large-scale earthworks, allowing it to stay relevant in the highly-crowded and competitive construction sector
It is a strong contender for Phase 2 earthworks of the refinery and petrochemical integrated development (RAPID) project worth MYR400m-500m, given its involvement in Phase 1
Its property profits will be underpinned by MYR3bn-4bn GDV from various projects in the Klang Valley and Johor
Company Profile
Gadang is a construction company that is also engaged in property development. It also owns a small oil palm plantation of about 2,000 ha in Sabah and three water concessions in Indonesia. Its current outstanding construction orderbook of MYR1.1bn, which can last the company for 2-3 years, comprises of: i) Package V2 of the Klang Valley MRT project (MYR725m), ii) a hospital project in Shah Alam (MYR191m), and iii) Phase 1 earthworks of RAPID in Pengerang, Johor. For 1HFY14, construction contributed 50% of its earnings, followed by property development (36%) and water concessions (14%). The plantation division is currently still loss-making due to the young age of its trees.
Highlights
Reinvented itself by moving into earthworks. Gadang has reaped the benefits of its key strategies back in 2010, ie aggressively bidding for the KLIA2’s earthworks package (which it eventually won for MYR291.2m) and investing heavily in a new earthworks equipment fleet. Having established itself as a niche player in the large-scale earthworks segment, in addition to general contracting, Gadang has successfully reinvented itself, allowing it to stay relevant in the highly-crowded and competitive construction sector.
Earthworks offer high margins. Large-scale earthworks jobs still offer high margins (estimated at about 10% vs ≤5% for general contracting) due to limited competition from a handful of established players other than Gadang like: i) Sunway (SWB MK, BUY, FV: MYR3.33), ii) WCT (WCTHG MK, NEUTRAL, FV: MYR2.21), and iii) privately-owned Menta Construction SB. The entry barrier for new players is high due to steep ownership costs (costs incurred whether or not the equipment is used, including depreciation and funding costs) of earthworks equipment. For the same reason, established players also will not aggressively expand their capacity unless it is backed by firm contracts.
Profit & Loss May-12 May-13 May-14F
Total turnover (MYRm) 246 356 522
Reported net profit (MYRm) 14 20 35
Recurring net profit (MYRm) 14 20 35
Recurring net profit growth (%) na 41.7 73.0
Recurring EPS (MYR) 0.07 0.10 0.18
DPS (MYR) 0.02 0.02 0.03
Dividend Yield (%) 1.2 1.8 2.4
Recurring P/E (x) 17.29 12.20 7.06
Return on average equity (%) 6.1 8.1 27.0
P/B (x) 1.02 0.95 na
P/CF (x) 5.92 2.17 na
Source: Company data, RHB estimates
Balance Sheet (MYRm) May-11 May-12 May-13
Total current assets 364 321 364
Total assets 514 465 511
Total current liabilities 247 157 161
Total non-current liabilities 31 58 84
Total liabilities 279 215 244
Shareholders' equity 230 246 263
Minority interests 5 4 4
Other equity (0) - (0)
Total equity 235 250 266
Total liabilities & equity 514 465 511
Total debt 144 93 83
Net debt 87 43 (53)
Source: Company data, RHB estimates
Cash flow (MYRm) May-11 May-12 May-13
Cash flow from operations (20) 42 115
Cash flow from investing activities (9) 6 (4)
Cash flow from financing activities 61 (53) (18)
Cash at beginning of period 26 56 50
Total cash generated 31 (5) 93
Forex effects (0) 1 1
Implied cash at end of period 57 52 143
Source: Company data, RHB estimates
Sizeable earthworks contracts in the offing. On the other hand, the prospects for the large-scale earthworks segment over the immediate term are strong, underpinned by at least two imminent sizeable contracts in the pipeline, namely: i) Phase 2 of RAPID in Pengerang, Johor, worth MYR400m-500m, and ii) Phase 1 of Kwasa Damansara (redevelopment of the 2,330-acre Rubber Research Institute in Sungai Buloh) worth about MYR1bn. We believe Gadang stands the best chance of winning RAPID’s Phase 2 earthworks given its in-depth knowledge of the facility’s sites and ground conditions after having carried out RAPID’s MYR313m Phase 1 earthworks (40% completed).
Gadang is also a small-cap proxy to the MYR73bn Klang Valley MRT project. It is the main contractor for Line 1 (16% completed)’s MYR863m Package V2 (viaduct between Kota Damansara and Dataran Sunway). Gadang intends to bid for Line 2’s work packages, which are expected to break ground in 1Q2016.
Gadang’s current property projects are in Kuala Lumpur (MYR500m Residensi Vyne condominium project in Sungai Besi) and Johor Bahru (MYR174m Jentayu Residensi mixed project in Tampoi). Both projects have been well-received with: i) a sell-out of non-bumiputera units for the MYR165m Phase 1 of Residensi Vyne, and ii) take-up rates of 93% and 33% for serviced apartments and retail/office units for Jentayu Residensi. Over the medium to long term, Gadang’s property profits will be underpinned by MYR3bn-4bn GDV from the remaining phases of Residensi Vyne, Capital City (a MYR2.2bn integrated project with a mall, hotels and office blocks on a 14-acre site next to Jentayu Residensi), the K-Workers housing project (a MYR1.06bn housing project on an 109-acre site in Cyberjaya), and a MYR300m township project on a 200-acre site in Pokok Sena, Kedah.
Company Report Card
Latest results. Gadang’s FY13 net profit surged 42%, thanks to improved construction billings and substantial gains from land disposal.
Balance sheet/cash flow. As at end-FY13, Gadang was in a net cash of MYR53.4m position, translating into 27 sen per share. Commendable operating performance coupled with limited capex gave rise to a substantial free cash flow of MYR111.3m, or 57 sen per share in FY13.
ROE. Its ROE of 8.1% in FY13 was below industry average of 11%, but should rise to 12.7% in FY14 based on our projection on improved earnings.
Dividend. FY13 DPS was 3 sen less 25% tax, translating into a net yield of 1.8%.
Management. At the helm of the company is managing director cum chief executive officer Tan Sri Dato’ Kok Onn. He has had more than 40 years of experience in the construction sector.
Recommendation
Our valuation is MYR1.79, based on 10x fully-diluted (for 19.7m outstanding warrants with an exercise price of MYR1.00) CY14 EPS of 17.9 sen. This is in line with our 1-year forward target P/E for the construction sector of 10-16x.
Top Malaysia Small Cap Companies 2014

33
GD Express Courier Target: MYR2.20
Price: MYR1.75
Riding On The Uptrend In Express Delivery
72
105
139
172
205
239
272
305
339
372
0.3
0.5
0.7
0.9
1.1
1.3
1.5
1.7
1.9
2.1
GD Express Courier (GDX MK)Price Close Relative to FTSE Bursa Malaysia KLCI Index (RHS)
12345678
Apr-
13
Jun
-13
Aug
-13
Oct
-13
Dec-1
3
Feb
-14
Vol m
Source: Bloomberg
Stock Profile
Bloomberg Ticker GDX MK
Avg Turnover (MYR/USD) 1.35m/0.41m
Net Gearing (%) 3.5
Market Cap (MYRm) 1,458m
Beta (x) 0.39
BVPS (MYR) 0.09
52-wk Price low/high (MYR) 0.53 - 1.88
Free float (%) 27
Major Shareholders (%)
GD Express Holdings 31.4
Singapore POST 26.0
GD Holdings 9.8
Share Performance (%)
1m 3m 6m 12m
Absolute 1.2 56.3 68.8 228.3
Relative 0.1 55.2 64.6 218.6
Jerry Lee 603 9207 7622
Investment Merits
Solid and prudent management team
Proven earnings track record with 5-year pre-tax profit CAGR of 34.6%
Undergoing aggressive expansion and is poised for stronger growth on the back of strong demand for courier services
Company Profile
Formed in 1997, GD Express Courier (GD Express) provides express delivery services in both the domestic and international markets. It operates a network of 136 stations, comprising 59 branches, two affiliate stations, 52 agents and 23 lodge-in centres throughout East and West Malaysia. GD Express has a fleet of more than 400 trucks and vans used primarily for hauling of documents and parcels between stations and the national hub (termed "line-haul" fleet) for local pick-ups and deliveries. The company's express delivery service operation is structured along the "hub and spoke" concept. The group currently employs more than 2,000 staff.
Highlights
Tapping the fast-growing express delivery industry. The express delivery industry has strong growth potential. The industry generated MYR2.0bn revenue in 2011 and the figure is expected to rise to MYR4.0bn by 2020, driven by sustained growth in economic activities, as indicated by the Malaysian Communications and Multimedia Commission (MCMC). GD Express is in a sweet spot to tap into this fast-growing trend.
E-commerce gaining popularity. The household broadband penetration rate is rising (67% in Sept 2013) with the usage of smartphones becoming more mainstreamed, as consumers alter their lifestyle in pursuit of convenience and efficiency. Some major e-commerce companies have been very active in the domestic market with the likes of Groupon, Lazada and Zalora. Furthermore, the emergence of “blog shops”, ie online retail businesses through blogging platforms, is among the recent trends in the fast-paced online business environment.
Evolving trend in courier services. As e-commerce is growing rapidly, there is a rising demand for fast, efficient and safe delivery services. This is evidenced by a 45% y-o-y jump in revenue for Pos Malaysia (POSM MK, BUY, FV: MYR5.45)’s logistics arm in 3QFY14. Courier companies have transformed in recent years and are now offering third-party logistics services by providing warehousing and inventory management services.
Proven earnings track record. GD Express achieved a 5-year pre-tax profit CAGR of 34.6% in FY13 while its pre-tax profit margin expanded to 14.2% in FY13. This was mainly buoyed by sustained growth in
Profit & Loss Jun-12 Jun-13 Jun-14F
Total turnover (MYRm) 116 135 170
Reported net profit (MYRm) 9 14 27
Recurring net profit (MYRm) 9 15 27
Recurring net profit growth (%) 26.0 65.7 87.9
Recurring EPS (MYR) 0.01 0.02 0.03
DPS (MYR) 0.02 0.04 0.06
Dividend Yield (%) 1.1 2.1 3.2
Recurring P/E (x) 186.41 112.51 59.87
Return on average equity (%) 17.7 23.2 36.9
P/B (x) 31.27 25.09 19.72
P/CF (x) 106.65 90.28 66.18
Source: Company data, RHB estimates
Balance Sheet (MYRm) Jun-12 Jun-13 Jun-14F
Total current assets 44 53 73
Total assets 96 107 132
Total current liabilities 23 21 26
Total non-current liabilities 20 21 23
Total liabilities 43 42 49
Shareholders' equity 52 65 83
Total equity 52 65 83
Total liabilities & equity 96 107 132
Total debt 28 26 28
Net debt 16 8 3
Source: Company data, RHB estimates
Cash flow (MYRm) Jun-12 Jun-13 Jun-14F
Cash flow from operations 15 18 25
Cash flow from investing activities (8) (4) (10)
Cash flow from financing activities (7) (8) (8)
Cash at beginning of period 12 12 18
Total cash generated 0 5 7
Implied cash at end of period 12 18 25
Source: Company data, RHB estimates
revenue and operational efficiency.
Quality assured; ambitious expansion plan. GD Express is the first local express delivery company to attain ISO 9001:2000 (quality management system) in 2003. The company also plans to expand and become a premier regional express carrier.
Company Report Card
Latest results. GD Express’ 1HFY14 earnings grew >100% y-o-y, bolstered by higher revenue, improved efficiency and tax incentive recognition from the Malaysian Investment Development Authority (MIDA).
Balance sheet/cash flow. The company’s 1HFY14 balance sheet strengthened as it turned into a net cash position, with total cash of about MYR30m, covering borrowings (including hire purchase) of MYR26m.
ROE. It achieved ROE of 23.2% in FY13.
Dividend. The company paid out a 2.25 sen dividend in FY13, which translated into a payout ratio of 43%.
Management. GD Express is led by Mr Teong Teck Lean, who has successfully turned around the company and is actively involved in its operations. He is responsible for the company’s business development, strategic direction and overall management.
Recommendation
Despite its high P/E valuation, we think GD Express is undervalued, as we expect the company to report 56% y-o-y growth in FY15F, after its strong forecast earnings growth of 83% y-o-y in FY14F. With such strong growth, GD Express’ PEGs are estimated at 0.6x and 0.8x for FY14F and FY15F respectively. Pegging the stock to a 1.0x FY15F PEG, this company should be worth MYR2.20.
Top Malaysia Small Cap Companies 2014

34
GD Express Courier Target: MYR2.20
Price: MYR1.75
Riding On The Uptrend In Express Delivery
72
105
139
172
205
239
272
305
339
372
0.3
0.5
0.7
0.9
1.1
1.3
1.5
1.7
1.9
2.1
GD Express Courier (GDX MK)Price Close Relative to FTSE Bursa Malaysia KLCI Index (RHS)
12345678
Apr-
13
Jun
-13
Aug
-13
Oct
-13
Dec-1
3
Feb
-14
Vol m
Source: Bloomberg
Stock Profile
Bloomberg Ticker GDX MK
Avg Turnover (MYR/USD) 1.35m/0.41m
Net Gearing (%) 3.5
Market Cap (MYRm) 1,458m
Beta (x) 0.39
BVPS (MYR) 0.09
52-wk Price low/high (MYR) 0.53 - 1.88
Free float (%) 27
Major Shareholders (%)
GD Express Holdings 31.4
Singapore POST 26.0
GD Holdings 9.8
Share Performance (%)
1m 3m 6m 12m
Absolute 1.2 56.3 68.8 228.3
Relative 0.1 55.2 64.6 218.6
Jerry Lee 603 9207 7622
Investment Merits
Solid and prudent management team
Proven earnings track record with 5-year pre-tax profit CAGR of 34.6%
Undergoing aggressive expansion and is poised for stronger growth on the back of strong demand for courier services
Company Profile
Formed in 1997, GD Express Courier (GD Express) provides express delivery services in both the domestic and international markets. It operates a network of 136 stations, comprising 59 branches, two affiliate stations, 52 agents and 23 lodge-in centres throughout East and West Malaysia. GD Express has a fleet of more than 400 trucks and vans used primarily for hauling of documents and parcels between stations and the national hub (termed "line-haul" fleet) for local pick-ups and deliveries. The company's express delivery service operation is structured along the "hub and spoke" concept. The group currently employs more than 2,000 staff.
Highlights
Tapping the fast-growing express delivery industry. The express delivery industry has strong growth potential. The industry generated MYR2.0bn revenue in 2011 and the figure is expected to rise to MYR4.0bn by 2020, driven by sustained growth in economic activities, as indicated by the Malaysian Communications and Multimedia Commission (MCMC). GD Express is in a sweet spot to tap into this fast-growing trend.
E-commerce gaining popularity. The household broadband penetration rate is rising (67% in Sept 2013) with the usage of smartphones becoming more mainstreamed, as consumers alter their lifestyle in pursuit of convenience and efficiency. Some major e-commerce companies have been very active in the domestic market with the likes of Groupon, Lazada and Zalora. Furthermore, the emergence of “blog shops”, ie online retail businesses through blogging platforms, is among the recent trends in the fast-paced online business environment.
Evolving trend in courier services. As e-commerce is growing rapidly, there is a rising demand for fast, efficient and safe delivery services. This is evidenced by a 45% y-o-y jump in revenue for Pos Malaysia (POSM MK, BUY, FV: MYR5.45)’s logistics arm in 3QFY14. Courier companies have transformed in recent years and are now offering third-party logistics services by providing warehousing and inventory management services.
Proven earnings track record. GD Express achieved a 5-year pre-tax profit CAGR of 34.6% in FY13 while its pre-tax profit margin expanded to 14.2% in FY13. This was mainly buoyed by sustained growth in
Profit & Loss Jun-12 Jun-13 Jun-14F
Total turnover (MYRm) 116 135 170
Reported net profit (MYRm) 9 14 27
Recurring net profit (MYRm) 9 15 27
Recurring net profit growth (%) 26.0 65.7 87.9
Recurring EPS (MYR) 0.01 0.02 0.03
DPS (MYR) 0.02 0.04 0.06
Dividend Yield (%) 1.1 2.1 3.2
Recurring P/E (x) 186.41 112.51 59.87
Return on average equity (%) 17.7 23.2 36.9
P/B (x) 31.27 25.09 19.72
P/CF (x) 106.65 90.28 66.18
Source: Company data, RHB estimates
Balance Sheet (MYRm) Jun-12 Jun-13 Jun-14F
Total current assets 44 53 73
Total assets 96 107 132
Total current liabilities 23 21 26
Total non-current liabilities 20 21 23
Total liabilities 43 42 49
Shareholders' equity 52 65 83
Total equity 52 65 83
Total liabilities & equity 96 107 132
Total debt 28 26 28
Net debt 16 8 3
Source: Company data, RHB estimates
Cash flow (MYRm) Jun-12 Jun-13 Jun-14F
Cash flow from operations 15 18 25
Cash flow from investing activities (8) (4) (10)
Cash flow from financing activities (7) (8) (8)
Cash at beginning of period 12 12 18
Total cash generated 0 5 7
Implied cash at end of period 12 18 25
Source: Company data, RHB estimates
revenue and operational efficiency.
Quality assured; ambitious expansion plan. GD Express is the first local express delivery company to attain ISO 9001:2000 (quality management system) in 2003. The company also plans to expand and become a premier regional express carrier.
Company Report Card
Latest results. GD Express’ 1HFY14 earnings grew >100% y-o-y, bolstered by higher revenue, improved efficiency and tax incentive recognition from the Malaysian Investment Development Authority (MIDA).
Balance sheet/cash flow. The company’s 1HFY14 balance sheet strengthened as it turned into a net cash position, with total cash of about MYR30m, covering borrowings (including hire purchase) of MYR26m.
ROE. It achieved ROE of 23.2% in FY13.
Dividend. The company paid out a 2.25 sen dividend in FY13, which translated into a payout ratio of 43%.
Management. GD Express is led by Mr Teong Teck Lean, who has successfully turned around the company and is actively involved in its operations. He is responsible for the company’s business development, strategic direction and overall management.
Recommendation
Despite its high P/E valuation, we think GD Express is undervalued, as we expect the company to report 56% y-o-y growth in FY15F, after its strong forecast earnings growth of 83% y-o-y in FY14F. With such strong growth, GD Express’ PEGs are estimated at 0.6x and 0.8x for FY14F and FY15F respectively. Pegging the stock to a 1.0x FY15F PEG, this company should be worth MYR2.20.
Top Malaysia Small Cap Companies 2014
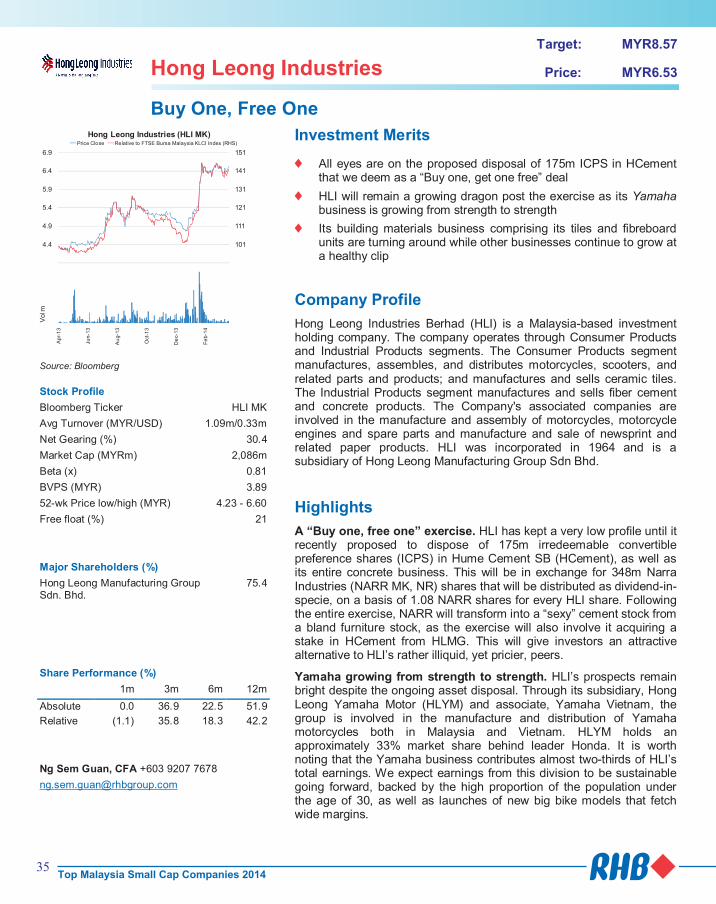
35
Hong Leong Industries Target: MYR8.57
Price: MYR6.53
Buy One, Free One
Source: Bloomberg
Stock Profile
Bloomberg Ticker HLI MK
Avg Turnover (MYR/USD) 1.09m/0.33m
Net Gearing (%) 30.4
Market Cap (MYRm) 2,086m
Beta (x) 0.81
BVPS (MYR) 3.89
52-wk Price low/high (MYR) 4.23 - 6.60
Free float (%) 21
Major Shareholders (%)
Hong Leong Manufacturing Group Sdn. Bhd.
75.4
Share Performance (%)
1m 3m 6m 12m
Absolute 0.0 36.9 22.5 51.9
Relative (1.1) 35.8 18.3 42.2
Ng Sem Guan, CFA +603 9207 7678
91
101
111
121
131
141
151
3.9
4.4
4.9
5.4
5.9
6.4
6.9
Hong Leong Industries (HLI MK)Price Close Relative to FTSE Bursa Malaysia KLCI Index (RHS)
11111
Ap
r-1
3
Jun-1
3
Au
g-1
3
Oct-
13
De
c-1
3
Fe
b-1
4
Vol m
Investment Merits
All eyes are on the proposed disposal of 175m ICPS in HCement that we deem as a “Buy one, get one free” deal
HLI will remain a growing dragon post the exercise as its Yamaha business is growing from strength to strength
Its building materials business comprising its tiles and fibreboard units are turning around while other businesses continue to grow at a healthy clip
Company Profile
Hong Leong Industries Berhad (HLI) is a Malaysia-based investment holding company. The company operates through Consumer Products and Industrial Products segments. The Consumer Products segment manufactures, assembles, and distributes motorcycles, scooters, and related parts and products; and manufactures and sells ceramic tiles. The Industrial Products segment manufactures and sells fiber cement and concrete products. The Company's associated companies are involved in the manufacture and assembly of motorcycles, motorcycle engines and spare parts and manufacture and sale of newsprint and related paper products. HLI was incorporated in 1964 and is a subsidiary of Hong Leong Manufacturing Group Sdn Bhd.
Highlights
A “Buy one, free one” exercise. HLI has kept a very low profile until it recently proposed to dispose of 175m irredeemable convertible preference shares (ICPS) in Hume Cement SB (HCement), as well as its entire concrete business. This will be in exchange for 348m Narra Industries (NARR MK, NR) shares that will be distributed as dividend-in-specie, on a basis of 1.08 NARR shares for every HLI share. Following the entire exercise, NARR will transform into a “sexy” cement stock from a bland furniture stock, as the exercise will also involve it acquiring a stake in HCement from HLMG. This will give investors an attractive alternative to HLI’s rather illiquid, yet pricier, peers.
Yamaha growing from strength to strength. HLI’s prospects remain bright despite the ongoing asset disposal. Through its subsidiary, Hong Leong Yamaha Motor (HLYM) and associate, Yamaha Vietnam, the group is involved in the manufacture and distribution of Yamaha motorcycles both in Malaysia and Vietnam. HLYM holds an approximately 33% market share behind leader Honda. It is worth noting that the Yamaha business contributes almost two-thirds of HLI’s total earnings. We expect earnings from this division to be sustainable going forward, backed by the high proportion of the population under the age of 30, as well as launches of new big bike models that fetch wide margins.
Source: Company data, RHB estimates
Source: Company data, RHB estimates
Source: Company data, RHB estimates
Profit & Loss Jun-13 Jun-14F Jun-15F
Total turnover (MYRm) 2,261 2,385 2,197
Reported net profit (MYRm) 148 154 171
Recurring net profit (MYRm) 148 154 171
Recurring net profit growth (%) 11.8 4.1 11.3
Recurring EPS (MYR) 0.46 0.48 0.54
DPS (MYR) 0.21 0.32 0.36
Dividend Yield (%) 3.3 4.9 5.5
Recurring P/E (x) 14.13 13.57 12.20
Return on average equity (%) 12.6 12.7 13.3
P/B (x) 1.78 1.68 1.57
P/CF (x) 9.36 11.86 9.12
Balance Sheet (MYRm) Jun-13 Jun-14F Jun-15F
Total current assets 1,013 1,148 1,410
Total assets 2,489 2,641 2,228
Total current liabilities 481 606 565
Total non-current liabilities 725 637 127
Total liabilities 1,206 1,243 693
Shareholders' equity 1,170 1,242 1,328
Minority interests 113 155 208
Total equity 1,283 1,398 1,536
Total liabilities & equity 2,489 2,641 2,228
Total debt 835 741 231
Net debt 481 424 (414)
Cash flow (MYRm) Jun-13 Jun-14F Jun-15F
Cash flow from operations 223 176 229
Cash flow from investing activities (262) (27) 673
Cash flow from financing activities 178 (237) (622)
Cash at beginning of period 216 354 317
Total cash generated 139 (88) 280
Forex effects (0) - -
Implied cash at end of period 354 266 597
Building materials business a turnaround story. After suffering losses in FY12, we see the tiles division rebounding to profitability in FY13. Its Kluang plant, which was previously in the red due to the expansion of its porcelain production line, is now back in the black, and is now looking to fire up its second kiln. This is not forgetting the group’s fibre cement board (FCB) division, for which we believe the worst is over, given: i) the better EBIT margins on improved utilisation post plant expansion, ii) extra capacity to cater for increasing demand in a market buoyed by a robust construction sector, and iii) anti-dumping duties imposed on FCB imports from Thailand. Elsewhere, other businesses continue to grow at a healthy pace. The redemption of HLI’s high-cost medium term note (MTN), utilising its lower-yield unit trust investments to bring about savings that may contribute up to MYR10m in annual net profit, is timely. This will compensate for any loss of income from its concrete business and ICPS dividend.
Company Report Card
Latest results. HLI recorded revenue of MYR1.1bn (0.9% y-o-y) and a net profit of MYR78.2m (48.7% y-o-y) in 1HFY14. These earnings made up 51% of our full-year estimates.
Balance sheet/cash flow. The group’s net gearing was a fairly manageable 37.5% as at end-FY13. With the bulk of its borrowings being in MTNs that will be redeemed by August 2015 through its unit trust investments, HLI will be in a net cash position by end-FY15.
ROE. As we expect HLI to remain a growing dragon post exercise, its ROEs should stay in the attractive mid-teens.
Dividend. While HLI does not have a dividend policy, its dividend payout has been fairly consistent at 50%-60% in the past three years. Hence, we expect a 25 sen DPS in FY14, derived from our assumed 50% payout ratio.
Management. Chairman Dato’ Kwek Leng San, who heads the management team, has extensive experience in various business sectors. He is the brother of Tan Sri Quek Leng Chan, who helms the Hong Leong Group.
Recommendation
Cum-dividend FV of MYR8.57. Valuing HLI prior to the completion of the corporate exercise, targeted for completion at end-FY14, involves blending the value of its stock with 1.08 NARR shares. Meanwhile, our SOP-based FV for HLI on a standalone basis post exercise stands at MYR6.12, while NARR’s MYR2.27 FV is based on a 15x FY6/15 P/E. All in, we derive a cum-dividend FV of MYR8.57 for HLI, which offers a potential upside of 31.8%.
Top Malaysia Small Cap Companies 2014
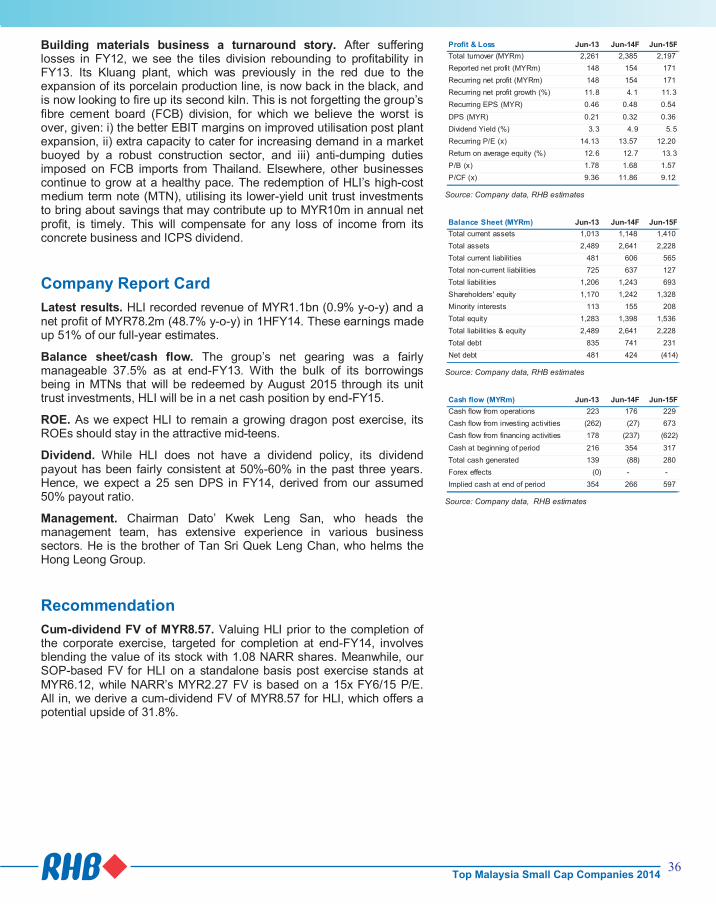
36
Hong Leong Industries Target: MYR8.57
Price: MYR6.53
Buy One, Free One
Source: Bloomberg
Stock Profile
Bloomberg Ticker HLI MK
Avg Turnover (MYR/USD) 1.09m/0.33m
Net Gearing (%) 30.4
Market Cap (MYRm) 2,086m
Beta (x) 0.81
BVPS (MYR) 3.89
52-wk Price low/high (MYR) 4.23 - 6.60
Free float (%) 21
Major Shareholders (%)
Hong Leong Manufacturing Group Sdn. Bhd.
75.4
Share Performance (%)
1m 3m 6m 12m
Absolute 0.0 36.9 22.5 51.9
Relative (1.1) 35.8 18.3 42.2
Ng Sem Guan, CFA +603 9207 7678
91
101
111
121
131
141
151
3.9
4.4
4.9
5.4
5.9
6.4
6.9
Hong Leong Industries (HLI MK)Price Close Relative to FTSE Bursa Malaysia KLCI Index (RHS)
11111
Ap
r-1
3
Jun-1
3
Au
g-1
3
Oct-
13
De
c-1
3
Fe
b-1
4
Vol m
Investment Merits
All eyes are on the proposed disposal of 175m ICPS in HCement that we deem as a “Buy one, get one free” deal
HLI will remain a growing dragon post the exercise as its Yamaha business is growing from strength to strength
Its building materials business comprising its tiles and fibreboard units are turning around while other businesses continue to grow at a healthy clip
Company Profile
Hong Leong Industries Berhad (HLI) is a Malaysia-based investment holding company. The company operates through Consumer Products and Industrial Products segments. The Consumer Products segment manufactures, assembles, and distributes motorcycles, scooters, and related parts and products; and manufactures and sells ceramic tiles. The Industrial Products segment manufactures and sells fiber cement and concrete products. The Company's associated companies are involved in the manufacture and assembly of motorcycles, motorcycle engines and spare parts and manufacture and sale of newsprint and related paper products. HLI was incorporated in 1964 and is a subsidiary of Hong Leong Manufacturing Group Sdn Bhd.
Highlights
A “Buy one, free one” exercise. HLI has kept a very low profile until it recently proposed to dispose of 175m irredeemable convertible preference shares (ICPS) in Hume Cement SB (HCement), as well as its entire concrete business. This will be in exchange for 348m Narra Industries (NARR MK, NR) shares that will be distributed as dividend-in-specie, on a basis of 1.08 NARR shares for every HLI share. Following the entire exercise, NARR will transform into a “sexy” cement stock from a bland furniture stock, as the exercise will also involve it acquiring a stake in HCement from HLMG. This will give investors an attractive alternative to HLI’s rather illiquid, yet pricier, peers.
Yamaha growing from strength to strength. HLI’s prospects remain bright despite the ongoing asset disposal. Through its subsidiary, Hong Leong Yamaha Motor (HLYM) and associate, Yamaha Vietnam, the group is involved in the manufacture and distribution of Yamaha motorcycles both in Malaysia and Vietnam. HLYM holds an approximately 33% market share behind leader Honda. It is worth noting that the Yamaha business contributes almost two-thirds of HLI’s total earnings. We expect earnings from this division to be sustainable going forward, backed by the high proportion of the population under the age of 30, as well as launches of new big bike models that fetch wide margins.
Source: Company data, RHB estimates
Source: Company data, RHB estimates
Source: Company data, RHB estimates
Profit & Loss Jun-13 Jun-14F Jun-15F
Total turnover (MYRm) 2,261 2,385 2,197
Reported net profit (MYRm) 148 154 171
Recurring net profit (MYRm) 148 154 171
Recurring net profit growth (%) 11.8 4.1 11.3
Recurring EPS (MYR) 0.46 0.48 0.54
DPS (MYR) 0.21 0.32 0.36
Dividend Yield (%) 3.3 4.9 5.5
Recurring P/E (x) 14.13 13.57 12.20
Return on average equity (%) 12.6 12.7 13.3
P/B (x) 1.78 1.68 1.57
P/CF (x) 9.36 11.86 9.12
Balance Sheet (MYRm) Jun-13 Jun-14F Jun-15F
Total current assets 1,013 1,148 1,410
Total assets 2,489 2,641 2,228
Total current liabilities 481 606 565
Total non-current liabilities 725 637 127
Total liabilities 1,206 1,243 693
Shareholders' equity 1,170 1,242 1,328
Minority interests 113 155 208
Total equity 1,283 1,398 1,536
Total liabilities & equity 2,489 2,641 2,228
Total debt 835 741 231
Net debt 481 424 (414)
Cash flow (MYRm) Jun-13 Jun-14F Jun-15F
Cash flow from operations 223 176 229
Cash flow from investing activities (262) (27) 673
Cash flow from financing activities 178 (237) (622)
Cash at beginning of period 216 354 317
Total cash generated 139 (88) 280
Forex effects (0) - -
Implied cash at end of period 354 266 597
Building materials business a turnaround story. After suffering losses in FY12, we see the tiles division rebounding to profitability in FY13. Its Kluang plant, which was previously in the red due to the expansion of its porcelain production line, is now back in the black, and is now looking to fire up its second kiln. This is not forgetting the group’s fibre cement board (FCB) division, for which we believe the worst is over, given: i) the better EBIT margins on improved utilisation post plant expansion, ii) extra capacity to cater for increasing demand in a market buoyed by a robust construction sector, and iii) anti-dumping duties imposed on FCB imports from Thailand. Elsewhere, other businesses continue to grow at a healthy pace. The redemption of HLI’s high-cost medium term note (MTN), utilising its lower-yield unit trust investments to bring about savings that may contribute up to MYR10m in annual net profit, is timely. This will compensate for any loss of income from its concrete business and ICPS dividend.
Company Report Card
Latest results. HLI recorded revenue of MYR1.1bn (0.9% y-o-y) and a net profit of MYR78.2m (48.7% y-o-y) in 1HFY14. These earnings made up 51% of our full-year estimates.
Balance sheet/cash flow. The group’s net gearing was a fairly manageable 37.5% as at end-FY13. With the bulk of its borrowings being in MTNs that will be redeemed by August 2015 through its unit trust investments, HLI will be in a net cash position by end-FY15.
ROE. As we expect HLI to remain a growing dragon post exercise, its ROEs should stay in the attractive mid-teens.
Dividend. While HLI does not have a dividend policy, its dividend payout has been fairly consistent at 50%-60% in the past three years. Hence, we expect a 25 sen DPS in FY14, derived from our assumed 50% payout ratio.
Management. Chairman Dato’ Kwek Leng San, who heads the management team, has extensive experience in various business sectors. He is the brother of Tan Sri Quek Leng Chan, who helms the Hong Leong Group.
Recommendation
Cum-dividend FV of MYR8.57. Valuing HLI prior to the completion of the corporate exercise, targeted for completion at end-FY14, involves blending the value of its stock with 1.08 NARR shares. Meanwhile, our SOP-based FV for HLI on a standalone basis post exercise stands at MYR6.12, while NARR’s MYR2.27 FV is based on a 15x FY6/15 P/E. All in, we derive a cum-dividend FV of MYR8.57 for HLI, which offers a potential upside of 31.8%.
Top Malaysia Small Cap Companies 2014

37
Hovid Target: MYR0.42
Price: MYR0.35
Expiry Of Drug Patents To Power Growth
81
94
108
121
134
148
161
0.10
0.15
0.20
0.25
0.30
0.35
0.40
Hovid Bhd (HOV MK)Price Close Relative to FTSE Bursa Malaysia KLCI Index (RHS)
510152025303540
Apr-
13
Jun
-13
Aug
-13
Oct
-13
Dec-1
3
Feb
-14
Vo
l m
Source: Bloomberg
Stock Profile
Bloomberg Ticker HOV MK
Avg Turnover (MYR/USD) 1.27m/0.39m
Net Gearing (%) -6.2
Market Cap (MYRm) 256m
Beta (x) 0.81
BVPS (MYR) 0.24
52-wk Price low/high (MYR) 0.22 - 0.38
Free float (%) 57
Major Shareholders (%)
Ho Sue San 37.6
Lembaga Tabung Haji 5.2
Share Performance (%)
1m 3m 6m 12m
Absolute (1.5) 1.5 15.5 45.7
Relative (3.2) 0.4 10.7 35.6
The Research Team +603 9207 7663
Investment Merits
Small-cap pharmaceutical manufacturer of more than 350 types of generic drugs with a global presence in 45 countries
Strong growth potential with the “patent cliff”, export market drug registrations, internally-developed drugs and original equipment manufacturing (OEM) products to boost revenue growth
We value Hovid at MYR0.42, based on a 16x fully-diluted FY15 EPS, which is a discount to its global peer average of 17x. Our valuation takes into account its size (relative to global peers) and the number of warrants issued during FY13
Company Profile
Hovid was founded by Dr Ho Kai Cheong in the 1940s, with its maiden Ho Yan Hor herbal tea product. In the 1980s, it ventured into the pharmaceutical manufacturing business and is now a drug manufacturer based in Ipoh, Perak. Its products are manufactured and marketed locally as well as exported to 45 countries. Hovid currently has two manufacturing plants located in Ipoh and Chemor, Perak in addition to a research and development centre in Penang.
Highlights
Patented drugs expiry to boost revenue. Hovid is expected to be one of the beneficiaries of a “patent cliff” or major lifestyle drugs going off-patent in the coming years. Between 2014 and 2016, more than 20 lifestyle drugs are expected to go off-patent. The lifestyle drugs include: i) Micardis, ii) Renagel and iii) Advicor which are drugs meant to combat diseases such as hypertension, kidney and cholesterol respectively. These soon-to-expire drugs are worth an estimated USD34bn - USD66bn in worldwide sales during FY14-15. Hence, we believe that Hovid will be able to grow its revenue substantially by tapping into this revenue pool.
Existing drugs pending approval in FY14-15. Hovid is set for a good year ahead with several drugs pending approval in Malaysia and several other countries that will drive FY15 earnings. To date, it has about 250 product registrations currently pending approval in various countries. These are expected to generate MYR30.0m in sales within 18 months of the drugs being officially registered in the respective countries.
Developing in-house lifestyle drugs. Hovid is currently working on two lifestyle in-house drugs targeted towards liver and stroke patients. The drugs, the first of its kind, will tap further into the potential of TocovidSuprabio. These drugs, currently undergoing intensive research and development at the Ohio State University - Hovid’s research partner in the United States – are anticipated to hit the shelves within three to five years. TocovidSuprabio, which is expected to be Hovid’s breakthrough as a drug innovator,will be produced and marketed under
Profit & Loss Jun-13 Jun-14F Jun-15F
Total turnover (MYRm) 173 183 197
Reported net profit (MYRm) 20 23 28
Recurring net profit (MYRm) 20 23 28
Recurring net profit growth (%) (36.0) 11.6 22.5
Recurring EPS (MYR) 0.03 0.03 0.04
Recurring P/E (x) 12.70 11.38 9.29
Return on average equity (%) 15.6 13.6 14.3
P/B (x) 1.67 1.44 1.23
P/CF (x) 8.04 10.93 8.80
Source: Company data, RHB estimates
Balance Sheet (MYRm) Jun-11 Jun-12 Jun-13
Total current assets 70 98 91
Total assets 201 210 224
Total current liabilities 66 74 38
Total non-current liabilities 29 25 26
Total liabilities 95 99 64
Shareholders' equity 100 107 155
Minority interests 5 4 5
Other equity 0 - 0
Total equity 106 111 160
Total liabilities & equity 201 210 224
Total debt 50 43 12
Net debt 41 20 (15)
Source: Company data, RHB estimates
Cash flow (MYRm) Jun-11 Jun-12 Jun-13
Cash flow from operations 31 35 32
Cash flow from investing activities - - 0
Cash flow from financing activities (304) (32) (2)
Cash at beginning of period 10 9 23
Total cash generated (272) 3 30
Implied cash at end of period (263) 12 53
Source: Company data, RHB estimates
the company’s label.
Capacity expansion.Hovid is currently in the midst of increasing its production capacity with the expansion of its Chemor manufacturing plant. The new plant will have equipment for high-volume production of capsules and tablets. The expansion is expected to raise production capacity by 30%. Hovid is also currently setting up its own bioequivalence test center, located in UniversitiSains Malaysia (USM), Penang as well as a centralised warehouse in Ipoh to improve product distribution to facilitate business growth.
The management believes that despite the lacklustre performance in 6MFY14, Hovid is still on track to achieve its target projected net profit of MYR23-28m for FY14-15. Historically, the company performs better in the second half of the FY and benefits from the appreciation of USD against MYR. Management is also guiding for double-digit net profit growth in FY14-15.
Company Report Card
Latest results. Hovid’s 6MFY14 results were broadly within our and consensus expectations, with its MYR8.5m in net profit account for 37% of our full-year forecast. The weak performance was mainly due to lower sales to export markets, a different sales mix with a lower profit margin and higher operational costs. Future sales are expected to be derived from newly-registered drugs.
Balance sheet/cash flow. The company’s balance sheet as at 6MFY14 remained, healthy with its gearing ratio at just 7.0%, compared with its larger local peer Pharmaniaga (PHRM MK, NR)’s 50.3%. Hovid’s free cash flow (FCF) for the past two years has also been positive, registering MYR28.8m and MYR14.0m in FY12-13 respectively.
ROE. We expect ROE of around 13-14% in FY14-15, down marginally from 15.6% ROE in FY13.
Dividend. Currently, Hovid does not have a fixed dividend payout policy. However, it has conveyed its intention to do so in the near future. It has paid out interim dividends of 1.3 sen and 0.5 sen with respect to FY13 and FY14. Historically, the company paid out 4.5 sen per share in FY12 but nil in FY11.
Management. Hovid’s management is spearheaded by Mr. David Ho, who is the chairman and managing director. Mr. Andrew Goh is the company’s CFO. Mr. Ho, a pharmacist by profession, was a member of various pharmaceutical associations, including the Malaysian Pharmacist Board and Pharmaceutical Society of New Zealand before being appointed to the board on 31 Jan 2008.
Recommendation
Our TP for Hovid is MYR0.42, derived by ascribing a 16x fully-diluted FY15 EPS. Our target P/E is at a discount to its global peer average of 17x FY15 earnings. We have taken into account the 381.0m warrants issued in 2013. We like this stock for its: i) robust revenue pipeline, ii) strong and wide exposure to the export market, and iii) decent expected ROE of 14% in FY15.
Top Malaysia Small Cap Companies 2014
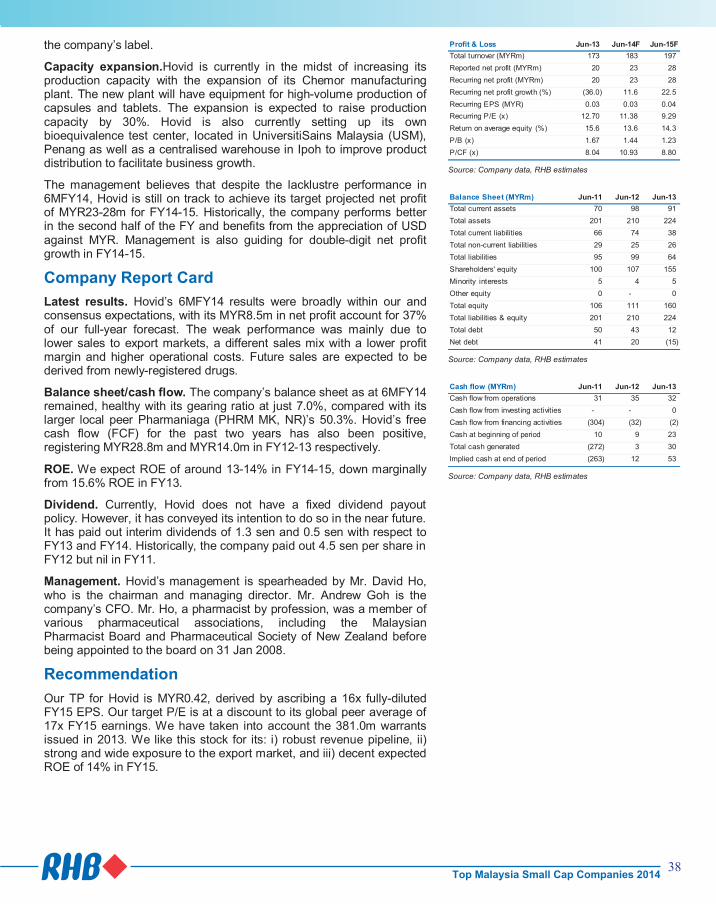
38
Hovid Target: MYR0.42
Price: MYR0.35
Expiry Of Drug Patents To Power Growth
81
94
108
121
134
148
161
0.10
0.15
0.20
0.25
0.30
0.35
0.40
Hovid Bhd (HOV MK)Price Close Relative to FTSE Bursa Malaysia KLCI Index (RHS)
510152025303540
Apr-
13
Jun
-13
Aug
-13
Oct
-13
Dec-1
3
Feb
-14
Vo
l m
Source: Bloomberg
Stock Profile
Bloomberg Ticker HOV MK
Avg Turnover (MYR/USD) 1.27m/0.39m
Net Gearing (%) -6.2
Market Cap (MYRm) 256m
Beta (x) 0.81
BVPS (MYR) 0.24
52-wk Price low/high (MYR) 0.22 - 0.38
Free float (%) 57
Major Shareholders (%)
Ho Sue San 37.6
Lembaga Tabung Haji 5.2
Share Performance (%)
1m 3m 6m 12m
Absolute (1.5) 1.5 15.5 45.7
Relative (3.2) 0.4 10.7 35.6
The Research Team +603 9207 7663
Investment Merits
Small-cap pharmaceutical manufacturer of more than 350 types of generic drugs with a global presence in 45 countries
Strong growth potential with the “patent cliff”, export market drug registrations, internally-developed drugs and original equipment manufacturing (OEM) products to boost revenue growth
We value Hovid at MYR0.42, based on a 16x fully-diluted FY15 EPS, which is a discount to its global peer average of 17x. Our valuation takes into account its size (relative to global peers) and the number of warrants issued during FY13
Company Profile
Hovid was founded by Dr Ho Kai Cheong in the 1940s, with its maiden Ho Yan Hor herbal tea product. In the 1980s, it ventured into the pharmaceutical manufacturing business and is now a drug manufacturer based in Ipoh, Perak. Its products are manufactured and marketed locally as well as exported to 45 countries. Hovid currently has two manufacturing plants located in Ipoh and Chemor, Perak in addition to a research and development centre in Penang.
Highlights
Patented drugs expiry to boost revenue. Hovid is expected to be one of the beneficiaries of a “patent cliff” or major lifestyle drugs going off-patent in the coming years. Between 2014 and 2016, more than 20 lifestyle drugs are expected to go off-patent. The lifestyle drugs include: i) Micardis, ii) Renagel and iii) Advicor which are drugs meant to combat diseases such as hypertension, kidney and cholesterol respectively. These soon-to-expire drugs are worth an estimated USD34bn - USD66bn in worldwide sales during FY14-15. Hence, we believe that Hovid will be able to grow its revenue substantially by tapping into this revenue pool.
Existing drugs pending approval in FY14-15. Hovid is set for a good year ahead with several drugs pending approval in Malaysia and several other countries that will drive FY15 earnings. To date, it has about 250 product registrations currently pending approval in various countries. These are expected to generate MYR30.0m in sales within 18 months of the drugs being officially registered in the respective countries.
Developing in-house lifestyle drugs. Hovid is currently working on two lifestyle in-house drugs targeted towards liver and stroke patients. The drugs, the first of its kind, will tap further into the potential of TocovidSuprabio. These drugs, currently undergoing intensive research and development at the Ohio State University - Hovid’s research partner in the United States – are anticipated to hit the shelves within three to five years. TocovidSuprabio, which is expected to be Hovid’s breakthrough as a drug innovator,will be produced and marketed under
Profit & Loss Jun-13 Jun-14F Jun-15F
Total turnover (MYRm) 173 183 197
Reported net profit (MYRm) 20 23 28
Recurring net profit (MYRm) 20 23 28
Recurring net profit growth (%) (36.0) 11.6 22.5
Recurring EPS (MYR) 0.03 0.03 0.04
Recurring P/E (x) 12.70 11.38 9.29
Return on average equity (%) 15.6 13.6 14.3
P/B (x) 1.67 1.44 1.23
P/CF (x) 8.04 10.93 8.80
Source: Company data, RHB estimates
Balance Sheet (MYRm) Jun-11 Jun-12 Jun-13
Total current assets 70 98 91
Total assets 201 210 224
Total current liabilities 66 74 38
Total non-current liabilities 29 25 26
Total liabilities 95 99 64
Shareholders' equity 100 107 155
Minority interests 5 4 5
Other equity 0 - 0
Total equity 106 111 160
Total liabilities & equity 201 210 224
Total debt 50 43 12
Net debt 41 20 (15)
Source: Company data, RHB estimates
Cash flow (MYRm) Jun-11 Jun-12 Jun-13
Cash flow from operations 31 35 32
Cash flow from investing activities - - 0
Cash flow from financing activities (304) (32) (2)
Cash at beginning of period 10 9 23
Total cash generated (272) 3 30
Implied cash at end of period (263) 12 53
Source: Company data, RHB estimates
the company’s label.
Capacity expansion.Hovid is currently in the midst of increasing its production capacity with the expansion of its Chemor manufacturing plant. The new plant will have equipment for high-volume production of capsules and tablets. The expansion is expected to raise production capacity by 30%. Hovid is also currently setting up its own bioequivalence test center, located in UniversitiSains Malaysia (USM), Penang as well as a centralised warehouse in Ipoh to improve product distribution to facilitate business growth.
The management believes that despite the lacklustre performance in 6MFY14, Hovid is still on track to achieve its target projected net profit of MYR23-28m for FY14-15. Historically, the company performs better in the second half of the FY and benefits from the appreciation of USD against MYR. Management is also guiding for double-digit net profit growth in FY14-15.
Company Report Card
Latest results. Hovid’s 6MFY14 results were broadly within our and consensus expectations, with its MYR8.5m in net profit account for 37% of our full-year forecast. The weak performance was mainly due to lower sales to export markets, a different sales mix with a lower profit margin and higher operational costs. Future sales are expected to be derived from newly-registered drugs.
Balance sheet/cash flow. The company’s balance sheet as at 6MFY14 remained, healthy with its gearing ratio at just 7.0%, compared with its larger local peer Pharmaniaga (PHRM MK, NR)’s 50.3%. Hovid’s free cash flow (FCF) for the past two years has also been positive, registering MYR28.8m and MYR14.0m in FY12-13 respectively.
ROE. We expect ROE of around 13-14% in FY14-15, down marginally from 15.6% ROE in FY13.
Dividend. Currently, Hovid does not have a fixed dividend payout policy. However, it has conveyed its intention to do so in the near future. It has paid out interim dividends of 1.3 sen and 0.5 sen with respect to FY13 and FY14. Historically, the company paid out 4.5 sen per share in FY12 but nil in FY11.
Management. Hovid’s management is spearheaded by Mr. David Ho, who is the chairman and managing director. Mr. Andrew Goh is the company’s CFO. Mr. Ho, a pharmacist by profession, was a member of various pharmaceutical associations, including the Malaysian Pharmacist Board and Pharmaceutical Society of New Zealand before being appointed to the board on 31 Jan 2008.
Recommendation
Our TP for Hovid is MYR0.42, derived by ascribing a 16x fully-diluted FY15 EPS. Our target P/E is at a discount to its global peer average of 17x FY15 earnings. We have taken into account the 381.0m warrants issued in 2013. We like this stock for its: i) robust revenue pipeline, ii) strong and wide exposure to the export market, and iii) decent expected ROE of 14% in FY15.
Top Malaysia Small Cap Companies 2014

39
Inari Amertron Target: MYR3.72
Price: MYR2.75
Going Great Guns
41
158
274
391
508
624
741
0.1
0.6
1.1
1.6
2.1
2.6
3.1
Inari Amertron (INRI MK)Price Close Relative to FTSE Bursa Malaysia KLCI Index (RHS)
2468
10121416
Apr-
13
Jun
-13
Aug
-13
Oct
-13
Dec-1
3
Feb
-14
Vol m
Source: Bloomberg
Stock Profile
Bloomberg Ticker INRI MK
Avg Turnover (MYR/USD) 7.17m/2.18m
Net Gearing (%) -8.6
Market Cap (MYRm) 1,364m
Beta (x) 1.35
BVPS (MYR) 0.50
52-wk Price low/high (MYR) 0.41 - 2.83
Free float (%) 40
Major Shareholders (%)
Insas Bhd 33.4
Macronion SB 6.9
Ho Phon Guan 6.4
Share Performance (%)
1m 3m 6m 12m
Absolute 34.1 63.7 154.6 580.7
Relative 32.4 61.6 149.8 570.4
The Research Team +603 9207 7686
Investment Merits
Offering decent yields of 2-4% on top of strong projected earnings growth of 25-35% for FY15-16
Recent industry data is pointing north, suggesting recovery in the semiconductor sector
Right product exposure, targeting growth in the consumer electronic space
Impending transfer to the Main Board of Bursa Malaysia
Company Profile
Inari Amertron (Inari) is an electronics manufacturing service provider in the semiconductor and optoelectronics industries that also develops precision test and measurement products for various technological applications.
Highlights
Riding high with Avago. Inari’s growth potential remains intact owing to the bright outlook for its major customer, Avago Technologies (AVGO US, NR). The latter is a leading analog, mixed signal and optoelectronic components supplier targeting the wireless communications, wired infrastructure and industrial markets. Its radio frequency (RF) chips are among the best in the world, and Inari is poised to benefit by virture of being one of Avago’s main contractors assembling and testing its RF integrated circuits. This in turn opens doors for Inari to tap into the smartphone and tablet markets. The recent acquisition of Amertron also gives Inari the opportunity to make inroads into the data centre business by offering fibre optics-related products to Avago.
“Internet of Things” a driving force. We reckon the “Internet of Things” (IoT) will further spearhead and propel the growth of both companies as data consumption rockets. In the near future, we believe IoT will dominate the consumer product space and quickly make strides into our daily lives, while smartphones and tablets are becoming basic devices for machine-to-machine (M2M) connectivity. Also, there are transformational effects on data centres given that IoT deployment generates large amounts of data that need to be managed and analysed in real time, leaving providers to deal with new challenges in capacity, security and analytics.
Ceedtec a budding gem. Another contributor of growth would come from the test and measurement (T&M) business, on which Inari’s 51%-owned Ceedtec is focused. Notably, it is being incubated to become an original design manufacturer for Agilent Technologies (A US, NR), a leader in the T&M space. In addition, the company is a key beneficiary of the Economic Transformation Programme, as one of Agilent’s Malaysian ecosystem partners.
Profit & Loss Jun-13 Jun-14F Jun-15F
Total turnover (MYRm) 241 803 914
Reported net profit (MYRm) 42 94 129
Recurring net profit (MYRm) 42 94 129
Recurring net profit growth (%) 111.3 124.7 36.6
Recurring EPS (MYR) 0.08 0.19 0.26
DPS (MYR) 0.03 0.08 0.10
Dividend Yield (%) 1.2 2.8 3.8
Recurring P/E (x) 32.40 14.42 10.56
Return on average equity (%) 34.8 46.5 43.9
P/B (x) 8.62 5.49 4.02
P/CF (x) 18.93 15.77 10.23
Source: Company data, RHB estimates
Balance Sheet (MYRm) Jun-13 Jun-14F Jun-15F
Total current assets 249 342 428
Total assets 372 499 614
Total current liabilities 154 162 177
Total non-current liabilities 61 91 100
Total liabilities 215 253 277
Shareholders' equity 158 248 339
Minority interests (1) (1) (2)
Other equity 0 0 (0)
Total equity 157 246 337
Total liabilities & equity 372 499 614
Total debt 69 74 79
Net debt 25 (21) (69)
Source: Company data, RHB estimates
Cash flow (MYRm) Jun-13 Jun-14F Jun-15F
Cash flow from operations 72 86 133
Cash flow from investing activities (130) (36) (47)
Cash flow from financing activities 61 0 (33)
Cash at beginning of period 40 44 95
Total cash generated 3 51 53
Forex effects 0 - -
Implied cash at end of period 44 95 148
Source: Company data, RHB estimates
Company Report Card
Latest results. In 1HFY14, Inari reported a stellar set of financials, thanks to the completion of its acquisition of Amertron in June last year. Its revenue jumped 224% while core earnings spiked up 176% y-o-y respectively.
Balance sheet/cash flow. As at 31 Dec 2013, Inari’s balance sheet was robust, with a net gearing ratio of 0.1x. Similarly, it has been generating robust operating cash flow, posting positive numbers for the past three years.
ROE. Its ROE of >40% is above the industry average of 5-10%.
Dividend. Inari has a policy of paying up to 40% of its earnings as dividends. Based on our FY14-15 estimates, we can expect yields of between 2-4%.
Management. Inari is led by co-founder Dr Tan Seng Chuan and CEO KC Lau, together with a team of highly experienced managers.
Recommendation
FV of MYR3.72. We opine that Inari is still undervalued despite its significant share price rally over the last one year. Our fair value is MYR3.72, based on 17x CY15 EPS. We ascribe a 15% P/E premium to the stock vis-a-vis its local peers to reflect its: i) strong growth prospects, ii) right product diversity, and iii) robust balance sheet. We think our valuation is fair given the stock’s implied CY15 PEG of a mere 0.7x. Inari’s valuation is also attractive when stacked against FBM KLCI, which is currently trading at a forward PEG of >2x.
Top Malaysia Small Cap Companies 2014

40
Inari Amertron Target: MYR3.72
Price: MYR2.75
Going Great Guns
41
158
274
391
508
624
741
0.1
0.6
1.1
1.6
2.1
2.6
3.1
Inari Amertron (INRI MK)Price Close Relative to FTSE Bursa Malaysia KLCI Index (RHS)
2468
10121416
Apr-
13
Jun
-13
Aug
-13
Oct
-13
Dec-1
3
Feb
-14
Vol m
Source: Bloomberg
Stock Profile
Bloomberg Ticker INRI MK
Avg Turnover (MYR/USD) 7.17m/2.18m
Net Gearing (%) -8.6
Market Cap (MYRm) 1,364m
Beta (x) 1.35
BVPS (MYR) 0.50
52-wk Price low/high (MYR) 0.41 - 2.83
Free float (%) 40
Major Shareholders (%)
Insas Bhd 33.4
Macronion SB 6.9
Ho Phon Guan 6.4
Share Performance (%)
1m 3m 6m 12m
Absolute 34.1 63.7 154.6 580.7
Relative 32.4 61.6 149.8 570.4
The Research Team +603 9207 7686
Investment Merits
Offering decent yields of 2-4% on top of strong projected earnings growth of 25-35% for FY15-16
Recent industry data is pointing north, suggesting recovery in the semiconductor sector
Right product exposure, targeting growth in the consumer electronic space
Impending transfer to the Main Board of Bursa Malaysia
Company Profile
Inari Amertron (Inari) is an electronics manufacturing service provider in the semiconductor and optoelectronics industries that also develops precision test and measurement products for various technological applications.
Highlights
Riding high with Avago. Inari’s growth potential remains intact owing to the bright outlook for its major customer, Avago Technologies (AVGO US, NR). The latter is a leading analog, mixed signal and optoelectronic components supplier targeting the wireless communications, wired infrastructure and industrial markets. Its radio frequency (RF) chips are among the best in the world, and Inari is poised to benefit by virture of being one of Avago’s main contractors assembling and testing its RF integrated circuits. This in turn opens doors for Inari to tap into the smartphone and tablet markets. The recent acquisition of Amertron also gives Inari the opportunity to make inroads into the data centre business by offering fibre optics-related products to Avago.
“Internet of Things” a driving force. We reckon the “Internet of Things” (IoT) will further spearhead and propel the growth of both companies as data consumption rockets. In the near future, we believe IoT will dominate the consumer product space and quickly make strides into our daily lives, while smartphones and tablets are becoming basic devices for machine-to-machine (M2M) connectivity. Also, there are transformational effects on data centres given that IoT deployment generates large amounts of data that need to be managed and analysed in real time, leaving providers to deal with new challenges in capacity, security and analytics.
Ceedtec a budding gem. Another contributor of growth would come from the test and measurement (T&M) business, on which Inari’s 51%-owned Ceedtec is focused. Notably, it is being incubated to become an original design manufacturer for Agilent Technologies (A US, NR), a leader in the T&M space. In addition, the company is a key beneficiary of the Economic Transformation Programme, as one of Agilent’s Malaysian ecosystem partners.
Profit & Loss Jun-13 Jun-14F Jun-15F
Total turnover (MYRm) 241 803 914
Reported net profit (MYRm) 42 94 129
Recurring net profit (MYRm) 42 94 129
Recurring net profit growth (%) 111.3 124.7 36.6
Recurring EPS (MYR) 0.08 0.19 0.26
DPS (MYR) 0.03 0.08 0.10
Dividend Yield (%) 1.2 2.8 3.8
Recurring P/E (x) 32.40 14.42 10.56
Return on average equity (%) 34.8 46.5 43.9
P/B (x) 8.62 5.49 4.02
P/CF (x) 18.93 15.77 10.23
Source: Company data, RHB estimates
Balance Sheet (MYRm) Jun-13 Jun-14F Jun-15F
Total current assets 249 342 428
Total assets 372 499 614
Total current liabilities 154 162 177
Total non-current liabilities 61 91 100
Total liabilities 215 253 277
Shareholders' equity 158 248 339
Minority interests (1) (1) (2)
Other equity 0 0 (0)
Total equity 157 246 337
Total liabilities & equity 372 499 614
Total debt 69 74 79
Net debt 25 (21) (69)
Source: Company data, RHB estimates
Cash flow (MYRm) Jun-13 Jun-14F Jun-15F
Cash flow from operations 72 86 133
Cash flow from investing activities (130) (36) (47)
Cash flow from financing activities 61 0 (33)
Cash at beginning of period 40 44 95
Total cash generated 3 51 53
Forex effects 0 - -
Implied cash at end of period 44 95 148
Source: Company data, RHB estimates
Company Report Card
Latest results. In 1HFY14, Inari reported a stellar set of financials, thanks to the completion of its acquisition of Amertron in June last year. Its revenue jumped 224% while core earnings spiked up 176% y-o-y respectively.
Balance sheet/cash flow. As at 31 Dec 2013, Inari’s balance sheet was robust, with a net gearing ratio of 0.1x. Similarly, it has been generating robust operating cash flow, posting positive numbers for the past three years.
ROE. Its ROE of >40% is above the industry average of 5-10%.
Dividend. Inari has a policy of paying up to 40% of its earnings as dividends. Based on our FY14-15 estimates, we can expect yields of between 2-4%.
Management. Inari is led by co-founder Dr Tan Seng Chuan and CEO KC Lau, together with a team of highly experienced managers.
Recommendation
FV of MYR3.72. We opine that Inari is still undervalued despite its significant share price rally over the last one year. Our fair value is MYR3.72, based on 17x CY15 EPS. We ascribe a 15% P/E premium to the stock vis-a-vis its local peers to reflect its: i) strong growth prospects, ii) right product diversity, and iii) robust balance sheet. We think our valuation is fair given the stock’s implied CY15 PEG of a mere 0.7x. Inari’s valuation is also attractive when stacked against FBM KLCI, which is currently trading at a forward PEG of >2x.
Top Malaysia Small Cap Companies 2014
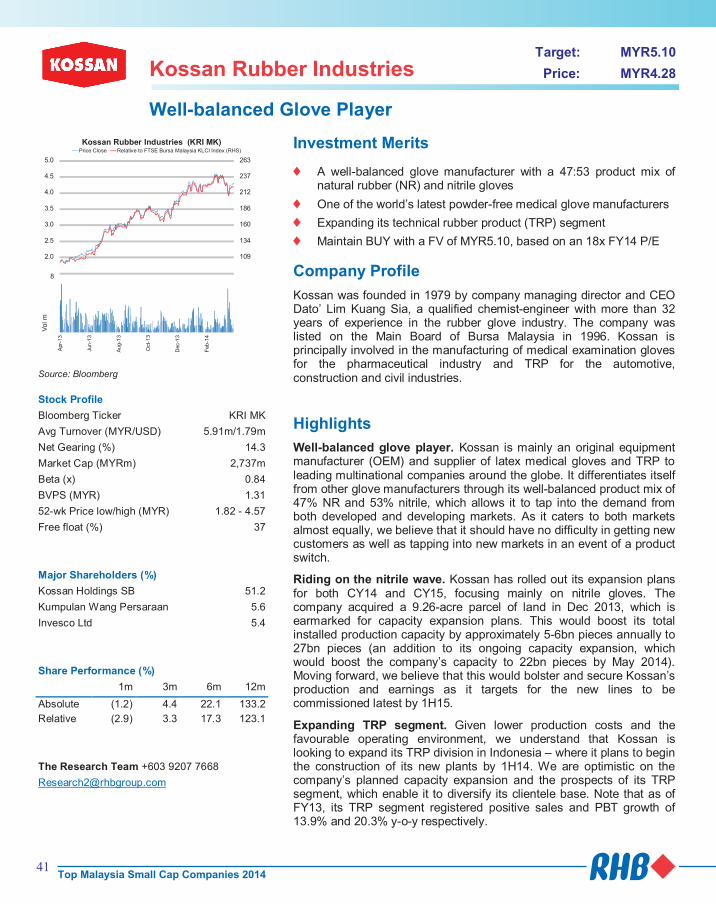
41
Kossan Rubber Industries Target: MYR5.10
Price: MYR4.28
Well-balanced Glove Player
83
109
134
160
186
212
237
263
1.5
2.0
2.5
3.0
3.5
4.0
4.5
5.0
Kossan Rubber Industries (KRI MK)Price Close Relative to FTSE Bursa Malaysia KLCI Index (RHS)
12345678
Apr-
13
Jun
-13
Aug
-13
Oct
-13
Dec-1
3
Feb
-14
Vol m
Source: Bloomberg
Stock Profile
Bloomberg Ticker KRI MK
Avg Turnover (MYR/USD) 5.91m/1.79m
Net Gearing (%) 14.3
Market Cap (MYRm) 2,737m
Beta (x) 0.84
BVPS (MYR) 1.31
52-wk Price low/high (MYR) 1.82 - 4.57
Free float (%) 37
Major Shareholders (%)
Kossan Holdings SB 51.2
Kumpulan Wang Persaraan 5.6
Invesco Ltd 5.4
Share Performance (%)
1m 3m 6m 12m
Absolute (1.2) 4.4 22.1 133.2
Relative (2.9) 3.3 17.3 123.1
The Research Team +603 9207 7668
Investment Merits
A well-balanced glove manufacturer with a 47:53 product mix of natural rubber (NR) and nitrile gloves
One of the world’s latest powder-free medical glove manufacturers
Expanding its technical rubber product (TRP) segment
Maintain BUY with a FV of MYR5.10, based on an 18x FY14 P/E
Company Profile
Kossan was founded in 1979 by company managing director and CEO Dato’ Lim Kuang Sia, a qualified chemist-engineer with more than 32 years of experience in the rubber glove industry. The company was listed on the Main Board of Bursa Malaysia in 1996. Kossan is principally involved in the manufacturing of medical examination gloves for the pharmaceutical industry and TRP for the automotive, construction and civil industries.
Highlights
Well-balanced glove player. Kossan is mainly an original equipment manufacturer (OEM) and supplier of latex medical gloves and TRP to leading multinational companies around the globe. It differentiates itself from other glove manufacturers through its well-balanced product mix of 47% NR and 53% nitrile, which allows it to tap into the demand from both developed and developing markets. As it caters to both markets almost equally, we believe that it should have no difficulty in getting new customers as well as tapping into new markets in an event of a product switch.
Riding on the nitrile wave. Kossan has rolled out its expansion plans for both CY14 and CY15, focusing mainly on nitrile gloves. The company acquired a 9.26-acre parcel of land in Dec 2013, which is earmarked for capacity expansion plans. This would boost its total installed production capacity by approximately 5-6bn pieces annually to 27bn pieces (an addition to its ongoing capacity expansion, which would boost the company’s capacity to 22bn pieces by May 2014). Moving forward, we believe that this would bolster and secure Kossan’s production and earnings as it targets for the new lines to be commissioned latest by 1H15.
Expanding TRP segment. Given lower production costs and the favourable operating environment, we understand that Kossan is looking to expand its TRP division in Indonesia – where it plans to begin the construction of its new plants by 1H14. We are optimistic on the company’s planned capacity expansion and the prospects of its TRP segment, which enable it to diversify its clientele base. Note that as of FY13, its TRP segment registered positive sales and PBT growth of 13.9% and 20.3% y-o-y respectively.
Profit & Loss Dec-12 Dec-13 Dec-14F
Total turnover (MYRm) 1,234 1,310 1,731
Reported net profit (MYRm) 102 141 182
Recurring net profit (MYRm) 102 141 182
Recurring net profit growth (%) 13.9 37.6 29.6
Recurring EPS (MYR) 0.16 0.22 0.28
DPS (MYR) 0.09 0.07 0.09
Dividend Yield (%) 2.1 1.5 2.0
Recurring P/E (x) 26.79 19.46 15.02
Return on average equity (%) 18.6 21.4 23.6
P/B (x) 4.53 3.86 3.27
P/CF (x) 29.45 17.44 17.81
Source: Company data, RHB estimates
Balance Sheet (MYRm) Dec-12 Dec-13 Dec-14F
Total current assets 471 500 561
Total assets 990 1,103 1,255
Total current liabilities 284 280 301
Total non-current liabilities 88 97 97
Total liabilities 373 377 398
Shareholders' equity 605 710 837
Minority interests 13 16 20
Other equity (0) - -
Total equity 617 726 857
Total liabilities & equity 990 1,103 1,255
Total debt 199 169 169
Net debt 99 71 123
Source: Company data, RHB estimates
Cash flow (MYRm) Dec-12 Dec-13 Dec-14F
Cash flow from operations 93 157 154
Cash flow from investing activities (80) (135) (139)
Cash flow from financing activities 33 (28) (62)
Cash at beginning of period 52 100 98
Total cash generated 46 (7) (48)
Implied cash at end of period 98 93 50
Source: Company data, RHB estimates
Company Report Card
Latest results. Kossan’s commendable FY13 core earnings of MYR141m came in line with our estimates, mainly attributed to a higher sales volume, stabilising raw material prices as well as better operating efficiency at its plants.
Balance sheet/cash flow. As of FY13, the company’s net gearing stood at 0.11x vs 0.16x in FY12. We believe that its net gearing ratio is still at a comfortable level and should not pose a concern.
ROE. Kossan has been consistently delivering strong ROE growth, which improved to 21.4% in 2013 from 18.6% in 2012. Moving forward, we expect the company to continue delivering double-digit ROEs as we see its capacity expansion gradually kick in in CY14 and CY15. We believe that this is attainable given the nature of the recession-proof rubber glove industry as well as growing demand in both developed and developing countries amid increasing healthcare awareness.
Dividend. The company has been consistently paying dividends since its listing in 1996 and we expect it to continuously reward shareholders with generous dividends, given its sustainable and resilient business model.
Management. Founder, managing director and CEO Dato’ Lim Kuang Sia leads Kossan’s management team and carries with him more than 32 years of experience in the rubber glove industry.
Recommendation
Maintain BUY. Our FV of MYR5.10 for Kossan is based on a P/E of 18x on FY14 earnings. We continue to like the company’s solid fundamentals and strong management team, as well as its: i) robust earnings outlook for the next two years, backed by capacity expansion, ii) balanced product mix, and iii) steady operating environment, given stable raw material prices and a favourable USD.
Top Malaysia Small Cap Companies 2014

42
Kossan Rubber Industries Target: MYR5.10
Price: MYR4.28
Well-balanced Glove Player
83
109
134
160
186
212
237
263
1.5
2.0
2.5
3.0
3.5
4.0
4.5
5.0
Kossan Rubber Industries (KRI MK)Price Close Relative to FTSE Bursa Malaysia KLCI Index (RHS)
12345678
Apr-
13
Jun
-13
Aug
-13
Oct
-13
Dec-1
3
Feb
-14
Vol m
Source: Bloomberg
Stock Profile
Bloomberg Ticker KRI MK
Avg Turnover (MYR/USD) 5.91m/1.79m
Net Gearing (%) 14.3
Market Cap (MYRm) 2,737m
Beta (x) 0.84
BVPS (MYR) 1.31
52-wk Price low/high (MYR) 1.82 - 4.57
Free float (%) 37
Major Shareholders (%)
Kossan Holdings SB 51.2
Kumpulan Wang Persaraan 5.6
Invesco Ltd 5.4
Share Performance (%)
1m 3m 6m 12m
Absolute (1.2) 4.4 22.1 133.2
Relative (2.9) 3.3 17.3 123.1
The Research Team +603 9207 7668
Investment Merits
A well-balanced glove manufacturer with a 47:53 product mix of natural rubber (NR) and nitrile gloves
One of the world’s latest powder-free medical glove manufacturers
Expanding its technical rubber product (TRP) segment
Maintain BUY with a FV of MYR5.10, based on an 18x FY14 P/E
Company Profile
Kossan was founded in 1979 by company managing director and CEO Dato’ Lim Kuang Sia, a qualified chemist-engineer with more than 32 years of experience in the rubber glove industry. The company was listed on the Main Board of Bursa Malaysia in 1996. Kossan is principally involved in the manufacturing of medical examination gloves for the pharmaceutical industry and TRP for the automotive, construction and civil industries.
Highlights
Well-balanced glove player. Kossan is mainly an original equipment manufacturer (OEM) and supplier of latex medical gloves and TRP to leading multinational companies around the globe. It differentiates itself from other glove manufacturers through its well-balanced product mix of 47% NR and 53% nitrile, which allows it to tap into the demand from both developed and developing markets. As it caters to both markets almost equally, we believe that it should have no difficulty in getting new customers as well as tapping into new markets in an event of a product switch.
Riding on the nitrile wave. Kossan has rolled out its expansion plans for both CY14 and CY15, focusing mainly on nitrile gloves. The company acquired a 9.26-acre parcel of land in Dec 2013, which is earmarked for capacity expansion plans. This would boost its total installed production capacity by approximately 5-6bn pieces annually to 27bn pieces (an addition to its ongoing capacity expansion, which would boost the company’s capacity to 22bn pieces by May 2014). Moving forward, we believe that this would bolster and secure Kossan’s production and earnings as it targets for the new lines to be commissioned latest by 1H15.
Expanding TRP segment. Given lower production costs and the favourable operating environment, we understand that Kossan is looking to expand its TRP division in Indonesia – where it plans to begin the construction of its new plants by 1H14. We are optimistic on the company’s planned capacity expansion and the prospects of its TRP segment, which enable it to diversify its clientele base. Note that as of FY13, its TRP segment registered positive sales and PBT growth of 13.9% and 20.3% y-o-y respectively.
Profit & Loss Dec-12 Dec-13 Dec-14F
Total turnover (MYRm) 1,234 1,310 1,731
Reported net profit (MYRm) 102 141 182
Recurring net profit (MYRm) 102 141 182
Recurring net profit growth (%) 13.9 37.6 29.6
Recurring EPS (MYR) 0.16 0.22 0.28
DPS (MYR) 0.09 0.07 0.09
Dividend Yield (%) 2.1 1.5 2.0
Recurring P/E (x) 26.79 19.46 15.02
Return on average equity (%) 18.6 21.4 23.6
P/B (x) 4.53 3.86 3.27
P/CF (x) 29.45 17.44 17.81
Source: Company data, RHB estimates
Balance Sheet (MYRm) Dec-12 Dec-13 Dec-14F
Total current assets 471 500 561
Total assets 990 1,103 1,255
Total current liabilities 284 280 301
Total non-current liabilities 88 97 97
Total liabilities 373 377 398
Shareholders' equity 605 710 837
Minority interests 13 16 20
Other equity (0) - -
Total equity 617 726 857
Total liabilities & equity 990 1,103 1,255
Total debt 199 169 169
Net debt 99 71 123
Source: Company data, RHB estimates
Cash flow (MYRm) Dec-12 Dec-13 Dec-14F
Cash flow from operations 93 157 154
Cash flow from investing activities (80) (135) (139)
Cash flow from financing activities 33 (28) (62)
Cash at beginning of period 52 100 98
Total cash generated 46 (7) (48)
Implied cash at end of period 98 93 50
Source: Company data, RHB estimates
Company Report Card
Latest results. Kossan’s commendable FY13 core earnings of MYR141m came in line with our estimates, mainly attributed to a higher sales volume, stabilising raw material prices as well as better operating efficiency at its plants.
Balance sheet/cash flow. As of FY13, the company’s net gearing stood at 0.11x vs 0.16x in FY12. We believe that its net gearing ratio is still at a comfortable level and should not pose a concern.
ROE. Kossan has been consistently delivering strong ROE growth, which improved to 21.4% in 2013 from 18.6% in 2012. Moving forward, we expect the company to continue delivering double-digit ROEs as we see its capacity expansion gradually kick in in CY14 and CY15. We believe that this is attainable given the nature of the recession-proof rubber glove industry as well as growing demand in both developed and developing countries amid increasing healthcare awareness.
Dividend. The company has been consistently paying dividends since its listing in 1996 and we expect it to continuously reward shareholders with generous dividends, given its sustainable and resilient business model.
Management. Founder, managing director and CEO Dato’ Lim Kuang Sia leads Kossan’s management team and carries with him more than 32 years of experience in the rubber glove industry.
Recommendation
Maintain BUY. Our FV of MYR5.10 for Kossan is based on a P/E of 18x on FY14 earnings. We continue to like the company’s solid fundamentals and strong management team, as well as its: i) robust earnings outlook for the next two years, backed by capacity expansion, ii) balanced product mix, and iii) steady operating environment, given stable raw material prices and a favourable USD.
Top Malaysia Small Cap Companies 2014

43
LBS Bina Group Target: MYR3.39
Price: MYR1.82
Getting The Attention It Deserves
74
91
108
125
143
160
177
0.7
0.9
1.1
1.3
1.5
1.7
1.9
2.1
LBS Bina Group (LBS MK)Price Close Relative to FTSE Bursa Malaysia KLCI Index (RHS)
10
20
30
40
50
Ap
r-13
Jun
-13
Au
g-1
3
Oct-
13
Dec-1
3
Feb
-14
Vol m
Source: Bloomberg
Stock Profile
Bloomberg Ticker LBS MK
Avg Turnover (MYR/USD) 1.01m/0.31m
Net Gearing (%) -9.5
Market Cap (MYRm) 857m
Beta (x) 1.13
BVPS (MYR) 1.86
52-wk Price low/high (MYR) 0.89 - 1.92
Free float (%) 37
Major Shareholders (%)
Gaterich SB 54.7
Share Performance (%)
1m 3m 6m 12m
Absolute 5.8 13.0 (0.6) 75.0
Relative 4.7 11.9 (4.8) 65.3
Kong Heng Siong +603 9207 7666
The Research Team +603 9207 7680
Investment Merits
Sizeable landbank in strategic locations
Disposal of China assets presents more landbank acquisition opportunities
Committed family-led management team
Company Profile
LBS was founded in the 1960s as a small construction outfit in Petaling Jaya, Selangor. In 1992, the group ventured into property development via its maiden project, Jelapang Maju Light Industrial Park in Ipoh, Perak. Today, it is an established and reputable property developer with existing projects in Selangor, Pahang, Johor and Perak. It is currently sitting on 1,787.8 acres of undeveloped landbank with an outstanding GDV of MYR16.8bn.
Highlights
Disposes of China assets. In Aug 2013, LBS Bina Group (LBS) disposed of its 60% interest in two plots of land in Zhuhai, China to Zhuhai International Holdings (908 HK, NR) for a total consideration of HKD1.65bn. However, the group still holds a 60% stake in the 264-acre Zhuhai International Circuit (ZIC), which we believe is worth at least MYR900m, based on LBS’ disposal price. We think this stake could fetch as much as MYR1.26bn following the recent appreciation in land prices, and given that ZIC has a commercial land title. We believe the market may have overlooked the possible cash infusion from the potential sale of this asset, which we expect to materialise soon, since management is keen to expand its presence in Malaysia in the medium to long term. Once the disposal materialises, it will give the group ammunition to expand its domestic landbank.
Domestic operations. LBS’ current total GDV amounts to MYR16.8bn, based on its undeveloped landbank of 1,787.8 acres. Most of the group’s landbank is in Selangor and Johor, at 43% and 26% of total group acreage respectively, with the rest being predominantly in Pahang and Perak. As of 31 Jan 2014, the company’s unbilled sales stood at MYR650m.
New launches in FY14-15. Following the sale of its China asset, the group will concentrate more on its domestic operations. LBS plans to launch new properties worth a total GDV of MYR1.96bn in FY14 and MYR1.87bn in FY15. These will be from its flagship projects D’Island Residence in Puchong and Bandar Saujana Putra, as well as its developments in Batu Pahat, Cameron Highlands, Kuantan and Gohtong Jaya. In view of a relatively less bullish property market outlook, we adopt a conservative stance and project a take-up rate of 45-50% for FY14-15F.
Profit & Loss Dec-13 Dec-14F Dec-15F
Total turnover (MYRm) 534 705 850
Reported net profit (MYRm) 389 77 100
Recurring net profit (MYRm) 75 77 100
Recurring net profit growth (%) 62.9 2.4 29.8
Recurring EPS (MYR) 0.17 0.16 0.21
DPS (MYR) 0.09 0.11 0.12
Dividend Yield (%) 4.9 5.9 6.7
Recurring P/E (x) 10.51 11.36 8.75
Return on average equity (%) 59.2 8.7 10.9
P/B (x) 1.00 0.98 0.93
P/CF (x) na 5.93 4.81
Source: Company data, RHB estimates
Balance Sheet (MYRm) Dec-13 Dec-14F Dec-15F
Total current assets 833 927 1,079
Total assets 2,011 2,035 2,116
Total current liabilities 597 719 828
Total non-current liabilities 542 413 335
Total liabilities 1,139 1,132 1,163
Shareholders' equity 869 894 935
Minority interests 3 9 17
Other equity (0) 0 -
Total equity 872 903 952
Total liabilities & equity 2,011 2,035 2,116
Total debt 378 227 136
Net debt 89 (86) (268)
Source: Company data, RHB estimates
Cash flow (MYRm) Dec-13 Dec-14F Dec-15F
Cash flow from operations (297) 147 181
Cash flow from investing activities 158 100 100
Cash flow from financing activities 47 (223) (189)
Cash at beginning of period 69 289 312
Total cash generated (92) 24 92
Forex effects (29) - -
Implied cash at end of period (52) 312 404
Source: Company data, RHB estimates
Company Report Card
Latest results. LBS’ FY13 revenue rose 4.7% to MYR533.5m vs FY12 on the back of contributions from its ongoing projects in the Klang Valley and Cameron Highlands. Core earnings surged 38% to MYR51.3m in FY13 from MYR31.2m in FY12 as the group registered higher net margins from its property launches.
Balance sheet / cash flow. As of Dec 2013, LBS’ net gearing stood at 0.10x, improving from 0.62x in FY12 following the disposal of its assets in China. Factoring in the promissory notes, of which MYR103.2m will be due by end-FY14, and the remaining MYR247.7m spread equally over three years from FY15 to FY17, we expect the group to revert to a net cash position by end-FY14.
ROE. We expect LBS to deliver an ROE of 8.7% as the group launches new development projects on top of the ongoing ones.
Dividend. LBS has committed to distributing an annual DPS of 6.0 sen upon receiving the outstanding proceeds of around MYR351.0m. This will translate into 73.1 sen per share based on LBS’ 480.3m outstanding shares. On top of that, management is also committed to a minimum 30% payout ratio. Based on our projections, this will translate into a total DPS of 10.8-13.4 sen per share over the next three years, implying a decent annual dividend yield of 6.4-7.9%.
Management. LBS was founded by Dato’ Seri Lim Bock Seng in the 1960s. The senior management team is now led by his sons: group managing director Dato’ Seri Lim Hock San, together with executive directors Datuk Lim Hock Guan, Dato’ Seri Lim Hock Sing, Datuk Lim Hock Seong and Ms Lim Mooi Pang.
Recommendation
We value the company based on SOP, being: i) a 45% discount on the equity value of its Malaysian property development division, ii) its 16.7% stake in Zhuhai Holdings based on the current market value, and iii) an estimated value for its 60.0% stake in ZIC based on the previous disposal price. All in, we value LBS at a FV of MYR3.39.
Top Malaysia Small Cap Companies 2014

44
LBS Bina Group Target: MYR3.39
Price: MYR1.82
Getting The Attention It Deserves
74
91
108
125
143
160
177
0.7
0.9
1.1
1.3
1.5
1.7
1.9
2.1
LBS Bina Group (LBS MK)Price Close Relative to FTSE Bursa Malaysia KLCI Index (RHS)
10
20
30
40
50
Ap
r-13
Jun
-13
Au
g-1
3
Oct-
13
Dec-1
3
Feb
-14
Vol m
Source: Bloomberg
Stock Profile
Bloomberg Ticker LBS MK
Avg Turnover (MYR/USD) 1.01m/0.31m
Net Gearing (%) -9.5
Market Cap (MYRm) 857m
Beta (x) 1.13
BVPS (MYR) 1.86
52-wk Price low/high (MYR) 0.89 - 1.92
Free float (%) 37
Major Shareholders (%)
Gaterich SB 54.7
Share Performance (%)
1m 3m 6m 12m
Absolute 5.8 13.0 (0.6) 75.0
Relative 4.7 11.9 (4.8) 65.3
Kong Heng Siong +603 9207 7666
The Research Team +603 9207 7680
Investment Merits
Sizeable landbank in strategic locations
Disposal of China assets presents more landbank acquisition opportunities
Committed family-led management team
Company Profile
LBS was founded in the 1960s as a small construction outfit in Petaling Jaya, Selangor. In 1992, the group ventured into property development via its maiden project, Jelapang Maju Light Industrial Park in Ipoh, Perak. Today, it is an established and reputable property developer with existing projects in Selangor, Pahang, Johor and Perak. It is currently sitting on 1,787.8 acres of undeveloped landbank with an outstanding GDV of MYR16.8bn.
Highlights
Disposes of China assets. In Aug 2013, LBS Bina Group (LBS) disposed of its 60% interest in two plots of land in Zhuhai, China to Zhuhai International Holdings (908 HK, NR) for a total consideration of HKD1.65bn. However, the group still holds a 60% stake in the 264-acre Zhuhai International Circuit (ZIC), which we believe is worth at least MYR900m, based on LBS’ disposal price. We think this stake could fetch as much as MYR1.26bn following the recent appreciation in land prices, and given that ZIC has a commercial land title. We believe the market may have overlooked the possible cash infusion from the potential sale of this asset, which we expect to materialise soon, since management is keen to expand its presence in Malaysia in the medium to long term. Once the disposal materialises, it will give the group ammunition to expand its domestic landbank.
Domestic operations. LBS’ current total GDV amounts to MYR16.8bn, based on its undeveloped landbank of 1,787.8 acres. Most of the group’s landbank is in Selangor and Johor, at 43% and 26% of total group acreage respectively, with the rest being predominantly in Pahang and Perak. As of 31 Jan 2014, the company’s unbilled sales stood at MYR650m.
New launches in FY14-15. Following the sale of its China asset, the group will concentrate more on its domestic operations. LBS plans to launch new properties worth a total GDV of MYR1.96bn in FY14 and MYR1.87bn in FY15. These will be from its flagship projects D’Island Residence in Puchong and Bandar Saujana Putra, as well as its developments in Batu Pahat, Cameron Highlands, Kuantan and Gohtong Jaya. In view of a relatively less bullish property market outlook, we adopt a conservative stance and project a take-up rate of 45-50% for FY14-15F.
Profit & Loss Dec-13 Dec-14F Dec-15F
Total turnover (MYRm) 534 705 850
Reported net profit (MYRm) 389 77 100
Recurring net profit (MYRm) 75 77 100
Recurring net profit growth (%) 62.9 2.4 29.8
Recurring EPS (MYR) 0.17 0.16 0.21
DPS (MYR) 0.09 0.11 0.12
Dividend Yield (%) 4.9 5.9 6.7
Recurring P/E (x) 10.51 11.36 8.75
Return on average equity (%) 59.2 8.7 10.9
P/B (x) 1.00 0.98 0.93
P/CF (x) na 5.93 4.81
Source: Company data, RHB estimates
Balance Sheet (MYRm) Dec-13 Dec-14F Dec-15F
Total current assets 833 927 1,079
Total assets 2,011 2,035 2,116
Total current liabilities 597 719 828
Total non-current liabilities 542 413 335
Total liabilities 1,139 1,132 1,163
Shareholders' equity 869 894 935
Minority interests 3 9 17
Other equity (0) 0 -
Total equity 872 903 952
Total liabilities & equity 2,011 2,035 2,116
Total debt 378 227 136
Net debt 89 (86) (268)
Source: Company data, RHB estimates
Cash flow (MYRm) Dec-13 Dec-14F Dec-15F
Cash flow from operations (297) 147 181
Cash flow from investing activities 158 100 100
Cash flow from financing activities 47 (223) (189)
Cash at beginning of period 69 289 312
Total cash generated (92) 24 92
Forex effects (29) - -
Implied cash at end of period (52) 312 404
Source: Company data, RHB estimates
Company Report Card
Latest results. LBS’ FY13 revenue rose 4.7% to MYR533.5m vs FY12 on the back of contributions from its ongoing projects in the Klang Valley and Cameron Highlands. Core earnings surged 38% to MYR51.3m in FY13 from MYR31.2m in FY12 as the group registered higher net margins from its property launches.
Balance sheet / cash flow. As of Dec 2013, LBS’ net gearing stood at 0.10x, improving from 0.62x in FY12 following the disposal of its assets in China. Factoring in the promissory notes, of which MYR103.2m will be due by end-FY14, and the remaining MYR247.7m spread equally over three years from FY15 to FY17, we expect the group to revert to a net cash position by end-FY14.
ROE. We expect LBS to deliver an ROE of 8.7% as the group launches new development projects on top of the ongoing ones.
Dividend. LBS has committed to distributing an annual DPS of 6.0 sen upon receiving the outstanding proceeds of around MYR351.0m. This will translate into 73.1 sen per share based on LBS’ 480.3m outstanding shares. On top of that, management is also committed to a minimum 30% payout ratio. Based on our projections, this will translate into a total DPS of 10.8-13.4 sen per share over the next three years, implying a decent annual dividend yield of 6.4-7.9%.
Management. LBS was founded by Dato’ Seri Lim Bock Seng in the 1960s. The senior management team is now led by his sons: group managing director Dato’ Seri Lim Hock San, together with executive directors Datuk Lim Hock Guan, Dato’ Seri Lim Hock Sing, Datuk Lim Hock Seong and Ms Lim Mooi Pang.
Recommendation
We value the company based on SOP, being: i) a 45% discount on the equity value of its Malaysian property development division, ii) its 16.7% stake in Zhuhai Holdings based on the current market value, and iii) an estimated value for its 60.0% stake in ZIC based on the previous disposal price. All in, we value LBS at a FV of MYR3.39.
Top Malaysia Small Cap Companies 2014
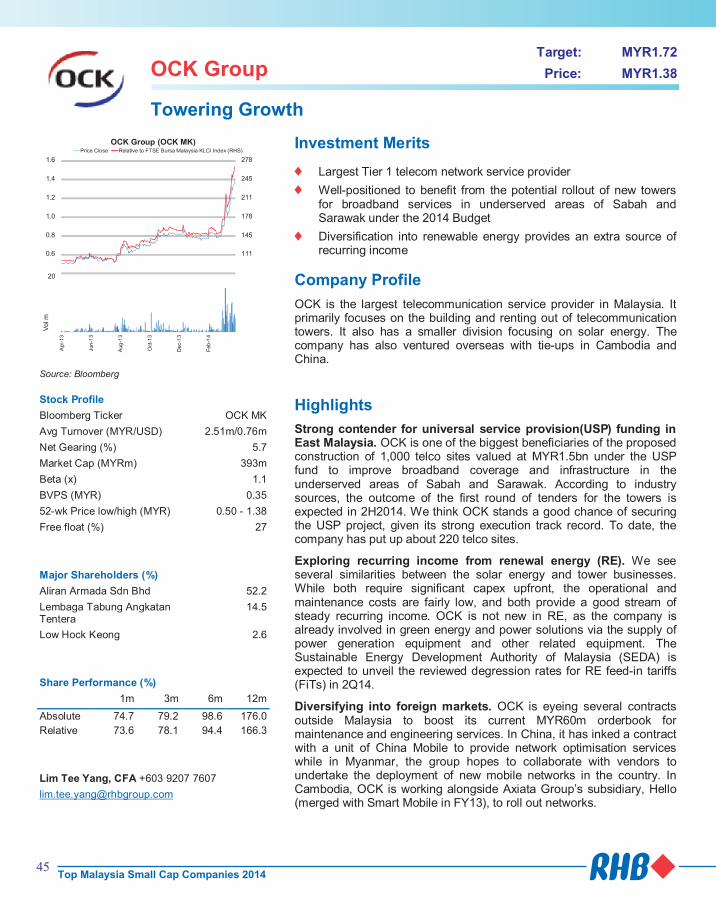
45
OCK Group Target: MYR1.72
Price: MYR1.38
Towering Growth
78
111
145
178
211
245
278
0.4
0.6
0.8
1.0
1.2
1.4
1.6
OCK Group (OCK MK)Price Close Relative to FTSE Bursa Malaysia KLCI Index (RHS)
5
10
15
20
Apr-
13
Jun
-13
Aug
-13
Oct
-13
Dec-1
3
Feb
-14
Vo
l m
Source: Bloomberg
Stock Profile
Bloomberg Ticker OCK MK
Avg Turnover (MYR/USD) 2.51m/0.76m
Net Gearing (%) 5.7
Market Cap (MYRm) 393m
Beta (x) 1.1
BVPS (MYR) 0.35
52-wk Price low/high (MYR) 0.50 - 1.38
Free float (%) 27
Major Shareholders (%)
Aliran Armada Sdn Bhd 52.2
Lembaga Tabung Angkatan Tentera
14.5
Low Hock Keong 2.6
Share Performance (%)
1m 3m 6m 12m
Absolute 74.7 79.2 98.6 176.0
Relative 73.6 78.1 94.4 166.3
Lim Tee Yang, CFA +603 9207 7607
Investment Merits
Largest Tier 1 telecom network service provider
Well-positioned to benefit from the potential rollout of new towers for broadband services in underserved areas of Sabah and Sarawak under the 2014 Budget
Diversification into renewable energy provides an extra source of recurring income
Company Profile
OCK is the largest telecommunication service provider in Malaysia. It primarily focuses on the building and renting out of telecommunication towers. It also has a smaller division focusing on solar energy. The company has also ventured overseas with tie-ups in Cambodia and China.
Highlights
Strong contender for universal service provision(USP) funding in East Malaysia. OCK is one of the biggest beneficiaries of the proposed construction of 1,000 telco sites valued at MYR1.5bn under the USP fund to improve broadband coverage and infrastructure in the underserved areas of Sabah and Sarawak. According to industry sources, the outcome of the first round of tenders for the towers is expected in 2H2014. We think OCK stands a good chance of securing the USP project, given its strong execution track record. To date, the company has put up about 220 telco sites.
Exploring recurring income from renewal energy (RE). We see several similarities between the solar energy and tower businesses. While both require significant capex upfront, the operational and maintenance costs are fairly low, and both provide a good stream of steady recurring income. OCK is not new in RE, as the company is already involved in green energy and power solutions via the supply of power generation equipment and other related equipment. The Sustainable Energy Development Authority of Malaysia (SEDA) is expected to unveil the reviewed degression rates for RE feed-in tariffs (FiTs) in 2Q14.
Diversifying into foreign markets. OCK is eyeing several contracts outside Malaysia to boost its current MYR60m orderbook for maintenance and engineering services. In China, it has inked a contract with a unit of China Mobile to provide network optimisation services while in Myanmar, the group hopes to collaborate with vendors to undertake the deployment of new mobile networks in the country. In Cambodia, OCK is working alongside Axiata Group’s subsidiary, Hello (merged with Smart Mobile in FY13), to roll out networks.
Profit & Loss Dec-13 Dec-14F Dec-15F
Total turnover (MYRm) 150 162 350
Reported net profit (MYRm) 13 16 33
Recurring net profit (MYRm) 13 16 33
Recurring net profit growth (%) (1.9) 24.9 102.9
Recurring EPS (MYR) 0.05 0.06 0.11
Recurring P/E (x) 29.09 24.40 12.02
Return on average equity (%) 19.1 17.9 27.9
P/B (x) 4.97 3.90 2.94
P/CF (x) 23.50 17.83 na
Source: Company data, RHB estimates
Balance Sheet (MYRm) Dec-13 Dec-14F Dec-15F
Total current assets 115 108 169
Total assets 181 178 244
Total current liabilities 81 55 88
Total non-current liabilities 18 17 16
Total liabilities 98 72 104
Shareholders' equity 79 101 134
Minority interests 4 5 7
Total equity 83 106 140
Total liabilities & equity 181 178 244
Total debt 59 41 40
Net debt 42 6 28
Source: Company data, RHB estimates
Cash flow (MYRm) Dec-13 Dec-14F Dec-15F
Cash flow from operations 16 22 (17)
Cash flow from investing activities (33) (8) (10)
Cash flow from financing activities 21 1 (1)
Cash at beginning of period 11 17 35
Total cash generated 4 15 (28)
Forex effects (1) (1)
Implied cash at end of period 15 31 7
Source: Company data,RHB estimates
Company Report Card
Latest results. OCK’s FY13 revenue rose 8.5% mainly on the back of a more than doubling of contributions from its RE business. However, its core business of telecom network services, contributing 57% of total revenue, saw topline contract 13% due to slower roll out by the telcos. We expect revenue from this segment to accelerate in FY14/15 as the telcos focus on expanding their 4G/LTE coverage.
Balance sheet/cash flow. OCK’s net debt/equity of 0.2x as at 4Q13 suggests that there is room for more gearing to expand its business or undertake a M&A exercise, supported by a cash balance of MYR16.8m. The company completed a MYR150m sukuk facility in May 2013, with only MYR5m drawn down so far.
ROE. ROE stood at 15.5% in FY13. While this is down from FY12’s 22.8%, the company undertook a share placement exercise in FY13 which contributed to the 42.9% increase in shareholder equity. We expect OCK’s ROE to remain stable or improve further, supported by robust earnings growth.
Dividend. As OCK needs to reinvest for growth, the company does not currently distribute dividends.
Management. Sam Ooi Chin Khoon, its managing director, is the largest shareholder of OCK and responsible for the growth, development and strategic direction of the group. He controls OCK via Aliran Armada SB, which has a direct 53% stake. Lembaga Tabung Angkatan Tentera (LTAT) is the second largest shareholder of the company with a 15% stake.
Recommendation
Our valuation is MYR1.72, based on 15x FY15 EPS of 11.5 sen, at a 25% discount to the large cap telecom sector average of 20x due to the company’s significantly smaller scale of operations.
Top Malaysia Small Cap Companies 2014
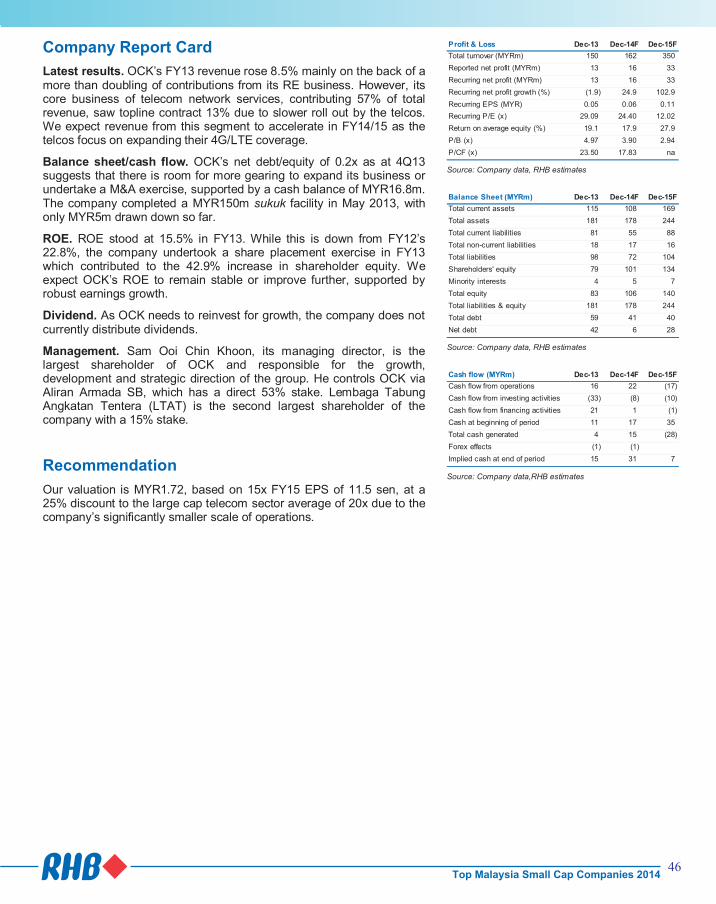
46
OCK Group Target: MYR1.72
Price: MYR1.38
Towering Growth
78
111
145
178
211
245
278
0.4
0.6
0.8
1.0
1.2
1.4
1.6
OCK Group (OCK MK)Price Close Relative to FTSE Bursa Malaysia KLCI Index (RHS)
5
10
15
20
Apr-
13
Jun
-13
Aug
-13
Oct
-13
Dec-1
3
Feb
-14
Vo
l m
Source: Bloomberg
Stock Profile
Bloomberg Ticker OCK MK
Avg Turnover (MYR/USD) 2.51m/0.76m
Net Gearing (%) 5.7
Market Cap (MYRm) 393m
Beta (x) 1.1
BVPS (MYR) 0.35
52-wk Price low/high (MYR) 0.50 - 1.38
Free float (%) 27
Major Shareholders (%)
Aliran Armada Sdn Bhd 52.2
Lembaga Tabung Angkatan Tentera
14.5
Low Hock Keong 2.6
Share Performance (%)
1m 3m 6m 12m
Absolute 74.7 79.2 98.6 176.0
Relative 73.6 78.1 94.4 166.3
Lim Tee Yang, CFA +603 9207 7607
Investment Merits
Largest Tier 1 telecom network service provider
Well-positioned to benefit from the potential rollout of new towers for broadband services in underserved areas of Sabah and Sarawak under the 2014 Budget
Diversification into renewable energy provides an extra source of recurring income
Company Profile
OCK is the largest telecommunication service provider in Malaysia. It primarily focuses on the building and renting out of telecommunication towers. It also has a smaller division focusing on solar energy. The company has also ventured overseas with tie-ups in Cambodia and China.
Highlights
Strong contender for universal service provision(USP) funding in East Malaysia. OCK is one of the biggest beneficiaries of the proposed construction of 1,000 telco sites valued at MYR1.5bn under the USP fund to improve broadband coverage and infrastructure in the underserved areas of Sabah and Sarawak. According to industry sources, the outcome of the first round of tenders for the towers is expected in 2H2014. We think OCK stands a good chance of securing the USP project, given its strong execution track record. To date, the company has put up about 220 telco sites.
Exploring recurring income from renewal energy (RE). We see several similarities between the solar energy and tower businesses. While both require significant capex upfront, the operational and maintenance costs are fairly low, and both provide a good stream of steady recurring income. OCK is not new in RE, as the company is already involved in green energy and power solutions via the supply of power generation equipment and other related equipment. The Sustainable Energy Development Authority of Malaysia (SEDA) is expected to unveil the reviewed degression rates for RE feed-in tariffs (FiTs) in 2Q14.
Diversifying into foreign markets. OCK is eyeing several contracts outside Malaysia to boost its current MYR60m orderbook for maintenance and engineering services. In China, it has inked a contract with a unit of China Mobile to provide network optimisation services while in Myanmar, the group hopes to collaborate with vendors to undertake the deployment of new mobile networks in the country. In Cambodia, OCK is working alongside Axiata Group’s subsidiary, Hello (merged with Smart Mobile in FY13), to roll out networks.
Profit & Loss Dec-13 Dec-14F Dec-15F
Total turnover (MYRm) 150 162 350
Reported net profit (MYRm) 13 16 33
Recurring net profit (MYRm) 13 16 33
Recurring net profit growth (%) (1.9) 24.9 102.9
Recurring EPS (MYR) 0.05 0.06 0.11
Recurring P/E (x) 29.09 24.40 12.02
Return on average equity (%) 19.1 17.9 27.9
P/B (x) 4.97 3.90 2.94
P/CF (x) 23.50 17.83 na
Source: Company data, RHB estimates
Balance Sheet (MYRm) Dec-13 Dec-14F Dec-15F
Total current assets 115 108 169
Total assets 181 178 244
Total current liabilities 81 55 88
Total non-current liabilities 18 17 16
Total liabilities 98 72 104
Shareholders' equity 79 101 134
Minority interests 4 5 7
Total equity 83 106 140
Total liabilities & equity 181 178 244
Total debt 59 41 40
Net debt 42 6 28
Source: Company data, RHB estimates
Cash flow (MYRm) Dec-13 Dec-14F Dec-15F
Cash flow from operations 16 22 (17)
Cash flow from investing activities (33) (8) (10)
Cash flow from financing activities 21 1 (1)
Cash at beginning of period 11 17 35
Total cash generated 4 15 (28)
Forex effects (1) (1)
Implied cash at end of period 15 31 7
Source: Company data,RHB estimates
Company Report Card
Latest results. OCK’s FY13 revenue rose 8.5% mainly on the back of a more than doubling of contributions from its RE business. However, its core business of telecom network services, contributing 57% of total revenue, saw topline contract 13% due to slower roll out by the telcos. We expect revenue from this segment to accelerate in FY14/15 as the telcos focus on expanding their 4G/LTE coverage.
Balance sheet/cash flow. OCK’s net debt/equity of 0.2x as at 4Q13 suggests that there is room for more gearing to expand its business or undertake a M&A exercise, supported by a cash balance of MYR16.8m. The company completed a MYR150m sukuk facility in May 2013, with only MYR5m drawn down so far.
ROE. ROE stood at 15.5% in FY13. While this is down from FY12’s 22.8%, the company undertook a share placement exercise in FY13 which contributed to the 42.9% increase in shareholder equity. We expect OCK’s ROE to remain stable or improve further, supported by robust earnings growth.
Dividend. As OCK needs to reinvest for growth, the company does not currently distribute dividends.
Management. Sam Ooi Chin Khoon, its managing director, is the largest shareholder of OCK and responsible for the growth, development and strategic direction of the group. He controls OCK via Aliran Armada SB, which has a direct 53% stake. Lembaga Tabung Angkatan Tentera (LTAT) is the second largest shareholder of the company with a 15% stake.
Recommendation
Our valuation is MYR1.72, based on 15x FY15 EPS of 11.5 sen, at a 25% discount to the large cap telecom sector average of 20x due to the company’s significantly smaller scale of operations.
Top Malaysia Small Cap Companies 2014

Pantech Target: MYR1.25
Price: MYR0.95
A Bright Star
89
99
109
119
129
139
149
0.60
0.70
0.80
0.90
1.00
1.10
1.20
Pantech (PGHB MK)Price Close Relative to FTSE Bursa Malaysia KLCI Index (RHS)
5101520253035
Apr-
13
Jun
-13
Aug
-13
Oct
-13
Dec-1
3
Feb
-14
Vol m
Source: Bloomberg
Stock Profile
Bloomberg Ticker PGHB MK
Avg Turnover (MYR/USD) 1.06m/0.32m
Net Gearing (%) 10.3
Market Cap (MYRm) 539m
Beta (x) 1.25
BVPS (MYR) 0.73
52-wk Price low/high (MYR) 0.74 - 1.13
Free float (%) 34
Major Shareholders (%)
CTL Capital Holding 20.0
GL Management Agency SB 14.9
Koperasi Permodalan Felda 10.2
Share Performance (%)
1m 3m 6m 12m
Absolute 3.8 (6.9) 0.0 22.6
Relative 2.7 (8.0) (4.2) 12.9
Jerry Lee 603 9207 7622
Investment Merits
Strong growth potential with exposure to the booming O&G sector
Solid foundation and established business relationships with globally-renowned oil majors
Oil majors continuing to spend on capex amid favourable oil prices
Company Profile
Pantech is primarily involved in the manufacturing and trading of pipes, fittings and flow controls. It also manufactures carbon steel fittings, stainless pipes and fittings, induction long bends and copper nickel fittings.
Highlights
Solid foundation. Pantech has established itself as the industry’s one-stop provider of pipes, fittings and flanges. Its products cater to industries dealing with flowing liquid or gas, including the oil and gas (O&G), chemicals, and palm oil sectors. The group is currently focusing on expanding its clientele in the O&G sector, as it believes the sector has strong growth potential, both locally and abroad.
Nautic Steels a successful investment. Pantech started to see significant growth in FY13 following its acquisition of UK-based Nautic Steels (Holdings) Ltd (Nautic Steels). This subsidiary manufactures exotic products such as copper nickel, duplex and super duplex fittings. Furthermore, with Nautic Steels on board, its business network now has access to most of the global oil majors, which should facilitate Pantech’s cross-selling efforts.
Local O&G sector looks bright. Petronas’ 2011-2016 capex budget of MYR300bn is expected to boost the local O&G sector. The high capex should lead to rising demand for Pantech’s products, which should support local sales growth. Petronas has recently given the green light to its much-awaited final investment decision (FID) for the Pengerang integrated complex (PIC) in South Johor with a commitment of USD27bn (RM88.56bn), although the project will start a year later than expected in 2019. The FID marks a significant milestone for PIC, of which the refinery and petrochemical integrated development (RAPID) is a key component. This is positive for Pantech, as its FY14F earnings were largely affected by the slow execution of local O&G projects. Given Petronas’ new commitment, we believe the group’s trading division revenue will improve significantly in FY15F – which we expect to be a good year.
Profit & Loss Feb-12 Feb-13 Feb-14F
Total turnover (MYRm) 435 637 580
Reported net profit (MYRm) 34 55 55
Recurring net profit (MYRm) 34 55 55
Recurring net profit growth (%) 18.1 60.7 0.3
Recurring EPS (MYR) 0.08 0.11 0.10
DPS (MYR) 0.04 0.04 0.04
Dividend Yield (%) 3.7 4.4 4.0
Recurring P/E (x) 12.56 8.78 9.90
Return on average equity (%) 10.5 15.4 13.9
P/B (x) 1.28 1.28 1.31
P/CF (x) 29.34 12.60 8.33
Source: Company data, RHB estimates
Balance Sheet (MYRm) Feb-12 Feb-13 Feb-14F
Total current assets 431 487 513
Total assets 597 696 732
Total current liabilities 188 232 231
Total non-current liabilities 72 87 84
Total liabilities 259 319 315
Shareholders' equity 337 377 417
Minority interests 0 0 0
Other equity 0 0 0
Total equity 337 377 417
Total liabilities & equity 597 696 732
Total debt 98 138 142
Net debt (4) 58 43
Source: Company data, RHB estimates
Cash flow (MYRm) Feb-12 Feb-13 Feb-14F
Cash flow from operations 15 38 66
Cash flow from investing activities (34) (84) (54)
Cash flow from financing activities (17) 23 5
Cash at beginning of period 138 102 79
Total cash generated (36) (23) 17
Forex effects (0) (0) -
Implied cash at end of period 102 79 96
Source: Company data, RHB estimates
More upside potential. Our earnings forecasts are very conservative, as we have yet to include any possible upside from the RAPID project. Assuming normal organic growth in the manufacturing division, our base case scenario estimates low trading revenue of MYR329m due to slow execution of local O&G projects. However, should the RAPID project bring benefits to Pantech’s trading division and boost its trading revenue to FY13’s level of about MYR380m, we expect the group’s FY15F net profit to reach MYR66.9m. Earnings will be even stronger should its manufacturing division grow faster and fetch higher margins. Hence, we are positive that Pantech will be able to chalk up stronger results in FY15F.
Company Report Card
Latest results. Pantech’s 9MFY14 net profit of MYR41.2m (-2.9% y-o-y) came in below our forecast. Revenue from the trading division declined 21% y-o-y, mainly attributed to higher operating costs and weaker sales from the O&G segment that was hit by slower project execution. This translated into a 48% y-o-y decline in pre-tax profit. On a positive note, its manufacturing division continued to improve with a 15% y-o-y revenue growth, driven by an increase in output from all its manufacturing plants to meet rising local and export sales demand. The manufacturing division’s pre-tax profit surged 87% y-o-y on higher niche product sales. Pantech declared a dividend of 1.0 sen in 3QFY14 (cumulative 9MFY14 dividend: 3.4 sen).
Balance sheet/cash flow. Its gearing of 10.3% is not a concern as its borrowings mainly comprise short-term debts to facilitate its trading activities. Long-term borrowings are minimal and its free cash flow remains positive.
ROE. We expect Pantech to deliver a 13.8% ROE in FY15F.
Dividend. The group has been very generous in paying good dividends to its shareholders. For the past three financial years, the payout ratio has been greater than 40%. Our assumptions are based on a conservative 30% dividend payout in FY15F.
Management. Pantech is led by an experienced management team comprising chairman/group MD Dato’ Jimmy Chew, who has more than 30 years of experience in the PFF industry; deputy MD Dato’ Goh Teoh Kean, who has 20 years’ experience in PFF solutions; and executive director Arian Tan, who is also the MD of subsidiary, Pantech Steel Industries SB. Collectively, the trio is a formidable driving force behind Pantech’s success.
Recommendation
Reiterate BUY. We remain bullish on Pantech’s solid foundation and attractive growth potential. We think that the stock rightly justifies our 12x target P/E as its O&G customers are global majors such as Petronas, Petrobras and Saudi Aramco. Note that almost 70-80% of its earnings come from the O&G sector and, as such, the stock provides a cheap exposure to the O&G play. We reiterate our BUY call and MYR1.25 FV.
47Top Malaysia Small Cap Companies 2014
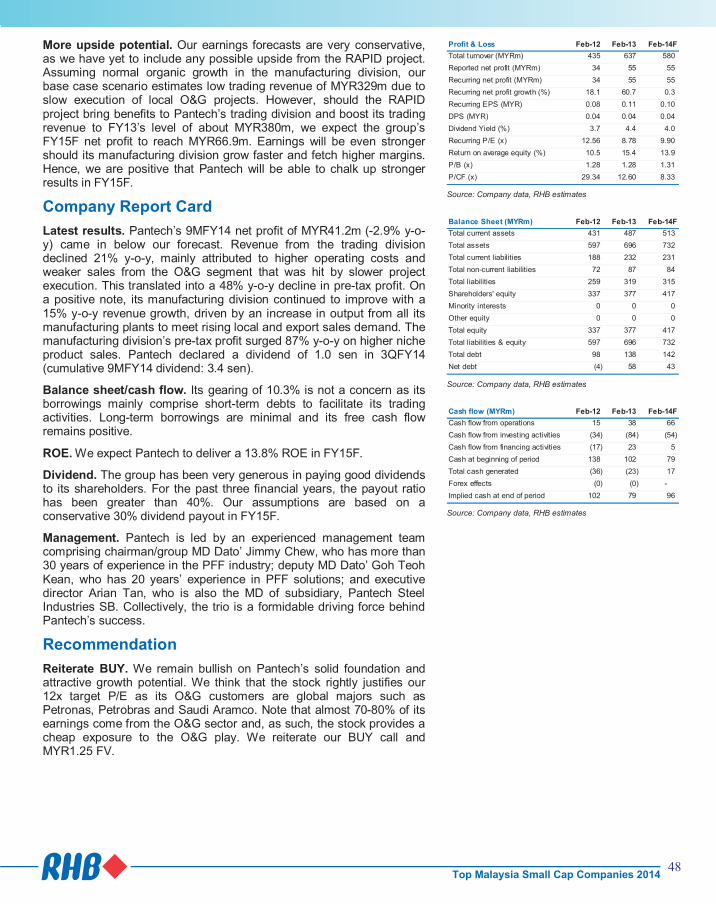
Pantech Target: MYR1.25
Price: MYR0.95
A Bright Star
89
99
109
119
129
139
149
0.60
0.70
0.80
0.90
1.00
1.10
1.20
Pantech (PGHB MK)Price Close Relative to FTSE Bursa Malaysia KLCI Index (RHS)
5101520253035
Apr-
13
Jun
-13
Aug
-13
Oct
-13
Dec-1
3
Feb
-14
Vol m
Source: Bloomberg
Stock Profile
Bloomberg Ticker PGHB MK
Avg Turnover (MYR/USD) 1.06m/0.32m
Net Gearing (%) 10.3
Market Cap (MYRm) 539m
Beta (x) 1.25
BVPS (MYR) 0.73
52-wk Price low/high (MYR) 0.74 - 1.13
Free float (%) 34
Major Shareholders (%)
CTL Capital Holding 20.0
GL Management Agency SB 14.9
Koperasi Permodalan Felda 10.2
Share Performance (%)
1m 3m 6m 12m
Absolute 3.8 (6.9) 0.0 22.6
Relative 2.7 (8.0) (4.2) 12.9
Jerry Lee 603 9207 7622
Investment Merits
Strong growth potential with exposure to the booming O&G sector
Solid foundation and established business relationships with globally-renowned oil majors
Oil majors continuing to spend on capex amid favourable oil prices
Company Profile
Pantech is primarily involved in the manufacturing and trading of pipes, fittings and flow controls. It also manufactures carbon steel fittings, stainless pipes and fittings, induction long bends and copper nickel fittings.
Highlights
Solid foundation. Pantech has established itself as the industry’s one-stop provider of pipes, fittings and flanges. Its products cater to industries dealing with flowing liquid or gas, including the oil and gas (O&G), chemicals, and palm oil sectors. The group is currently focusing on expanding its clientele in the O&G sector, as it believes the sector has strong growth potential, both locally and abroad.
Nautic Steels a successful investment. Pantech started to see significant growth in FY13 following its acquisition of UK-based Nautic Steels (Holdings) Ltd (Nautic Steels). This subsidiary manufactures exotic products such as copper nickel, duplex and super duplex fittings. Furthermore, with Nautic Steels on board, its business network now has access to most of the global oil majors, which should facilitate Pantech’s cross-selling efforts.
Local O&G sector looks bright. Petronas’ 2011-2016 capex budget of MYR300bn is expected to boost the local O&G sector. The high capex should lead to rising demand for Pantech’s products, which should support local sales growth. Petronas has recently given the green light to its much-awaited final investment decision (FID) for the Pengerang integrated complex (PIC) in South Johor with a commitment of USD27bn (RM88.56bn), although the project will start a year later than expected in 2019. The FID marks a significant milestone for PIC, of which the refinery and petrochemical integrated development (RAPID) is a key component. This is positive for Pantech, as its FY14F earnings were largely affected by the slow execution of local O&G projects. Given Petronas’ new commitment, we believe the group’s trading division revenue will improve significantly in FY15F – which we expect to be a good year.
Profit & Loss Feb-12 Feb-13 Feb-14F
Total turnover (MYRm) 435 637 580
Reported net profit (MYRm) 34 55 55
Recurring net profit (MYRm) 34 55 55
Recurring net profit growth (%) 18.1 60.7 0.3
Recurring EPS (MYR) 0.08 0.11 0.10
DPS (MYR) 0.04 0.04 0.04
Dividend Yield (%) 3.7 4.4 4.0
Recurring P/E (x) 12.56 8.78 9.90
Return on average equity (%) 10.5 15.4 13.9
P/B (x) 1.28 1.28 1.31
P/CF (x) 29.34 12.60 8.33
Source: Company data, RHB estimates
Balance Sheet (MYRm) Feb-12 Feb-13 Feb-14F
Total current assets 431 487 513
Total assets 597 696 732
Total current liabilities 188 232 231
Total non-current liabilities 72 87 84
Total liabilities 259 319 315
Shareholders' equity 337 377 417
Minority interests 0 0 0
Other equity 0 0 0
Total equity 337 377 417
Total liabilities & equity 597 696 732
Total debt 98 138 142
Net debt (4) 58 43
Source: Company data, RHB estimates
Cash flow (MYRm) Feb-12 Feb-13 Feb-14F
Cash flow from operations 15 38 66
Cash flow from investing activities (34) (84) (54)
Cash flow from financing activities (17) 23 5
Cash at beginning of period 138 102 79
Total cash generated (36) (23) 17
Forex effects (0) (0) -
Implied cash at end of period 102 79 96
Source: Company data, RHB estimates
More upside potential. Our earnings forecasts are very conservative, as we have yet to include any possible upside from the RAPID project. Assuming normal organic growth in the manufacturing division, our base case scenario estimates low trading revenue of MYR329m due to slow execution of local O&G projects. However, should the RAPID project bring benefits to Pantech’s trading division and boost its trading revenue to FY13’s level of about MYR380m, we expect the group’s FY15F net profit to reach MYR66.9m. Earnings will be even stronger should its manufacturing division grow faster and fetch higher margins. Hence, we are positive that Pantech will be able to chalk up stronger results in FY15F.
Company Report Card
Latest results. Pantech’s 9MFY14 net profit of MYR41.2m (-2.9% y-o-y) came in below our forecast. Revenue from the trading division declined 21% y-o-y, mainly attributed to higher operating costs and weaker sales from the O&G segment that was hit by slower project execution. This translated into a 48% y-o-y decline in pre-tax profit. On a positive note, its manufacturing division continued to improve with a 15% y-o-y revenue growth, driven by an increase in output from all its manufacturing plants to meet rising local and export sales demand. The manufacturing division’s pre-tax profit surged 87% y-o-y on higher niche product sales. Pantech declared a dividend of 1.0 sen in 3QFY14 (cumulative 9MFY14 dividend: 3.4 sen).
Balance sheet/cash flow. Its gearing of 10.3% is not a concern as its borrowings mainly comprise short-term debts to facilitate its trading activities. Long-term borrowings are minimal and its free cash flow remains positive.
ROE. We expect Pantech to deliver a 13.8% ROE in FY15F.
Dividend. The group has been very generous in paying good dividends to its shareholders. For the past three financial years, the payout ratio has been greater than 40%. Our assumptions are based on a conservative 30% dividend payout in FY15F.
Management. Pantech is led by an experienced management team comprising chairman/group MD Dato’ Jimmy Chew, who has more than 30 years of experience in the PFF industry; deputy MD Dato’ Goh Teoh Kean, who has 20 years’ experience in PFF solutions; and executive director Arian Tan, who is also the MD of subsidiary, Pantech Steel Industries SB. Collectively, the trio is a formidable driving force behind Pantech’s success.
Recommendation
Reiterate BUY. We remain bullish on Pantech’s solid foundation and attractive growth potential. We think that the stock rightly justifies our 12x target P/E as its O&G customers are global majors such as Petronas, Petrobras and Saudi Aramco. Note that almost 70-80% of its earnings come from the O&G sector and, as such, the stock provides a cheap exposure to the O&G play. We reiterate our BUY call and MYR1.25 FV.
48Top Malaysia Small Cap Companies 2014
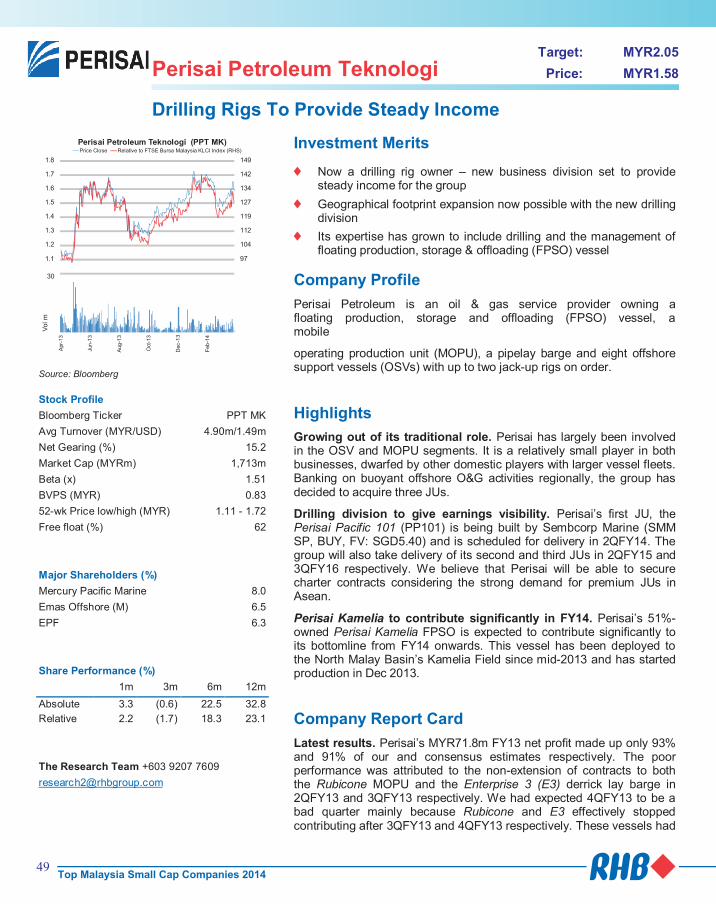
Perisai Petroleum Teknologi Target: MYR2.05
Price: MYR1.58
Drilling Rigs To Provide Steady Income
89
97
104
112
119
127
134
142
149
1.0
1.1
1.2
1.3
1.4
1.5
1.6
1.7
1.8
Perisai Petroleum Teknologi (PPT MK)Price Close Relative to FTSE Bursa Malaysia KLCI Index (RHS)
5
10
15
20
25
30
Apr-
13
Jun
-13
Aug
-13
Oct
-13
Dec-1
3
Feb
-14
Vol m
Source: Bloomberg
Stock Profile
Bloomberg Ticker PPT MK
Avg Turnover (MYR/USD) 4.90m/1.49m
Net Gearing (%) 15.2
Market Cap (MYRm) 1,713m
Beta (x) 1.51
BVPS (MYR) 0.83
52-wk Price low/high (MYR) 1.11 - 1.72
Free float (%) 62
Major Shareholders (%)
Mercury Pacific Marine 8.0
Emas Offshore (M) 6.5
EPF 6.3
Share Performance (%)
1m 3m 6m 12m
Absolute 3.3 (0.6) 22.5 32.8
Relative 2.2 (1.7) 18.3 23.1
The Research Team +603 9207 7609
Investment Merits
Now a drilling rig owner – new business division set to provide steady income for the group
Geographical footprint expansion now possible with the new drilling division
Its expertise has grown to include drilling and the management of floating production, storage & offloading (FPSO) vessel
Company Profile
Perisai Petroleum is an oil & gas service provider owning a floating production, storage and offloading (FPSO) vessel, a mobile
operating production unit (MOPU), a pipelay barge and eight offshore support vessels (OSVs) with up to two jack-up rigs on order.
Highlights
Growing out of its traditional role. Perisai has largely been involved in the OSV and MOPU segments. It is a relatively small player in both businesses, dwarfed by other domestic players with larger vessel fleets. Banking on buoyant offshore O&G activities regionally, the group has decided to acquire three JUs.
Drilling division to give earnings visibility. Perisai’s first JU, the Perisai Pacific 101 (PP101) is being built by Sembcorp Marine (SMM SP, BUY, FV: SGD5.40) and is scheduled for delivery in 2QFY14. The group will also take delivery of its second and third JUs in 2QFY15 and 3QFY16 respectively. We believe that Perisai will be able to secure charter contracts considering the strong demand for premium JUs in Asean.
Perisai Kamelia to contribute significantly in FY14. Perisai’s 51%-owned Perisai Kamelia FPSO is expected to contribute significantly to its bottomline from FY14 onwards. This vessel has been deployed to the North Malay Basin’s Kamelia Field since mid-2013 and has started production in Dec 2013.
Company Report Card
Latest results. Perisai’s MYR71.8m FY13 net profit made up only 93% and 91% of our and consensus estimates respectively. The poor performance was attributed to the non-extension of contracts to both the Rubicone MOPU and the Enterprise 3 (E3) derrick lay barge in 2QFY13 and 3QFY13 respectively. We had expected 4QFY13 to be a bad quarter mainly because Rubicone and E3 effectively stopped contributing after 3QFY13 and 4QFY13 respectively. These vessels had
Profit & Loss Dec-12 Dec-13 Dec-14F
Total turnover (MYRm) 128 112 119
Reported net profit (MYRm) 92 72 73
Recurring net profit (MYRm) 92 72 73
Recurring net profit growth (%) 336.1 (22.1) 2.2
Recurring EPS (MYR) 0.09 0.07 0.06
Recurring P/E (x) 18.54 23.87 25.69
Return on average equity (%) 22.7 10.4 7.8
P/B (x) 3.54 1.90 1.91
P/CF (x) 10.33 113.31 14.72
Source: Company data, RHB estimates
Balance Sheet (MYRm) Dec-12 Dec-13 Dec-14F
Total current assets 579 263 174
Total assets 1,129 1,443 1,492
Total current liabilities 300 166 156
Total non-current liabilities 265 273 237
Total liabilities 565 439 393
Shareholders' equity 482 903 987
Minority interests 82 100 111
Total equity 565 1,003 1,098
Total liabilities & equity 1,129 1,443 1,492
Total debt 342 354 268
Net debt 317 291 167
Source: Company data, RHB estimates
Cash flow (MYRm) Dec-12 Dec-13 Dec-14F
Cash flow from operations 165 15 128
Cash flow from investing activities (272) (71) (519)
Cash flow from financing activities 93 88 429
Cash at beginning of period 41 25 63
Total cash generated (13) 33 37
Forex effects (3) 5 0
Implied cash at end of period 25 63 100
Source: Company data, RHB estimates
previously accounted for around 40% of its earnings; hence, the overall 13%/22% y-o-y decline in FY13 revenue/net profit.
Balance sheet/cash flow. Perisai is currently undertaking a drive to expand its income-producing assets. Understandably, this will raise questions over financing. We believe the group may need to further tap into debt and equity financing. Note that Perisai has just recently concluded a 10% private placement.
ROE. We forecast ROEs to fall to 7.8% from 10.4% following the heavy capex and the idling Rubicone and E3. Having said that, we are comforted by the fact that the company’s new drilling division will be able to shore up earnings in FY14.
Dividend. No dividend was declared for FY13. We believe Perisai is conserving cash for asset acquisitions and, therefore, we do not expect the group to declare dividends for at least the next two years.
Management. Perisai’s senior management is currently headed by En Zainol Izzet Mohamed Ishak, the group’s managing director. His industry experience includes his 18-year stint in Sapura Group, where his last held position was as chief executive officer of SapuraCrest Petroleum, which is now known as SapuraKencana Petroleum (SAKP MK, BUY, FV: MYR5.61). Zainol Izzet left the Malaysian O&G giant in 2010. Perisai’s management is commended for its efforts to expand the group’s bottomline and expertise via other sub-segments within the O&G industry.
Recommendation
We view the events that happened in FY13 as temporary noise to Perisai’s otherwise decent financial performance. The new drilling and FPSO segments are expected to drive earnings from FY14 onwards. We value the group based on a FY14/15 blended EPS to capture the estimated FY15 earnings growth of more than 100%. This will be driven by: i) contributions from two drilling rigs, and ii) full-year contributions from both Rubicone and E3 in FY15. Our new FV also reflects the recent 10% private placement. We maintain our BUY call on Perisai, with a FV of MYR2.05, which is based on an unchanged target P/E of 20x, at a 35% discount to UMW Oil & Gas (UMWOG MK, NR)’s 31x.
49Top Malaysia Small Cap Companies 2014
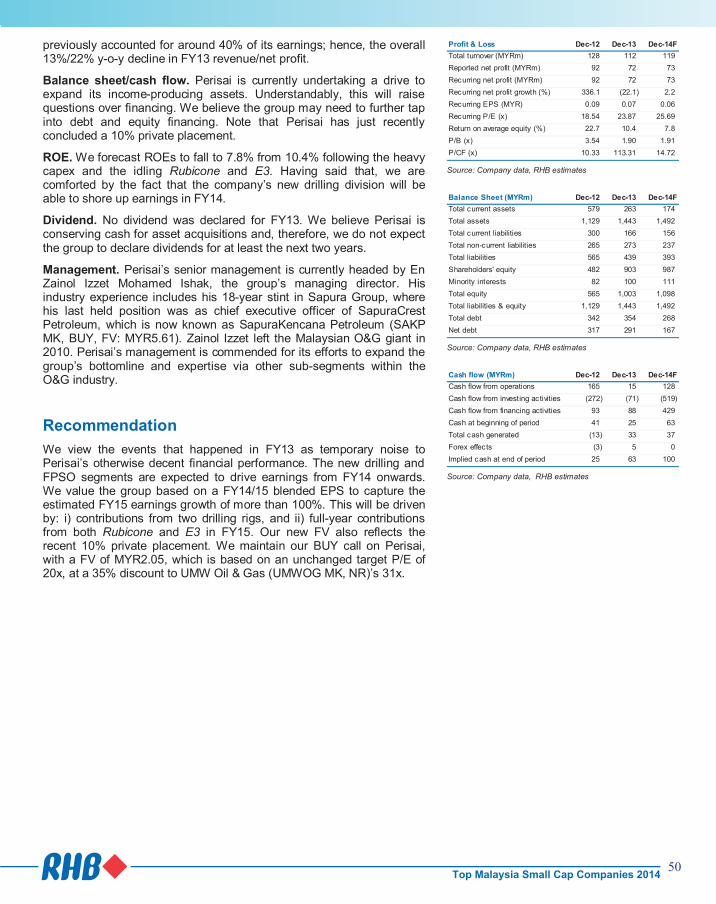
Perisai Petroleum Teknologi Target: MYR2.05
Price: MYR1.58
Drilling Rigs To Provide Steady Income
89
97
104
112
119
127
134
142
149
1.0
1.1
1.2
1.3
1.4
1.5
1.6
1.7
1.8
Perisai Petroleum Teknologi (PPT MK)Price Close Relative to FTSE Bursa Malaysia KLCI Index (RHS)
5
10
15
20
25
30
Apr-
13
Jun
-13
Aug
-13
Oct
-13
Dec-1
3
Feb
-14
Vol m
Source: Bloomberg
Stock Profile
Bloomberg Ticker PPT MK
Avg Turnover (MYR/USD) 4.90m/1.49m
Net Gearing (%) 15.2
Market Cap (MYRm) 1,713m
Beta (x) 1.51
BVPS (MYR) 0.83
52-wk Price low/high (MYR) 1.11 - 1.72
Free float (%) 62
Major Shareholders (%)
Mercury Pacific Marine 8.0
Emas Offshore (M) 6.5
EPF 6.3
Share Performance (%)
1m 3m 6m 12m
Absolute 3.3 (0.6) 22.5 32.8
Relative 2.2 (1.7) 18.3 23.1
The Research Team +603 9207 7609
Investment Merits
Now a drilling rig owner – new business division set to provide steady income for the group
Geographical footprint expansion now possible with the new drilling division
Its expertise has grown to include drilling and the management of floating production, storage & offloading (FPSO) vessel
Company Profile
Perisai Petroleum is an oil & gas service provider owning a floating production, storage and offloading (FPSO) vessel, a mobile
operating production unit (MOPU), a pipelay barge and eight offshore support vessels (OSVs) with up to two jack-up rigs on order.
Highlights
Growing out of its traditional role. Perisai has largely been involved in the OSV and MOPU segments. It is a relatively small player in both businesses, dwarfed by other domestic players with larger vessel fleets. Banking on buoyant offshore O&G activities regionally, the group has decided to acquire three JUs.
Drilling division to give earnings visibility. Perisai’s first JU, the Perisai Pacific 101 (PP101) is being built by Sembcorp Marine (SMM SP, BUY, FV: SGD5.40) and is scheduled for delivery in 2QFY14. The group will also take delivery of its second and third JUs in 2QFY15 and 3QFY16 respectively. We believe that Perisai will be able to secure charter contracts considering the strong demand for premium JUs in Asean.
Perisai Kamelia to contribute significantly in FY14. Perisai’s 51%-owned Perisai Kamelia FPSO is expected to contribute significantly to its bottomline from FY14 onwards. This vessel has been deployed to the North Malay Basin’s Kamelia Field since mid-2013 and has started production in Dec 2013.
Company Report Card
Latest results. Perisai’s MYR71.8m FY13 net profit made up only 93% and 91% of our and consensus estimates respectively. The poor performance was attributed to the non-extension of contracts to both the Rubicone MOPU and the Enterprise 3 (E3) derrick lay barge in 2QFY13 and 3QFY13 respectively. We had expected 4QFY13 to be a bad quarter mainly because Rubicone and E3 effectively stopped contributing after 3QFY13 and 4QFY13 respectively. These vessels had
Profit & Loss Dec-12 Dec-13 Dec-14F
Total turnover (MYRm) 128 112 119
Reported net profit (MYRm) 92 72 73
Recurring net profit (MYRm) 92 72 73
Recurring net profit growth (%) 336.1 (22.1) 2.2
Recurring EPS (MYR) 0.09 0.07 0.06
Recurring P/E (x) 18.54 23.87 25.69
Return on average equity (%) 22.7 10.4 7.8
P/B (x) 3.54 1.90 1.91
P/CF (x) 10.33 113.31 14.72
Source: Company data, RHB estimates
Balance Sheet (MYRm) Dec-12 Dec-13 Dec-14F
Total current assets 579 263 174
Total assets 1,129 1,443 1,492
Total current liabilities 300 166 156
Total non-current liabilities 265 273 237
Total liabilities 565 439 393
Shareholders' equity 482 903 987
Minority interests 82 100 111
Total equity 565 1,003 1,098
Total liabilities & equity 1,129 1,443 1,492
Total debt 342 354 268
Net debt 317 291 167
Source: Company data, RHB estimates
Cash flow (MYRm) Dec-12 Dec-13 Dec-14F
Cash flow from operations 165 15 128
Cash flow from investing activities (272) (71) (519)
Cash flow from financing activities 93 88 429
Cash at beginning of period 41 25 63
Total cash generated (13) 33 37
Forex effects (3) 5 0
Implied cash at end of period 25 63 100
Source: Company data, RHB estimates
previously accounted for around 40% of its earnings; hence, the overall 13%/22% y-o-y decline in FY13 revenue/net profit.
Balance sheet/cash flow. Perisai is currently undertaking a drive to expand its income-producing assets. Understandably, this will raise questions over financing. We believe the group may need to further tap into debt and equity financing. Note that Perisai has just recently concluded a 10% private placement.
ROE. We forecast ROEs to fall to 7.8% from 10.4% following the heavy capex and the idling Rubicone and E3. Having said that, we are comforted by the fact that the company’s new drilling division will be able to shore up earnings in FY14.
Dividend. No dividend was declared for FY13. We believe Perisai is conserving cash for asset acquisitions and, therefore, we do not expect the group to declare dividends for at least the next two years.
Management. Perisai’s senior management is currently headed by En Zainol Izzet Mohamed Ishak, the group’s managing director. His industry experience includes his 18-year stint in Sapura Group, where his last held position was as chief executive officer of SapuraCrest Petroleum, which is now known as SapuraKencana Petroleum (SAKP MK, BUY, FV: MYR5.61). Zainol Izzet left the Malaysian O&G giant in 2010. Perisai’s management is commended for its efforts to expand the group’s bottomline and expertise via other sub-segments within the O&G industry.
Recommendation
We view the events that happened in FY13 as temporary noise to Perisai’s otherwise decent financial performance. The new drilling and FPSO segments are expected to drive earnings from FY14 onwards. We value the group based on a FY14/15 blended EPS to capture the estimated FY15 earnings growth of more than 100%. This will be driven by: i) contributions from two drilling rigs, and ii) full-year contributions from both Rubicone and E3 in FY15. Our new FV also reflects the recent 10% private placement. We maintain our BUY call on Perisai, with a FV of MYR2.05, which is based on an unchanged target P/E of 20x, at a 35% discount to UMW Oil & Gas (UMWOG MK, NR)’s 31x.
50Top Malaysia Small Cap Companies 2014
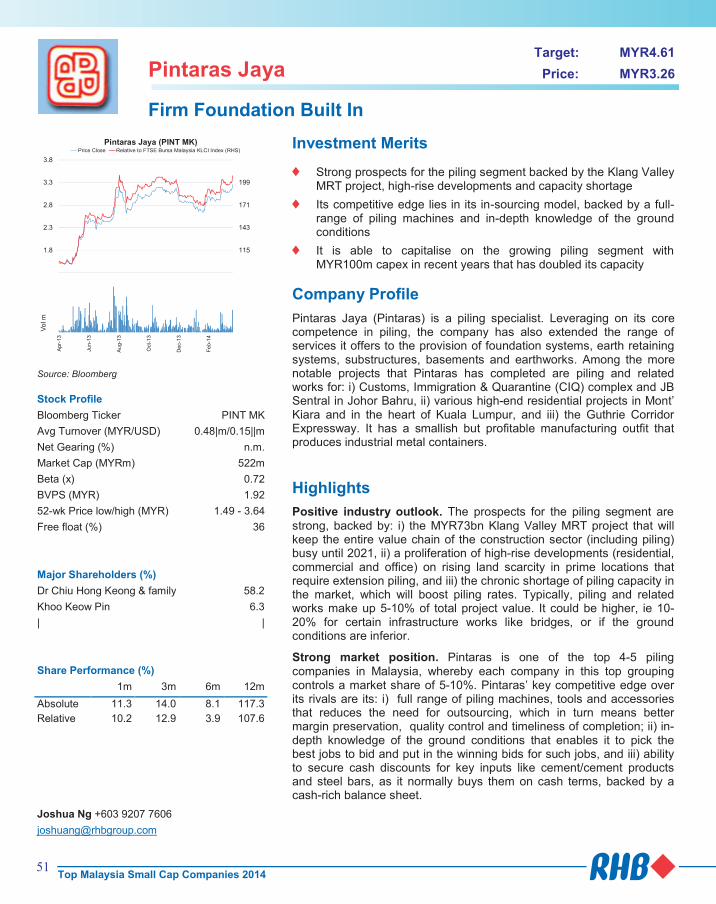
Pintaras Jaya Target: MYR4.61
Price: MYR3.26
Firm Foundation Built In
87
115
143
171
199
1.3
1.8
2.3
2.8
3.3
3.8
Pintaras Jaya (PINT MK)Price Close Relative to FTSE Bursa Malaysia KLCI Index (RHS)
11111
Apr-
13
Ju
n-1
3
Au
g-1
3
Oct
-13
De
c-1
3
Fe
b-1
4
Vo
l m
Source: Bloomberg
Stock Profile
Bloomberg Ticker PINT MK
Avg Turnover (MYR/USD) 0.48|m/0.15||m
Net Gearing (%) n.m.
Market Cap (MYRm) 522m
Beta (x) 0.72
BVPS (MYR) 1.92
52-wk Price low/high (MYR) 1.49 - 3.64
Free float (%) 36
Major Shareholders (%)
Dr Chiu Hong Keong & family 58.2
Khoo Keow Pin 6.3
| |
Share Performance (%)
1m 3m 6m 12m
Absolute 11.3 14.0 8.1 117.3
Relative 10.2 12.9 3.9 107.6
Joshua Ng +603 9207 7606
Investment Merits
Strong prospects for the piling segment backed by the Klang Valley MRT project, high-rise developments and capacity shortage
Its competitive edge lies in its in-sourcing model, backed by a full-range of piling machines and in-depth knowledge of the ground conditions
It is able to capitalise on the growing piling segment with MYR100m capex in recent years that has doubled its capacity
Company Profile
Pintaras Jaya (Pintaras) is a piling specialist. Leveraging on its core competence in piling, the company has also extended the range of services it offers to the provision of foundation systems, earth retaining systems, substructures, basements and earthworks. Among the more notable projects that Pintaras has completed are piling and related works for: i) Customs, Immigration & Quarantine (CIQ) complex and JB Sentral in Johor Bahru, ii) various high-end residential projects in Mont’ Kiara and in the heart of Kuala Lumpur, and iii) the Guthrie Corridor Expressway. It has a smallish but profitable manufacturing outfit that produces industrial metal containers.
Highlights
Positive industry outlook. The prospects for the piling segment are strong, backed by: i) the MYR73bn Klang Valley MRT project that will keep the entire value chain of the construction sector (including piling) busy until 2021, ii) a proliferation of high-rise developments (residential, commercial and office) on rising land scarcity in prime locations that require extension piling, and iii) the chronic shortage of piling capacity in the market, which will boost piling rates. Typically, piling and related works make up 5-10% of total project value. It could be higher, ie 10-20% for certain infrastructure works like bridges, or if the ground conditions are inferior.
Strong market position. Pintaras is one of the top 4-5 piling companies in Malaysia, whereby each company in this top grouping controls a market share of 5-10%. Pintaras’ key competitive edge over its rivals are its: i) full range of piling machines, tools and accessories that reduces the need for outsourcing, which in turn means better margin preservation, quality control and timeliness of completion; ii) in-depth knowledge of the ground conditions that enables it to pick the best jobs to bid and put in the winning bids for such jobs, and iii) ability to secure cash discounts for key inputs like cement/cement products and steel bars, as it normally buys them on cash terms, backed by a cash-rich balance sheet.
Profit & Loss Jun-12 Jun-13 Jun-14F
Total turnover (MYRm) 185 173 200
Reported net profit (MYRm) 36 52 52
Recurring net profit (MYRm) 30 44 52
Recurring net profit growth (%) 9.7 48.2 18.0
Recurring EPS (MYR) 0.19 0.28 0.33
DPS (MYR) 0.10 0.13 0.13
Dividend Yield (%) 3.1 3.8 3.8
Recurring P/E (x) 17.47 11.79 9.99
Return on average equity (%) 15.7 20.6 18.1
P/B (x) 2.20 1.93 1.70
P/CF (x) 10.73 11.86 10.05
Source: Company data, RHB estimates
Balance Sheet (MYRm) Jun-12 Jun-13 Jun-14F
Total current assets 183 223 233
Total assets 302 331 367
Total current liabilities 56 50 50
Total non-current liabilities 9 10 10
Total liabilities 64 60 60
Shareholders' equity 237 271 307
Total equity 237 271 307
Total liabilities & equity 302 331 367
Net debt (84) (125) (120)
Source: Company data, RHB estimates
Cash flow (MYRm) Jun-12 Jun-13 Jun-14F
Cash flow from operations 49 44 52
Cash flow from investing activities (11) (8) (25)
Cash flow from financing activities (12) (16) (16)
Cash at beginning of period 52 84 125
Total cash generated 26 20 11
Forex effects 0 (0) -
Implied cash at end of period 78 104 136
Source: Company data, RHB estimates
New capacity to drive growth. Backed by about MYR100m capex in recent years, Pintaras can now take on jobs with a combined outstanding value of about MYR300m at any one point, doubling from MYR150m. At present, the company’ outstanding orderbook is worth MYR295m, with the most notable job being a MYR74m contract secured in March 2014 for foundation works comprising diaphragm wall, piling and excavation for the Warisan Merdeka project.
Company Report Card
Latest results. FY13 core net profit surged 48%, thanks to margin expansion on improved piling rates.
Balance sheet/cash flow. As at end-FY13, Pintaras was in a net cash of MYR125.3m, translating into 78 sen per share. FY13 free cash flow remained strong at MYR41m, or 26 sen, after accounting for capex of MYR8.5m.
ROE. FY13’s 21% was way above the industry average of 11%.
Dividend. Single-tier 12.5 sen per share in FY13, translating into a net yield of 4%.
Management. At the helm of the company is founder, chairman and managing director Dr Chiu Hong Keong. Dr Chiu holds a Bachelor of Civil Engineering degree (First Class Honours) from the University of Auckland, New Zealand, and a Doctorate of Philosophy degree in Engineering from Monash University, Australia. He has had more than 30 years of experience in the construction sector. Prior to starting Pintaras, he had a professional career as an engineer with the Victorian Country Roads Board of Australia, Pilecon Engineering and Ho Hup Construction Company (HO MK, NR).
Recommendation
Our valuation is MYR4.61, based on 12x CY15 EPS of 38.4 sen. This is in line with our 1-year forward target P/E of 10-16x for the construction sector. BUY.
51Top Malaysia Small Cap Companies 2014
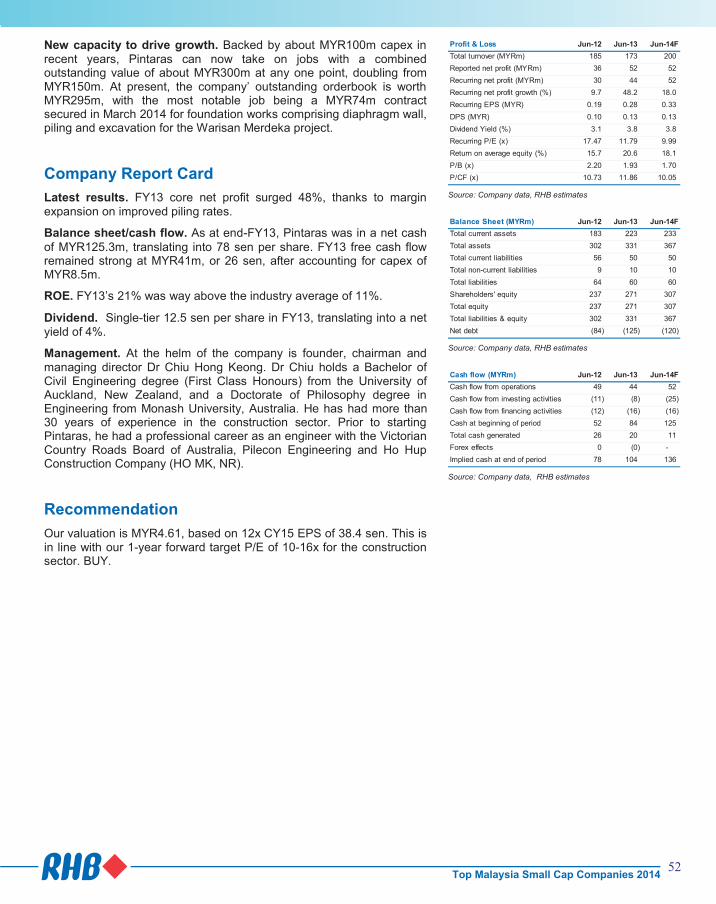
Pintaras Jaya Target: MYR4.61
Price: MYR3.26
Firm Foundation Built In
87
115
143
171
199
1.3
1.8
2.3
2.8
3.3
3.8
Pintaras Jaya (PINT MK)Price Close Relative to FTSE Bursa Malaysia KLCI Index (RHS)
11111
Apr-
13
Ju
n-1
3
Au
g-1
3
Oct
-13
De
c-1
3
Fe
b-1
4
Vo
l m
Source: Bloomberg
Stock Profile
Bloomberg Ticker PINT MK
Avg Turnover (MYR/USD) 0.48|m/0.15||m
Net Gearing (%) n.m.
Market Cap (MYRm) 522m
Beta (x) 0.72
BVPS (MYR) 1.92
52-wk Price low/high (MYR) 1.49 - 3.64
Free float (%) 36
Major Shareholders (%)
Dr Chiu Hong Keong & family 58.2
Khoo Keow Pin 6.3
| |
Share Performance (%)
1m 3m 6m 12m
Absolute 11.3 14.0 8.1 117.3
Relative 10.2 12.9 3.9 107.6
Joshua Ng +603 9207 7606
Investment Merits
Strong prospects for the piling segment backed by the Klang Valley MRT project, high-rise developments and capacity shortage
Its competitive edge lies in its in-sourcing model, backed by a full-range of piling machines and in-depth knowledge of the ground conditions
It is able to capitalise on the growing piling segment with MYR100m capex in recent years that has doubled its capacity
Company Profile
Pintaras Jaya (Pintaras) is a piling specialist. Leveraging on its core competence in piling, the company has also extended the range of services it offers to the provision of foundation systems, earth retaining systems, substructures, basements and earthworks. Among the more notable projects that Pintaras has completed are piling and related works for: i) Customs, Immigration & Quarantine (CIQ) complex and JB Sentral in Johor Bahru, ii) various high-end residential projects in Mont’ Kiara and in the heart of Kuala Lumpur, and iii) the Guthrie Corridor Expressway. It has a smallish but profitable manufacturing outfit that produces industrial metal containers.
Highlights
Positive industry outlook. The prospects for the piling segment are strong, backed by: i) the MYR73bn Klang Valley MRT project that will keep the entire value chain of the construction sector (including piling) busy until 2021, ii) a proliferation of high-rise developments (residential, commercial and office) on rising land scarcity in prime locations that require extension piling, and iii) the chronic shortage of piling capacity in the market, which will boost piling rates. Typically, piling and related works make up 5-10% of total project value. It could be higher, ie 10-20% for certain infrastructure works like bridges, or if the ground conditions are inferior.
Strong market position. Pintaras is one of the top 4-5 piling companies in Malaysia, whereby each company in this top grouping controls a market share of 5-10%. Pintaras’ key competitive edge over its rivals are its: i) full range of piling machines, tools and accessories that reduces the need for outsourcing, which in turn means better margin preservation, quality control and timeliness of completion; ii) in-depth knowledge of the ground conditions that enables it to pick the best jobs to bid and put in the winning bids for such jobs, and iii) ability to secure cash discounts for key inputs like cement/cement products and steel bars, as it normally buys them on cash terms, backed by a cash-rich balance sheet.
Profit & Loss Jun-12 Jun-13 Jun-14F
Total turnover (MYRm) 185 173 200
Reported net profit (MYRm) 36 52 52
Recurring net profit (MYRm) 30 44 52
Recurring net profit growth (%) 9.7 48.2 18.0
Recurring EPS (MYR) 0.19 0.28 0.33
DPS (MYR) 0.10 0.13 0.13
Dividend Yield (%) 3.1 3.8 3.8
Recurring P/E (x) 17.47 11.79 9.99
Return on average equity (%) 15.7 20.6 18.1
P/B (x) 2.20 1.93 1.70
P/CF (x) 10.73 11.86 10.05
Source: Company data, RHB estimates
Balance Sheet (MYRm) Jun-12 Jun-13 Jun-14F
Total current assets 183 223 233
Total assets 302 331 367
Total current liabilities 56 50 50
Total non-current liabilities 9 10 10
Total liabilities 64 60 60
Shareholders' equity 237 271 307
Total equity 237 271 307
Total liabilities & equity 302 331 367
Net debt (84) (125) (120)
Source: Company data, RHB estimates
Cash flow (MYRm) Jun-12 Jun-13 Jun-14F
Cash flow from operations 49 44 52
Cash flow from investing activities (11) (8) (25)
Cash flow from financing activities (12) (16) (16)
Cash at beginning of period 52 84 125
Total cash generated 26 20 11
Forex effects 0 (0) -
Implied cash at end of period 78 104 136
Source: Company data, RHB estimates
New capacity to drive growth. Backed by about MYR100m capex in recent years, Pintaras can now take on jobs with a combined outstanding value of about MYR300m at any one point, doubling from MYR150m. At present, the company’ outstanding orderbook is worth MYR295m, with the most notable job being a MYR74m contract secured in March 2014 for foundation works comprising diaphragm wall, piling and excavation for the Warisan Merdeka project.
Company Report Card
Latest results. FY13 core net profit surged 48%, thanks to margin expansion on improved piling rates.
Balance sheet/cash flow. As at end-FY13, Pintaras was in a net cash of MYR125.3m, translating into 78 sen per share. FY13 free cash flow remained strong at MYR41m, or 26 sen, after accounting for capex of MYR8.5m.
ROE. FY13’s 21% was way above the industry average of 11%.
Dividend. Single-tier 12.5 sen per share in FY13, translating into a net yield of 4%.
Management. At the helm of the company is founder, chairman and managing director Dr Chiu Hong Keong. Dr Chiu holds a Bachelor of Civil Engineering degree (First Class Honours) from the University of Auckland, New Zealand, and a Doctorate of Philosophy degree in Engineering from Monash University, Australia. He has had more than 30 years of experience in the construction sector. Prior to starting Pintaras, he had a professional career as an engineer with the Victorian Country Roads Board of Australia, Pilecon Engineering and Ho Hup Construction Company (HO MK, NR).
Recommendation
Our valuation is MYR4.61, based on 12x CY15 EPS of 38.4 sen. This is in line with our 1-year forward target P/E of 10-16x for the construction sector. BUY.
52Top Malaysia Small Cap Companies 2014
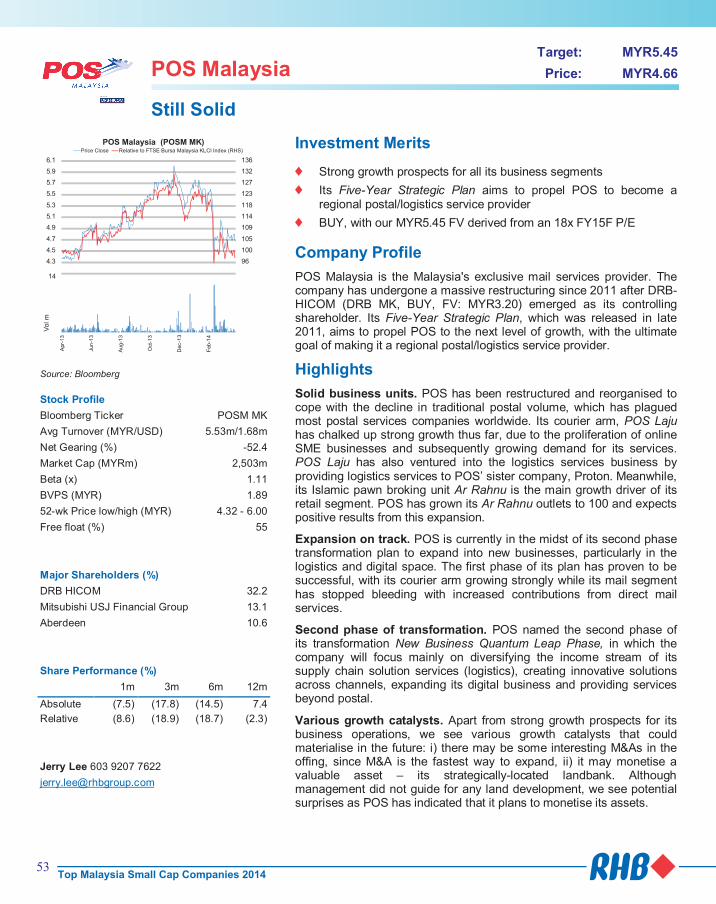
POS Malaysia Target: MYR5.45
Price: MYR4.66
Still Solid
91
96
100
105
109
114
118
123
127
132
136
4.1
4.3
4.5
4.7
4.9
5.1
5.3
5.5
5.7
5.9
6.1
POS Malaysia (POSM MK)Price Close Relative to FTSE Bursa Malaysia KLCI Index (RHS)
2468
101214
Apr-
13
Jun
-13
Aug
-13
Oct
-13
Dec-1
3
Feb
-14
Vol m
Source: Bloomberg
Stock Profile
Bloomberg Ticker POSM MK
Avg Turnover (MYR/USD) 5.53m/1.68m
Net Gearing (%) -52.4
Market Cap (MYRm) 2,503m
Beta (x) 1.11
BVPS (MYR) 1.89
52-wk Price low/high (MYR) 4.32 - 6.00
Free float (%) 55
Major Shareholders (%)
DRB HICOM 32.2
Mitsubishi USJ Financial Group 13.1
Aberdeen 10.6
Share Performance (%)
1m 3m 6m 12m
Absolute (7.5) (17.8) (14.5) 7.4
Relative (8.6) (18.9) (18.7) (2.3)
Jerry Lee 603 9207 7622
Investment Merits
Strong growth prospects for all its business segments
Its Five-Year Strategic Plan aims to propel POS to become a regional postal/logistics service provider
BUY, with our MYR5.45 FV derived from an 18x FY15F P/E
Company Profile
POS Malaysia is the Malaysia's exclusive mail services provider. The company has undergone a massive restructuring since 2011 after DRB-HICOM (DRB MK, BUY, FV: MYR3.20) emerged as its controlling shareholder. Its Five-Year Strategic Plan, which was released in late 2011, aims to propel POS to the next level of growth, with the ultimate goal of making it a regional postal/logistics service provider.
Highlights
Solid business units. POS has been restructured and reorganised to cope with the decline in traditional postal volume, which has plagued most postal services companies worldwide. Its courier arm, POS Laju has chalked up strong growth thus far, due to the proliferation of online SME businesses and subsequently growing demand for its services. POS Laju has also ventured into the logistics services business by providing logistics services to POS’ sister company, Proton. Meanwhile, its Islamic pawn broking unit Ar Rahnu is the main growth driver of its retail segment. POS has grown its Ar Rahnu outlets to 100 and expects positive results from this expansion.
Expansion on track. POS is currently in the midst of its second phase transformation plan to expand into new businesses, particularly in the logistics and digital space. The first phase of its plan has proven to be successful, with its courier arm growing strongly while its mail segment has stopped bleeding with increased contributions from direct mail services.
Second phase of transformation. POS named the second phase of its transformation New Business Quantum Leap Phase, in which the company will focus mainly on diversifying the income stream of its supply chain solution services (logistics), creating innovative solutions across channels, expanding its digital business and providing services beyond postal.
Various growth catalysts. Apart from strong growth prospects for its business operations, we see various growth catalysts that could materialise in the future: i) there may be some interesting M&As in the offing, since M&A is the fastest way to expand, ii) it may monetise a valuable asset – its strategically-located landbank. Although management did not guide for any land development, we see potential surprises as POS has indicated that it plans to monetise its assets.
Profit & Loss Mar-12 Mar-13 Mar-14F
Total turnover (MYRm) 1,482 1,270 1,406
Reported net profit (MYRm) 139 151 140
Recurring net profit (MYRm) 151 150 140
Recurring net profit growth (%) - (1.1) (6.9)
Recurring EPS (MYR) 0.28 0.28 0.26
DPS (MYR) 0.13 0.13 0.13
Dividend Yield (%) 2.8 2.8 2.8
Recurring P/E (x) 16.53 16.70 17.94
Return on average equity (%) 16.1 16.4 14.2
P/B (x) 2.79 2.64 2.46
P/CF (x) 6.85 10.79 9.12
Source: Company data, RHB estimates
Balance Sheet (MYRm) Mar-12 Mar-13 Mar-14F
Total current assets 722 862 784
Total assets 1,498 1,615 1,791
Total current liabilities 582 631 737
Total non-current liabilities 18 37 37
Total liabilities 600 668 774
Shareholders' equity 898 947 1,017
Minority interests - 1 1
Other equity - (0) (0)
Total equity 898 948 1,017
Total liabilities & equity 1,498 1,615 1,791
Net debt (544) (666) (533)
Source: Company data, RHB estimates
Cash flow (MYRm) Mar-12 Mar-13 Mar-14F
Cash flow from operations 365 232 274
Cash flow from investing activities (86) (34) (319)
Cash flow from financing activities (112) (64) (70)
Cash at beginning of period 396 544 666
Total cash generated 167 134 (115)
Implied cash at end of period 562 678 552
Source: Company data, RHB estimates
Company Report Card
Latest results. POS’ 9MFY14 results surprised the market as earnings came in below expectations. Although its revenue was in line with our forecast, higher-than-expected operating expenses squeezed earnings. Nonetheless, we believe POS’ fundamentals remain solid and its prospects intact, driven by potential growth in its courier segment once its automated processing centre begins operations.
Balance sheet/cash flow. POS has a solid balance sheet with a huge cash pile of MYR397m and minimal borrowings.
ROE. We expect ROE of 15.4% for FY14F, driven mainly by its strong earnings growth.
Dividend. The company has been paying 16.5 sen gross dividend over the last three financial years, which translated into an annual payout of about 50%. As management did not guide for any possible increase in dividend payout, we are of the view that it may want to retain cash for expansion.
Management. Since DRB-HICOM came on board in 2011 and introduced a new transformation plan, POS’ financial health has been improving. As such, we believe the company would continue to grow positively under the helm of the current management team, led by its newly-appointed CEO Datuk Iskandar Mizal Mahmood.
Recommendation
BUY. We maintain our BUY call on POS for its solid business growth coupled with potential positive surprises from its landbank developments. Our valuation of MYR5.45 is pegged to an 18x FY15F P/E, on par with its global peers’, as we believe POS is on the right track to become an established regional postal/logistics player.
53Top Malaysia Small Cap Companies 2014

POS Malaysia Target: MYR5.45
Price: MYR4.66
Still Solid
91
96
100
105
109
114
118
123
127
132
136
4.1
4.3
4.5
4.7
4.9
5.1
5.3
5.5
5.7
5.9
6.1
POS Malaysia (POSM MK)Price Close Relative to FTSE Bursa Malaysia KLCI Index (RHS)
2468
101214
Apr-
13
Jun
-13
Aug
-13
Oct
-13
Dec-1
3
Feb
-14
Vol m
Source: Bloomberg
Stock Profile
Bloomberg Ticker POSM MK
Avg Turnover (MYR/USD) 5.53m/1.68m
Net Gearing (%) -52.4
Market Cap (MYRm) 2,503m
Beta (x) 1.11
BVPS (MYR) 1.89
52-wk Price low/high (MYR) 4.32 - 6.00
Free float (%) 55
Major Shareholders (%)
DRB HICOM 32.2
Mitsubishi USJ Financial Group 13.1
Aberdeen 10.6
Share Performance (%)
1m 3m 6m 12m
Absolute (7.5) (17.8) (14.5) 7.4
Relative (8.6) (18.9) (18.7) (2.3)
Jerry Lee 603 9207 7622
Investment Merits
Strong growth prospects for all its business segments
Its Five-Year Strategic Plan aims to propel POS to become a regional postal/logistics service provider
BUY, with our MYR5.45 FV derived from an 18x FY15F P/E
Company Profile
POS Malaysia is the Malaysia's exclusive mail services provider. The company has undergone a massive restructuring since 2011 after DRB-HICOM (DRB MK, BUY, FV: MYR3.20) emerged as its controlling shareholder. Its Five-Year Strategic Plan, which was released in late 2011, aims to propel POS to the next level of growth, with the ultimate goal of making it a regional postal/logistics service provider.
Highlights
Solid business units. POS has been restructured and reorganised to cope with the decline in traditional postal volume, which has plagued most postal services companies worldwide. Its courier arm, POS Laju has chalked up strong growth thus far, due to the proliferation of online SME businesses and subsequently growing demand for its services. POS Laju has also ventured into the logistics services business by providing logistics services to POS’ sister company, Proton. Meanwhile, its Islamic pawn broking unit Ar Rahnu is the main growth driver of its retail segment. POS has grown its Ar Rahnu outlets to 100 and expects positive results from this expansion.
Expansion on track. POS is currently in the midst of its second phase transformation plan to expand into new businesses, particularly in the logistics and digital space. The first phase of its plan has proven to be successful, with its courier arm growing strongly while its mail segment has stopped bleeding with increased contributions from direct mail services.
Second phase of transformation. POS named the second phase of its transformation New Business Quantum Leap Phase, in which the company will focus mainly on diversifying the income stream of its supply chain solution services (logistics), creating innovative solutions across channels, expanding its digital business and providing services beyond postal.
Various growth catalysts. Apart from strong growth prospects for its business operations, we see various growth catalysts that could materialise in the future: i) there may be some interesting M&As in the offing, since M&A is the fastest way to expand, ii) it may monetise a valuable asset – its strategically-located landbank. Although management did not guide for any land development, we see potential surprises as POS has indicated that it plans to monetise its assets.
Profit & Loss Mar-12 Mar-13 Mar-14F
Total turnover (MYRm) 1,482 1,270 1,406
Reported net profit (MYRm) 139 151 140
Recurring net profit (MYRm) 151 150 140
Recurring net profit growth (%) - (1.1) (6.9)
Recurring EPS (MYR) 0.28 0.28 0.26
DPS (MYR) 0.13 0.13 0.13
Dividend Yield (%) 2.8 2.8 2.8
Recurring P/E (x) 16.53 16.70 17.94
Return on average equity (%) 16.1 16.4 14.2
P/B (x) 2.79 2.64 2.46
P/CF (x) 6.85 10.79 9.12
Source: Company data, RHB estimates
Balance Sheet (MYRm) Mar-12 Mar-13 Mar-14F
Total current assets 722 862 784
Total assets 1,498 1,615 1,791
Total current liabilities 582 631 737
Total non-current liabilities 18 37 37
Total liabilities 600 668 774
Shareholders' equity 898 947 1,017
Minority interests - 1 1
Other equity - (0) (0)
Total equity 898 948 1,017
Total liabilities & equity 1,498 1,615 1,791
Net debt (544) (666) (533)
Source: Company data, RHB estimates
Cash flow (MYRm) Mar-12 Mar-13 Mar-14F
Cash flow from operations 365 232 274
Cash flow from investing activities (86) (34) (319)
Cash flow from financing activities (112) (64) (70)
Cash at beginning of period 396 544 666
Total cash generated 167 134 (115)
Implied cash at end of period 562 678 552
Source: Company data, RHB estimates
Company Report Card
Latest results. POS’ 9MFY14 results surprised the market as earnings came in below expectations. Although its revenue was in line with our forecast, higher-than-expected operating expenses squeezed earnings. Nonetheless, we believe POS’ fundamentals remain solid and its prospects intact, driven by potential growth in its courier segment once its automated processing centre begins operations.
Balance sheet/cash flow. POS has a solid balance sheet with a huge cash pile of MYR397m and minimal borrowings.
ROE. We expect ROE of 15.4% for FY14F, driven mainly by its strong earnings growth.
Dividend. The company has been paying 16.5 sen gross dividend over the last three financial years, which translated into an annual payout of about 50%. As management did not guide for any possible increase in dividend payout, we are of the view that it may want to retain cash for expansion.
Management. Since DRB-HICOM came on board in 2011 and introduced a new transformation plan, POS’ financial health has been improving. As such, we believe the company would continue to grow positively under the helm of the current management team, led by its newly-appointed CEO Datuk Iskandar Mizal Mahmood.
Recommendation
BUY. We maintain our BUY call on POS for its solid business growth coupled with potential positive surprises from its landbank developments. Our valuation of MYR5.45 is pegged to an 18x FY15F P/E, on par with its global peers’, as we believe POS is on the right track to become an established regional postal/logistics player.
54Top Malaysia Small Cap Companies 2014
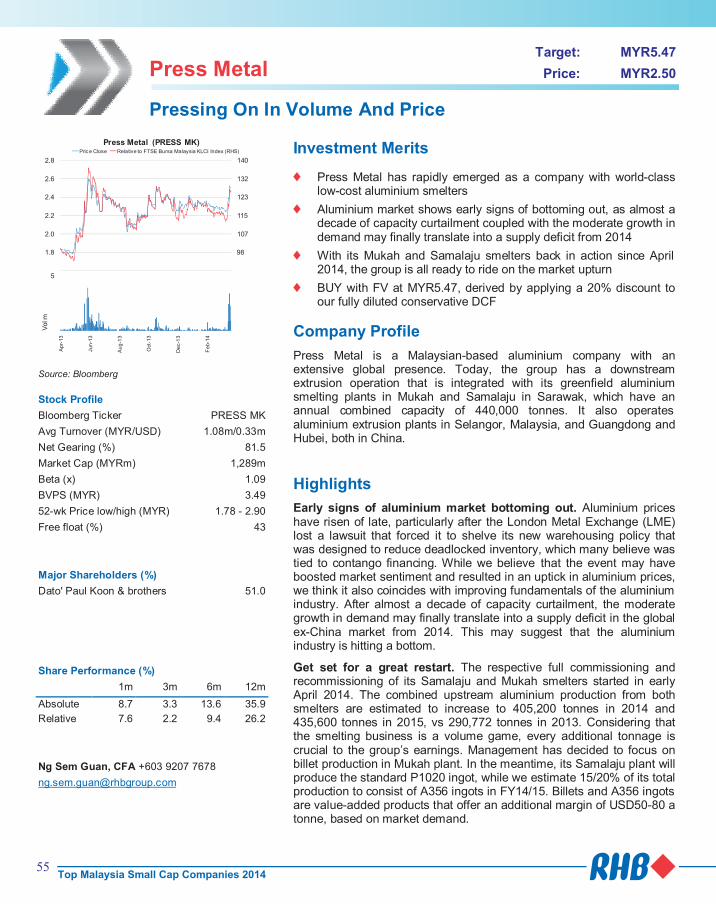
Press Metal Target: MYR5.47
Price: MYR2.50
Pressing On In Volume And Price
90
98
107
115
123
132
140
1.6
1.8
2.0
2.2
2.4
2.6
2.8
Press Metal (PRESS MK)Price Close Relative to FTSE Bursa Malaysia KLCI Index (RHS)
1
2
3
4
5
Ap
r-13
Jun
-13
Aug
-13
Oct
-13
Dec-1
3
Feb-1
4
Vo
l m
Source: Bloomberg
Stock Profile
Bloomberg Ticker PRESS MK
Avg Turnover (MYR/USD) 1.08m/0.33m
Net Gearing (%) 81.5
Market Cap (MYRm) 1,289m
Beta (x) 1.09
BVPS (MYR) 3.49
52-wk Price low/high (MYR) 1.78 - 2.90
Free float (%) 43
Major Shareholders (%)
Dato' Paul Koon & brothers 51.0
Share Performance (%)
1m 3m 6m 12m
Absolute 8.7 3.3 13.6 35.9
Relative 7.6 2.2 9.4 26.2
Ng Sem Guan, CFA +603 9207 7678
Investment Merits
Press Metal has rapidly emerged as a company with world-class low-cost aluminium smelters
Aluminium market shows early signs of bottoming out, as almost a decade of capacity curtailment coupled with the moderate growth in demand may finally translate into a supply deficit from 2014
With its Mukah and Samalaju smelters back in action since April 2014, the group is all ready to ride on the market upturn
BUY with FV at MYR5.47, derived by applying a 20% discount to our fully diluted conservative DCF
Company Profile
Press Metal is a Malaysian-based aluminium company with an extensive global presence. Today, the group has a downstream extrusion operation that is integrated with its greenfield aluminium smelting plants in Mukah and Samalaju in Sarawak, which have an annual combined capacity of 440,000 tonnes. It also operates aluminium extrusion plants in Selangor, Malaysia, and Guangdong and Hubei, both in China.
Highlights
Early signs of aluminium market bottoming out. Aluminium prices have risen of late, particularly after the London Metal Exchange (LME) lost a lawsuit that forced it to shelve its new warehousing policy that was designed to reduce deadlocked inventory, which many believe was tied to contango financing. While we believe that the event may have boosted market sentiment and resulted in an uptick in aluminium prices, we think it also coincides with improving fundamentals of the aluminium industry. After almost a decade of capacity curtailment, the moderate growth in demand may finally translate into a supply deficit in the global ex-China market from 2014. This may suggest that the aluminium industry is hitting a bottom.
Get set for a great restart. The respective full commissioning and recommissioning of its Samalaju and Mukah smelters started in early April 2014. The combined upstream aluminium production from both smelters are estimated to increase to 405,200 tonnes in 2014 and 435,600 tonnes in 2015, vs 290,772 tonnes in 2013. Considering that the smelting business is a volume game, every additional tonnage is crucial to the group’s earnings. Management has decided to focus on billet production in Mukah plant. In the meantime, its Samalaju plant will produce the standard P1020 ingot, while we estimate 15/20% of its total production to consist of A356 ingots in FY14/15. Billets and A356 ingots are value-added products that offer an additional margin of USD50-80 a tonne, based on market demand.
Profit & Loss Dec-12 Dec-13 Dec-14F
Total turnover (MYRm) 2,384 3,120 4,180
Reported net profit (MYRm) 184 15 215
Recurring net profit (MYRm) 64 114 215
Recurring net profit growth (%) (41.6) 78.8 87.7
Recurring EPS (MYR) 0.13 0.22 0.42
DPS (MYR) 0.03 0.02 0.04
Dividend Yield (%) 1.2 0.8 1.7
Recurring P/E (x) 18.53 11.13 5.97
Return on average equity (%) 16.8 1.2 14.0
P/B (x) 1.01 1.01 0.72
P/CF (x) na 2.23 2.85
Source: Company data, RHB estimates
Balance Sheet (MYRm) Dec-12 Dec-13 Dec-14F
Total current assets 1,639 1,259 1,687
Total assets 4,785 5,027 5,325
Total current liabilities 2,147 2,242 1,909
Total non-current liabilities 1,234 1,387 1,357
Total liabilities 3,381 3,629 3,265
Shareholders' equity 1,253 1,265 1,798
Minority interests 151 133 262
Total equity 1,405 1,398 2,060
Total liabilities & equity 4,785 5,027 5,325
Total debt 2,592 2,621 1,999
Net debt 2,331 2,378 1,679
Source: Company data, RHB estimates
Cash flow (MYRm) Dec-12 Dec-13 Dec-14F
Cash flow from operations (24) 570 450
Cash flow from investing activities (788) (497) 59
Cash flow from financing activities 714 (116) (431)
Cash at beginning of period 354 261 243
Total cash generated (98) (43) 77
Forex effects 6 25 -
Implied cash at end of period 261 243 320
Source: Company data, RHB estimates
All geared for a better tomorrow. News flow seems to have improved after the company disposed of its loss-making Hubei smelter while acquiring a profitable extrusion unit via an asset swap in Sept 2013. We are also excited about its recent landmark USD140m deal with Sumitomo Corp (8053 JP, NR), in which the latter took up a 20% stake in its Samalaju smelter, which implied a standalone valuation of MYR2.3bn for this unit. Although the disposal consideration of Samalaju smelter will be subject to certain adjustments until end-FY18, we deem them fair. For the time being, we are more hopeful about a potential reward of not more than USD21m upon Press Metal meeting certain production cost targets by end-FY18 – which are generally within management’s control. However, we are looking out for a potential negative earn-out adjustment (ie penalty) of up to USD16m, as the target set on Samalaju smelter’s yearly free cash flow until FY18 is highly dependent on aluminium prices, which management cannot control.
Company Report Card
Latest results. Investors may have missed the fact that Press Metal’s 2H13 results incorporated a loss, mainly due to losses incurred from the disposal of the Hubei smelter, on top of an operating loss recorded and an asset write-off for its Mukah smelter, pending compensation from its insurer. Excluding the loss, its core earnings would have been a commendable MYR30.9/38.1m in 3Q/4Q13.
Balance sheet/cash flow. Cash flow improved significantly from 2Q14 onwards from the disposal of its 20% stake in its Samalaju smelter on 1 April 2014. As a result, its gearing is expected to fall to 0.93x by end-FY14, with robust cash generated from its operation.
ROE. Core ROE is expected in the teens, when the Samalaju smelter is fully operational from FY14.
Dividend. Press Metal does not have any dividend policy in place, but we expect yields to improve with contributions from its smelting business.
Management. The group was founded by Dato’ Paul Koon and his brothers in 1986. Dato’ Paul remains fully involved in the business and actively drives Press Metal’s day-to-day operations.
Recommendation
Press Metal is set to enjoy the fruits of years of investments in world-class low-cost aluminium smelters. This is on the back of aluminium prices bottoming out (and rising in the future), while both smelters are now in full production mode. We expect group earnings to surge 87.7/29% in FY14/15 – largely unchanged from our previous numbers. We value the stock at MYR5.47, a 20% discount to our newly-derived fully-diluted conservative DCF, which implies 13.2/10.2x P/Es and 1.6/1.4x P/BVs on FY14/15 estimates respectively.
55Top Malaysia Small Cap Companies 2014

Press Metal Target: MYR5.47
Price: MYR2.50
Pressing On In Volume And Price
90
98
107
115
123
132
140
1.6
1.8
2.0
2.2
2.4
2.6
2.8
Press Metal (PRESS MK)Price Close Relative to FTSE Bursa Malaysia KLCI Index (RHS)
1
2
3
4
5
Ap
r-13
Jun
-13
Aug
-13
Oct
-13
Dec-1
3
Feb-1
4
Vo
l m
Source: Bloomberg
Stock Profile
Bloomberg Ticker PRESS MK
Avg Turnover (MYR/USD) 1.08m/0.33m
Net Gearing (%) 81.5
Market Cap (MYRm) 1,289m
Beta (x) 1.09
BVPS (MYR) 3.49
52-wk Price low/high (MYR) 1.78 - 2.90
Free float (%) 43
Major Shareholders (%)
Dato' Paul Koon & brothers 51.0
Share Performance (%)
1m 3m 6m 12m
Absolute 8.7 3.3 13.6 35.9
Relative 7.6 2.2 9.4 26.2
Ng Sem Guan, CFA +603 9207 7678
Investment Merits
Press Metal has rapidly emerged as a company with world-class low-cost aluminium smelters
Aluminium market shows early signs of bottoming out, as almost a decade of capacity curtailment coupled with the moderate growth in demand may finally translate into a supply deficit from 2014
With its Mukah and Samalaju smelters back in action since April 2014, the group is all ready to ride on the market upturn
BUY with FV at MYR5.47, derived by applying a 20% discount to our fully diluted conservative DCF
Company Profile
Press Metal is a Malaysian-based aluminium company with an extensive global presence. Today, the group has a downstream extrusion operation that is integrated with its greenfield aluminium smelting plants in Mukah and Samalaju in Sarawak, which have an annual combined capacity of 440,000 tonnes. It also operates aluminium extrusion plants in Selangor, Malaysia, and Guangdong and Hubei, both in China.
Highlights
Early signs of aluminium market bottoming out. Aluminium prices have risen of late, particularly after the London Metal Exchange (LME) lost a lawsuit that forced it to shelve its new warehousing policy that was designed to reduce deadlocked inventory, which many believe was tied to contango financing. While we believe that the event may have boosted market sentiment and resulted in an uptick in aluminium prices, we think it also coincides with improving fundamentals of the aluminium industry. After almost a decade of capacity curtailment, the moderate growth in demand may finally translate into a supply deficit in the global ex-China market from 2014. This may suggest that the aluminium industry is hitting a bottom.
Get set for a great restart. The respective full commissioning and recommissioning of its Samalaju and Mukah smelters started in early April 2014. The combined upstream aluminium production from both smelters are estimated to increase to 405,200 tonnes in 2014 and 435,600 tonnes in 2015, vs 290,772 tonnes in 2013. Considering that the smelting business is a volume game, every additional tonnage is crucial to the group’s earnings. Management has decided to focus on billet production in Mukah plant. In the meantime, its Samalaju plant will produce the standard P1020 ingot, while we estimate 15/20% of its total production to consist of A356 ingots in FY14/15. Billets and A356 ingots are value-added products that offer an additional margin of USD50-80 a tonne, based on market demand.
Profit & Loss Dec-12 Dec-13 Dec-14F
Total turnover (MYRm) 2,384 3,120 4,180
Reported net profit (MYRm) 184 15 215
Recurring net profit (MYRm) 64 114 215
Recurring net profit growth (%) (41.6) 78.8 87.7
Recurring EPS (MYR) 0.13 0.22 0.42
DPS (MYR) 0.03 0.02 0.04
Dividend Yield (%) 1.2 0.8 1.7
Recurring P/E (x) 18.53 11.13 5.97
Return on average equity (%) 16.8 1.2 14.0
P/B (x) 1.01 1.01 0.72
P/CF (x) na 2.23 2.85
Source: Company data, RHB estimates
Balance Sheet (MYRm) Dec-12 Dec-13 Dec-14F
Total current assets 1,639 1,259 1,687
Total assets 4,785 5,027 5,325
Total current liabilities 2,147 2,242 1,909
Total non-current liabilities 1,234 1,387 1,357
Total liabilities 3,381 3,629 3,265
Shareholders' equity 1,253 1,265 1,798
Minority interests 151 133 262
Total equity 1,405 1,398 2,060
Total liabilities & equity 4,785 5,027 5,325
Total debt 2,592 2,621 1,999
Net debt 2,331 2,378 1,679
Source: Company data, RHB estimates
Cash flow (MYRm) Dec-12 Dec-13 Dec-14F
Cash flow from operations (24) 570 450
Cash flow from investing activities (788) (497) 59
Cash flow from financing activities 714 (116) (431)
Cash at beginning of period 354 261 243
Total cash generated (98) (43) 77
Forex effects 6 25 -
Implied cash at end of period 261 243 320
Source: Company data, RHB estimates
All geared for a better tomorrow. News flow seems to have improved after the company disposed of its loss-making Hubei smelter while acquiring a profitable extrusion unit via an asset swap in Sept 2013. We are also excited about its recent landmark USD140m deal with Sumitomo Corp (8053 JP, NR), in which the latter took up a 20% stake in its Samalaju smelter, which implied a standalone valuation of MYR2.3bn for this unit. Although the disposal consideration of Samalaju smelter will be subject to certain adjustments until end-FY18, we deem them fair. For the time being, we are more hopeful about a potential reward of not more than USD21m upon Press Metal meeting certain production cost targets by end-FY18 – which are generally within management’s control. However, we are looking out for a potential negative earn-out adjustment (ie penalty) of up to USD16m, as the target set on Samalaju smelter’s yearly free cash flow until FY18 is highly dependent on aluminium prices, which management cannot control.
Company Report Card
Latest results. Investors may have missed the fact that Press Metal’s 2H13 results incorporated a loss, mainly due to losses incurred from the disposal of the Hubei smelter, on top of an operating loss recorded and an asset write-off for its Mukah smelter, pending compensation from its insurer. Excluding the loss, its core earnings would have been a commendable MYR30.9/38.1m in 3Q/4Q13.
Balance sheet/cash flow. Cash flow improved significantly from 2Q14 onwards from the disposal of its 20% stake in its Samalaju smelter on 1 April 2014. As a result, its gearing is expected to fall to 0.93x by end-FY14, with robust cash generated from its operation.
ROE. Core ROE is expected in the teens, when the Samalaju smelter is fully operational from FY14.
Dividend. Press Metal does not have any dividend policy in place, but we expect yields to improve with contributions from its smelting business.
Management. The group was founded by Dato’ Paul Koon and his brothers in 1986. Dato’ Paul remains fully involved in the business and actively drives Press Metal’s day-to-day operations.
Recommendation
Press Metal is set to enjoy the fruits of years of investments in world-class low-cost aluminium smelters. This is on the back of aluminium prices bottoming out (and rising in the future), while both smelters are now in full production mode. We expect group earnings to surge 87.7/29% in FY14/15 – largely unchanged from our previous numbers. We value the stock at MYR5.47, a 20% discount to our newly-derived fully-diluted conservative DCF, which implies 13.2/10.2x P/Es and 1.6/1.4x P/BVs on FY14/15 estimates respectively.
56Top Malaysia Small Cap Companies 2014
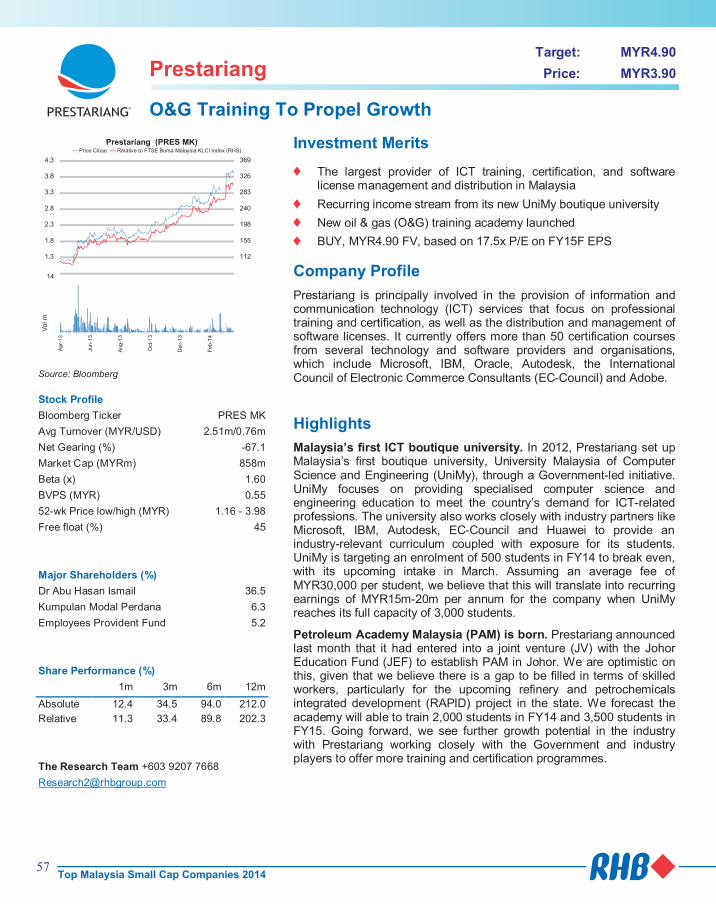
Prestariang Target: MYR4.90
Price: MYR3.90
O&G Training To Propel Growth
69
112
155
198
240
283
326
369
0.8
1.3
1.8
2.3
2.8
3.3
3.8
4.3
Prestariang (PRES MK)Price Close Relative to FTSE Bursa Malaysia KLCI Index (RHS)
2468
101214
Apr-
13
Jun
-13
Aug
-13
Oct
-13
Dec-1
3
Feb
-14
Vol m
Source: Bloomberg
Stock Profile
Bloomberg Ticker PRES MK
Avg Turnover (MYR/USD) 2.51m/0.76m
Net Gearing (%) -67.1
Market Cap (MYRm) 858m
Beta (x) 1.60
BVPS (MYR) 0.55
52-wk Price low/high (MYR) 1.16 - 3.98
Free float (%) 45
Major Shareholders (%)
Dr Abu Hasan Ismail 36.5
Kumpulan Modal Perdana 6.3
Employees Provident Fund 5.2
Share Performance (%)
1m 3m 6m 12m
Absolute 12.4 34.5 94.0 212.0
Relative 11.3 33.4 89.8 202.3
The Research Team +603 9207 7668
Investment Merits
The largest provider of ICT training, certification, and software license management and distribution in Malaysia
Recurring income stream from its new UniMy boutique university
New oil & gas (O&G) training academy launched
BUY, MYR4.90 FV, based on 17.5x P/E on FY15F EPS
Company Profile
Prestariang is principally involved in the provision of information and communication technology (ICT) services that focus on professional training and certification, as well as the distribution and management of software licenses. It currently offers more than 50 certification courses from several technology and software providers and organisations, which include Microsoft, IBM, Oracle, Autodesk, the International Council of Electronic Commerce Consultants (EC-Council) and Adobe.
Highlights
Malaysia’s first ICT boutique university. In 2012, Prestariang set up Malaysia’s first boutique university, University Malaysia of Computer Science and Engineering (UniMy), through a Government-led initiative. UniMy focuses on providing specialised computer science and engineering education to meet the country’s demand for ICT-related professions. The university also works closely with industry partners like Microsoft, IBM, Autodesk, EC-Council and Huawei to provide an industry-relevant curriculum coupled with exposure for its students. UniMy is targeting an enrolment of 500 students in FY14 to break even, with its upcoming intake in March. Assuming an average fee of MYR30,000 per student, we believe that this will translate into recurring earnings of MYR15m-20m per annum for the company when UniMy reaches its full capacity of 3,000 students.
Petroleum Academy Malaysia (PAM) is born. Prestariang announced last month that it had entered into a joint venture (JV) with the Johor Education Fund (JEF) to establish PAM in Johor. We are optimistic on this, given that we believe there is a gap to be filled in terms of skilled workers, particularly for the upcoming refinery and petrochemicals integrated development (RAPID) project in the state. We forecast the academy will able to train 2,000 students in FY14 and 3,500 students in FY15. Going forward, we see further growth potential in the industry with Prestariang working closely with the Government and industry players to offer more training and certification programmes.
Profit & Loss Dec-13 Dec-14F Dec-15F
Total turnover (MYRm) 119 181 218
Reported net profit (MYRm) 42 51 62
Recurring net profit (MYRm) 42 51 62
Recurring net profit growth (%) 12.9 20.8 21.1
Recurring EPS (MYR) 0.19 0.23 0.28
DPS (MYR) 0.12 0.12 0.14
Dividend Yield (%) 3.1 3.1 3.6
Recurring P/E (x) 20.39 16.88 13.94
Return on average equity (%) 47.6 46.6 45.0
P/B (x) 8.85 7.07 5.64
P/CF (x) 24.18 19.94 14.80
Source: Company data, , RHB estimates
Balance Sheet (MYRm) Dec-13 Dec-14F Dec-15F
Total current assets 101 127 158
Total assets 116 144 178
Total current liabilities 18 22 25
Total non-current liabilities 1 1 1
Total liabilities 19 23 26
Shareholders' equity 97 121 152
Total equity 97 121 152
Total liabilities & equity 116 144 178
Total debt 1 1 1
Net debt (70) (81) (104)
Source: Company data, , RHB estimates
Cash flow (MYRm) Dec-13 Dec-14F Dec-15F
Cash flow from operations 35 43 58
Cash flow from investing activities (2) (5) (5)
Cash flow from financing activities (27) (26) (31)
Cash at beginning of period 61 45 57
Total cash generated 7 12 22
Forex effects (24) - -
Implied cash at end of period 45 57 79
Source: Company data, RHB estimates
Further development on in-house innovation. To reduce its dependence on external partners for the provision of professional training and certification, Prestariang aims to develop new and innovative in-house training and certification programmes like the IC Citizen (ICC), SmartGreen (SG) and proficiency in enterprise communications (PEC). In 2013, the company launched its new in-house programme called the Green IT certification and training programme. Going forward, we believe that management may consider developing [email protected] to cater to different market segments, following the success of its first ICC programme in 2010. We are positive on Prestariang’s focus and commitment in developing in-house products effectively, which will – in turn – boost margins through its patented rights and serve as a platform for rolling out its regional expansion plan.
Company Report Card
Latest results. Prestariang reported FY13 earnings of MYR42.1m – a record for the company since listing in July 2011. This was in line with our expectations.
Balance sheet/cash flow. Prestariang’s balance sheet is unstressed, with a net cash balance of MYR43.7m or MYR0.19/share. Moving forward, we expect its balance sheet to continue strengthening in tandem with its growth prospects.
ROE. Historically, Prestariang has been delivering double-digit ROEs and we anticipate for it to continue posting strong ROEs in the future, supported by minimal capex requirements and low overhead costs.
Dividend. Given Prestariang’s robust balance sheet and asset-light business model, management has a policy of paying up to 50% of earnings in dividends. It paid out a DPS of 12 sen in FY13, which translated to a 63% dividend payout ratio. We expect the company to distribute a dividend of 12 sen for FY14, which will translate to a decent yield of more than 3%.
Management. The management team is led by founder Dr Abu Hasan Ismail. He holds an effective 36.5% stake and is also the company’s single largest shareholder. Dr Abu started out as an academician and rose to become a professor before being appointed as the first dean of the faculty of creative multimedia at the Multimedia University. He entered the ICT industry in 2000 while continuing to be involved in academic advisory work.
Recommendation
Maintain BUY. We continue to see growth potential for Prestariang in providing training and certification services for the lucrative O&G sector. Other than that, UniMy is expected to contribute to the company’s recurring income, which will, in turn, boost future margins. All in, Prestariang remains the cheapest proxy to the education sector and we continue to see huge potential for the company, given its strong net cash balance sheet and high dividend payout policy. We maintain our BUY recommendation on the stock with our FV of MYR4.90, based on a FY15F earnings P/E of 17.5x.
57Top Malaysia Small Cap Companies 2014
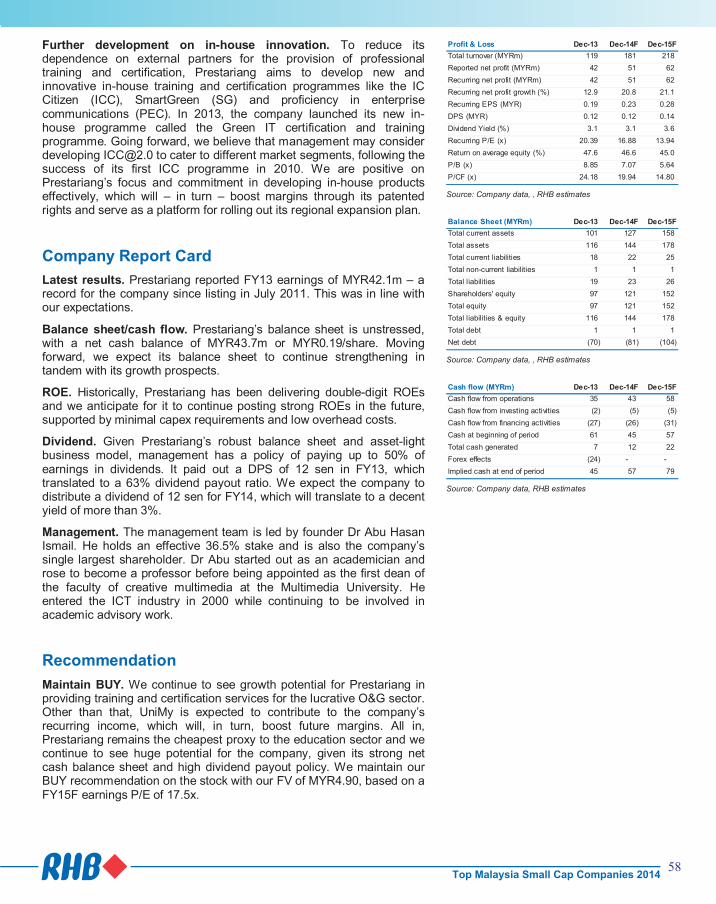
Prestariang Target: MYR4.90
Price: MYR3.90
O&G Training To Propel Growth
69
112
155
198
240
283
326
369
0.8
1.3
1.8
2.3
2.8
3.3
3.8
4.3
Prestariang (PRES MK)Price Close Relative to FTSE Bursa Malaysia KLCI Index (RHS)
2468
101214
Apr-
13
Jun
-13
Aug
-13
Oct
-13
Dec-1
3
Feb
-14
Vol m
Source: Bloomberg
Stock Profile
Bloomberg Ticker PRES MK
Avg Turnover (MYR/USD) 2.51m/0.76m
Net Gearing (%) -67.1
Market Cap (MYRm) 858m
Beta (x) 1.60
BVPS (MYR) 0.55
52-wk Price low/high (MYR) 1.16 - 3.98
Free float (%) 45
Major Shareholders (%)
Dr Abu Hasan Ismail 36.5
Kumpulan Modal Perdana 6.3
Employees Provident Fund 5.2
Share Performance (%)
1m 3m 6m 12m
Absolute 12.4 34.5 94.0 212.0
Relative 11.3 33.4 89.8 202.3
The Research Team +603 9207 7668
Investment Merits
The largest provider of ICT training, certification, and software license management and distribution in Malaysia
Recurring income stream from its new UniMy boutique university
New oil & gas (O&G) training academy launched
BUY, MYR4.90 FV, based on 17.5x P/E on FY15F EPS
Company Profile
Prestariang is principally involved in the provision of information and communication technology (ICT) services that focus on professional training and certification, as well as the distribution and management of software licenses. It currently offers more than 50 certification courses from several technology and software providers and organisations, which include Microsoft, IBM, Oracle, Autodesk, the International Council of Electronic Commerce Consultants (EC-Council) and Adobe.
Highlights
Malaysia’s first ICT boutique university. In 2012, Prestariang set up Malaysia’s first boutique university, University Malaysia of Computer Science and Engineering (UniMy), through a Government-led initiative. UniMy focuses on providing specialised computer science and engineering education to meet the country’s demand for ICT-related professions. The university also works closely with industry partners like Microsoft, IBM, Autodesk, EC-Council and Huawei to provide an industry-relevant curriculum coupled with exposure for its students. UniMy is targeting an enrolment of 500 students in FY14 to break even, with its upcoming intake in March. Assuming an average fee of MYR30,000 per student, we believe that this will translate into recurring earnings of MYR15m-20m per annum for the company when UniMy reaches its full capacity of 3,000 students.
Petroleum Academy Malaysia (PAM) is born. Prestariang announced last month that it had entered into a joint venture (JV) with the Johor Education Fund (JEF) to establish PAM in Johor. We are optimistic on this, given that we believe there is a gap to be filled in terms of skilled workers, particularly for the upcoming refinery and petrochemicals integrated development (RAPID) project in the state. We forecast the academy will able to train 2,000 students in FY14 and 3,500 students in FY15. Going forward, we see further growth potential in the industry with Prestariang working closely with the Government and industry players to offer more training and certification programmes.
Profit & Loss Dec-13 Dec-14F Dec-15F
Total turnover (MYRm) 119 181 218
Reported net profit (MYRm) 42 51 62
Recurring net profit (MYRm) 42 51 62
Recurring net profit growth (%) 12.9 20.8 21.1
Recurring EPS (MYR) 0.19 0.23 0.28
DPS (MYR) 0.12 0.12 0.14
Dividend Yield (%) 3.1 3.1 3.6
Recurring P/E (x) 20.39 16.88 13.94
Return on average equity (%) 47.6 46.6 45.0
P/B (x) 8.85 7.07 5.64
P/CF (x) 24.18 19.94 14.80
Source: Company data, , RHB estimates
Balance Sheet (MYRm) Dec-13 Dec-14F Dec-15F
Total current assets 101 127 158
Total assets 116 144 178
Total current liabilities 18 22 25
Total non-current liabilities 1 1 1
Total liabilities 19 23 26
Shareholders' equity 97 121 152
Total equity 97 121 152
Total liabilities & equity 116 144 178
Total debt 1 1 1
Net debt (70) (81) (104)
Source: Company data, , RHB estimates
Cash flow (MYRm) Dec-13 Dec-14F Dec-15F
Cash flow from operations 35 43 58
Cash flow from investing activities (2) (5) (5)
Cash flow from financing activities (27) (26) (31)
Cash at beginning of period 61 45 57
Total cash generated 7 12 22
Forex effects (24) - -
Implied cash at end of period 45 57 79
Source: Company data, RHB estimates
Further development on in-house innovation. To reduce its dependence on external partners for the provision of professional training and certification, Prestariang aims to develop new and innovative in-house training and certification programmes like the IC Citizen (ICC), SmartGreen (SG) and proficiency in enterprise communications (PEC). In 2013, the company launched its new in-house programme called the Green IT certification and training programme. Going forward, we believe that management may consider developing [email protected] to cater to different market segments, following the success of its first ICC programme in 2010. We are positive on Prestariang’s focus and commitment in developing in-house products effectively, which will – in turn – boost margins through its patented rights and serve as a platform for rolling out its regional expansion plan.
Company Report Card
Latest results. Prestariang reported FY13 earnings of MYR42.1m – a record for the company since listing in July 2011. This was in line with our expectations.
Balance sheet/cash flow. Prestariang’s balance sheet is unstressed, with a net cash balance of MYR43.7m or MYR0.19/share. Moving forward, we expect its balance sheet to continue strengthening in tandem with its growth prospects.
ROE. Historically, Prestariang has been delivering double-digit ROEs and we anticipate for it to continue posting strong ROEs in the future, supported by minimal capex requirements and low overhead costs.
Dividend. Given Prestariang’s robust balance sheet and asset-light business model, management has a policy of paying up to 50% of earnings in dividends. It paid out a DPS of 12 sen in FY13, which translated to a 63% dividend payout ratio. We expect the company to distribute a dividend of 12 sen for FY14, which will translate to a decent yield of more than 3%.
Management. The management team is led by founder Dr Abu Hasan Ismail. He holds an effective 36.5% stake and is also the company’s single largest shareholder. Dr Abu started out as an academician and rose to become a professor before being appointed as the first dean of the faculty of creative multimedia at the Multimedia University. He entered the ICT industry in 2000 while continuing to be involved in academic advisory work.
Recommendation
Maintain BUY. We continue to see growth potential for Prestariang in providing training and certification services for the lucrative O&G sector. Other than that, UniMy is expected to contribute to the company’s recurring income, which will, in turn, boost future margins. All in, Prestariang remains the cheapest proxy to the education sector and we continue to see huge potential for the company, given its strong net cash balance sheet and high dividend payout policy. We maintain our BUY recommendation on the stock with our FV of MYR4.90, based on a FY15F earnings P/E of 17.5x.
58Top Malaysia Small Cap Companies 2014
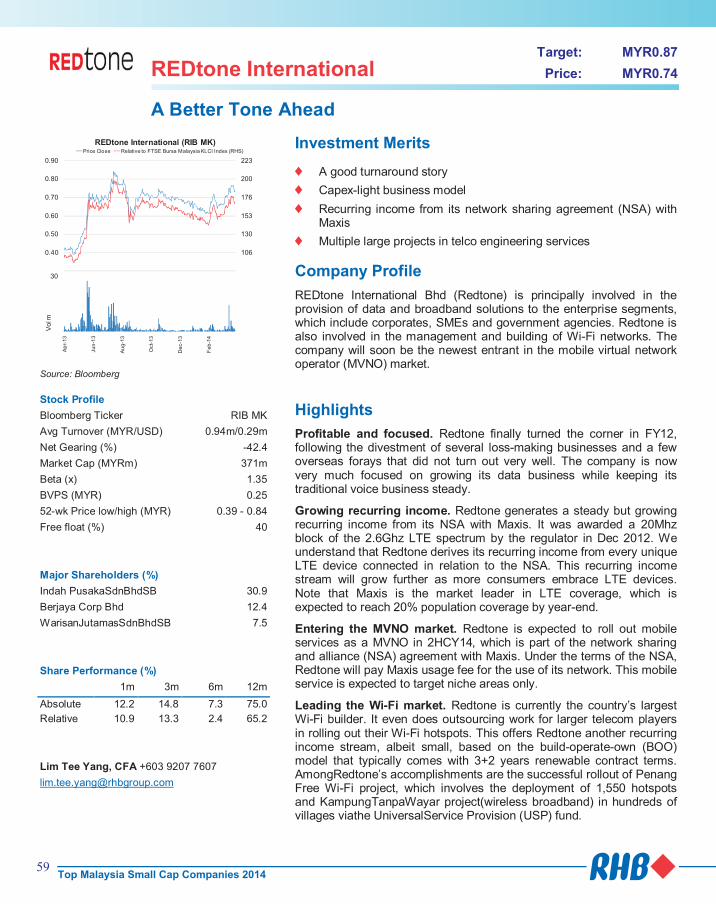
REDtone International Target: MYR0.87
Price: MYR0.74
A Better Tone Ahead
Source: Bloomberg
Stock Profile
Bloomberg Ticker RIB MK
Avg Turnover (MYR/USD) 0.94m/0.29m
Net Gearing (%) -42.4
Market Cap (MYRm) 371m
Beta (x) 1.35
BVPS (MYR) 0.25
52-wk Price low/high (MYR) 0.39 - 0.84
Free float (%) 40
Major Shareholders (%)
Indah PusakaSdnBhdSB 30.9
Berjaya Corp Bhd 12.4
WarisanJutamasSdnBhdSB 7.5
Share Performance (%)
1m 3m 6m 12m
Absolute 12.2 14.8 7.3 75.0
Relative 10.9 13.3 2.4 65.2
Lim Tee Yang, CFA +603 9207 7607
83
106
130
153
176
200
223
0.30
0.40
0.50
0.60
0.70
0.80
0.90
REDtone International (RIB MK)Price Close Relative to FTSE Bursa Malaysia KLCI Index (RHS)
5
10
15
20
25
30
Ap
r-13
Jun
-13
Au
g-1
3
Oct-
13
Dec-1
3
Feb
-14
Vol m
Investment Merits
A good turnaround story
Capex-light business model
Recurring income from its network sharing agreement (NSA) with Maxis
Multiple large projects in telco engineering services
Company Profile
REDtone International Bhd (Redtone) is principally involved in the provision of data and broadband solutions to the enterprise segments, which include corporates, SMEs and government agencies. Redtone is also involved in the management and building of Wi-Fi networks. The company will soon be the newest entrant in the mobile virtual network operator (MVNO) market.
Highlights
Profitable and focused. Redtone finally turned the corner in FY12, following the divestment of several loss-making businesses and a few overseas forays that did not turn out very well. The company is now very much focused on growing its data business while keeping its traditional voice business steady.
Growing recurring income. Redtone generates a steady but growing recurring income from its NSA with Maxis. It was awarded a 20Mhz block of the 2.6Ghz LTE spectrum by the regulator in Dec 2012. We understand that Redtone derives its recurring income from every unique LTE device connected in relation to the NSA. This recurring income stream will grow further as more consumers embrace LTE devices. Note that Maxis is the market leader in LTE coverage, which is expected to reach 20% population coverage by year-end.
Entering the MVNO market. Redtone is expected to roll out mobile services as a MVNO in 2HCY14, which is part of the network sharing and alliance (NSA) agreement with Maxis. Under the terms of the NSA, Redtone will pay Maxis usage fee for the use of its network. This mobile service is expected to target niche areas only.
Leading the Wi-Fi market. Redtone is currently the country’s largest Wi-Fi builder. It even does outsourcing work for larger telecom players in rolling out their Wi-Fi hotspots. This offers Redtone another recurring income stream, albeit small, based on the build-operate-own (BOO) model that typically comes with 3+2 years renewable contract terms. AmongRedtone’s accomplishments are the successful rollout of Penang Free Wi-Fi project, which involves the deployment of 1,550 hotspots and KampungTanpaWayar project(wireless broadband) in hundreds of villages viathe UniversalService Provision (USP) fund.
Source: Company data, RHB estimates
Source: Company data, RHB estimates
Source: Company data, RHB estimates
Profit & Loss May-13 May-14F May-15F
Total turnover (MYRm) 142 153 161
Reported net profit (MYRm) 25 28 29
Recurring net profit (MYRm) 25 28 29
Recurring net profit growth (%) 1,068.0 13.0 3.7
Recurring EPS (MYR) 0.05 0.06 0.06
Recurring P/E (x) 14.04 13.14 12.66
Return on average equity (%) 27.0 24.4 21.3
P/B (x) 3.33 2.93 2.50
P/CF (x) 21.66 10.98 10.65
Balance Sheet (MYRm) May-13 May-14F May-15F
Total current assets 116 149 183
Total assets 203 240 275
Total current liabilities 84 100 113
Total non-current liabilities 5 5 5
Total liabilities 90 105 118
Shareholders' equity 106 127 149
Minority interests 7 7 7
Other equity - (0) (0)
Total equity 113 134 156
Total liabilities & equity 203 240 275
Total debt 5 5 5
Net debt (32) (57) (87)
Cash flow (MYRm) May-13 May-14F May-15F
Cash flow from operations 16 34 35
Cash flow from investing activities (0) (5) (5)
Cash flow from financing activities (2) - -
Cash at beginning of period 22 37 62
Total cash generated 14 29 30
Forex effects 1 (3) -
Implied cash at end of period 37 62 92
An eye on the mobile basestation or RANmarket. Redtone is no stranger to the telco infra engineering servicesbusiness, having been awarded a MYR82.5m contract from the regulator in 4Q12 to build, operate and maintain the radio access network (RAN) infrastructure in rural areas within Sabah. We understand that management is keen to win a slice of the 1,000 towers/base stations expected to be predominantly rolled out in Sabah and Sarawak.
Company Report Card
Latest results. Redtone’s 2HFY14 revenue rose 16.1% on the back of stronger revenue contribution from its data and broadband business. Its 2HFY14 earnings grew at a faster pace of 62.0%, although this was due to a net gain of MYR5m booked in 2QFY14from the disposal of an associate company.
Balance sheet/cash flow. As at 2QFY14, Redtone had minimal gearing, with a gross debt/equity ratio of just 0.02x. In fact, the company is in a net cash position of MYR6m. Redtone’s under-leveraged balance sheet offers ample room to gear up to expand its data and broadband business, as well as tap into any other opportunities that may arise.
ROE. 2QFY14 ROE stood at 8.4%, representing a 2.7ppts improvement from 2QFY13’s 5.7%. With ample room to gear up and little need to raise new equity funds, we believe there is more room for its ROE to improve.
Dividend. With Redtone back in the black and its capex expected to remain fairly stable in the MYR5m-10m per annum range, management has in place a 25% minimum payoutdividend policy. For FY13, management declared a DPS of 1.5 sen, which translated into a 28.5% payout ratio. With improving cash flow, we believe there is upside to Redtone’s future dividend payout.
Management. Managing director Dato’ Wei ChuanBeng helms the company and is responsible for its growth, development, transformation and strategic direction. He holds a 5.5% direct stake in Redtone.
Recommendation
Our valuation is MYR0.87, based on 15x FY15 EPS of 5.8 sen. Our target P/E is at a 25% discount to the large-cap telecom sector average of 20x due to Redtone’s significantly smaller scale of operations.
59Top Malaysia Small Cap Companies 2014
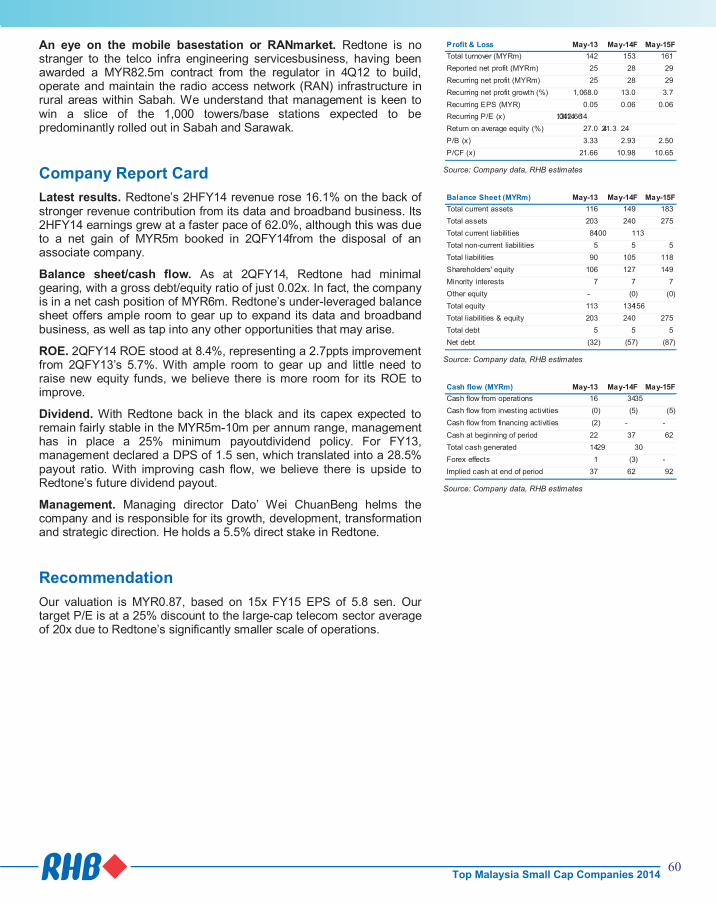
REDtone International Target: MYR0.87
Price: MYR0.74
A Better Tone Ahead
Source: Bloomberg
Stock Profile
Bloomberg Ticker RIB MK
Avg Turnover (MYR/USD) 0.94m/0.29m
Net Gearing (%) -42.4
Market Cap (MYRm) 371m
Beta (x) 1.35
BVPS (MYR) 0.25
52-wk Price low/high (MYR) 0.39 - 0.84
Free float (%) 40
Major Shareholders (%)
Indah PusakaSdnBhdSB 30.9
Berjaya Corp Bhd 12.4
WarisanJutamasSdnBhdSB 7.5
Share Performance (%)
1m 3m 6m 12m
Absolute 12.2 14.8 7.3 75.0
Relative 10.9 13.3 2.4 65.2
Lim Tee Yang, CFA +603 9207 7607
83
106
130
153
176
200
223
0.30
0.40
0.50
0.60
0.70
0.80
0.90
REDtone International (RIB MK)Price Close Relative to FTSE Bursa Malaysia KLCI Index (RHS)
5
10
15
20
25
30
Ap
r-13
Jun
-13
Au
g-1
3
Oct-
13
Dec-1
3
Feb
-14
Vol m
Investment Merits
A good turnaround story
Capex-light business model
Recurring income from its network sharing agreement (NSA) with Maxis
Multiple large projects in telco engineering services
Company Profile
REDtone International Bhd (Redtone) is principally involved in the provision of data and broadband solutions to the enterprise segments, which include corporates, SMEs and government agencies. Redtone is also involved in the management and building of Wi-Fi networks. The company will soon be the newest entrant in the mobile virtual network operator (MVNO) market.
Highlights
Profitable and focused. Redtone finally turned the corner in FY12, following the divestment of several loss-making businesses and a few overseas forays that did not turn out very well. The company is now very much focused on growing its data business while keeping its traditional voice business steady.
Growing recurring income. Redtone generates a steady but growing recurring income from its NSA with Maxis. It was awarded a 20Mhz block of the 2.6Ghz LTE spectrum by the regulator in Dec 2012. We understand that Redtone derives its recurring income from every unique LTE device connected in relation to the NSA. This recurring income stream will grow further as more consumers embrace LTE devices. Note that Maxis is the market leader in LTE coverage, which is expected to reach 20% population coverage by year-end.
Entering the MVNO market. Redtone is expected to roll out mobile services as a MVNO in 2HCY14, which is part of the network sharing and alliance (NSA) agreement with Maxis. Under the terms of the NSA, Redtone will pay Maxis usage fee for the use of its network. This mobile service is expected to target niche areas only.
Leading the Wi-Fi market. Redtone is currently the country’s largest Wi-Fi builder. It even does outsourcing work for larger telecom players in rolling out their Wi-Fi hotspots. This offers Redtone another recurring income stream, albeit small, based on the build-operate-own (BOO) model that typically comes with 3+2 years renewable contract terms. AmongRedtone’s accomplishments are the successful rollout of Penang Free Wi-Fi project, which involves the deployment of 1,550 hotspots and KampungTanpaWayar project(wireless broadband) in hundreds of villages viathe UniversalService Provision (USP) fund.
Source: Company data, RHB estimates
Source: Company data, RHB estimates
Source: Company data, RHB estimates
Profit & Loss May-13 May-14F May-15F
Total turnover (MYRm) 142 153 161
Reported net profit (MYRm) 25 28 29
Recurring net profit (MYRm) 25 28 29
Recurring net profit growth (%) 1,068.0 13.0 3.7
Recurring EPS (MYR) 0.05 0.06 0.06
Recurring P/E (x) 14.04 13.14 12.66
Return on average equity (%) 27.0 24.4 21.3
P/B (x) 3.33 2.93 2.50
P/CF (x) 21.66 10.98 10.65
Balance Sheet (MYRm) May-13 May-14F May-15F
Total current assets 116 149 183
Total assets 203 240 275
Total current liabilities 84 100 113
Total non-current liabilities 5 5 5
Total liabilities 90 105 118
Shareholders' equity 106 127 149
Minority interests 7 7 7
Other equity - (0) (0)
Total equity 113 134 156
Total liabilities & equity 203 240 275
Total debt 5 5 5
Net debt (32) (57) (87)
Cash flow (MYRm) May-13 May-14F May-15F
Cash flow from operations 16 34 35
Cash flow from investing activities (0) (5) (5)
Cash flow from financing activities (2) - -
Cash at beginning of period 22 37 62
Total cash generated 14 29 30
Forex effects 1 (3) -
Implied cash at end of period 37 62 92
An eye on the mobile basestation or RANmarket. Redtone is no stranger to the telco infra engineering servicesbusiness, having been awarded a MYR82.5m contract from the regulator in 4Q12 to build, operate and maintain the radio access network (RAN) infrastructure in rural areas within Sabah. We understand that management is keen to win a slice of the 1,000 towers/base stations expected to be predominantly rolled out in Sabah and Sarawak.
Company Report Card
Latest results. Redtone’s 2HFY14 revenue rose 16.1% on the back of stronger revenue contribution from its data and broadband business. Its 2HFY14 earnings grew at a faster pace of 62.0%, although this was due to a net gain of MYR5m booked in 2QFY14from the disposal of an associate company.
Balance sheet/cash flow. As at 2QFY14, Redtone had minimal gearing, with a gross debt/equity ratio of just 0.02x. In fact, the company is in a net cash position of MYR6m. Redtone’s under-leveraged balance sheet offers ample room to gear up to expand its data and broadband business, as well as tap into any other opportunities that may arise.
ROE. 2QFY14 ROE stood at 8.4%, representing a 2.7ppts improvement from 2QFY13’s 5.7%. With ample room to gear up and little need to raise new equity funds, we believe there is more room for its ROE to improve.
Dividend. With Redtone back in the black and its capex expected to remain fairly stable in the MYR5m-10m per annum range, management has in place a 25% minimum payoutdividend policy. For FY13, management declared a DPS of 1.5 sen, which translated into a 28.5% payout ratio. With improving cash flow, we believe there is upside to Redtone’s future dividend payout.
Management. Managing director Dato’ Wei ChuanBeng helms the company and is responsible for its growth, development, transformation and strategic direction. He holds a 5.5% direct stake in Redtone.
Recommendation
Our valuation is MYR0.87, based on 15x FY15 EPS of 5.8 sen. Our target P/E is at a 25% discount to the large-cap telecom sector average of 20x due to Redtone’s significantly smaller scale of operations.
60Top Malaysia Small Cap Companies 2014
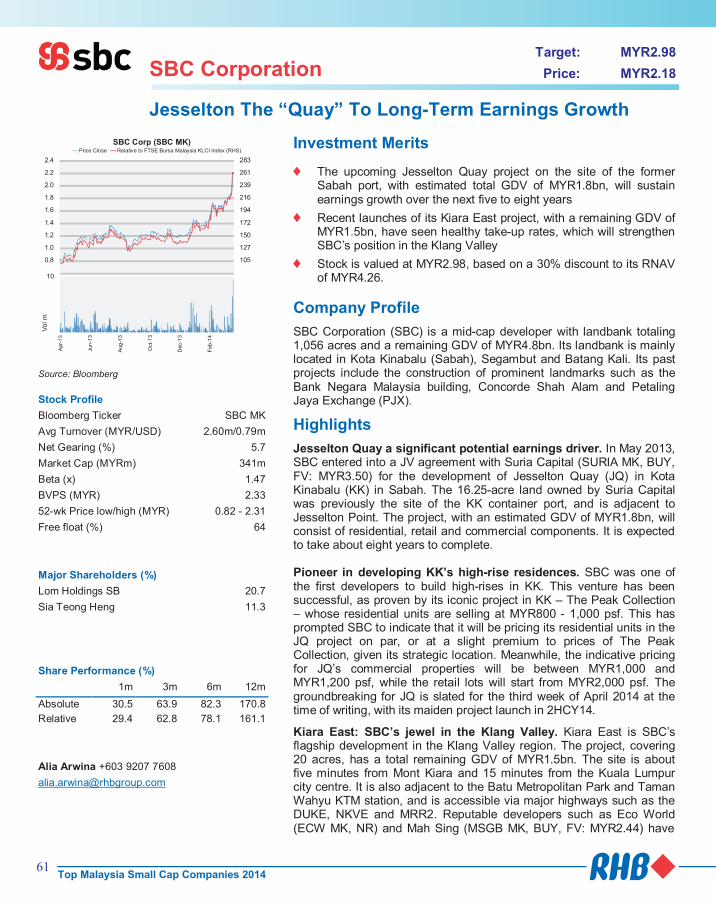
SBC Corporation Target: MYR2.98
Price: MYR2.18
Jesselton The “Quay” To Long-Term Earnings Growth
83
105
127
150
172
194
216
239
261
283
0.6
0.8
1.0
1.2
1.4
1.6
1.8
2.0
2.2
2.4
SBC Corp (SBC MK)Price Close Relative to FTSE Bursa Malaysia KLCI Index (RHS)
2
4
6
8
10
Apr-
13
Jun
-13
Aug
-13
Oct
-13
Dec-1
3
Feb
-14
Vol m
Source: Bloomberg
Stock Profile
Bloomberg Ticker SBC MK
Avg Turnover (MYR/USD) 2.60m/0.79m
Net Gearing (%) 5.7
Market Cap (MYRm) 341m
Beta (x) 1.47
BVPS (MYR) 2.33
52-wk Price low/high (MYR) 0.82 - 2.31
Free float (%) 64
Major Shareholders (%)
Lom Holdings SB 20.7
Sia Teong Heng 11.3
Share Performance (%)
1m 3m 6m 12m
Absolute 30.5 63.9 82.3 170.8
Relative 29.4 62.8 78.1 161.1
Alia Arwina +603 9207 7608
Investment Merits
The upcoming Jesselton Quay project on the site of the former Sabah port, with estimated total GDV of MYR1.8bn, will sustain earnings growth over the next five to eight years
Recent launches of its Kiara East project, with a remaining GDV of MYR1.5bn, have seen healthy take-up rates, which will strengthen SBC’s position in the Klang Valley
Stock is valued at MYR2.98, based on a 30% discount to its RNAV of MYR4.26.
Company Profile
SBC Corporation (SBC) is a mid-cap developer with landbank totaling 1,056 acres and a remaining GDV of MYR4.8bn. Its landbank is mainly located in Kota Kinabalu (Sabah), Segambut and Batang Kali. Its past projects include the construction of prominent landmarks such as the Bank Negara Malaysia building, Concorde Shah Alam and Petaling Jaya Exchange (PJX).
Highlights
Jesselton Quay a significant potential earnings driver. In May 2013, SBC entered into a JV agreement with Suria Capital (SURIA MK, BUY, FV: MYR3.50) for the development of Jesselton Quay (JQ) in Kota Kinabalu (KK) in Sabah. The 16.25-acre land owned by Suria Capital was previously the site of the KK container port, and is adjacent to Jesselton Point. The project, with an estimated GDV of MYR1.8bn, will consist of residential, retail and commercial components. It is expected to take about eight years to complete. Pioneer in developing KK’s high-rise residences. SBC was one of the first developers to build high-rises in KK. This venture has been successful, as proven by its iconic project in KK – The Peak Collection – whose residential units are selling at MYR800 - 1,000 psf. This has prompted SBC to indicate that it will be pricing its residential units in the JQ project on par, or at a slight premium to prices of The Peak Collection, given its strategic location. Meanwhile, the indicative pricing for JQ’s commercial properties will be between MYR1,000 and MYR1,200 psf, while the retail lots will start from MYR2,000 psf. The groundbreaking for JQ is slated for the third week of April 2014 at the time of writing, with its maiden project launch in 2HCY14.
Kiara East: SBC’s jewel in the Klang Valley. Kiara East is SBC’s flagship development in the Klang Valley region. The project, covering 20 acres, has a total remaining GDV of MYR1.5bn. The site is about five minutes from Mont Kiara and 15 minutes from the Kuala Lumpur city centre. It is also adjacent to the Batu Metropolitan Park and Taman Wahyu KTM station, and is accessible via major highways such as the DUKE, NKVE and MRR2. Reputable developers such as Eco World (ECW MK, NR) and Mah Sing (MSGB MK, BUY, FV: MYR2.44) have
Profit & Loss Mar-12 Mar-13 Mar-14F
Total turnover (MYRm) 154 127 150
Reported net profit (MYRm) 23 27 34
Recurring net profit (MYRm) 23 27 34
Recurring net profit growth (%) 72.4 18.0 26.3
Recurring EPS (MYR) 0.28 0.32 0.32
DPS (MYR) 0.03 0.04 0.06
Dividend Yield (%) 1.2 1.8 2.9
Recurring P/E (x) 7.92 6.72 6.91
Return on average equity (%) 9.0 9.7 10.3
P/B (x) 0.68 0.62 0.93
P/CF (x) 2.85 11.36 14.47
Source: Company data, RHB estimates
Balance Sheet (MYRm) Mar-12 Mar-13 Mar-14F
Total current assets 152 184 275
Total assets 416 459 558
Total current liabilities 100 121 139
Total non-current liabilities 53 50 53
Total liabilities 153 170 193
Shareholders' equity 263 289 366
Minority interests 0 0 0
Other equity 0 0 0
Total equity 263 289 366
Total liabilities & equity 416 459 558
Total debt 86 75 92
Net debt 77 68 21
Source: Company data, RHB estimates
Cash flow (MYRm) Mar-12 Mar-13 Mar-14F
Cash flow from operations 63 16 16
Cash flow from investing activities (53) (15) (9)
Cash flow from financing activities (3) (9) 40
Cash at beginning of period 7 8 7
Total cash generated 7 (8) 47
Implied cash at end of period 14 0 54
Source: Company data, RHB estimates
also recently ventured into the area at higher land costs. SBC’s development will comprise condo-styled suites, retail lots and park front villas. In FY14, SBC launched two new projects with a total GDV of about MYR544m, which are: i) the Dex Suites (GDV: MYR544m); and ii) some retail space worth MYR200m. The take-up rates have been relatively strong, with Dex Tower A being fully taken up while Dex Tower B (launched in February) saw a decent take-up rate of 30%.
Other projects. SBC’s other sizeable projects include a landed affordable housing development project in Batang Kali, which has a remaining landbank of 1,000 acres and carries a future GDV of MYR500m. The units are priced at MYR200,000 to MYR400,000 each, depending on the size. The new phases have been fully sold. SBC also has smaller projects such as Cantonment Exchange in Jalan Ipoh, Kuala Lumpur (GDV: MYR200m) and 20 acres of undeveloped landbank in Kuantan.
Company Report Card
Latest results. SBC’s 3QFY14 earnings were strong, with 9M net profit surging 54.4% y-o-y, driven by progress billings from The Peak Soho in Kota Kinabalu and the Dex Suites in Kiara East. We expect similar results for 4QFY14, attributable to increasing contributions from these two projects. The company will likely maintain its growth momentum going into FY15, underpinned by contributions from Kiara East, Batang Kali as well as JQ’s possible maiden contribution.
Balance sheet/cash flow. SBC’s net gearing currently stands at a decent 0.24x, but we expect this to go up once works on JQ get underway. Its management has set a conservative gearing cap of about 0.5x.
ROE. ROE is expected to pick up gradually only from FY15 onwards, as more earnings from property projects such as Phase 1 of JQ start to kick in.
Dividend. On 18 Feb 2014, SBC announced that, going forward, it will be paying out at least 20% of its net profit as dividend every financial year. As such, we estimate a dividend of 6.3 sen for FY14 and 5.4 sen for FY15, translating into a yield of 2-3%.
Management. SBC’s management is spearheaded by Managing Director Sia Teong Heng, who has been with SBC since 1991. Given the success of recent projects such as The Peak Collection, Mr Sia has the necessary track record, capabilities and expertise to propel SBC’s growth going forward.
Recommendation
We value SBC at MYR2.98, based on a 30% discount to its RNAV of MYR4.26. This implies an upside of more than 30% from the current share price. We have conservatively applied a wider discount to RNAV for SBC vs some of its peers as its future earnings largely hinge on the success of its JQ project.
61Top Malaysia Small Cap Companies 2014

SBC Corporation Target: MYR2.98
Price: MYR2.18
Jesselton The “Quay” To Long-Term Earnings Growth
83
105
127
150
172
194
216
239
261
283
0.6
0.8
1.0
1.2
1.4
1.6
1.8
2.0
2.2
2.4
SBC Corp (SBC MK)Price Close Relative to FTSE Bursa Malaysia KLCI Index (RHS)
2
4
6
8
10
Apr-
13
Jun
-13
Aug
-13
Oct
-13
Dec-1
3
Feb
-14
Vol m
Source: Bloomberg
Stock Profile
Bloomberg Ticker SBC MK
Avg Turnover (MYR/USD) 2.60m/0.79m
Net Gearing (%) 5.7
Market Cap (MYRm) 341m
Beta (x) 1.47
BVPS (MYR) 2.33
52-wk Price low/high (MYR) 0.82 - 2.31
Free float (%) 64
Major Shareholders (%)
Lom Holdings SB 20.7
Sia Teong Heng 11.3
Share Performance (%)
1m 3m 6m 12m
Absolute 30.5 63.9 82.3 170.8
Relative 29.4 62.8 78.1 161.1
Alia Arwina +603 9207 7608
Investment Merits
The upcoming Jesselton Quay project on the site of the former Sabah port, with estimated total GDV of MYR1.8bn, will sustain earnings growth over the next five to eight years
Recent launches of its Kiara East project, with a remaining GDV of MYR1.5bn, have seen healthy take-up rates, which will strengthen SBC’s position in the Klang Valley
Stock is valued at MYR2.98, based on a 30% discount to its RNAV of MYR4.26.
Company Profile
SBC Corporation (SBC) is a mid-cap developer with landbank totaling 1,056 acres and a remaining GDV of MYR4.8bn. Its landbank is mainly located in Kota Kinabalu (Sabah), Segambut and Batang Kali. Its past projects include the construction of prominent landmarks such as the Bank Negara Malaysia building, Concorde Shah Alam and Petaling Jaya Exchange (PJX).
Highlights
Jesselton Quay a significant potential earnings driver. In May 2013, SBC entered into a JV agreement with Suria Capital (SURIA MK, BUY, FV: MYR3.50) for the development of Jesselton Quay (JQ) in Kota Kinabalu (KK) in Sabah. The 16.25-acre land owned by Suria Capital was previously the site of the KK container port, and is adjacent to Jesselton Point. The project, with an estimated GDV of MYR1.8bn, will consist of residential, retail and commercial components. It is expected to take about eight years to complete. Pioneer in developing KK’s high-rise residences. SBC was one of the first developers to build high-rises in KK. This venture has been successful, as proven by its iconic project in KK – The Peak Collection – whose residential units are selling at MYR800 - 1,000 psf. This has prompted SBC to indicate that it will be pricing its residential units in the JQ project on par, or at a slight premium to prices of The Peak Collection, given its strategic location. Meanwhile, the indicative pricing for JQ’s commercial properties will be between MYR1,000 and MYR1,200 psf, while the retail lots will start from MYR2,000 psf. The groundbreaking for JQ is slated for the third week of April 2014 at the time of writing, with its maiden project launch in 2HCY14.
Kiara East: SBC’s jewel in the Klang Valley. Kiara East is SBC’s flagship development in the Klang Valley region. The project, covering 20 acres, has a total remaining GDV of MYR1.5bn. The site is about five minutes from Mont Kiara and 15 minutes from the Kuala Lumpur city centre. It is also adjacent to the Batu Metropolitan Park and Taman Wahyu KTM station, and is accessible via major highways such as the DUKE, NKVE and MRR2. Reputable developers such as Eco World (ECW MK, NR) and Mah Sing (MSGB MK, BUY, FV: MYR2.44) have
Profit & Loss Mar-12 Mar-13 Mar-14F
Total turnover (MYRm) 154 127 150
Reported net profit (MYRm) 23 27 34
Recurring net profit (MYRm) 23 27 34
Recurring net profit growth (%) 72.4 18.0 26.3
Recurring EPS (MYR) 0.28 0.32 0.32
DPS (MYR) 0.03 0.04 0.06
Dividend Yield (%) 1.2 1.8 2.9
Recurring P/E (x) 7.92 6.72 6.91
Return on average equity (%) 9.0 9.7 10.3
P/B (x) 0.68 0.62 0.93
P/CF (x) 2.85 11.36 14.47
Source: Company data, RHB estimates
Balance Sheet (MYRm) Mar-12 Mar-13 Mar-14F
Total current assets 152 184 275
Total assets 416 459 558
Total current liabilities 100 121 139
Total non-current liabilities 53 50 53
Total liabilities 153 170 193
Shareholders' equity 263 289 366
Minority interests 0 0 0
Other equity 0 0 0
Total equity 263 289 366
Total liabilities & equity 416 459 558
Total debt 86 75 92
Net debt 77 68 21
Source: Company data, RHB estimates
Cash flow (MYRm) Mar-12 Mar-13 Mar-14F
Cash flow from operations 63 16 16
Cash flow from investing activities (53) (15) (9)
Cash flow from financing activities (3) (9) 40
Cash at beginning of period 7 8 7
Total cash generated 7 (8) 47
Implied cash at end of period 14 0 54
Source: Company data, RHB estimates
also recently ventured into the area at higher land costs. SBC’s development will comprise condo-styled suites, retail lots and park front villas. In FY14, SBC launched two new projects with a total GDV of about MYR544m, which are: i) the Dex Suites (GDV: MYR544m); and ii) some retail space worth MYR200m. The take-up rates have been relatively strong, with Dex Tower A being fully taken up while Dex Tower B (launched in February) saw a decent take-up rate of 30%.
Other projects. SBC’s other sizeable projects include a landed affordable housing development project in Batang Kali, which has a remaining landbank of 1,000 acres and carries a future GDV of MYR500m. The units are priced at MYR200,000 to MYR400,000 each, depending on the size. The new phases have been fully sold. SBC also has smaller projects such as Cantonment Exchange in Jalan Ipoh, Kuala Lumpur (GDV: MYR200m) and 20 acres of undeveloped landbank in Kuantan.
Company Report Card
Latest results. SBC’s 3QFY14 earnings were strong, with 9M net profit surging 54.4% y-o-y, driven by progress billings from The Peak Soho in Kota Kinabalu and the Dex Suites in Kiara East. We expect similar results for 4QFY14, attributable to increasing contributions from these two projects. The company will likely maintain its growth momentum going into FY15, underpinned by contributions from Kiara East, Batang Kali as well as JQ’s possible maiden contribution.
Balance sheet/cash flow. SBC’s net gearing currently stands at a decent 0.24x, but we expect this to go up once works on JQ get underway. Its management has set a conservative gearing cap of about 0.5x.
ROE. ROE is expected to pick up gradually only from FY15 onwards, as more earnings from property projects such as Phase 1 of JQ start to kick in.
Dividend. On 18 Feb 2014, SBC announced that, going forward, it will be paying out at least 20% of its net profit as dividend every financial year. As such, we estimate a dividend of 6.3 sen for FY14 and 5.4 sen for FY15, translating into a yield of 2-3%.
Management. SBC’s management is spearheaded by Managing Director Sia Teong Heng, who has been with SBC since 1991. Given the success of recent projects such as The Peak Collection, Mr Sia has the necessary track record, capabilities and expertise to propel SBC’s growth going forward.
Recommendation
We value SBC at MYR2.98, based on a 30% discount to its RNAV of MYR4.26. This implies an upside of more than 30% from the current share price. We have conservatively applied a wider discount to RNAV for SBC vs some of its peers as its future earnings largely hinge on the success of its JQ project.
62Top Malaysia Small Cap Companies 2014
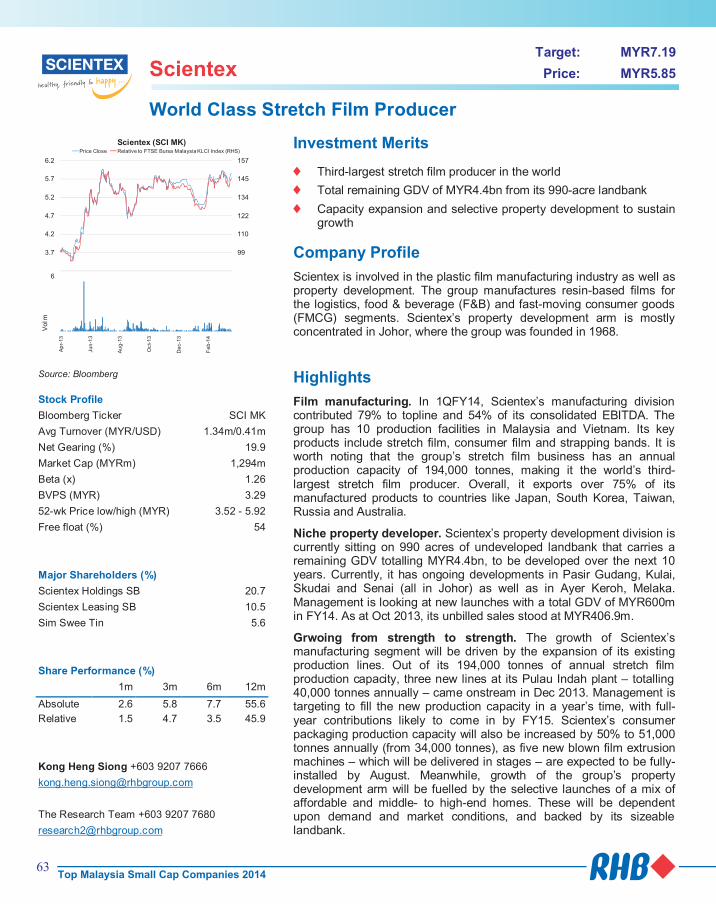
Scientex Target: MYR7.19
Price: MYR5.85
World Class Stretch Film Producer
87
99
110
122
134
145
157
3.2
3.7
4.2
4.7
5.2
5.7
6.2
Scientex (SCI MK)Price Close Relative to FTSE Bursa Malaysia KLCI Index (RHS)
1
2
3
4
5
6
Ap
r-13
Jun
-13
Au
g-1
3
Oct-
13
Dec-1
3
Feb
-14
Vol m
Source: Bloomberg
Stock Profile
Bloomberg Ticker SCI MK
Avg Turnover (MYR/USD) 1.34m/0.41m
Net Gearing (%) 19.9
Market Cap (MYRm) 1,294m
Beta (x) 1.26
BVPS (MYR) 3.29
52-wk Price low/high (MYR) 3.52 - 5.92
Free float (%) 54
Major Shareholders (%)
Scientex Holdings SB 20.7
Scientex Leasing SB 10.5
Sim Swee Tin 5.6
Share Performance (%)
1m 3m 6m 12m
Absolute 2.6 5.8 7.7 55.6
Relative 1.5 4.7 3.5 45.9
Kong Heng Siong +603 9207 7666
The Research Team +603 9207 7680
Investment Merits
Third-largest stretch film producer in the world
Total remaining GDV of MYR4.4bn from its 990-acre landbank
Capacity expansion and selective property development to sustain growth
Company Profile
Scientex is involved in the plastic film manufacturing industry as well as property development. The group manufactures resin-based films for the logistics, food & beverage (F&B) and fast-moving consumer goods (FMCG) segments. Scientex’s property development arm is mostly concentrated in Johor, where the group was founded in 1968.
Highlights
Film manufacturing. In 1QFY14, Scientex’s manufacturing division contributed 79% to topline and 54% of its consolidated EBITDA. The group has 10 production facilities in Malaysia and Vietnam. Its key products include stretch film, consumer film and strapping bands. It is worth noting that the group’s stretch film business has an annual production capacity of 194,000 tonnes, making it the world’s third-largest stretch film producer. Overall, it exports over 75% of its manufactured products to countries like Japan, South Korea, Taiwan, Russia and Australia.
Niche property developer. Scientex’s property development division is currently sitting on 990 acres of undeveloped landbank that carries a remaining GDV totalling MYR4.4bn, to be developed over the next 10 years. Currently, it has ongoing developments in Pasir Gudang, Kulai, Skudai and Senai (all in Johor) as well as in Ayer Keroh, Melaka. Management is looking at new launches with a total GDV of MYR600m in FY14. As at Oct 2013, its unbilled sales stood at MYR406.9m.
Grwoing from strength to strength. The growth of Scientex’s manufacturing segment will be driven by the expansion of its existing production lines. Out of its 194,000 tonnes of annual stretch film production capacity, three new lines at its Pulau Indah plant – totalling 40,000 tonnes annually – came onstream in Dec 2013. Management is targeting to fill the new production capacity in a year’s time, with full-year contributions likely to come in by FY15. Scientex’s consumer packaging production capacity will also be increased by 50% to 51,000 tonnes annually (from 34,000 tonnes), as five new blown film extrusion machines – which will be delivered in stages – are expected to be fully-installed by August. Meanwhile, growth of the group’s property development arm will be fuelled by the selective launches of a mix of affordable and middle- to high-end homes. These will be dependent upon demand and market conditions, and backed by its sizeable landbank.
Profit & Loss Jul-13 Jul-14F Jul-15F
Total turnover (MYRm) 1,229 1,366 1,590
Reported net profit (MYRm) 110 143 171
Recurring net profit (MYRm) 110 143 171
Recurring net profit growth (%) 31.4 30.0 19.3
Recurring EPS (MYR) 0.51 0.66 0.77
DPS (MYR) 0.27 0.19 0.23
Dividend Yield (%) 4.5 3.3 4.0
Recurring P/E (x) 11.43 8.92 7.57
Return on average equity (%) 19.1 21.1 21.7
P/B (x) 2.01 1.78 1.53
P/CF (x) 5.91 6.51 5.70
Source: Company data, RHB estimates
Balance Sheet (MYRm) Jul-13 Jul-14F Jul-15F
Total current assets 497 566 709
Total assets 1,286 1,422 1,565
Total current liabilities 437 468 503
Total non-current liabilities 201 203 191
Total liabilities 638 672 694
Shareholders' equity 629 727 845
Minority interests 20 23 26
Other equity 0 0 (0)
Total equity 649 750 871
Total liabilities & equity 1,286 1,422 1,565
Total debt 335 340 315
Net debt 183 149 31
Source: Company data, RHB estimates
Cash flow (MYRm) Jul-13 Jul-14F Jul-15F
Cash flow from operations 213 196 227
Cash flow from investing activities (348) (110) (50)
Cash flow from financing activities 251 (47) (84)
Cash at beginning of period 36 152 191
Total cash generated 116 39 93
Implied cash at end of period 152 191 285
Source: Company dataRHB estimates
Company Report Card
Latest results. Scientex’s 1HFY14 topline of MYR748.3m (+45.9% y-o-y) was contributed by: i) MYR577.7m in revenue from its manufacturing segment (+57.8% y-o-y; 77.2% of total topline), and ii) MYR170.6m revenue from its property segment (+16.4% y-o-y; 22.8% of total topline). Scientex’s 1HFY14 core earnings expanded 25.3% y-o-y to MYR63.3m, making up 43.3% and 41.8% of our and consensus full-year estimates respectively.
Balance sheet/cash flow. In FY13, Scientex’s net gearing stood at 0.3x. For FY14F and FY15F, we expect this ratio to go down to 0.2x and 0.03x respectively.
ROE. We expect the group to deliver ROEs of 21.1% on the back of its expanding film manufacturing segment and selective property launches.
Dividend. We expect management to declare a DPS of 19.0 sen, absed on the company’s 30% minimum payout ratio. This will likely translate into an annual dividend yield of >3%.
Management. Management is currently led by Lim Peng Jin, who is the group MD. A chemical engineer by training, he is also the son of founder Lim Teck Meng. Peng Jin has been with Scientex for the last 20 years. Currently, the founding family collectively owns a 60% stake in the group. Listed on the Main Market of Bursa Malaysia in Feb 1990, Scientex’s market capitalisation has increased by over 10-fold in the last 23 years to MYR1.24bn currently.
Recommendation
Maintain BUY. We reiterate our BUY recommendation on the stock, with our SOP-based FV of MYR7.19. We continue to like Scientex’s: i) fast-expanding plastic film manufacturing segment, ii) reputable brand name in southern Malaysia’s property market, and iii) committed management team under the founding Lim family.
63Top Malaysia Small Cap Companies 2014

Scientex Target: MYR7.19
Price: MYR5.85
World Class Stretch Film Producer
87
99
110
122
134
145
157
3.2
3.7
4.2
4.7
5.2
5.7
6.2
Scientex (SCI MK)Price Close Relative to FTSE Bursa Malaysia KLCI Index (RHS)
1
2
3
4
5
6
Ap
r-13
Jun
-13
Au
g-1
3
Oct-
13
Dec-1
3
Feb
-14
Vol m
Source: Bloomberg
Stock Profile
Bloomberg Ticker SCI MK
Avg Turnover (MYR/USD) 1.34m/0.41m
Net Gearing (%) 19.9
Market Cap (MYRm) 1,294m
Beta (x) 1.26
BVPS (MYR) 3.29
52-wk Price low/high (MYR) 3.52 - 5.92
Free float (%) 54
Major Shareholders (%)
Scientex Holdings SB 20.7
Scientex Leasing SB 10.5
Sim Swee Tin 5.6
Share Performance (%)
1m 3m 6m 12m
Absolute 2.6 5.8 7.7 55.6
Relative 1.5 4.7 3.5 45.9
Kong Heng Siong +603 9207 7666
The Research Team +603 9207 7680
Investment Merits
Third-largest stretch film producer in the world
Total remaining GDV of MYR4.4bn from its 990-acre landbank
Capacity expansion and selective property development to sustain growth
Company Profile
Scientex is involved in the plastic film manufacturing industry as well as property development. The group manufactures resin-based films for the logistics, food & beverage (F&B) and fast-moving consumer goods (FMCG) segments. Scientex’s property development arm is mostly concentrated in Johor, where the group was founded in 1968.
Highlights
Film manufacturing. In 1QFY14, Scientex’s manufacturing division contributed 79% to topline and 54% of its consolidated EBITDA. The group has 10 production facilities in Malaysia and Vietnam. Its key products include stretch film, consumer film and strapping bands. It is worth noting that the group’s stretch film business has an annual production capacity of 194,000 tonnes, making it the world’s third-largest stretch film producer. Overall, it exports over 75% of its manufactured products to countries like Japan, South Korea, Taiwan, Russia and Australia.
Niche property developer. Scientex’s property development division is currently sitting on 990 acres of undeveloped landbank that carries a remaining GDV totalling MYR4.4bn, to be developed over the next 10 years. Currently, it has ongoing developments in Pasir Gudang, Kulai, Skudai and Senai (all in Johor) as well as in Ayer Keroh, Melaka. Management is looking at new launches with a total GDV of MYR600m in FY14. As at Oct 2013, its unbilled sales stood at MYR406.9m.
Grwoing from strength to strength. The growth of Scientex’s manufacturing segment will be driven by the expansion of its existing production lines. Out of its 194,000 tonnes of annual stretch film production capacity, three new lines at its Pulau Indah plant – totalling 40,000 tonnes annually – came onstream in Dec 2013. Management is targeting to fill the new production capacity in a year’s time, with full-year contributions likely to come in by FY15. Scientex’s consumer packaging production capacity will also be increased by 50% to 51,000 tonnes annually (from 34,000 tonnes), as five new blown film extrusion machines – which will be delivered in stages – are expected to be fully-installed by August. Meanwhile, growth of the group’s property development arm will be fuelled by the selective launches of a mix of affordable and middle- to high-end homes. These will be dependent upon demand and market conditions, and backed by its sizeable landbank.
Profit & Loss Jul-13 Jul-14F Jul-15F
Total turnover (MYRm) 1,229 1,366 1,590
Reported net profit (MYRm) 110 143 171
Recurring net profit (MYRm) 110 143 171
Recurring net profit growth (%) 31.4 30.0 19.3
Recurring EPS (MYR) 0.51 0.66 0.77
DPS (MYR) 0.27 0.19 0.23
Dividend Yield (%) 4.5 3.3 4.0
Recurring P/E (x) 11.43 8.92 7.57
Return on average equity (%) 19.1 21.1 21.7
P/B (x) 2.01 1.78 1.53
P/CF (x) 5.91 6.51 5.70
Source: Company data, RHB estimates
Balance Sheet (MYRm) Jul-13 Jul-14F Jul-15F
Total current assets 497 566 709
Total assets 1,286 1,422 1,565
Total current liabilities 437 468 503
Total non-current liabilities 201 203 191
Total liabilities 638 672 694
Shareholders' equity 629 727 845
Minority interests 20 23 26
Other equity 0 0 (0)
Total equity 649 750 871
Total liabilities & equity 1,286 1,422 1,565
Total debt 335 340 315
Net debt 183 149 31
Source: Company data, RHB estimates
Cash flow (MYRm) Jul-13 Jul-14F Jul-15F
Cash flow from operations 213 196 227
Cash flow from investing activities (348) (110) (50)
Cash flow from financing activities 251 (47) (84)
Cash at beginning of period 36 152 191
Total cash generated 116 39 93
Implied cash at end of period 152 191 285
Source: Company dataRHB estimates
Company Report Card
Latest results. Scientex’s 1HFY14 topline of MYR748.3m (+45.9% y-o-y) was contributed by: i) MYR577.7m in revenue from its manufacturing segment (+57.8% y-o-y; 77.2% of total topline), and ii) MYR170.6m revenue from its property segment (+16.4% y-o-y; 22.8% of total topline). Scientex’s 1HFY14 core earnings expanded 25.3% y-o-y to MYR63.3m, making up 43.3% and 41.8% of our and consensus full-year estimates respectively.
Balance sheet/cash flow. In FY13, Scientex’s net gearing stood at 0.3x. For FY14F and FY15F, we expect this ratio to go down to 0.2x and 0.03x respectively.
ROE. We expect the group to deliver ROEs of 21.1% on the back of its expanding film manufacturing segment and selective property launches.
Dividend. We expect management to declare a DPS of 19.0 sen, absed on the company’s 30% minimum payout ratio. This will likely translate into an annual dividend yield of >3%.
Management. Management is currently led by Lim Peng Jin, who is the group MD. A chemical engineer by training, he is also the son of founder Lim Teck Meng. Peng Jin has been with Scientex for the last 20 years. Currently, the founding family collectively owns a 60% stake in the group. Listed on the Main Market of Bursa Malaysia in Feb 1990, Scientex’s market capitalisation has increased by over 10-fold in the last 23 years to MYR1.24bn currently.
Recommendation
Maintain BUY. We reiterate our BUY recommendation on the stock, with our SOP-based FV of MYR7.19. We continue to like Scientex’s: i) fast-expanding plastic film manufacturing segment, ii) reputable brand name in southern Malaysia’s property market, and iii) committed management team under the founding Lim family.
64Top Malaysia Small Cap Companies 2014

65
Syarikat Takaful Malaysia Target: MYR15.00
Price: MYR12.36
Consistently Rewarding Investors And Customers
84
97
109
122
134
147
159
172
184
6
7
8
9
10
11
12
13
14
Syarikat Takaful Malaysia (STMB MK)Price Close Relative to FTSE Bursa Malaysia KLCI Index (RHS)
200
400
600
800
1000
1200
Apr-
13
Jun
-13
Au
g-1
3
Oct-
13
De
c-13
Feb
-14
Vol t
h
Source: Bloomberg
Stock Profile
Bloomberg Ticker STMB MK
Avg Turnover (MYR/USD) 1.22m/0.37m
Net Gearing (%) na
Market Cap (MYRm) 2,117m
Beta (x) 1.28
BVPS (MYR) 3.98
52-wk Price low/high (MYR) 6.51 - 13.0
Free float (%) 32
Major Shareholders (%)
BIMB 60.5
EPF 8.4
Share Performance (%)
1m 3m 6m 12m
Absolute 20.4 26.2 44.1 88.4
Relative 18.7 25.1 39.3 78.3
Kong Ho Meng +603 9207 7620
Investment Merits
Long-standing history in operating takaful
Top 2 market share and above-industry growth
Most improved ROEs among listed local insurers
Unique "15% No-Claim Rebate/Cash-Back" proposition
Ample surplus reserves provide buffer against regulatory risks
Company Profile
Syarikat Takaful Malaysia (STMB) is in the business of providing shariah-compliant general and family insurance, whereby the risk is voluntarily and collectively shared by a group of participants.
Highlights
Wakalah model the way forward. Under the takaful concept, a group of people (participants) provide guarantees for mutual financial aid on a reciprocal basis, with the emphasis on the virtues of cooperation and profit sharing (mudharabah). Previously, STMB adopted the mudharabah model, which dictated how surplus profits are to be shared between the participants as the providers of capital and the takaful operator as the entrepreneur. Most takaful players now adopt a modified wakalah model, which is essentially an agency fee-based system that is most prevalent in the Middle East. This model allows the company to act as an agent on behalf of the participants. In return, it is entitled to a recurring wakalah fee, which is usually paid up-front. Compared with the mudharabah model, wakalah is deemed to have less uncertainty (gharar) – an element prohibited under Islamic principles – and also gives a takaful player greater control over earnings volatility. Due to this change in business model, STMB experienced a two-fold surge in wakalah income in FY11-13.
Proxy to a fast-growing industry. STMB is the best proxy to the takaful industry. In fact, it has been surpassing industry growth, capturing close to 40% of the family takaful market and 23% of the combined (general and family) Islamic insurance market share in 3Q13 vs 40% and 20% in 2012 respectively. According to Bank Negara’s statistics, the takaful industry's net contributions charted a CAGR of 15.7% through 2009-2013, ie above the conventional industry's net premium CAGR of 7.8% in the same period. This was partly due to the Islamic insurance sector’s significantly lower penetration rate, contributing only 0.7% of gross national income (GNI) vs the overall insurance and takaful's 4.9%. Despite the industry’s relatively smaller size, the Malaysian family takaful market (the equivalent of life insurance) was valued at MYR4bn and is relatively sophisticated, accounting for a staggering 73% of the global family’s takaful market.
Profit & Loss Dec-12 Dec-13 Dec-14F
Total operating income (MYRm) 1,644.0 1,852.1 1,984.6
Reported net profit (MYRm) 97 139 158
Recurring net profit (MYRm) 97 139 158
Recurring net profit growth (%) 70.0 44.1 13.4
Recurring EPS (MYR) 0.59 0.85 0.97
DPS (MYR) 0.25 0.82 0.50
Dividend Yield (%) 1.9 6.3 3.9
Recurring P/E (x) 21.50 15.23 13.42
Return on average equity (%) 20.3 25.9 25.9
P/B (x) 4.24 3.70 3.27
Source: Company data, RHB estimates
Balance Sheet (MYRm) Dec-12 Dec-13 Dec-14F
Total current assets 454 553 614
Total assets 6,372 6,925 7,871
Total current liabilities 307 308 335
Total non-current liabilities 113 132 72
Total liabilities 5,846 6,335 7,193
Shareholders' equity 499 572 648
Minority interests 26 18 30
Total equity 525 590 678
Total liabilities & equity 6,372 6,925 7,871
Source: Company data, RHB estimates
Key Ratios Dec-12 Dec-13 Dec-14F
Reinsurance ratio (%) 11.7 12.1 10.9
Retention ratio (%) 88.3 87.9 89.1
Claims ratio (%) 51.7 53.1 55.0
Commission ratio (%) 10.8 10.2 9.7
Expense ratio (%) 20.4 19.7 20.0
Combined ratio (%) 82.9 83.0 84.7
Underwriting margin (%) 17.1 17.0 15.3
Investment yield (%) 7.7 7.4 7.3
Liquidity ratio (%) 148.0 179.9 183.1
Source: Company data, RHB estimates
Unique proposition. Given the low industry penetration rate of takaful, STMB has invested wisely in portraying itself in its advertisements as a leading "insurance" provider that caters to all customer segments. It is the only local Islamic insurance player that offers a unique “15% Cash-Back’’ (CB) to customers should they make no claims during the coverage period. The company also offers an additional 5% CB on top of the existing 15% on all its maturing non-motor policies. STMB paid out MYR29.6m CBs to its customers and business partners in 2013.
Indonesia – a longer-term picture. STMB has an 18-year presence in Indonesia through three subsidiaries and a tie-up with Bank Muamalat Indonesia, which has 3,000 branches. Its Indonesian operations are currently facing stiff competition from local conventional players that are still permitted to sell Islamic products via a window concept. On a longer-term basis (possibly from 2015), we see STMB as a beneficiary of expected regulatory changes that disallow the operating of an Islamic window by conventional insurers. Indonesia, which carries a sizable Muslim population and rising income levels, is a huge potential for the company’s takaful business in the near future.
Company Report Card
Latest results. STMB's FY13 core earnings improved 44% y-o-y on increased recognition of wakalah income, and improved claims and expense ratios. These factors outweighed the 6% revenue growth that was attributed to the moderation of the company’s retail products amid Bank Negara’s tightening measures on household debt since July 2013 and weaker performance from its Indonesia operations.
ROE. STMB’s ROE has been improving tremendously since 2007, rising to 25.9% in FY13 from 13.4% in FY11. Going forward, we expect the company to register similar levels of ROEs, ie within 25-26%.
Dividend. While STMB has no official dividend policy, it has been consistently raising its payout to >40% in FY12 (FY09: 20%) and 97% dividend payout in FY13. We are still projecting on a sustainable 50% payout in the future, which is supported by the company's ample surplus reserves and above-industry profit growth.
Management. Group managing director, Dato’ Mohamed Hassan Md Kamil has vast experience in both conventional insurance and takaful industries, with numerous awards and recognitions. He repositioned the company by setting up competitive standards. Under his leadership, STMB has launched rebranding campaigns and has grown in strength. His ultimate goal is to firmly establish the company as the preferred choice for insurance and not merely a takaful provider. The company is benchmarking itself against the giants in the conventional insurance landscape, not just among the Islamic insurance players.
Recommendation
Top BUY for insurance. Our MYR15.00 FV is pegged to 13x FY15F EPS. We believe the stock deserves a P/E in line with our 13-20x sector valuations, supported by double-digit earnings growth, good dividend yields and its niche in the promising takaful industry. While our FV implies a FY15F P/BV of 3.4x, we deem this fair given STMB’s superior ROE vs the insurance stocks under our coverage.
Top Malaysia Small Cap Companies 2014

66
Syarikat Takaful Malaysia Target: MYR15.00
Price: MYR12.36
Consistently Rewarding Investors And Customers
84
97
109
122
134
147
159
172
184
6
7
8
9
10
11
12
13
14
Syarikat Takaful Malaysia (STMB MK)Price Close Relative to FTSE Bursa Malaysia KLCI Index (RHS)
200
400
600
800
1000
1200
Apr-
13
Jun
-13
Au
g-1
3
Oct-
13
De
c-13
Feb
-14
Vol t
h
Source: Bloomberg
Stock Profile
Bloomberg Ticker STMB MK
Avg Turnover (MYR/USD) 1.22m/0.37m
Net Gearing (%) na
Market Cap (MYRm) 2,117m
Beta (x) 1.28
BVPS (MYR) 3.98
52-wk Price low/high (MYR) 6.51 - 13.0
Free float (%) 32
Major Shareholders (%)
BIMB 60.5
EPF 8.4
Share Performance (%)
1m 3m 6m 12m
Absolute 20.4 26.2 44.1 88.4
Relative 18.7 25.1 39.3 78.3
Kong Ho Meng +603 9207 7620
Investment Merits
Long-standing history in operating takaful
Top 2 market share and above-industry growth
Most improved ROEs among listed local insurers
Unique "15% No-Claim Rebate/Cash-Back" proposition
Ample surplus reserves provide buffer against regulatory risks
Company Profile
Syarikat Takaful Malaysia (STMB) is in the business of providing shariah-compliant general and family insurance, whereby the risk is voluntarily and collectively shared by a group of participants.
Highlights
Wakalah model the way forward. Under the takaful concept, a group of people (participants) provide guarantees for mutual financial aid on a reciprocal basis, with the emphasis on the virtues of cooperation and profit sharing (mudharabah). Previously, STMB adopted the mudharabah model, which dictated how surplus profits are to be shared between the participants as the providers of capital and the takaful operator as the entrepreneur. Most takaful players now adopt a modified wakalah model, which is essentially an agency fee-based system that is most prevalent in the Middle East. This model allows the company to act as an agent on behalf of the participants. In return, it is entitled to a recurring wakalah fee, which is usually paid up-front. Compared with the mudharabah model, wakalah is deemed to have less uncertainty (gharar) – an element prohibited under Islamic principles – and also gives a takaful player greater control over earnings volatility. Due to this change in business model, STMB experienced a two-fold surge in wakalah income in FY11-13.
Proxy to a fast-growing industry. STMB is the best proxy to the takaful industry. In fact, it has been surpassing industry growth, capturing close to 40% of the family takaful market and 23% of the combined (general and family) Islamic insurance market share in 3Q13 vs 40% and 20% in 2012 respectively. According to Bank Negara’s statistics, the takaful industry's net contributions charted a CAGR of 15.7% through 2009-2013, ie above the conventional industry's net premium CAGR of 7.8% in the same period. This was partly due to the Islamic insurance sector’s significantly lower penetration rate, contributing only 0.7% of gross national income (GNI) vs the overall insurance and takaful's 4.9%. Despite the industry’s relatively smaller size, the Malaysian family takaful market (the equivalent of life insurance) was valued at MYR4bn and is relatively sophisticated, accounting for a staggering 73% of the global family’s takaful market.
Profit & Loss Dec-12 Dec-13 Dec-14F
Total operating income (MYRm) 1,644.0 1,852.1 1,984.6
Reported net profit (MYRm) 97 139 158
Recurring net profit (MYRm) 97 139 158
Recurring net profit growth (%) 70.0 44.1 13.4
Recurring EPS (MYR) 0.59 0.85 0.97
DPS (MYR) 0.25 0.82 0.50
Dividend Yield (%) 1.9 6.3 3.9
Recurring P/E (x) 21.50 15.23 13.42
Return on average equity (%) 20.3 25.9 25.9
P/B (x) 4.24 3.70 3.27
Source: Company data, RHB estimates
Balance Sheet (MYRm) Dec-12 Dec-13 Dec-14F
Total current assets 454 553 614
Total assets 6,372 6,925 7,871
Total current liabilities 307 308 335
Total non-current liabilities 113 132 72
Total liabilities 5,846 6,335 7,193
Shareholders' equity 499 572 648
Minority interests 26 18 30
Total equity 525 590 678
Total liabilities & equity 6,372 6,925 7,871
Source: Company data, RHB estimates
Key Ratios Dec-12 Dec-13 Dec-14F
Reinsurance ratio (%) 11.7 12.1 10.9
Retention ratio (%) 88.3 87.9 89.1
Claims ratio (%) 51.7 53.1 55.0
Commission ratio (%) 10.8 10.2 9.7
Expense ratio (%) 20.4 19.7 20.0
Combined ratio (%) 82.9 83.0 84.7
Underwriting margin (%) 17.1 17.0 15.3
Investment yield (%) 7.7 7.4 7.3
Liquidity ratio (%) 148.0 179.9 183.1
Source: Company data, RHB estimates
Unique proposition. Given the low industry penetration rate of takaful, STMB has invested wisely in portraying itself in its advertisements as a leading "insurance" provider that caters to all customer segments. It is the only local Islamic insurance player that offers a unique “15% Cash-Back’’ (CB) to customers should they make no claims during the coverage period. The company also offers an additional 5% CB on top of the existing 15% on all its maturing non-motor policies. STMB paid out MYR29.6m CBs to its customers and business partners in 2013.
Indonesia – a longer-term picture. STMB has an 18-year presence in Indonesia through three subsidiaries and a tie-up with Bank Muamalat Indonesia, which has 3,000 branches. Its Indonesian operations are currently facing stiff competition from local conventional players that are still permitted to sell Islamic products via a window concept. On a longer-term basis (possibly from 2015), we see STMB as a beneficiary of expected regulatory changes that disallow the operating of an Islamic window by conventional insurers. Indonesia, which carries a sizable Muslim population and rising income levels, is a huge potential for the company’s takaful business in the near future.
Company Report Card
Latest results. STMB's FY13 core earnings improved 44% y-o-y on increased recognition of wakalah income, and improved claims and expense ratios. These factors outweighed the 6% revenue growth that was attributed to the moderation of the company’s retail products amid Bank Negara’s tightening measures on household debt since July 2013 and weaker performance from its Indonesia operations.
ROE. STMB’s ROE has been improving tremendously since 2007, rising to 25.9% in FY13 from 13.4% in FY11. Going forward, we expect the company to register similar levels of ROEs, ie within 25-26%.
Dividend. While STMB has no official dividend policy, it has been consistently raising its payout to >40% in FY12 (FY09: 20%) and 97% dividend payout in FY13. We are still projecting on a sustainable 50% payout in the future, which is supported by the company's ample surplus reserves and above-industry profit growth.
Management. Group managing director, Dato’ Mohamed Hassan Md Kamil has vast experience in both conventional insurance and takaful industries, with numerous awards and recognitions. He repositioned the company by setting up competitive standards. Under his leadership, STMB has launched rebranding campaigns and has grown in strength. His ultimate goal is to firmly establish the company as the preferred choice for insurance and not merely a takaful provider. The company is benchmarking itself against the giants in the conventional insurance landscape, not just among the Islamic insurance players.
Recommendation
Top BUY for insurance. Our MYR15.00 FV is pegged to 13x FY15F EPS. We believe the stock deserves a P/E in line with our 13-20x sector valuations, supported by double-digit earnings growth, good dividend yields and its niche in the promising takaful industry. While our FV implies a FY15F P/BV of 3.4x, we deem this fair given STMB’s superior ROE vs the insurance stocks under our coverage.
Top Malaysia Small Cap Companies 2014

67
Suria Capital Holdings Target: MYR3.50
Price: MYR2.59
Multi-Year Growth Prospects Remain Intact
84
95
107
118
129
140
152
163
174
1.3
1.5
1.7
1.9
2.1
2.3
2.5
2.7
2.9
Suria Capital (SURIA MK)Price Close Relative to FTSE Bursa Malaysia KLCI Index (RHS)
1
1
2
2
3
3
Apr-
13
Jun
-13
Aug
-13
Oct
-13
Dec-1
3
Feb
-14
Vol m
Source: Bloomberg
Stock Profile
Bloomberg Ticker SURIA MK
Avg Turnover (MYR/USD) 0.28m/0.08m
Net Gearing (%) 13.1
Market Cap (MYRm) 734m
Beta (x) 0.88
BVPS (MYR) 3.11
52-wk Price low/high (MYR) 1.49 - 2.76
Free float (%) 30
Major Shareholders (%)
Warisan Harta 46.2
Lembaga Tabung Haji 9.2
Share Performance (%)
1m 3m 6m 12m
Absolute 0.0 (2.6) 44.7 61.9
Relative (1.1) (3.7) 40.5 52.2
Jerry Lee 603 9207 7622
Investment Merits
Its Jesselton Quay JV is expected to materialise soon, for which the salient terms are favourable to Suria Capital
Its key operating divisions are yielding stable and positive performance
Our conservative assumptions give room for potential earnings upside
Company Profile
Suria Capital Holdings (Suria Capital)’s main core business is the operation of eight major ports in Sabah, namely Kota Kinabalu Port, Sapangar Bay Oil Terminal, Sandakan Port, Lahad Datu Port, Kunak Port, Kudat Port, Tawau Port and Sapangar Bay Container Port. The group also has other businesses, such as equipment supply and maintenance, logistics and bunkering services, contract and engineering, and ferry terminal operations. Suria Capital is looking to diversify its operations into property and tourism sectors.
Highlights
Jesselton Quay the key catalyst. Suria Capital’s ‘riskless’ diversification into the property sector is expected to materialise soon, as management targets the JV to be completed within 1H2014. We deem the salient terms of the agreement favourable to Suria, as it only needs to provide the land and facilitate the implementation of the project. All other costs and expenses relating to the project, including the implementation and completion of Jesselton Quay, will be borne by SBC Corp (SBC MK, NR). The group is also guaranteed a minimum return of MYR324m in cash, or in kind, over eight tranches.
Core operations are improving. Other than the immediate catalyst from the Jesselton Quay project, Suria Capital’s core earnings are improving as well. On its ports division, although the overall throughput volume declined (cargo: -0.1% y-o-y, container: -0.4% y-o-y) in FY13, revenue from port operations grew 3% y-o-y, mainly attributed to heightened palm oil and bulk oil handling at the port, as well as a MYR2.8m increase in machinery sales. This, coupled with a 3% y-o-y drop in operating expenses (repair and maintenance, dredging and stevedoring), translated into a 13% y-o-y jump in FY13 operating profit. Meanwhile, the logistics business improved y-o-y, boosted by the supply of bunkering fuel to cruise ships in Kota Kinabalu Port, as well as the commencement of the Samur project in June 2013. This led to narrowing losses at its bunkering division in 2013, which should help improve Suria Capital’s profitability.
Profit & Loss Dec-12 Dec-13 Dec-14F
Total turnover (MYRm) 263 263 264
Reported net profit (MYRm) 65 62 65
Recurring net profit (MYRm) 53 62 65
Recurring net profit growth (%) (0.7) 15.5 5.8
Recurring EPS (MYR) 0.19 0.22 0.23
DPS (MYR) 0.06 0.06 0.08
Dividend Yield (%) 2.4 2.4 3.1
Recurring P/E (x) 13.78 11.93 11.27
Return on average equity (%) 8.3 7.5 7.5
P/B (x) 0.92 0.87 0.83
P/CF (x) 5.37 4.93 6.19
Source: Company data, RHB estimates
Balance Sheet (MYRm) Dec-12 Dec-13 Dec-14F
Total current assets 289 308 167
Total assets 1,178 1,179 1,196
Total current liabilities 78 141 59
Total non-current liabilities 298 191 252
Total liabilities 376 332 311
Shareholders' equity 800 845 882
Minority interests 2 2 2
Other equity 0 (0) 0
Total equity 802 847 884
Total liabilities & equity 1,178 1,179 1,196
Total debt 272 229 210
Net debt 56 (23) 116
Source: Company data, RHB estimates
Cash flow (MYRm) Dec-12 Dec-13 Dec-14F
Cash flow from operations 137 149 119
Cash flow from investing activities 28 (26) (170)
Cash flow from financing activities (143) (74) (89)
Cash at beginning of period 205 216 252
Total cash generated 22 49 (140)
Implied cash at end of period 227 265 112
Source: Company data, RHB estimates
Our assumptions are conservative. Our earnings forecasts are conservative, as: i) we do not incorporate any tariff hikes into our earnings forecasts, ii) our assumptions for container and non-container volume growth are relatively low, and iii) our assumptions for higher operating expenses result in a lower gross profit margin forecast. This gives Suria Capital more earnings upside potential.
Company Report Card
Latest results. Suria Capital’s FY13 core net profit of MYR62m met our earnings forecast, with its port operations contributing 88% of the group’s revenue, followed by logistics and bunkering services at 11%. The remaining revenue came from contract and engineering as well as ferry terminal operations.
Balance sheet/cash flow. The group is slightly geared but this is not a concern as both its operating cash flow and free cash flow are still positive.
ROE. We project Suria Capital’s ROE in FY14F at 7.5%.
Dividend. In FY13, the company declared a 3 sen dividend for 4QFY13, bringing its full-year FY13 dividend to 6.15 sen, or a 28% payout ratio. Historically, Suria Capital’s dividend payout ratio has been hovering at around 25-30%.
Management. The management team was led by Datuk Dr Mohd Fowzi Hj Razi, the managing director and Ng Kiat Min, the chief financial officer.
Recommendation
As Suria Capital’s core operations are expected to generate organic earnings growth, we keep conservative assumptions in our forecasts and do not factor in any tariff hikes. As it is, we find Suria still undervalued vs its closest peer Integrax (INTEG MK, NEUTRAL, FV: MYR2.32), which is trading at a higher P/E multiple. We think the market has yet to price in the cash inflow from Suria Capital’s Jesselton Quay JV. Thus, we maintain BUY on the stock with a MYR3.50 FV, based on a 20% discount to its DCF (at a WACC of 7.2%).
Top Malaysia Small Cap Companies 2014
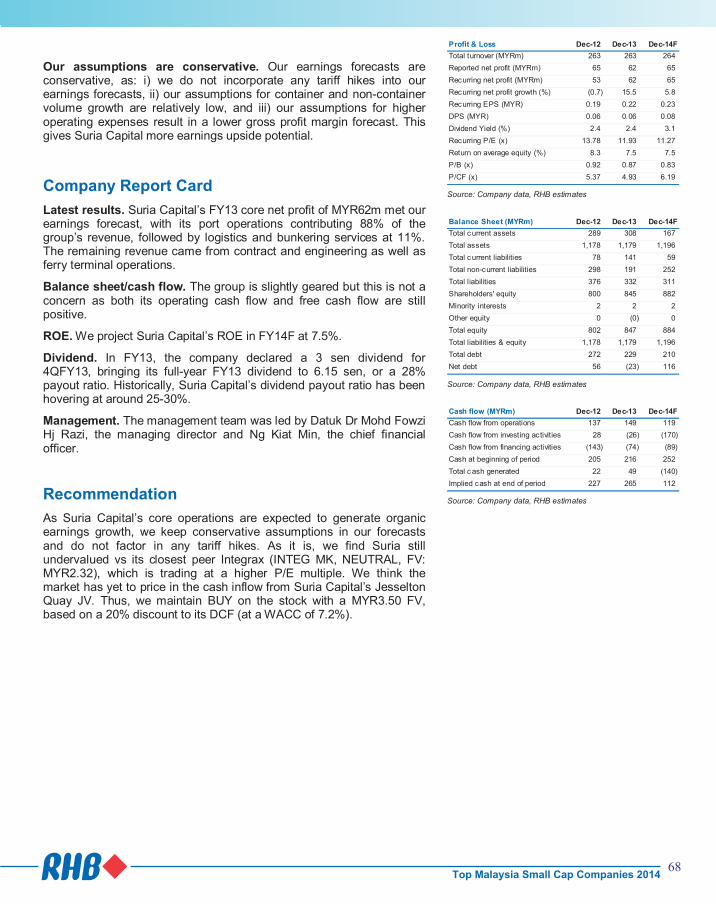
68
Suria Capital Holdings Target: MYR3.50
Price: MYR2.59
Multi-Year Growth Prospects Remain Intact
84
95
107
118
129
140
152
163
174
1.3
1.5
1.7
1.9
2.1
2.3
2.5
2.7
2.9
Suria Capital (SURIA MK)Price Close Relative to FTSE Bursa Malaysia KLCI Index (RHS)
1
1
2
2
3
3
Apr-
13
Jun
-13
Aug
-13
Oct
-13
Dec-1
3
Feb
-14
Vol m
Source: Bloomberg
Stock Profile
Bloomberg Ticker SURIA MK
Avg Turnover (MYR/USD) 0.28m/0.08m
Net Gearing (%) 13.1
Market Cap (MYRm) 734m
Beta (x) 0.88
BVPS (MYR) 3.11
52-wk Price low/high (MYR) 1.49 - 2.76
Free float (%) 30
Major Shareholders (%)
Warisan Harta 46.2
Lembaga Tabung Haji 9.2
Share Performance (%)
1m 3m 6m 12m
Absolute 0.0 (2.6) 44.7 61.9
Relative (1.1) (3.7) 40.5 52.2
Jerry Lee 603 9207 7622
Investment Merits
Its Jesselton Quay JV is expected to materialise soon, for which the salient terms are favourable to Suria Capital
Its key operating divisions are yielding stable and positive performance
Our conservative assumptions give room for potential earnings upside
Company Profile
Suria Capital Holdings (Suria Capital)’s main core business is the operation of eight major ports in Sabah, namely Kota Kinabalu Port, Sapangar Bay Oil Terminal, Sandakan Port, Lahad Datu Port, Kunak Port, Kudat Port, Tawau Port and Sapangar Bay Container Port. The group also has other businesses, such as equipment supply and maintenance, logistics and bunkering services, contract and engineering, and ferry terminal operations. Suria Capital is looking to diversify its operations into property and tourism sectors.
Highlights
Jesselton Quay the key catalyst. Suria Capital’s ‘riskless’ diversification into the property sector is expected to materialise soon, as management targets the JV to be completed within 1H2014. We deem the salient terms of the agreement favourable to Suria, as it only needs to provide the land and facilitate the implementation of the project. All other costs and expenses relating to the project, including the implementation and completion of Jesselton Quay, will be borne by SBC Corp (SBC MK, NR). The group is also guaranteed a minimum return of MYR324m in cash, or in kind, over eight tranches.
Core operations are improving. Other than the immediate catalyst from the Jesselton Quay project, Suria Capital’s core earnings are improving as well. On its ports division, although the overall throughput volume declined (cargo: -0.1% y-o-y, container: -0.4% y-o-y) in FY13, revenue from port operations grew 3% y-o-y, mainly attributed to heightened palm oil and bulk oil handling at the port, as well as a MYR2.8m increase in machinery sales. This, coupled with a 3% y-o-y drop in operating expenses (repair and maintenance, dredging and stevedoring), translated into a 13% y-o-y jump in FY13 operating profit. Meanwhile, the logistics business improved y-o-y, boosted by the supply of bunkering fuel to cruise ships in Kota Kinabalu Port, as well as the commencement of the Samur project in June 2013. This led to narrowing losses at its bunkering division in 2013, which should help improve Suria Capital’s profitability.
Profit & Loss Dec-12 Dec-13 Dec-14F
Total turnover (MYRm) 263 263 264
Reported net profit (MYRm) 65 62 65
Recurring net profit (MYRm) 53 62 65
Recurring net profit growth (%) (0.7) 15.5 5.8
Recurring EPS (MYR) 0.19 0.22 0.23
DPS (MYR) 0.06 0.06 0.08
Dividend Yield (%) 2.4 2.4 3.1
Recurring P/E (x) 13.78 11.93 11.27
Return on average equity (%) 8.3 7.5 7.5
P/B (x) 0.92 0.87 0.83
P/CF (x) 5.37 4.93 6.19
Source: Company data, RHB estimates
Balance Sheet (MYRm) Dec-12 Dec-13 Dec-14F
Total current assets 289 308 167
Total assets 1,178 1,179 1,196
Total current liabilities 78 141 59
Total non-current liabilities 298 191 252
Total liabilities 376 332 311
Shareholders' equity 800 845 882
Minority interests 2 2 2
Other equity 0 (0) 0
Total equity 802 847 884
Total liabilities & equity 1,178 1,179 1,196
Total debt 272 229 210
Net debt 56 (23) 116
Source: Company data, RHB estimates
Cash flow (MYRm) Dec-12 Dec-13 Dec-14F
Cash flow from operations 137 149 119
Cash flow from investing activities 28 (26) (170)
Cash flow from financing activities (143) (74) (89)
Cash at beginning of period 205 216 252
Total cash generated 22 49 (140)
Implied cash at end of period 227 265 112
Source: Company data, RHB estimates
Our assumptions are conservative. Our earnings forecasts are conservative, as: i) we do not incorporate any tariff hikes into our earnings forecasts, ii) our assumptions for container and non-container volume growth are relatively low, and iii) our assumptions for higher operating expenses result in a lower gross profit margin forecast. This gives Suria Capital more earnings upside potential.
Company Report Card
Latest results. Suria Capital’s FY13 core net profit of MYR62m met our earnings forecast, with its port operations contributing 88% of the group’s revenue, followed by logistics and bunkering services at 11%. The remaining revenue came from contract and engineering as well as ferry terminal operations.
Balance sheet/cash flow. The group is slightly geared but this is not a concern as both its operating cash flow and free cash flow are still positive.
ROE. We project Suria Capital’s ROE in FY14F at 7.5%.
Dividend. In FY13, the company declared a 3 sen dividend for 4QFY13, bringing its full-year FY13 dividend to 6.15 sen, or a 28% payout ratio. Historically, Suria Capital’s dividend payout ratio has been hovering at around 25-30%.
Management. The management team was led by Datuk Dr Mohd Fowzi Hj Razi, the managing director and Ng Kiat Min, the chief financial officer.
Recommendation
As Suria Capital’s core operations are expected to generate organic earnings growth, we keep conservative assumptions in our forecasts and do not factor in any tariff hikes. As it is, we find Suria still undervalued vs its closest peer Integrax (INTEG MK, NEUTRAL, FV: MYR2.32), which is trading at a higher P/E multiple. We think the market has yet to price in the cash inflow from Suria Capital’s Jesselton Quay JV. Thus, we maintain BUY on the stock with a MYR3.50 FV, based on a 20% discount to its DCF (at a WACC of 7.2%).
Top Malaysia Small Cap Companies 2014

69
Ta Ann Holdings Target: MYR5.00
Price: MYR4.17
Plantation Contributions On The Rise
87
92
97
102
107
112
117
122
3.2
3.4
3.6
3.8
4.0
4.2
4.4
4.6
Ta Ann Holdings (TAH MK)Price Close Relative to FTSE Bursa Malaysia KLCI Index (RHS)
1
1
2
2
3
3
Apr-
13
Jun
-13
Aug
-13
Oct
-13
Dec-1
3
Feb
-14
Vol m
Source: Bloomberg
Stock Profile
Bloomberg Ticker TAH MK
Avg Turnover (MYR/USD) 1.52m/0.46m
Net Gearing (%) 20.0
Market Cap (MYRm) 1,545m
Beta (x) 1.10
BVPS (MYR) 2.96
52-wk Price low/high (MYR) 3.38 - 4.46
Free float (%) 34
Major Shareholders (%)
Mountex SB 21.0
Datuk Wahab b Hj Dollah 11.0
EPF 9.7
Share Performance (%)
1m 3m 6m 12m
Absolute (1.7) (1.7) 8.9 18.5
Relative (2.8) (2.8) 4.7 8.8
Hoe Lee Leng +603 9207 7605
Investment Merits
Ban on Myanmar log exports positive for Malaysian log producers
Beneficiary of weakening MYR:USD exchange rate
Rising CPO prices positive for Ta Ann’s rising mature hectarage
Company Profile
Ta Ann is mainly involved in the manufacture and sale of plywood, trading of timber logs and cultivation of oil palms. It has 359,180ha of timber concessions in Sarawak and 97,855ha of oil palm plantation landbank in Sarawak. 37,716ha of its oil palm landbank has been planted, of which 28,611ha was mature as at end-2013. The company also has 310,713ha of forest plantation areas, of which 35,020ha has been planted as at end-2013.
Highlights
Improvements in timber sector dynamics. We are positive on the prospects of the timber sector in view of:
i) The ban on tropical log exports by Myanmar that came into effect on 1 April 2014, which will likely result in a supply shortage and rising prices. Myanmar is the fifth-largest tropical log producer and the third-biggest exporter in the Asia-Pacific region. By comparison, Malaysia is the third-largest producer and the biggest exporter of tropical logs in the region. With the ban in place, we expect tropical log prices to start rising again from 2H14 after any existing log inventory held by importing countries are depleted;
ii) Stable log demand in India coming from investments in the infrastructure and industrial sectors. The country is the largest importer of Malaysian tropical logs currently; iii) Recovering plywood demand in Japan on the back of rising housing starts (+12.3% y-o-y in Jan 2014) and an improving economy. The East Asian nation is the largest importer of Malaysian tropical timber currently; and iv) Weakening of MYR against USD will benefit export-derived revenue. Currently, USD-based exports comprise 40-45% of Ta Ann’s revenue. Rising CPO prices to benefit Ta Ann. The rise in CPO prices will also benefit Ta Ann, given its rising plantation exposure. Currently, plantations contribute 55% to its PBT. We expect this to rise in tandem with Ta Ann’s rising fresh fruit bunches (FFB) production output as well as on the back of rising CPO prices. FFB growth is estimated at +10-20% per annum for FY14-15 as more oil palm plantation land comes into maturity. We project CPO prices to average MYR2,700/tonne in 2014 and MYR2,900/tonne in 2015. We expect Ta Ann’s plantation division to contribute 70-80% of PBT within the next few years.
Profit & Loss Dec-13 Dec-14F Dec-15F
Total turnover (MYRm) 774 1,022 1,275
Reported net profit (MYRm) 91 128 146
Recurring net profit (MYRm) 71 128 146
Recurring net profit growth (%) 7.1 80.3 14.0
Recurring EPS (MYR) 0.19 0.35 0.39
DPS (MYR) 0.05 0.11 0.12
Dividend Yield (%) 1.2 2.5 2.9
Recurring P/E (x) 21.70 12.04 10.59
Return on average equity (%) 9.3 12.2 12.7
P/B (x) 1.53 1.41 1.29
P/CF (x) 6.94 12.14 8.28
Source: Company data, , RHB estimates
Balance Sheet (MYRm) Dec-13 Dec-14F Dec-15F
Total current assets 461 548 669
Total assets 1,806 1,913 2,040
Total current liabilities 343 355 378
Total non-current liabilities 426 434 439
Total liabilities 768 789 816
Shareholders' equity 1,008 1,098 1,199
Minority interests 30 26 24
Other equity (0) 0 0
Total equity 1,038 1,124 1,223
Total liabilities & equity 1,806 1,913 2,040
Total debt 518 476 478
Net debt 258 224 182
Source: Company data, , RHB estimates
Cash flow (MYRm) Dec-13 Dec-14F Dec-15F
Cash flow from operations 223 127 187
Cash flow from investing activities (142) (105) (105)
Cash flow from financing activities 50 (32) (37)
Cash at beginning of period 130 261 251
Total cash generated 131 (10) 45
Implied cash at end of period 261 251 296
Source: Company data, RHB estimates
Company Report Card
Latest results. Ta Ann’s FY13 core net profit fell 30% y-o-y on the back of a 3% dip in revenue. Topline in the timber division fell due to lower log volume and lower plywood prices, which were offset by higher log prices and plywood volume. However, PBT margins improved to 14.8% (from 10.1% in FY12) due to higher profit in the log division and lower losses in its plywood business. The plantation division’s FY13 PBT dived 33% as prices fell 21%, although production volume rose by 5%. Plantations contributed 55% to PBT in FY13.
Balance sheet/cash flow. As at end-2013, Ta Ann’s net debt stood at MYR257.6m (or 26% net gearing), which is still very manageable given its interest cover of >10x. Operating cash flow is relatively stable at MYR150-250m per year.
ROE. Ta Ann’s ROE started to improve since 2012, on the back of rising timber product prices. We project ROEs to rise to 12-13% in FY14-15 from FY13’s 9.3%.
Dividend. Ta Ann does not have an official dividend policy, but generally tries to stick to a net payout ratio of close to 30%. This is expected to translate to net yields of 2.5-3% per annum.
Management. Ta Ann’s management is very experienced, having been in the timber industry for many years. It is led by Dato Wong Kuo Hea, who has been serving as managing director and CEO since 1999. Dato Wong was responsible for leading the group to become an established timber player from a small trading company and spearheading its commitment towards the sustainability of timber resources.
Recommendation
We have a BUY rating on Ta Ann, on the back of stronger earnings from its plantation division, a stable-to-improving outlook for the timber industry and the added benefit of the recent softening MYR against the USD. Our SOP-based FV is MYR5.00, based on target P/Es of 12.0x CY14F for the timber division and 16.0x CY14F for the plantation unit – in line with the company’s peers.
Top Malaysia Small Cap Companies 2014

70
Ta Ann Holdings Target: MYR5.00
Price: MYR4.17
Plantation Contributions On The Rise
87
92
97
102
107
112
117
122
3.2
3.4
3.6
3.8
4.0
4.2
4.4
4.6
Ta Ann Holdings (TAH MK)Price Close Relative to FTSE Bursa Malaysia KLCI Index (RHS)
1
1
2
2
3
3
Apr-
13
Jun
-13
Aug
-13
Oct
-13
Dec-1
3
Feb
-14
Vol m
Source: Bloomberg
Stock Profile
Bloomberg Ticker TAH MK
Avg Turnover (MYR/USD) 1.52m/0.46m
Net Gearing (%) 20.0
Market Cap (MYRm) 1,545m
Beta (x) 1.10
BVPS (MYR) 2.96
52-wk Price low/high (MYR) 3.38 - 4.46
Free float (%) 34
Major Shareholders (%)
Mountex SB 21.0
Datuk Wahab b Hj Dollah 11.0
EPF 9.7
Share Performance (%)
1m 3m 6m 12m
Absolute (1.7) (1.7) 8.9 18.5
Relative (2.8) (2.8) 4.7 8.8
Hoe Lee Leng +603 9207 7605
Investment Merits
Ban on Myanmar log exports positive for Malaysian log producers
Beneficiary of weakening MYR:USD exchange rate
Rising CPO prices positive for Ta Ann’s rising mature hectarage
Company Profile
Ta Ann is mainly involved in the manufacture and sale of plywood, trading of timber logs and cultivation of oil palms. It has 359,180ha of timber concessions in Sarawak and 97,855ha of oil palm plantation landbank in Sarawak. 37,716ha of its oil palm landbank has been planted, of which 28,611ha was mature as at end-2013. The company also has 310,713ha of forest plantation areas, of which 35,020ha has been planted as at end-2013.
Highlights
Improvements in timber sector dynamics. We are positive on the prospects of the timber sector in view of:
i) The ban on tropical log exports by Myanmar that came into effect on 1 April 2014, which will likely result in a supply shortage and rising prices. Myanmar is the fifth-largest tropical log producer and the third-biggest exporter in the Asia-Pacific region. By comparison, Malaysia is the third-largest producer and the biggest exporter of tropical logs in the region. With the ban in place, we expect tropical log prices to start rising again from 2H14 after any existing log inventory held by importing countries are depleted;
ii) Stable log demand in India coming from investments in the infrastructure and industrial sectors. The country is the largest importer of Malaysian tropical logs currently; iii) Recovering plywood demand in Japan on the back of rising housing starts (+12.3% y-o-y in Jan 2014) and an improving economy. The East Asian nation is the largest importer of Malaysian tropical timber currently; and iv) Weakening of MYR against USD will benefit export-derived revenue. Currently, USD-based exports comprise 40-45% of Ta Ann’s revenue. Rising CPO prices to benefit Ta Ann. The rise in CPO prices will also benefit Ta Ann, given its rising plantation exposure. Currently, plantations contribute 55% to its PBT. We expect this to rise in tandem with Ta Ann’s rising fresh fruit bunches (FFB) production output as well as on the back of rising CPO prices. FFB growth is estimated at +10-20% per annum for FY14-15 as more oil palm plantation land comes into maturity. We project CPO prices to average MYR2,700/tonne in 2014 and MYR2,900/tonne in 2015. We expect Ta Ann’s plantation division to contribute 70-80% of PBT within the next few years.
Profit & Loss Dec-13 Dec-14F Dec-15F
Total turnover (MYRm) 774 1,022 1,275
Reported net profit (MYRm) 91 128 146
Recurring net profit (MYRm) 71 128 146
Recurring net profit growth (%) 7.1 80.3 14.0
Recurring EPS (MYR) 0.19 0.35 0.39
DPS (MYR) 0.05 0.11 0.12
Dividend Yield (%) 1.2 2.5 2.9
Recurring P/E (x) 21.70 12.04 10.59
Return on average equity (%) 9.3 12.2 12.7
P/B (x) 1.53 1.41 1.29
P/CF (x) 6.94 12.14 8.28
Source: Company data, , RHB estimates
Balance Sheet (MYRm) Dec-13 Dec-14F Dec-15F
Total current assets 461 548 669
Total assets 1,806 1,913 2,040
Total current liabilities 343 355 378
Total non-current liabilities 426 434 439
Total liabilities 768 789 816
Shareholders' equity 1,008 1,098 1,199
Minority interests 30 26 24
Other equity (0) 0 0
Total equity 1,038 1,124 1,223
Total liabilities & equity 1,806 1,913 2,040
Total debt 518 476 478
Net debt 258 224 182
Source: Company data, , RHB estimates
Cash flow (MYRm) Dec-13 Dec-14F Dec-15F
Cash flow from operations 223 127 187
Cash flow from investing activities (142) (105) (105)
Cash flow from financing activities 50 (32) (37)
Cash at beginning of period 130 261 251
Total cash generated 131 (10) 45
Implied cash at end of period 261 251 296
Source: Company data, RHB estimates
Company Report Card
Latest results. Ta Ann’s FY13 core net profit fell 30% y-o-y on the back of a 3% dip in revenue. Topline in the timber division fell due to lower log volume and lower plywood prices, which were offset by higher log prices and plywood volume. However, PBT margins improved to 14.8% (from 10.1% in FY12) due to higher profit in the log division and lower losses in its plywood business. The plantation division’s FY13 PBT dived 33% as prices fell 21%, although production volume rose by 5%. Plantations contributed 55% to PBT in FY13.
Balance sheet/cash flow. As at end-2013, Ta Ann’s net debt stood at MYR257.6m (or 26% net gearing), which is still very manageable given its interest cover of >10x. Operating cash flow is relatively stable at MYR150-250m per year.
ROE. Ta Ann’s ROE started to improve since 2012, on the back of rising timber product prices. We project ROEs to rise to 12-13% in FY14-15 from FY13’s 9.3%.
Dividend. Ta Ann does not have an official dividend policy, but generally tries to stick to a net payout ratio of close to 30%. This is expected to translate to net yields of 2.5-3% per annum.
Management. Ta Ann’s management is very experienced, having been in the timber industry for many years. It is led by Dato Wong Kuo Hea, who has been serving as managing director and CEO since 1999. Dato Wong was responsible for leading the group to become an established timber player from a small trading company and spearheading its commitment towards the sustainability of timber resources.
Recommendation
We have a BUY rating on Ta Ann, on the back of stronger earnings from its plantation division, a stable-to-improving outlook for the timber industry and the added benefit of the recent softening MYR against the USD. Our SOP-based FV is MYR5.00, based on target P/Es of 12.0x CY14F for the timber division and 16.0x CY14F for the plantation unit – in line with the company’s peers.
Top Malaysia Small Cap Companies 2014

71
Tambun Indah Land Target: MYR2.50
Price: MYR1.99
Best Penang Mainland Property Play
Tambun Indah Land (TILB MK)
0.7
0.9
1.1
1.3
1.5
1.7
1.9
2.1
88
108
128
148
168
188
208
228
Price Close Relative to FTSE Bursa Malaysia KLCI Index (RHS)
1
2
3
4
5
6
Apr-
13
Jun
-13
Aug
-13
Oct-
13
De
c-13
Fe
b-1
4
Vol m
Source: Bloomberg
Stock Profile
Bloomberg Ticker TILB MK
Avg Turnover (MYR/USD) 1.51m/0.46m
Net Gearing (%) -13.7
Market Cap (MYRm) 787m
Beta (x) 0.94
BVPS (MYR) 0.93
52-wk Price low/high (MYR) 0.91 - 2.00
Free float (%) 50
Major Shareholders (%)
Ir. Teh Kiak Seng 38.0
Share Performance (%)
1m 3m 6m 12m
Absolute 18.5 36.3 38.2 122.3
Relative 16.8 35.2 33.4 112.2
Loong Kok Wen CFA +603 9207 7614
Investment Merits
Deserves scarcity premium valuations as a pure Penang Mainland play
Prime beneficiary of investment news flow on Batu Kawan
Record land prices will re-rate Tambun Indah’s RNAV
Company Profile
Tambun Indah Land Bhd (Tambun Indah) is a developer based in Penang mainland. Its flagship project, the Pearl City township, is located in Seberang Perai Selatan, just 15 minutes from the Penang Second Bridge and Batu Kawan.
Highlights
Tambun Indah’s value is underpinned by its strategic anchor landbank, capable management, quality products, and solid balance sheet. It has 593 acres of land in the Pearl City township, and together with its projects in Seberang Perai Tengah and Seberang Perai Utara, the company commands a 15% share of the residential property market in Penang mainland. Being close to many established industrial parks, the growing working population creates a natural demand for properties particularly in a proper residential community.
Why scarcity premium? We argue that Tambun Indah deserves a scarcity premium to its valuations. Currently, there is no pure listed Penang mainland play in the property scene. Other competitors in the area, such as Wing Tai (WING MK, NR), Asas Dunia (ASAS MK, NR), Global Oriental (GOB MK, NR) and Malton (MALT MK, NR) are either not a pure play or have weaker earnings track record. By contrast, Tambun Indah’s concentration is solely on Penang mainland, and it has achieved a marvelous earnings track record with a 3-year net profit CAGR of 37%. We are confident that it will be able to sustain its strong growth momentum.
Prime beneficiary of investment news flow on Batu Kawan. We expect more news on Batu Kawan over the next few months, and Tambun Indah will be the prime beneficiary of the positive spillover of the investment flows there. The Batu Kawan developments, which are spearheaded by the Penang state government, have garnered strong investment interest from domestic and foreign players. Since last year, a few education players such as the University of Hull and KDU University College have announced plans to set up schools in Batu Kawan, while Ikano/Aspen and PE Land/CBRE will develop a lifestyle furniture/shopping mall and a premier shopping outlet there. In addition, new factories such as Haemonetics’ plant are under construction. As job opportunities and business activities increase, these will translate into higher demand for properties. In 1Q14, Tambun Indah saw strong sales and bookings amounting to MYR160m. This can easily surpass management’s full-year target of MYR500m.
Profit & Loss Dec-13 Dec-14F Dec-15F
Total turnover (MYRm) 376 466 580
Reported net profit (MYRm) 65 92 116
Recurring net profit (MYRm) 65 92 116
Recurring net profit growth (%) 59.2 41.5 26.2
Recurring EPS (MYR) 0.16 0.23 0.28
DPS (MYR) 0.06 0.08 0.10
Dividend Yield (%) 3.0 4.2 5.2
Recurring P/E (x) 12.07 8.64 7.02
Return on average equity (%) 24.4 26.9 28.1
P/B (x) 2.53 2.13 1.79
P/CF (x) 13.54 14.41 9.96
Source: Company data, RHB estimates
Balance Sheet (MYRm) Dec-13 Dec-14F Dec-15F
Total current assets 340 414 516
Total assets 497 591 711
Total current liabilities 110 139 176
Total non-current liabilities 74 74 74
Total liabilities 183 213 250
Shareholders' equity 310 373 455
Minority interests 4 5 6
Other equity (0) - 0
Total equity 314 378 461
Total liabilities & equity 497 591 711
Total debt 98 98 98
Net debt (28) (52) (90)
Source: Company data, RHB estimates
Cash flow (MYRm) Dec-13 Dec-14F Dec-15F
Cash flow from operations 58 55 82
Cash flow from investing activities (21) (20) (20)
Cash flow from financing activities (12) (11) (24)
Cash at beginning of period 96 126 150
Total cash generated 24 24 38
Forex effects 6
Implied cash at end of period 126 150 188
Source: Company data, RHB estimates
Record land prices to re-rate Tambun Indah’s RNAV. The upcoming land tender in Batu Kawan will likely further drive up land value in Seberang Perai Selatan. Eco World Development (ECW MK, NR) has been speculated to be the likely winner of the international golf course project, and many new developers have been actively scouting for landbank in the area. The last transacted prices in Batu Kawan were MYR45-55 psf. Based on a land value assumption of MYR40 psf, Tambun Indah’s 593 acres are worth MYR1.06bn vs the company’s current market cap of about RM780m.
Company Report Card
Latest results. The company’s FY13 earnings were strong, with an EPS growth of 21%. Unbilled sales currently stand at MYR455.5m.
Balance sheet/cash flow. Its balance sheet is solid with a net cash of MYR28m.
ROE. Tambun Indah’s ROE is on an expansionary trend. Its ROE was at 17% in FY11, and is expected to rise to 28% in FY15.
Dividend. The company has a policy of paying 40-60% of earnings as dividend. As such, we forecast DPS of 8 and 9.5 sen for FY14-15, translating into 4-5% yields.
Management. With a shareholding of 38%, Mr Teh Kiak Seng is the founder and managing director of the company. A civil engineer, Mr The has more than 30 years of experience in the housing industry. Tambun Indah is well managed by a group of architects, engineers and finance professionals. Its financial controller, Steve Neoh, joined the company in 2008 from Tejari Technologies Bhd. His cumulative experience includes providing assurance and consulting services to public listed and local corporations involved in the property development, construction, manufacturing and trading services sectors.
Recommendation
We value Tambun Indah at MYR2.50, on par with its RNAV/share. The implied P/E based on our FV is 8.8x for FY15. Our valuations are backed by the market value of the company’s landbank, plus net current assets minus long-term liabilities, amounting to MYR2.81 per share. The company’s sales and earnings growth drivers are well in place.
Top Malaysia Small Cap Companies 2014
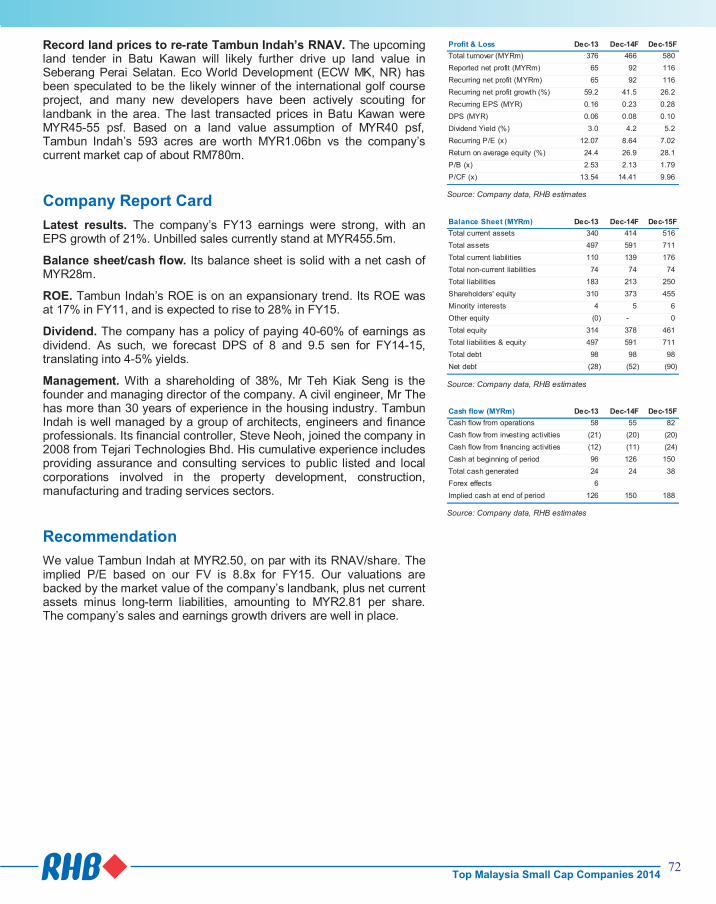
72
Tambun Indah Land Target: MYR2.50
Price: MYR1.99
Best Penang Mainland Property Play
Tambun Indah Land (TILB MK)
0.7
0.9
1.1
1.3
1.5
1.7
1.9
2.1
88
108
128
148
168
188
208
228
Price Close Relative to FTSE Bursa Malaysia KLCI Index (RHS)
1
2
3
4
5
6
Apr-
13
Jun
-13
Aug
-13
Oct-
13
De
c-13
Fe
b-1
4
Vol m
Source: Bloomberg
Stock Profile
Bloomberg Ticker TILB MK
Avg Turnover (MYR/USD) 1.51m/0.46m
Net Gearing (%) -13.7
Market Cap (MYRm) 787m
Beta (x) 0.94
BVPS (MYR) 0.93
52-wk Price low/high (MYR) 0.91 - 2.00
Free float (%) 50
Major Shareholders (%)
Ir. Teh Kiak Seng 38.0
Share Performance (%)
1m 3m 6m 12m
Absolute 18.5 36.3 38.2 122.3
Relative 16.8 35.2 33.4 112.2
Loong Kok Wen CFA +603 9207 7614
Investment Merits
Deserves scarcity premium valuations as a pure Penang Mainland play
Prime beneficiary of investment news flow on Batu Kawan
Record land prices will re-rate Tambun Indah’s RNAV
Company Profile
Tambun Indah Land Bhd (Tambun Indah) is a developer based in Penang mainland. Its flagship project, the Pearl City township, is located in Seberang Perai Selatan, just 15 minutes from the Penang Second Bridge and Batu Kawan.
Highlights
Tambun Indah’s value is underpinned by its strategic anchor landbank, capable management, quality products, and solid balance sheet. It has 593 acres of land in the Pearl City township, and together with its projects in Seberang Perai Tengah and Seberang Perai Utara, the company commands a 15% share of the residential property market in Penang mainland. Being close to many established industrial parks, the growing working population creates a natural demand for properties particularly in a proper residential community.
Why scarcity premium? We argue that Tambun Indah deserves a scarcity premium to its valuations. Currently, there is no pure listed Penang mainland play in the property scene. Other competitors in the area, such as Wing Tai (WING MK, NR), Asas Dunia (ASAS MK, NR), Global Oriental (GOB MK, NR) and Malton (MALT MK, NR) are either not a pure play or have weaker earnings track record. By contrast, Tambun Indah’s concentration is solely on Penang mainland, and it has achieved a marvelous earnings track record with a 3-year net profit CAGR of 37%. We are confident that it will be able to sustain its strong growth momentum.
Prime beneficiary of investment news flow on Batu Kawan. We expect more news on Batu Kawan over the next few months, and Tambun Indah will be the prime beneficiary of the positive spillover of the investment flows there. The Batu Kawan developments, which are spearheaded by the Penang state government, have garnered strong investment interest from domestic and foreign players. Since last year, a few education players such as the University of Hull and KDU University College have announced plans to set up schools in Batu Kawan, while Ikano/Aspen and PE Land/CBRE will develop a lifestyle furniture/shopping mall and a premier shopping outlet there. In addition, new factories such as Haemonetics’ plant are under construction. As job opportunities and business activities increase, these will translate into higher demand for properties. In 1Q14, Tambun Indah saw strong sales and bookings amounting to MYR160m. This can easily surpass management’s full-year target of MYR500m.
Profit & Loss Dec-13 Dec-14F Dec-15F
Total turnover (MYRm) 376 466 580
Reported net profit (MYRm) 65 92 116
Recurring net profit (MYRm) 65 92 116
Recurring net profit growth (%) 59.2 41.5 26.2
Recurring EPS (MYR) 0.16 0.23 0.28
DPS (MYR) 0.06 0.08 0.10
Dividend Yield (%) 3.0 4.2 5.2
Recurring P/E (x) 12.07 8.64 7.02
Return on average equity (%) 24.4 26.9 28.1
P/B (x) 2.53 2.13 1.79
P/CF (x) 13.54 14.41 9.96
Source: Company data, RHB estimates
Balance Sheet (MYRm) Dec-13 Dec-14F Dec-15F
Total current assets 340 414 516
Total assets 497 591 711
Total current liabilities 110 139 176
Total non-current liabilities 74 74 74
Total liabilities 183 213 250
Shareholders' equity 310 373 455
Minority interests 4 5 6
Other equity (0) - 0
Total equity 314 378 461
Total liabilities & equity 497 591 711
Total debt 98 98 98
Net debt (28) (52) (90)
Source: Company data, RHB estimates
Cash flow (MYRm) Dec-13 Dec-14F Dec-15F
Cash flow from operations 58 55 82
Cash flow from investing activities (21) (20) (20)
Cash flow from financing activities (12) (11) (24)
Cash at beginning of period 96 126 150
Total cash generated 24 24 38
Forex effects 6
Implied cash at end of period 126 150 188
Source: Company data, RHB estimates
Record land prices to re-rate Tambun Indah’s RNAV. The upcoming land tender in Batu Kawan will likely further drive up land value in Seberang Perai Selatan. Eco World Development (ECW MK, NR) has been speculated to be the likely winner of the international golf course project, and many new developers have been actively scouting for landbank in the area. The last transacted prices in Batu Kawan were MYR45-55 psf. Based on a land value assumption of MYR40 psf, Tambun Indah’s 593 acres are worth MYR1.06bn vs the company’s current market cap of about RM780m.
Company Report Card
Latest results. The company’s FY13 earnings were strong, with an EPS growth of 21%. Unbilled sales currently stand at MYR455.5m.
Balance sheet/cash flow. Its balance sheet is solid with a net cash of MYR28m.
ROE. Tambun Indah’s ROE is on an expansionary trend. Its ROE was at 17% in FY11, and is expected to rise to 28% in FY15.
Dividend. The company has a policy of paying 40-60% of earnings as dividend. As such, we forecast DPS of 8 and 9.5 sen for FY14-15, translating into 4-5% yields.
Management. With a shareholding of 38%, Mr Teh Kiak Seng is the founder and managing director of the company. A civil engineer, Mr The has more than 30 years of experience in the housing industry. Tambun Indah is well managed by a group of architects, engineers and finance professionals. Its financial controller, Steve Neoh, joined the company in 2008 from Tejari Technologies Bhd. His cumulative experience includes providing assurance and consulting services to public listed and local corporations involved in the property development, construction, manufacturing and trading services sectors.
Recommendation
We value Tambun Indah at MYR2.50, on par with its RNAV/share. The implied P/E based on our FV is 8.8x for FY15. Our valuations are backed by the market value of the company’s landbank, plus net current assets minus long-term liabilities, amounting to MYR2.81 per share. The company’s sales and earnings growth drivers are well in place.
Top Malaysia Small Cap Companies 2014
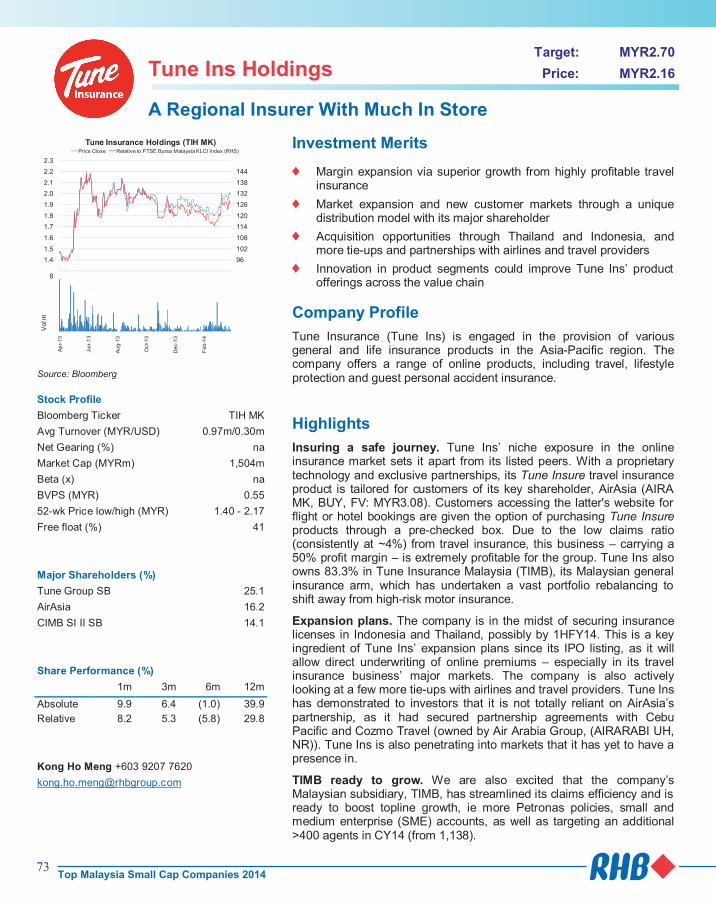
73
Tune Ins Holdings Target: MYR2.70
Price: MYR2.16
A Regional Insurer With Much In Store
90
96
102
108
114
120
126
132
138
144
1.3
1.4
1.5
1.6
1.7
1.8
1.9
2.0
2.1
2.2
2.3
Tune Insurance Holdings (TIH MK)Price Close Relative to FTSE Bursa Malaysia KLCI Index (RHS)
12345678
Ap
r-13
Jun
-13
Au
g-1
3
Oct-
13
Dec-1
3
Feb
-14
Vol m
Source: Bloomberg
Stock Profile
Bloomberg Ticker TIH MK
Avg Turnover (MYR/USD) 0.97m/0.30m
Net Gearing (%) na
Market Cap (MYRm) 1,504m
Beta (x) na
BVPS (MYR) 0.55
52-wk Price low/high (MYR) 1.40 - 2.17
Free float (%) 41
Major Shareholders (%)
Tune Group SB 25.1
AirAsia 16.2
CIMB SI II SB 14.1
Share Performance (%)
1m 3m 6m 12m
Absolute 9.9 6.4 (1.0) 39.9
Relative 8.2 5.3 (5.8) 29.8
Kong Ho Meng +603 9207 7620
Investment Merits
Margin expansion via superior growth from highly profitable travel insurance
Market expansion and new customer markets through a unique distribution model with its major shareholder
Acquisition opportunities through Thailand and Indonesia, and more tie-ups and partnerships with airlines and travel providers
Innovation in product segments could improve Tune Ins’ product offerings across the value chain
Company Profile
Tune Insurance (Tune Ins) is engaged in the provision of various general and life insurance products in the Asia-Pacific region. The company offers a range of online products, including travel, lifestyle protection and guest personal accident insurance.
Highlights
Insuring a safe journey. Tune Ins’ niche exposure in the online insurance market sets it apart from its listed peers. With a proprietary technology and exclusive partnerships, its Tune Insure travel insurance product is tailored for customers of its key shareholder, AirAsia (AIRA MK, BUY, FV: MYR3.08). Customers accessing the latter's website for flight or hotel bookings are given the option of purchasing Tune Insure products through a pre-checked box. Due to the low claims ratio (consistently at ~4%) from travel insurance, this business – carrying a 50% profit margin – is extremely profitable for the group. Tune Ins also owns 83.3% in Tune Insurance Malaysia (TIMB), its Malaysian general insurance arm, which has undertaken a vast portfolio rebalancing to shift away from high-risk motor insurance.
Expansion plans. The company is in the midst of securing insurance licenses in Indonesia and Thailand, possibly by 1HFY14. This is a key ingredient of Tune Ins’ expansion plans since its IPO listing, as it will allow direct underwriting of online premiums – especially in its travel insurance business’ major markets. The company is also actively looking at a few more tie-ups with airlines and travel providers. Tune Ins has demonstrated to investors that it is not totally reliant on AirAsia’s partnership, as it had secured partnership agreements with Cebu Pacific and Cozmo Travel (owned by Air Arabia Group, (AIRARABI UH, NR)). Tune Ins is also penetrating into markets that it has yet to have a presence in.
TIMB ready to grow. We are also excited that the company’s Malaysian subsidiary, TIMB, has streamlined its claims efficiency and is ready to boost topline growth, ie more Petronas policies, small and medium enterprise (SME) accounts, as well as targeting an additional >400 agents in CY14 (from 1,138).
Profit & Loss Dec-12 Dec-13 Dec-14F
Total operating income (MYRm) 217 241 265
Reported net profit (MYRm) 39 69 81
Recurring net profit (MYRm) 47 71 81
Recurring net profit growth (%) -3.6 48.9 18.3
Recurring EPS (MYR) 0.06 0.09 0.11
DPS (MYR) - 0.04 0.04
Dividend Yield (%) - 1.7 2.2
Recurring P/E (x) 33.29 25.23 19.46
P/B (x) 14.66 4.33 3.82
Source: Company data, RHB estimates
Balance Sheet (MYRm) Dec-12 Dec-13 Dec-14F
Total current assets 23 24 93
Total assets 815 1022 1166
Total current liabilities 231 117 140
Total non-current liabilities 4 5 3
Total liabilities 675 626 694
Shareholders' equity 107 359 413
Minority interests 34 37 58
Total equity 141 397 472
Total liabilities & equity 815 1022 1166
Source: Company data, RHB estimates
Key Ratios Dec-12 Dec-13 Dec-14F
Reinsurance ratio (%) 32.5 34.4 33.4
Retention ratio (%) 67.5 65.6 66.6
Claims ratio (%) 45.9 39.0 35.0
Commission ratio (%) 14.2 14.9 13.5
Expense ratio (%) 20.5 24.1 23.8
Combined ratio (%) 80.6 77.9 72.3
Underwriting margin (%) 19.4 22.1 27.7
Investment yield (%) 5.5 0.0 0.1
Liquidity ratio (%) 9.8 0.2 0.7
Source: Company data, RHB estimates
More surprises? We believe Tune Ins’ future plans have more to offer. The company has yet to: i) exploit/maximise the potential of its product innovation and data analytics to focus on key customer segments, ii) replicate its proprietary technology to other online distributors and direct channel sales, iii) improve product mix to customers of Tune Hotel and other travel solutions providers, and iv) be a potential beneficiary of markets that are progressing towards mandatory travel insurance.
Company Report Card
Latest results. Tune Ins’ FY13 core profit grew 45% vs revenue growth of 15%. This was supported by improved blended margins, given strong growth in the profitable online travel sales. Online premiums contributed 40.8% of the total net earned premium vs FY12’s 31.3%, as the company taps on the growing regional customer base of its airline partners.
ROE. ROE is expected to remain high at >20%, as Tune Ins utilises an asset-light business model. More importantly, the company’s de-risking strategies have resulted in TIMB’s capital adequacy ratio (CAR) improved significantly to 270% (FY12: 221%; FY11: 177%). These justify the premium valuations this stock is trading at.
Dividend. Tune Ins’ dividend policy is a minimum of 40% payout. In FY13, the company declared its first and final dividend 3.86 sen, translating into a yield of approximately 1.7%.
Management. CEO Peter Miller has been involved in the insurance industry for many years. This includes working for global insurance brokers, and assuming various positions in prominent banks and insurers. Through his extensive experience in bancassurance/ distribution strategies, Tune Ins has achieved many landmarks, forging multiple relationships and tie-ups within a span of three years since he joined the Tune Group in 2010. Staff strength has also grown to 358 (as at FY12) from merely 14. We expect more partnerships with various distributors across the value chain, as the company’s proposition has much to offer.
Recommendation
Maintain BUY, MYR2.70 FV. Our FV is pegged to 20x FY15F P/E. We view Tune Ins as a growth stock that deserves to trade at a premium to the sector’s 14-18x P/Es. This is given its high earnings growth expectations and margins expansion. We also like its market expansion angle, as it is the only listed insurer that has an Asean customer base. It is potentially moving towards a global customer base.
Tune Ins’ unique and profitable business model, as well as its travel insurance partnerships, combine the best of both insurance and consumer stocks. Notable online-centric consumer brands that offer travel solutions, like Expedia (EXPE US, NR), CTrip (CTRIP US, NR) and MakeMyTrip (MMYT US, NR), are all trading at forward P/Es of between 18.5-40x.
Top Malaysia Small Cap Companies 2014
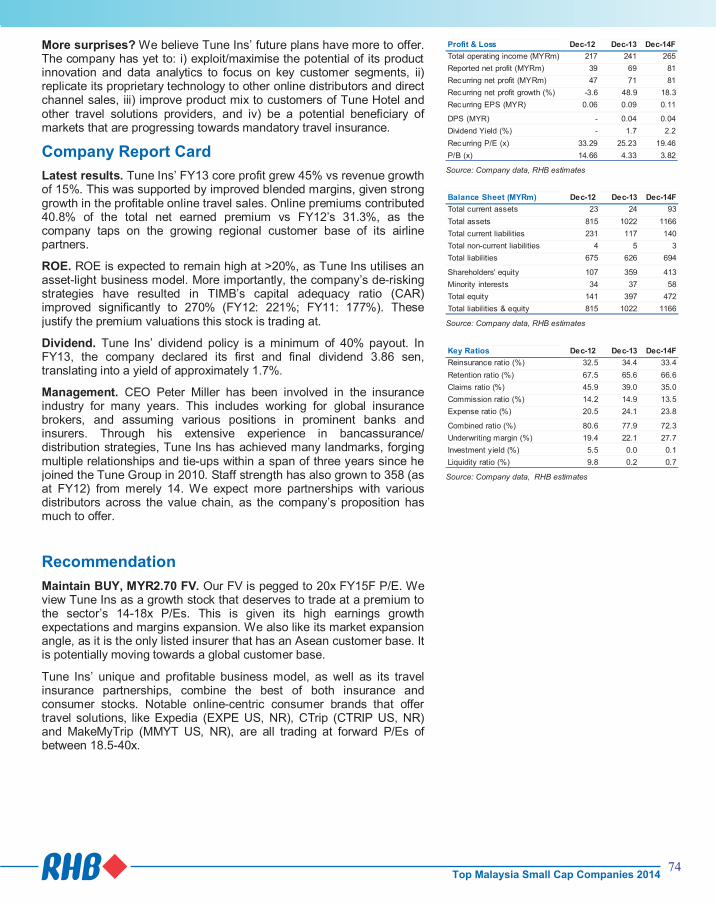
74
Tune Ins Holdings Target: MYR2.70
Price: MYR2.16
A Regional Insurer With Much In Store
90
96
102
108
114
120
126
132
138
144
1.3
1.4
1.5
1.6
1.7
1.8
1.9
2.0
2.1
2.2
2.3
Tune Insurance Holdings (TIH MK)Price Close Relative to FTSE Bursa Malaysia KLCI Index (RHS)
12345678
Ap
r-13
Jun
-13
Au
g-1
3
Oct-
13
Dec-1
3
Feb
-14
Vol m
Source: Bloomberg
Stock Profile
Bloomberg Ticker TIH MK
Avg Turnover (MYR/USD) 0.97m/0.30m
Net Gearing (%) na
Market Cap (MYRm) 1,504m
Beta (x) na
BVPS (MYR) 0.55
52-wk Price low/high (MYR) 1.40 - 2.17
Free float (%) 41
Major Shareholders (%)
Tune Group SB 25.1
AirAsia 16.2
CIMB SI II SB 14.1
Share Performance (%)
1m 3m 6m 12m
Absolute 9.9 6.4 (1.0) 39.9
Relative 8.2 5.3 (5.8) 29.8
Kong Ho Meng +603 9207 7620
Investment Merits
Margin expansion via superior growth from highly profitable travel insurance
Market expansion and new customer markets through a unique distribution model with its major shareholder
Acquisition opportunities through Thailand and Indonesia, and more tie-ups and partnerships with airlines and travel providers
Innovation in product segments could improve Tune Ins’ product offerings across the value chain
Company Profile
Tune Insurance (Tune Ins) is engaged in the provision of various general and life insurance products in the Asia-Pacific region. The company offers a range of online products, including travel, lifestyle protection and guest personal accident insurance.
Highlights
Insuring a safe journey. Tune Ins’ niche exposure in the online insurance market sets it apart from its listed peers. With a proprietary technology and exclusive partnerships, its Tune Insure travel insurance product is tailored for customers of its key shareholder, AirAsia (AIRA MK, BUY, FV: MYR3.08). Customers accessing the latter's website for flight or hotel bookings are given the option of purchasing Tune Insure products through a pre-checked box. Due to the low claims ratio (consistently at ~4%) from travel insurance, this business – carrying a 50% profit margin – is extremely profitable for the group. Tune Ins also owns 83.3% in Tune Insurance Malaysia (TIMB), its Malaysian general insurance arm, which has undertaken a vast portfolio rebalancing to shift away from high-risk motor insurance.
Expansion plans. The company is in the midst of securing insurance licenses in Indonesia and Thailand, possibly by 1HFY14. This is a key ingredient of Tune Ins’ expansion plans since its IPO listing, as it will allow direct underwriting of online premiums – especially in its travel insurance business’ major markets. The company is also actively looking at a few more tie-ups with airlines and travel providers. Tune Ins has demonstrated to investors that it is not totally reliant on AirAsia’s partnership, as it had secured partnership agreements with Cebu Pacific and Cozmo Travel (owned by Air Arabia Group, (AIRARABI UH, NR)). Tune Ins is also penetrating into markets that it has yet to have a presence in.
TIMB ready to grow. We are also excited that the company’s Malaysian subsidiary, TIMB, has streamlined its claims efficiency and is ready to boost topline growth, ie more Petronas policies, small and medium enterprise (SME) accounts, as well as targeting an additional >400 agents in CY14 (from 1,138).
Profit & Loss Dec-12 Dec-13 Dec-14F
Total operating income (MYRm) 217 241 265
Reported net profit (MYRm) 39 69 81
Recurring net profit (MYRm) 47 71 81
Recurring net profit growth (%) -3.6 48.9 18.3
Recurring EPS (MYR) 0.06 0.09 0.11
DPS (MYR) - 0.04 0.04
Dividend Yield (%) - 1.7 2.2
Recurring P/E (x) 33.29 25.23 19.46
P/B (x) 14.66 4.33 3.82
Source: Company data, RHB estimates
Balance Sheet (MYRm) Dec-12 Dec-13 Dec-14F
Total current assets 23 24 93
Total assets 815 1022 1166
Total current liabilities 231 117 140
Total non-current liabilities 4 5 3
Total liabilities 675 626 694
Shareholders' equity 107 359 413
Minority interests 34 37 58
Total equity 141 397 472
Total liabilities & equity 815 1022 1166
Source: Company data, RHB estimates
Key Ratios Dec-12 Dec-13 Dec-14F
Reinsurance ratio (%) 32.5 34.4 33.4
Retention ratio (%) 67.5 65.6 66.6
Claims ratio (%) 45.9 39.0 35.0
Commission ratio (%) 14.2 14.9 13.5
Expense ratio (%) 20.5 24.1 23.8
Combined ratio (%) 80.6 77.9 72.3
Underwriting margin (%) 19.4 22.1 27.7
Investment yield (%) 5.5 0.0 0.1
Liquidity ratio (%) 9.8 0.2 0.7
Source: Company data, RHB estimates
More surprises? We believe Tune Ins’ future plans have more to offer. The company has yet to: i) exploit/maximise the potential of its product innovation and data analytics to focus on key customer segments, ii) replicate its proprietary technology to other online distributors and direct channel sales, iii) improve product mix to customers of Tune Hotel and other travel solutions providers, and iv) be a potential beneficiary of markets that are progressing towards mandatory travel insurance.
Company Report Card
Latest results. Tune Ins’ FY13 core profit grew 45% vs revenue growth of 15%. This was supported by improved blended margins, given strong growth in the profitable online travel sales. Online premiums contributed 40.8% of the total net earned premium vs FY12’s 31.3%, as the company taps on the growing regional customer base of its airline partners.
ROE. ROE is expected to remain high at >20%, as Tune Ins utilises an asset-light business model. More importantly, the company’s de-risking strategies have resulted in TIMB’s capital adequacy ratio (CAR) improved significantly to 270% (FY12: 221%; FY11: 177%). These justify the premium valuations this stock is trading at.
Dividend. Tune Ins’ dividend policy is a minimum of 40% payout. In FY13, the company declared its first and final dividend 3.86 sen, translating into a yield of approximately 1.7%.
Management. CEO Peter Miller has been involved in the insurance industry for many years. This includes working for global insurance brokers, and assuming various positions in prominent banks and insurers. Through his extensive experience in bancassurance/ distribution strategies, Tune Ins has achieved many landmarks, forging multiple relationships and tie-ups within a span of three years since he joined the Tune Group in 2010. Staff strength has also grown to 358 (as at FY12) from merely 14. We expect more partnerships with various distributors across the value chain, as the company’s proposition has much to offer.
Recommendation
Maintain BUY, MYR2.70 FV. Our FV is pegged to 20x FY15F P/E. We view Tune Ins as a growth stock that deserves to trade at a premium to the sector’s 14-18x P/Es. This is given its high earnings growth expectations and margins expansion. We also like its market expansion angle, as it is the only listed insurer that has an Asean customer base. It is potentially moving towards a global customer base.
Tune Ins’ unique and profitable business model, as well as its travel insurance partnerships, combine the best of both insurance and consumer stocks. Notable online-centric consumer brands that offer travel solutions, like Expedia (EXPE US, NR), CTrip (CTRIP US, NR) and MakeMyTrip (MMYT US, NR), are all trading at forward P/Es of between 18.5-40x.
Top Malaysia Small Cap Companies 2014

75
Yinson Holdings Target: MYR10.90
Price: MYR8.88
Emerging From The Winds Of Change
76
114
151
189
226
264
301
339
376
2
3
4
5
6
7
8
9
10
Yinson Holdings (YNS MK)Price Close Relative to FTSE Bursa Malaysia KLCI Index (RHS)
1122334
Ap
r-13
Jun
-13
Au
g-1
3
Oct-
13
Dec-1
3
Feb
-14
Vol m
Source: Bloomberg
Stock Profile
Bloomberg Ticker YNS MK
Avg Turnover (MYR/USD) 2.84m/0.86m
Net Gearing (%) 195.4
Market Cap (MYRm) 2,295m
Beta (x) 1.32
BVPS (MYR) 2.14
52-wk Price low/high (MYR) 2.69 - 9.16
Free float (%) 51
Major Shareholders (%)
Han Weng Lim 26.0
Kencana Capital SB 18.5
Kim Lian Bah 9.0
Share Performance (%)
1m 3m 6m 12m
Absolute 3.9 29.4 83.3 231.7
Relative 2.2 28.3 78.5 221.6
Kong Ho Meng +603 9207 7620
Investment Merits
Fortified equity branding propelled the company to be the sixth largest floating, production, offloading and storage (FPSO) player globally, and Asia’s second-largest
A foothold in all high-growth FPSO markets – Asia, Africa and South America
Long-term earnings visibility – all FPSO contracts have average remaining firm periods for at least the next four years
Conservative policies – aims for contracts with long firm periods and value fast paybacks
Company Profile
Yinson Holdings is an investment holding company. Through subsidiaries, it provides offshore support services such as trading and logistics to the upstream oil and gas sector. It is also involved in commodity trading.
Highlights
Transformation story. Yinson has emerged as a significant FPSO player from its original core business in logistics and commodity trading. This transformation story was essentially spurred by two major events: i) its joint ventures (JVs) with Vietnam Oil & Gas Group (Petrovietnam) on the floating, offloading and storage vessel (FSO) the FSO Bien Dong and the FPSO Lam Son, and ii) its acquisition of Fred Olsen Production ASA (now Yinson Production AS) that owns three FPSOs and operates a mobile offshore production unit (MOPU).
Reaping synergies. Yinson Production AS was a strategic acquisition for the group. The opportunity came about via a negotiation with Fred Olsen Production, which had to pull out from the FPSO Lam Son project due to financing issues. Yinson gained: i) Fred Olsen’s expertise as a Norwegian offshore firm with over 150 years of experience and 450 capable employees, ii) its track record of over 10 successful projects delivered and a niche in low- to mid-sized FPSO jobs, iii) an additional fleet, iv) an additional clientele base in West Africa and South America, and v) its existing orderbook of over MYR3.5bn. Moreover, the business marriage was synergistic, as it offered engineering capabilities that Yinson did not previously have.
FPSO strategy. Yinson is well-positioned in its niche as an operator of mid-sized FPSOs (capex in the range of USD250-700m). This separates itself from the Top 5 global FPSO players, which have bigger scale to manage more complicated, bigger FPSO projects. The company is actively bidding for a number of FPSO projects in regions that see good demand for such vessels.
Profit & Loss Jan-13 Jan-14 Jan-15F
Total turnover (MYRm) 865 946 1,484
Reported net profit (MYRm) 34 67 123
Recurring net profit (MYRm) 42 53 123
Recurring net profit growth (%) 76.4 26.8 131.1
Recurring EPS (MYR) 0.16 0.21 0.47
Recurring P/E (x) 54.98 43.36 18.76
Return on average equity (%) 15.4 11.5 14.6
P/B (x) 8.0 4.1 2.0
P/CF (x) na 79.42 31.56
Source: Company data, RHB estimates
Balance Sheet (MYRm) Jan-13 Jan-14 Jan-15F
Total current assets 355 745 839
Total assets 801 2151 2404
Total current liabilities 375 839 643
Total non-current liabilities 142 788 612
Total liabilities 517 1627 1255
Shareholders' equity 281 518 1129
Minority interests 3 6 19
Total equity 284 524 1148
Total liabilities & equity 801 2151 2403
Total debt 449 1290 998
Net debt 425 1012 712
Source: Company data, RHB estimates
Cash Flow (MYRm) Jan-13 Jan-14 Jan-15F
Cash flow from operations (52) (26) 63
Cash flow from investing activities (173) (377) (141)
Cash flow from financing activities 219 590 302
Cash at beginning of period 24 278 286
Total cash generated (6) 187 224
Forex effects (13) (3) 0
Implied cash at end of period 24 210 286
Source: Company data, RHB estimates
Conservatism. Management adopts a prudent strategy and will only accept projects with long firm contract periods. This is consistent with its risk management policies of sustaining stable cash flow and hedging itself against industry risks. Compared with the majority of its peers, we note that Yinson has a higher proportion of firm periods in its average contract life (about ~60%). Securing a Petronas licence. Aside from bidding for global FPSO jobs, Yinson is expected to be more involved in oil & gas (O&G) projects in Malaysia – possibly in marginal fields – as it is in the midst of securing a Petronas license through its associate. At this juncture, the company is not keen to expand its capabilities into floating liquefied natural gas (FLNG) projects, as the substantial capex requirements are not in line with its mid-sized FPSO niche.
Company Report Card
Latest results. Yinson’s FY14 core profit rose 26.8% on the back of higher contributions from the chartering of two vessels, ie a 1-month contribution from Yinson Production’s FPSO fleet and maiden contributions from the FSO Bien Dong, which is accounted for as income from JVs.
Balance sheet/cash flow. Net gearing rose to 1.9x in FY14 as a result of the consolidation of debts of Yinson Production and a MYR400m acquisition loan. However, Yinson is carrying out a rights issue that will raise up to MYR500-600m in gross proceeds, partially to pare down its net gearing to our 0.6-0.7x forecast.
ROE. We expect ROE to be diluted to 11-12% due to the series of capital-raising carried out in the past. This is in line with the ROE of its competitor, Bumi Armada (BAB MK, BUY, FV: MYR4.45).
Dividend. Yinson has been consistently paying a 2.5% dividend for the past five financial years. We expect the company to announce its FY14 dividend closer to its AGM.
Management. Mr Lim Chern Yuan, the son of the founder and group chairman Mr Lim Han Weng, was recently appointed as the CEO of Yinson. He was spearheading various operations of the group prior to this appointment. Given the young blood of the current management team, we believe Yinson will be actively hunting for more business opportunities.
Recommendation
BUY with a FV of MYR10.90. Our FV is based on SOP, which uses a DCF valuation on Yinson’s FPSO business (valued on both firm and extension contracts). This implies a 23x FY15F P/E, in line with that of Bumi Armada’s. We like the company’s transformation story and management’s prudent strategies in undertaking a business that can be cyclical in nature.
Our FV will be adjusted to MYR2.70-3.00 post rights issue and share split (completion expected towards 2HCY14). We are assuming Yinson will: i) secure an average of one floating production unit contract every two years, and ii) repay its MYR240m debt from the proceeds of the rights issue.
Top Malaysia Small Cap Companies 2014

76
Yinson Holdings Target: MYR10.90
Price: MYR8.88
Emerging From The Winds Of Change
76
114
151
189
226
264
301
339
376
2
3
4
5
6
7
8
9
10
Yinson Holdings (YNS MK)Price Close Relative to FTSE Bursa Malaysia KLCI Index (RHS)
1122334
Ap
r-13
Jun
-13
Au
g-1
3
Oct-
13
Dec-1
3
Feb
-14
Vol m
Source: Bloomberg
Stock Profile
Bloomberg Ticker YNS MK
Avg Turnover (MYR/USD) 2.84m/0.86m
Net Gearing (%) 195.4
Market Cap (MYRm) 2,295m
Beta (x) 1.32
BVPS (MYR) 2.14
52-wk Price low/high (MYR) 2.69 - 9.16
Free float (%) 51
Major Shareholders (%)
Han Weng Lim 26.0
Kencana Capital SB 18.5
Kim Lian Bah 9.0
Share Performance (%)
1m 3m 6m 12m
Absolute 3.9 29.4 83.3 231.7
Relative 2.2 28.3 78.5 221.6
Kong Ho Meng +603 9207 7620
Investment Merits
Fortified equity branding propelled the company to be the sixth largest floating, production, offloading and storage (FPSO) player globally, and Asia’s second-largest
A foothold in all high-growth FPSO markets – Asia, Africa and South America
Long-term earnings visibility – all FPSO contracts have average remaining firm periods for at least the next four years
Conservative policies – aims for contracts with long firm periods and value fast paybacks
Company Profile
Yinson Holdings is an investment holding company. Through subsidiaries, it provides offshore support services such as trading and logistics to the upstream oil and gas sector. It is also involved in commodity trading.
Highlights
Transformation story. Yinson has emerged as a significant FPSO player from its original core business in logistics and commodity trading. This transformation story was essentially spurred by two major events: i) its joint ventures (JVs) with Vietnam Oil & Gas Group (Petrovietnam) on the floating, offloading and storage vessel (FSO) the FSO Bien Dong and the FPSO Lam Son, and ii) its acquisition of Fred Olsen Production ASA (now Yinson Production AS) that owns three FPSOs and operates a mobile offshore production unit (MOPU).
Reaping synergies. Yinson Production AS was a strategic acquisition for the group. The opportunity came about via a negotiation with Fred Olsen Production, which had to pull out from the FPSO Lam Son project due to financing issues. Yinson gained: i) Fred Olsen’s expertise as a Norwegian offshore firm with over 150 years of experience and 450 capable employees, ii) its track record of over 10 successful projects delivered and a niche in low- to mid-sized FPSO jobs, iii) an additional fleet, iv) an additional clientele base in West Africa and South America, and v) its existing orderbook of over MYR3.5bn. Moreover, the business marriage was synergistic, as it offered engineering capabilities that Yinson did not previously have.
FPSO strategy. Yinson is well-positioned in its niche as an operator of mid-sized FPSOs (capex in the range of USD250-700m). This separates itself from the Top 5 global FPSO players, which have bigger scale to manage more complicated, bigger FPSO projects. The company is actively bidding for a number of FPSO projects in regions that see good demand for such vessels.
Profit & Loss Jan-13 Jan-14 Jan-15F
Total turnover (MYRm) 865 946 1,484
Reported net profit (MYRm) 34 67 123
Recurring net profit (MYRm) 42 53 123
Recurring net profit growth (%) 76.4 26.8 131.1
Recurring EPS (MYR) 0.16 0.21 0.47
Recurring P/E (x) 54.98 43.36 18.76
Return on average equity (%) 15.4 11.5 14.6
P/B (x) 8.0 4.1 2.0
P/CF (x) na 79.42 31.56
Source: Company data, RHB estimates
Balance Sheet (MYRm) Jan-13 Jan-14 Jan-15F
Total current assets 355 745 839
Total assets 801 2151 2404
Total current liabilities 375 839 643
Total non-current liabilities 142 788 612
Total liabilities 517 1627 1255
Shareholders' equity 281 518 1129
Minority interests 3 6 19
Total equity 284 524 1148
Total liabilities & equity 801 2151 2403
Total debt 449 1290 998
Net debt 425 1012 712
Source: Company data, RHB estimates
Cash Flow (MYRm) Jan-13 Jan-14 Jan-15F
Cash flow from operations (52) (26) 63
Cash flow from investing activities (173) (377) (141)
Cash flow from financing activities 219 590 302
Cash at beginning of period 24 278 286
Total cash generated (6) 187 224
Forex effects (13) (3) 0
Implied cash at end of period 24 210 286
Source: Company data, RHB estimates
Conservatism. Management adopts a prudent strategy and will only accept projects with long firm contract periods. This is consistent with its risk management policies of sustaining stable cash flow and hedging itself against industry risks. Compared with the majority of its peers, we note that Yinson has a higher proportion of firm periods in its average contract life (about ~60%). Securing a Petronas licence. Aside from bidding for global FPSO jobs, Yinson is expected to be more involved in oil & gas (O&G) projects in Malaysia – possibly in marginal fields – as it is in the midst of securing a Petronas license through its associate. At this juncture, the company is not keen to expand its capabilities into floating liquefied natural gas (FLNG) projects, as the substantial capex requirements are not in line with its mid-sized FPSO niche.
Company Report Card
Latest results. Yinson’s FY14 core profit rose 26.8% on the back of higher contributions from the chartering of two vessels, ie a 1-month contribution from Yinson Production’s FPSO fleet and maiden contributions from the FSO Bien Dong, which is accounted for as income from JVs.
Balance sheet/cash flow. Net gearing rose to 1.9x in FY14 as a result of the consolidation of debts of Yinson Production and a MYR400m acquisition loan. However, Yinson is carrying out a rights issue that will raise up to MYR500-600m in gross proceeds, partially to pare down its net gearing to our 0.6-0.7x forecast.
ROE. We expect ROE to be diluted to 11-12% due to the series of capital-raising carried out in the past. This is in line with the ROE of its competitor, Bumi Armada (BAB MK, BUY, FV: MYR4.45).
Dividend. Yinson has been consistently paying a 2.5% dividend for the past five financial years. We expect the company to announce its FY14 dividend closer to its AGM.
Management. Mr Lim Chern Yuan, the son of the founder and group chairman Mr Lim Han Weng, was recently appointed as the CEO of Yinson. He was spearheading various operations of the group prior to this appointment. Given the young blood of the current management team, we believe Yinson will be actively hunting for more business opportunities.
Recommendation
BUY with a FV of MYR10.90. Our FV is based on SOP, which uses a DCF valuation on Yinson’s FPSO business (valued on both firm and extension contracts). This implies a 23x FY15F P/E, in line with that of Bumi Armada’s. We like the company’s transformation story and management’s prudent strategies in undertaking a business that can be cyclical in nature.
Our FV will be adjusted to MYR2.70-3.00 post rights issue and share split (completion expected towards 2HCY14). We are assuming Yinson will: i) secure an average of one floating production unit contract every two years, and ii) repay its MYR240m debt from the proceeds of the rights issue.
Top Malaysia Small Cap Companies 2014
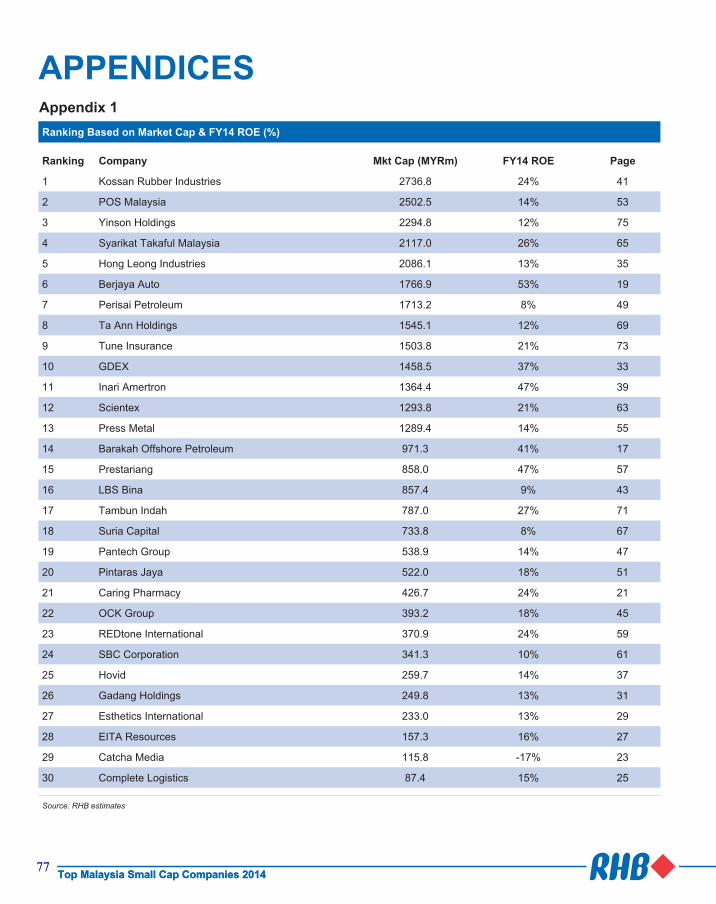
7777Top Malaysia Small Cap Companies 2014
APPENDICESAppendix 1Ranking Based on Market Cap & FY14 ROE (%)
Ranking Company Mkt Cap (MYRm) FY14 ROE Page
1 Kossan Rubber Industries 2736.8 24% 41
2 POS Malaysia 2502.5 14% 53
3 Yinson Holdings 2294.8 12% 75
4 Syarikat Takaful Malaysia 2117.0 26% 65
5 Hong Leong Industries 2086.1 13% 35
6 Berjaya Auto 1766.9 53% 19
7 Perisai Petroleum 1713.2 8% 49
8 Ta Ann Holdings 1545.1 12% 69
9 Tune Insurance 1503.8 21% 73
10 GDEX 1458.5 37% 33
11 Inari Amertron 1364.4 47% 39
12 Scientex 1293.8 21% 63
13 Press Metal 1289.4 14% 55
14 Barakah Offshore Petroleum 971.3 41% 17
15 Prestariang 858.0 47% 57
16 LBS Bina 857.4 9% 43
17 Tambun Indah 787.0 27% 71
18 Suria Capital 733.8 8% 67
19 Pantech Group 538.9 14% 47
20 Pintaras Jaya 522.0 18% 51
21 Caring Pharmacy 426.7 24% 21
22 OCK Group 393.2 18% 45
23 REDtone International 370.9 24% 59
24 SBC Corporation 341.3 10% 61
25 Hovid 259.7 14% 37
26 Gadang Holdings 249.8 13% 31
27 Esthetics International 233.0 13% 29
28 EITA Resources 157.3 16% 27
29 Catcha Media 115.8 -17% 23
30 Complete Logistics 87.4 15% 25
Source: RHB estimates
Top Malaysia Small Cap Companies 2014
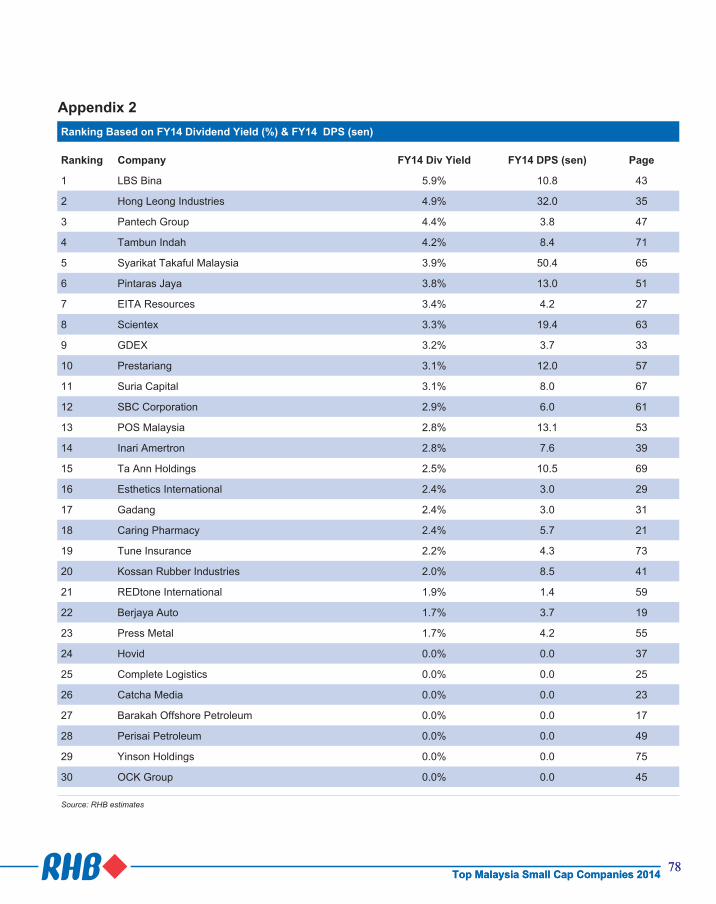
7878Top Malaysia Small Cap Companies 2014
Appendix 2Ranking Based on FY14 Dividend Yield (%) & FY14 DPS (sen)
Ranking Company FY14 Div Yield FY14 DPS (sen) Page
1 LBS Bina 5.9% 10.8 43
2 Hong Leong Industries 4.9% 32.0 35
3 Pantech Group 4.4% 3.8 47
4 Tambun Indah 4.2% 8.4 71
5 Syarikat Takaful Malaysia 3.9% 50.4 65
6 Pintaras Jaya 3.8% 13.0 51
7 EITA Resources 3.4% 4.2 27
8 Scientex 3.3% 19.4 63
9 GDEX 3.2% 3.7 33
10 Prestariang 3.1% 12.0 57
11 Suria Capital 3.1% 8.0 67
12 SBC Corporation 2.9% 6.0 61
13 POS Malaysia 2.8% 13.1 53
14 Inari Amertron 2.8% 7.6 39
15 Ta Ann Holdings 2.5% 10.5 69
16 Esthetics International 2.4% 3.0 29
17 Gadang 2.4% 3.0 31
18 Caring Pharmacy 2.4% 5.7 21
19 Tune Insurance 2.2% 4.3 73
20 Kossan Rubber Industries 2.0% 8.5 41
21 REDtone International 1.9% 1.4 59
22 Berjaya Auto 1.7% 3.7 19
23 Press Metal 1.7% 4.2 55
24 Hovid 0.0% 0.0 37
25 Complete Logistics 0.0% 0.0 25
26 Catcha Media 0.0% 0.0 23
27 Barakah Offshore Petroleum 0.0% 0.0 17
28 Perisai Petroleum 0.0% 0.0 49
29 Yinson Holdings 0.0% 0.0 75
30 OCK Group 0.0% 0.0 45
Source: RHB estimates
Top Malaysia Small Cap Companies 2014

7979Top Malaysia Small Cap Companies 2014
Appendix 3
Ranking based on FY14 P/E (x) & FY14 EPS (sen)
Ranking Company PF14 P/E (x) FY14 EPS (sen) Page
1 Press Metal 6.0 41.9 55
2 Complete Logistics 6.0 12.0 25
3 SBC Corporation 6.9 32.0 61
4 Gadang Holdings 7.1 18.0 31
5 EITA Resources 8.6 14.4 27
6 Tambun Indah 8.6 23.0 71
7 Scientex 8.9 65.6 63
8 Pintaras Jaya 9.9 33.0 51
9 Pantech Group 9.9 9.6 47
10 Barakah Offshore Petroleum 10.4 15.0 17
11 Suria Capital 11.3 23.0 67
12 LBS Bina 11.4 16.0 43
13 Hovid 11.4 3.2 37
14 Ta Ann Holdings 12.0 34.6 69
15 REDtone International 13.1 5.8 59
16 Syarikat Takaful Malaysia 13.4 96.8 65
17 Hong Leong Industries 13.6 48.1 35
18 Berjaya Auto 14.1 15.6 19
19 Inari Amertron 14.4 19.1 39
20 Esthetics International 14.7 8.5 29
21 Kossan Rubber Industries 15.0 28.5 41
22 Caring Pharmacy 16.7 11.7 21
23 Prestariang 16.9 23.1 57
24 POS Malaysia 17.9 26.0 53
25 Tune Insurance 19.5 10.8 73
26 OCK Group 24.4 5.7 45
27 Perisai Petroleum 25.7 6.2 49
28 Yinson Holdings 42.3 21.0 75
29 GDEX 59.9 2.9 33
30 Catcha Media nm -2.6 23
Source: RHB estimates
Top Malaysia Small Cap Companies 2014
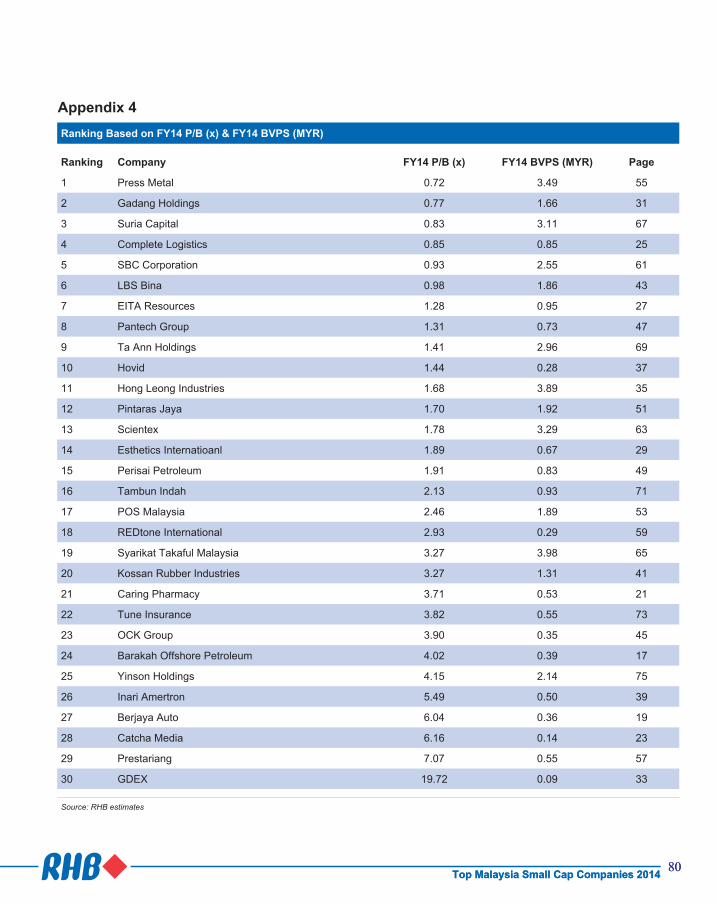
8080Top Malaysia Small Cap Companies 2014
Appendix 4
Ranking Based on FY14 P/B (x) & FY14 BVPS (MYR)
Ranking Company FY14 P/B (x) FY14 BVPS (MYR) Page
1 Press Metal 0.72 3.49 55
2 Gadang Holdings 0.77 1.66 31
3 Suria Capital 0.83 3.11 67
4 Complete Logistics 0.85 0.85 25
5 SBC Corporation 0.93 2.55 61
6 LBS Bina 0.98 1.86 43
7 EITA Resources 1.28 0.95 27
8 Pantech Group 1.31 0.73 47
9 Ta Ann Holdings 1.41 2.96 69
10 Hovid 1.44 0.28 37
11 Hong Leong Industries 1.68 3.89 35
12 Pintaras Jaya 1.70 1.92 51
13 Scientex 1.78 3.29 63
14 Esthetics Internatioanl 1.89 0.67 29
15 Perisai Petroleum 1.91 0.83 49
16 Tambun Indah 2.13 0.93 71
17 POS Malaysia 2.46 1.89 53
18 REDtone International 2.93 0.29 59
19 Syarikat Takaful Malaysia 3.27 3.98 65
20 Kossan Rubber Industries 3.27 1.31 41
21 Caring Pharmacy 3.71 0.53 21
22 Tune Insurance 3.82 0.55 73
23 OCK Group 3.90 0.35 45
24 Barakah Offshore Petroleum 4.02 0.39 17
25 Yinson Holdings 4.15 2.14 75
26 Inari Amertron 5.49 0.50 39
27 Berjaya Auto 6.04 0.36 19
28 Catcha Media 6.16 0.14 23
29 Prestariang 7.07 0.55 57
30 GDEX 19.72 0.09 33
Source: RHB estimates
Top Malaysia Small Cap Companies 2014
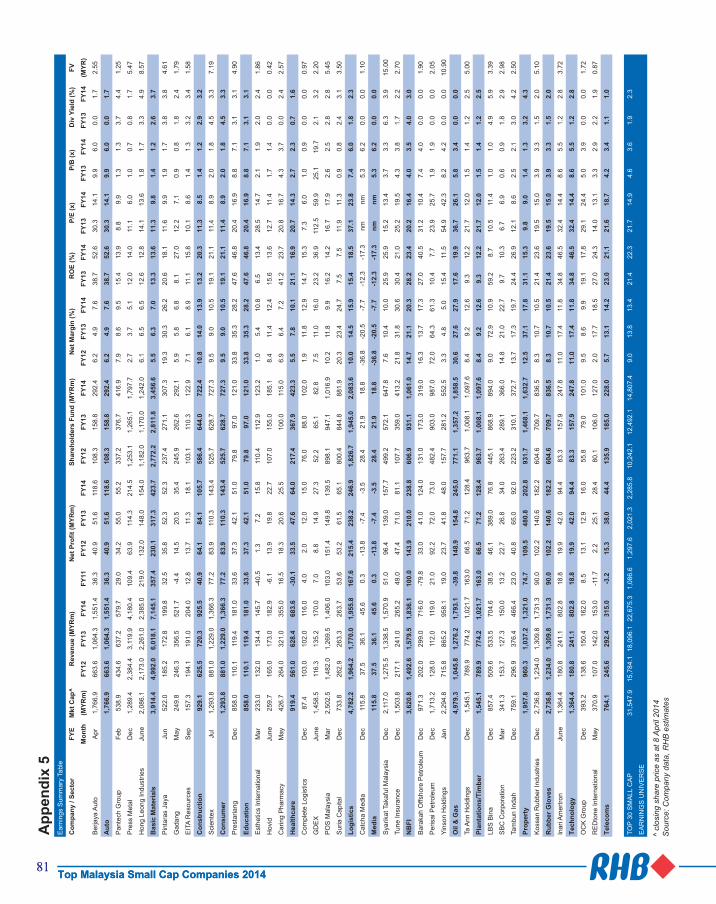
8181Top Malaysia Small Cap Companies 2014
App
endi
x 5
Ear
ning
s S
umm
ary
Tabl
e
Com
pany
/ S
ecto
rFY
EM
kt C
ap^
Rev
enue
(MY
Rm
)N
et P
rofit
(MY
Rm
)S
hare
hold
ers
Fund
(MY
Rm
)N
et M
argi
n (%
)R
OE
(%)
P/E
(x)
P/B
(x)
Div
Yie
ld (%
)FV
Mon
th(M
YR
m)
FY12
FY13
FY14
FY11
FY12
FY13
FY14
FY12
FY13
FY14
FY12
FY13
FY14
FY13
FY14
FY13
FY14
FY13
FY14
FY13
FY14
(MY
R)
Ber
jaya
Aut
oA
pr1,
766.
966
3.6
1,06
4.3
1,55
1.4
36.3
40.9
51.6
118.
610
8.3
158.
829
2.4
6.2
4.9
7.6
38.7
52.6
30.3
14.1
9.9
6.0
0.0
1.7
2.55
Aut
o1,
766.
966
3.6
1,06
4.3
1,55
1.4
36.3
40.9
51.6
118.
610
8.3
158.
829
2.4
6.2
4.9
7.6
38.7
52.6
30.3
14.1
9.9
6.0
0.0
1.7
Pan
tech
Gro
upFe
b53
8.9
434.
663
7.2
579.
729
.034
.255
.055
.233
7.2
376.
741
6.9
7.9
8.6
9.5
15.4
13.9
8.8
9.9
1.3
1.3
3.7
4.4
1.25
Pre
ss M
etal
Dec
1,28
9.4
2,38
4.4
3,11
9.9
4,18
0.4
109.
463
.911
4.3
214.
51,
253.
11,
265.
11,
797.
72.
73.
75.
112
.014
.011
.16.
01.
00.
70.
81.
75.
47
Hon
g Le
ong
Indu
strie
sJu
ne2,
086.
12,
173.
02,
261.
02,
385.
021
9.0
132.
014
8.0
154.
01,
182.
01,
170.
01,
242.
06.
16.
56.
512
.612
.814
.113
.61.
81.
73.
34.
98.
57
Bas
ic M
ater
ials
3,91
4.4
4,99
2.0
6,01
8.1
7,14
5.1
357.
423
0.1
317.
342
3.7
2,77
2.2
2,81
1.8
3,45
6.6
5.5
6.3
7.0
13.3
13.6
11.3
9.8
1.4
1.2
2.6
3.7
Pin
tara
s Ja
yaJu
n52
2.0
185.
217
2.8
199.
832
.535
.852
.352
.323
7.4
271.
130
7.3
19.3
30.3
26.2
20.6
18.1
11.6
9.9
1.9
1.7
3.8
3.8
4.61
Gad
ang
May
249.
824
6.3
356.
552
1.7
-4.4
14.5
20.5
35.4
245.
926
2.6
292.
15.
95.
86.
88.
127
.012
.27.
10.
90.
81.
82.
41.
79
EIT
A R
esou
rces
Sep
157.
319
4.1
191.
020
4.0
12.8
13.7
11.3
18.1
103.
111
0.3
122.
97.
16.
18.
911
.115
.810
.18.
61.
41.
33.
23.
41.
58
Con
stru
ctio
n92
9.1
625.
572
0.3
925.
540
.964
.184
.110
5.7
586.
464
4.0
722.
410
.814
.013
.913
.220
.311
.38.
51.
41.
22.
93.
2
Sci
ente
xJu
l1,
293.
888
1.0
1,22
9.0
1,36
6.3
77.2
83.9
110.
314
3.4
525.
762
8.7
727.
39.
59.
010
.519
.121
.111
.48.
92.
01.
84.
53.
37.
19
Con
sum
er1,
293.
888
1.0
1,22
9.0
1,36
6.3
77.2
83.9
110.
314
3.4
525.
762
8.7
727.
39.
59.
010
.519
.121
.111
.48.
92.
01.
84.
53.
3
Pre
star
iang
Dec
858.
011
0.1
119.
418
1.0
33.6
37.3
42.1
51.0
79.8
97.0
121.
033
.835
.328
.247
.646
.820
.416
.98.
87.
13.
13.
14.
90
Edu
catio
n85
8.0
110.
111
9.4
181.
033
.637
.342
.151
.079
.897
.012
1.0
33.8
35.3
28.2
47.6
46.8
20.4
16.9
8.8
7.1
3.1
3.1
Est
hetic
s In
tern
atio
nal
Mar
233.
013
2.0
134.
414
5.7
-40.
51.
37.
215
.811
0.4
112.
912
3.2
1.0
5.4
10.8
6.5
13.4
28.5
14.7
2.1
1.9
2.0
2.4
1.86
Hov
idJu
ne25
9.7
165.
017
3.0
182.
9-6
.113
.919
.822
.710
7.0
155.
018
5.1
8.4
11.4
12.4
15.6
13.6
12.7
11.4
1.7
1.4
0.0
0.0
0.42
Car
ing
Pha
rmac
yM
ay42
6.7
264.
032
1.0
355.
016
.518
.320
.625
.510
0.0
115.
06.
96.
47.
241
.223
.720
.816
.74.
33.
70.
02.
42.
57
Hea
lthca
re91
9.4
561.
062
8.4
683.
6-3
0.1
33.5
47.6
64.0
217.
436
7.9
423.
35.
57.
810
.121
.116
.920
.714
.32.
72.
30.
71.
6
Com
plet
e Lo
gist
ics
Dec
87.4
103.
010
2.0
116.
04.
02.
012
.015
.076
.088
.010
2.0
1.9
11.8
12.9
14.7
15.3
7.3
6.0
1.0
0.9
0.0
0.0
0.97
GD
EX
June
1,45
8.5
116.
313
5.2
170.
07.
08.
814
.927
.352
.265
.182
.87.
511
.016
.023
.236
.911
2.5
59.9
25.1
19.7
2.1
3.2
2.20
PO
S M
alay
sia
Mar
2,50
2.5
1,48
2.0
1,26
9.5
1,40
6.0
103.
015
1.4
149.
813
9.5
898.
194
7.1
1,01
6.9
10.2
11.8
9.9
16.2
14.2
16.7
17.9
2.6
2.5
2.8
2.8
5.45
Sur
ia C
apita
l D
ec73
3.8
262.
926
3.3
263.
753
.653
.261
.565
.180
0.4
844.
888
1.9
20.3
23.4
24.7
7.5
7.5
11.9
11.3
0.9
0.8
2.4
3.1
3.50
Logi
stic
s4,
782.
21,
964.
21,
770.
01,
955.
816
7.6
215.
423
8.2
246.
91,
826.
71,
945.
02,
083.
610
.014
.515
.915
.418
.537
.123
.87.
46.
01.
82.
3
Cat
cha
Med
iaD
ec11
5.8
37.5
36.1
45.6
0.3
-13.
8-7
.4-3
.528
.421
.918
.8-3
6.8
-20.
5-7
.7-1
2.3
-17.
3nm
nm5.
36.
20.
00.
01.
10
Med
ia11
5.8
37.5
36.1
45.6
0.3
-13.
8-7
.4-3
.528
.421
.918
.8-3
6.8
-20.
5-7
.7-1
2.3
-17.
3nm
nm5.
36.
20.
00.
0
Sya
rikat
Tak
aful
Mal
aysi
aD
ec2,
117.
01,
275.
51,
338.
51,
570.
951
.096
.413
9.0
157.
749
9.2
572.
164
7.8
7.6
10.4
10.0
25.9
25.9
15.2
13.4
3.7
3.3
6.3
3.9
15.0
0
Tune
Insu
ranc
eD
ec1,
503.
821
7.1
241.
026
5.2
49.0
47.4
71.0
81.1
107.
735
9.0
413.
221
.831
.830
.630
.421
.025
.219
.54.
33.
81.
72.
22.
70
NB
FI3,
620.
81,
492.
61,
579.
51,
836.
110
0.0
143.
921
0.0
238.
860
6.9
931.
11,
061.
014
.721
.120
.328
.223
.420
.216
.44.
03.
54.
03.
0
Bar
akah
Offs
hore
Pet
role
umD
ec97
1.3
202.
029
9.0
716.
0-7
9.8
33.0
41.0
124.
013
1.0
173.
031
9.0
16.3
13.7
17.3
27.0
40.5
31.2
10.4
7.4
4.0
0.0
0.0
1.90
Per
isai
Pet
role
umD
ec1,
713.
212
8.0
112.
011
9.0
21.0
92.2
72.0
73.0
482.
490
3.0
987.
072
.064
.361
.310
.47.
723
.925
.71.
91.
90.
00.
02.
05
Yins
on H
oldi
ngs
Jan
2,29
4.8
715.
886
5.2
958.
119
.023
.741
.848
.015
7.7
281.
255
2.5
3.3
4.8
5.0
15.4
11.5
54.9
42.3
8.2
4.2
0.0
0.0
10.9
0
Oil
& G
as4,
979.
31,
045.
81,
276.
21,
793.
1-3
9.8
148.
915
4.8
245.
077
1.1
1,35
7.2
1,85
8.5
30.6
27.6
27.9
17.6
19.9
36.7
26.1
5.8
3.4
0.0
0.0
Ta A
nn H
oldi
ngs
Dec
1,5
45.1
7
89.9
7
74.2
1
,021
.7
163
.0
66.
5 7
1.2
128
.4
963
.7
1,0
08.1
1
,097
.6
8.4
9.2
12.6
9.3
12.2
21.7
12.0
1.5
1.4
1.2
2.5
5.00
Pla
ntat
ions
/Tim
ber
1,54
5.1
789.
977
4.2
1,02
1.7
163.
066
.571
.212
8.4
963.
71,
008.
11,
097.
68.
49.
212
.69.
312
.221
.712
.01.
51.
41.
22.
5
LBS
Bin
aD
ec85
7.4
509.
653
3.5
704.
638
.546
.138
9.0
76.8
445.
186
8.9
894.
09.
072
.910
.959
.28.
710
.511
.41.
01.
04.
95.
93.
39
SB
C C
orpo
ratio
nM
ar34
1.3
153.
712
7.3
150.
013
.222
.726
.834
.026
3.4
289.
136
6.0
14.8
21.0
22.7
9.7
10.3
6.7
6.9
0.6
0.9
1.8
2.9
2.98
Tam
bun
Inda
hD
ec75
9.1
296.
937
6.4
466.
423
.040
.865
.092
.022
3.2
310.
137
2.7
13.7
17.3
19.7
24.4
26.9
12.1
8.6
2.5
2.1
3.0
4.2
2.50
Pro
pert
y1,
957.
896
0.3
1,03
7.2
1,32
1.0
74.7
109.
548
0.8
202.
893
1.7
1,46
8.1
1,63
2.7
12.5
37.1
17.8
31.1
15.3
9.8
9.0
1.4
1.3
3.2
4.3
Kos
san
Rub
ber I
ndus
tries
Dec
2,73
6.8
1,23
4.0
1,30
9.8
1,73
1.3
90.0
102.
214
0.6
182.
260
4.6
709.
783
6.5
8.3
10.7
10.5
21.4
23.6
19.5
15.0
3.9
3.3
1.5
2.0
5.10
Rub
ber
Glo
ves
2,73
6.8
1,23
4.0
1,30
9.8
1,73
1.3
90.0
102.
214
0.6
182.
260
4.6
709.
783
6.5
8.3
10.7
10.5
21.4
23.6
19.5
15.0
3.9
3.3
1.5
2.0
Inar
i Am
ertro
nJu
ne1,
364.
418
0.8
241.
180
2.8
18.8
19.9
42.0
94.4
83.3
157.
924
7.8
11.0
17.4
11.8
34.8
46.5
32.4
14.4
8.6
5.5
1.2
2.8
3.72
Tech
nolo
gy1,
364.
418
0.8
241.
180
2.8
18.8
19.9
42.0
94.4
83.3
157.
924
7.8
11.0
17.4
11.8
34.8
46.5
32.4
14.4
8.6
5.5
1.2
2.8
OC
K G
roup
Dec
393.
213
8.6
150.
416
2.0
8.5
13.1
12.9
16.0
55.8
79.0
101.
09.
58.
69.
919
.117
.829
.124
.45.
03.
90.
00.
01.
72
RE
Dto
ne In
tern
atio
nal
May
370.
910
7.0
142.
015
3.0
-11.
72.
225
.128
.480
.110
6.0
127.
02.
017
.718
.527
.024
.314
.013
.13.
32.
92.
21.
90.
87
Tele
com
s76
4.1
245.
629
2.4
315.
0-3
.215
.338
.044
.413
5.9
185.
022
8.0
5.7
13.1
14.2
23.0
21.1
21.6
18.7
4.2
3.4
1.1
1.0
TOP
30 S
MA
LL C
AP
31,5
47.9
15,7
84.1
18,0
96.1
22,6
75.3
1,08
6.6
1,29
7.6
2,02
1.3
2,28
5.8
10,2
42.1
12,4
92.1
14,8
07.4
9.0
13.8
13.4
21.4
22.3
21.7
14.9
4.6
3.6
1.9
2.3
EA
RN
ING
S U
NIV
ER
SE
^ cl
osin
g sh
are
pric
e as
at 8
Apr
il 20
14S
ourc
e: C
ompa
ny d
ata,
RH
B e
stim
ates
Top Malaysia Small Cap Companies 2014