Embed Size (px)
Citation preview
Copyright # 2004 John Wiley & Sons, Ltd.
MANAGERIAL AND DECISION ECONOMICS
Manage. Decis. Econ. 26: 25–37 (2005)
Published online 16 June 2004 in Wiley InterScience (www.interscience.wiley.com). DOI: 10.1002/mde.1187
Top Executive Turnovers: SeparatingDecision and Control Rights
Robert Neumanna,y and Torben Voetmannb,*
aDanske Markets, Danske Bank, Holmens Kanal 2-12, 1092 Copenhagen K, DenmarkbCornerstone Research and Finance Department, The Wharton School, 3620 Locust Walk,
Steinberg Hall–Dietrich Hall, Suite 2344, Philadelphia, PA 19104-6367, USA
This paper examines the relationship between performance and top executive turnovers using a
sample of 81 turnovers and matching companies listed on the Copenhagen Stock Exchange.
We find that poor market performance increases the probability of management replacementsand that forced layoffs are value-increasing events while voluntary resignations are value-
decreasing events. Large shareholders as active monitors, or part of corporate control, are not
exhibited in the results. If large shareholders have any influence on CEO turnovers it is not
revealed in our data. Indeed, separating control rights from decision rights does not appear toaffect managerial turnovers. Copyright # 2004 John Wiley & Sons, Ltd.
INTRODUCTION
Corporate CEO turnovers and corporate controlissues attract substantial attention in the businesscommunity and academic literature. CEO turn-overs may be value-increasing events that are theresults of poor performance and/or changes incorporate policies. This paper presents evidence onlarge shareholders’ activism in the decision ofChief Executive Officer (CEO) turnovers. Weexamine whether the corporate governance systemin Denmark, without an active market for take-overs and with large equity holdings by institu-tional investors, demonstrates a quantifiablerelationship between stock performance andCEO turnovers. In particular, the paper focuseson whether a threat of a forced resignation mayprovide the management with an incentive to align
their actions with the interest of shareholders andwhether institutional investors’ equity holdingslead to more forced layoffs and an increased focuson shareholder value. The alignment is strength-ened through a two-tier corporate governancesystem that provides effective monitoring by anindependent board and oversight by large bloc-kholders and institutional investors.
Brickley et al. (1997) challenge the conventionalhypothesis that separating the CEO and thechairman improves stock performance. They findseveral reasons which suggest that separatingdecision rights from control rights does notnecessarily improve stock performance. There areseveral costs of dual leadership: agency costs,information costs, succession costs, and dualdecision costs. The separation of decision rightsand control rights are not necessarily effectivebecause shareholders with control are often tied tothe company through large equity ownership.Brickley et al. (1997) conclude that combiningdecision and control rights is indeed efficient andgenerally consistent with shareholders’ interest.
*Correspondence to: Cornerstone Research, Finance Depart-ment, The Wharton School, 3620 Locust Walk, Steinberg Hall–Dietrich Hall, Suite 2344, Philadelphia, PA 19104-6367, USA.E-mail: [email protected]: [email protected]
The purpose of our paper is not to challenge theconventional wisdom on how separate titlesimprove performance. Rather our purpose is moremodest; we only investigate CEO turnovers in acorporate environment that separates controlrights from decision rights. Our analysis suggeststhat this two-tier system does not influence CEOturnovers. This could be due to the fact that dualleadership makes it difficult to pinpoint the faultfor bad performance which precedes CEO turn-overs.
We collected a sample of CEO turnoversfrom firms that were listed on the CopenhagenStock Exchange during the period 1994 to 1998.In the Danish corporate governance system,the distinction between the role of the executiveboard (decision rights) and the board of directors(control rights) is legally separated making itpossible to analyze CEO replacements as corpo-rate control transactions. Our results show thatan inverse relationship exists between past stockprice performance and CEO turnovers. Thisimplies that poor market performance tends toincrease the probability of a CEO turnover. Wearrive at a similar conclusion by using earning pershare (EPS) or free-cash flows (FCF) as a proxyfor performance. The inverse relationshiparises when comparing the average performanceof firms with CEO turnovers to the performance offirms in a control group. The control firms arefound by matching size (in terms of marketcapitalization) and industry classification. Theresults in this paper are consistent with theempirical literature, which is primarily based ondata from the United States (Weisbach, 1988;Warner et al., 1988; Denis et al., 1997; Brickleyet al., 1997).
Evidence from the United States suggests thatthe CEO turnover decisions are affected by thecomposition of the board (Weisbach, 1988). Forexample, the likelihood of a forced layoff is greaterin firms with a higher proportion of outside boardmembers. The corporate governance system inDenmark is a two-tier system where the CEO’sduty is to perform operational decisions whereasthe board of directors’ competence is devoted togeneral strategic issues, long-term policies, andcontrol functions. Furthermore, the same indivi-dual cannot act as both the CEO and the chairmanof the board, however, the CEO may still controlthe board of directors because the CEO canpromote and appoint board members.1 Hence,
the institutional investors are likely to be candi-dates for external corporate monitors and theincreasing ownership structure may imply thatthey can influence central corporate controldecisions. In addition, the relative size of institu-tional investors’ equity holdings provides themwith an incentive and the ability to exercisecorporate control. This means that larger share-holders are interrelated factors that affect manage-ment turnovers.
Using a sample of private and public firms inDenmark, Lausten (2002) reports an inverserelationship between CEO turnovers and the pre-tax accounting profit to sales. However, Laustendoes not distinguish between the different reasonsfor the turnovers. The results in this paper arecomparable primarily to Denis et al. (1997). Theirsample does not display a relationship betweenlarge shareholders’ ownership and CEO turnovers,although top executive turnovers are significantlyand positively related to the presence of an outsideblock holder. We also investigate whether largeshareholders’ ownership affects the likelihood ofmanagement replacements in publicly tradedDanish companies. Our findings, however, donot confirm Huson et al.’s (2001) hypothesis thatlarge shareholders’ activism influences CEO turn-overs. In fact, our results suggest that an increasein large shareholders’ ownership may protect topexecutives from monitoring activities. Large share-holders’ influence on new corporate policies is notreflected in the process of management replace-ments in a measurable or positive way. Thepresence of large shareholders appears to limitthe effect of corporate discipline mechanismsrather than empowering sanctions. This result isrobust to different specifications of the empiricalmodel. The results also show that top executiveturnovers are unrelated to large shareholder own-ership, which is similar to the findings by Deniset al. (1997).
The presence of large shareholders could beinterpreted as a proxy for the lack of otherinvestors, i.e. an ownership structure dominatedby institutional investors could reflect that there isno entrepreneur, family owner, or foundation. Tothoroughly investigate whether market perfor-mance is related to large shareholder ownership,we distinguish between institutional and strategicinvestors. Institutional investors include insurancecompanies, pension funds, and banks. Institu-tional investors have a limited ability to intervene
R. NEUMANN AND T. VOETMANN26
Copyright # 2004 John Wiley & Sons, Ltd. Manage. Decis. Econ. 26: 25–37 (2005)
because Danish legislation restricts financial firmsfrom using ownership influence to dictate govern-ance on other non-financial firms. For example,the restrictions on institutional investors state thatthe Labor Market Supplementary Pension Schemeand the Employers Retirement Scheme are notallowed to have dominant positions in a given firmeither separately or together. Strategic investorsare defined as large shareholders with a long-termrelationship with the firm, this includes largeprivate shareholders, foundations, venture capital-ists, and industrial investors. Unlike institutionalinvestors, strategic investors may have strategicvisions tied to their equity holdings because theymay have founded the firms or inherited theirshares. The distinction between institutional in-vestors and strategic investors is important be-cause the strategic investors have boardrepresentation. This representation providesthe strategic investor the ability to implementcontrol and monitoring mechanisms and aswell as an ability to influence the CEO turnoverdecision.
Institutional investors’ involvement in corpo-rate governance in Denmark differs from theircounterparts in the United States. As mentionedabove, two-tier corporate governance structureseparates the management board (with decisionrights) from the board of directors (with controlrights) and it is constructed such that the CEOcannot act as the chairman of the board ofdirectors. Brickley et al. (1997) find that the CEOis also the chairman of the board of directors in80.9 percent of companies in the United States.Only in 14.1 percent of the companies doesthis person not hold both titles. The board ofdirectors in Denmark includes large investorsand members of the business community. Ourexpectation is, therefore, that large investors areinterested in removing poor performing CEOs.However, institutional investors in Denmark aresubject to statutory regulation that limits theirrights to hold shares and exercise control. There-fore, we expect no impact from institutionalinvestors that diminishes their control of the boardof directors.
Rechner and Dalton (1991) find that firms thathave separate positions improve performance. IfCEO turnovers are a function of poor perfor-mance we should observe lower turnover rates inDenmark. Warner et al. (1988) find a 6 percentturnover rate for the worst performing decile,
which is three times the turnover rate in betterperforming deciles. Our expectation, therefore, istherefore to find lower turnover rate than sixpercent in Denmark.
Overall, our data shows that contrary toexpectations, CEO turnovers are not affected byseparating control rights from decision rights.Large shareholders and institutional investorsappear not to advance turnovers. And, differingfrom our expectations, we find a large turnoverrate in Denmark. Clearly, more detailed researchabout control and decision rights impact on CEOturnovers is wanted before reaching more defini-tive conclusions.
The structure of the paper is as follows. First,related research in the area of corporate CEOturnover is discussed. Next the data and theapplied methodology are presented, followed bythe empirical results of logistic regressions of CEOturnovers. Then the share price movements whenCEO turnovers are announced are analyzed.Finally, the last section concludes.
RELATED RESEARCH
The academic literature devotes much attention toexamining the CEO’s contractual setup in largecorporations. Empirical evidence indicates aninverse relationship between various performancebenchmarks and the probability that the CEO islaid off.2 Wiesbach (1988) finds that the inverserelationship is more pronounced for firms with ahigh proportion of outside directors. It suggeststhat the board of directors serves as a controlmechanism. This is an interesting observationsince Berle and Means (1932) argue for theseparation of control and ownership, whichsuggests that management have de-facto control.Weisbach’s finding could indicate that the CEOs’concern for their reputation in the managerial ordirectorial labor market causes them to performself-monitoring. However, Denis et al. (1997) doesnot confirm Wiesbach’s (1988) conclusions. In-stead, Denis et al. find that a stronger relationshipbetween CEO turnover and performance in out-sider-dominated board of directors does not exist.
Studies of CEO turnover raise an importantissue because the decision is often related to otherstructural changes in firms that could introducebiases due to confounding information. Severalpapers suggest that management turnovers are
TOP EXECUTIVE TURNOVERS 27
Copyright # 2004 John Wiley & Sons, Ltd. Manage. Decis. Econ. 26: 25–37 (2005)
connected to financial events, e.g. bankruptcies,DeAngelo and DeAngelo (1989) and asset restruc-turing, Asquith et al. (1991). In addition,Weisbach (1995) finds at the time of a manage-ment change, an increase in the probability ofdivesting an acquisition that is publicly con-sidered unprofitable. Moreover, Parrino (1997)provides evidence suggesting that the likelihoodof both CEO turnovers and outside successionvaries across industries, which implies thatindustries characterized by homogeneous firmshave a greater likelihood of CEO turnovers, forcedlayoffs and outside successions. Similarly, CEO’sin a homogeneous industry possess more humancapital that is relevant to other firms in theindustry. Also, knowledge of production technol-ogies and business contracts make job changesmore likely. Therefore, the potential benefit ofreplacing a CEO increases with the quality of thepool of potential successors. This implies thatCEO turnovers are less costly in homogenousindustries.
The established inverse relationship seems to bean econometric fact, although to what extent theCEO is forced to leave his position is unknown.Denis and Denis (1995) point out that activemonitoring parties, other than the board ofdirectors, precede 68 percent of forced top execu-tive dismissals in the year prior to the CEOturnovers. Moreover, 56 percent of the forcedlayoffs are targets of corporate control transac-tions, e.g. block investment, takeover, or leveragedbuyout. This evidence suggests that it is toonarrow only to focus on the board of directorsas corporate monitors. Denis and Denis (1995)emphasize that the CEO turnover decision im-proves operational performance after managementdismissals due to changes in accounting policies.They also find increased improvements in operat-ing performance after forced layoffs. A clearadvantage of the earnings data is its ability tomeasure the CEO’s performance, e.g. the bench-mark short-term profits, whereas stock price as abenchmark may discount different elements thatare not necessarily related to the CEO turnover.However, using accounting data exposes findingsto many well-described problems such as thechosen depreciation scheme.3
In the United States, the total equity holdings ofinstitutions, such as mutual funds, private pensionplans, government retirement funds, and insurancecompanies increased from 19.8 percent in 1971 to
43.9 percent in 1994. Huson et al. (2001) show thatthe frequency of forced CEO layoffs in the UnitedStates increased in the 1990s compared with the1970s. Huson et al. (2001) also argue that the1990s reflect an evolution in internal monitoringmechanisms because the size and composition ofthe board of directors are more independent andstreamlined. The largest increase in Huson et al.’s(2001) sample occurred between 1989 and 1994.Also, public funds and coordinated shareholdergroups have initiated 616 shareholder proposalsover the 1989–1994 period compared with 60proposals during 1984–1988 (Gillian and Starks,2001). This confirms a more active profile of publicpension funds in the United States. Similarly,McConnell and Servaes (1990) find a positiverelationship between institutional investors’ own-ership and Tobin’s q. However, they note that thiscould reflect institutional investors’ preference forstocks that historically have outperformed themarket.
Mikkelson and Partch’s (1997) results indicatethat the decline in the active takeover market inthe late 1980s is associated with a decline in therelationship between performance and replace-ments. Mikkelson and Partch (1997) argue thatthe relationship between CEO turnovers andperformance in the less-active takeover period ofthe early 1990s is insignificant. This view seemsconsistent with Hadlock and Lumer (1997) whoinvestigate an inactive period in the United Statestakeover market. Historically, they find no rela-tionship between stock market return and manage-ment turnover between 1933 and 1941. Thequestion is therefore whether the reduced effec-tiveness of external monitoring will be replaced byinternal control? In other words, will a less-activetakeover market intensify control by active in-vestors or the board of directors? Or is an effectiveexternal market pressure a condition for theperformance of internal control forces? The resultsfrom both Mikkelson and Partch (1997) and Deniset al. (1997) indicate that the reduction in externalcontrol mechanisms is also accompanied by adecline in the effectiveness of internal control.
DESCRIPTION OF DATA AND
METHODOLOGY
We constructed a data set by gathering informa-tion of CEO turnovers from announcements
R. NEUMANN AND T. VOETMANN28
Copyright # 2004 John Wiley & Sons, Ltd. Manage. Decis. Econ. 26: 25–37 (2005)
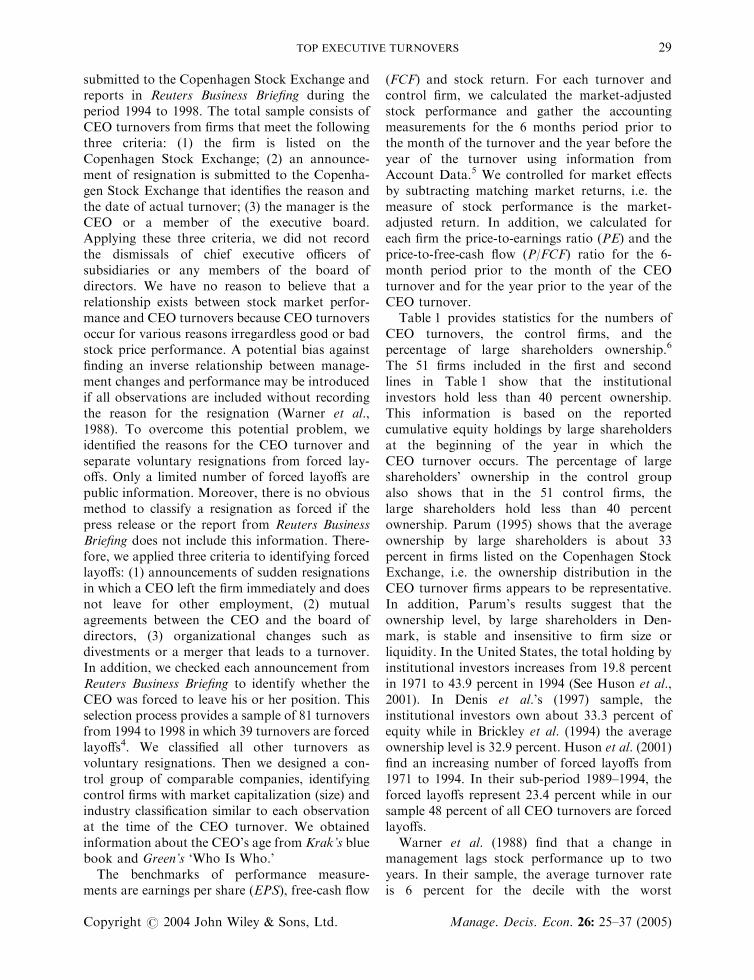
submitted to the Copenhagen Stock Exchange andreports in Reuters Business Briefing during theperiod 1994 to 1998. The total sample consists ofCEO turnovers from firms that meet the followingthree criteria: (1) the firm is listed on theCopenhagen Stock Exchange; (2) an announce-ment of resignation is submitted to the Copenha-gen Stock Exchange that identifies the reason andthe date of actual turnover; (3) the manager is theCEO or a member of the executive board.Applying these three criteria, we did not recordthe dismissals of chief executive officers ofsubsidiaries or any members of the board ofdirectors. We have no reason to believe that arelationship exists between stock market perfor-mance and CEO turnovers because CEO turnoversoccur for various reasons irregardless good or badstock price performance. A potential bias againstfinding an inverse relationship between manage-ment changes and performance may be introducedif all observations are included without recordingthe reason for the resignation (Warner et al.,1988). To overcome this potential problem, weidentified the reasons for the CEO turnover andseparate voluntary resignations from forced lay-offs. Only a limited number of forced layoffs arepublic information. Moreover, there is no obviousmethod to classify a resignation as forced if thepress release or the report from Reuters BusinessBriefing does not include this information. There-fore, we applied three criteria to identifying forcedlayoffs: (1) announcements of sudden resignationsin which a CEO left the firm immediately and doesnot leave for other employment, (2) mutualagreements between the CEO and the board ofdirectors, (3) organizational changes such asdivestments or a merger that leads to a turnover.In addition, we checked each announcement fromReuters Business Briefing to identify whether theCEO was forced to leave his or her position. Thisselection process provides a sample of 81 turnoversfrom 1994 to 1998 in which 39 turnovers are forcedlayoffs4. We classified all other turnovers asvoluntary resignations. Then we designed a con-trol group of comparable companies, identifyingcontrol firms with market capitalization (size) andindustry classification similar to each observationat the time of the CEO turnover. We obtainedinformation about the CEO’s age from Krak’s bluebook and Green’s ‘Who Is Who.’
The benchmarks of performance measure-ments are earnings per share (EPS), free-cash flow
(FCF) and stock return. For each turnover andcontrol firm, we calculated the market-adjustedstock performance and gather the accountingmeasurements for the 6 months period prior tothe month of the turnover and the year before theyear of the turnover using information fromAccount Data.5 We controlled for market effectsby subtracting matching market returns, i.e. themeasure of stock performance is the market-adjusted return. In addition, we calculated foreach firm the price-to-earnings ratio (PE) and theprice-to-free-cash flow (P/FCF) ratio for the 6-month period prior to the month of the CEOturnover and for the year prior to the year of theCEO turnover.
Table 1 provides statistics for the numbers ofCEO turnovers, the control firms, and thepercentage of large shareholders ownership.6
The 51 firms included in the first and secondlines in Table 1 show that the institutionalinvestors hold less than 40 percent ownership.This information is based on the reportedcumulative equity holdings by large shareholdersat the beginning of the year in which theCEO turnover occurs. The percentage of largeshareholders’ ownership in the control groupalso shows that in the 51 control firms, thelarge shareholders hold less than 40 percentownership. Parum (1995) shows that the averageownership by large shareholders is about 33percent in firms listed on the Copenhagen StockExchange, i.e. the ownership distribution in theCEO turnover firms appears to be representative.In addition, Parum’s results suggest that theownership level, by large shareholders in Den-mark, is stable and insensitive to firm size orliquidity. In the United States, the total holding byinstitutional investors increases from 19.8 percentin 1971 to 43.9 percent in 1994 (See Huson et al.,2001). In Denis et al.’s (1997) sample, theinstitutional investors own about 33.3 percent ofequity while in Brickley et al. (1994) the averageownership level is 32.9 percent. Huson et al. (2001)find an increasing number of forced layoffs from1971 to 1994. In their sub-period 1989–1994, theforced layoffs represent 23.4 percent while in oursample 48 percent of all CEO turnovers are forcedlayoffs.
Warner et al. (1988) find that a change inmanagement lags stock performance up to twoyears. In their sample, the average turnover rateis 6 percent for the decile with the worst
TOP EXECUTIVE TURNOVERS 29
Copyright # 2004 John Wiley & Sons, Ltd. Manage. Decis. Econ. 26: 25–37 (2005)
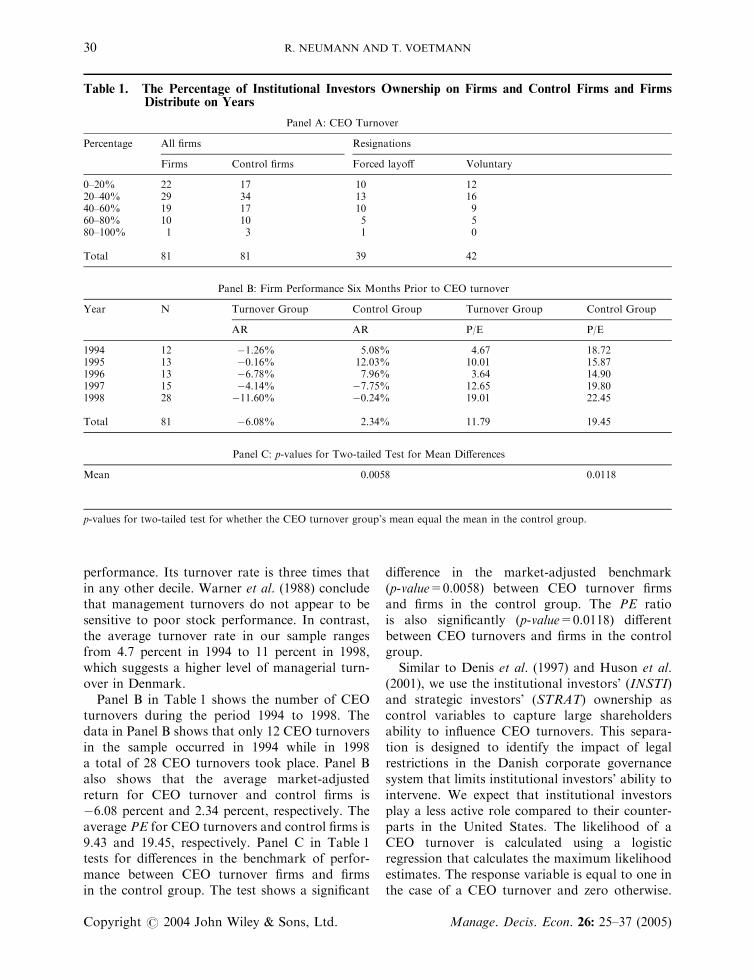
performance. Its turnover rate is three times thatin any other decile. Warner et al. (1988) concludethat management turnovers do not appear to besensitive to poor stock performance. In contrast,the average turnover rate in our sample rangesfrom 4.7 percent in 1994 to 11 percent in 1998,which suggests a higher level of managerial turn-over in Denmark.
Panel B in Table 1 shows the number of CEOturnovers during the period 1994 to 1998. Thedata in Panel B shows that only 12 CEO turnoversin the sample occurred in 1994 while in 1998a total of 28 CEO turnovers took place. Panel Balso shows that the average market-adjustedreturn for CEO turnover and control firms is�6.08 percent and 2.34 percent, respectively. Theaverage PE for CEO turnovers and control firms is9.43 and 19.45, respectively. Panel C in Table 1tests for differences in the benchmark of perfor-mance between CEO turnover firms and firmsin the control group. The test shows a significant
difference in the market-adjusted benchmark(p-value=0.0058) between CEO turnover firmsand firms in the control group. The PE ratiois also significantly (p-value=0.0118) differentbetween CEO turnovers and firms in the controlgroup.
Similar to Denis et al. (1997) and Huson et al.(2001), we use the institutional investors’ (INSTI)and strategic investors’ (STRAT) ownership ascontrol variables to capture large shareholdersability to influence CEO turnovers. This separa-tion is designed to identify the impact of legalrestrictions in the Danish corporate governancesystem that limits institutional investors’ ability tointervene. We expect that institutional investorsplay a less active role compared to their counter-parts in the United States. The likelihood of aCEO turnover is calculated using a logisticregression that calculates the maximum likelihoodestimates. The response variable is equal to one inthe case of a CEO turnover and zero otherwise.
Table 1. The Percentage of Institutional Investors Ownership on Firms and Control Firms and FirmsDistribute on Years
Panel A: CEO Turnover
Percentage All firms Resignations
Firms Control firms Forced layoff Voluntary
0–20% 22 17 10 1220–40% 29 34 13 1640–60% 19 17 10 960–80% 10 10 5 580–100% 1 3 1 0
Total 81 81 39 42
Panel B: Firm Performance Six Months Prior to CEO turnover
Year N Turnover Group Control Group Turnover Group Control Group
AR AR P/E P/E
1994 12 �1.26% 5.08% 4.67 18.721995 13 �0.16% 12.03% 10.01 15.871996 13 �6.78% 7.96% 3.64 14.901997 15 �4.14% �7.75% 12.65 19.801998 28 �11.60% �0.24% 19.01 22.45
Total 81 �6.08% 2.34% 11.79 19.45
Panel C: p-values for Two-tailed Test for Mean Differences
Mean 0.0058 0.0118
p-values for two-tailed test for whether the CEO turnover group’s mean equal the mean in the control group.
R. NEUMANN AND T. VOETMANN30
Copyright # 2004 John Wiley & Sons, Ltd. Manage. Decis. Econ. 26: 25–37 (2005)
The linear logistic model is:
LogitðpÞ ¼ logp
1� p
� �¼ aþ b0x ð1Þ
where a is the intercept parameter, and b is thevector of slope parameters. x is a vector ofexplanatory variables that may affect theprobability of a CEO turnover and p=Pr(Y=1 | x) is the probability modeled. The signifi-cant difference in the benchmark measurementof CEO turnovers and control firms impliesthat the specified logit model can possiblydistinguish between the two groups (see Panel Cin Table 1).
The second part of the analysis investigatesthe market response around the CEO turn-overs. We tested the market responses acrossdifferent event windows applying an event-study methodology that measures share pricemovements to CEO turnover announcements(see Campbell et al., 1997). The market modelis used to estimate the abnormal returns.Parameters ai and bi for each firm i areestimated using daily returns between 260days to 20 days before the CEO turnoverannouncement.
ARi;t ¼ Ri;t � ðai þ bi �MtÞ ð2Þ
Ri,t and Mt are the return to firm i at day t andthe return to the market index at day t, respec-tively. ARi,t is the abnormal return of firm i’sstock at day t.
EMPIRICAL RESULTS
Full Sample
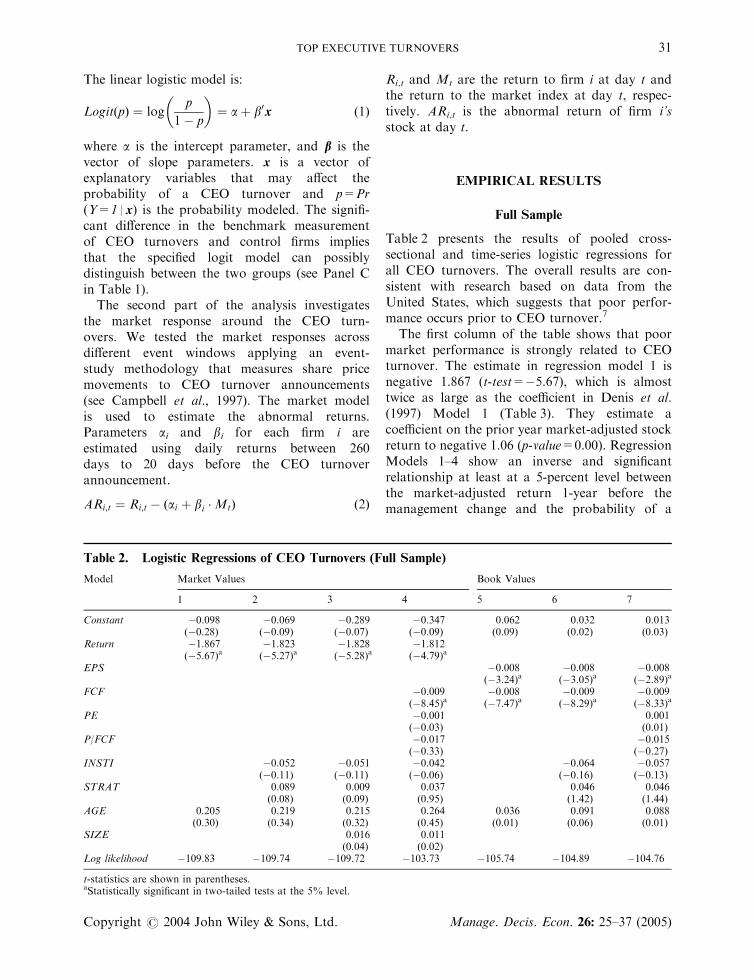
Table 2 presents the results of pooled cross-sectional and time-series logistic regressions forall CEO turnovers. The overall results are con-sistent with research based on data from theUnited States, which suggests that poor perfor-mance occurs prior to CEO turnover.7
The first column of the table shows that poormarket performance is strongly related to CEOturnover. The estimate in regression model 1 isnegative 1.867 (t-test=�5.67), which is almosttwice as large as the coefficient in Denis et al.(1997) Model 1 (Table 3). They estimate acoefficient on the prior year market-adjusted stockreturn to negative 1.06 (p-value=0.00). RegressionModels 1–4 show an inverse and significantrelationship at least at a 5-percent level betweenthe market-adjusted return 1-year before themanagement change and the probability of a
Table 2. Logistic Regressions of CEO Turnovers (Full Sample)
Model Market Values Book Values
1 2 3 4 5 6 7
Constant �0.098 �0.069 �0.289 �0.347 0.062 0.032 0.013(�0.28) (�0.09) (�0.07) (�0.09) (0.09) (0.02) (0.03)
Return �1.867 �1.823 �1.828 �1.812(�5.67)a (�5.27)a (�5.28)a (�4.79)a
EPS �0.008 �0.008 �0.008(�3.24)a (�3.05)a (�2.89)a
FCF �0.009 �0.008 �0.009 �0.009(�8.45)a (�7.47)a (�8.29)a (�8.33)a
PE �0.001 0.001(�0.03) (0.01)
P/FCF �0.017 �0.015(�0.33) (�0.27)
INSTI �0.052 �0.051 �0.042 �0.064 �0.057(�0.11) (�0.11) (�0.06) (�0.16) (�0.13)
STRAT 0.089 0.009 0.037 0.046 0.046(0.08) (0.09) (0.95) (1.42) (1.44)
AGE 0.205 0.219 0.215 0.264 0.036 0.091 0.088(0.30) (0.34) (0.32) (0.45) (0.01) (0.06) (0.01)
SIZE 0.016 0.011(0.04) (0.02)
Log likelihood �109.83 �109.74 �109.72 �103.73 �105.74 �104.89 �104.76
t-statistics are shown in parentheses.aStatistically significant in two-tailed tests at the 5% level.
TOP EXECUTIVE TURNOVERS 31
Copyright # 2004 John Wiley & Sons, Ltd. Manage. Decis. Econ. 26: 25–37 (2005)
CEO turnover. The result indicates that the boardof directors takes poor performance into accountin making a CEO retention decision.
Regression models 5 through 7 investigatethe extent to which accounting-based bench-marks for performance is related to CEOturnovers. EPS displays the same properties asthe market-adjusted return. The reported EPSfrom the latest annual report before theCEO turnover is also inversely related to theprobability of a CEO turnover. The reportedFCF has the same explanatory power asEPS, the estimated coefficients in model 5are negative 0.008 (t-test=�3.24) and 0.008(t-test =�7.47) for EPS and FCF, respectively.This shows that both EPS and FCF are inverselyand significantly related to management dismis-sals. The accounting-related measurements P/FCFand PE are inversely but not statistically relatedto CEO turnovers. The natural log of themarket capitalization (market price times theoutstanding shares) is not statistically related toCEO turnovers. Including the AGE dummycaptures the effect of a natural managementchange process on the likelihood of CEO turnover.
Similar to Huson et al. (2001), we applied a cutoffof 60 years of age or older in which case the AGEdummy is equal to one. Alternatively, we couldhave used the typical retirement age but theturnover relationship depends on the exact timewhen the CEO relinquishes the position. Thecoefficient for the AGE dummy in Table 2 confirmsthat a natural management replacementprocess takes place. The coefficients are positivein every turnover outcome. A total of 19 CEO’s ofthe 81 CEO turnovers are 60 years or older andonly three of them are categorized in the forcedlayoff group.
Regression models 2 through 4 and models 6and 7 test the influence by institutional investors’ownership on the probability of a CEO turnover.The coefficients for institutional investors (models2 and 3) are negative 0.052 (t-test=�0.11) andnegative 0.051 (t-test=�0.11). The coefficient inmodel 4, which includes both market and account-ing performance benchmarks, is negative 0.042(t-test=�0.06). This may imply that large equityholdings by institutional investors’ protectthe management from replacements but thecoefficients are not significant at any level.
Table 3. Logistic Regressions for Forced Layoffs and Voluntary Resignations
Forced Layoffs Voluntary Resignations
N ¼ 162 N=39 N=42
Model 1 2 3 4 5 6 7 8
Constant �0.920 �1.079 �0.852 �0.895 �0.666 �1.262 �0.525 �0.536(�9.30)a (�0.42) (�6.84)a (�7.23)a (�5.95)a (�0.91) (�2.92)b (�2.99)b
Return �3.618 �3.632 �0.827 �0.836(�9.71)a (�9.61)a (�0.70) (�0.70)
EPS �0.011 �0.012 �0.006 �0.006(�3.59)b (�3.60)b (�1.26) (�1.08)
FCF �0.013 �0.013 �0.004 �0.004(�10.96)a (�10.92)a (�1.81) (�1.59)
PE 0.004 �0.001(0.27) (0.07)
P/FCF �0.019 �0.015(�0.32) (�0.12)
INSTI 0.052 0.053 0.033 0.036 �0.176 �0.182 �0.200 �0.182(0.06) (0.06) (0.03) (0.03) (�0.72) (�0.76) (�0.85) (�0.69)
STRAT 0.008 0.008 0.069 0.069 �0.015 �0.015 0.019 0.017(0.06) (0.06) (1.47) (1.45) (�0.06) (�0.06) (0.09) (0.07)
AGE �0.545 �0.547 �0.597 �0.652 0.656 0.646 0.511 0.524(�0.92) (�0.93) (�0.97) (�1.13) (2.37) (2.29) (1.42) (1.45)
SIZE 0.012 0.043(0.01) (0.21)
Log likelihood �67.40 �67.39 �63.71 �63.42 �78.74 �78.63 �77.30 �77.20
t-statistics are shown in parentheses.aStatistically significant in two-tailed tests at the 5% level.bStatistically significant in two-tailed tests at the 10% level.
R. NEUMANN AND T. VOETMANN32
Copyright # 2004 John Wiley & Sons, Ltd. Manage. Decis. Econ. 26: 25–37 (2005)
Denis et al.’s (1997) model 3 and 4 (in Table 3),also show that institutional investors have noinfluence on the probability of CEO replace-ments. The coefficients are almost zero andclearly insignificant. One possible explanation forthe lack of a significant relationship betweeninstitutional holdings and CEO turnover is thatit could be the results of a tradeoff. Institutionalinvestors sell stocks that are performingpoorly. Thus, one would expect that institutionalownership would tend to be lower in those firms,ceteris paribus. Yet, if institutional investors thinkthat they can affect the firm’s performance byremoving the CEO or if they think that the boardwill be removing the CEO and that performanceshould be improved, they may continue to hold theshares or even buy into the company. Thus, onewould not particularly expect a relationshipbetween the level of institutional holdings andCEO turnover.
Sub-sample
Table 3 separates the sample into two sub-samplesin order to draw attention to the reasons forthe CEO turnover. It provides additional insightsinto the sensitivity of the likelihood of a CEOturnover that depend on whether the CEO isforced to leave his or her position or left theposition voluntarily.
Of the 81 turnovers, 39 result from forcedlayoffs while 42 are voluntary. Models 1–4reestimate the logistic regressions for thegroup of forced layoffs and models 5–8 reesti-mate the results for the group of voluntaryresignations. Overall, the results reveal, as ex-pected that forced layoff and performance isinversely related. In particular, the stock marketperformance in models 1 and 2 is inversely relatedwith the negative coefficients 3.62 (t-test=�9.71)and 3.63 (t-test=�9.61), respectively. These re-sults are similar to Huson et al. (2001) model 2,(Table 5) in which forced layoffs are inverselyrelated with a negative coefficient 1.28 (p-va-lue=0.028) to stock market returns the year priorto the turnover.
Models 3 and 4 show that the accountingassociated performance benchmark measured asEPS and FCF are significant and inverse related toCEO turnovers at a 5-percent level of significance.Huson et al.’s (2001) results also reveal asignificant and inverse relationship between
the ratio of previous earnings before interestand taxes to the beginning of the period bookassets (p-value=0.007). However, Huson et al.(2001) show that the likelihood of a turnover ispositively and negatively related to accountingfigures in their sub-periods. In the sub-period1983–1988, changes in accounting figures areunrelated to the likelihood of turnover, whilethe estimated relationship is negative andsignificant for the sub-period 1989–1994. Husonet al. argue that the measurement used toevaluate the CEO turnover from the level ofaccounting performance to changes in accountingfigures relates to the changes in internal monitor-ing after the active takeover market weakened inthe late eighties.
Our sample of CEO turnovers does notallow us to draw a conclusion from a long-termperspective. In addition, since the corporategovernance system in Denmark practicallynever includes hostile takeovers as a controloption, the internal disciplinary mechanismshave always played an important role in manage-ment replacements. However, the relationshipbetween institutional investors’ ownership andforced layoff and voluntary replacements alsobecomes insignificant in Table 3. The AGE dummyin Table 3 reconfirms the natural managementreplacement process. For voluntary resigna-tions the coefficient is positive and for forcedlayoffs the coefficient is negative. This indicatesthat CEO’s close to retirement are more likely tobe replaced.
STOCK PRICE MOVEMENTS
It is often assumed that a CEO is removed due topoor performance. Therefore, an increase in valueor a positive share price response is expected.Warner et al. (1988) did not find any indication ofsignificant market responses to the announcementof CEO turnovers using the market model toestimate abnormal returns. But they confirmed anincrease in the variance at the day of theannouncement. Weisbach (1988) interprets thisresult as evidence that the announcement conveysrelevant market information. The average cumu-lative abnormal returns around the announcementday broken down by forced layoffs, voluntaryresignations, and the control group are shown inTable 4.
TOP EXECUTIVE TURNOVERS 33
Copyright # 2004 John Wiley & Sons, Ltd. Manage. Decis. Econ. 26: 25–37 (2005)
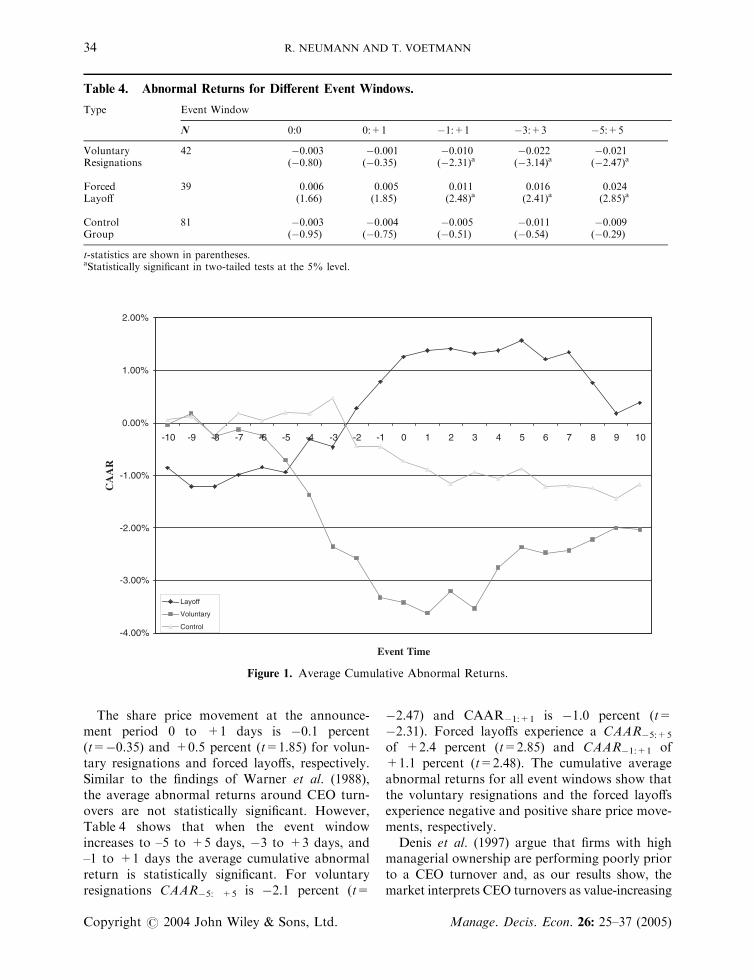
The share price movement at the announce-ment period 0 to +1 days is �0.1 percent(t=�0.35) and +0.5 percent (t=1.85) for volun-tary resignations and forced layoffs, respectively.Similar to the findings of Warner et al. (1988),the average abnormal returns around CEO turn-overs are not statistically significant. However,Table 4 shows that when the event windowincreases to –5 to +5 days, �3 to +3 days, and–1 to +1 days the average cumulative abnormalreturn is statistically significant. For voluntaryresignations CAAR�5: +5 is �2.1 percent (t=
�2.47) and CAAR�1:+1 is �1.0 percent (t=�2.31). Forced layoffs experience a CAAR�5:+5
of +2.4 percent (t=2.85) and CAAR�1:+1 of+1.1 percent (t=2.48). The cumulative averageabnormal returns for all event windows show thatthe voluntary resignations and the forced layoffsexperience negative and positive share price move-ments, respectively.
Denis et al. (1997) argue that firms with highmanagerial ownership are performing poorly priorto a CEO turnover and, as our results show, themarket interprets CEO turnovers as value-increasing
Table 4. Abnormal Returns for Different Event Windows.
Type Event Window
N 0:0 0:+1 �1:+1 �3:+3 �5:+5
Voluntary 42 �0.003 �0.001 �0.010 �0.022 �0.021Resignations (�0.80) (�0.35) (�2.31)a (�3.14)a (�2.47)a
Forced 39 0.006 0.005 0.011 0.016 0.024Layoff (1.66) (1.85) (2.48)a (2.41)a (2.85)a
Control 81 �0.003 �0.004 �0.005 �0.011 �0.009Group (�0.95) (�0.75) (�0.51) (�0.54) (�0.29)
t-statistics are shown in parentheses.aStatistically significant in two-tailed tests at the 5% level.
-4.00%
-3.00%
-2.00%
-1.00%
0.00%
1.00%
2.00%
-10 -9 -8 -7 -6 -5 -4 -3 -2 -1 0 1 2 3 4 5 6 7 8 9 10
Event Time
CA
AR
Layoff
Voluntary
Control
Figure 1. Average Cumulative Abnormal Returns.
R. NEUMANN AND T. VOETMANN34
Copyright # 2004 John Wiley & Sons, Ltd. Manage. Decis. Econ. 26: 25–37 (2005)
events. But it is difficult to assess the net effect ofCEO turnovers given the information effect andthe real effect.8 Hence, we find positive stock pricereactions to forced layoff announcements follow-ing prolonged poor performance and negativestock price reactions around voluntary resigna-tions because the information effect is higher thanthe real effect. These results may suggest that thecorrection of prior errors dominate the short-termmarket reaction. This may also reflect that themarket recognizes the existence of firm specificknowledge, i.e. the negative net effect couldexpress uncertainty or loss of human capital dueto a CEO’s departure.
Huson et al. (2001) find similar results on thefact that the cumulative average abnormal returnsaround CEO turnovers move significantly for theperiod 1989 to 1994. They find positive andsignificant stock price movements for forced lay-offs and negative and significant stock pricemovements for voluntary resignations. Borokho-vich et al. (1996) find that share price movement ispositive when an outside succession follows aforced layoff while an inside succession leads tonegative share price movements. Our resultsindicate that the average cumulative abnormalreturns are not significant for the succession of amember of the executive board. The net effect ofthe forced layoff market response and the volun-tary resignation market response are, on average,zero. In addition, the findings show, not surpris-ingly, that the average cumulative abnormalreturns of the control group are not statisticallysignificant from zero in any event windows. Theaverage cumulative abnormal returns for forcedlayoffs, voluntary resignations, and the controlgroup are shown in Figure 1.
Figure 1 shows that about 5 days before theCEO turnover announcement the cumulativeaverage abnormal return decreases for forcedlayoffs and increases for voluntary resignations.The average cumulative abnormal return for thecontrol group stays constant over the event period.Weisbach (1988) finds similar results showing thata forced layoff that followed poor performanceincreases the value of the firm. Huson et al. (2001)find that the average abnormal return increases byfour percent (p-value=0.00) around forced layoffs.Huson et al. (2001) argue that this increaseexpresses the change in the effectiveness of internalmonitoring mechanisms. Our findings partly sup-port the results in Brickley et al. (1997), which
suggest that firms with separate titles do notinfluence performance. With or without a separa-tion of control and decision rights, CEO turnoversfollow poor performance.
CONCLUSION
International evidence shows that the level ofinstitutional investors’ equity holdings is increas-ing rapidly. However, relatively little research isdone on the existence of a relationship betweeninstitutional and strategic investors’ ownershipand corporate control transactions. Outside theUnited States, to the best of our knowledge, verylimited work investigates the relationship betweencorporate control and CEO turnovers. This paperprovides some evidence of this relationship using asample of CEO turnovers and institutional in-vestors’ ownership from firms that are listed on theCopenhagen Stock Exchange.
The inverse CEO turnover-performance rela-tionship is confirmed, which suggests that poorperformance increases the probability of a CEObeing replaced. More importantly, we obtain abetter understanding of institutional investors’ability to affect the decision of CEO turnovers.The results do not support, however, the opinionthat the increasing equity holdings by institutionalinvestors lead to an increasing influence oncorporate decisions. The separation of controland decision rights appears not to influence CEOturnovers.
TOP EXECUTIVE TURNOVERS 35
Copyright # 2004 John Wiley & Sons, Ltd. Manage. Decis. Econ. 26: 25–37 (2005)
APPENDIX A: CORRELATION MATRIX
NOTES
1. Corporate Law (‘Aktieselskabsloven’) } 56(1)(3). Therule was a reaction to the Nordisk Fjer’s bankruptcyin which the CEO also was the chairman of the boardof directors.
2. See Coughlan and Schmidt (1985), Weisbach (1988),Warner et al. (1988), Jensen and Murphy (1990), andParrino (1997).
3. See other problems in Fisher and McGowan (1973).4. 70 percent of the sample represents actual CEOs.
Therefore, we refer to turnovers of a CEO and anexecutive member as a CEO turnover.
5. Account Data is a database that contains informa-tion about all firms that are listed on the CopenhagenStock Exchange.
6. Appendix A provides a correlation matrix with theanalyzed variables.
7. The influence of individual CEO turnoverson the maximum likelihood coefficients is testedusing Pearson’s w2 statistics for illfitted observations.The results show that the parameters in the logisticregression are not heavily influenced by one singleCEO turnover.
8. The information effect is the expected change due tothe revealed information and the real effect is the
observed effect. See Bonnier and Bruner (1986),Warner et al. (1988), Huson et al. (2001).
REFERENCES
Asquith P, Gertner R, Scharfstein D. 1991. Anatomy offinancial distress: an examination of junk bond issuers.Working Paper, Massachusetts Institute of Technol-ogy, Cambridge MA.
Berle AA, Means GC. 1932. The Modern Corporationand Private Property. Macmillan: New York.
Bonnier KA, Bruner RF, 1986. An analysis of the stockprice reaction to management change in distressedfirms. Unpublished manuscript, University of Virgi-nia, Charlottesville, VA.
Borokhovich K, Parrino R, Trapani T. 1996. OutsideDirectors and CEO Selection. Journal of Financial andQuantitative Analysis 31: 337–355.
Brickley JA, Coles JL, Jarrell G. 1997. Leadershipstructure: separating the CEO and Chairman of theBoard. Journal of Corporate Finance 3: 189–220.
Brickley JA, Coles JL, Terry RL. 1994. Outside directorsand the adoption of poison pills. Journal of FinancialEconomics 35: 371–390.
FCF PE P/FCF Abnormalreturn
EPS SIZE Institutionalownership
Strategicinvestorsownership
FCF 1.00}
PE 0.12 1.00(0.14) }
P/FCF 0.02 0.05 1.00(0.84) (0.57) }
Abnormal 0.02 0.07 0.04 1.00return (0.77) (0.37) (0.60) }
EPS 0.06 0.15 0.06 0.20 1.00(0.47) (0.06) (0.44) (0.01) }
SIZE �0.04 0.16 �0.04 0.02 0.07 1.00(0.63) (0.05) (0.57) (0.83) (0.41) }
Institutional 0.11 0.13 0.10 0.07 �0.02 �0.02) 1.00ownership (0.17) (0.11) (0.19) (0.35) (0.80) (0.82) }
Strategic Investors’ 0.17 0.01 0.03 �0.15 �0.02 �0.04 0.11 1.00ownership (0.03) (0.91) (0.73) (0.05) (0.76) (0.64) (0.16) }
p-values shown in parentheses.
R. NEUMANN AND T. VOETMANN36
Copyright # 2004 John Wiley & Sons, Ltd. Manage. Decis. Econ. 26: 25–37 (2005)
Campbell JY, Lo AW, MacKinlay AC. 1997. TheEconometrics of Financial Markets. Princeton Uni-versity Press: Princeton, NJ.
Coughlan AT, Schmidt RM. 1985. Executive compensa-tion, management turnover, and firm performance: anempirical investigation. Journal of Accounting andEconomics 7: 43–66.
DeAngelo H, DeAngelo L. 1989. Proxy contests and thegovernance of public held corporations. Journal ofFinancial Economics 23: 29–61.
Denis DJ, Denis DK. 1995. Performance changesfollowing top management dismissals. Journal ofFinance 50: 1029–1057.
Denis DJ, Denis DK, Sarin A. 1997. Ownershipstructure and top executive turnover. Journal ofFinancial Economics 45: 193–221.
Fisher FM, McGowan JJ. 1973. On the misuse ofaccounting rates of return to infer monopoly profits.American Economic Review 73: 82–97.
Gillian S, Starks L. 2001. Corporate governanceproposals and shareholder activism: the role ofinstitutional investors. Journal of Financial Economics57: 275–305.
Hadlock CJ, Lumer GB. 1997. Compensation, turnoverand top management incentives: historical evidence.Journal of Business 70: 153–187.
Huson MR, Parrino R, Starks L. 2001. Internalmonitoring mechanisms and CEO turnover: along term perspective. Journal of Finance 56:2265–2297.
Jensen M, Murphy K. 1990. Performance pay and top-management incentives. Journal of Political Economy98: 225–264.
Lausten, M. 2002. CEO turnover, firm performance andcorporate governance: empirical evidence on Danishfirms. International Journal of Industrial Organization20: 391–414.
McConnell JJ, Servaes H. 1990. Additional evidence onequity ownership and corporate value. Journal ofFinancial Economics 26: 595–612.
Mikkelson WH, Partch M. 1997. The decline of take-overs and disciplinary managerial turnover. Journal ofFinancial Economics 44: 205–228.
Parrino R. 1997. CEO turnover and outside succession:a cross sectional analysis. Journal of FinancialEconomics 46: 165–197.
Parum C. 1995. Institutional investors ejerandele idanske b�rsnoterede selskaber: Myter og realiteter.National�konomisk Tidsskrift 133: 302–318.
Rechner PL, Dalton DR. 1991. CEO duality andorganizational performance: a longitudinal analysis.Strategic Management Journal 12: 155–160.
Warner JB, Watts RL, Wruck KH. 1988. Stock pricesand top management changes. Journal of FinancialEconomics 20: 461–492.
Weisbach MS. 1988. Outside directors and CEO turn-over. Journal of Financial Economics 20: 431–460.
Weisbach MS. 1995. CEO turnover and the firm’sinvestment decisions. Journal of Financial Economics37: 159–188.
TOP EXECUTIVE TURNOVERS 37
Copyright # 2004 John Wiley & Sons, Ltd. Manage. Decis. Econ. 26: 25–37 (2005)


![Brian Short Pursuit, Tackle, Turnovers Clinic Talk [Read-Only]](https://img.pdfslide.us/doc/110x75/5695d08e1a28ab9b0292eee3/brian-short-pursuit-tackle-turnovers-clinic-talk-read-only.jpg)