Embed Size (px)
Citation preview
Top 20 Dairy Processors’ impact on the world is understated
The Top 20 dairy processors provide over 100 bill US$ / year to society
The IFCN research approach
The IFCN Top 20 Milk Processors List provides validated, comparable data to better understand the
largest dairy processors worldwide. In 2020, IFCN has extended its research about these processors
and has created the world’s first dairy processor report: a fact book that makes dairy processing
companies comparable. Analysing a wider set of sources and data, it illustrates the contributions of
milk processors with a focus on people, planet and profits.
People Planet Profit
Contributions to dairy farmers, employees, shareholders, and
taxes to governments
How companies address sustainability and greenhouse
gas emissions
Analysis of profitability indicators
and their drivers
The Top 20 dairy companies in 2019
Milk volume and market share: The Top 20 milk processors represent 25% of the milk produced
globally by collecting 211 mill t milk. Their milk intake has increased annually by around 2.4% during
the 2014-2019 period, which is broadly in line with global milk production growth.
The top 20 dairy companies: The majority of the Top 20 dairy processors is located in Europe, with
ten of them having their global headquarters based there. Six of them are located in North-America,
three in Asia, and one in Oceania. The top 3 dairy companies by milk intake are: 1) DFA (Dairy
Farmers of America), 2) Fonterra and 3) Lactalis. By turnover, IFCN data show Lactalis as ranked first,
followed by Nestlé and Danone in second and third place.
Changes in the ranking by milk intake: In line with the last ranking published in 2018, Dairy Farmers
of America continues to top the list in 2020. The top seven processors - DFA, Fonterra, Lactalis, Arla,
Nestlé, FrieslandCampina and Saputo - maintained their positions compared with the previous
ranking in 2018. The top 10 ranking is completed by Amul, Yili and Mengniu, three Asian dairies,
which also showed the biggest increase in the ranking. Land O’Lakes and Leprino are the
“newcomers” in the 2020 ranking.
People, planet and profit of the Top 20 dairy companies in 2019
People: By collecting and processing 211 billion litres of milk, the Top 20 dairy processors not only
serve the dairy needs of over one billion people, they also contribute over USD 100 billion dollar
annually to society. Of these, USD 71 billion go for example to dairy farmers and USD 21 billion are
paid to 460,000 employees.
Planet: In terms of sustainability goals, 20 out of the 20 Top 20 dairy processors report on climate
and sustainability monitoring and 10 out of the 20 declared to become carbon neutral by 2050.
Profit: The EBITDA margin for all processors over the years 2014 – 2019 was on average around 8%,
even though the range between companies is much wider between 1% to 20%.
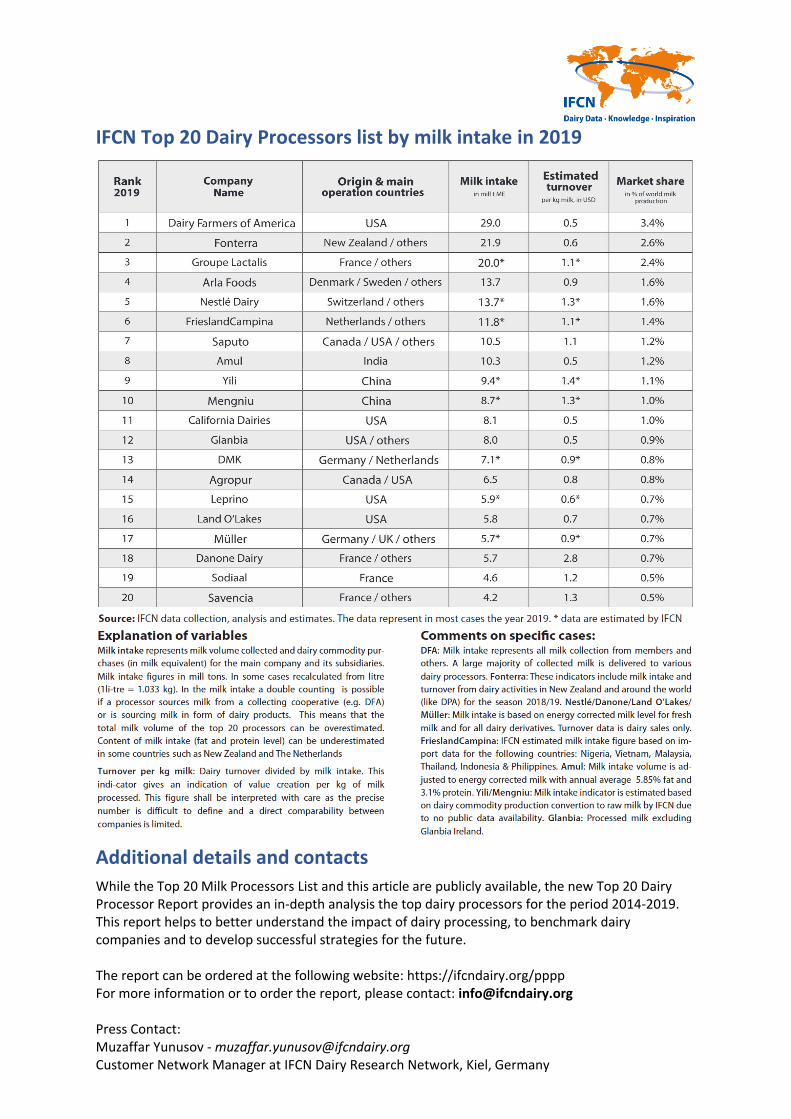
IFCN Top 20 Dairy Processors list by milk intake in 2019
Additional details and contacts
While the Top 20 Milk Processors List and this article are publicly available, the new Top 20 Dairy Processor Report provides an in-depth analysis the top dairy processors for the period 2014-2019. This report helps to better understand the impact of dairy processing, to benchmark dairy companies and to develop successful strategies for the future.
The report can be ordered at the following website: https://ifcndairy.org/pppp For more information or to order the report, please contact: [email protected]
Press Contact: Muzaffar Yunusov - [email protected] Customer Network Manager at IFCN Dairy Research Network, Kiel, Germany
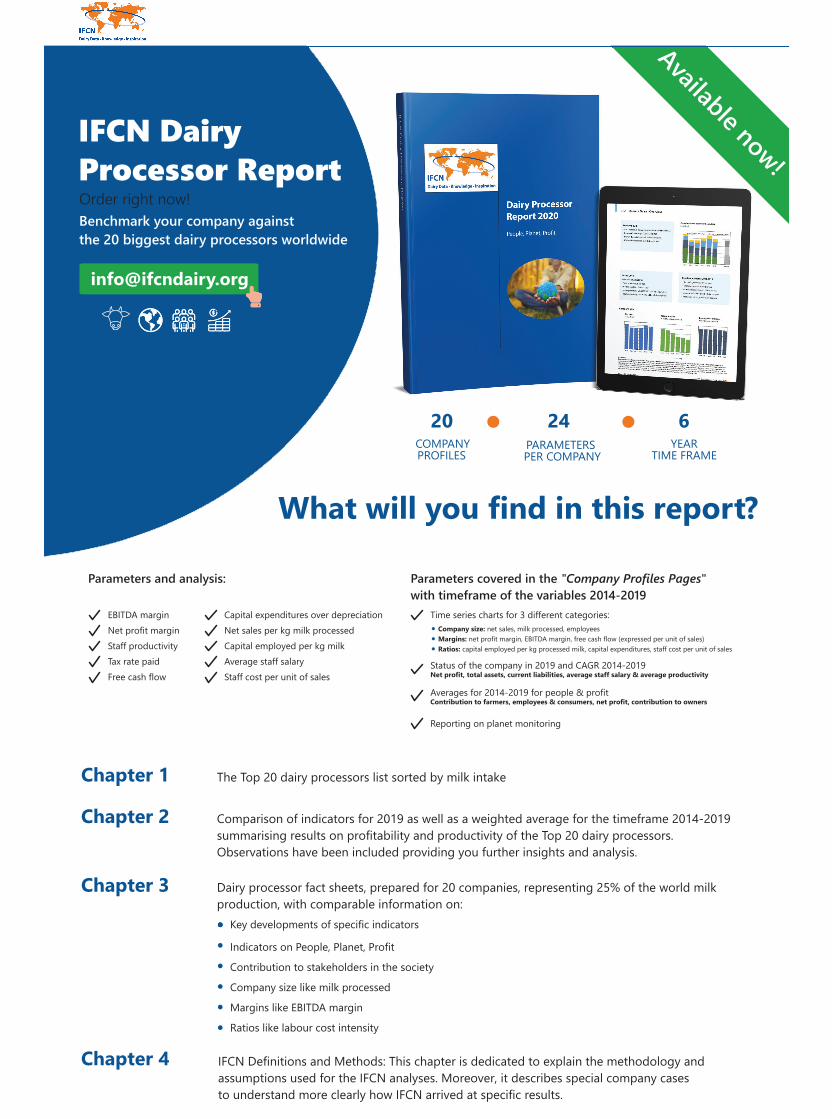
IFCN Dairy Processor ReportBenchmark your company against the 20 biggest dairy processors worldwide
20COMPANY PROFILES
24PARAMETERS PER COMPANY
6YEAR
TIME FRAME
Order right now!
What will you find in this report?Parameters and analysis:
EBITDA marginNet profit marginStaff productivityTax rate paidFree cash flow
Capital expenditures over depreciationNet sales per kg milk processedCapital employed per kg milkAverage staff salaryStaff cost per unit of sales
Parameters covered in the "Company Profiles Pages" with timeframe of the variables 2014-2019
Time series charts for 3 different categories:
Status of the company in 2019 and CAGR 2014-2019
Company size: net sales, milk processed, employees
Net profit, total assets, current liabilities, average staff salary & average productivity
Averages for 2014-2019 for people & profit
Reporting on planet monitoring
Contribution to farmers, employees & consumers, net profit, contribution to owners
Margins: net profit margin, EBITDA margin, free cash flow (expressed per unit of sales)Ratios: capital employed per kg processed milk, capital expenditures, staff cost per unit of sales
Available now!
Chapter 1 The Top 20 dairy processors list sorted by milk intake
Chapter 2 Comparison of indicators for 2019 as well as a weighted average for the timeframe 2014-2019 summarising results on profitability and productivity of the Top 20 dairy processors. Observations have been included providing you further insights and analysis.
Chapter 3 Dairy processor fact sheets, prepared for 20 companies, representing 25% of the world milk production, with comparable information on:
Key developments of specific indicators
Indicators on People, Planet, Profit
Contribution to stakeholders in the society
Company size like milk processed
Margins like EBITDA margin
Ratios like labour cost intensity
Chapter 4 IFCN Definitions and Methods: This chapter is dedicated to explain the methodology and assumptions used for the IFCN analyses. Moreover, it describes special company cases to understand more clearly how IFCN arrived at specific results.