Embed Size (px)
Citation preview

CropEnergies AG Joachim Lutz (CEO)
14 February 2017

CropEnergies AG, 14 February 2017
CropEnergies AG (CE): overview
Leading EU - producer of sustainable bioethanol
Bioenergy-division of Südzucker (69% share)
Integrated producer of ethanol and protein from domestic sources
1.3 mn m³ ethanol (capacity), replacing fossil oil
> 1 mn t food/feed protein, replacing soy imports
100,000 t liquefied biogenic CO2
Key data
€ 723 mn revenues*
416 employees*
M cap € 540 mn
* BY 2015/16
2

CropEnergies AG, 14 February 2017
Highlights
Market and political environment
EU RED II draft published on 30 November 2016
Belgium: E10 introduced on 1 January 2017
Germany: GHG reduction target raised to 4.0 wt.-%
Normalization of bioethanol prices
CropEnergies
Strong increase in production
Solid 9M financials
Outlook for 2016/17 raised
3

CropEnergies AG, 14 February 2017
0.40
0.50
0.60
0.70
0.80
0.90
1.00
1.10
1.20
1.30
1.40
19
90
19
92
19
94
19
96
19
98
20
00
20
02
20
04
20
06
20
08
20
10
20
12
20
14
1990=1
Greenhouse Gas Emissions (GHG)* by Sector: EU-28
Energy Industries Industry ***
Transport ** Residential and commercial
Agriculture, Forestry, Fisheries **** Other *****
Total
EU: Policy framework for renewable fuels (I)
Transport sector major contributor to CO2 emissions
Air quality / exhaust pollutants are growing concern
Paris Climate Agreement: in force since Nov 2016
Limit global warming to < 2 °C /2100 climate neutrality
EU general targets for transport sector for 2020
RED: 10% renewable energy (incl. up to 7%
renewable fuels from arable crops)
FQD: 6% less GHG emissions from fuels
Two-sided approach to low-carbon transport
Developing new cars medium-term
Improving fuel quality short-term
4
GHG emissions by sector EU-28
(2014: 4.4 Gt CO2eq)
Source: EEA (2016)
23%
0.40
0.50
0.60
0.70
0.80
0.90
1.00
1.10
1.20
1.30
1.40
1990
1992
1994
1996
19
98
2000
2002
2004
2006
2008
2010
2012
20
14
1990=1
Greenhouse Gas Emissions (GHG)* by Sector: EU-28
Energy Industries Industry ***
Transport ** Residential and commercial
Agriculture, Forestry, Fisheries **** Other *****
Total

CropEnergies AG, 14 February 2017
Market volume and REN energy targets 2020
EU: bioethanol consumption
2016: 5.2 mn m3 (-2%), growth expected in 2017
2016: blending share about 5.0 vol.-%
Additional market 2.5 mn m3 (+2%) neutral alcohol
Germany: bioethanol consumption
2016: 1.5 mn m3 (-2%)
Further increase in GHG savings
E10 market share 12%
2017: increase GHG targets to -4 (-3.5) %
France: bioethanol consumption
2016: 0.8 mn m3 (+4%), reduced tax disadvantage
E10 market share 37%
Belgium: E10 introduction in Jan 2017
Increase of blending rate from 4 to 8.5 vol.-%
5
Germany: GHG savings of bioethanol
Source: BLE (2015, 2016)
EU: REN share in transport energy
Source: Eurostat (2016)
49%
62%
71%
0%
10%
20%
30%
40%
50%
60%
70%
80%
2012 Q1 2015 2015
1.0% 2.1%
3.6%4.8%
5.0% 5.9%
0%
2%
4%
6%
8%
10%
12%
2004 2006 2008 2010 2012 2014
Share of renewable energy in fuel consumption of transportTransport
Source: Eurostat

CropEnergies AG, 14 February 2017
EU: Policy framework for renewable fuels (II)
EU Council mandate (Oct 2014): at least 40% less GHG emissions by 2030
EU COM 2030 climate and energy package (draft 30 Nov 2016)
27% overall share of renewable energy
No specific target for transport sector
Alternative fuels up to 6.8% (2021: 1.5%)
Fuels from arable crops down to 3.8% (2021: 7%)
Industry position
Most pollutive sector (transport) needs specific target
Development, investment and growth of alternative
fuels need stable basis for fuels from arable crops
EU COM proposal would increase fossil fuel use
and decrease alternatives
6
Energy in transport – 2030 (%-Mtoe)
According to draft EU COM RED II
Black: fossil fuels, green: renewable fuels from
arable crops - limit, yellow; alternative renewable
fuels Annex IX-A min target, orange: Annex IX-B –
limit, red: other low emission fuels
Source: ePURE

CropEnergies AG, 14 February 2017
Price developments on relevant markets
High volatility of EU ethanol prices
Currently at € 590 /m3
Price movements do not always reflect
demand/supply situation
Catching up with biodiesel and oil
Stability on grain markets
Expected record world grain harvest
2,080 mn t in 2016/17 (+5%)
Record world ending stocks 507 mn t (+4%)
EU grain harvest 295 mn t (-5%)
exceeds consumption (285 mn t)
7
100
200
300
400
500
600
700
800
(€/t o
r €/m
3)
Euronext Paris wheat No. 2
Gross raw material costs
Fuel EtOH T2 FOB
Rdm.
Gross profit for wheat-EtOH
FAME FOB Rdm.
Price development
CropEnergies AG, 14 February 2017
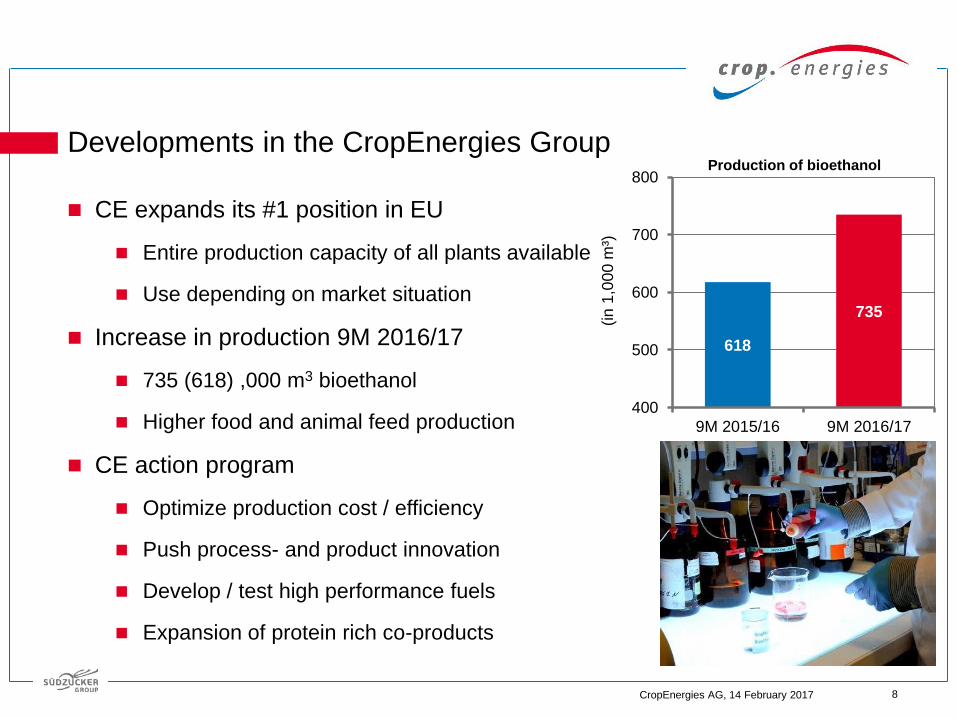
CE expands its #1 position in EU
Entire production capacity of all plants available
Use depending on market situation
Increase in production 9M 2016/17
735 (618) ,000 m3 bioethanol
Higher food and animal feed production
CE action program
Optimize production cost / efficiency
Push process- and product innovation
Develop / test high performance fuels
Expansion of protein rich co-products
Developments in the CropEnergies Group
8
Production of bioethanol
618
735
400
500
600
700
800
9M 2015/16 9M 2016/17
(in
1,0
00
m³)

CropEnergies AG, 14 February 2017
Income statement (I): 1st - 3rd quarter 2016/17
Revenues match previous year’s € 565 (558) mn
Higher production volumes replace trading
Lower prices for bioethanol and for most proteins
EBITDA close to previous year’s record € 87 (89) mn
Operating profit at € 60 (63) mn
Lower yoy, but significantly better than expected
*without restructuring costs and special items
9
626558 565
777
618
735
0
200
400
600
800
1.000
9M14/15
9M15/16
9M16/17
(in €
mill
ion / ,000 m
³)
Revenues / Production
21
89 87
0
20
40
60
80
100
9M14/15
9M15/16
9M16/17
(in €
mill
ion)
EBITDA
(in € million) 9M 16/17 9M 15/16 Δ Δ
Revenues 564.6 558.0 + 6.6 + 1%
EBITDA* 87.1 89.0 - 2.0 - 2%
Margin 15.4% 16.0%
Depreciation* -27.6 -25.6 - 2.0 - 8%
Operating profit 59.5 63.4 - 3.9 - 6%

CropEnergies AG, 14 February 2017
Income statement (II): 1st - 3rd quarter 2016/17
Restructuring costs benefit from Ensus’ performance
Income from operations rose to € 53 (50) mn
Net earnings improved to € 36 (30) mn
10
-12
30
36
-20
-10
0
10
20
30
40
50
9M14/15
9M15/16
9M16/17
(in €
mill
ion)
Net earnings for the period
(in € million) 9M 16/17 9M 15/16 Δ
Revenues 564.6 558.0 + 6.6
Operating profit 59.5 63.4 - 3.9
Restructuring costs / special items -6.2 -13.0 + 6.7
At equity result 0.2 0.0 + 0.1
Income from operations 53.4 50.5 + 2.9
Financial result -3.5 -3.2 - 0.3
Earnings before income taxes 49.9 47.3 + 2.6
Taxes on income -14.0 -17.5 + 3.5
Net earnings for the period 35.9 29.8 + 6.1
-6
50
53
-20
0
20
40
60
80
9M14/15
9M15/16
9M16/17
(in €
mill
ion)
Income from operations

CropEnergies AG, 14 February 2017
Cash flow
Cash flow improves to € 68 (63) mn
Free cash flow reflects dividend paid for last year (0.15 €/share)
Total pay out since IPO 2006: 0.89 €
Net financial debt reduced to € 37 mn
11
6468
-13 -11
-40
-20
0
20
40
60
80
100
9M15/16
9M16/17
(in €
mill
ion)
Cash flow (+) / Investments (-)
(in € million) 9M 16/17 9M 15/16 Δ
Cash flow 68.2 63.5 + 4.8
Change in net working capital -15.8 14.0 - 29.9
Net investments -11.0 -13.0 + 2.0
Exchange rate changes et al. 0.0 -0.1 + 0.1
Free cash flow before dividends 41.4 64.4 - 23.1
Dividends for prior year -13.1 0.0 - 13.1
Free cash flow 28.3 64.4 - 36.1
30/11/2016 29/02/2016 Δ
Net financial debt 37.4 65.8 - 28.3

CropEnergies AG, 14 February 2017
Balance sheet structure and financial ratios
Net financial debt reduced to € 37 (86) mn
Shareholders‘ equity rose to € 392 (363) mn
Equity ratio 67%
12
363 367 392
0
100
200
300
400
500
(in €
mill
ion)
Shareholders' equity
Enterprise value*
255
465445
140
8637
28
119 116
Multiple 14.2
Multiple 4.6
Multiple 4.2
0
100
200
300
400
500
600
700
(€m
illio
n)
Market cap NFD EBITDA Projection
* EV multiple based on projection: 12/9 of EBITDA achieved in 9M
(in € million) 30/11/2016 30/11/2015 Δ Δ
Assets
Non-current assets 433.1 471.1 - 38.0 - 8%
Current assets 156.7 138.8 + 17.9 + 12.9%
Total assets 589.8 609.9 - 20.2 - 3%
Liabilities
Shareholders' equity 392.4 363.4 + 29.0 + 8.0%
Non-current liabilities 78.2 119.5 - 41.3 - 35%
Current liabilities 119.1 127.0 - 7.9 - 6%
Total liabilities and equity 589.8 609.9 - 20.2 - 3%
Net financial debt (NFD) 37.4 85.8 - 48.3 - 56%
Equity ratio 67% 60%
Gearing (NFD/Equity) 10% 24%

CropEnergies AG, 14 February 2017
Outlook 2016/17e
Bioethanol prices in January 2017 back to normal
High volatility expected to stay
Full production capacity available since July 2016
Flexible use of CE’s production capacity according to market and order situation
Revenues range € 760 - € 790 (previously expected: € 670 - € 720) mn
EBITDA range € 105 - € 120 (previously expected: € 85 - € 115) mn
Operating profit range € 70 - € 85 (previously expected: € 50 - € 80) mn
Restructuring cost / special items will decline significantly year over year
13

End

CropEnergies AG, 14 February 2017
EU ethanol: efficient, climate friendly, available
Facts – no fiction
Already about 70% GHG reduction
No effects on global food price and supply
Bridging gap between EU grain surplus
and protein deficit
Decreases reliance on fossil fuels
Efficient feedstock use: 99.7% locally grown
Straw stays in fields: improving soil quality
Starch replaces fossil oil imports
Proteins replace (GMO) soy imports from America
Fermentation CO2 replaces fossil CO2 in beverages
15
EU: Grain surplus, protein deficit,
and price development of
wheat (€/t) and ICE Brent Crude ($/bbl)
Left: Net exports (+) / net imports (-) in mn. t
Right: wheat price in €/t, ICE crude oil in USD/bbl
Sources: EU Commission (2016), Euronext Paris, ICE
19 19
1115
25
3630
16
-5 -4 -4 -5 -6 -6 -7-6
-32 -34 -32-29
-32 -31 -33
0
70
140
210
280
350
-50
-30
-10
10
30
50
Wheat price i(€
/t)
Net export
s (
mill
ion t
)
soybean meal soybean
palm oil coarse grains
wheat Matif wheat price
ICE Brent Crude price

CropEnergies AG, 14 February 2017
Contact
CropEnergies AG
Maximilianstraße 10
68165 Mannheim
Investor Relations
Dr. Lilia Filipova-Neumann
Phone: +49 (621) 71 41 90-30
Public Relations / Marketing
Nadine Dejung-Custance
Phone: +49 (621) 71 41 90-65
www.cropenergies.com
Stock information
ISIN: DE000A0LAUP1
Symbol: CE2
Bloomberg / Reuters: CE2 GY / CE2G.DE
Transparency standard: Prime Standard
Disclaimer
This presentation contains forward-looking statements based on assumptions and estimates made by the executive board of CropEnergies AG. Although the executive
board may be convinced that these assumptions and estimates are reasonable, the future actual developments and future actual results may vary considerably from
the assumptions and estimates due to many external and internal factors. For example, matters to be mentioned in this connection include changes in the general
economic conditions, competitive product and pricing pressures and developments in the regulatory framework. CropEnergies AG assumes no responsibility and
accepts no liability for future developments and future actual results achieved being the same as the assumptions and estimates included in this presentation.
This presentation includes percentage and number rounding.
Financial Calendar
17 May 2017: Annual press and analysts’ conference for the 2016/17
financial year
12 July 2017: Report for 1st quarter of 2017/18
18 July 2017: Annual General Meeting 2017
11 October 2017: Report for the 1st half of 2017/18
10 January 2018: Report for 1st to 3rd quarter of 2017/18


![Vorlesungsmanuskript zur Funktionentheorie · [17] , Aufgabensammlung zur Funktionentheorie. II. Aufgaben zur höheenr Funktionentheorie , 5te Au . Sammlung Göschen Bd. 878, Walter](https://img.pdfslide.us/doc/110x75/5d54ed5188c9934e2b8bcc58/vorlesungsmanuskript-zur-17-aufgabensammlung-zur-funktionentheorie-ii.jpg)