Embed Size (px)
Citation preview
1
Image captions/credits on Page 2.
INDEX/SATAL 2010
Tools of Exploration: CTD
FocusCTD (conductivity, temperature, depth profiler)
Grade Level9-12 (Earth Science/Physical Science/Technology)
Focus QuestionHow does a CTD help explore Earth’s deep ocean?
Learning Objectivesn Students will be able to describe typical effects of hydrothermal vents,
volcanoes, and cold seeps on chemical and physical parameters of seawater.
n Students will be able to explain how oceanographers can use CTD data
to locate these geologic features. n Students will be able to analyze data from CTD casts for the presence
of anomalies.
Materialsq Copies of the Introduction to CTD Data Worksheet, one copy for each
student group
Audio-Visual Materialsq Video projector or large screen monitor for showing downloaded
videos (see Learning Procedure, Step 3)
Teaching TimeOne or two 45-minute class periods, plus time for student research
Seating ArrangementGroups of 2-4 students
Maximum Number of Students30
Key WordsCTDOxidation reduction potentialOptical backscatterPlume
2
Image captions/credits on Page 2.
www.oceanexplorer.noaa.gov INDEX/SATAL 2010: Tools of Exploration: CTDGrades 9-12 (Earth Science/Physical Science/Technology)
Background InformationNOTE: Explanations and procedures in this lesson are written at a level appropriate to professional educators. In presenting and discussing this material with students, educators may need to adapt the language and instructional approach to styles that are best suited to specific student groups. During the summer of 2010, scientists from Indonesia and the United States will work together on an expedition to explore the deep ocean surrounding Indonesia. This mission is called INDEX/SATAL 2010, since the expedition is focussed on INDonesia, EXploration, and the Sangihe Talaud (SATAL) region. Working from the Indonesian Research Vessel Baruna Jaya IV and the NOAA Ship Okeanos Explorer, these ocean explorers expect to find new deep-sea ecosystems, undiscovered geological features, and living organisms that have never been seen before. New discoveries are always exciting to scientists; but information from ocean exploration is important to everyone, because:
• Biodiversity in deep-sea ecosystems includes new species that can provide important drugs and other useful products;
• Some deep-sea ecosystems include organisms that can be used for human food;
• Information from deep ocean exploration can help predict earthquakes and tsunamis; and
• Human benefits from deep ocean systems are being affected by changes in Earth’s climate and atmosphere.
One of the most exciting and significant scientific discoveries in the history of ocean science was made in 1977 at a divergent plate boundary near the Galapagos Islands. Here, researchers found large numbers of animals that had never been seen before clustered around underwater hot springs flowing from cracks in the lava seafloor. Similar hot springs, known as hydrothermal vents, have since been found in many other locations where underwater volcanic processes are active. Hydrothermal vents are formed when the movement of tectonic plates causes deep cracks to form in the ocean floor. Seawater flows into these cracks, is heated by magma, and then rises back to the surface of the seafloor. The water does not boil because of the high pressure in the deep ocean, but may reach temperatures higher than 350° C. This superheated water dissolves minerals in Earth’s crust. Hydrothermal vents are locations where the superheated water erupts through the seafloor. The temperature of the surrounding water is near-freezing, which causes some of the dissolved minerals to precipitate from the solution. This makes the hot water plume look like black smoke, and in some cases the precipitated minerals form chimneys or towers.
The presence of thriving biological communities in the deep ocean was a complete surprise, because it was assumed that food energy resources would be scarce in an environment without sunlight to support photosynthesis. Researchers soon discovered that the
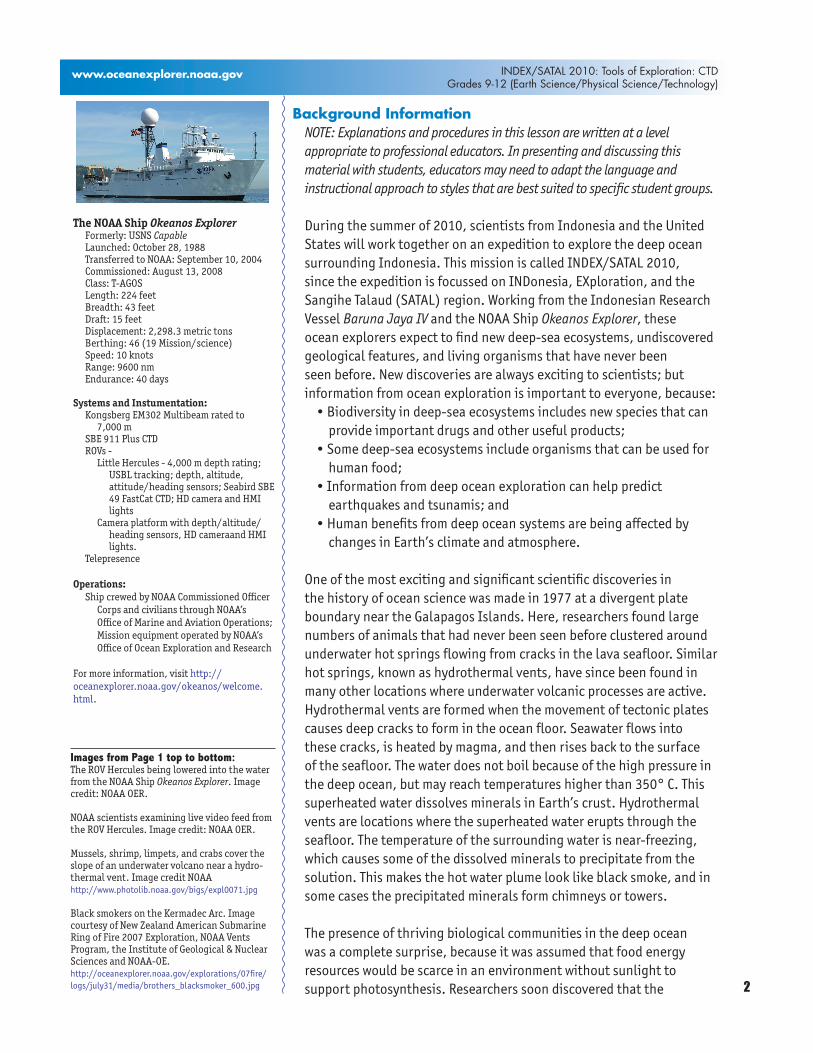
Images from Page 1 top to bottom:The ROV Hercules being lowered into the water from the NOAA Ship Okeanos Explorer. Image credit: NOAA OER.
NOAA scientists examining live video feed from the ROV Hercules. Image credit: NOAA OER.
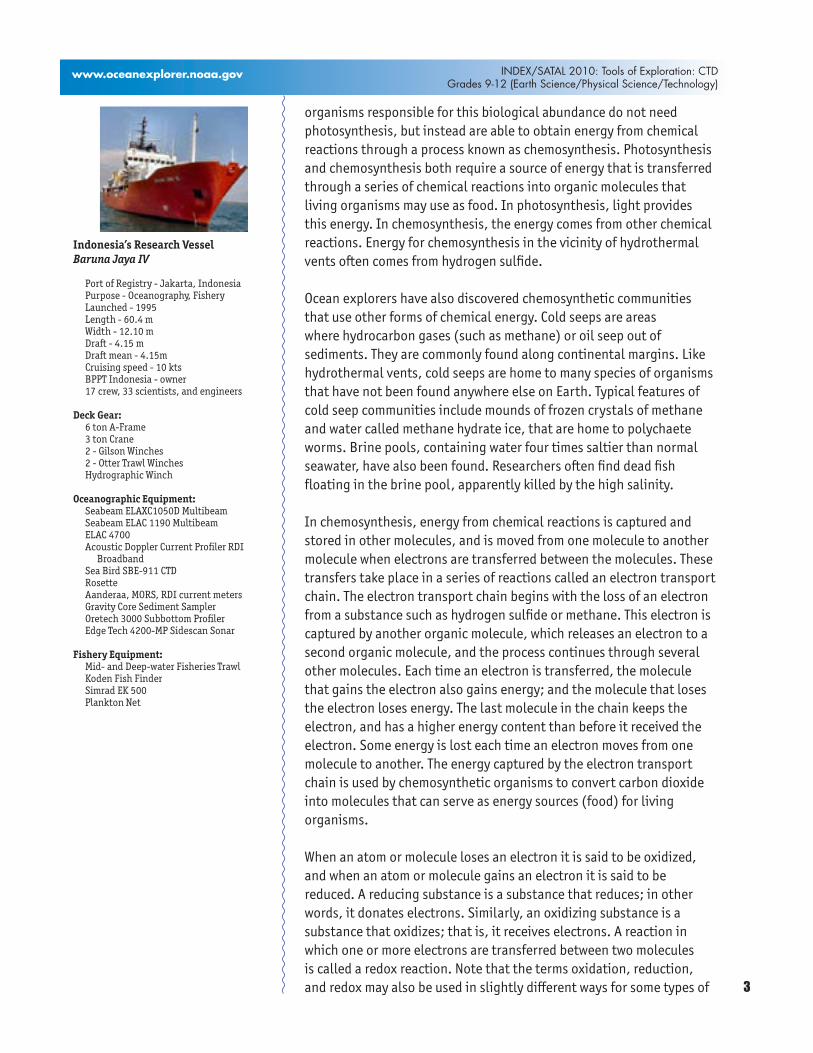
Mussels, shrimp, limpets, and crabs cover the slope of an underwater volcano near a hydro-thermal vent. Image credit NOAAhttp://www.photolib.noaa.gov/bigs/expl0071.jpg
Black smokers on the Kermadec Arc. Image courtesy of New Zealand American Submarine Ring of Fire 2007 Exploration, NOAA Vents Program, the Institute of Geological & Nuclear Sciences and NOAA-OE.http://oceanexplorer.noaa.gov/explorations/07fire/logs/july31/media/brothers_blacksmoker_600.jpg
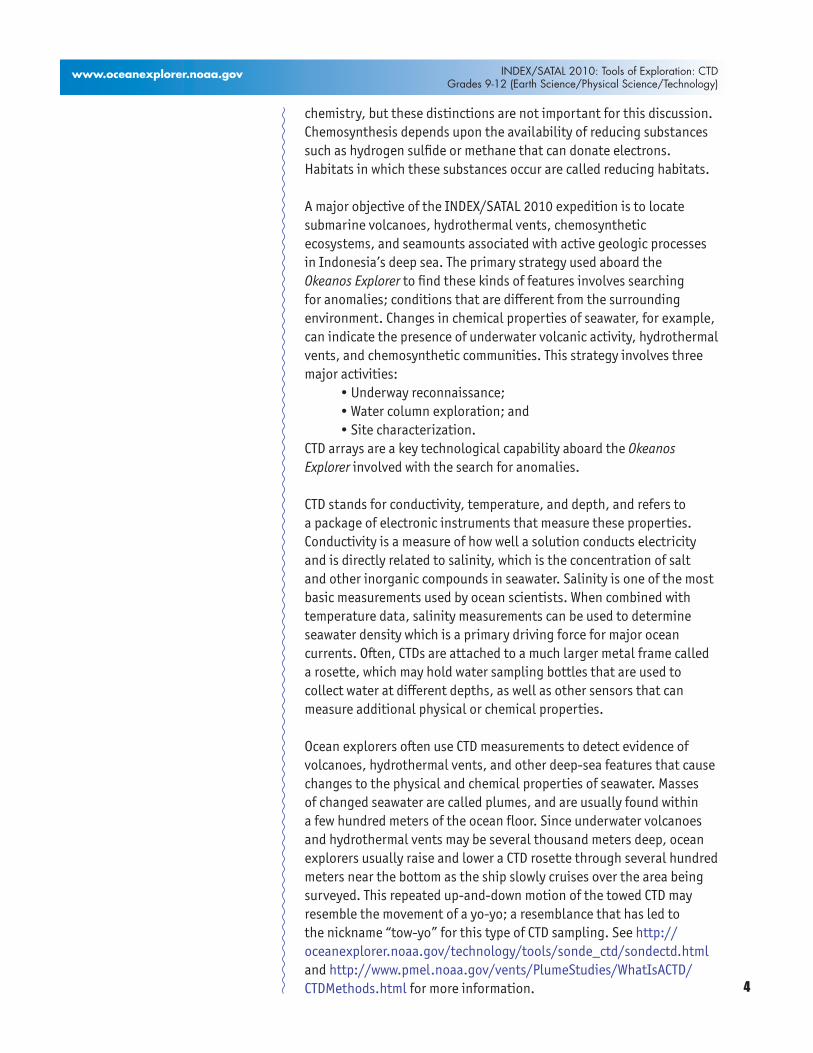
The NOAA Ship Okeanos ExplorerFormerly: USNS CapableLaunched: October 28, 1988Transferred to NOAA: September 10, 2004Commissioned: August 13, 2008Class: T-AGOSLength: 224 feetBreadth: 43 feetDraft: 15 feetDisplacement: 2,298.3 metric tonsBerthing: 46 (19 Mission/science)Speed: 10 knotsRange: 9600 nmEndurance: 40 days
Systems and Instumentation:Kongsberg EM302 Multibeam rated to
7,000 mSBE 911 Plus CTDROVs -
Little Hercules - 4,000 m depth rating; USBL tracking; depth, altitude, attitude/heading sensors; Seabird SBE 49 FastCat CTD; HD camera and HMI lights
Camera platform with depth/altitude/heading sensors, HD cameraand HMI lights.
Telepresence
Operations: Ship crewed by NOAA Commissioned Officer
Corps and civilians through NOAA’s Office of Marine and Aviation Operations; Mission equipment operated by NOAA’s Office of Ocean Exploration and Research
For more information, visit http://oceanexplorer.noaa.gov/okeanos/welcome.html.
3
Image captions/credits on Page 2.
www.oceanexplorer.noaa.gov INDEX/SATAL 2010: Tools of Exploration: CTDGrades 9-12 (Earth Science/Physical Science/Technology)
organisms responsible for this biological abundance do not need photosynthesis, but instead are able to obtain energy from chemical reactions through a process known as chemosynthesis. Photosynthesis and chemosynthesis both require a source of energy that is transferred through a series of chemical reactions into organic molecules that living organisms may use as food. In photosynthesis, light provides this energy. In chemosynthesis, the energy comes from other chemical reactions. Energy for chemosynthesis in the vicinity of hydrothermal vents often comes from hydrogen sulfide.
Ocean explorers have also discovered chemosynthetic communities that use other forms of chemical energy. Cold seeps are areas where hydrocarbon gases (such as methane) or oil seep out of sediments. They are commonly found along continental margins. Like hydrothermal vents, cold seeps are home to many species of organisms that have not been found anywhere else on Earth. Typical features of cold seep communities include mounds of frozen crystals of methane and water called methane hydrate ice, that are home to polychaete worms. Brine pools, containing water four times saltier than normal seawater, have also been found. Researchers often find dead fish floating in the brine pool, apparently killed by the high salinity.
In chemosynthesis, energy from chemical reactions is captured and stored in other molecules, and is moved from one molecule to another molecule when electrons are transferred between the molecules. These transfers take place in a series of reactions called an electron transport chain. The electron transport chain begins with the loss of an electron from a substance such as hydrogen sulfide or methane. This electron is captured by another organic molecule, which releases an electron to a second organic molecule, and the process continues through several other molecules. Each time an electron is transferred, the molecule that gains the electron also gains energy; and the molecule that loses the electron loses energy. The last molecule in the chain keeps the electron, and has a higher energy content than before it received the electron. Some energy is lost each time an electron moves from one molecule to another. The energy captured by the electron transport chain is used by chemosynthetic organisms to convert carbon dioxide into molecules that can serve as energy sources (food) for living organisms.
When an atom or molecule loses an electron it is said to be oxidized, and when an atom or molecule gains an electron it is said to be reduced. A reducing substance is a substance that reduces; in other words, it donates electrons. Similarly, an oxidizing substance is a substance that oxidizes; that is, it receives electrons. A reaction in which one or more electrons are transferred between two molecules is called a redox reaction. Note that the terms oxidation, reduction, and redox may also be used in slightly different ways for some types of
Indonesia’s Research Vessel Baruna Jaya IV
Port of Registry - Jakarta, IndonesiaPurpose - Oceanography, FisheryLaunched - 1995Length - 60.4 mWidth - 12.10 mDraft - 4.15 mDraft mean - 4.15mCruising speed - 10 ktsBPPT Indonesia - owner17 crew, 33 scientists, and engineers
Deck Gear:6 ton A-Frame 3 ton Crane2 - Gilson Winches2 - Otter Trawl WinchesHydrographic Winch
Oceanographic Equipment:Seabeam ELAXC1050D MultibeamSeabeam ELAC 1190 MultibeamELAC 4700Acoustic Doppler Current Profiler RDI
BroadbandSea Bird SBE-911 CTDRosetteAanderaa, MORS, RDI current metersGravity Core Sediment SamplerOretech 3000 Subbottom ProfilerEdge Tech 4200-MP Sidescan Sonar
Fishery Equipment:Mid- and Deep-water Fisheries TrawlKoden Fish FinderSimrad EK 500Plankton Net
4
Image captions/credits on Page 2.
www.oceanexplorer.noaa.gov INDEX/SATAL 2010: Tools of Exploration: CTDGrades 9-12 (Earth Science/Physical Science/Technology)
chemistry, but these distinctions are not important for this discussion. Chemosynthesis depends upon the availability of reducing substances such as hydrogen sulfide or methane that can donate electrons. Habitats in which these substances occur are called reducing habitats.
A major objective of the INDEX/SATAL 2010 expedition is to locate submarine volcanoes, hydrothermal vents, chemosynthetic ecosystems, and seamounts associated with active geologic processes in Indonesia’s deep sea. The primary strategy used aboard the Okeanos Explorer to find these kinds of features involves searching for anomalies; conditions that are different from the surrounding environment. Changes in chemical properties of seawater, for example, can indicate the presence of underwater volcanic activity, hydrothermal vents, and chemosynthetic communities. This strategy involves three major activities: • Underway reconnaissance; • Water column exploration; and • Site characterization.CTD arrays are a key technological capability aboard the Okeanos Explorer involved with the search for anomalies.
CTD stands for conductivity, temperature, and depth, and refers to a package of electronic instruments that measure these properties. Conductivity is a measure of how well a solution conducts electricity and is directly related to salinity, which is the concentration of salt and other inorganic compounds in seawater. Salinity is one of the most basic measurements used by ocean scientists. When combined with temperature data, salinity measurements can be used to determine seawater density which is a primary driving force for major ocean currents. Often, CTDs are attached to a much larger metal frame called a rosette, which may hold water sampling bottles that are used to collect water at different depths, as well as other sensors that can measure additional physical or chemical properties.
Ocean explorers often use CTD measurements to detect evidence of volcanoes, hydrothermal vents, and other deep-sea features that cause changes to the physical and chemical properties of seawater. Masses of changed seawater are called plumes, and are usually found within a few hundred meters of the ocean floor. Since underwater volcanoes and hydrothermal vents may be several thousand meters deep, ocean explorers usually raise and lower a CTD rosette through several hundred meters near the bottom as the ship slowly cruises over the area being surveyed. This repeated up-and-down motion of the towed CTD may resemble the movement of a yo-yo; a resemblance that has led to the nickname “tow-yo” for this type of CTD sampling. See http://oceanexplorer.noaa.gov/technology/tools/sonde_ctd/sondectd.html and http://www.pmel.noaa.gov/vents/PlumeStudies/WhatIsACTD/CTDMethods.html for more information.

5
Image captions/credits on Page 2.
www.oceanexplorer.noaa.gov INDEX/SATAL 2010: Tools of Exploration: CTDGrades 9-12 (Earth Science/Physical Science/Technology)
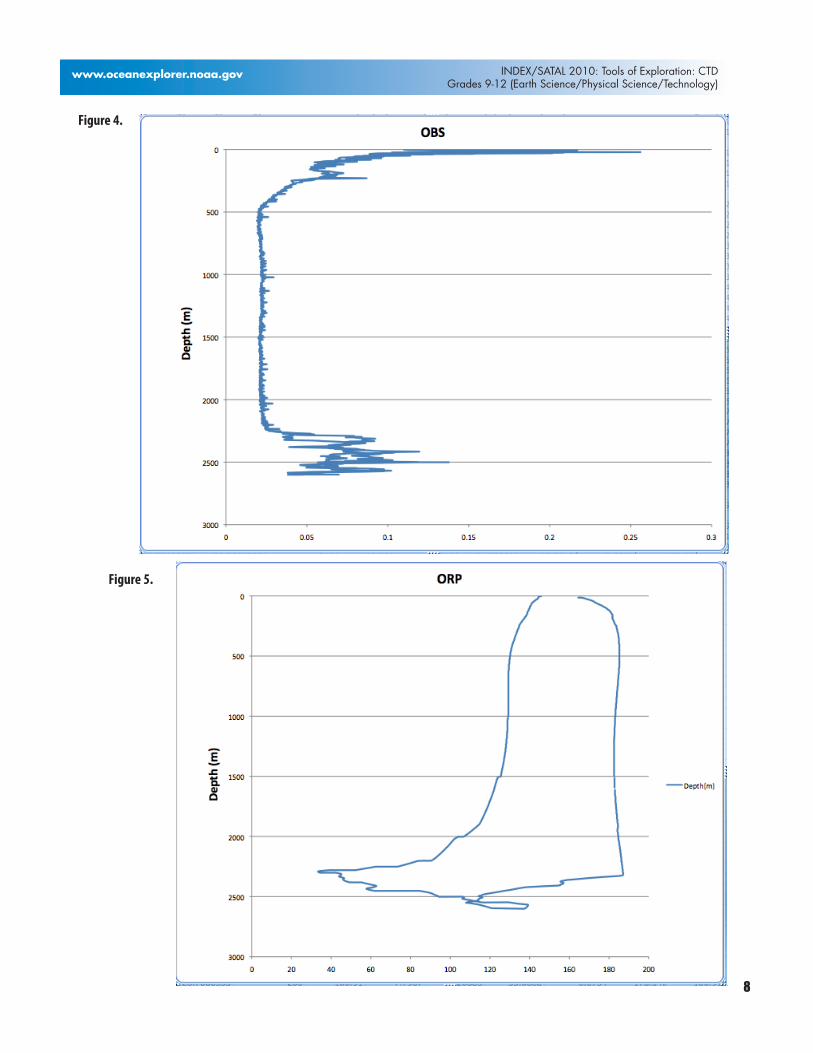
Temperature measurements from CTD sensors can be used to detect water temperature anomalies that may indicate the presence of volcanoes or hydrothermal vents. Two other sensors are also important to the search for these deep ocean features. Optical backscatter (OBS) sensors detect the presence of suspended particles that may come from hydrothermal vents or from the oxidation of methane which causes precipitates of carbonate material to form. Oxidation-Reduction Potential (ORP) sensors measure of the tendency of a substance to gain or lose electrons. ORP is measured in volts, and increases directly with the tendency of a substance to gain electrons and become reduced. Because chemosynthetic communities are based on chemical substances that can donate electrons, these chemical substances have a tendency to lose electrons. So a drop in ORP may signal the presence of chemosynthetic communities nearby.
The Okeanos Explorer is equipped with a Sea Bird SBE-9plus underwater CTD. Besides measuring conductivity, temperature, and depth, up to 8 additional sensors can be added to measure other physical and chemical characteristics.
Note: mention of proprietary names does not imply endorsement by NOAA.
This lesson introduces students to simple analysis of CTD data. In the future, students will have the opportunity to apply their analytic skills to investigate additional information from CTDs as the Okeanos Explorer continues its voyages of discovery in Earth’s deep ocean.
Learning Procedure[NOTE: Depending upon available time and instructional objectives,
educators may want to have students complete the background portion of the Hydrothermal Vent Plume Inquiry Guide (http://oceanexplorer.noaa.gov/explorations/10chile/background/edu/media/plume.pdf) which guides student inquiries about hydrothermal vents and plumes.]
1. To prepare for this lesson:(a) Review introductory essays for the INDEX/SATAL 2010 Expedition
at http://oceanexplorer.noaa.gov/okeanos/explorations/10index/welcome.html
(b) Review information about the importance of deep ocean exploration in the Background section of the Earth’s Ocean is 95% Unexplored: So What? lesson;
(c) Review background information on CTD technology at http://www.pmel.noaa.gov/vents/PlumeStudies/WhatIsACTD/CTDMethods.html
(d) Review questions on the Introduction to CTD Data Worksheet(e) Download the Download the data file EX0904_ctd_1.xls from
http://oceanexplorer.noaa.gov/okeanos/edu/resources/media/ex0904_ctd_1.xls, and install it on computers that students will
6
Image captions/credits on Page 2.
www.oceanexplorer.noaa.gov INDEX/SATAL 2010: Tools of Exploration: CTDGrades 9-12 (Earth Science/Physical Science/Technology)
be using to complete the Worksheet activity. Alternatively, you may have students download this file onto their own computer systems.
2. Briefly introduce the INDEX/SATAL 2010 Expedition, and point out that this expedition is the maiden voyage of the Okeanos Explorer, which is the only U.S. ship whose sole assignment is to systematically explore Earth’s largely unknown ocean for the purposes of discovery and the advancement of knowledge. Ask students for their ideas about why this kind of exploration might be important, and highlight some of the reasons referenced in Step 1b. Be sure students understand that discoveries of deep sea chemosynthetic communities during the last 30 years are major scientific events that have changed many assumptions about life in the ocean and have opened up many new fields of scientific investigation.
Review the overall exploration strategy used by Okeanos Explorer, highlighting the concept of finding anomalies, and that this strategy involves three major activities:
• Underway reconnaissance;• Water column exploration; and• Site characterization.
Underway reconnaissance involves mapping the ocean floor and
water column while the ship is underway, and using other sensors to measure chemical and physical properties of seawater. Water column exploration involves making measurements of chemical and physical properties “from top to bottom” while the ship is stopped. In some cases these measurements may be made routinely at pre-selected locations, while in other cases they may be made to decide whether an area with suspected anomalies should be more thoroughly investigated. Site characterization involves more detailed exploration of a specific region, including obtaining high quality imagery, making measurements of chemical and physical seawater properties, and obtaining appropriate samples.
Key technologies involved with this strategy include:• Multibeam sonar mapping system;• CTD and other electronic sensors to measure chemical and
physical seawater properties; and• A Remotely Operated Vehicle (ROV) capable of obtaining high-
quality imagery in depths as great as 4,000 meters.
A fourth technological capability that is essential to the Okeanos Explorer exploration strategy is advanced broadband satellite communication. This capability provides the foundation for “telepresence” technologies that allow people to observe and interact with events at a remote location. Telepresence allows live images to be transmitted from the seafloor to scientists ashore,
7
Image captions/credits on Page 2.
www.oceanexplorer.noaa.gov INDEX/SATAL 2010: Tools of Exploration: CTDGrades 9-12 (Earth Science/Physical Science/Technology)
classrooms, newsrooms and living rooms, and opens new educational opportunities that are a major part of Okeanos Explorer’s mission for advancement of knowledge. In addition, telepresence makes it possible for shipboard equipment to be controlled by scientists in shore-based Exploration Command Centers. In this way, scientific expertise can be brought to the exploration team as soon as discoveries are made, and at a fraction of the cost of traditional oceanographic expeditions.
3. Ask students why oceanographers would want to measure conductivity, and temperature, at certain depth intervals. Be sure students understand the relationship between conductivity and salinity. Briefly describe a CTD, emphasizing that these devices are often capable of measuring many other parameters in addition to conductivity, temperature, and depth. You may want to use information and/or images from http://www.pmel.noaa.gov/vents/PlumeStudies/WhatIsACTD/CTDMethods.html. Discuss how OBS and ORP may be affected by hydrothermal vent activity.
4. Tell students that their assignment is to look for anomalies in CTD data collected aboard the Okeanos Explorer in 2009. Provide each student group with a copy of the Introduction to CTD Data Worksheet, and ensure that students have access to the file referenced in Step 1e. Tell students that this activity is intended to familiarize them with CTD data and how they can be analyzed to find anomalies that may indicate the presence of undiscovered features on the ocean floor. You may also want to mention that this skill will allow them to investigate additional data that will be available from future Okeanos Explorer missions.
5. When students have answered questions on the Worksheet, lead a discussion of their results. This discussion should include:
• The time required to complete the entire CTD cast was 7160 seconds; just under two hours.
• The maximum depth recorded by the CTD was 2601.255 meters.
• Students should notice that the maximum depth occurred about half-way through the cast; this is because data were recorded during the CTD’s ascent (the “up cast”), as well as during its descent (the “down cast”).
• Students’ plots of OBS and ORP should resemble Figures 4 and 5 respectively. (See page 8).
• Plots of OBS and ORP both show anomalies between depths of 2,000 and 2,500 meters; increased OBS due to precipitates or
8
Image captions/credits on Page 2.
www.oceanexplorer.noaa.gov INDEX/SATAL 2010: Tools of Exploration: CTDGrades 9-12 (Earth Science/Physical Science/Technology)
Figure5.
Figure4.

9
Image captions/credits on Page 2.
www.oceanexplorer.noaa.gov INDEX/SATAL 2010: Tools of Exploration: CTDGrades 9-12 (Earth Science/Physical Science/Technology)
particulate material and a reduction in ORP are both indicative of plumes from hydrothermal vents.
• Two lines on the ORP plot represent data collected during the downcast and upcast; the numbers are different, in part, because the sensor that measures ORP continues to be affected by reducing substances for a period of time after it leaves the plume.
The BRIDGE Connectionwww.vims.edu/bridge/ – Scroll over “Ocean Science Topics” in the menu on the left side of the page, then “Habitats” then select “Deep Ocean” for activities and links about deep ocean ecosystems.
The “Me” ConnectionHave students write a short essay discussing how discovering a deep ocean anomaly might turn into a personal benefit.
Connections to Other SubjectsEnglish/Language Arts, Social Studies
AssessmentStudents answers to Worksheet questions and class discussions provide opportunities for assessment.
Extensions1. Visit http://oceanexplorer.noaa.gov/okeanos/
explorations/10index/welcome.html for the latest activities and discoveries by the INDEX/SATAL 2010 Expedition.
2. Visit the Okeanos Explorer Digital Atlas (http://www.ncddc.noaa.gov/website/google_maps/OkeanosExplorer/mapsOkeanos.htm) and Web page (http://oceanexplorer.noaa.gov/okeanos/welcome.html) for reports, images, and other products from Okeanos Explorer cruises.
Multimedia Discovery Missions http://oceanexplorer.noaa.gov/edu/learning/welcome.html – Click on the links to Lessons 1, 5, and 6 for interactive multimedia presentations and Learning Activities on Plate Tectonics, Chemosynthesis and Hydrothermal Vent Life, and Deep-Sea Benthos.
Other Relevant Lesson Plans from NOAA’s Ocean Exploration Program
Chemosynthesis for the Classroom (PDF, 274 kb) (from the 2002 Gulf of Mexico Expedition)http://oceanexplorer.noaa.gov/explorations/02mexico/background/edu/media/gom_chemo_gr912.pdf
10
Image captions/credits on Page 2.
www.oceanexplorer.noaa.gov INDEX/SATAL 2010: Tools of Exploration: CTDGrades 9-12 (Earth Science/Physical Science/Technology)
Focus: Chemosynthetic bacteria and succession in chemosynthetic communities (Chemistry/Biology)
In this activity, students will observe the development of chemosynthetic bacterial communities and will recognize that organisms modify their environment in ways that create opportunities for other organisms to thrive. Students will also be able to explain the process of chemosynthesis and the relevance of chemosynthesis to biological communities in the vicinity of cold seeps.
Hydrothermal Vent Challenge (PDF, 412 kb) (from the Submarine Ring of Fire 2004 Expedition)http://oceanexplorer.noaa.gov/explorations/04fire/background/edu/media/RoF.ventchall.pdf
Focus: Chemistry of hydrothermal vents (Chemistry)
Students will be able to define hydrothermal vents and explain the overall processes that lead to their formation. Students will be able to explain the origin of mineral-rich fluids associated with hydrothermal vents. Students will be able to explain how black smokers and white smokers are formed. Students will be able to hypothesize how properties of hydrothermal fluids might be used to locate undiscovered hydrothermal vents.
Thar She Blows! (PDF, 456 kb) (from the 2002 Galapagos Rift Expedition)http://oceanexplorer.noaa.gov/explorations/02galapagos/background/education/media/gal_gr9_12_l3.pdf
Focus: Hydrothermal vents
In this activity, students will demonstrate an understanding of how the processes that result in the formation of hydrothermal vents create new ocean floor; students will demonstrate an understanding of how the transfer of energy effects solids and liquids.
The Big Burp: Where’s the Proof? (PDF, 364 kb) (from the Expedition to the Deep Slope 2007 Expedition)http://oceanexplorer.noaa.gov/explorations/07mexico/background/edu/media/burp.pdf
Focus: Potential role of methane hydrates in global warming (Earth Science)
In this activity, students will be able to describe the overall events that occurred during the Cambrian explosion and Paleocene extinction events and will be able to define methane hydrates and hypothesize
11
Image captions/credits on Page 2.
www.oceanexplorer.noaa.gov INDEX/SATAL 2010: Tools of Exploration: CTDGrades 9-12 (Earth Science/Physical Science/Technology)
how these substances could contribute to global warming. Students will also be able to describe and explain evidence to support the hypothesis that methane hydrates contributed to the Cambrian explosion and Paleocene extinction events.
This Life Stinks (PDF, 276 kb) (from the 2003 Windows to the Deep Expedition)http://oceanexplorer.noaa.gov/explorations/03windows/background/education/media/03win_lifestinks.pdf
Focus: Methane-based chemosynthetic processes (Physical Science)
In this activity, students will be able to define the process of chemosynthesis, and contrast this process with photosynthesis. Students will also explain the process of methane-based chemosynthesis and explain the relevance of chemosynthesis to biological communities in the vicinity of cold seeps.
The Tell-Tale Plume (PDF, 1.2 Mb) (from the INSPIRE: Chile Margin 2010 Expedition)http://oceanexplorer.noaa.gov/explorations/10chile/background/edu/media/plume.pdf
Focus: Hydrothermal Vent Chemistry
Students will describe hydrothermal vents, identify changes that they cause to the physical and chemical properties of seawater, and use oceanographic data to recognize a probable plume from hydrothermal activity.
Other Resources The Web links below are provided for informational purposes only. Links outside of Ocean Explorer have been checked at the time of this page’s publication, but the linking sites may become outdated or non-operational over time.http://oceanexplorer.noaa.gov/okeanos/explorations/10index/
welcome.html – Web site for the INDEX/SATAL 2010 Expedition, with links to lesson plans, career connections, and other resources
http://oceanexplorer.noaa.gov/okeanos/edu/welcome.html – Web page for the NOAA Ship Okeanos Explorer Education Materials Collection
http://celebrating200years.noaa.gov/edufun/book/welcome.html#book - A free printable book for home and school use introduced in 2004 to celebrate the 200th anniversary of NOAA; nearly 200 pages of lessons focusing on the exploration, understanding, and protection of Earth as a whole system

12
Image captions/credits on Page 2.
www.oceanexplorer.noaa.gov INDEX/SATAL 2010: Tools of Exploration: CTDGrades 9-12 (Earth Science/Physical Science/Technology)
http://explore.noaa.gov/special-projects/indonesia-u-s-scientific-and-technical-cooperation-in-ocean-exploration/files/Okeanos_Explorer_for_WOC_-_FINAL.pdf – NOAA Fact Sheet about the NOAA Ship Okeanos Explorer
http://www.pmel.noaa.gov/vents/PlumeStudies/WhatIsACTD/CTDMethods.html – Web page about CTDs from NOAA’s Pacific Marine Environmental Laboratory
Yoerger, D., A. Bradley, M. Jakuba, M. Tivey, C. German, T. Shank, and R. Embley. 2007. Mid-ocean ridge exploration with an autonomous underwater vehicle. Oceanography 20(4):52-61(available online at http://www.tos.org/oceanography/issues/issue_archive/issue_pdfs/20_4/20.4_yoerger_et_al.pdf)
German, C., D. Yoerger, M. Jakuba, T. Shank, C. Langmuir, and K. Nakamura. 2008. Hydrothermal exploration with the Autonomous Benthic Explorer. Deep-Sea Research I 55:203-219
National Science Education StandardsContent Standard A: Science As Inquiry
• Abilities necessary to do scientific inquiry • Understandings about scientific inquiry
Content Standard B: Physical Science • Chemical reactions• Motions and forces
Content Standard D: Earth and Space Science • Energy in the Earth system• Geochemical cycles
Content Standard E: Science and Technology • Abilities of technological design
Content Standard F: Science in Personal and Social Perspectives • Natural resources
Content Standard G: History and Nature of Science• Nature of scientific knowledge
13
Image captions/credits on Page 2.
www.oceanexplorer.noaa.gov INDEX/SATAL 2010: Tools of Exploration: CTDGrades 9-12 (Earth Science/Physical Science/Technology)
Ocean Literacy Essential Principles and Fundamental Concepts
Essential Principle 1. The Earth has one big ocean with many features.Fundamental Concept b. An ocean basin’s size, shape and features (such as islands, trenches, mid-ocean ridges, rift valleys) vary due to the movement of Earth’s lithospheric plates. Earth’s highest peaks, deepest valleys and flattest vast plains are all in the ocean.
Essential Principle 2. The ocean and life in the ocean shape the features of the Earth. Fundamental Concept e. Tectonic activity, sea level changes, and force of waves influence the physical structure and landforms of the coast.
Essential Principle 4. The ocean makes Earth habitable.Fundamental Concept a. Most of the oxygen in the atmosphere originally came from the activities of photosynthetic organisms in the ocean.Fundamental Concept b. The first life is thought to have started in the ocean. The earliest evidence of life is found in the ocean.
Essential Principle 5. The ocean supports a great diversity of life and ecosystems.Fundamental Concept f. Ocean habitats are defined by environmental factors. Due to interactions of abiotic factors such as salinity, temperature, oxygen, pH, light, nutrients, pressure, substrate and circulation, ocean life is not evenly distributed temporally or spatially, i.e., it is “patchy”. Some regions of the ocean support more diverse and abundant life than anywhere on Earth, while much of the ocean is considered a desert. Fundamental Concept g. There are deep ocean ecosystems that are independent of energy from sunlight and photosynthetic organisms. Hydrothermal vents, submarine hot springs, and methane cold seeps rely only on chemical energy and chemosynthetic organisms to support life.
Essential Principle 6. The ocean and humans are inextricably interconnected.Fundamental Concept f. Coastal regions are susceptible to natural hazards (such as tsunamis, hurricanes, cyclones, sea level change, and storm surges).
Essential Principle 7. The ocean is largely unexplored.Fundamental Concept a. The ocean is the last and largest unexplored place on Earth—less than 5% of it has been explored. This is the great frontier for the next generation’s explorers and researchers, where they will find great opportunities for inquiry and investigation.
14
Image captions/credits on Page 2.
www.oceanexplorer.noaa.gov INDEX/SATAL 2010: Tools of Exploration: CTDGrades 9-12 (Earth Science/Physical Science/Technology)
Fundamental Concept b. Understanding the ocean is more than a matter of curiosity. Exploration, inquiry and study are required to better understand ocean systems and processes.Fundamental Concept d. New technologies, sensors and tools are expanding our ability to explore the ocean. Ocean scientists are relying more and more on satellites, drifters, buoys, subsea observatories and unmanned submersibles.Fundamental Concept f. Ocean exploration is truly interdisciplinary. It requires close collaboration among biologists, chemists, climatologists, computer programmers, engineers, geologists, meteorologists, and physicists, and new ways of thinking.
Send Us Your FeedbackWe value your feedback on this lesson.Please send your comments to: [email protected]
For More InformationPaula Keener-Chavis, Director, Education ProgramsNOAA Office of Ocean Exploration and ResearchHollings Marine Laboratory331 Fort Johnson Road, Charleston SC 29412843.762.8818 843.762.8737 (fax) [email protected]
AcknowledgementsThis lesson was developed by Mel Goodwin, PhD, Marine Biologist and Science Writer for NOAA’s Office of Ocean Exploration and Research. Layout and design by Coastal Images Graphic Design, Charleston, SC. If reproducing this lesson, please cite NOAA as the source, and provide the following URL: http://oceanexplorer.noaa.gov/
15
Image captions/credits on Page 2.
INDEX/SATAL 2010: Tools of Exploration: CTDGrades 9-12 (Earth Science/Physical Science/Technology)
www.oceanexplorer.noaa.gov
Tools of Exploration: CTD
Introduction to CTD Data Worksheet
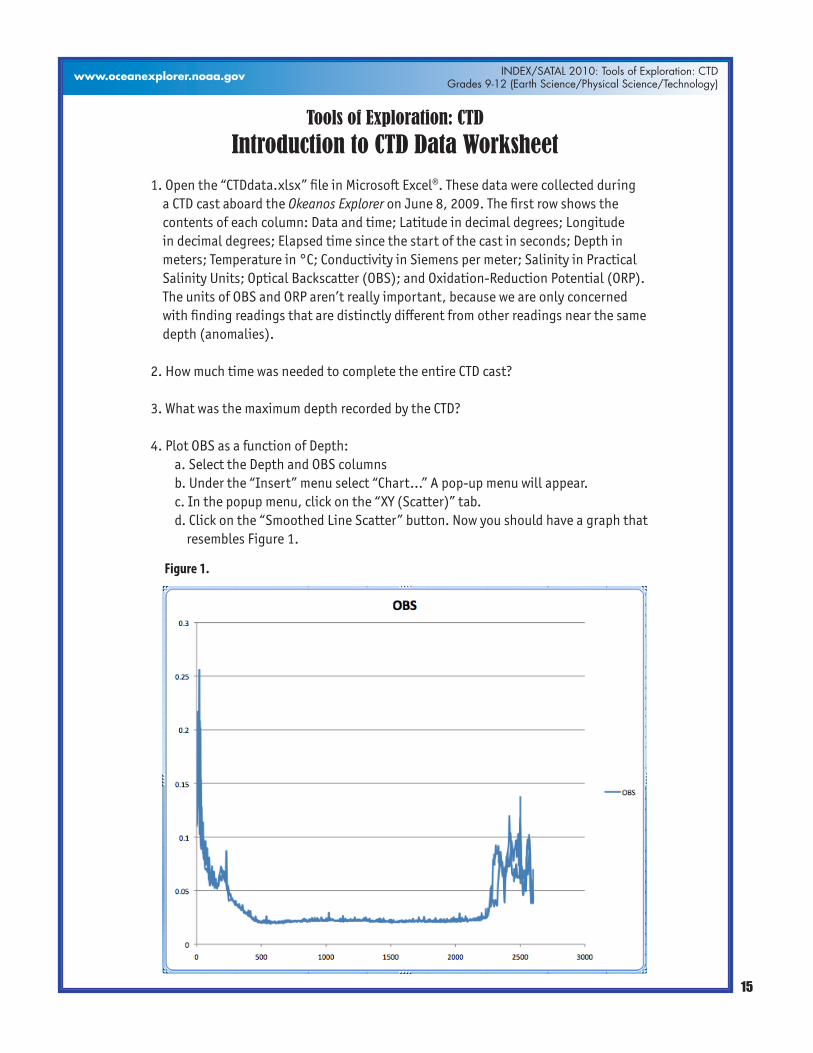
1. Open the “CTDdata.xlsx” file in Microsoft Excel®. These data were collected during a CTD cast aboard the Okeanos Explorer on June 8, 2009. The first row shows the contents of each column: Data and time; Latitude in decimal degrees; Longitude in decimal degrees; Elapsed time since the start of the cast in seconds; Depth in meters; Temperature in °C; Conductivity in Siemens per meter; Salinity in Practical Salinity Units; Optical Backscatter (OBS); and Oxidation-Reduction Potential (ORP). The units of OBS and ORP aren’t really important, because we are only concerned with finding readings that are distinctly different from other readings near the same depth (anomalies).
2. How much time was needed to complete the entire CTD cast?
3. What was the maximum depth recorded by the CTD?
4. Plot OBS as a function of Depth:a. Select the Depth and OBS columnsb. Under the “Insert” menu select “Chart...” A pop-up menu will appear.c. In the popup menu, click on the “XY (Scatter)” tab.d. Click on the “Smoothed Line Scatter” button. Now you should have a graph that
resembles Figure 1.
Figure1.
16
Image captions/credits on Page 2.
INDEX/SATAL 2010: Tools of Exploration: CTDGrades 9-12 (Earth Science/Physical Science/Technology)
www.oceanexplorer.noaa.gov
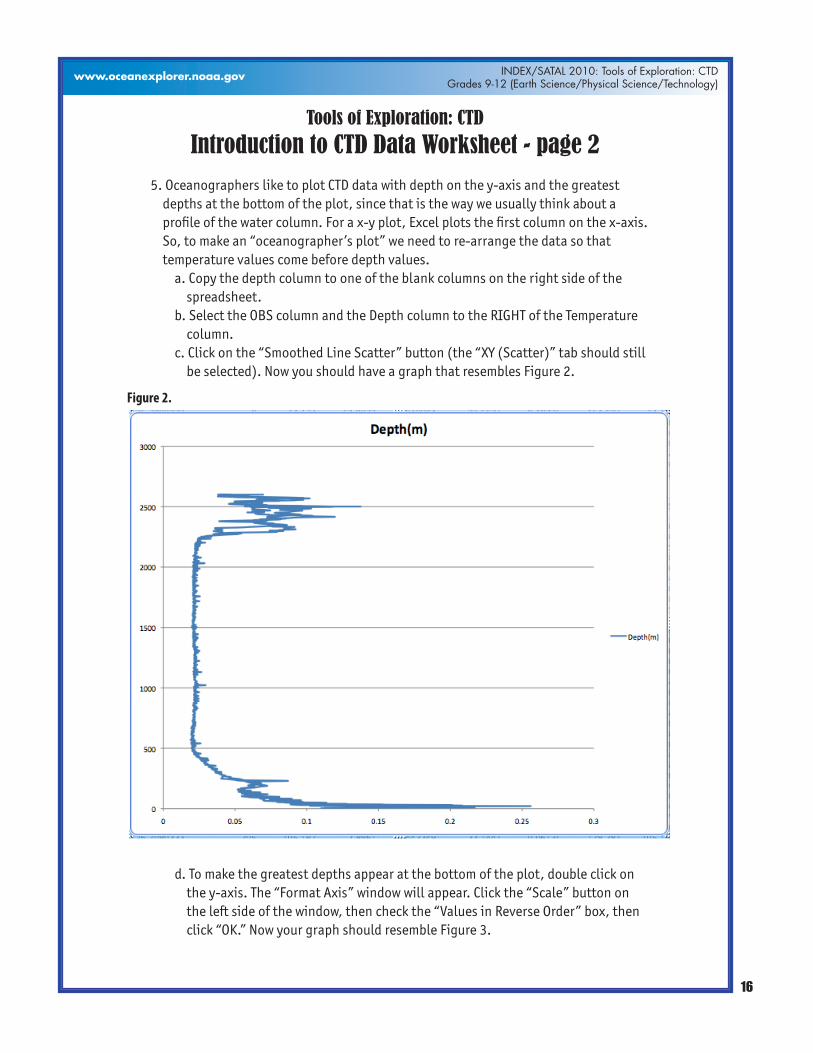
5. Oceanographers like to plot CTD data with depth on the y-axis and the greatest depths at the bottom of the plot, since that is the way we usually think about a profile of the water column. For a x-y plot, Excel plots the first column on the x-axis. So, to make an “oceanographer’s plot” we need to re-arrange the data so that temperature values come before depth values.
a. Copy the depth column to one of the blank columns on the right side of the spreadsheet.
b. Select the OBS column and the Depth column to the RIGHT of the Temperature column.
c. Click on the “Smoothed Line Scatter” button (the “XY (Scatter)” tab should still be selected). Now you should have a graph that resembles Figure 2.
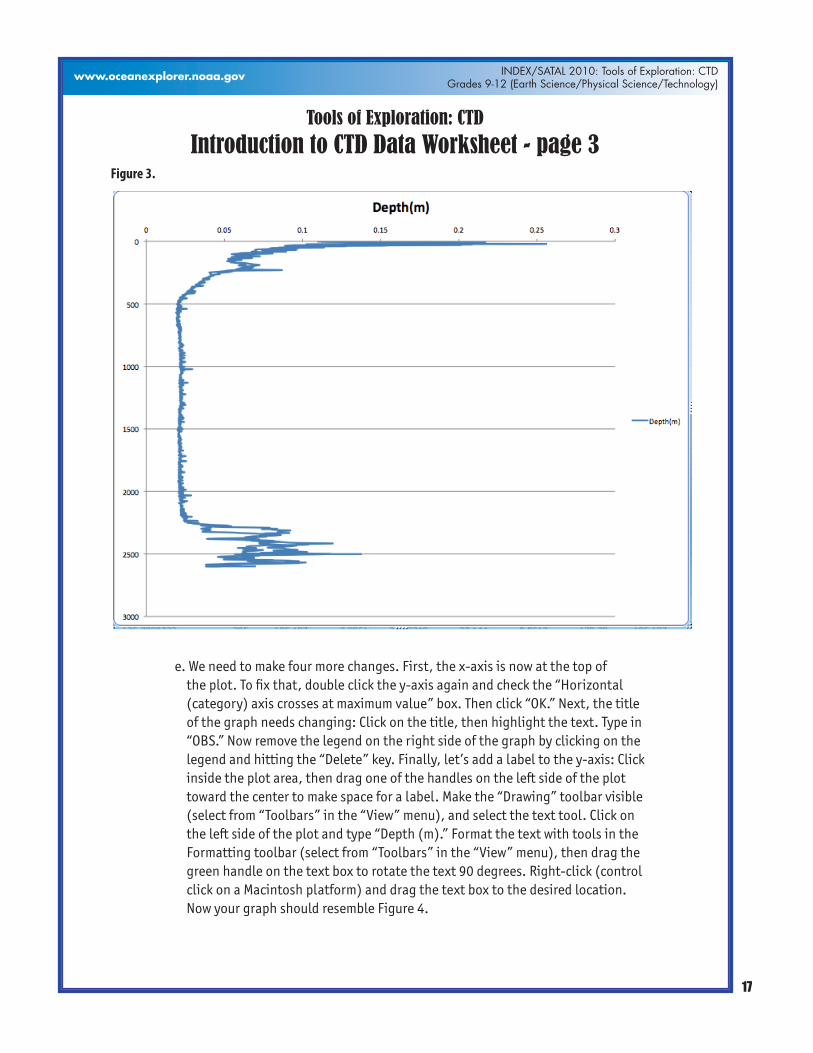
d. To make the greatest depths appear at the bottom of the plot, double click on the y-axis. The “Format Axis” window will appear. Click the “Scale” button on the left side of the window, then check the “Values in Reverse Order” box, then click “OK.” Now your graph should resemble Figure 3.
Tools of Exploration: CTD
Introduction to CTD Data Worksheet - page 2
Figure2.
17
Image captions/credits on Page 2.
INDEX/SATAL 2010: Tools of Exploration: CTDGrades 9-12 (Earth Science/Physical Science/Technology)
www.oceanexplorer.noaa.gov
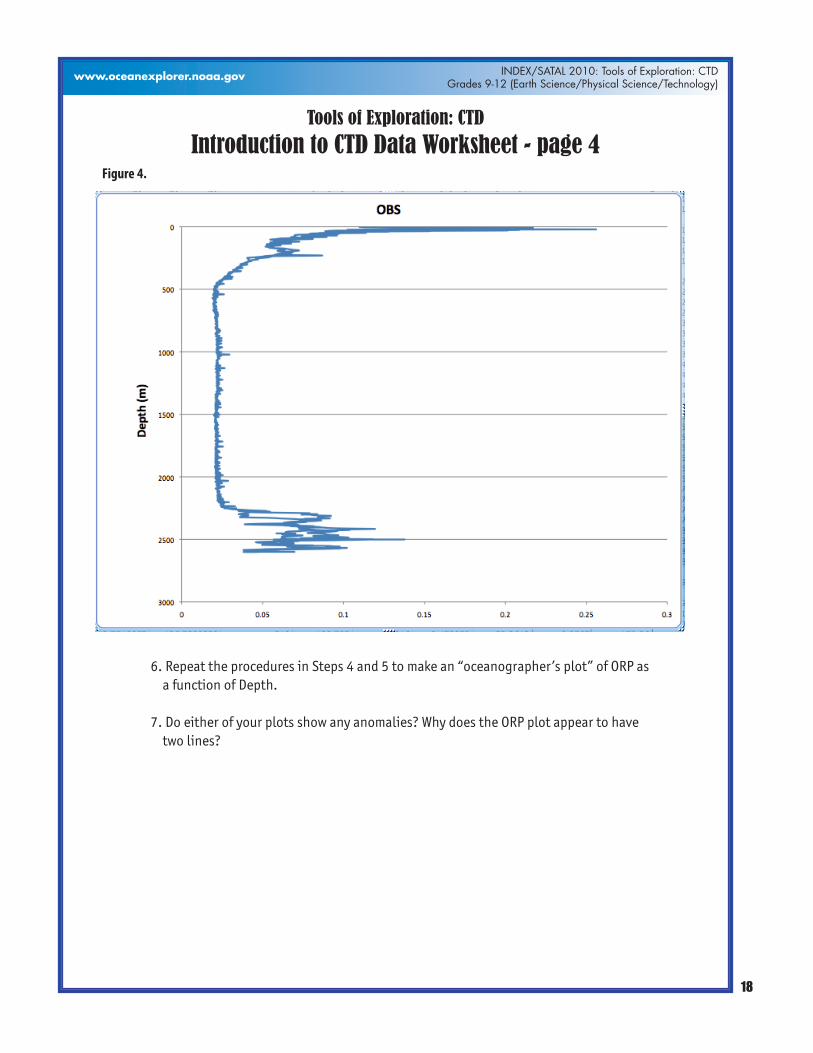
e. We need to make four more changes. First, the x-axis is now at the top of the plot. To fix that, double click the y-axis again and check the “Horizontal (category) axis crosses at maximum value” box. Then click “OK.” Next, the title of the graph needs changing: Click on the title, then highlight the text. Type in “OBS.” Now remove the legend on the right side of the graph by clicking on the legend and hitting the “Delete” key. Finally, let’s add a label to the y-axis: Click inside the plot area, then drag one of the handles on the left side of the plot toward the center to make space for a label. Make the “Drawing” toolbar visible (select from “Toolbars” in the “View” menu), and select the text tool. Click on the left side of the plot and type “Depth (m).” Format the text with tools in the Formatting toolbar (select from “Toolbars” in the “View” menu), then drag the green handle on the text box to rotate the text 90 degrees. Right-click (control click on a Macintosh platform) and drag the text box to the desired location. Now your graph should resemble Figure 4.
Tools of Exploration: CTD
Introduction to CTD Data Worksheet - page 3 Figure3.
18
Image captions/credits on Page 2.
INDEX/SATAL 2010: Tools of Exploration: CTDGrades 9-12 (Earth Science/Physical Science/Technology)
www.oceanexplorer.noaa.gov
6. Repeat the procedures in Steps 4 and 5 to make an “oceanographer’s plot” of ORP as a function of Depth.
7. Do either of your plots show any anomalies? Why does the ORP plot appear to have two lines?
Tools of Exploration: CTD
Introduction to CTD Data Worksheet - page 4 Figure4.