Embed Size (px)
Citation preview
Key skills of BB : Process knowledge, Good observation and correct selection of tools 1
Six Sigma ImplementationTools Application Rules Checklist
20th June2007
Key skills of BB : Process knowledge, Good observation and correct selection of tools 2
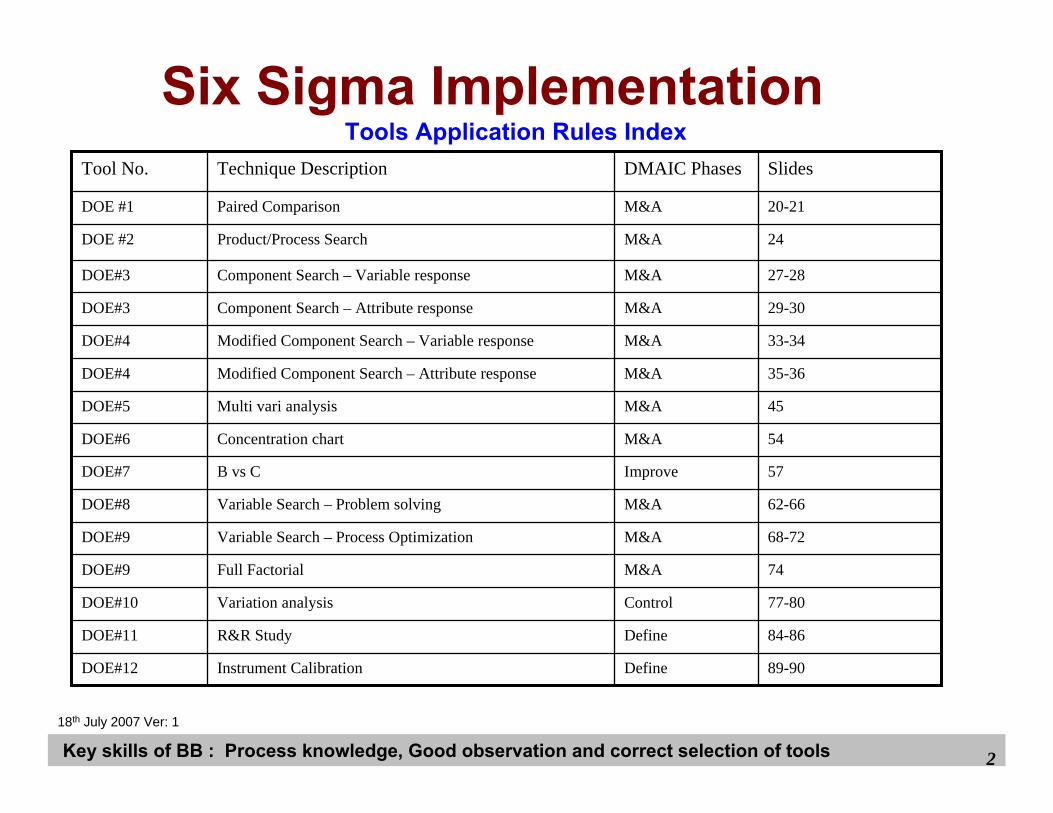
Six Sigma ImplementationTools Application Rules Index
18th July 2007 Ver: 1
68-72M&AVariable Search – Process OptimizationDOE#9
35-36M&AModified Component Search – Attribute responseDOE#4
33-34M&AModified Component Search – Variable responseDOE#4
Define
Define
Control
M&A
M&A
Improve
M&A
M&A
M&A
M&A
M&A
M&A
DMAIC Phases
89-90Instrument CalibrationDOE#12
84-86R&R StudyDOE#11
77-80Variation analysisDOE#10
74Full FactorialDOE#9
62-66Variable Search – Problem solving DOE#8
57B vs CDOE#7
54Concentration chartDOE#6
45Multi vari analysisDOE#5
29-30Component Search – Attribute responseDOE#3
27-28Component Search – Variable responseDOE#3
24Product/Process SearchDOE #2
20-21Paired ComparisonDOE #1
SlidesTechnique DescriptionTool No.

Key skills of BB : Process knowledge, Good observation and correct selection of tools 3
SIX SIGMA
•• 3 Sigma Level3 Sigma Level------------------ Tolerance= 6Tolerance= 6σσ
Defect Rate= 2700ppmDefect Rate= 2700ppm
•• 6 Sigma Level6 Sigma Level------------------ 50% of Tolerance= 650% of Tolerance= 6σσ
Defect Rate= 3ppbDefect Rate= 3ppb
Key skills of BB : Process knowledge, Good observation and correct selection of tools 4
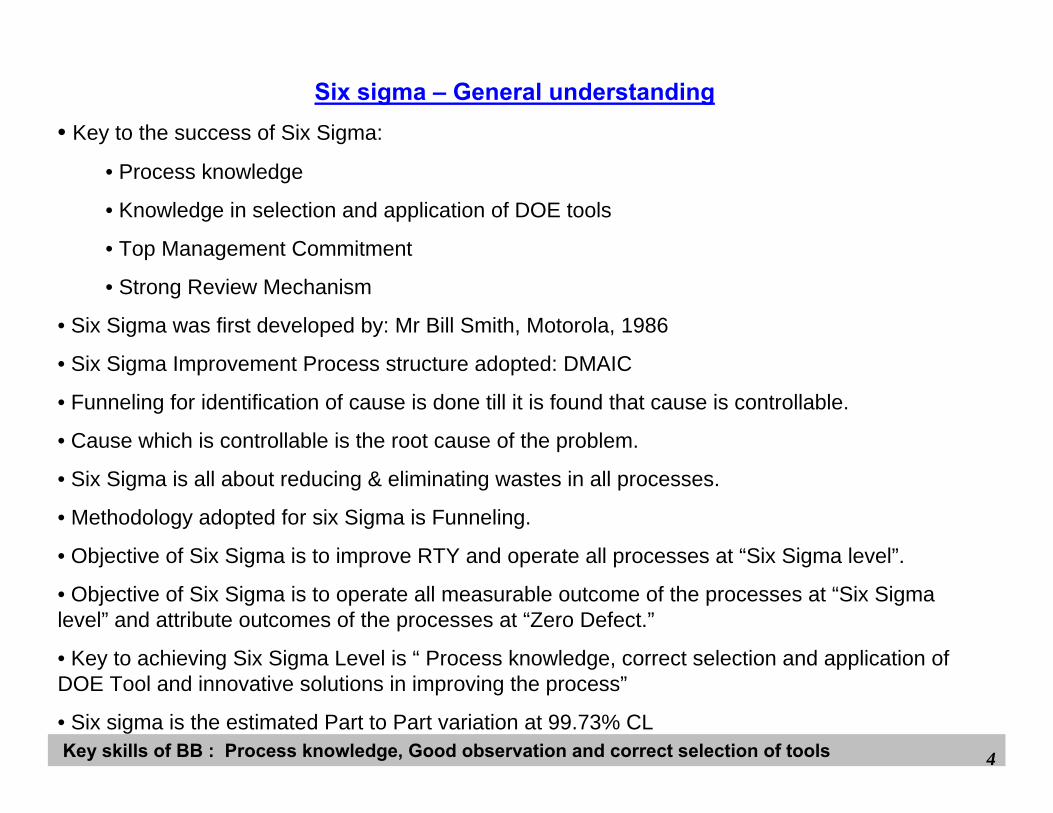
• Key to the success of Six Sigma:
• Process knowledge
• Knowledge in selection and application of DOE tools
• Top Management Commitment
• Strong Review Mechanism
• Six Sigma was first developed by: Mr Bill Smith, Motorola, 1986
• Six Sigma Improvement Process structure adopted: DMAIC
• Funneling for identification of cause is done till it is found that cause is controllable.
• Cause which is controllable is the root cause of the problem.
• Six Sigma is all about reducing & eliminating wastes in all processes.
• Methodology adopted for six Sigma is Funneling.
• Objective of Six Sigma is to improve RTY and operate all processes at “Six Sigma level”.
• Objective of Six Sigma is to operate all measurable outcome of the processes at “Six Sigma level” and attribute outcomes of the processes at “Zero Defect.”
• Key to achieving Six Sigma Level is “ Process knowledge, correct selection and application of DOE Tool and innovative solutions in improving the process”
• Six sigma is the estimated Part to Part variation at 99.73% CL
Six sigma – General understanding
Key skills of BB : Process knowledge, Good observation and correct selection of tools 5
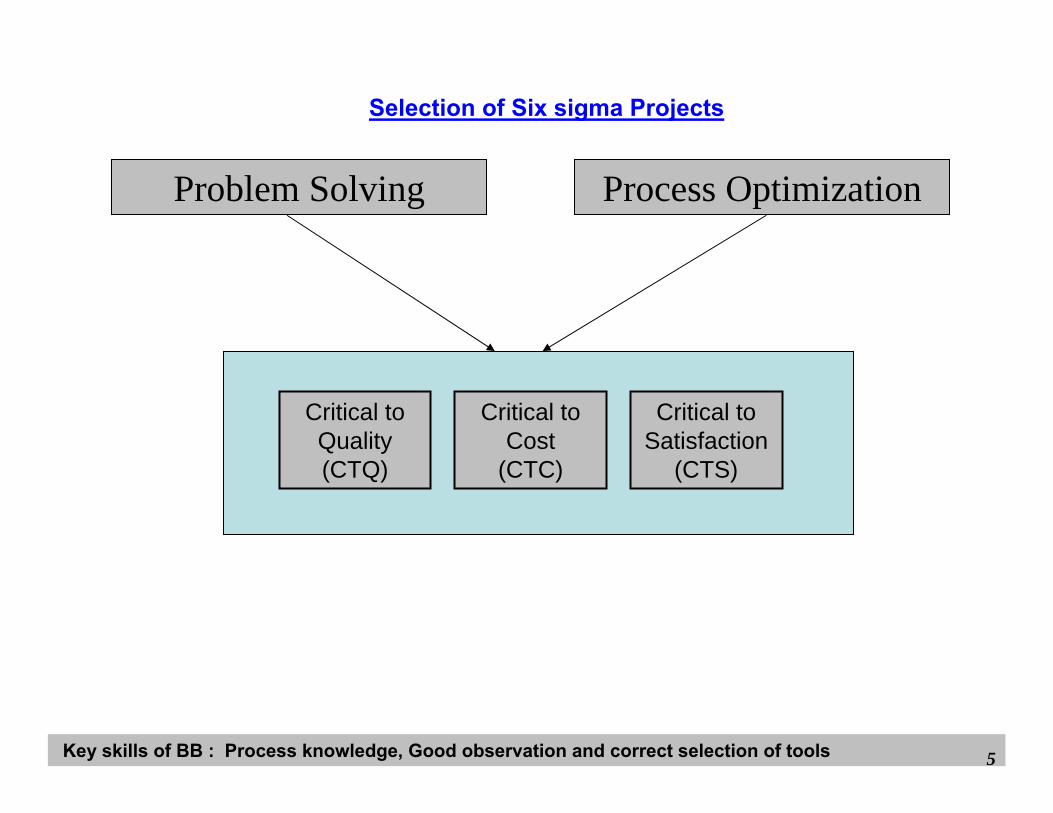
Selection of Six sigma Projects
Problem Solving Process Optimization
Critical to Quality (CTQ)
Critical to Cost
(CTC)
Critical to Satisfaction
(CTS)
Key skills of BB : Process knowledge, Good observation and correct selection of tools 6
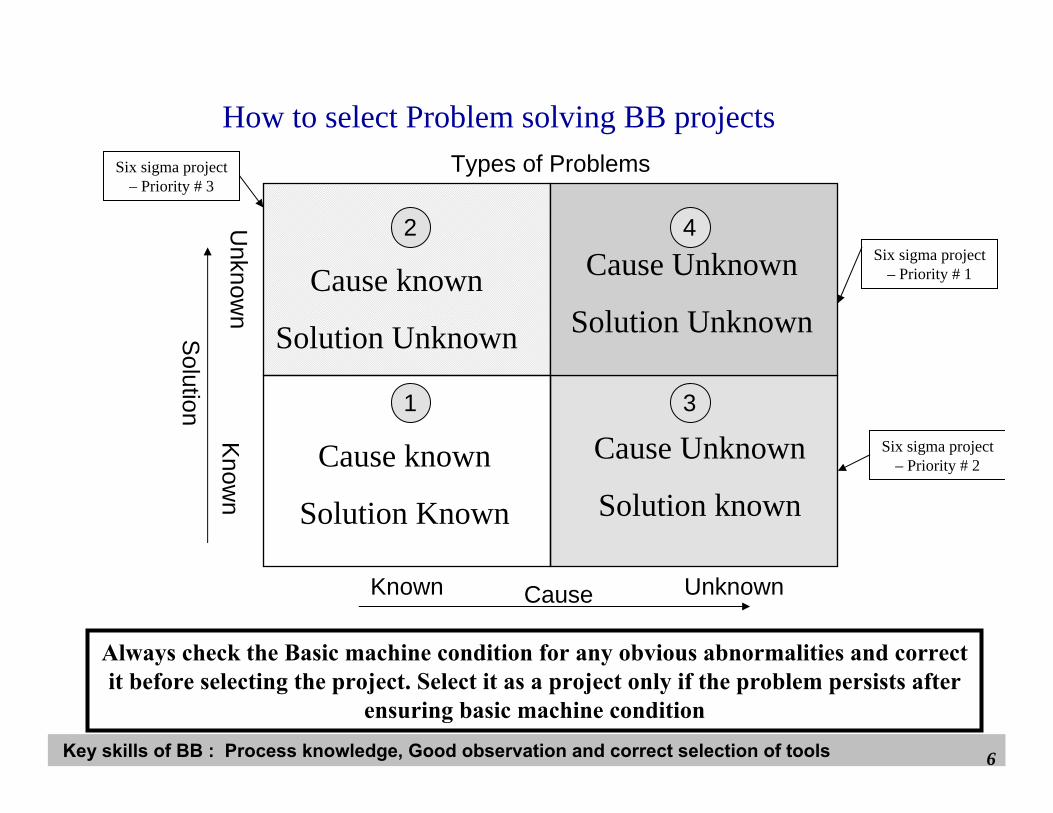
How to select Problem solving BB projects
Cause known
Solution Known
Cause known
Solution Unknown
Cause Unknown
Solution Unknown
Cause Unknown
Solution known
CauseKnown Unknown
Solution
Know
nU
nknown
Six sigma project – Priority # 1
Six sigma project – Priority # 2
1
2 4
3
Types of Problems Six sigma project – Priority # 3
Always check the Basic machine condition for any obvious abnormalities and correct it before selecting the project. Select it as a project only if the problem persists after
ensuring basic machine condition
Key skills of BB : Process knowledge, Good observation and correct selection of tools 7
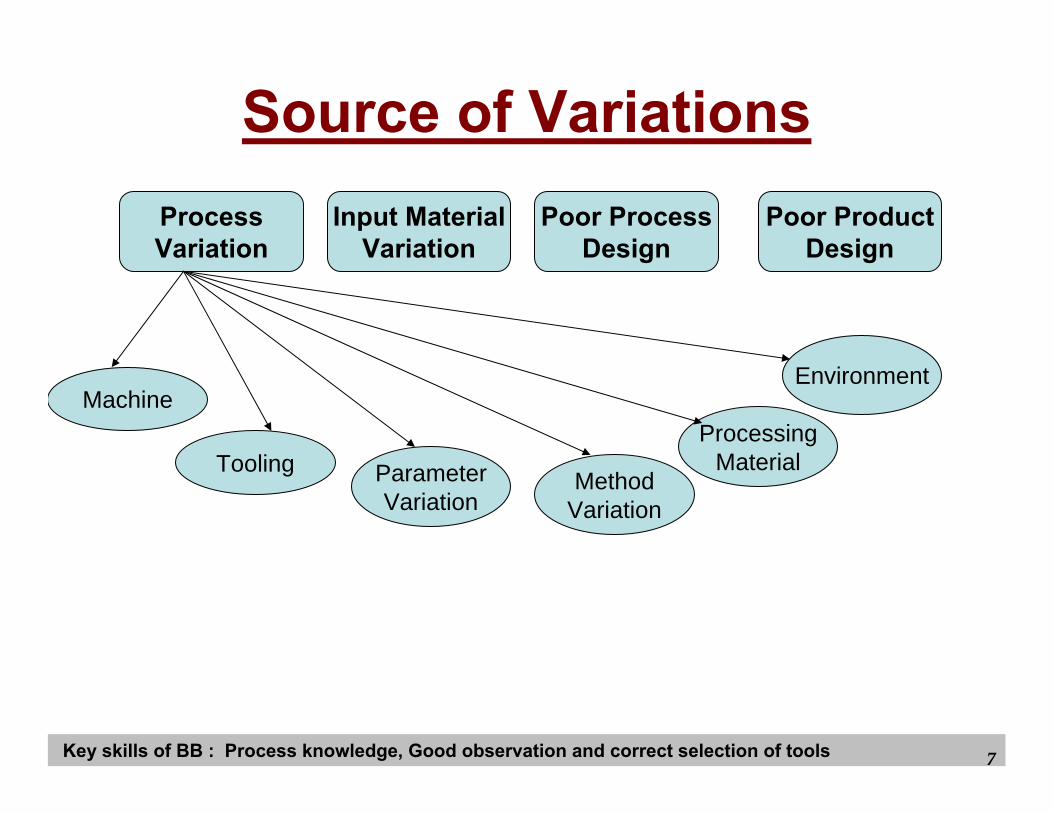
ProcessVariation
Input MaterialVariation
Poor ProcessDesign
Poor ProductDesign
Machine
Tooling ParameterVariation
MethodVariation
ProcessingMaterial
Environment
Source of Variations
Key skills of BB : Process knowledge, Good observation and correct selection of tools 8
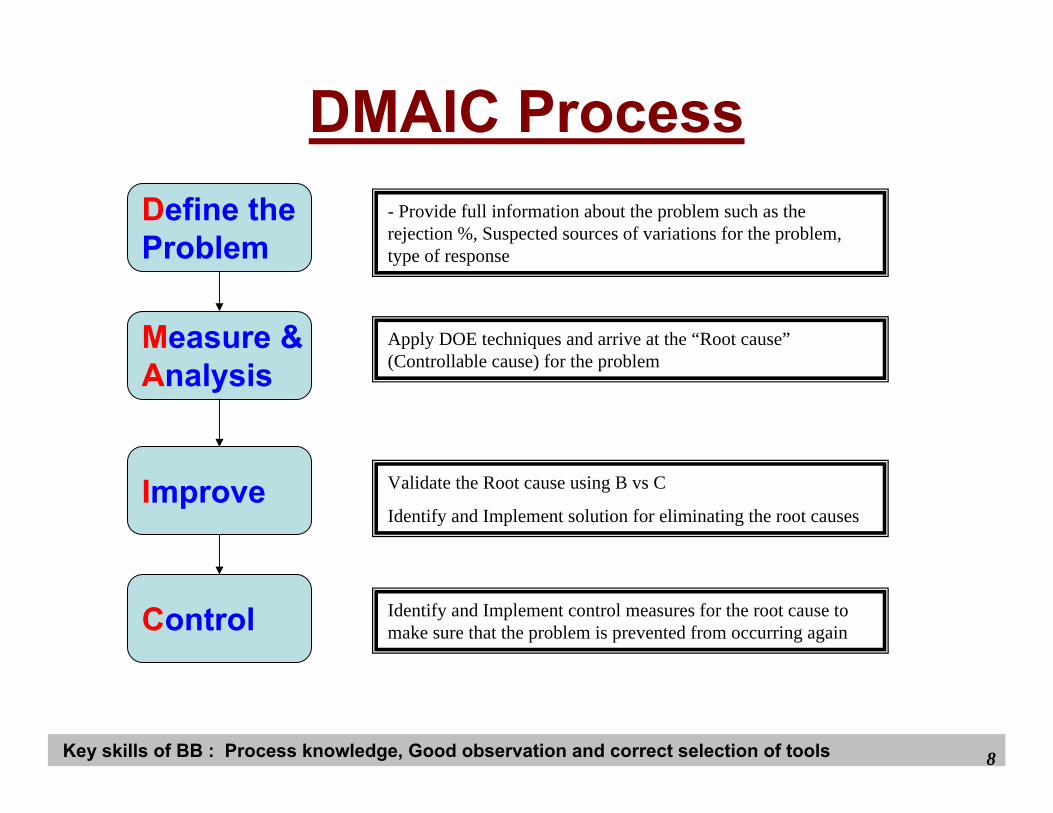
DMAIC ProcessDefine theProblem
Measure &Analysis
Improve
Control
- Provide full information about the problem such as the rejection %, Suspected sources of variations for the problem, type of response
Apply DOE techniques and arrive at the “Root cause”(Controllable cause) for the problem
Validate the Root cause using B vs C
Identify and Implement solution for eliminating the root causes
Identify and Implement control measures for the root cause to make sure that the problem is prevented from occurring again
Key skills of BB : Process knowledge, Good observation and correct selection of tools 9
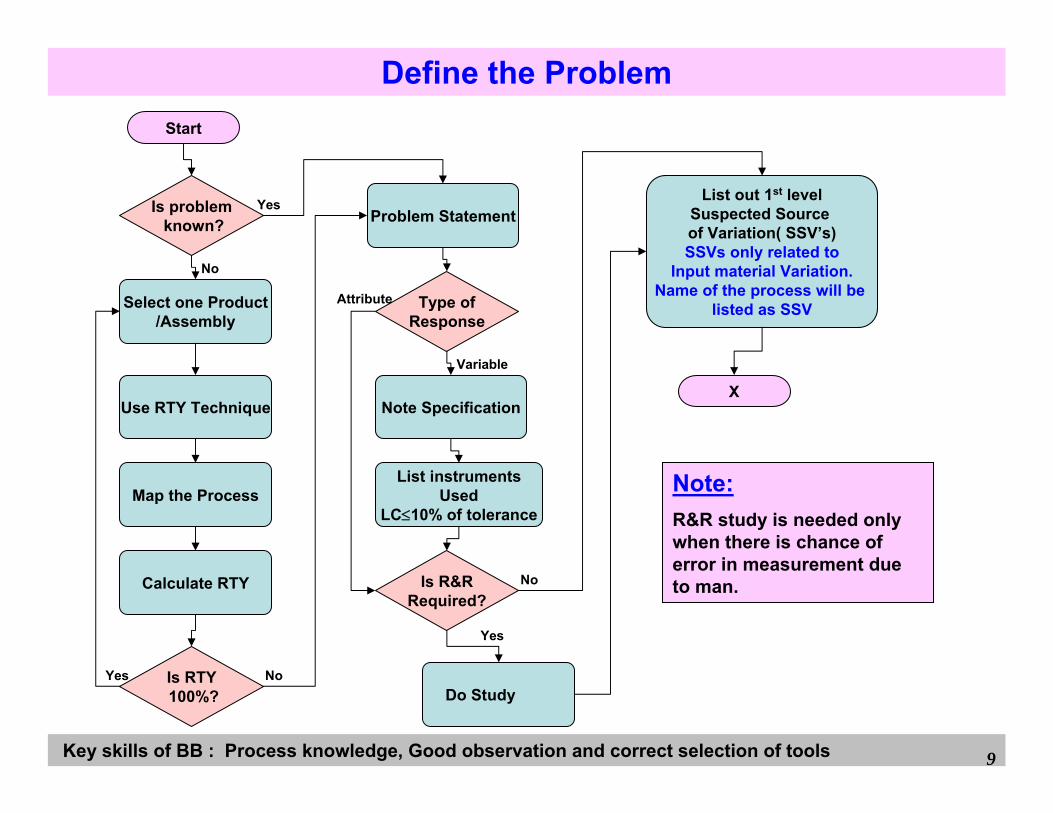
Define the ProblemStart
Is problemknown? Problem Statement
Select one Product/Assembly
Is RTY100%?
Use RTY Technique
Map the Process
Calculate RTY
Type ofResponse
Note Specification
List instrumentsUsed
LC≤10% of tolerance
Is R&RRequired?
Do Study
List out 1st levelSuspected Source of Variation( SSV’s)SSVs only related to
Input material Variation. Name of the process will be
listed as SSV
X
Variable
Attribute
No
No
No
Yes
Yes
Yes
Note:R&R study is needed only when there is chance of error in measurement due to man.
Key skills of BB : Process knowledge, Good observation and correct selection of tools 10
Suspected Source of Variation (SSVs)To start with List down only First Level source of variation
•Last Process in which the response is generated
•Do not brainstorm and list down the detailed sources of variations within the process
•Input Material Parameters which can technically create the problem
Do not list down SSV related to Process and Product design. ( SSV which can not vary during process)
- Some examples are Speed of spindle, Feed Rate, Time, Injection pressure, Limit switch position
Key skills of BB : Process knowledge, Good observation and correct selection of tools 11
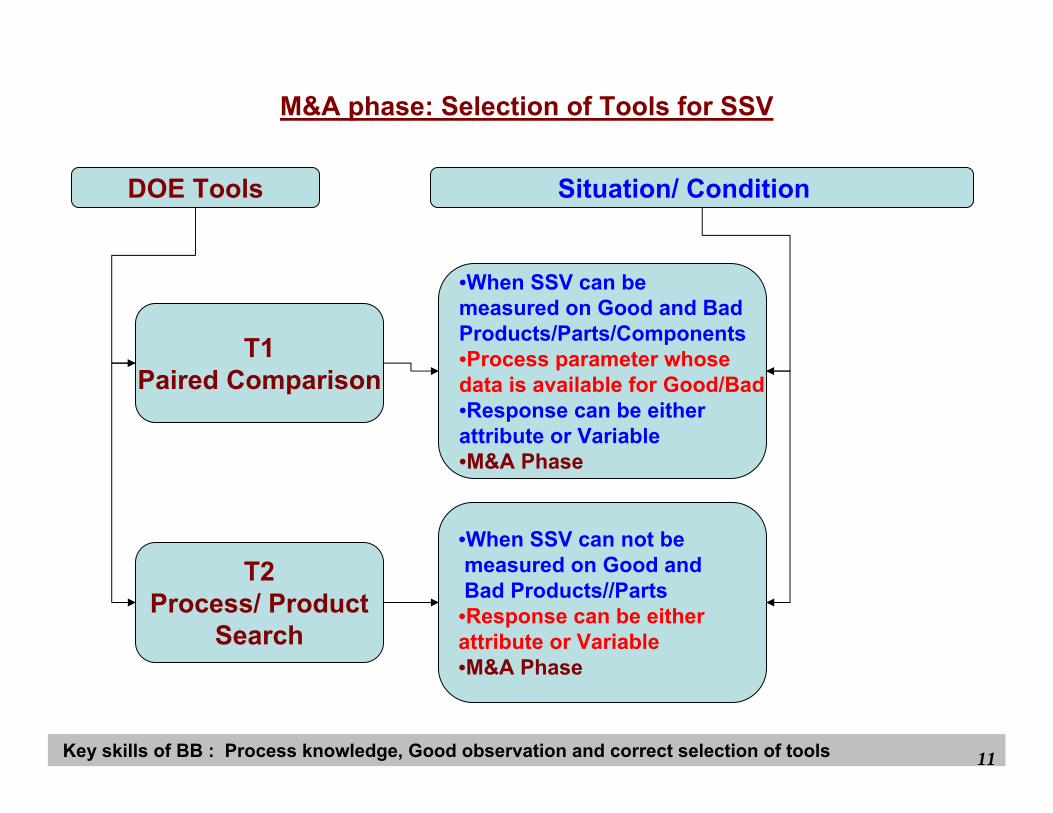
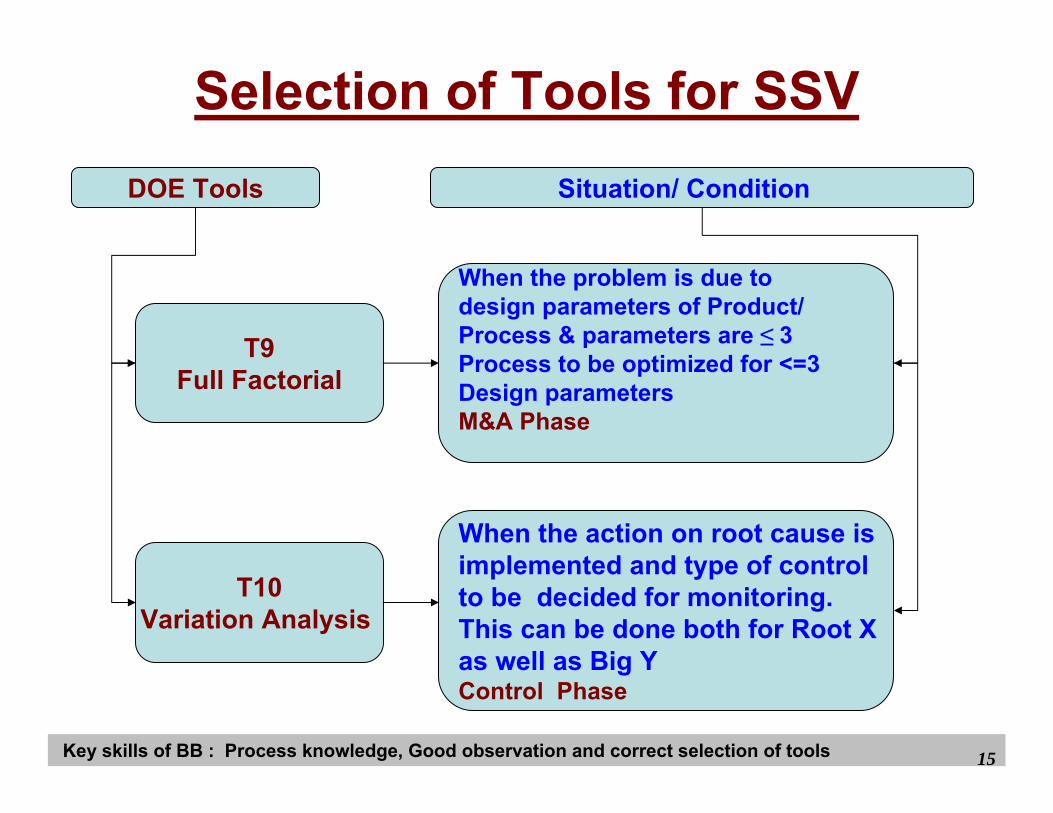
M&A phase: Selection of Tools for SSV
DOE Tools Situation/ Condition
T1Paired Comparison
•When SSV can bemeasured on Good and Bad Products/Parts/Components•Process parameter whosedata is available for Good/Bad•Response can be eitherattribute or Variable•M&A Phase
T2Process/ Product
Search
•When SSV can not bemeasured on Good andBad Products//Parts•Response can be eitherattribute or Variable•M&A Phase
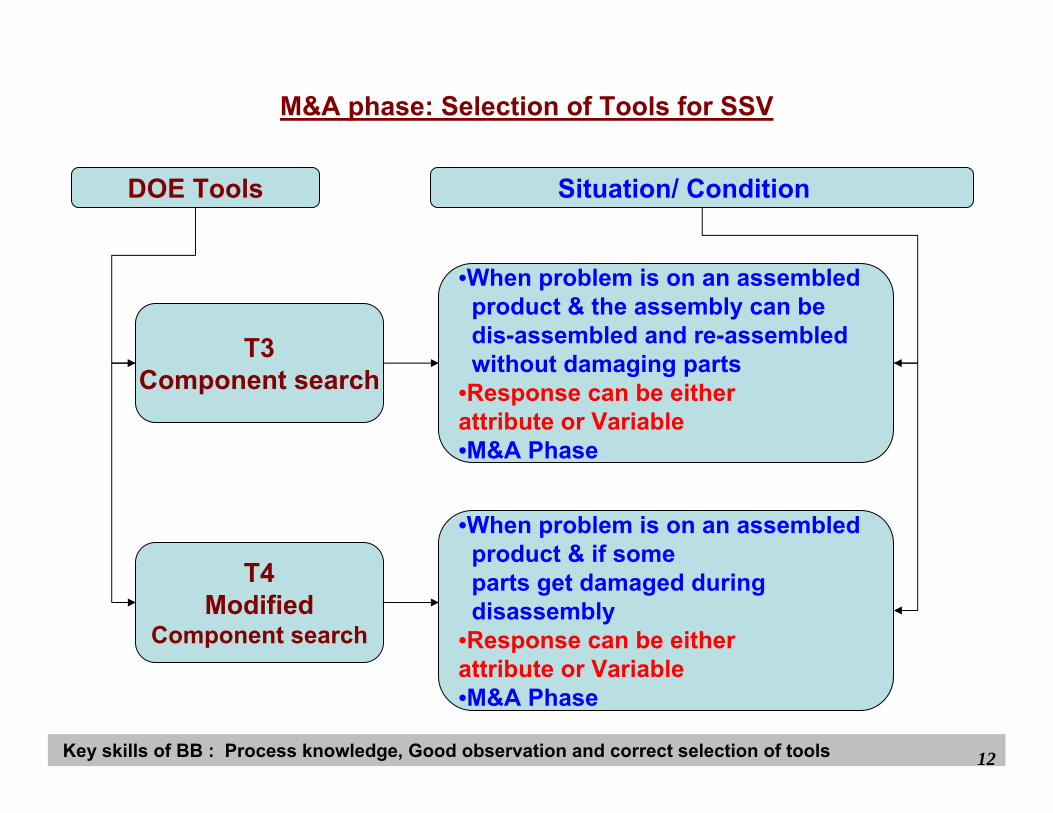
Key skills of BB : Process knowledge, Good observation and correct selection of tools 12
DOE Tools Situation/ Condition
T3Component search
•When problem is on an assembledproduct & the assembly can bedis-assembled and re-assembledwithout damaging parts
•Response can be eitherattribute or Variable•M&A Phase
T4Modified
Component search
•When problem is on an assembledproduct & if some parts get damaged during disassembly
•Response can be eitherattribute or Variable•M&A Phase
M&A phase: Selection of Tools for SSV
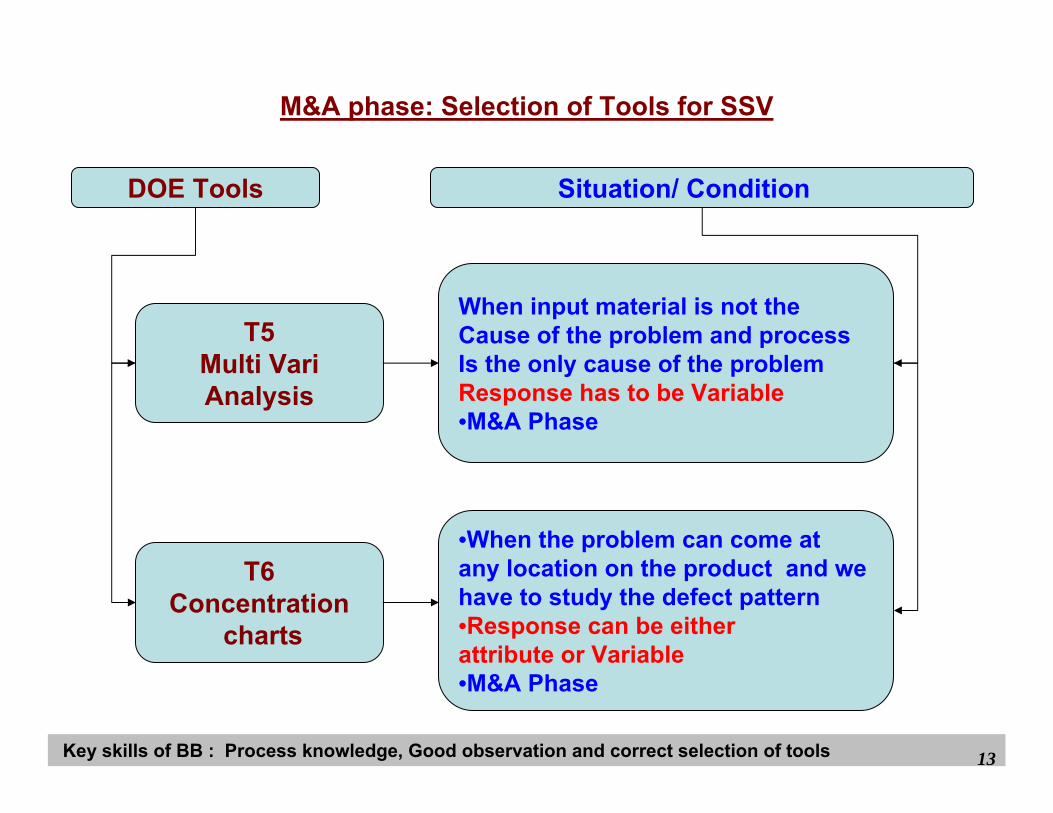
Key skills of BB : Process knowledge, Good observation and correct selection of tools 13
DOE Tools Situation/ Condition
T5Multi VariAnalysis
When input material is not the Cause of the problem and processIs the only cause of the problemResponse has to be Variable•M&A Phase
T6Concentration
charts
•When the problem can come atany location on the product and we have to study the defect pattern•Response can be eitherattribute or Variable•M&A Phase
M&A phase: Selection of Tools for SSV
Key skills of BB : Process knowledge, Good observation and correct selection of tools 14
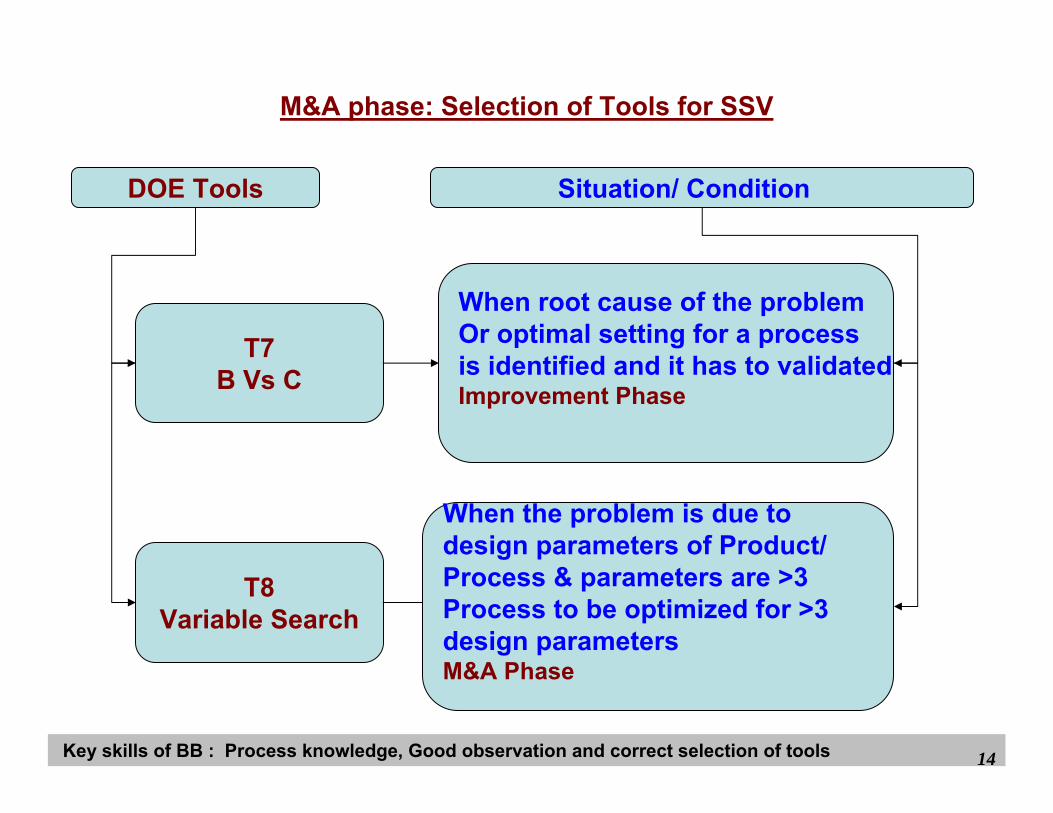
DOE Tools Situation/ Condition
T7B Vs C
When root cause of the problem Or optimal setting for a process is identified and it has to validatedImprovement Phase
T8Variable Search
When the problem is due to design parameters of Product/ Process & parameters are >3Process to be optimized for >3 design parametersM&A Phase
M&A phase: Selection of Tools for SSV
Key skills of BB : Process knowledge, Good observation and correct selection of tools 15
Selection of Tools for SSVDOE Tools Situation/ Condition
T9Full Factorial
When the problem is due to design parameters of Product/ Process & parameters are ≤ 3Process to be optimized for <=3Design parametersM&A Phase
T10Variation Analysis
When the action on root cause is implemented and type of control to be decided for monitoring.This can be done both for Root X as well as Big YControl Phase

Key skills of BB : Process knowledge, Good observation and correct selection of tools 16
Selection of Tools for SSVDOE Tools Situation/ Condition
T11R&R study
When the measurement variation can come due to method of checking and we have to find out the variation due to the personwho is checkingDefine phase
T12Calibration
When the variation can come due to Instrument and we have to find outthe variation of the instrument onlyDefine phase
Key skills of BB : Process knowledge, Good observation and correct selection of tools 17
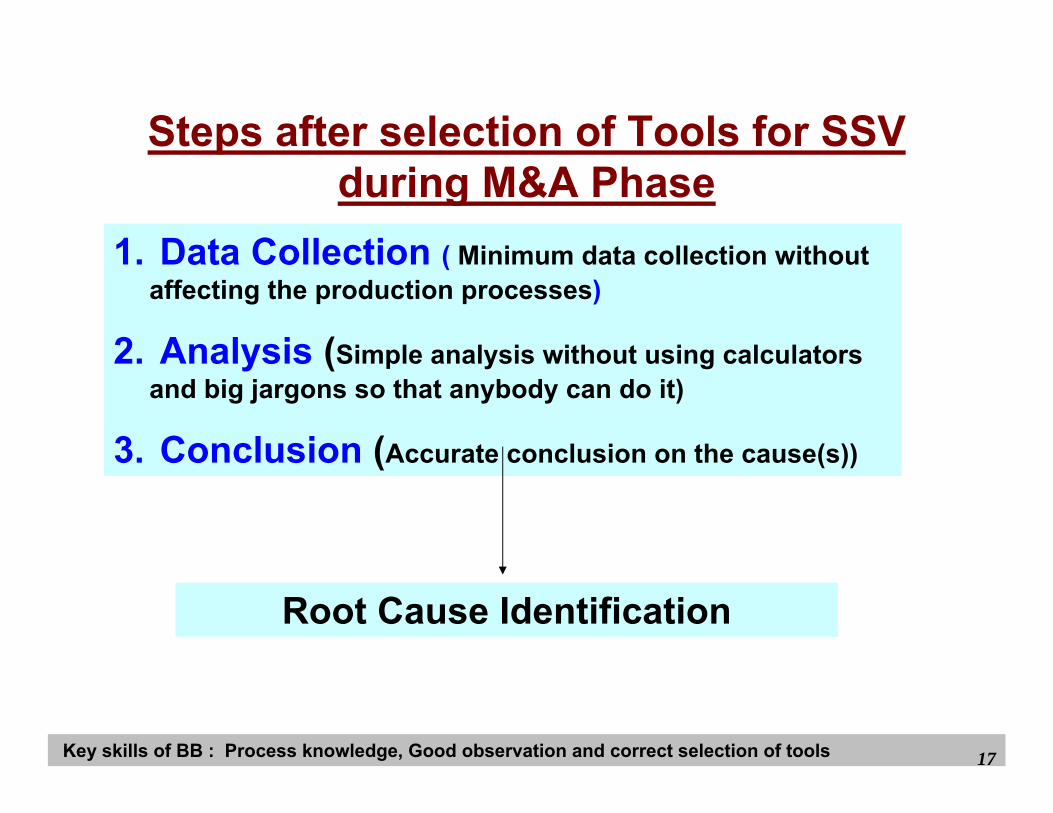
Steps after selection of Tools for SSV during M&A Phase
1. Data Collection ( Minimum data collection without affecting the production processes)
2. Analysis (Simple analysis without using calculators and big jargons so that anybody can do it)
3. Conclusion (Accurate conclusion on the cause(s))
Root Cause Identification

Key skills of BB : Process knowledge, Good observation and correct selection of tools 18
DOE Tool 1
Paired Comparison
Key skills of BB : Process knowledge, Good observation and correct selection of tools 19
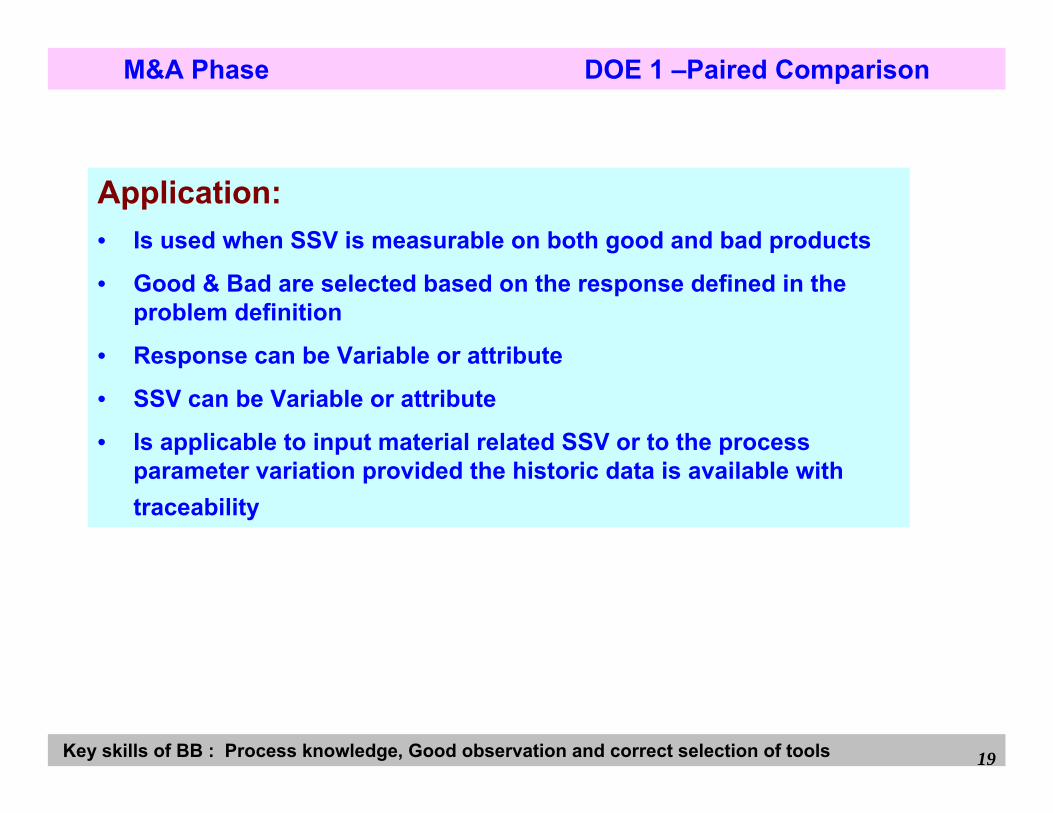
Application:• Is used when SSV is measurable on both good and bad products
• Good & Bad are selected based on the response defined in the problem definition
• Response can be Variable or attribute
• SSV can be Variable or attribute
• Is applicable to input material related SSV or to the process parameter variation provided the historic data is available withtraceability
M&A Phase DOE 1 –Paired Comparison
Key skills of BB : Process knowledge, Good observation and correct selection of tools 20
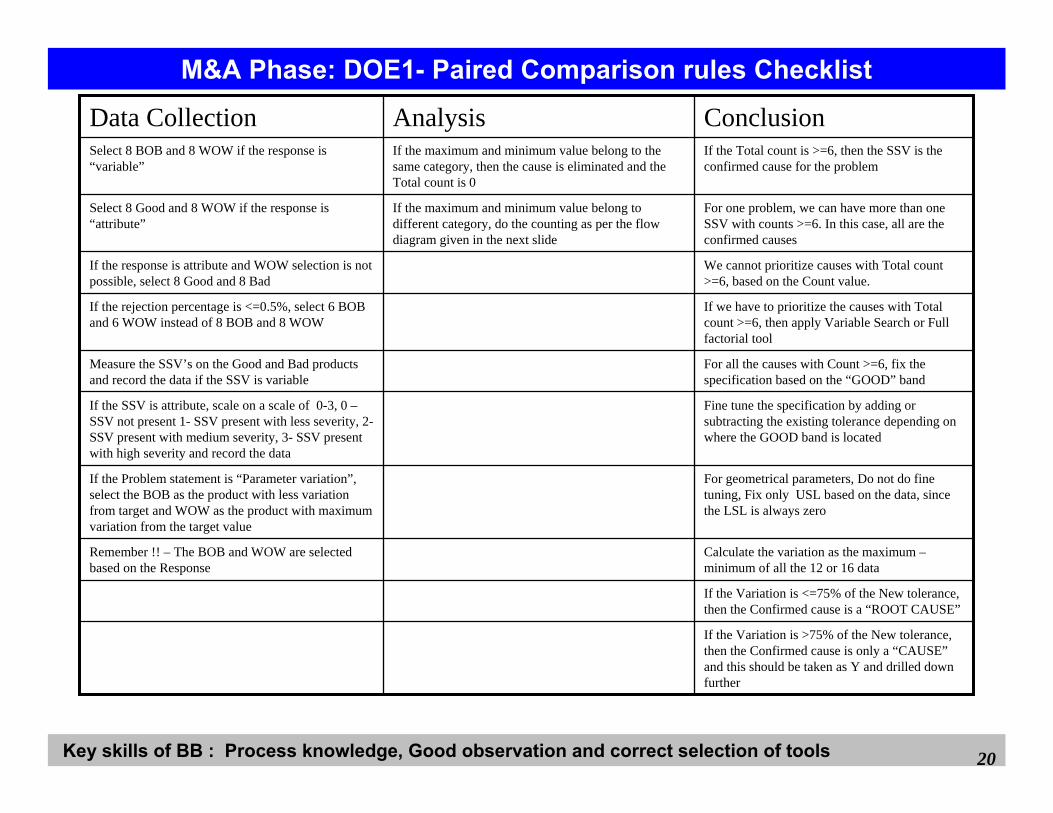
If the Variation is >75% of the New tolerance, then the Confirmed cause is only a “CAUSE”and this should be taken as Y and drilled down further
If the Variation is <=75% of the New tolerance, then the Confirmed cause is a “ROOT CAUSE”
Calculate the variation as the maximum –minimum of all the 12 or 16 data
Remember !! – The BOB and WOW are selected based on the Response
For geometrical parameters, Do not do fine tuning, Fix only USL based on the data, since the LSL is always zero
If the Problem statement is “Parameter variation”, select the BOB as the product with less variation from target and WOW as the product with maximum variation from the target value
Fine tune the specification by adding or subtracting the existing tolerance depending on where the GOOD band is located
If the SSV is attribute, scale on a scale of 0-3, 0 –SSV not present 1- SSV present with less severity, 2-SSV present with medium severity, 3- SSV present with high severity and record the data
For all the causes with Count >=6, fix the specification based on the “GOOD” band
Measure the SSV’s on the Good and Bad products and record the data if the SSV is variable
If we have to prioritize the causes with Total count >=6, then apply Variable Search or Full factorial tool
If the rejection percentage is <=0.5%, select 6 BOB and 6 WOW instead of 8 BOB and 8 WOW
We cannot prioritize causes with Total count >=6, based on the Count value.
If the response is attribute and WOW selection is not possible, select 8 Good and 8 Bad
For one problem, we can have more than one SSV with counts >=6. In this case, all are the confirmed causes
If the maximum and minimum value belong to different category, do the counting as per the flow diagram given in the next slide
Select 8 Good and 8 WOW if the response is “attribute”
If the Total count is >=6, then the SSV is the confirmed cause for the problem
If the maximum and minimum value belong to the same category, then the cause is eliminated and the Total count is 0
Select 8 BOB and 8 WOW if the response is “variable”
ConclusionAnalysisData Collection
M&A Phase: DOE1- Paired Comparison rules Checklist
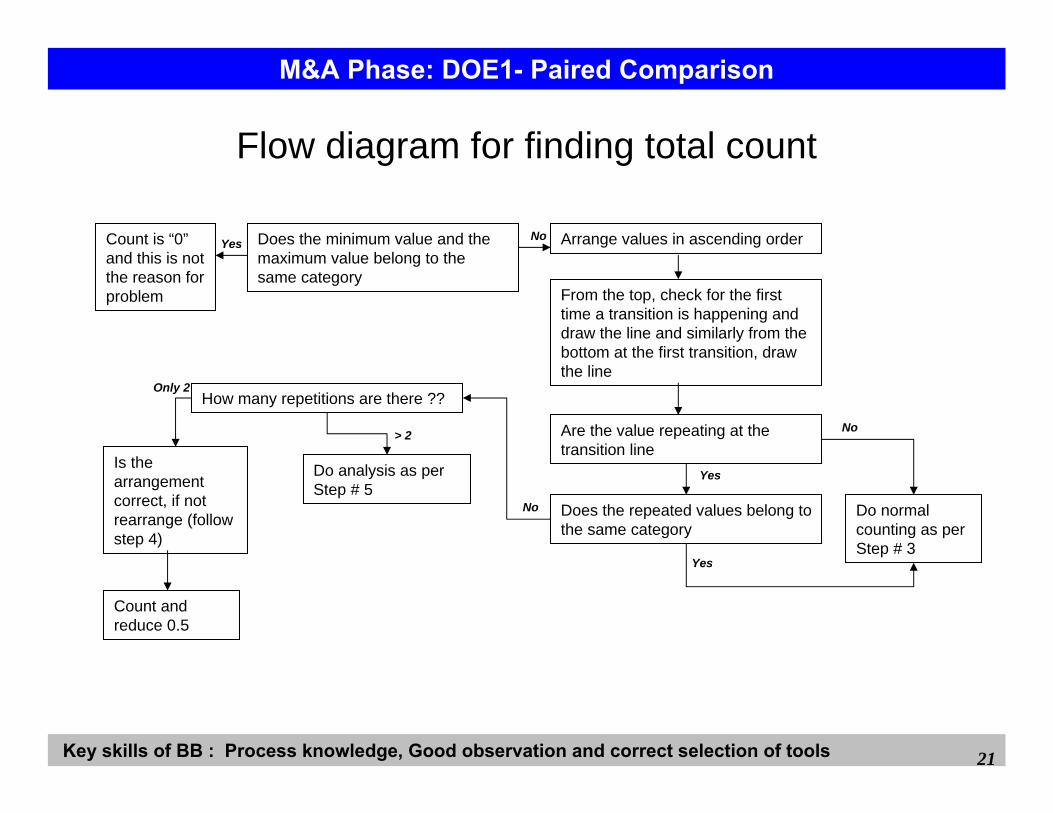
Key skills of BB : Process knowledge, Good observation and correct selection of tools 21
Flow diagram for finding total count
Does the minimum value and the maximum value belong to the same category
Arrange values in ascending order
From the top, check for the first time a transition is happening and draw the line and similarly from the bottom at the first transition, draw the line
Are the value repeating at the transition line
Does the repeated values belong to the same category
How many repetitions are there ??
Is the arrangement correct, if not rearrange (follow step 4)
Count and reduce 0.5
Do analysis as per Step # 5
Count is “0”and this is not the reason for problem
Do normal counting as per Step # 3
NoYes
Yes
Yes
No
No
Only 2
> 2
M&A Phase: DOE1- Paired Comparison
Key skills of BB : Process knowledge, Good observation and correct selection of tools 22
DOE Tool 2
Product/Process Search
Key skills of BB : Process knowledge, Good observation and correct selection of tools 23
Application:• When the sources of variation is not measurable on both
Good and Bad Products/Parts
• SSV related to process parameter or product characteristics that can not be measured on Good and Bad parts.
• Is used when SSV are process/ machine parameters like Temperature, Pressure, pouring time, etc.
• related to input material dimensions, but the dimensions will get changed during processing preventing the application of paired comparison.
• Response can be Variable or attribute. SSV’s can be attribute or variable
M&A Phase DOE 2 –Product/Process Search

Key skills of BB : Process knowledge, Good observation and correct selection of tools 24
If Method #2 data collection is done and 8 or 6 bad are not obtained and the response is attribute, then we have to collect more data till we get 6 or 8 Bad
If Method #2 data collection is done and 8 or 6 bad is not obtained in the lot, then check the following condition if the response is variable-Find out the variation of the entire data-If the variation is >=80% of tolerance, further data collection is not required-If the variation is <80% of tolerance, then collect for one more lot and again check the variation of both the data. Do like this till variation is >=80% of tolerance
Decide the lot size for Method # 2 data collection based on the historic rejection.Eg: if the historic rejection is 8%, decide the lot size as 100 pcs
If any one of the above conditions are not satisfied, then follow Method # 2 data collection
-Rejection % is > 1%-Input material SSV’ s can be checked near the machine-Inspection cycle time of the SSV’s are less than the Process cycle time of one part-Response can be checked/measured near the machine-Response can be checked/measured immediately after the process is completed
Same rules as Paired comparisonSame rules as Paired ComparisonFollow Method # 1 data collection when the following conditions are satisfied
ConclusionAnalysisData Collection
M&A Phase: DOE2- Product/Process search rules checklist
Key skills of BB : Process knowledge, Good observation and correct selection of tools 25
DOE Tool 3
Component Search
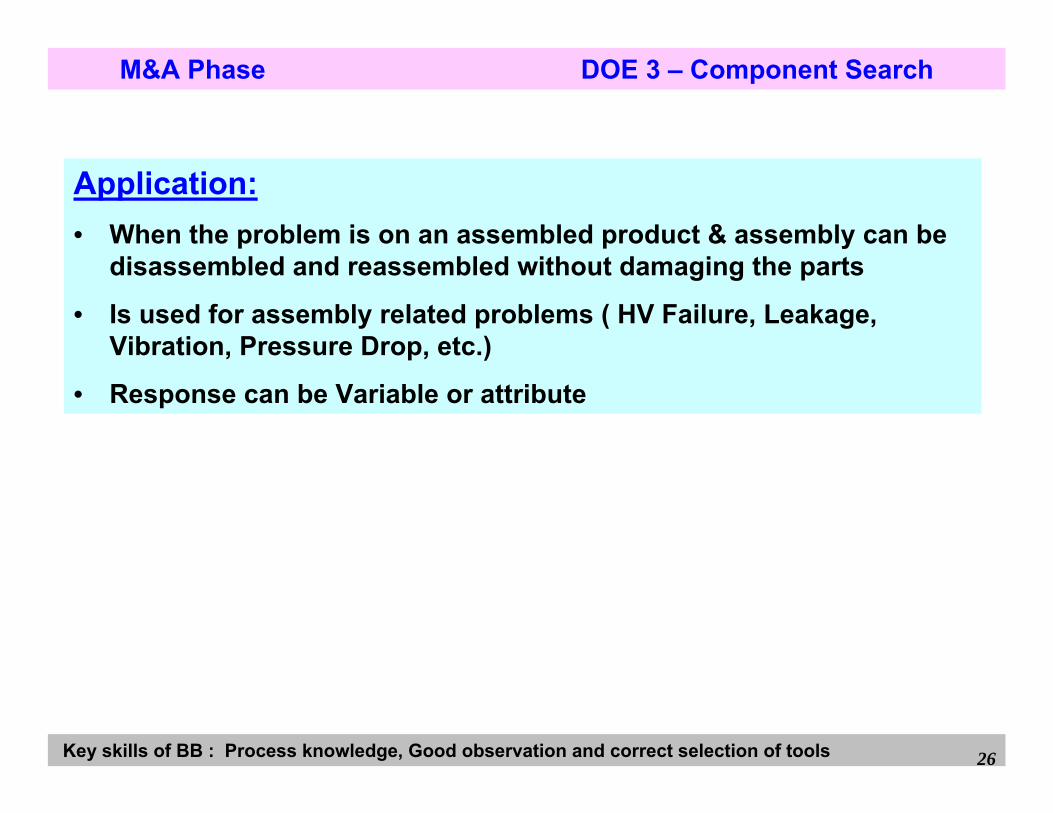
Key skills of BB : Process knowledge, Good observation and correct selection of tools 26
Application:• When the problem is on an assembled product & assembly can be
disassembled and reassembled without damaging the parts
• Is used for assembly related problems ( HV Failure, Leakage, Vibration, Pressure Drop, etc.)
• Response can be Variable or attribute
M&A Phase DOE 3 – Component Search
Key skills of BB : Process knowledge, Good observation and correct selection of tools 27
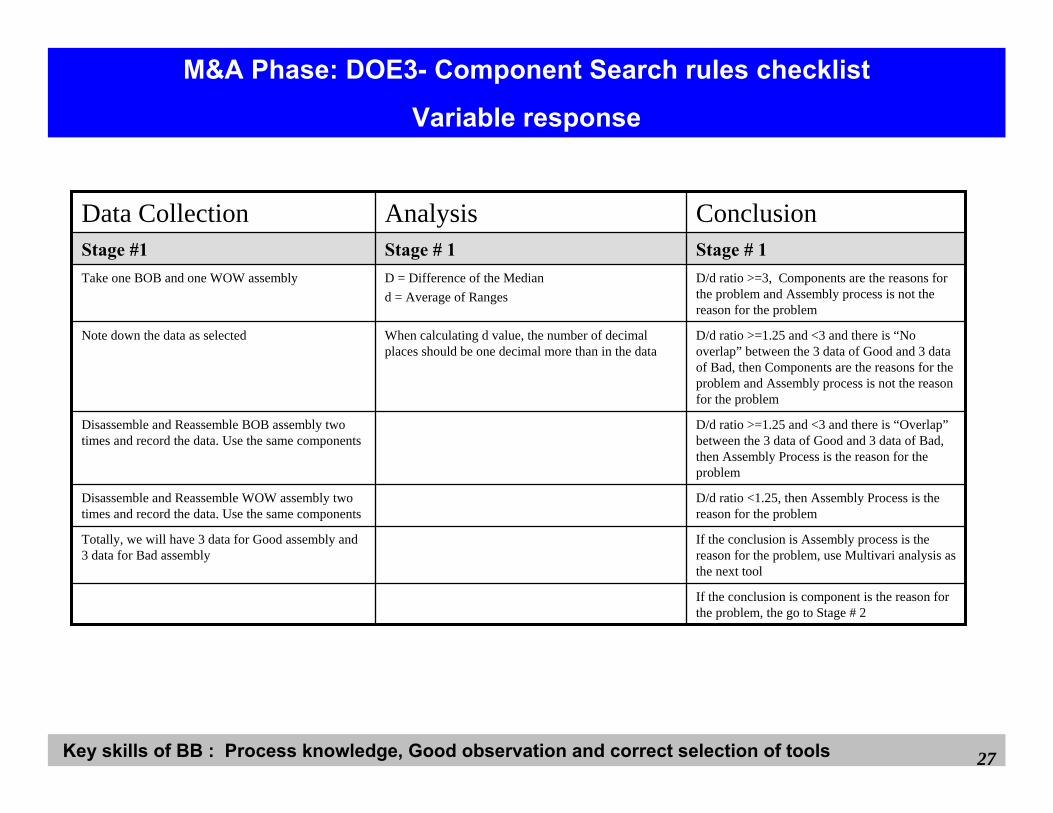
M&A Phase: DOE3- Component Search rules checklist
Variable response
Stage # 1Stage # 1Stage #1
If the conclusion is component is the reason for the problem, the go to Stage # 2
If the conclusion is Assembly process is the reason for the problem, use Multivari analysis as the next tool
Totally, we will have 3 data for Good assembly and 3 data for Bad assembly
D/d ratio <1.25, then Assembly Process is the reason for the problem
Disassemble and Reassemble WOW assembly two times and record the data. Use the same components
D/d ratio >=1.25 and <3 and there is “Overlap”between the 3 data of Good and 3 data of Bad, then Assembly Process is the reason for the problem
Disassemble and Reassemble BOB assembly two times and record the data. Use the same components
D/d ratio >=1.25 and <3 and there is “No overlap” between the 3 data of Good and 3 data of Bad, then Components are the reasons for the problem and Assembly process is not the reason for the problem
When calculating d value, the number of decimal places should be one decimal more than in the data
Note down the data as selected
D/d ratio >=3, Components are the reasons for the problem and Assembly process is not the reason for the problem
D = Difference of the Mediand = Average of Ranges
Take one BOB and one WOW assembly
ConclusionAnalysisData Collection
Key skills of BB : Process knowledge, Good observation and correct selection of tools 28
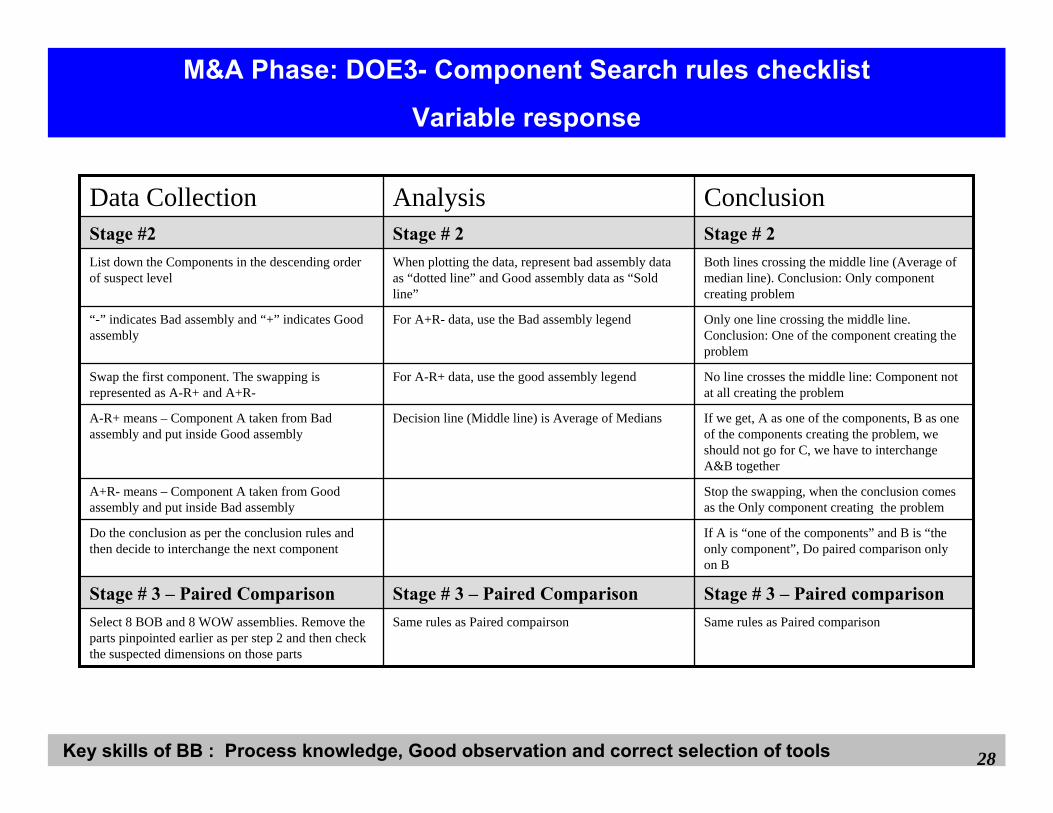
M&A Phase: DOE3- Component Search rules checklist
Variable response
Same rules as Paired comparisonSame rules as Paired compairsonSelect 8 BOB and 8 WOW assemblies. Remove the parts pinpointed earlier as per step 2 and then check the suspected dimensions on those parts
Only one line crossing the middle line. Conclusion: One of the component creating the problem
For A+R- data, use the Bad assembly legend“-” indicates Bad assembly and “+” indicates Good assembly
Stage # 2Stage # 2Stage #2
Stage # 3 – Paired comparisonStage # 3 – Paired ComparisonStage # 3 – Paired Comparison
If A is “one of the components” and B is “the only component”, Do paired comparison only on B
Do the conclusion as per the conclusion rules and then decide to interchange the next component
Stop the swapping, when the conclusion comes as the Only component creating the problem
A+R- means – Component A taken from Good assembly and put inside Bad assembly
If we get, A as one of the components, B as one of the components creating the problem, we should not go for C, we have to interchange A&B together
Decision line (Middle line) is Average of MediansA-R+ means – Component A taken from Bad assembly and put inside Good assembly
No line crosses the middle line: Component not at all creating the problem
For A-R+ data, use the good assembly legendSwap the first component. The swapping is represented as A-R+ and A+R-
Both lines crossing the middle line (Average of median line). Conclusion: Only component creating problem
When plotting the data, represent bad assembly data as “dotted line” and Good assembly data as “Sold line”
List down the Components in the descending order of suspect level
ConclusionAnalysisData Collection
Key skills of BB : Process knowledge, Good observation and correct selection of tools 29
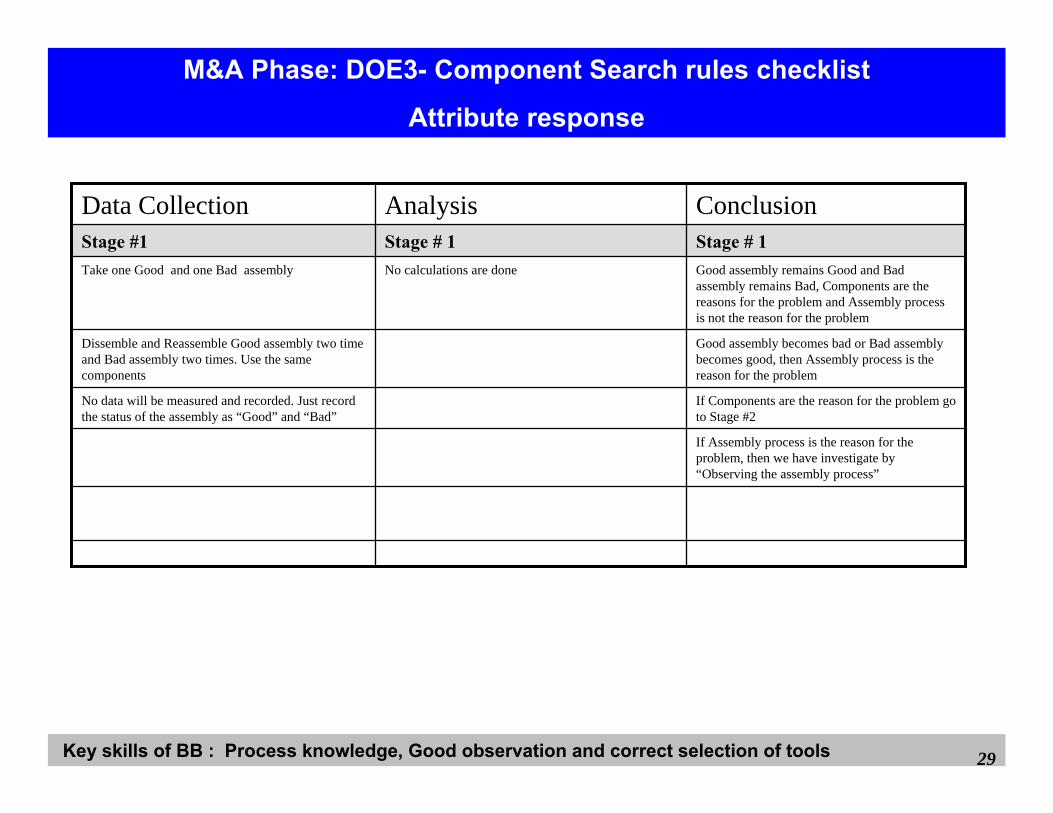
M&A Phase: DOE3- Component Search rules checklist
Attribute response
Stage # 1Stage # 1Stage #1
If Assembly process is the reason for the problem, then we have investigate by “Observing the assembly process”
If Components are the reason for the problem go to Stage #2
No data will be measured and recorded. Just record the status of the assembly as “Good” and “Bad”
Good assembly becomes bad or Bad assembly becomes good, then Assembly process is the reason for the problem
Dissemble and Reassemble Good assembly two time and Bad assembly two times. Use the same components
Good assembly remains Good and Bad assembly remains Bad, Components are the reasons for the problem and Assembly process is not the reason for the problem
No calculations are doneTake one Good and one Bad assembly
ConclusionAnalysisData Collection
Key skills of BB : Process knowledge, Good observation and correct selection of tools 30
M&A Phase: DOE3- Component Search rules checklist
Attribute response
Same rules as Paired comparisonSame rules as Paired compairsonSelect 8 Good and 8 Bad assemblies. Remove the parts pinpointed earlier as per step 2 and then check the suspected dimensions on those parts
If Good assembly remains Good and Bad assembly remains Bad, then the Component interchanged is “Not at all” the reason for the problem
“-” indicates Bad assembly and “+” indicates Good assembly
Stage # 2Stage # 2Stage #2
If A is “one of the components” and B is “the only component”, Do paired comparison only on B
Stage # 3 – Paired ComparisonStage # 3 – Paired Comparison
Stop the swapping, when the conclusion comes as the Only component creating the problem
Do the conclusion as per the conclusion rules and then decide to interchange the next component
If we get, A as one of the components, B as one of the components creating the problem, we should not go for C, we have to interchange A&B together
A+R- means – Component A taken from Good assembly and put inside Bad assembly
If Good assembly remains Good and Bad assembly becomes Good, then the Component interchanged is “One of the component”creating the problem
A-R+ means – Component A taken from Bad assembly and put inside Good assembly
If Good assembly becomes Bad and Bad assembly remains Bad, then the Component interchanged is “One of the component”creating the problem
Swap the first component. The swapping is represented as A-R+ and A+R-
If Good assembly becomes Bad assembly, and Bad assembly becomes Good assembly, then Component interchanged is the “Only reason”for the problem
No graph is plotted as in the variable responseList down the Components in the descending order of suspect level
ConclusionAnalysisData Collection
Key skills of BB : Process knowledge, Good observation and correct selection of tools 31
DOE Tool 4
Modified Component Search
Key skills of BB : Process knowledge, Good observation and correct selection of tools 32
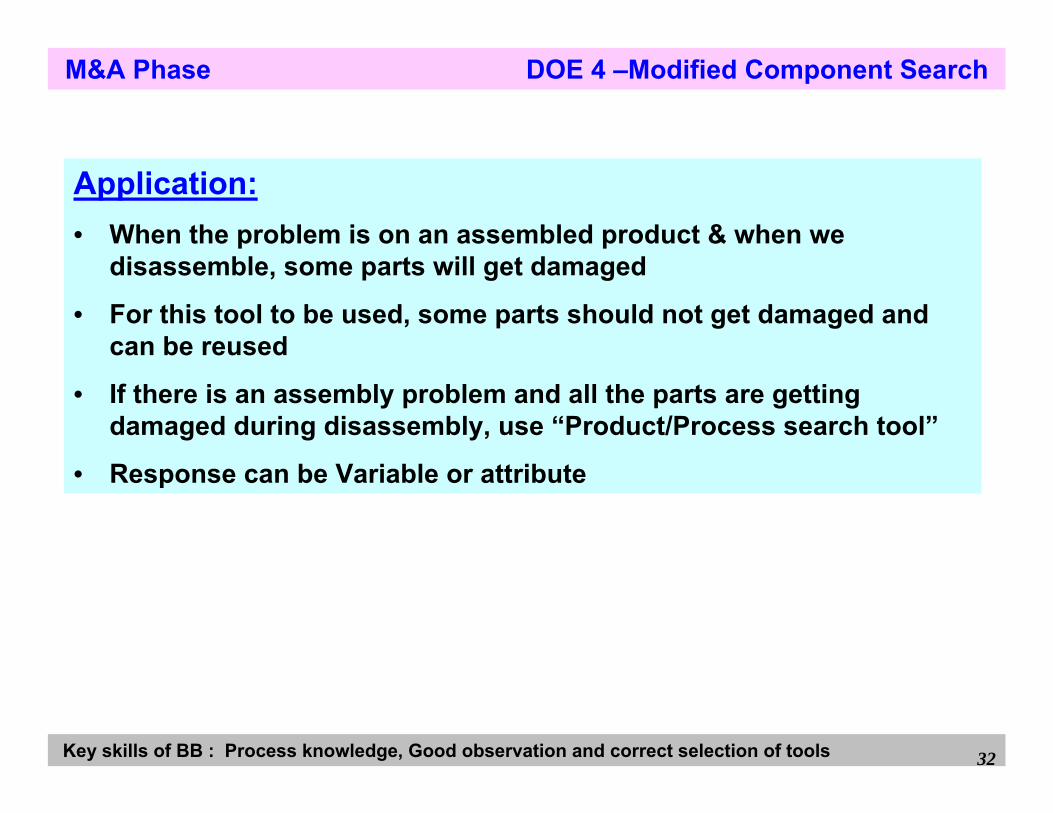
M&A Phase DOE 4 –Modified Component Search
Application:• When the problem is on an assembled product & when we
disassemble, some parts will get damaged
• For this tool to be used, some parts should not get damaged and can be reused
• If there is an assembly problem and all the parts are getting damaged during disassembly, use “Product/Process search tool”
• Response can be Variable or attribute
Key skills of BB : Process knowledge, Good observation and correct selection of tools 33
M&A Phase: DOE4- Modified Component Search rules checklist
Variable response
After doing Product/Process search, if all the dimensions of the replaced parts are eliminated, then do “Multivari analysis” on the Assembly process
Stage # 1Stage # 1Stage #1
If the conclusion is Assembly process and the replaced parts are not the reasons, then go to Stage # 2
If the conclusion is Assembly process or the replaced parts are the reason for the problem, use “Product/Process search” tool to investigate the replaced parts dimensions.
Totally, we will have 3 data for Good assembly and 3 data for Bad assembly
D/d ratio <1.25, then Assembly Process or the replaced parts are the reason for the problem
Disassemble and Reassemble WOW assembly two times. Replace the parts that are getting damaged with new parts and record the response.
D/d ratio >=1.25 and <3 and there is “Overlap”between the 3 data of Good and 3 data of Bad, then Assembly process “or” the replaced parts are the reasons for the problem
Disassemble and Reassemble BOB assembly two times. Replace the parts that are getting damaged with new parts and record the response.
D/d ratio >=1.25 and <3 and there is “No overlap” between the 3 data of Good and 3 data of Bad, Assembly process and replaced parts are not the reasons. The components that are not getting damaged are the reasons for the problem
When calculating d value, the number of decimal places should be one decimal more than in the data
Note down the data as selected
D/d ratio >=3, Assembly process and replaced parts are not the reasons. The components that are not getting damaged are the reasons for the problem
D = Difference of the Mediand = Average of Ranges
Take one BOB and one WOW assembly
ConclusionAnalysisData Collection
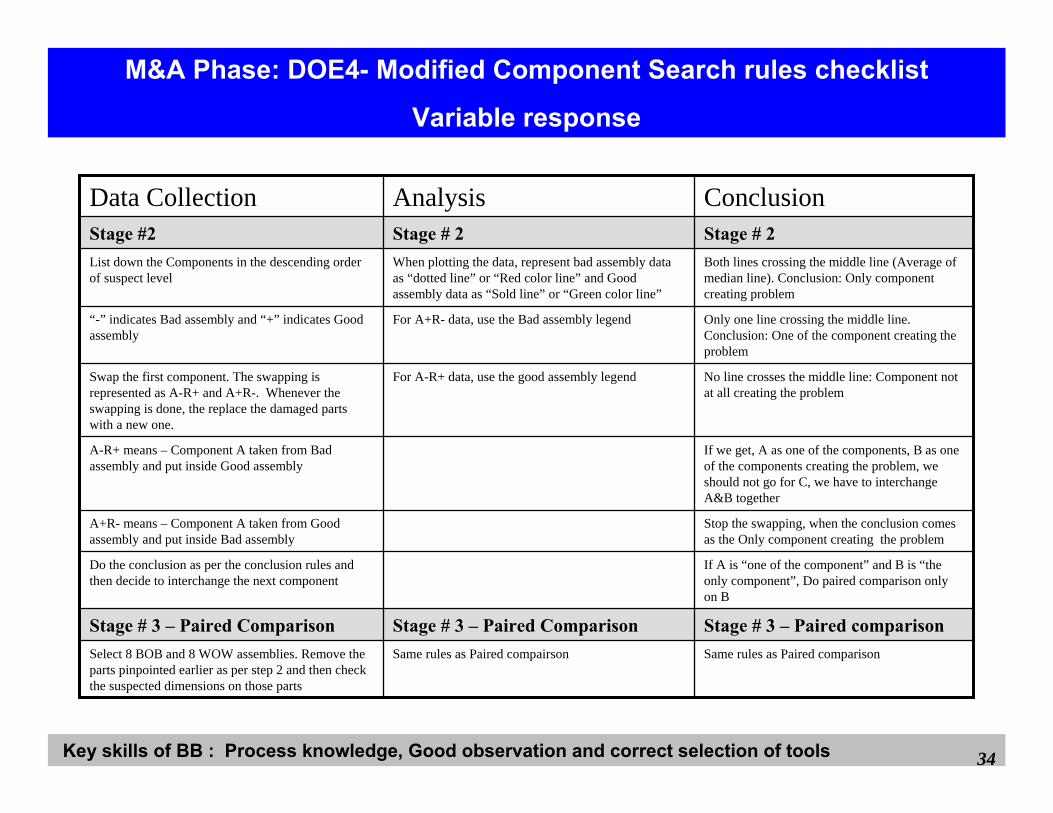
Key skills of BB : Process knowledge, Good observation and correct selection of tools 34
M&A Phase: DOE4- Modified Component Search rules checklist
Variable response
Same rules as Paired comparisonSame rules as Paired compairsonSelect 8 BOB and 8 WOW assemblies. Remove the parts pinpointed earlier as per step 2 and then check the suspected dimensions on those parts
Only one line crossing the middle line. Conclusion: One of the component creating the problem
For A+R- data, use the Bad assembly legend“-” indicates Bad assembly and “+” indicates Good assembly
Stage # 2Stage # 2Stage #2
Stage # 3 – Paired comparisonStage # 3 – Paired ComparisonStage # 3 – Paired Comparison
If A is “one of the component” and B is “the only component”, Do paired comparison only on B
Do the conclusion as per the conclusion rules and then decide to interchange the next component
Stop the swapping, when the conclusion comes as the Only component creating the problem
A+R- means – Component A taken from Good assembly and put inside Bad assembly
If we get, A as one of the components, B as one of the components creating the problem, we should not go for C, we have to interchange A&B together
A-R+ means – Component A taken from Bad assembly and put inside Good assembly
No line crosses the middle line: Component not at all creating the problem
For A-R+ data, use the good assembly legendSwap the first component. The swapping is represented as A-R+ and A+R-. Whenever the swapping is done, the replace the damaged parts with a new one.
Both lines crossing the middle line (Average of median line). Conclusion: Only component creating problem
When plotting the data, represent bad assembly data as “dotted line” or “Red color line” and Good assembly data as “Sold line” or “Green color line”
List down the Components in the descending order of suspect level
ConclusionAnalysisData Collection
Key skills of BB : Process knowledge, Good observation and correct selection of tools 35
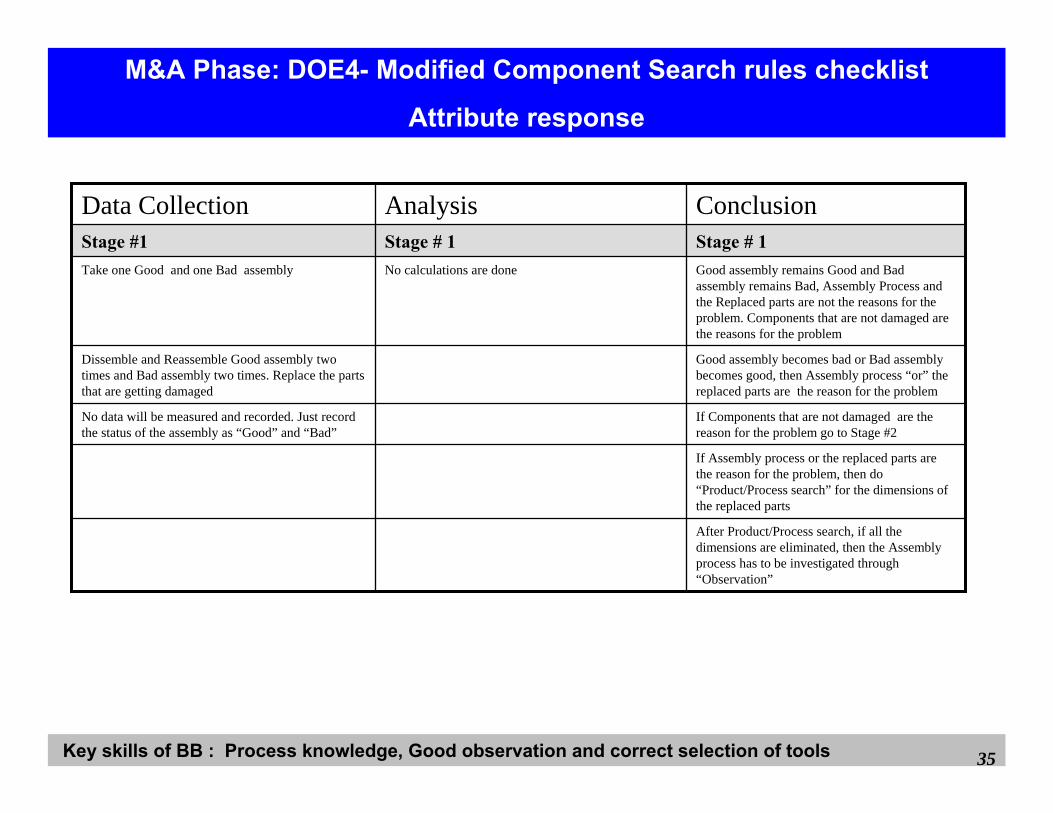
M&A Phase: DOE4- Modified Component Search rules checklist
Attribute response
Stage # 1Stage # 1Stage #1
After Product/Process search, if all the dimensions are eliminated, then the Assembly process has to be investigated through “Observation”
If Assembly process or the replaced parts are the reason for the problem, then do “Product/Process search” for the dimensions of the replaced parts
If Components that are not damaged are the reason for the problem go to Stage #2
No data will be measured and recorded. Just record the status of the assembly as “Good” and “Bad”
Good assembly becomes bad or Bad assembly becomes good, then Assembly process “or” the replaced parts are the reason for the problem
Dissemble and Reassemble Good assembly two times and Bad assembly two times. Replace the parts that are getting damaged
Good assembly remains Good and Bad assembly remains Bad, Assembly Process and the Replaced parts are not the reasons for the problem. Components that are not damaged are the reasons for the problem
No calculations are doneTake one Good and one Bad assembly
ConclusionAnalysisData Collection

Key skills of BB : Process knowledge, Good observation and correct selection of tools 36
M&A Phase: DOE4- Modified Component Search rules checklist
Attribute response
Same rules as Paired comparisonSame rules as Paired compairsonSelect 8 Good and 8 Bad assemblies. Remove the parts pinpointed earlier as per step 2 and then check the suspected dimensions on those parts
If Good assembly remains Good and Bad assembly remains Bad, then the Component interchanged is “Not at all” the reason for the problem
“-” indicates Bad assembly and “+” indicates Good assembly
Stage # 2Stage # 2Stage #2
If A is “one of the components” and B is “the only component”, Do paired comparison only on B
Stage # 3 – Paired ComparisonStage # 3 – Paired Comparison
Stop the swapping, when the conclusion comes as the Only component creating the problem
Do the conclusion as per the conclusion rules and then decide to interchange the next component
If we get, A as one of the component, B as one of the component creating the problem, we should not go for C, we have to interchange A&B together
A+R- means – Component A taken from Good assembly and put inside Bad assembly
If Good assembly remains Good and Bad assembly becomes Good, then the Component interchanged is “One of the component”creating the problem
A-R+ means – Component A taken from Bad assembly and put inside Good assembly
If Good assembly becomes Bad and Bad assembly remains Bad, then the Component interchanged is “One of the component”creating the problem
Swap the first component. The swapping is represented as A-R+ and A+R-. During swapping, replace the parts that are getting damaged with new ones.
If Good assembly becomes Bad assembly, and Bad assembly becomes Good assembly, then Component interchanged is the “Only reason”for the problem
No graph is plotted as in the variable responseList down the Components in the descending order of suspect level
ConclusionAnalysisData Collection
Key skills of BB : Process knowledge, Good observation and correct selection of tools 37
DOE Tool 5
Multi vari analysis
Key skills of BB : Process knowledge, Good observation and correct selection of tools 38
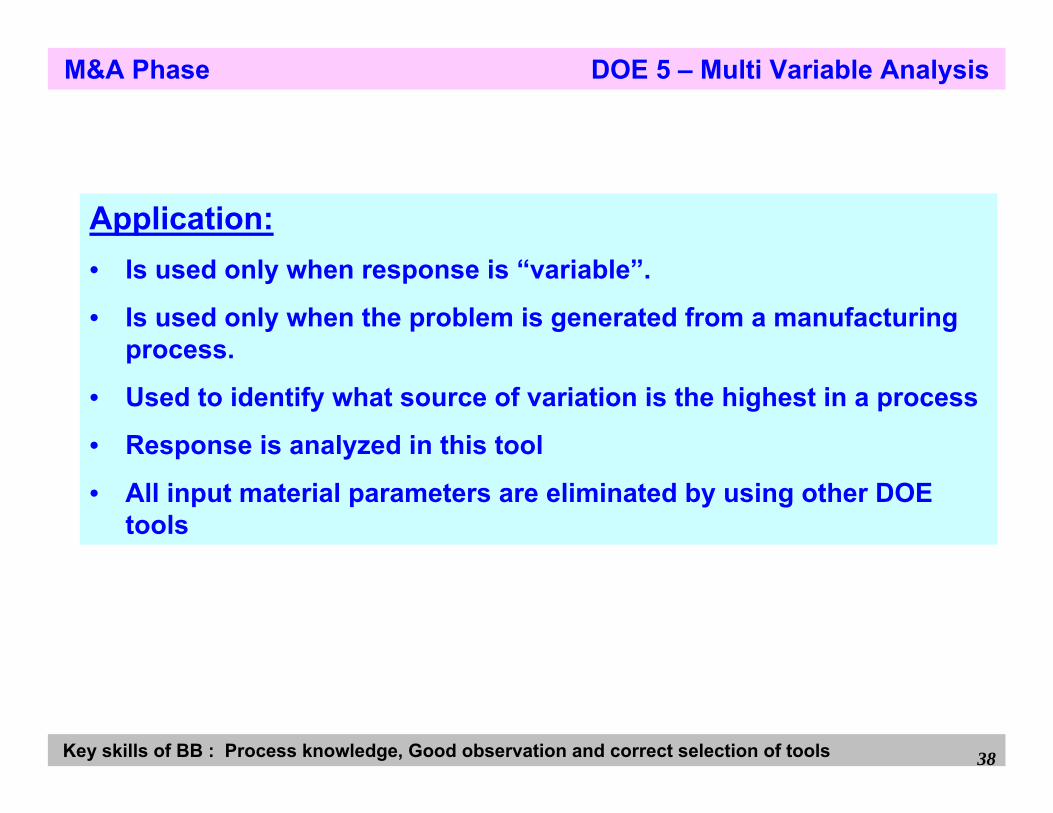
M&A Phase DOE 5 – Multi Variable Analysis
Application:• Is used only when response is “variable”.
• Is used only when the problem is generated from a manufacturing process.
• Used to identify what source of variation is the highest in a process
• Response is analyzed in this tool
• All input material parameters are eliminated by using other DOE tools
Key skills of BB : Process knowledge, Good observation and correct selection of tools 39
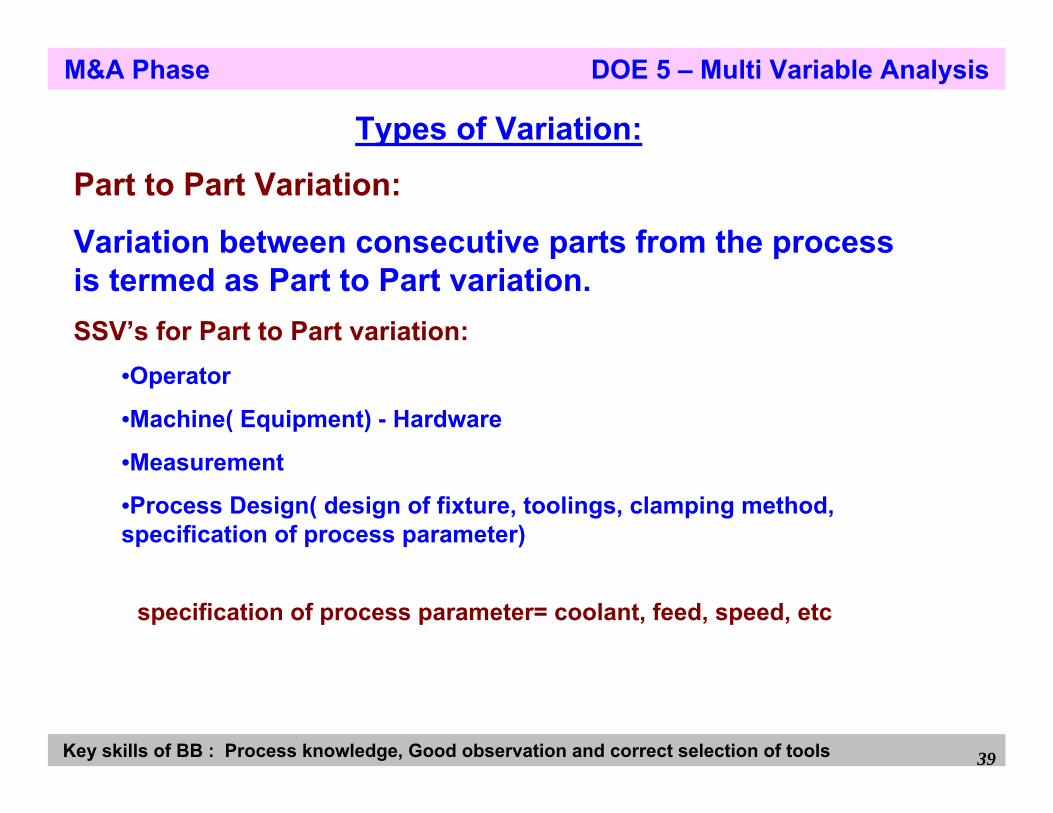
Types of Variation:
Part to Part Variation:
Variation between consecutive parts from the process is termed as Part to Part variation.SSV’s for Part to Part variation:
•Operator
•Machine( Equipment) - Hardware
•Measurement
•Process Design( design of fixture, toolings, clamping method, specification of process parameter)
specification of process parameter= coolant, feed, speed, etc
M&A Phase DOE 5 – Multi Variable Analysis
Key skills of BB : Process knowledge, Good observation and correct selection of tools 40
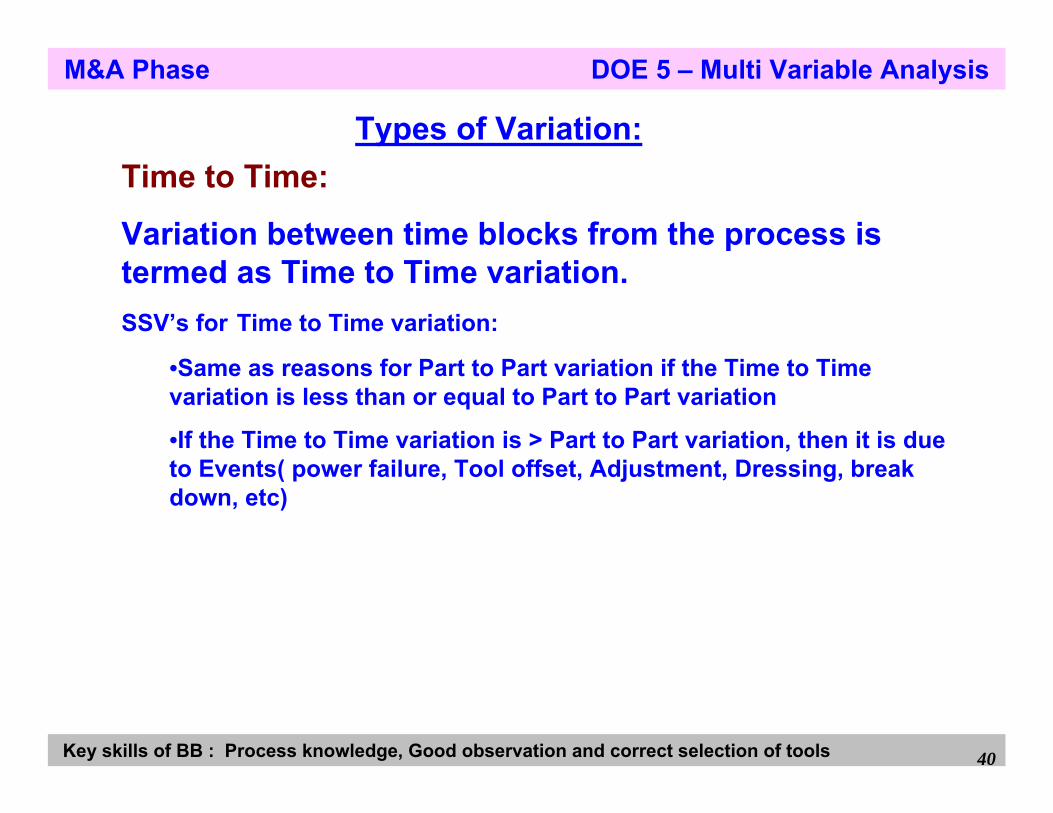
Types of Variation:
SSV’s for Time to Time variation:
•Same as reasons for Part to Part variation if the Time to Time variation is less than or equal to Part to Part variation
•If the Time to Time variation is > Part to Part variation, then it is due to Events( power failure, Tool offset, Adjustment, Dressing, break down, etc)
Time to Time:
Variation between time blocks from the process is termed as Time to Time variation.
M&A Phase DOE 5 – Multi Variable Analysis
Key skills of BB : Process knowledge, Good observation and correct selection of tools 41
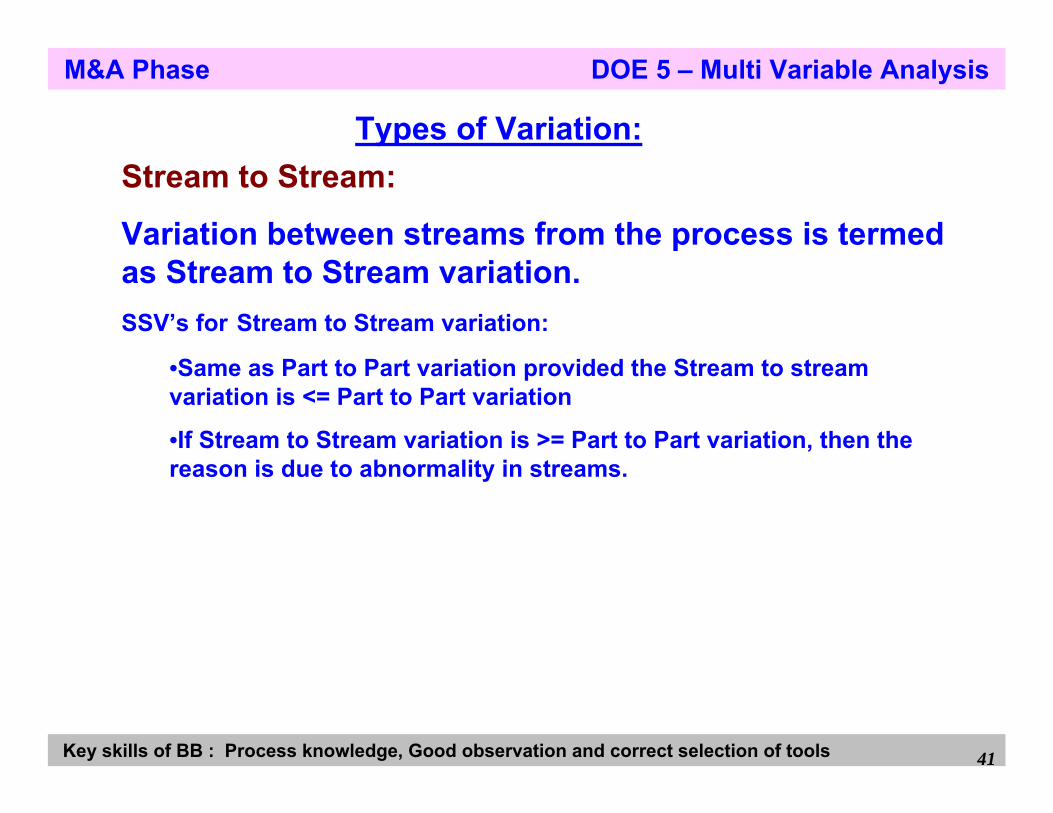
Types of Variation:
SSV’s for Stream to Stream variation:
•Same as Part to Part variation provided the Stream to stream variation is <= Part to Part variation
•If Stream to Stream variation is >= Part to Part variation, then the reason is due to abnormality in streams.
Stream to Stream:
Variation between streams from the process is termed as Stream to Stream variation.
M&A Phase DOE 5 – Multi Variable Analysis
Key skills of BB : Process knowledge, Good observation and correct selection of tools 42
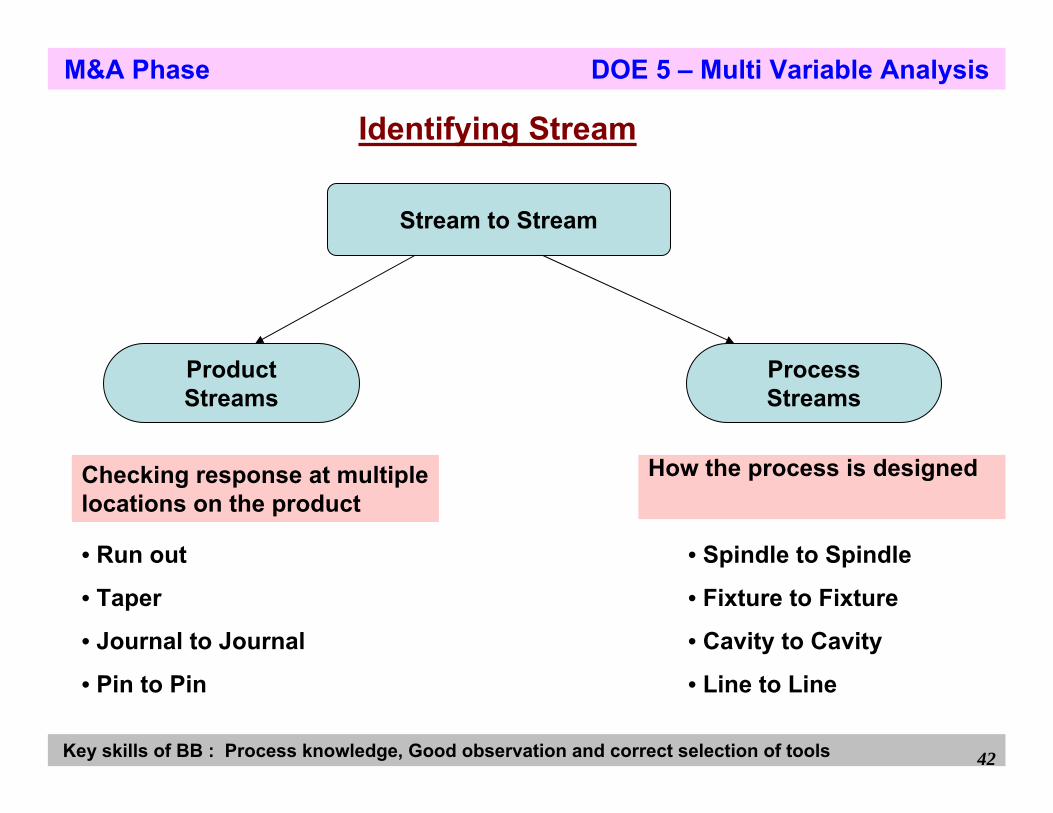
Identifying Stream
Stream to Stream
ProductStreams
ProcessStreams
• Run out
• Taper
• Journal to Journal
• Pin to Pin
• Spindle to Spindle
• Fixture to Fixture
• Cavity to Cavity
• Line to Line
Checking response at multiple locations on the product
How the process is designed
M&A Phase DOE 5 – Multi Variable Analysis
Key skills of BB : Process knowledge, Good observation and correct selection of tools 43
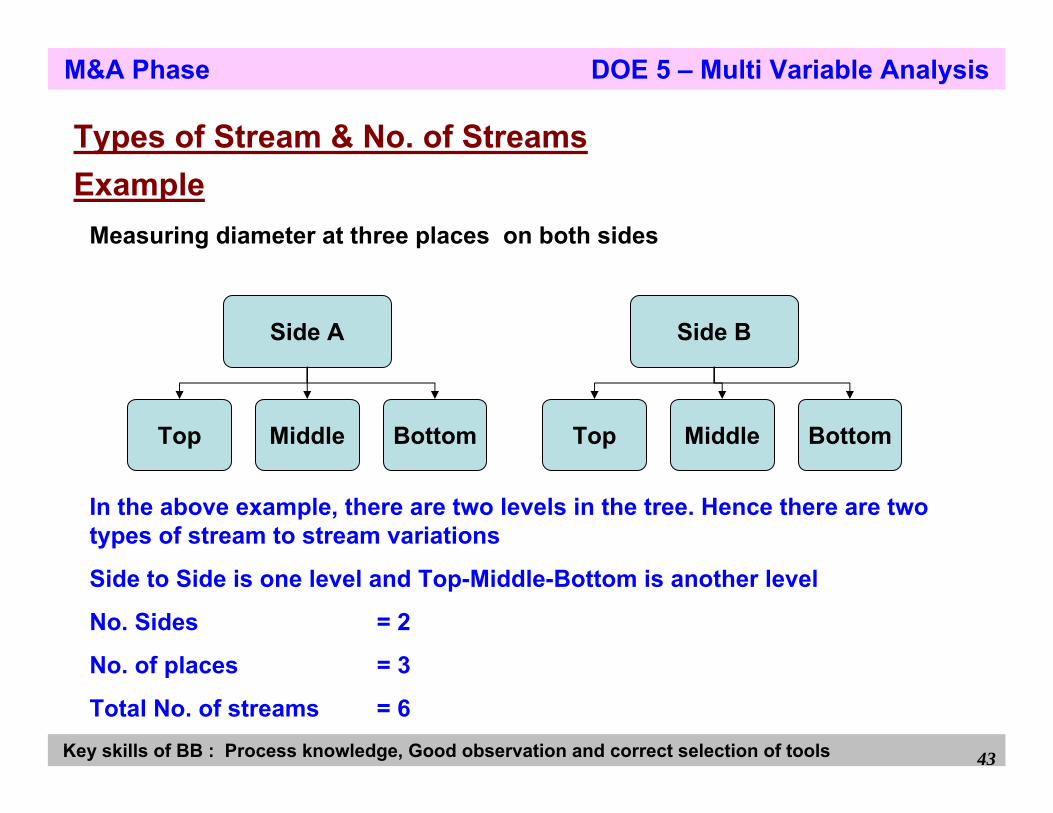
Types of Stream & No. of Streams
Measuring diameter at three places on both sides
Example
Side A Side B
Top Middle Bottom Top Middle Bottom
In the above example, there are two levels in the tree. Hence there are two types of stream to stream variations
Side to Side is one level and Top-Middle-Bottom is another level
No. Sides = 2
No. of places = 3
Total No. of streams = 6
M&A Phase DOE 5 – Multi Variable Analysis
Key skills of BB : Process knowledge, Good observation and correct selection of tools 44
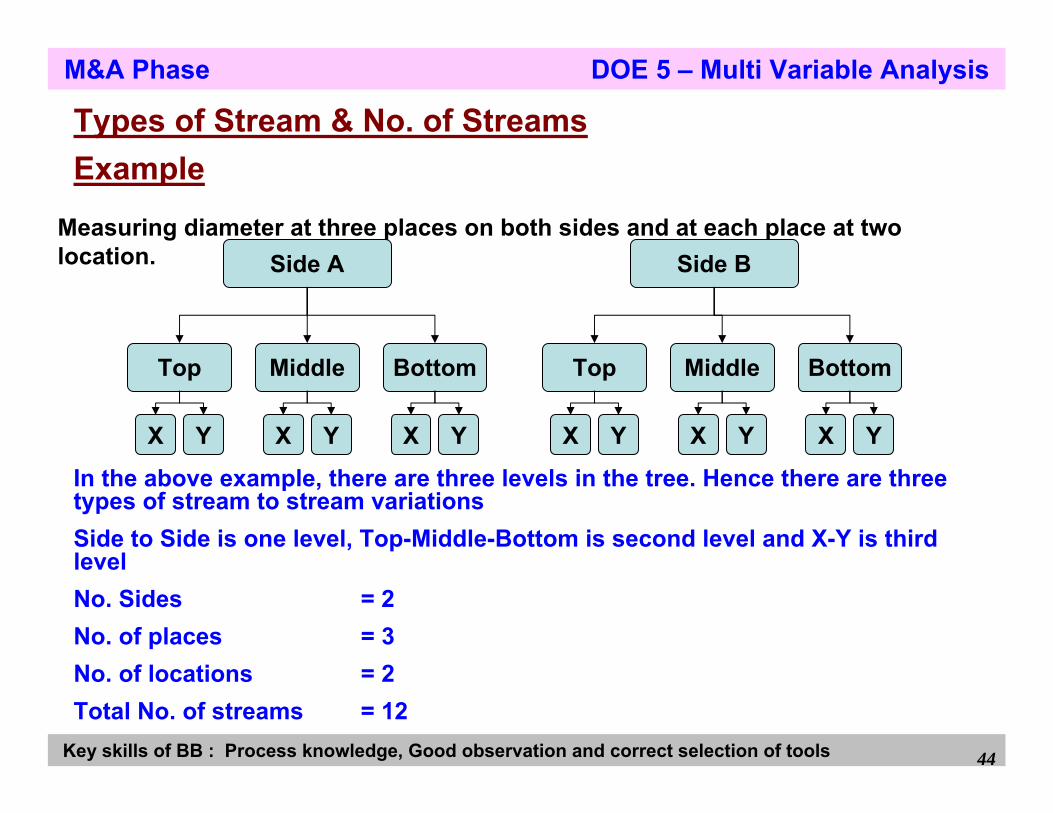
Measuring diameter at three places on both sides and at each place at two location.
Example
Side A Side B
Top Middle Bottom Top Middle Bottom
In the above example, there are three levels in the tree. Hence there are three types of stream to stream variationsSide to Side is one level, Top-Middle-Bottom is second level and X-Y is third levelNo. Sides = 2No. of places = 3No. of locations = 2Total No. of streams = 12
X Y X Y X Y X Y X Y X Y
M&A Phase DOE 5 – Multi Variable Analysis
Types of Stream & No. of Streams
Key skills of BB : Process knowledge, Good observation and correct selection of tools 45
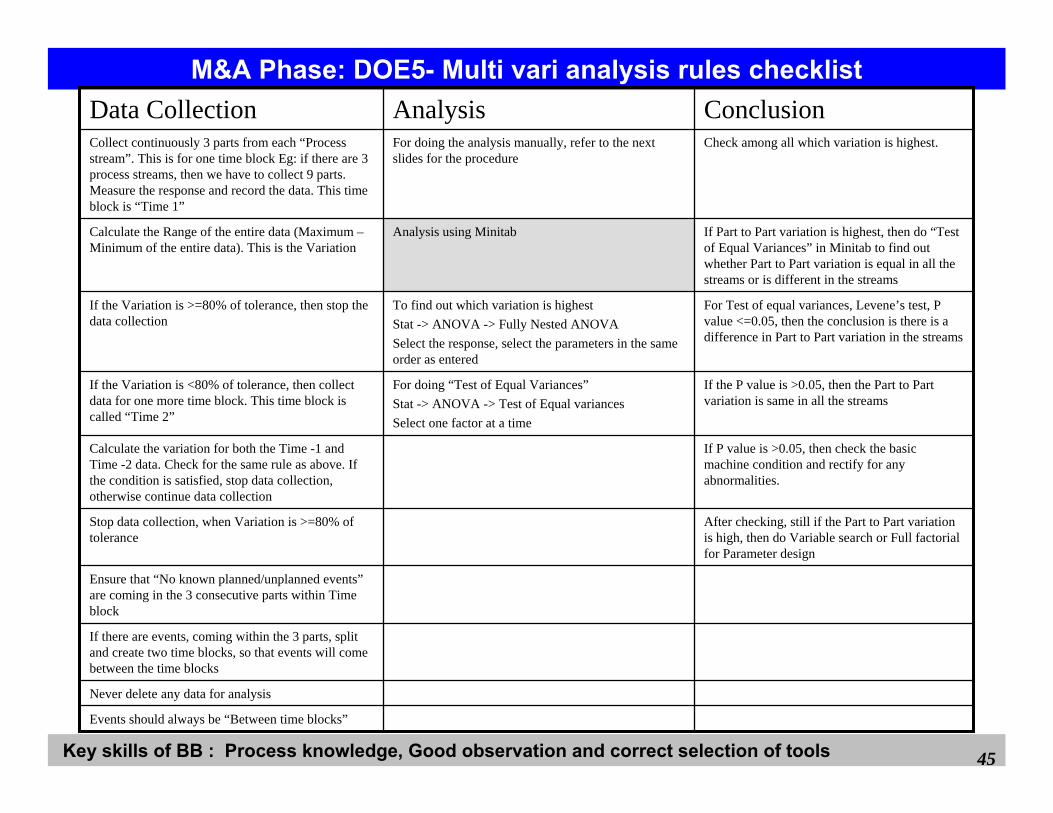
M&A Phase: DOE5- Multi vari analysis rules checklist
Events should always be “Between time blocks”
Never delete any data for analysis
Ensure that “No known planned/unplanned events”are coming in the 3 consecutive parts within Time block
Check among all which variation is highest.For doing the analysis manually, refer to the next slides for the procedure
Collect continuously 3 parts from each “Process stream”. This is for one time block Eg: if there are 3 process streams, then we have to collect 9 parts. Measure the response and record the data. This time block is “Time 1”
If there are events, coming within the 3 parts, split and create two time blocks, so that events will come between the time blocks
After checking, still if the Part to Part variation is high, then do Variable search or Full factorial for Parameter design
Stop data collection, when Variation is >=80% of tolerance
If P value is >0.05, then check the basic machine condition and rectify for any abnormalities.
Calculate the variation for both the Time -1 and Time -2 data. Check for the same rule as above. If the condition is satisfied, stop data collection, otherwise continue data collection
If the P value is >0.05, then the Part to Part variation is same in all the streams
For doing “Test of Equal Variances”Stat -> ANOVA -> Test of Equal variancesSelect one factor at a time
If the Variation is <80% of tolerance, then collect data for one more time block. This time block is called “Time 2”
For Test of equal variances, Levene’s test, P value <=0.05, then the conclusion is there is a difference in Part to Part variation in the streams
To find out which variation is highestStat -> ANOVA -> Fully Nested ANOVASelect the response, select the parameters in the same order as entered
If the Variation is >=80% of tolerance, then stop the data collection
If Part to Part variation is highest, then do “Test of Equal Variances” in Minitab to find out whether Part to Part variation is equal in all the streams or is different in the streams
Analysis using MinitabCalculate the Range of the entire data (Maximum –Minimum of the entire data). This is the Variation
ConclusionAnalysisData Collection
Key skills of BB : Process knowledge, Good observation and correct selection of tools 46
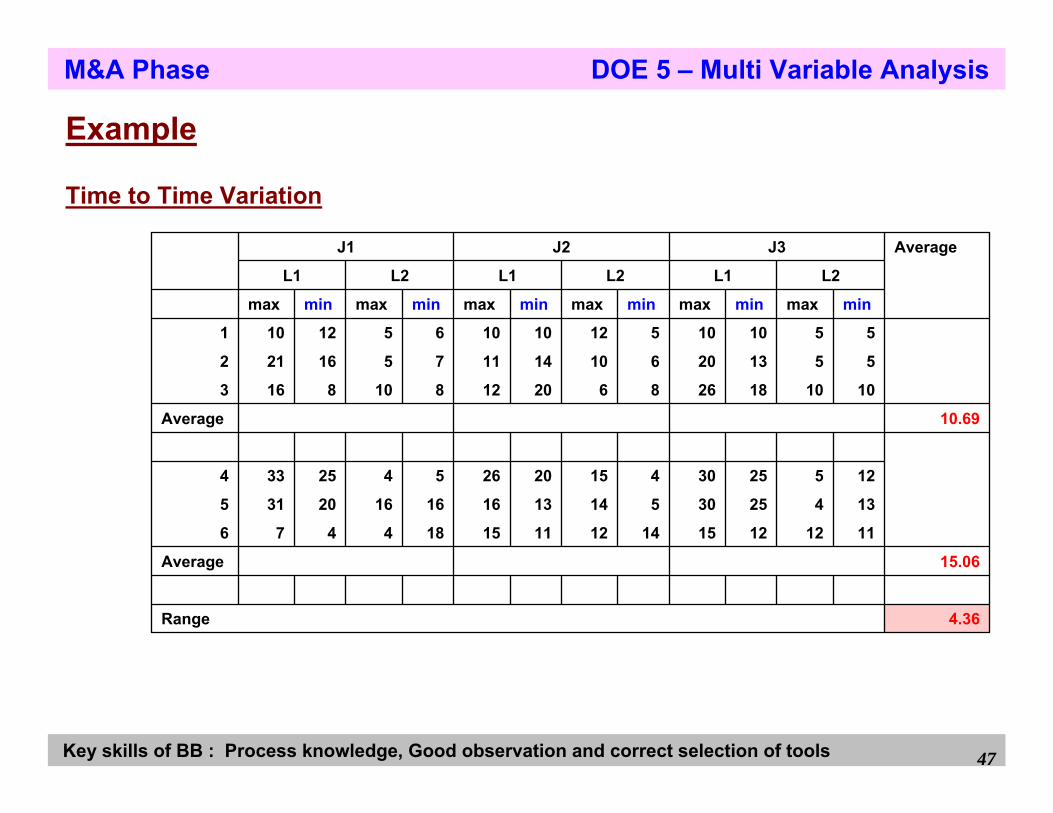
Example
28131510391113122126Range
1112121514121115184476
13425305141316161620315
125253041520265425334
558163610225811Range
101018268620128108163
55132061014117516212
55101051210106512101
minmaxminmaxminmaxminmaxminmaxminmax
L2L1L2L1L2L1
J3J2J1
Journal1
L1
Max Min
L2
Max Min
Journal1
L1
Max Min
L2
Max Min
Journal1
L1
Max Min
L2
Max Min
Part to Part Variation
M&A Phase DOE 5 – Multi Variable Analysis
Key skills of BB : Process knowledge, Good observation and correct selection of tools 47
Example
Time to Time Variation
4.36Range
15.06Average
1112121514121115184476
13425305141316161620315
125253041520265425334
10.69Average
101018268620128108163
55132061014117516212
55101051210106512101
minmaxminmaxminmaxminmaxminmaxminmax
L2L1L2L1L2L1
AverageJ3J2J1
M&A Phase DOE 5 – Multi Variable Analysis
Key skills of BB : Process knowledge, Good observation and correct selection of tools 48
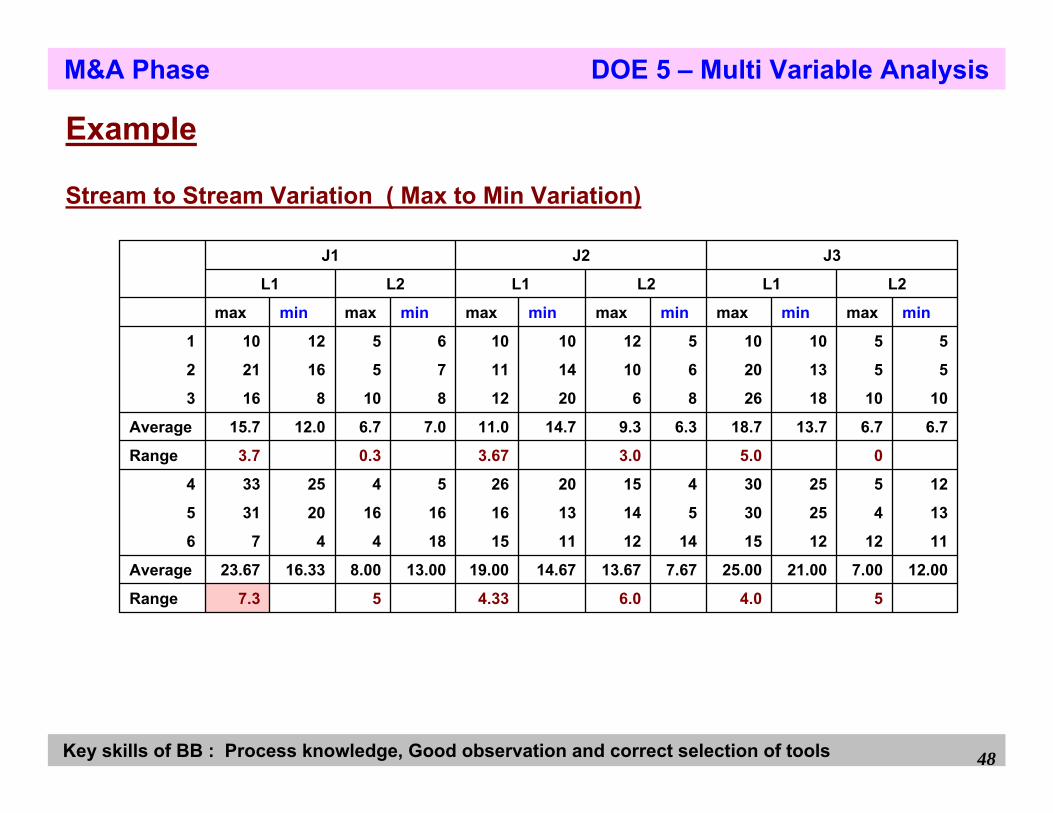
Example
Stream to Stream Variation ( Max to Min Variation)
54.06.04.3357.3Range
12.007.0021.0025.007.6713.6714.6719.0013.008.0016.3323.67Average
1112121514121115184476
13425305141316161620315
125253041520265425334
05.03.03.670.33.7Range
6.76.713.718.76.39.314.711.07.06.712.015.7Average
101018268620128108163
55132061014117516212
55101051210106512101
minmaxminmaxminmaxminmaxminmaxminmax
L2L1L2L1L2L1
J3J2J1
M&A Phase DOE 5 – Multi Variable Analysis

Key skills of BB : Process knowledge, Good observation and correct selection of tools 49
Example
Stream to Stream Variation ( L1 to L2 Variation)
13.336.29.5Range9.522.810.716.810.520.0Average111212151412111518447613425305141316161620315125253041520265425334
9.55.07.0Range6.716.27.812.86.813.8Average1010182686201281081635513206101411751621255101051210106512101
minmaxminmaxminmaxminmaxminmaxminmaxL2L1L2L1L2L1
J3J2J1
M&A Phase DOE 5 – Multi Variable Analysis
Key skills of BB : Process knowledge, Good observation and correct selection of tools 50
Example
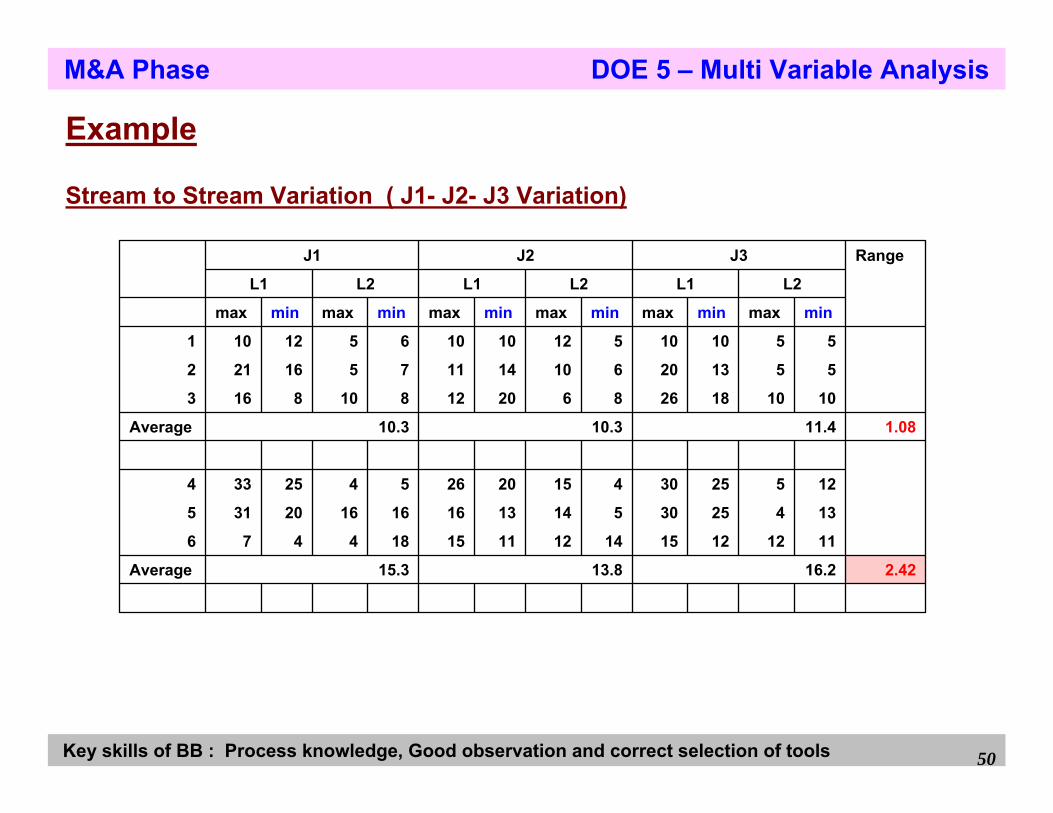
Stream to Stream Variation ( J1- J2- J3 Variation)
2.4216.213.815.3Average
1112121514121115184476
13425305141316161620315
125253041520265425334
1.0811.410.310.3Average
101018268620128108163
55132061014117516212
55101051210106512101
minmaxminmaxminmaxminmaxminmaxminmax
L2L1L2L1L2L1
RangeJ3J2J1
M&A Phase DOE 5 – Multi Variable Analysis
Key skills of BB : Process knowledge, Good observation and correct selection of tools 51
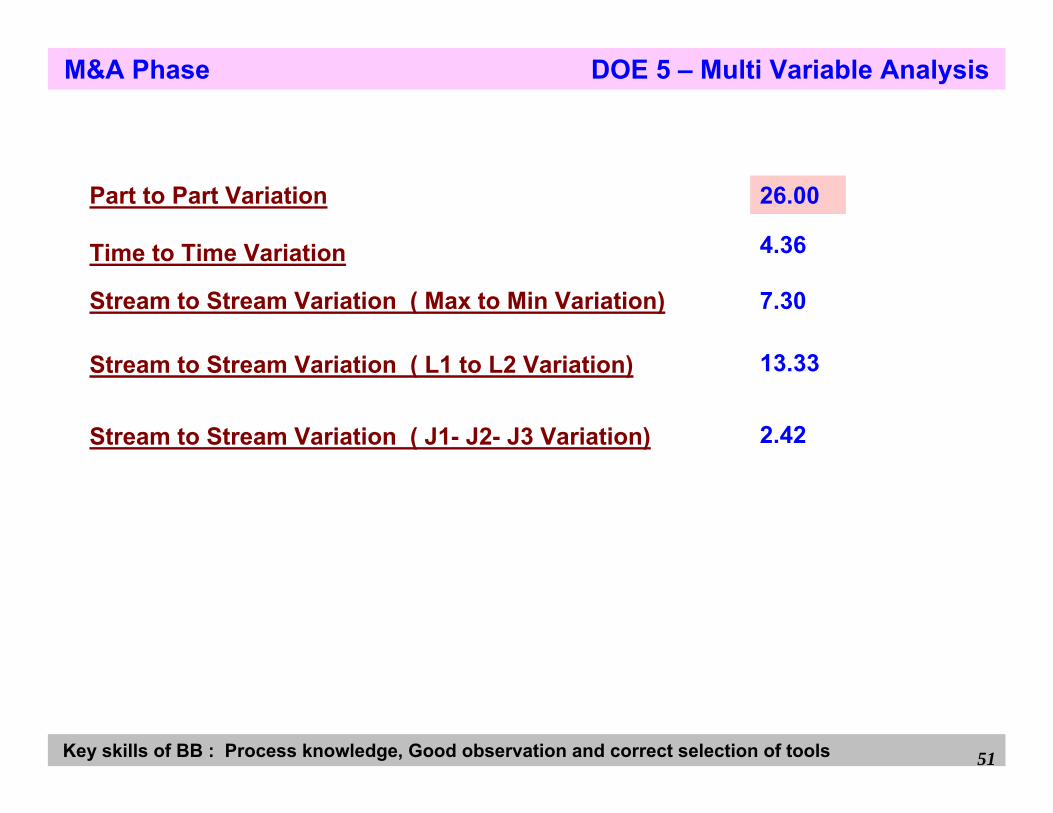
Part to Part Variation
Time to Time Variation
Stream to Stream Variation ( Max to Min Variation)
Stream to Stream Variation ( L1 to L2 Variation)
Stream to Stream Variation ( J1- J2- J3 Variation)
26.00
4.36
7.30
13.33
2.42
M&A Phase DOE 5 – Multi Variable Analysis
Key skills of BB : Process knowledge, Good observation and correct selection of tools 52
DOE Tool 6
Concentration Chart
Key skills of BB : Process knowledge, Good observation and correct selection of tools 53
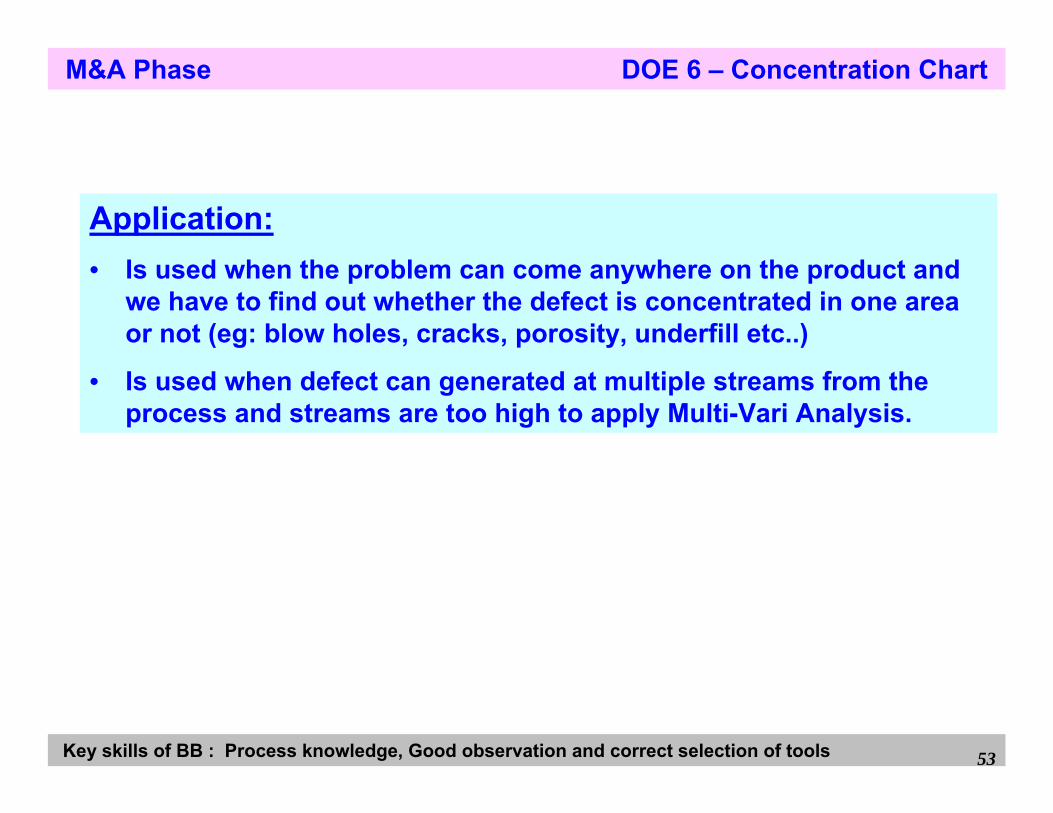
M&A Phase DOE 6 – Concentration Chart
Application:• Is used when the problem can come anywhere on the product and
we have to find out whether the defect is concentrated in one area or not (eg: blow holes, cracks, porosity, underfill etc..)
• Is used when defect can generated at multiple streams from the process and streams are too high to apply Multi-Vari Analysis.
Key skills of BB : Process knowledge, Good observation and correct selection of tools 54
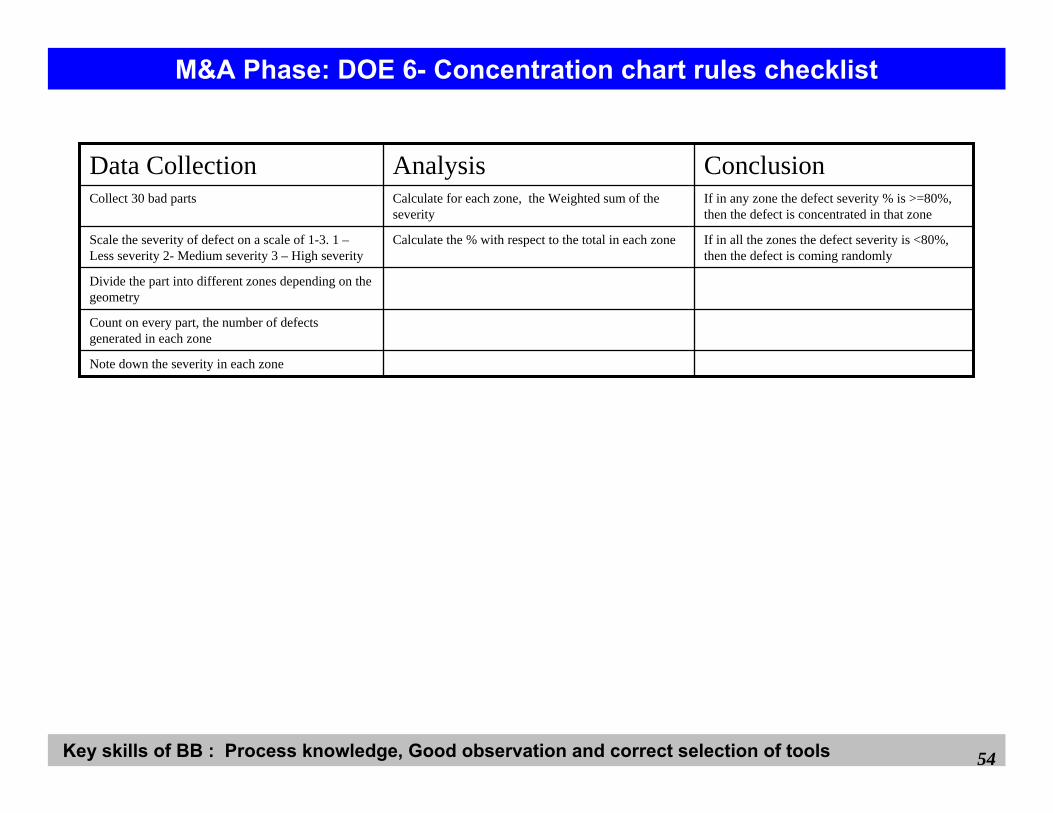
M&A Phase: DOE 6- Concentration chart rules checklist
Divide the part into different zones depending on the geometry
If in any zone the defect severity % is >=80%, then the defect is concentrated in that zone
Calculate for each zone, the Weighted sum of the severity
Collect 30 bad parts
Note down the severity in each zone
Count on every part, the number of defects generated in each zone
If in all the zones the defect severity is <80%, then the defect is coming randomly
Calculate the % with respect to the total in each zoneScale the severity of defect on a scale of 1-3. 1 –Less severity 2- Medium severity 3 – High severity
ConclusionAnalysisData Collection
Key skills of BB : Process knowledge, Good observation and correct selection of tools 55
DOE Tool 7
B Vs C
Key skills of BB : Process knowledge, Good observation and correct selection of tools 56
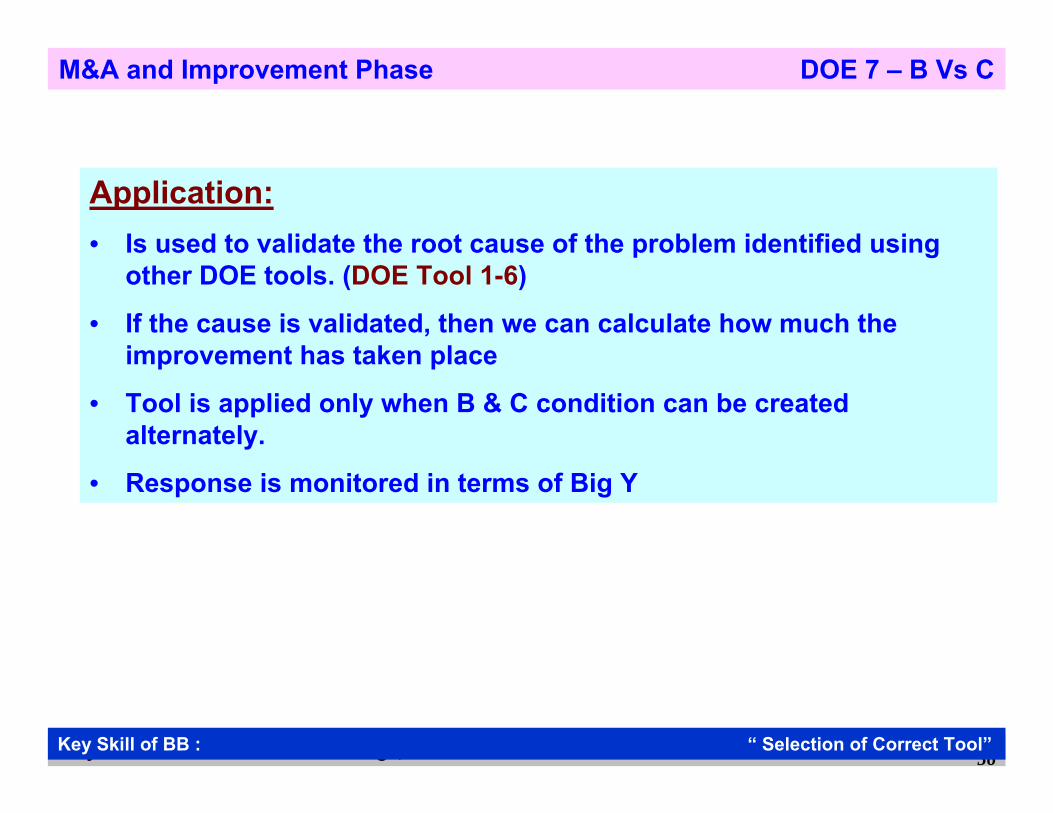
M&A and Improvement Phase DOE 7 – B Vs C
Application:• Is used to validate the root cause of the problem identified using
other DOE tools. (DOE Tool 1-6)
• If the cause is validated, then we can calculate how much the improvement has taken place
• Tool is applied only when B & C condition can be created alternately.
• Response is monitored in terms of Big Y
Key Skill of BB : “ Selection of Correct Tool”
Key skills of BB : Process knowledge, Good observation and correct selection of tools 57
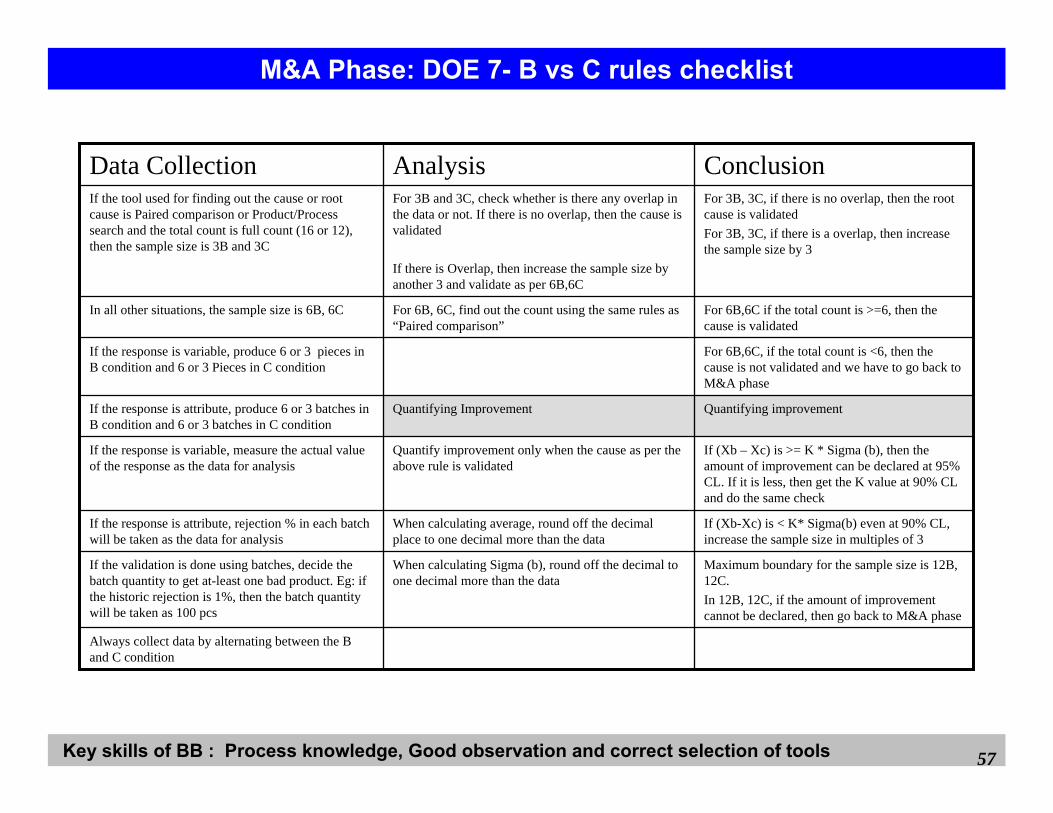
M&A Phase: DOE 7- B vs C rules checklist
Always collect data by alternating between the B and C condition
Maximum boundary for the sample size is 12B, 12C.In 12B, 12C, if the amount of improvement cannot be declared, then go back to M&A phase
When calculating Sigma (b), round off the decimal to one decimal more than the data
If the validation is done using batches, decide the batch quantity to get at-least one bad product. Eg: if the historic rejection is 1%, then the batch quantity will be taken as 100 pcs
If (Xb-Xc) is < K* Sigma(b) even at 90% CL, increase the sample size in multiples of 3
When calculating average, round off the decimal place to one decimal more than the data
If the response is attribute, rejection % in each batch will be taken as the data for analysis
For 6B,6C, if the total count is <6, then the cause is not validated and we have to go back to M&A phase
If the response is variable, produce 6 or 3 pieces in B condition and 6 or 3 Pieces in C condition
For 3B, 3C, if there is no overlap, then the root cause is validatedFor 3B, 3C, if there is a overlap, then increase the sample size by 3
For 3B and 3C, check whether is there any overlap in the data or not. If there is no overlap, then the cause is validated
If there is Overlap, then increase the sample size by another 3 and validate as per 6B,6C
If the tool used for finding out the cause or root cause is Paired comparison or Product/Process search and the total count is full count (16 or 12), then the sample size is 3B and 3C
If (Xb – Xc) is >= K * Sigma (b), then the amount of improvement can be declared at 95% CL. If it is less, then get the K value at 90% CL and do the same check
Quantify improvement only when the cause as per the above rule is validated
If the response is variable, measure the actual value of the response as the data for analysis
Quantifying improvementQuantifying ImprovementIf the response is attribute, produce 6 or 3 batches in B condition and 6 or 3 batches in C condition
For 6B,6C if the total count is >=6, then the cause is validated
For 6B, 6C, find out the count using the same rules as “Paired comparison”
In all other situations, the sample size is 6B, 6C
ConclusionAnalysisData Collection
Key skills of BB : Process knowledge, Good observation and correct selection of tools 58
DOE Tool 8
Variable Search
Key skills of BB : Process knowledge, Good observation and correct selection of tools 59
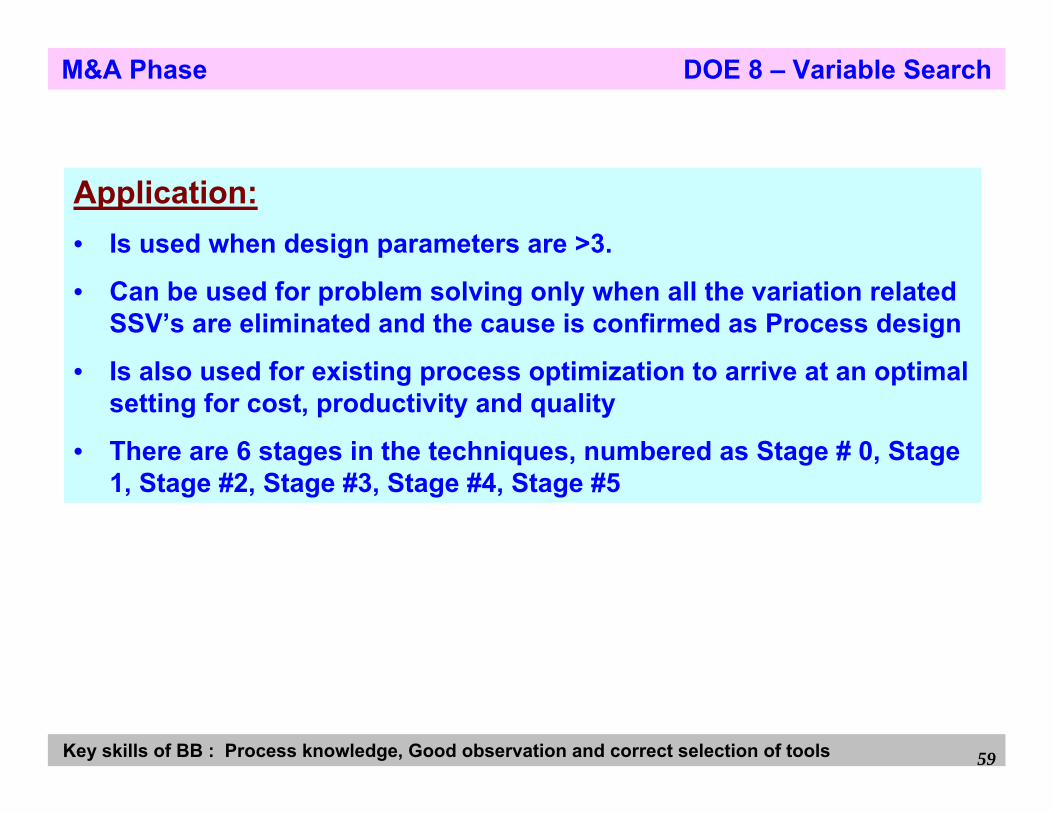
M&A Phase DOE 8 – Variable Search
Application:• Is used when design parameters are >3.
• Can be used for problem solving only when all the variation related SSV’s are eliminated and the cause is confirmed as Process design
• Is also used for existing process optimization to arrive at an optimal setting for cost, productivity and quality
• There are 6 stages in the techniques, numbered as Stage # 0, Stage 1, Stage #2, Stage #3, Stage #4, Stage #5
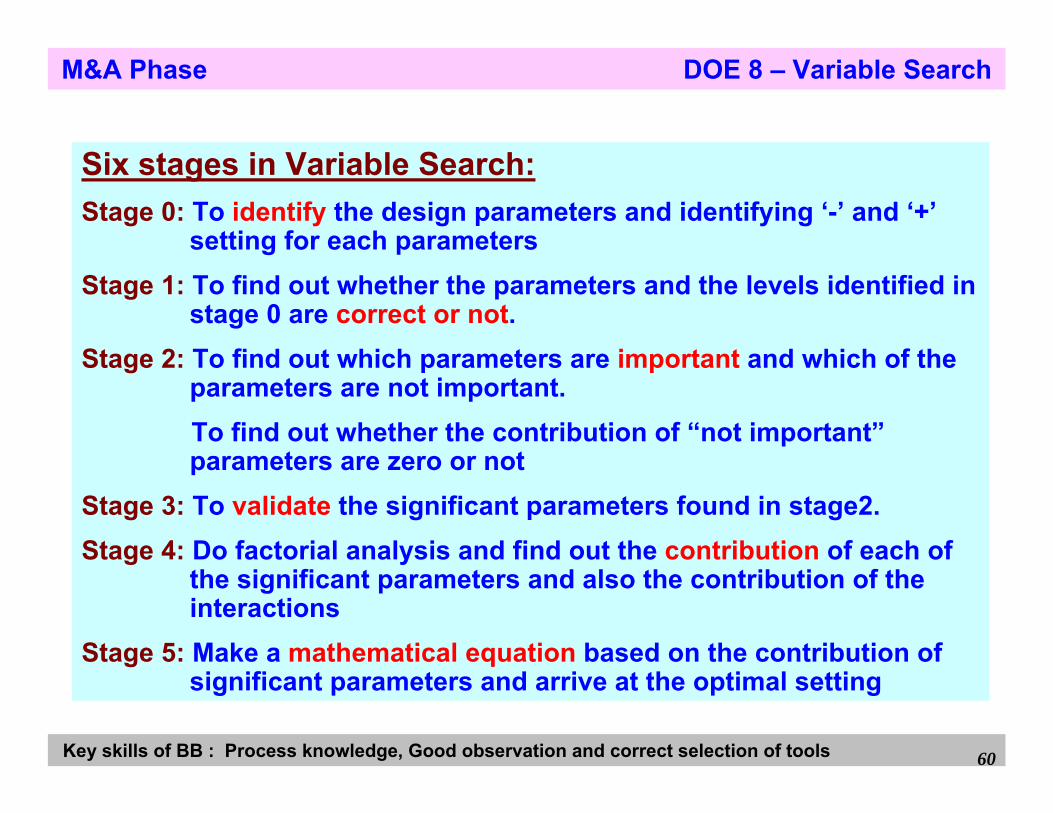
Key skills of BB : Process knowledge, Good observation and correct selection of tools 60
Six stages in Variable Search:Stage 0: To identify the design parameters and identifying ‘-’ and ‘+’
setting for each parametersStage 1: To find out whether the parameters and the levels identified in
stage 0 are correct or not.Stage 2: To find out which parameters are important and which of the
parameters are not important. To find out whether the contribution of “not important”parameters are zero or not
Stage 3: To validate the significant parameters found in stage2.Stage 4: Do factorial analysis and find out the contribution of each of
the significant parameters and also the contribution of the interactions
Stage 5: Make a mathematical equation based on the contribution of significant parameters and arrive at the optimal setting
M&A Phase DOE 8 – Variable Search
Key skills of BB : Process knowledge, Good observation and correct selection of tools 61
DOE Tool 8
Variable Search
Application: Problem Solving
Key skills of BB : Process knowledge, Good observation and correct selection of tools 62
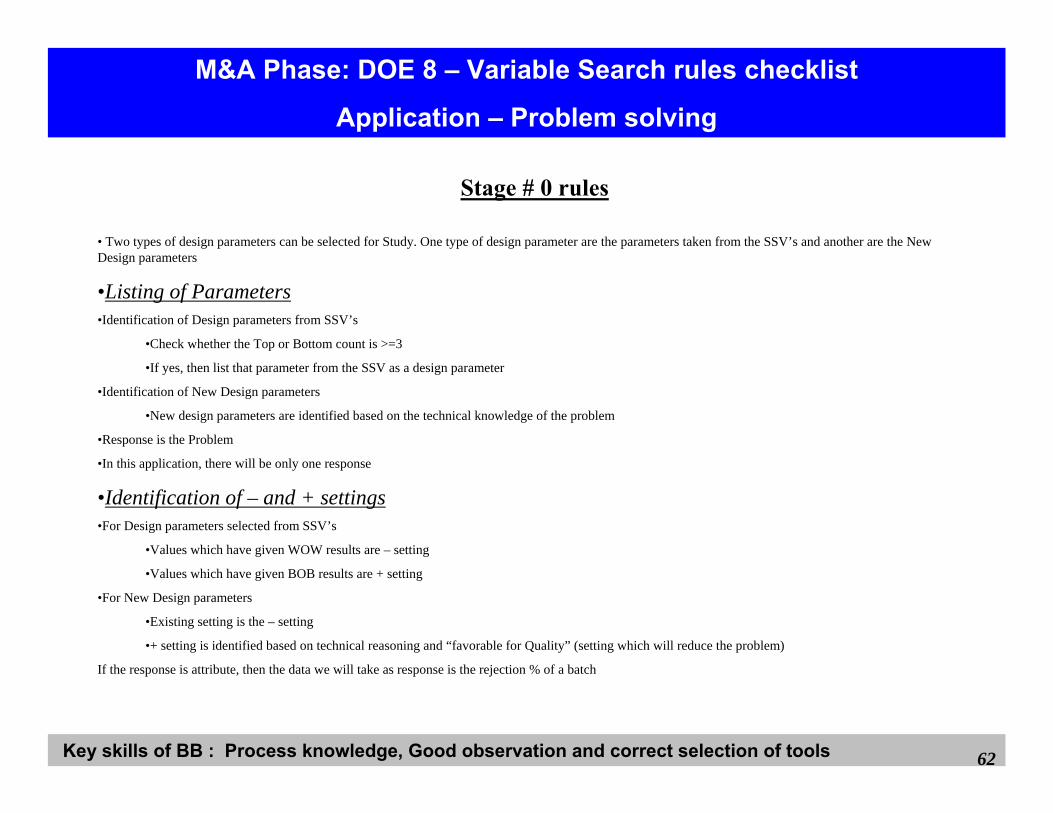
M&A Phase: DOE 8 – Variable Search rules checklist
Application – Problem solving
Stage # 0 rules
• Two types of design parameters can be selected for Study. One type of design parameter are the parameters taken from the SSV’s and another are the New Design parameters
•Listing of Parameters•Identification of Design parameters from SSV’s
•Check whether the Top or Bottom count is >=3
•If yes, then list that parameter from the SSV as a design parameter
•Identification of New Design parameters
•New design parameters are identified based on the technical knowledge of the problem
•Response is the Problem
•In this application, there will be only one response
•Identification of – and + settings•For Design parameters selected from SSV’s
•Values which have given WOW results are – setting
•Values which have given BOB results are + setting
•For New Design parameters
•Existing setting is the – setting
•+ setting is identified based on technical reasoning and “favorable for Quality” (setting which will reduce the problem)
If the response is attribute, then the data we will take as response is the rejection % of a batch
Key skills of BB : Process knowledge, Good observation and correct selection of tools 63
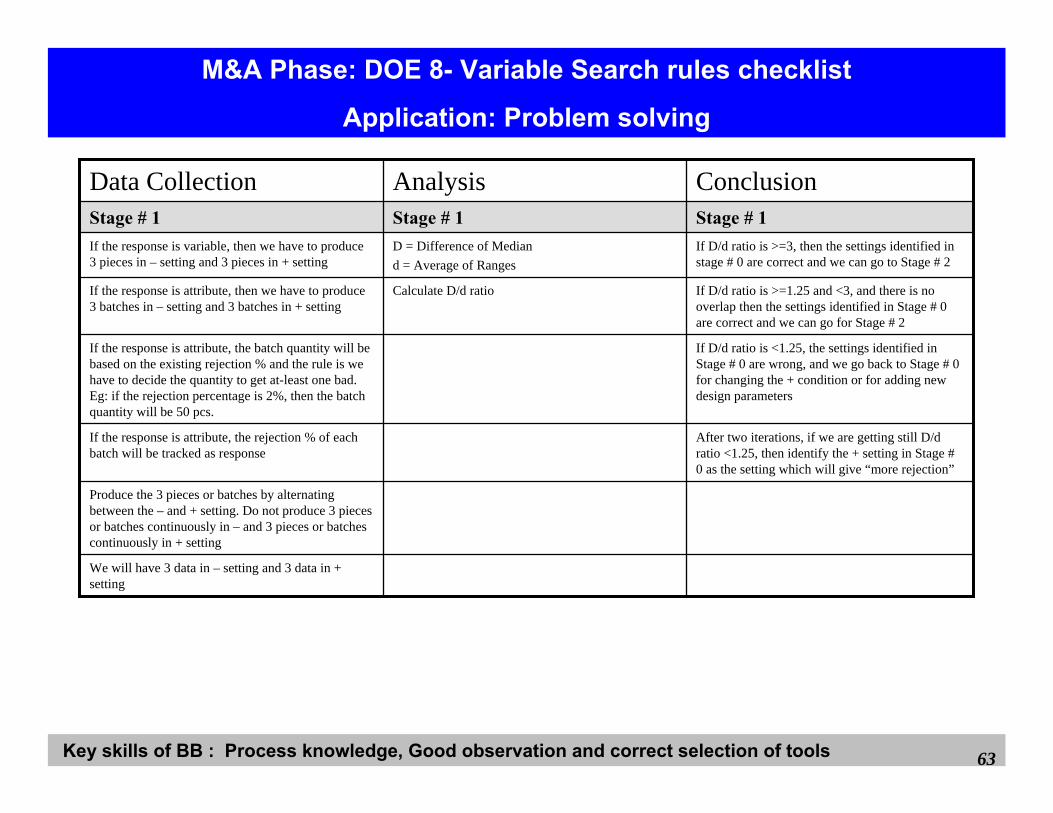
M&A Phase: DOE 8- Variable Search rules checklist
Application: Problem solving
After two iterations, if we are getting still D/d ratio <1.25, then identify the + setting in Stage # 0 as the setting which will give “more rejection”
If the response is attribute, the rejection % of each batch will be tracked as response
We will have 3 data in – setting and 3 data in + setting
If D/d ratio is >=1.25 and <3, and there is no overlap then the settings identified in Stage # 0 are correct and we can go for Stage # 2
Calculate D/d ratioIf the response is attribute, then we have to produce 3 batches in – setting and 3 batches in + setting
Stage # 1Stage # 1Stage # 1
Produce the 3 pieces or batches by alternating between the – and + setting. Do not produce 3 pieces or batches continuously in – and 3 pieces or batches continuously in + setting
If D/d ratio is <1.25, the settings identified in Stage # 0 are wrong, and we go back to Stage # 0 for changing the + condition or for adding new design parameters
If the response is attribute, the batch quantity will be based on the existing rejection % and the rule is we have to decide the quantity to get at-least one bad. Eg: if the rejection percentage is 2%, then the batch quantity will be 50 pcs.
If D/d ratio is >=3, then the settings identified in stage # 0 are correct and we can go to Stage # 2
D = Difference of Mediand = Average of Ranges
If the response is variable, then we have to produce 3 pieces in – setting and 3 pieces in + setting
ConclusionAnalysisData Collection

Key skills of BB : Process knowledge, Good observation and correct selection of tools 64
M&A Phase: DOE 8- Variable Search rules checklist
Application: Problem solving
If we conclude that the parameter is “NOT AT ALL” creating the problem, then check whether the “Solid or Green line” is within the “Solid or Green limits” and “Dotted or Red line” is within the “Dotted or Red limits”If yes, then the contribution of the parameter is “ZERO”If not, then the contribution of the parameter is “NOT ZERO”
UDL(-) = Median (-) + 1.45*dLDL(-) = Median (-) – 1.45*dDraws these limits as “Dotted or Red line”
If A parameter is concluded as “one of the parameter” and B parameter is concluded as “one of the parameter”, then do not go for C parameter. Do A&B together
If any one line cross the middle line, then that parameter is “ONE OF THE PARAMETER”creating the problem
Calculate 1.45*d, d – average of rangesRound off 1.45*d to the same decimal as data. Always round off to the higher value
Start with the first parameter, which is marked as “A”. Produce one piece or one batch in A-R+ and one piece of one batch in A+R-.
Stage # 2Stage # 2Stage # 2
If we conclude that the parameter is the “ONLY PARAMETER” , then check whether the “Solid or Green line” is within the “Dotted or Red limit”and “Dotted or Red line” is within the “Solid or Green limit”If yes, then the contribution of other parameters are “ZERO”If not, then the contribution of other parameters is “Not ZERO”
Draw the + setting line as “Solid line” or “Green color line”Draw the – setting line as “Dotted line” or “Red color line”
For A-R+, use the + setting legend for plotting the data pointFor A+R-, use the – setting legend for plotting the data point
Stop the data collection, once we get the conclusion as “ONLY PARAMETER” creating the problem
If no line crosses the middle line, then that parameter is “NOT AT ALL THE PARAMETER” creating the problem
UDL(+) = Median (+) + 1.45*dLDL(+) = Median (+) – 1.45*dDraw these limits as “Solid or Green line”
If the response is variable, measure the actual value. If the response is attribute, calculate rejection % for the batch
If both the lines cross the middle line (Average of median), then that parameter is the “ONLY PARMETER” creating the problem
Middle line is the Average of MedianList down the parameters in the descending order of suspect level
ConclusionAnalysisData Collection
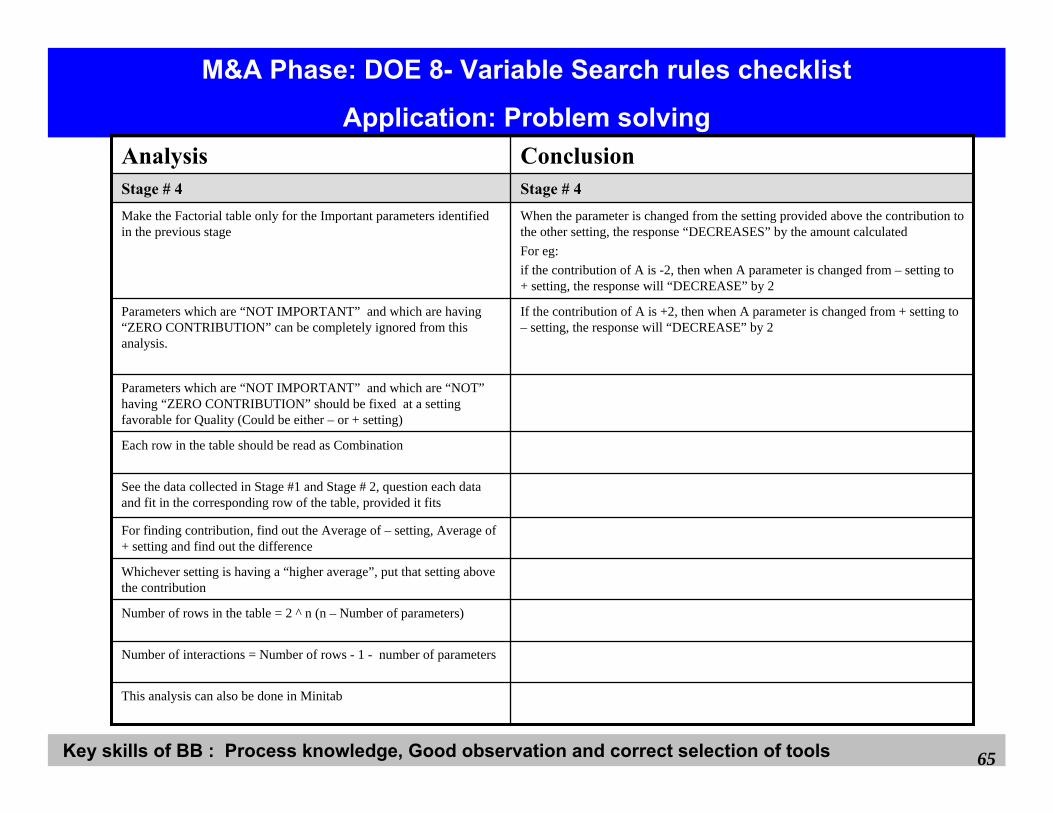
Key skills of BB : Process knowledge, Good observation and correct selection of tools 65
M&A Phase: DOE 8- Variable Search rules checklist
Application: Problem solving
This analysis can also be done in Minitab
Number of interactions = Number of rows - 1 - number of parameters
Number of rows in the table = 2 ^ n (n – Number of parameters)
Whichever setting is having a “higher average”, put that setting above the contribution
For finding contribution, find out the Average of – setting, Average of + setting and find out the difference
Each row in the table should be read as Combination
If the contribution of A is +2, then when A parameter is changed from + setting to – setting, the response will “DECREASE” by 2
Parameters which are “NOT IMPORTANT” and which are having “ZERO CONTRIBUTION” can be completely ignored from this analysis.
Stage # 4Stage # 4
See the data collected in Stage #1 and Stage # 2, question each data and fit in the corresponding row of the table, provided it fits
Parameters which are “NOT IMPORTANT” and which are “NOT”having “ZERO CONTRIBUTION” should be fixed at a setting favorable for Quality (Could be either – or + setting)
When the parameter is changed from the setting provided above the contribution to the other setting, the response “DECREASES” by the amount calculatedFor eg: if the contribution of A is -2, then when A parameter is changed from – setting to + setting, the response will “DECREASE” by 2
Make the Factorial table only for the Important parameters identified in the previous stage
ConclusionAnalysis
Key skills of BB : Process knowledge, Good observation and correct selection of tools 66
M&A Phase: DOE 8- Variable Search rules checklist
Application: Problem solving
If Y is attribute, then the Boundaries areUpper Boundary = 0Lower Boundary = 0
If Y is variable and Higher is better (Eg: Strength), Calculate the boundary for optimization asUpper boundary = LSL + 2.8 *dLower boundary = LSL + 2.3*d
Coefficients of each parameter is ½ the Contribution
Stage # 5Stage # 5
If Y is variable and Nominal is better (Eg: Diameter), Calculate the Boundary for optimization asUpper boundary = Target + 25% of toleranceLower boundary = Target = 25% of tolerance
If Y is variable and Lower is better (Eg” Runout), Calculate the boundary for optimization asUpper boundary = USL – 2.3*dLower boundary = USL – 2.8*d
Work out multiple settings using ExcelFind out the best setting in terms of Productivity and Cost
Make the Math equation.
ConclusionAnalysis
Key skills of BB : Process knowledge, Good observation and correct selection of tools 67
DOE Tool 8
Variable Search
Application: Process Optimization
Key skills of BB : Process knowledge, Good observation and correct selection of tools 68
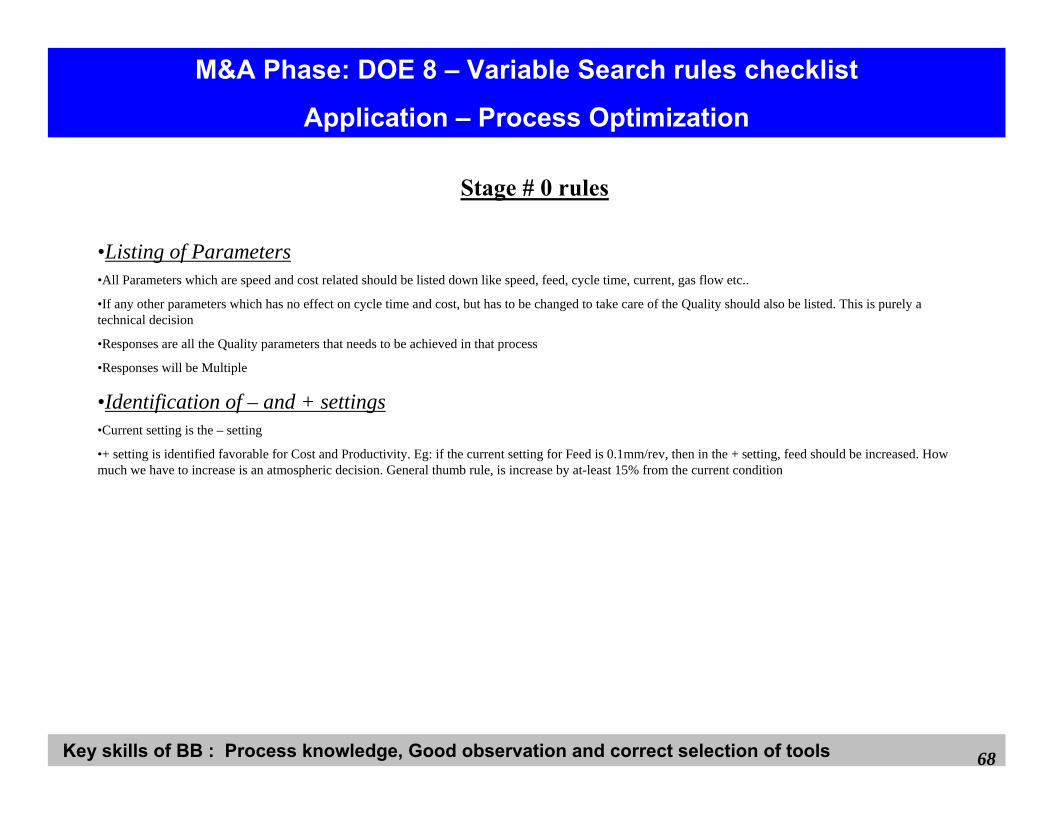
M&A Phase: DOE 8 – Variable Search rules checklist
Application – Process Optimization
Stage # 0 rules
•Listing of Parameters•All Parameters which are speed and cost related should be listed down like speed, feed, cycle time, current, gas flow etc..
•If any other parameters which has no effect on cycle time and cost, but has to be changed to take care of the Quality should also be listed. This is purely a technical decision
•Responses are all the Quality parameters that needs to be achieved in that process
•Responses will be Multiple
•Identification of – and + settings•Current setting is the – setting
•+ setting is identified favorable for Cost and Productivity. Eg: if the current setting for Feed is 0.1mm/rev, then in the + setting, feed should be increased. How much we have to increase is an atmospheric decision. General thumb rule, is increase by at-least 15% from the current condition
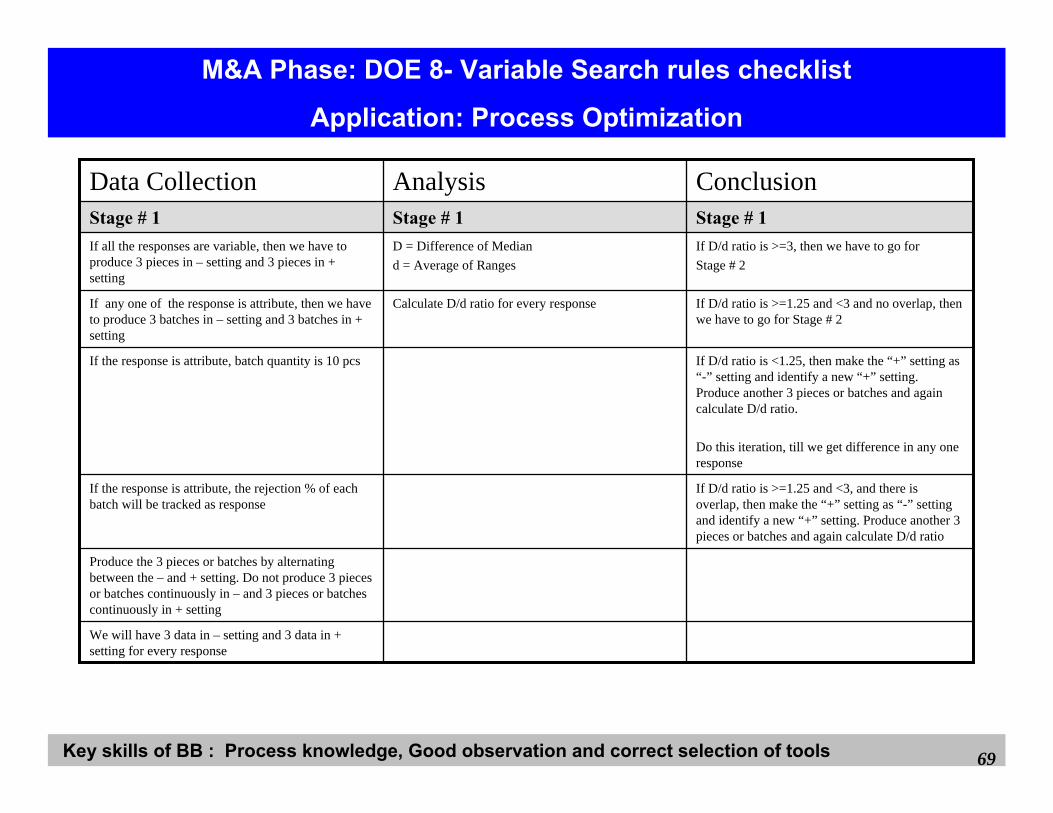
Key skills of BB : Process knowledge, Good observation and correct selection of tools 69
M&A Phase: DOE 8- Variable Search rules checklist
Application: Process Optimization
If D/d ratio is >=1.25 and <3, and there is overlap, then make the “+” setting as “-” setting and identify a new “+” setting. Produce another 3 pieces or batches and again calculate D/d ratio
If the response is attribute, the rejection % of each batch will be tracked as response
We will have 3 data in – setting and 3 data in + setting for every response
If D/d ratio is >=1.25 and <3 and no overlap, then we have to go for Stage # 2
Calculate D/d ratio for every responseIf any one of the response is attribute, then we have to produce 3 batches in – setting and 3 batches in + setting
Stage # 1Stage # 1Stage # 1
Produce the 3 pieces or batches by alternating between the – and + setting. Do not produce 3 pieces or batches continuously in – and 3 pieces or batches continuously in + setting
If D/d ratio is <1.25, then make the “+” setting as “-” setting and identify a new “+” setting. Produce another 3 pieces or batches and again calculate D/d ratio.
Do this iteration, till we get difference in any one response
If the response is attribute, batch quantity is 10 pcs
If D/d ratio is >=3, then we have to go for Stage # 2
D = Difference of Mediand = Average of Ranges
If all the responses are variable, then we have to produce 3 pieces in – setting and 3 pieces in + setting
ConclusionAnalysisData Collection
Key skills of BB : Process knowledge, Good observation and correct selection of tools 70
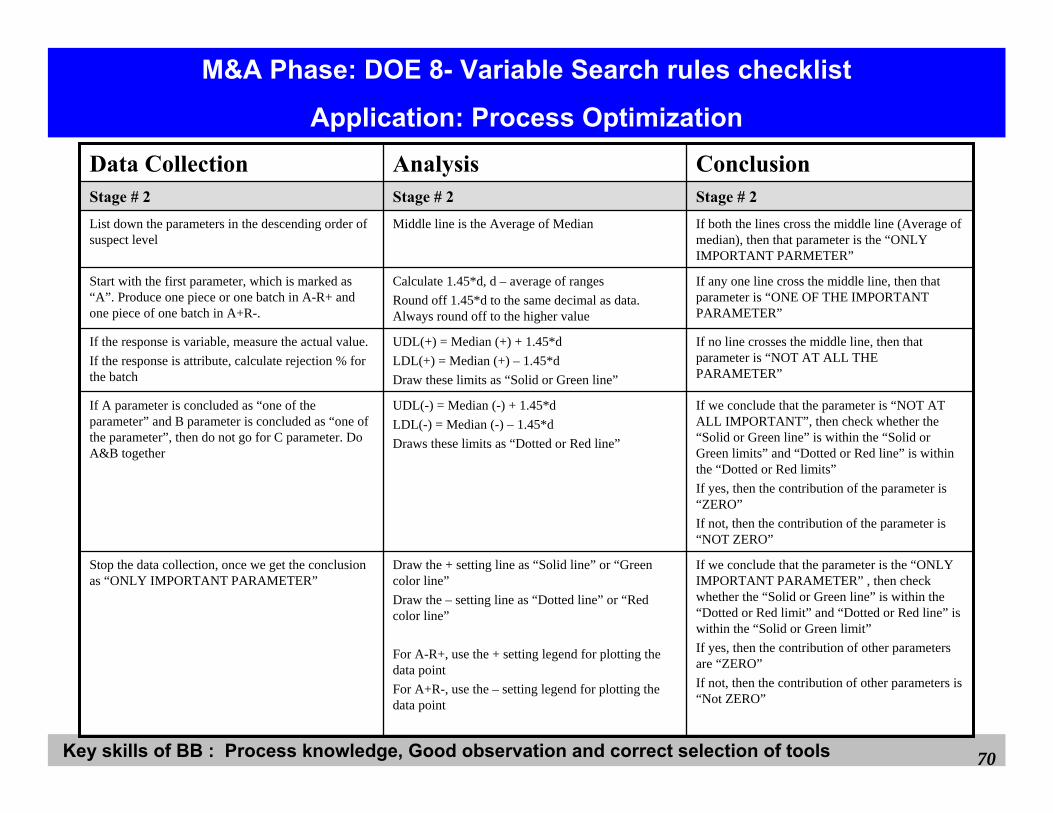
M&A Phase: DOE 8- Variable Search rules checklist
Application: Process Optimization
If we conclude that the parameter is “NOT AT ALL IMPORTANT”, then check whether the “Solid or Green line” is within the “Solid or Green limits” and “Dotted or Red line” is within the “Dotted or Red limits”If yes, then the contribution of the parameter is “ZERO”If not, then the contribution of the parameter is “NOT ZERO”
UDL(-) = Median (-) + 1.45*dLDL(-) = Median (-) – 1.45*dDraws these limits as “Dotted or Red line”
If A parameter is concluded as “one of the parameter” and B parameter is concluded as “one of the parameter”, then do not go for C parameter. Do A&B together
If any one line cross the middle line, then that parameter is “ONE OF THE IMPORTANT PARAMETER”
Calculate 1.45*d, d – average of rangesRound off 1.45*d to the same decimal as data. Always round off to the higher value
Start with the first parameter, which is marked as “A”. Produce one piece or one batch in A-R+ and one piece of one batch in A+R-.
Stage # 2Stage # 2Stage # 2
If we conclude that the parameter is the “ONLY IMPORTANT PARAMETER” , then check whether the “Solid or Green line” is within the “Dotted or Red limit” and “Dotted or Red line” is within the “Solid or Green limit”If yes, then the contribution of other parameters are “ZERO”If not, then the contribution of other parameters is “Not ZERO”
Draw the + setting line as “Solid line” or “Green color line”Draw the – setting line as “Dotted line” or “Red color line”
For A-R+, use the + setting legend for plotting the data pointFor A+R-, use the – setting legend for plotting the data point
Stop the data collection, once we get the conclusion as “ONLY IMPORTANT PARAMETER”
If no line crosses the middle line, then that parameter is “NOT AT ALL THE PARAMETER”
UDL(+) = Median (+) + 1.45*dLDL(+) = Median (+) – 1.45*dDraw these limits as “Solid or Green line”
If the response is variable, measure the actual value. If the response is attribute, calculate rejection % for the batch
If both the lines cross the middle line (Average of median), then that parameter is the “ONLY IMPORTANT PARMETER”
Middle line is the Average of MedianList down the parameters in the descending order of suspect level
ConclusionAnalysisData Collection
Key skills of BB : Process knowledge, Good observation and correct selection of tools 71
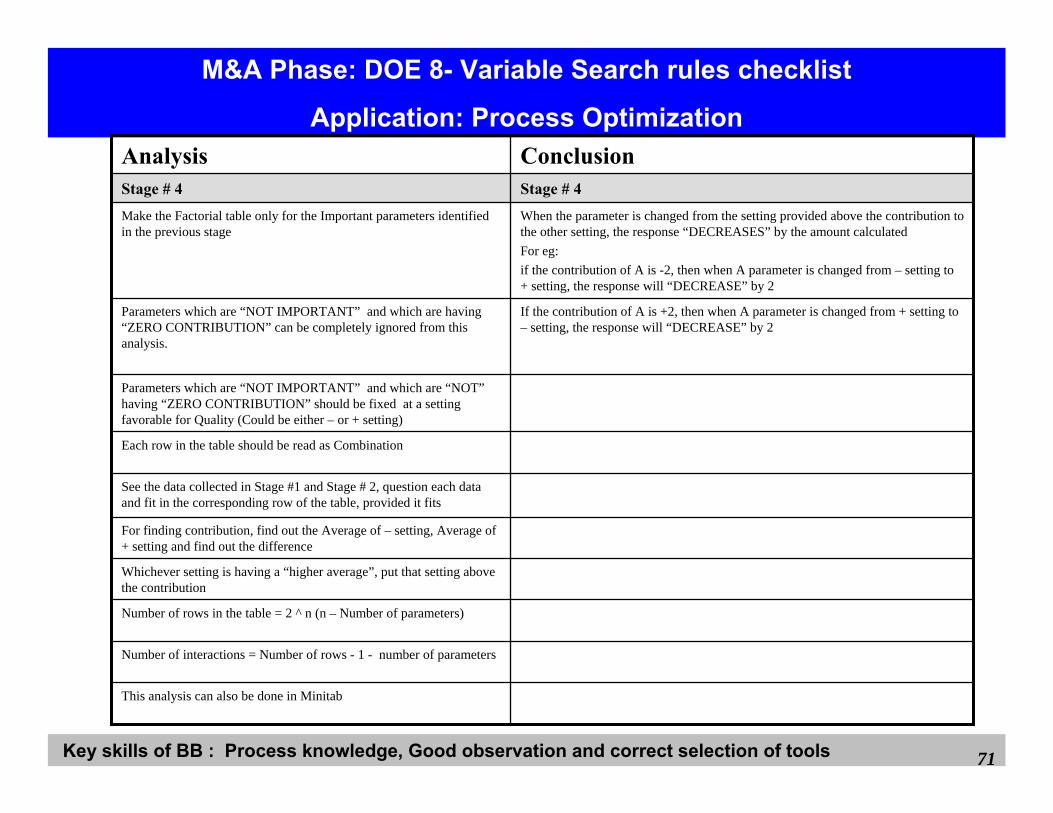
M&A Phase: DOE 8- Variable Search rules checklist
Application: Process Optimization
This analysis can also be done in Minitab
Number of interactions = Number of rows - 1 - number of parameters
Number of rows in the table = 2 ^ n (n – Number of parameters)
Whichever setting is having a “higher average”, put that setting above the contribution
For finding contribution, find out the Average of – setting, Average of + setting and find out the difference
Each row in the table should be read as Combination
If the contribution of A is +2, then when A parameter is changed from + setting to – setting, the response will “DECREASE” by 2
Parameters which are “NOT IMPORTANT” and which are having “ZERO CONTRIBUTION” can be completely ignored from this analysis.
Stage # 4Stage # 4
See the data collected in Stage #1 and Stage # 2, question each data and fit in the corresponding row of the table, provided it fits
Parameters which are “NOT IMPORTANT” and which are “NOT”having “ZERO CONTRIBUTION” should be fixed at a setting favorable for Quality (Could be either – or + setting)
When the parameter is changed from the setting provided above the contribution to the other setting, the response “DECREASES” by the amount calculatedFor eg: if the contribution of A is -2, then when A parameter is changed from – setting to + setting, the response will “DECREASE” by 2
Make the Factorial table only for the Important parameters identified in the previous stage
ConclusionAnalysis
Key skills of BB : Process knowledge, Good observation and correct selection of tools 72
M&A Phase: DOE 8- Variable Search rules checklist
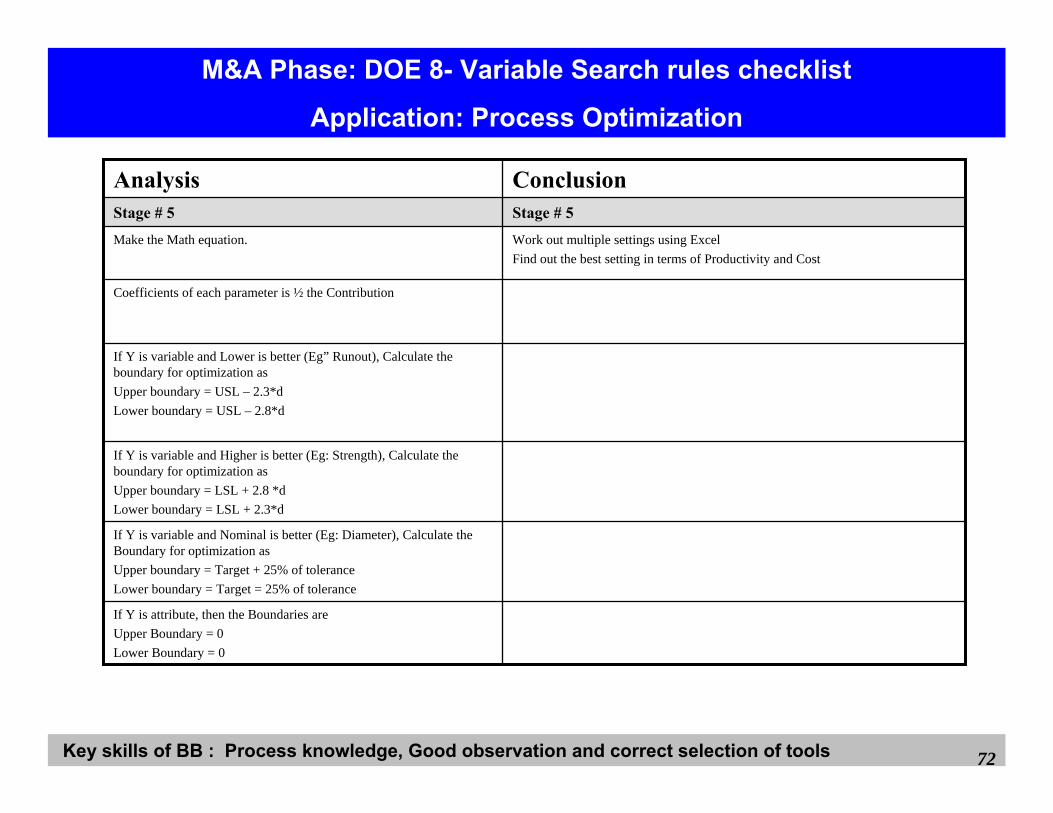
Application: Process Optimization
If Y is attribute, then the Boundaries areUpper Boundary = 0Lower Boundary = 0
If Y is variable and Higher is better (Eg: Strength), Calculate the boundary for optimization asUpper boundary = LSL + 2.8 *dLower boundary = LSL + 2.3*d
Coefficients of each parameter is ½ the Contribution
Stage # 5Stage # 5
If Y is variable and Nominal is better (Eg: Diameter), Calculate the Boundary for optimization asUpper boundary = Target + 25% of toleranceLower boundary = Target = 25% of tolerance
If Y is variable and Lower is better (Eg” Runout), Calculate the boundary for optimization asUpper boundary = USL – 2.3*dLower boundary = USL – 2.8*d
Work out multiple settings using ExcelFind out the best setting in terms of Productivity and Cost
Make the Math equation.
ConclusionAnalysis
Key skills of BB : Process knowledge, Good observation and correct selection of tools 73
DOE Tool 9
Full Factorial

Key skills of BB : Process knowledge, Good observation and correct selection of tools 74
M&A Phase DOE 9 – Full Factorial
Application:• Is used when design parameters are <=3.
• Is used for Problem solving as well as Existing process optimization.
Note: Difference from Variable Search
In variable search , factorial table is constructed only for significant parameters while in Full Factorial , it is constructed for the all parameters identified.
In this tool, Stage # 2 of Variable search is not done, and the factorial table is made directly and data is collected. Rest of the procedure is same
Key skills of BB : Process knowledge, Good observation and correct selection of tools 75
DOE Tool 10
Variation analysis

Key skills of BB : Process knowledge, Good observation and correct selection of tools 76
Control Phase DOE 10 – Variation Analysis
Application:• Is used to identify the type of controls (monitoring method) that are
required for the action implemented so that the problem does not recur again due to the same root cause.
• Is done only when Product dimensions are the root cause for the problem
• Five options of the control methods are
• No inspection
• Pre-control chart
• X-bar and Range chart with sampling inspection
• X-bar and Range chart with 100% inspection
• Only 100% inspection
• Is used to prove that “Six Sigma ( Estimated part to part variation) ”is 50% of the tolerance if the Big Y is “Variable”.
Key skills of BB : Process knowledge, Good observation and correct selection of tools 77
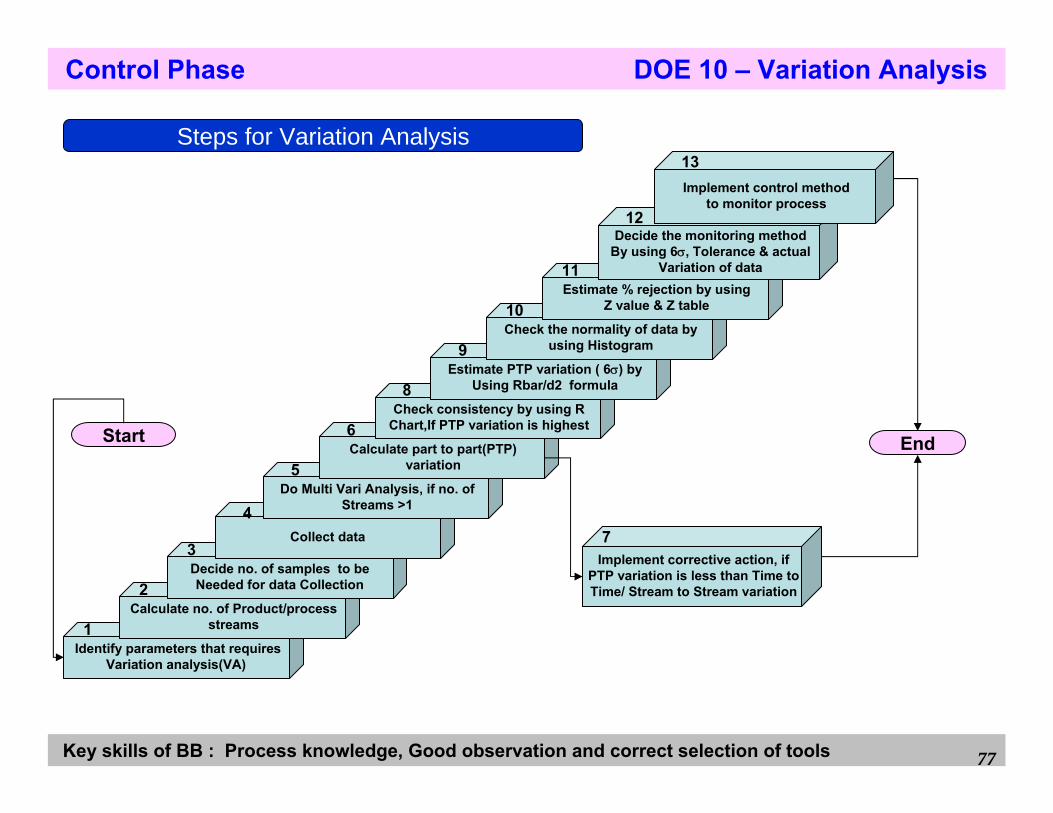
Control Phase DOE 10 – Variation Analysis
Steps for Variation Analysis
Identify parameters that requiresVariation analysis(VA)
Calculate no. of Product/processstreams
Decide no. of samples to be Needed for data Collection
Collect data
Do Multi Vari Analysis, if no. ofStreams >1
Calculate part to part(PTP)variation
Check consistency by using RChart,If PTP variation is highest
Estimate PTP variation ( 6σ) byUsing Rbar/d2 formula
Check the normality of data byusing Histogram
Estimate % rejection by usingZ value & Z table
Decide the monitoring methodBy using 6σ, Tolerance & actual
Variation of data
Implement control methodto monitor process
Implement corrective action, ifPTP variation is less than Time toTime/ Stream to Stream variation
1
2
3
4
5
6
7
8
9
10
11
12
13
Start End
Key skills of BB : Process knowledge, Good observation and correct selection of tools 78
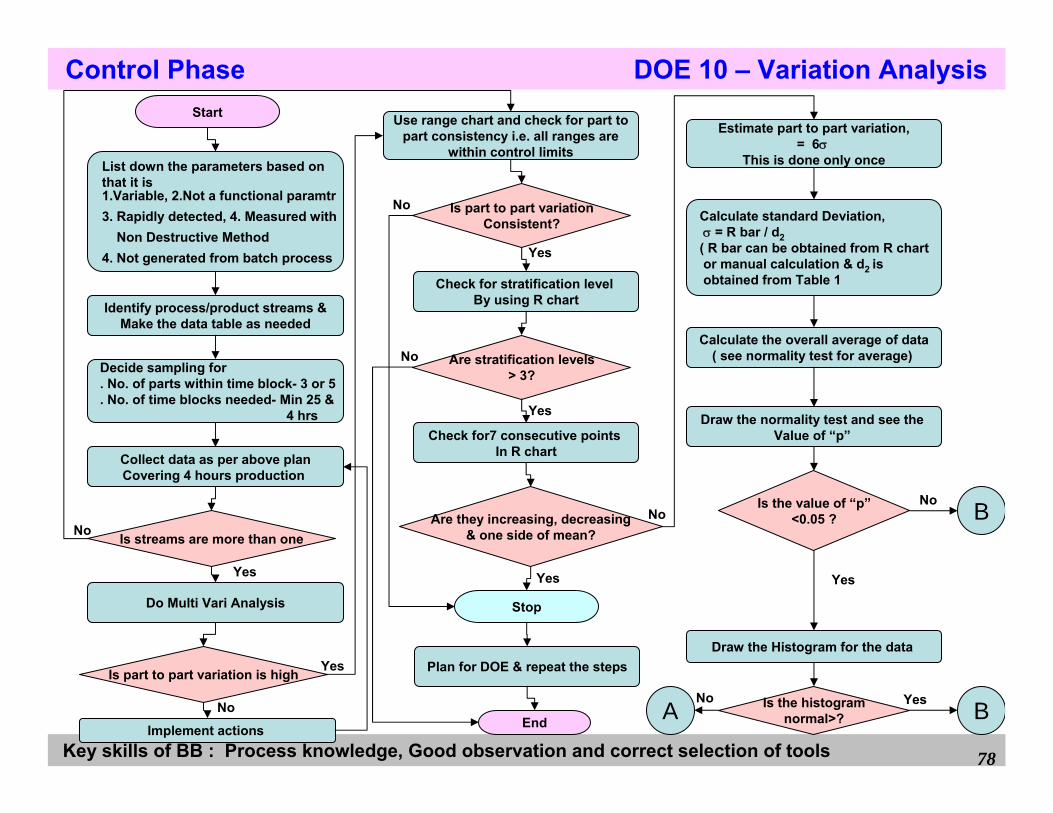
Start
List down the parameters based onthat it is1.Variable, 2.Not a functional paramtr3. Rapidly detected, 4. Measured with
Non Destructive Method4. Not generated from batch process
Is part to part variation is high
Identify process/product streams &Make the data table as needed
Decide sampling for . No. of parts within time block- 3 or 5. No. of time blocks needed- Min 25 &
4 hrs
Collect data as per above planCovering 4 hours production
Calculate standard Deviation,σ = R bar / d2 ( R bar can be obtained from R chartor manual calculation & d2 isobtained from Table 1
Is streams are more than one
Do Multi Vari Analysis
Estimate part to part variation,= 6σ
This is done only once
Use range chart and check for part topart consistency i.e. all ranges are
within control limits
Is part to part variationConsistent?
Check for stratification level By using R chart
Are stratification levels> 3?
Check for7 consecutive points In R chart
Are they increasing, decreasing& one side of mean?
Calculate the overall average of data( see normality test for average)
Stop
Is the value of “p”<0.05 ?
Draw the normality test and see the Value of “p”
B
Draw the Histogram for the data
Is the histogramnormal>? BA
Plan for DOE & repeat the steps
EndImplement actions
Yes
Yes
Yes
Yes
Yes Yes
Yes
No
No
No
No
NoNo
No
Control Phase DOE 10 – Variation Analysis

Key skills of BB : Process knowledge, Good observation and correct selection of tools 79
B
Collect or calculate . Average of data. Sigma( σ ) . Six Sigma ( 6σ ) . USL & LSL. Tolerance
Calculate . ZUSL = ( USL-AVERAGE) / Sigma
. ZLSL.= ( LSL-AVERAGE) / Sigma
Calculate from Z table. % rejection at ZUSL
. % rejection at ZLSL
Calculate Total % Rejection
= % reje. at ZUSL+ % reje at ZLSL
Calculate Cpk. Cpk for USL= ZUSL / 3
. Cpk for LSL= ZLSL / 3
Is 6σ ≤ 75% of Tolerance ?
Is 6σ >75% & ≤ 100% of Tolerance ?
Is actual part to partVariation ≤ 50% of Tolerance ?
Use Pre-Control ChartFor monitoring
Use X bar & R ChartFor monitoring
Use X bar & R ChartWith 100% inspection
For monitoring
Do 100% inspection
Use DOE to reducevariation
End
Is Tolerance known orgiven ? C
Yes
Yes
Yes
Yes
No
No
No
No
2.53462.32652.0594
1.69331.1282
d2Sample size
Table-1
It means 6σ > Tolerance
Control Phase DOE 10 – Variation Analysis
Key skills of BB : Process knowledge, Good observation and correct selection of tools 80
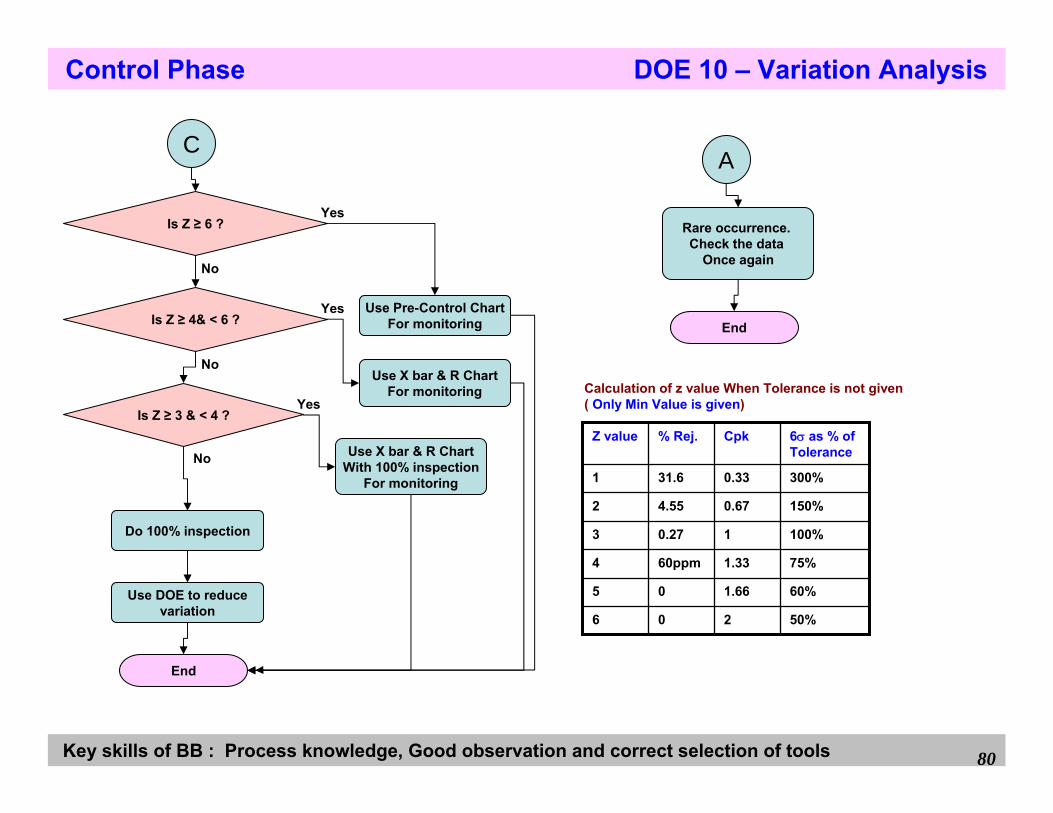
Is Z ≥ 6 ?
Is Z ≥ 4& < 6 ?
Is Z ≥ 3 & < 4 ?
Use Pre-Control ChartFor monitoring
Use X bar & R ChartFor monitoring
Do 100% inspection
Use DOE to reducevariation
End
Yes
Yes
Yes
No
No
No
C
Use X bar & R ChartWith 100% inspection
For monitoring
A
Rare occurrence. Check the data
Once again
End
Calculation of z value When Tolerance is not given ( Only Min Value is given)
50%206
60%1.6605
75%1.3360ppm4
100%10.273
150%0.674.552
300%0.3331.61
6σ as % of Tolerance
Cpk% Rej.Z value
Control Phase DOE 10 – Variation Analysis
Key skills of BB : Process knowledge, Good observation and correct selection of tools 81
DOE Tool 11
R&R study
Key skills of BB : Process knowledge, Good observation and correct selection of tools 82
Define Phase DOE 11 – R&R Study
Application:• Is used when there is variation due to method of checking by a
person
• Within person variation is termed as “Repeatability” and is equal to part to part variation. It is also called “Within Person Variation”
• Between person variation is termed as “Reproducibility” and is equal to time to time variation. It is also called “Person to Person Variation ”.
• This study is done only once to find out the variation due to the method of checking
• Variation Analysis DOE tool is used to do R&R study.
Key skills of BB : Process knowledge, Good observation and correct selection of tools 83
Define Phase DOE 11 – R&R Study
Repeatability:• The variation in measurements obtained with one instrument when
used several times by one operator while measuring the identicalcharacteristic on same part. This is within person variation.
Reproducibility:• The variation in the average of measurements obtained with one
instrument when used several times by different operator while measuring the identical characteristic on same part. This is person to person variation.
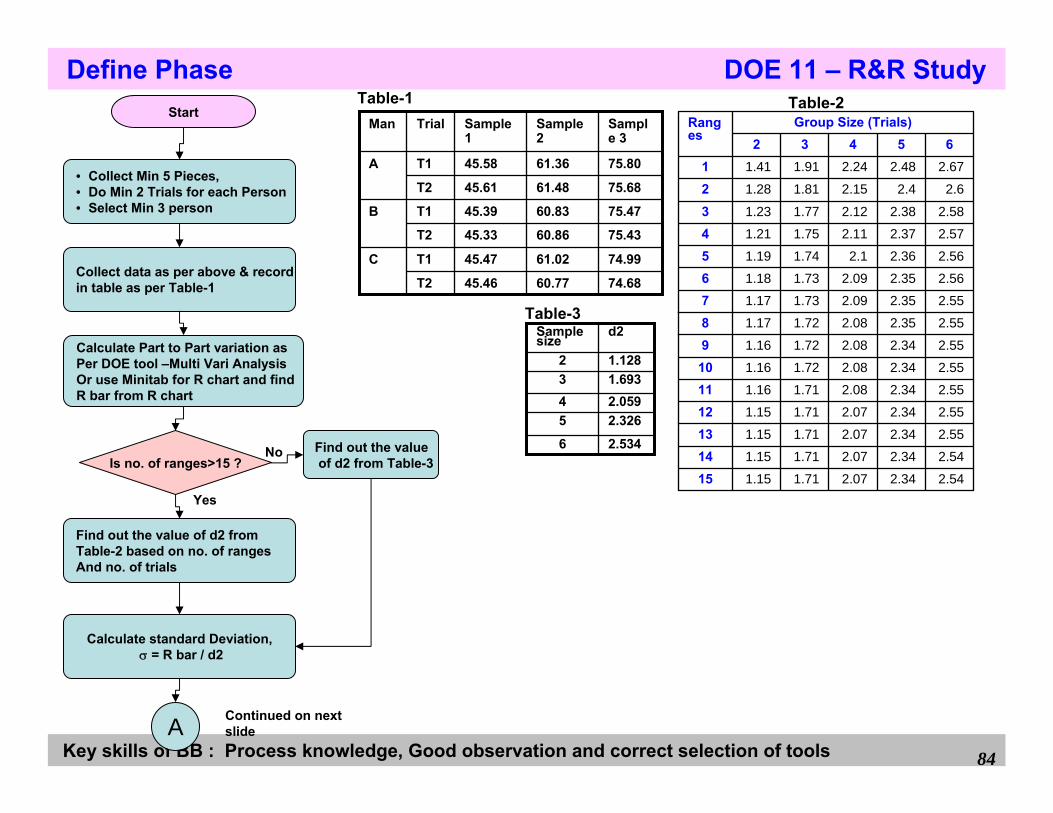
Key skills of BB : Process knowledge, Good observation and correct selection of tools 84
Start
• Collect Min 5 Pieces,• Do Min 2 Trials for each Person• Select Min 3 person
Collect data as per above & recordin table as per Table-1
Calculate Part to Part variation asPer DOE tool –Multi Vari AnalysisOr use Minitab for R chart and find R bar from R chart
Is no. of ranges>15 ?2.5346
2.32652.05941.69331.1282
d2Sample size
Table-2
74.6860.7745.46T2
74.9961.0245.47T1C
75.4360.8645.33T2
75.4760.8345.39T1B
75.6861.4845.61T2
75.8061.3645.58T1A
Sample 3
Sample 2
Sample 1
TrialMan
Table-1Define Phase DOE 11 – R&R Study
2.542.342.071.711.15152.542.342.071.711.15142.552.342.071.711.15132.552.342.071.711.15122.552.342.081.711.16112.552.342.081.721.16102.552.342.081.721.1692.552.352.081.721.1782.552.352.091.731.1772.562.352.091.731.1862.562.362.11.741.1952.572.372.111.751.2142.582.382.121.771.2332.62.42.151.811.282
2.672.482.241.911.41165432
Group Size (Trials)Ranges
Find out the value of d2 from Table-2 based on no. of rangesAnd no. of trials
Find out the valueof d2 from Table-3
Calculate standard Deviation,σ = R bar / d2
Table-3
A Continued on next slide
No
Yes
Key skills of BB : Process knowledge, Good observation and correct selection of tools 85
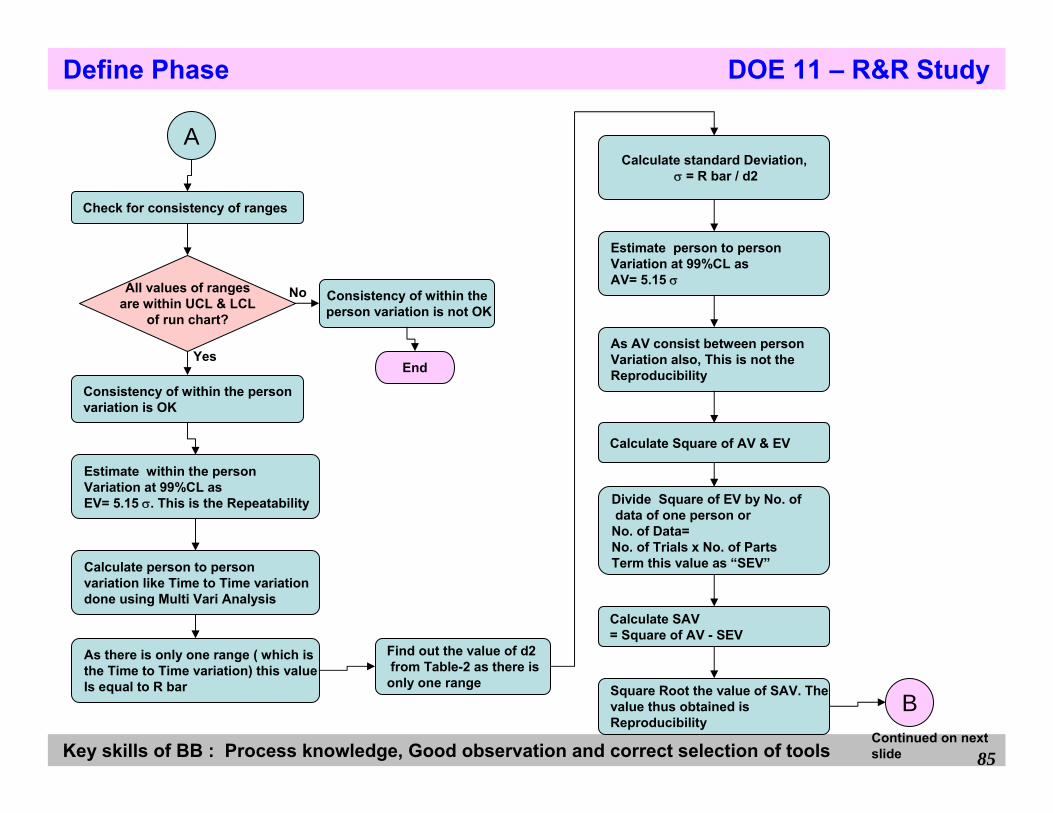
A
Define Phase DOE 11 – R&R Study
Check for consistency of ranges
Consistency of within the personvariation is OK
All values of rangesare within UCL & LCL
of run chart?
Consistency of within theperson variation is not OK
End
Estimate within the personVariation at 99%CL asEV= 5.15 σ. This is the Repeatability
Calculate person to personvariation like Time to Time variationdone using Multi Vari Analysis
As there is only one range ( which isthe Time to Time variation) this valueIs equal to R bar
Find out the value of d2from Table-2 as there is only one range
Calculate standard Deviation,σ = R bar / d2
Estimate person to personVariation at 99%CL asAV= 5.15 σ
As AV consist between person Variation also, This is not theReproducibility
Calculate Square of AV & EV
Divide Square of EV by No. ofdata of one person orNo. of Data= No. of Trials x No. of PartsTerm this value as “SEV”
Calculate SAV = Square of AV - SEV
Square Root the value of SAV. The value thus obtained is Reproducibility
BContinued on next slide
No
Yes
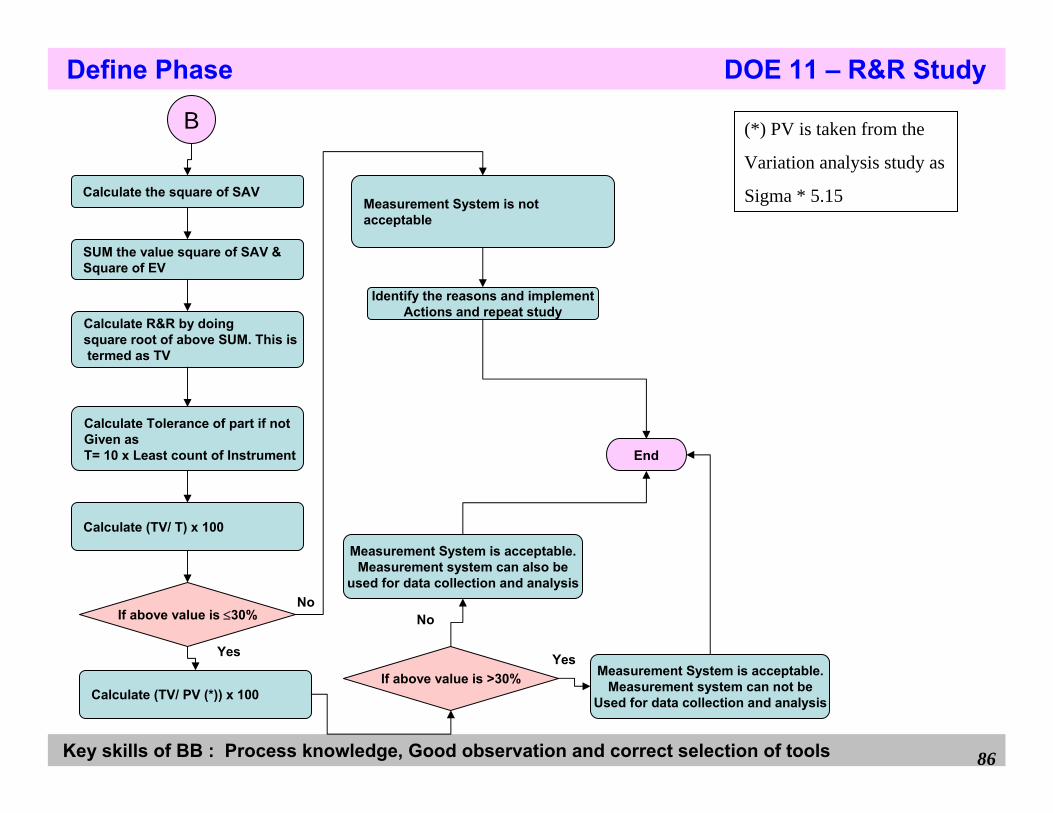
Key skills of BB : Process knowledge, Good observation and correct selection of tools 86
B
Define Phase DOE 11 – R&R Study
Calculate the square of SAV
End
Calculate Tolerance of part if not Given asT= 10 x Least count of Instrument
Calculate (TV/ T) x 100
SUM the value square of SAV &Square of EV
Calculate R&R by doing square root of above SUM. This istermed as TV
If above value is ≤30%
Measurement System is not acceptable
Identify the reasons and implementActions and repeat study
No
YesMeasurement System is acceptable.
Measurement system can not beUsed for data collection and analysis
If above value is >30%Calculate (TV/ PV (*)) x 100
Measurement System is acceptable.Measurement system can also be
used for data collection and analysis
(*) PV is taken from the
Variation analysis study as
Sigma * 5.15
Yes
No
Key skills of BB : Process knowledge, Good observation and correct selection of tools 87
DOE Tool 12
Instrument Calibration
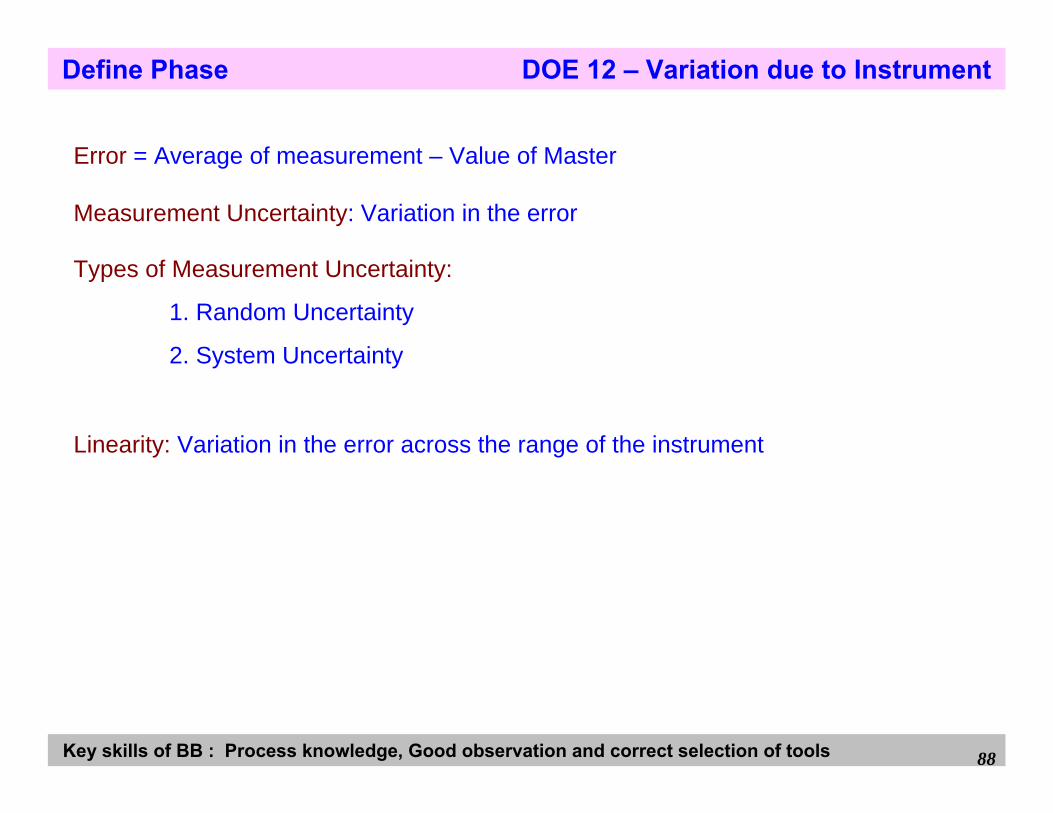
Key skills of BB : Process knowledge, Good observation and correct selection of tools 88
Define Phase DOE 12 – Variation due to Instrument
Error = Average of measurement – Value of Master
Measurement Uncertainty: Variation in the error
Types of Measurement Uncertainty:
1. Random Uncertainty
2. System Uncertainty
Linearity: Variation in the error across the range of the instrument
Key skills of BB : Process knowledge, Good observation and correct selection of tools 89
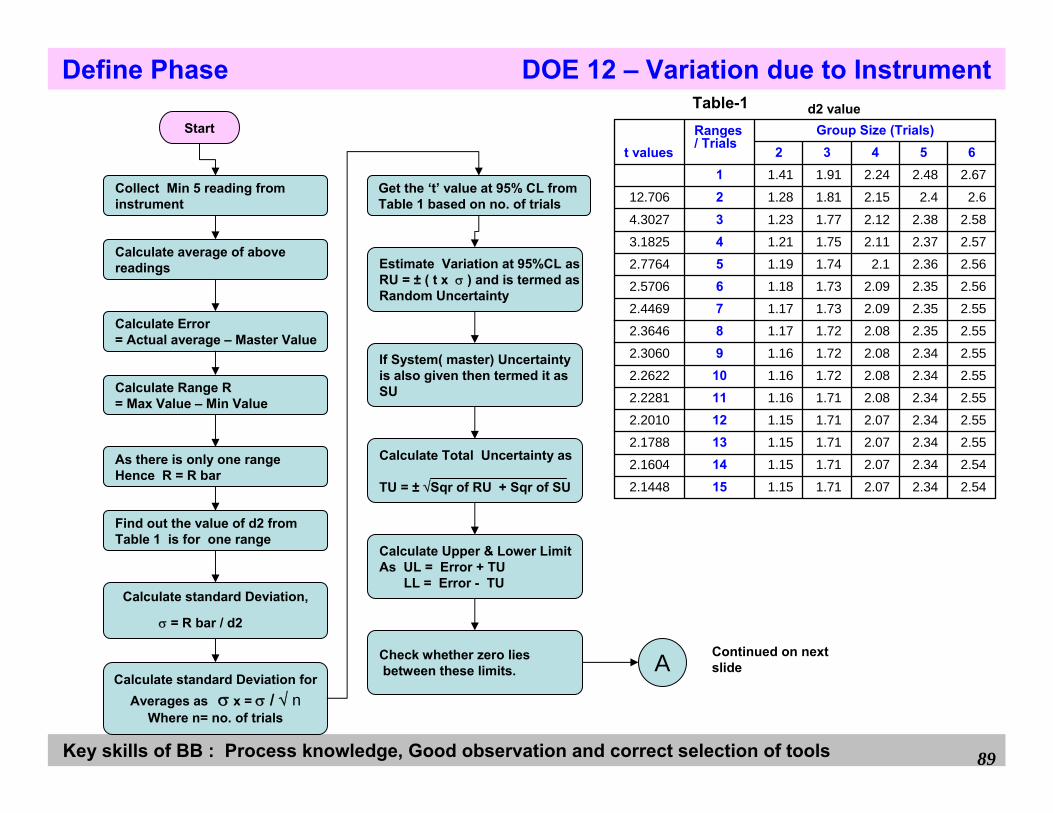
Start
Collect Min 5 reading from instrument
Define Phase DOE 12 – Variation due to Instrument
Calculate average of abovereadings
Calculate Error = Actual average – Master Value
Calculate Range R= Max Value – Min Value
As there is only one rangeHence R = R bar
Find out the value of d2 from Table 1 is for one range
Table-1
2.1448
2.1604
2.1788
2.2010
2.2281
2.2622
2.3060
2.3646
2.4469
2.5706
2.7764
3.1825
4.3027
12.706
t values
2.542.342.071.711.15152.542.342.071.711.15142.552.342.071.711.15132.552.342.071.711.15122.552.342.081.711.16112.552.342.081.721.16102.552.342.081.721.1692.552.352.081.721.1782.552.352.091.731.1772.562.352.091.731.1862.562.362.11.741.1952.572.372.111.751.2142.582.382.121.771.2332.62.42.151.811.282
2.672.482.241.911.41165432
Group Size (Trials)Ranges/ Trials
d2 value
Calculate standard Deviation,
σ = R bar / d2
Calculate standard Deviation forAverages as σ x = σ / √ n
Where n= no. of trials
Get the ‘t’ value at 95% CL fromTable 1 based on no. of trials
Estimate Variation at 95%CL asRU = ± ( t x σ ) and is termed asRandom Uncertainty
If System( master) Uncertaintyis also given then termed it asSU
Calculate Total Uncertainty as
TU = ± √Sqr of RU + Sqr of SU
Calculate Upper & Lower LimitAs UL = Error + TU
LL = Error - TU
Check whether zero liesbetween these limits. A Continued on next
slide

Key skills of BB : Process knowledge, Good observation and correct selection of tools 90
If “0” lies between limits
Error is not Zero & Instrument can notbe used
Error is Zero
A
Calculate tolerance T
Calculate (TU/ T)x100
If % < 25%
Uncertainty is acceptable& instrument can be used.
Uncertainty is not acceptable
Define Phase DOE 12 – Variation due to Instrument
End
No
No
Yes
Yes