Embed Size (px)
Citation preview

Impacts of Climate Change on Urban Infrastructure & the Built Environment
A Toolbox
Tool 2.4.1: Climate change and urban
drainage modelling – data, issues and
assumptions
Author
A. Semadeni-Davies1
Affiliation
1 NIWA, Private Bag 99940, Auckland
Contents
1. Introduction 1
1.1 Urban drainage modelling and climate change impact assessment 1
2. Urban Drainage Model Choice 2
3. Scenario development 4
3.1 Climate change scenarios 4
3.1.1 Extreme rainfalls (design-storms) 4
3.1.2 Long-term continuous rainfall 6
3.1.3 Simulation length 8
3.2 Urbanisation scenarios 8
3.2.1 Urban water management story-lines 9
3.2.2 Land use and surface hydrology parameters 11
3.2.3 Drainage network parameters 12
3.2.4 Boundary conditions 13
4. Spatial representation 13
5. Stormwater quality 14
6. Conclusion 16
References 16
All rights reserved. The copyright and all other intellectual property rights in this
report remain vested solely in the organisation(s) listed in the author affiliation list.
The organisation(s) listed in the author affiliation list make no representations or
warranties regarding the accuracy of the information in this report, the use to which this
report may be put or the results to be obtained from the use of this report. Accordingly the
organisation(s) listed in the author affiliation list accept no liability for any loss or
damage (whether direct or indirect) incurred by any person through the use of or reliance
on this report, and the user shall bear and shall indemnify and hold the organisation(s)
listed in the author affiliation list harmless from and against all losses, claims, demands,
liabilities, suits or actions (including reasonable legal fees) in connection with access and
use of this report to whomever or how so ever caused.

Tool 2.4.1: Urban drainage modelling – data, issues and assumptions 1
1. Introduction
The Ministry for the Environment Climate Change Guidance Manual (MfE, 2008)
provides climate change risk assessment guidelines for council core services and
functions, including urban water management, to determine the need for adaptation
and also to test alternative adaptation strategies. This tool reviews the issues and
assumptions involved in urban drainage modelling to determine the possible impacts
of climate change and their associated risk. Typical model applications include flood
hazard mapping and evaluating waste- and stormwater network capacity. The
objectives of this tool are to provide local government guidance regarding:
The choice of urban drainage models with respect to purpose;
The choice and use of climate change scenarios; and
Representation of urban development and change in water management
practices.
Examples of urban drainage models which have been applied to Auckland, including a
discussion of how the issues addressed in Section 1.1 were handled, are provided in
Tools 2.4.2 (Current Practices), 2.4.3 (Guidelines) and 2.4.4 (North Shore City waste
water simulation).
1.1 Urban drainage modelling and climate change impact assessment
Most urban climate change risk and impact assessments for stormwater management
to date have concentrated on the need for quantity control to limit the risks of flooding
or combined sewer overflows due to increased rainfall intensity, and, in some cases,
land use change (e.g., Arnbjerg-Nielsen and Mikkelsen, 2009; Arnbjerg-Nielsen and
Fleischer, 2009; Kleidorfer et al., 2009; Semadeni-Davies et al. 2008 a and b; Denault
et al., 2006; Ashley et al., 2005). Examples from Auckland relevant to this case study
include:
Wastewater flows in North Shore (Lockie and Brown, 2010)
- overviewed in Tool 2.4.4;
Capacity of the stormwater system in the Wairau Valley (Shaw et al.
2005) - overviewed in Tool 2.4.3;
Metrowater / Auckland City Integrated Catchment Study (ICS)
investigation of climate change impacts on stormwater flows and

Tool 2.4.1: Urban drainage modelling – data, issues and assumptions 2
flood risk (Kinley et al., 2007, Dayananada et al., 2005) - overviewed
in Tool 2.4.2;
ARC flood hazard mapping for Papakura (not yet published at the
time of writing); and
Regional flood hazard mapping in the Auckland Region (e.g., van
Kalken et al., 2009; Roberts and van Kalken, 2010) - overviewed in
Tool 2.4.2.
In addition, Davis et al. (2010) have recently reviewed the studies of flood risk under
climate change for the Auckland Region to illustrate how the methodologies used have
changed over the past decade as the information on climate change and assessment
tools available has improved.
2. Urban Drainage Model Choice
Huber and Dickinson (1988) state that urban drainage models can be generalised
according to their primary purpose as follows:
- Screening models, which provide immediate insight into the magnitude of
problems expected from a certain site or catchment, that is, problem
identification.
- Planning models, which are comprehensive enough to give an overall
assessment of system performance and trade-offs for a range of alternative
stormwater solutions, but are simple to use and have low data requirements.
Planning implies a forward-looking process to analyse “what-if” scenarios.
- Design models focus of specific details of different drainage components
(e.g., size and configuration) within the network as a whole. Design models
should not be confused with tools for the design of individual components
which follow set criteria.
- Operational models are intended for everyday running of the drainage
system (e.g., real time control).
The boundaries between these model types are not fast and some models can be used
for several purposes. With respect to climate change impact assessment, the model
chosen should be robust over the range of projected climatic and hydrological
conditions. Model choice should reflect the purpose of the assessment as well as data
availability; that is, the routines included, time-step and spatial representation should

Tool 2.4.1: Urban drainage modelling – data, issues and assumptions 3
all be compatible with the scale of the processes under investigation. The study
purpose will also dictate whether the model is run long-term (i.e., continuously) or
over a discrete event such as a historical rainfall or design-storm.
To illustrate, compare the modelling needs for assessing the number and volume of
sewer overflows against flood hazard mapping. Both tasks require hydrologic and
hydraulic modelling, however, the processes simulated and the level of detail required
differ. The former modelling task will require a hydraulic model of the sewer system,
but may only need a simple surface runoff generation model (see Lockie and Brown,
2010, overviewed in Tool 2.4.4). The latter task would require complex surface flow
routines and detailed topological data but may have a simplified representation of the
pipe network or simulate only surface flows with a constant abstraction rate to account
for losses to the pipe network (see Davis et al, 2010, overviewed in Tool 2.4.2).
Moreover, while the models would have a similar time-step, simulation with a long-
term rainfall time-series would be favoured for the first application and extreme
rainfall events for the second.
Urban drainage models available in New Zealand include the US EPA models
SWMM and SUSTAIN, the Australian MUSIC model (CRCCH, 2005),
INFOWORKS (Wallingford Software) and MOUSE / MIKE URBAN (Danish
Hydrological Institute, DHI). SWMM, INFOWORKS and MIKE URBAN have
primarily been designed for hydraulic simulation of flows in sewers, although they do
have surface water hydrological routines for routing water to the pipe network as well
as detention and pollution transport modules. While these models have been used for
planning and design applications, they are generally operational models. MIKE
URBAN and SWMM have been applied in a number of the climate change impact
assessments cited above. SUSTAIN and MUSIC also simulate the pipe network, but
have been developed largely as planning tools with a focus on surface drainage
infrastructure for low impact urban design and water treatment. All the models have
GIS functionality.
Models which have been used for climate change impact assessment in urban
catchments in relation to flood risk assessment include the DHI MIKE-SHE (surface
hydrology, ground water), MIKE 11 (channel flow) and MIKE 21 (2D dynamic flow)
as well as AUDACIOUS (Adaptable Urban Drainage - Addressing Change In
Intensity, Occurrence And Uncertainty of Stormwater; Ashley et al., 2008). The DHI
models can be coupled together; MIKE 11, MIKE 21 and MIKE Urban are
collectively known as MIKE FLOOD (see the description of the Auckland Rapid
Flood Hazard Mapping programme in Tool 2.4.2 for an example). AUDACIOUS was
purpose-developed in the UK for planning and evaluating adaptation strategies to
mitigate urban flood risk at different spatial scales (building, neighbourhood and
catchment) due to climate change. The AUDACIOUS package includes tools (i.e.,

Tool 2.4.1: Urban drainage modelling – data, issues and assumptions 4
rainfall estimates and model modules), guidance and procedures for flood risk
assessment.
It is noted that urban drainage models are complex, have intensive data needs, long
set-up and run times, and require users to have advanced modelling expertise.
Consequently, they are expensive to set-up and run, and this can limit the number of
scenarios that can be simulated for climate change impact assessment.
3. Scenario development
3.1 Climate change scenarios
The main drivers associated with climate change in urban areas are rainfall, especially
rainfall extremes, and sea level rise in coastal areas. While evapotranspiration is also
a consideration, it is a relatively minor part of the urban water balance which is
dominated by flows from impervious surfaces. This section outlines the rainfall
requirements for urban water modelling. Guidance on the adjustment of rainfall data
for urban drainage modelling in the Auckland area can be found in
3.1.1 Extreme rainfalls (design-storms)
MfE guidance (2008, 2010) recommends event-based modelling sing adjusted rainfall
extremes as part of risk assessment preliminary screening. The method (overviewed
in Tool 2.4.3) adjusts rainfall extremes according to the average annual temperature
increase. Screening should be carried out for a range of climate projections. If the
screening indicates high sensitivity, continuous modelling may be warranted.
The concept of hypothetical design-storms to represent extreme rainfalls is very
familiar to urban drainage engineers and is used for design (e.g. ARC, 2003 for the
Auckland Region) as well as assessment of drainage infrastructure and evaluation of
flood depth and extent. Design-storms are characterised by their Intensity-Duration-
Frequency (IDF) relationship whereby for a given event duration, rainfalls with the
greatest intensity occur least often. Design-storms are referred to either by their
average recurrence interval (ARI) or annual exceedence probability (AEP) which is
the probability that an event of a given duration and depth will be exceeded in a given
year. The AEP is related to the ARI as:
ARIAEP
1exp1

Tool 2.4.1: Urban drainage modelling – data, issues and assumptions 5
The 1% AEP event is equivalent to the 100-year rainfall. The terms ARI and AEP are
also applied to the frequency of floods events. While it is often assumed that a rainfall
with a particular ARI will result in a flood event with the same ARI, the depth and
extent of runoff generated by a rainfall event is highly dependant on antecedent
catchment conditions.
For Auckland, regional design rainfall maps for the 2, 5, 10, 20, 50 and 100-year ARIs
are provided in TP 108 (ARC, 1999). TP108 also gives guidance on how to distribute
the rainfall depth temporally over the duration period and provides methods for
determining surface runoff generation. The hyetograph chosen is a modification of the
Chicago hyetograph which accounts for changes in rainfall intensity over the event.
Post Auckland Council amalgamation, TP108 is currently under review and it is
anticipated that there will be a recommendation to apply the MfE (2008) adjustments
with a projected annual temperature increase of 2.1°C in the new document (personal
communication: Bodo Hellberg, Auckland Council). It should also be pointed out that
other council water management guidelines currently under preparation, such as the
Auckland Council Stormwater Flood Modelling Specifications (2011; personal
communication: Nick Brown), are likely to contain the same recommendation.
Design rainfalls are also available from the High Intensity Rainfall Design System
(HIRDS; Thompson, 2002) developed by the National Institute of Water and
Atmospheric Research (NIWA). The tool is now available online
(http://hirds.niwa.co.nz) and returns design storms for any location in New Zealand.
HIRDS automatically applies the MfE (2008) adjustments for climate change given
user specified changes in mean annual temperature.
Several examples from Auckland which demonstrate the use of adjusted design storms
for climate change impact assessments are overviewed in Tools 2.4.2 and 2.4.3.
International examples include Arnbjerg-Nielsen and Fleischer (2009); He et al,
(2006); Denault et al (2006) and Watt et al. (2003).
One of the failings of adjusted design storms is the implication that there is no change
in the frequency of extreme events, rather, only the intensity of those events increases.
However, increases in rainfall could also result from no change in rainfall intensity,
but an increase in the total number of events; or a skew in the rainfall distribution with
more frequent high intensity events and fewer low intensity events. Moreover, the
hyetograph chosen may not be representative of the actual rainfall distribution over
observed extreme rainfalls which can have a profound impact on runoff calculations.
This possibility led Metrowater to run their risk assessment for both historical events
and also TP108 design storms (see Tool 2.4.2 for details). Even without the added
complication of climate change, problems with the use of designs-storm in urban
water management are well recognised (e.g., USEPA: Clar et al., 2004), and there
Tool 2.4.1: Urban drainage modelling – data, issues and assumptions 6
have been calls for continuous simulation models be used to aid design (e.g., Newman
et al., 2000; Palmstrom and Walker, 1990).
3.1.2 Long-term continuous rainfall
Simulating a continuous rainfall record corresponding to future climate change
scenarios with a suitable spatial resolution and time-step remains a major challenge for
urban drainage modelling. Urban drainage processes occur at scales of metres and
minutes (e.g., Schilling, 1991); however, climate change projections are typically
regional and seasonal requiring spatial downscaling and temporal disaggregation. The
discordant scales mean that urban process must be scaled-up whereas climate
projections must be scaled-down. Either way, scaling is likely to increase model
uncertainty.
There are four alternatives for obtaining long-ter, continuous rainfall records under
climate change:
1. Adjusting historical records according to projected percentage changes in
rainfall (the delta-change method);
2. Creating an artificial rainfall record with the same statistical characteristics as
the historical rainfall record adjusted for climate change;
3. Directly using the outputs of a regional climate model; or
4. Using rainfall data from a region with a similar climate to that projected as an
analogue
The first three methods are discussed in more detail below; the final method is not
common in hydrological modelling as it can be difficult to find suitable analogues.
The Delta-Change Method
The delta-change method empirically adjusts historic rainfall on the basis of projected
changes in rainfall, either absolute (observations vs. future projections) or comparative
(climate model simulated present vs. future projections). The percentage change or
anomaly between current and future projected rainfall is applied to the historic record.
The method can be refined by applying delta-change coefficients monthly, seasonally
or according to some ranking of rainfall (e.g., percentile groupings). The advantage of
the delta-change method is its simplicity, that is, no manipulation of climate model
output data is required. Since an existing data set forms the basis of the
transformation, the impact of climate change on individual rain events and the
response of the hydrological system to those events can be compared. In the strictest

Tool 2.4.1: Urban drainage modelling – data, issues and assumptions 7
sense, the method should only be applied to observations with similar spatial and
temporal resolutions to avoid over-generalising trends seen in the climate model. For
example, a change in monthly rainfall projected by a climate model could equally
imply changes to either the frequency or intensity of events in that month, or a
combination of both. However, in practice, delta-change has been used to adjust
higher resolution observations for climate change in order to carry out hydrological
impact assessments.
A delta-change approach is suggested in MfE (2010) which adjusts daily rainfall
records for use in flood risk assessments according to seasonal climate projections.
The challenge for urban drainage modelling is to apply the delta change method at
time-steps in the order of minutes. Semadeni-Davies et al. (2008a and b) used the
delta-change technique to alter a high resolution (5-minute) rainfall series for future
climate signals from a regional climate model. The output of the climate model had a
temporal resolution of six hours. The high-resolution historical data was aggregated
into 6-hourly time-steps to identify high and low intensity events using a threshold of
10mm/6 hours. Each event was tagged accordingly in the record. Separate delta-
change coefficients were determined for each month and event type by comparing
modelled rainfall for present and end-of-century climates; these were applied to the 5-
minute record according to the tagged event type. Delta-change transformations were
also applied to monthly potential evapotranspiration. Two issues were noted: (1) the
method assumed that the relationship between local and regional climate will not alter;
and (2) increased monthly rainfall volumes predicted by the regional model were
assumed to be due to changed rainfall intensity. There was an obvious mismatch
between the signal from the regional model (which suggested that extreme rainfalls
would become more common) and the delta-change method which assumed no change
in event frequency or duration.
Disaggregation and artificial rainfall series
A comparison of rainfall disaggregation methods for urban applications can be found
in Hingray and Ben Haha (2005). They show that deterministic and simple stochastic
methods perform poorly, and scale-based methods (fractals) are only marginally
better. Cowpertwait et al. (2004) had more success with a stochastic weather
generator to extend historical rainfall records. However, both studies started with
hourly observed rainfall records and neither intended that the methods be used to
disaggregate future rainfall scenarios for impact assessments. The latter work is of
particular interest here as the model was developed for the Auckland City Council to
disaggregate historical one-hour rainfall blocks into 5-minute blocks suitable for urban
drainage applications. The method is further described in Cowpertwait et al. (2006;
2009) and was tested by comparing simulated (MOUSE) flows in Auckland’s
wastewater and combined sewer system. Historical 5-minute rainfall data from six

Tool 2.4.1: Urban drainage modelling – data, issues and assumptions 8
sites across the city were aggregated into one-hour blocks which were then
disaggregated into artificial 5-minutes rainfall series. The flows simulated with the
historical and artificial series were comparable. The method was also used to derive
an artificial rainfall series (Cowpertwait, 2003) for the Wairau Valley climate change
study (Shaw et al., 2005) summarised in Tool 2.4.3.
Regional Climate Model (RCM)
NIWA are currently developing a regional climate model based on the UK Met Office
unified model framework (Drost et al., 2007; Baskaran et al., 2002) which can provide
rainfall with a temporal resolution of down to 3 minutes. The use of rainfall records
from this model for flood risk assessment is discussed in MfE (2010). Rainfall
records are currently available for two time periods: current base-line (1970-2000) and
end of century (2070-2100). The RCM downscales projections from the Hadley
Centre HadCM3 global circulation model which has been forced by two gas emission
scenarios for future climate. These emission scenarios are the B2 and A2 (low and
moderately high) SRES scenarios which span the range of projections possible.
Future runs of the RCM will be based on an extended range of emission scenarios.
Rainfall from the RCM was provided to North Shore City Council for simulation of
flows in the waste water system (Lockie and Brown, 2010; summarised in Tool 2.4.4).
Significant research effort is being directed by NIWA towards improving and
enhancing the RCM. High temporal resolution output, such as short-duration rainfall,
also requires statistical bias correction, which is an ongoing research field.
3.1.3 Simulation length
Continuous simulations should be run for a period long enough to capture the range of
natural variability – at least 10 years. MfE (2008, 2010) report that the main drivers of
variability which affect hydrological processes in New Zealand are El Niño - Southern
Oscillation (ENSO) and the Interdecadal Pacific Oscillation (IPO). ENSO has three to
seven year cycles while the IPO has phases lasting between 15 and 30 years. MfE
(2010) notes that the magnitude of climate change projections for 2040 are in the same
order as variability due to the IPO.
3.2 Urbanisation scenarios
MfE (2008) recognizes the importance of socio-economic scenarios to risk
assessment. The key socio-economic drivers associated with urban water management
are urbanisation (i.e., land use change) and urban drainage practices. With the latter,
new networks and replacement of old pipes can be expected. There is also a current
transition in stormwater management from reticulated networks to stormwater
Tool 2.4.1: Urban drainage modelling – data, issues and assumptions 9
management devices as part of low impact design (LID) which favours compact urban
forms around transport nodes. These changes can be simulated in drainage models by
adjusting the boundary conditions and parameters. The exact nature of how socio-
economic scenarios should be represented depends on the study purpose, the model to
be used, and the area to be simulated.
3.2.1 Urban water management story-lines
The notion of development storylines is comparable to gas emission scenarios. In the
context of urban drainage, the storylines set up how urban water is likely to be
managed in the future in relation to current trends and foreseeable changes in drivers
including technology and social, cultural, environmental and economic values.
One of the most comprehensive studies to determine socio-economic storylines for
climate change impact assessment has been undertaken as part of the UK Climate
Impacts Programme (UKCIP, 2001; Berkhout et al., 2002; Shackley and Deanwood,
2003). A variety of stakeholders ranging from researchers and policy makers to
industry and NGOs were consulted to create four storylines based on differing world
views. Each storyline has interlinked impacts on, among other factors, education,
trade, industry, agriculture, water and biodiversity. The storylines were developed in
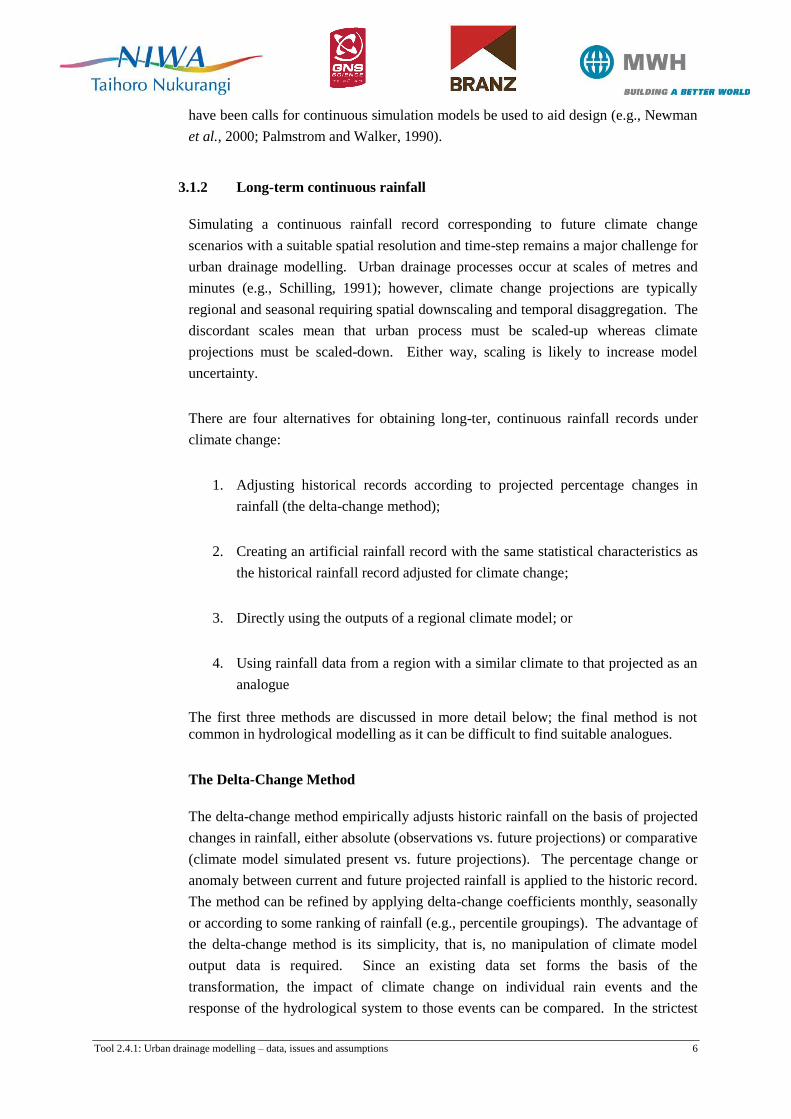
parallel to the IPCC SRES (2001) storylines and are national enterprise, world
markets, global sustainability and local stewardship. These are roughly equivalent to
the IPCC SRES A2, A1, B1 and B2 gas emission scenarios respectively and can be
arranged in quadrants according to their emphasis on the spectra of values and
governance (Figure 3.1).
To illustrate, the global sustainability storyline sees the world as an interconnected
whole while retaining community values. In this storyline, sustainable development
takes precedence over regional development and resource management transcends
national boundaries. UKCIP (2001) speculates that increased water demand due to an
improved standard of living would be met with demand management and adoption of
clean technologies. The latter, along with decreased pesticide use in agriculture,
would also result in improved water quality. In contrast, the national enterprise
storyline organises society according to short-term consumerist values on a national or
regional level. The environment is seen as a commodity to be traded, and only where
there is there is a direct economic gain will a resource be protected. This storyline will
also see increased water demands along with low investment in infrastructure and high
levels of leakage, these would be mitigated by pricing and metering rather than
innovation. Both storylines suggest slow population growth and a move towards
smaller households leading to new housing developments.

Tool 2.4.1: Urban drainage modelling – data, issues and assumptions 10
National
Enterprise
World
Markets
Local
Stewardship
Global
Sustainability
Values
Autonomy
Interdependence
Consum
erism
Com
munity
Go
vern
an
ceNational
Enterprise
World
Markets
Local
Stewardship
Global
Sustainability
Values
Autonomy
Interdependence
Consum
erism
Com
munity
Go
vern
an
ce
Figure 3.1: UKCIP socio-economic storylines arranged in quadrants according to the axes of
values (i.e., goals of consumers and policy makers) and governance (i.e., political
and economic power structures) (after UKCIP, 2001)
The way in which urbanisation scenarios are developed is dependent on the storyline
chosen. Take the example of flood risk which has been a major driver of change for
stormwater management in some parts of Auckland and is expected to increase as a
consequence of climate change (see Tool 2.4.2). There are a range of alternative
strategies currently available for adapting to increased flood risk including;
Business as usual (i.e., living with the consequences);
Increasing network capacity by replacing pipes or constructing storage
infrastructure such as tunnels or tanks;
Separating combined sewers and rehabilitating aging networks to reduce
surface water inflows and sewer infiltration to sanitary sewers;
Re-zoning flood plains for less sensitive land uses and relocating at-risk
businesses and residents;
Diverting flood waters to temporary storage facilities such as sports fields and
play grounds;

Tool 2.4.1: Urban drainage modelling – data, issues and assumptions 11
Artificial recharge – this option is being explored for parts of Auckland
currently drained by soakage to basalt aquifers ((Harding et al., 2008;
Parkinson et al., 2008);
Requiring LID for brown and greenfields developments and disconnecting
stormwater from existing networks in favour of retrofitted stormwater
management devices for local disposal; or
Combinations of the above measures.
Each approach will have a different impact on both water quantity and quality
reaching receiving environments. Moreover, each will be represented in urban
drainage models in a different way.
3.2.2 Land use and surface hydrology parameters
Parameters commonly found in urban drainage models which can be altered to
simulate land use change and possible impacts of surface hydrology include:
Stormwater catchment or management unit area to simulate new sources as
drainage networks are extended with urban development;
Ratio of permeable to impervious surfaces;
Hydrological properties
o vegetation (parameters for evapotranspiration) – trees, scrub,
grass/lawn, bare soil
o depression storage
o soil compaction and top-soil removal - infiltration capacity, storage
capacity, porosity and hydraulic conductivity
o surface roughness (e.g., Manning’s n for grass vs. concrete or asphalt)
o time-of-concentration - shorter pathways to drainage inlets with land
use intensification
Contaminant sources and build-up and wash-off rates.
Population growth (critical for modelling waste water flows)
o spatial distribution of population (e.g., spatially even increases across
region vs. local increases at growth nodes)
o water demand per capita (demand could rise due to both population
growth and increased summer soil moisture deficits in city gardens–
these could be met by restrictions and metering/water rates as well as

Tool 2.4.1: Urban drainage modelling – data, issues and assumptions 12
water saving technologies such as dual flush toilets and front-load
washing machines, harvesting of roof runoff and grey-water reuse)
o wastewater per capita - volumes (disconnection of grey-water from
sewers) and nutrient loads (urine separation toilets, changing diet).
Traffic fleet composition and associated vehicle emission factors (i.e.,
emissions of exhaust contaminants, tyre and brake wear-and-tear).
3.2.3 Drainage network parameters
The drainage network has traditionally consisted of a both primary and secondary flow
system. The primary system refers to reticulated pipe networks and surface
conveyance to pipe inlets via gutters. Secondary flow paths are surface or overland
flow paths which convey stormwater when the primary system is at capacity such as
gullies and stream channels. Over recent years, stormwater management devices
which variously convey, store and treat stormwater at the surface have been installed
as part of LID. While at the surface, they are designed as part of the primary system.
Changes in urban water drainage systems such as new drainage conduits and system
deterioration, and replacement or rehabilitation of existing networks can be expressed
by changing model parameters which describe:
The reticulated network (primary network):
Separated versus combined sewers;
System capacity, expressed as pipe dimensions – length and diameter / cross
sectional area;
Pipe hydraulic characteristics
o shape (e.g., round or keyhole)
o roughness (e.g., Manning’s n of concrete vs. plastic);
Network geometry including the number, location and hydraulic
characteristics of drainage infrastructure such as inlets (e.g., catch pits), lateral
connections from buildings (i.e., roof downpipes and wastewater), manholes,
network joints, culverts, flood protection and storage facilities (e.g., tanks,
tunnels), pumping stations, proprietary treatment devices, overflows, and
outfalls;
Sewer infiltration coefficients, i.e., pipe leakiness; and
Network depth and slope (energy line).
Secondary system:

Tool 2.4.1: Urban drainage modelling – data, issues and assumptions 13
Surface flow-paths with respect to the reticulated network and receiving
environments; and
Presence of emergency diverts to storage facilities such as sports fields.
There may also be changes in natural flow paths such as streams, including
channelisation, diversions, channel morphology and restoration (e.g., riparian
planting).
Stormwater management devices for LID:
Type (detention/retention facilities, conveyance, infiltration);
Dimensions/capacity (device and detention volumes, depth, width and length,
shape);
Inlet and outlet configurations (size, relative position, offline or online);
Other design features such as presence of baffles, underdrains and geo-textile
linings which can affect flow; and
Point of connection to other devices (i.e., treatment trains), the reticulated
network or receiving environment.
3.2.4 Boundary conditions
The choice of hydrological catchment boundary conditions is particularly important
for event-based simulations. This is because drainage model response to rainfall is
highly dependant on the antecedent storage available with regard to soil moisture and
the volume stored in pipes and storage facilities (such as tanks, tunnels and detention
basins). The conservative approach is to assume the soil is saturated and the system
storage capacity is full. For continuous modelling, models can be run with the first
one or two years of data repeated until the storage reaches a steady-state.
In areas with coastal outfalls, mean sea level, tidal ranges and storm surge could also
have an impact on the drainage system including back flow in pipes and changed
energy lines. These can be changed in many urban drainage models – coastal advice
can be found in Toolbox Bin 2.2.
4. Spatial representation
The representation of future drainage networks should be considered when designing
an impact assessment which includes urbanisation and land use change. That is, what
changes are likely, and where and when will they occur? Most drainage models now
operate within GIS platforms and it is relatively easy to adjust the drainage network by
adding new nodes (e.g., confluences, pumping stations, inlets, outfalls) and links (e.g.,
pipes, streams, channels). However, given the need to generate and model a range of
urban scenarios, spatially aggregating flow network elements can provide some model

Tool 2.4.1: Urban drainage modelling – data, issues and assumptions 14
simplification especially where land is zoned for change over coming decades but
detailed plans are not yet available.
There has been precedence for aggregating drainage units in urban stormwater
modelling, particularly with respect to water treatment. The USEPA SUSTAIN model
(Shoemaker et al., 2009), for instance, allows simulation at the neighbourhood scale
with each drainage element defined explicitly or at the catchment scale with
aggregated representative flow-paths. In New Zealand, Elliott et al. (2006, 2009)
aggregated treatment devices and flow pathways within the MUSIC model for a
catchment with an area of 0.83 km2. An initial total of 810 drainage nodes were
aggregated to 55, 7 and, finally, a single node. The parameters governing the
performance of modelled treatment devices (i.e., dimensions of the devices) were
scaled-up proportionally to the greater contributing area upon spatial aggregation.
They found that there was some loss of model skill with respect to peak flow, but
aggregation had little effect on the predictions of water quality, mean discharge and
base flow when there were uniform soil properties and sizing of devices relative to the
source area.
The use of spatially distributed and aggregated representations of drainage networks
for climate change impact assessment was demonstrated for combined sewer flows in
Helsingborg, Sweden, by Semadeni-Davies et al. (2008a). Inner city flows to the
system were represented explicitly as the pipe network geometry is already in place
and is not expected to change. The system was modelled using a fully calibrated
MOUSE model for the central city that was developed for operational purposes.
Surface flows in the inner city were simulated using the RDII module for MOUSE.
However, wastewater flows from the surrounding suburbs, which are not yet included
in the model set-up were aggregated. The suburban waste water is conveyed from a
separate system to the wastewater treatment plant via connections at several points to
the combined system. The land use intensity and population in these suburbs is
expected to increase over the coming decades, and this was simulated by increasing
the volume of wastewater flowing into the connection points on a per capita basis.
Direct inflow and sewer infiltration to the separated systems were assumed to be
negligible.
5. Stormwater quality
The quality of urban stormwater has a major impact on the ecosystem health of urban
receiving environments. Changes to the frequency of rainfall events (i.e., build-up and
wash-off cycles) rainfall intensity will have an effect on base-flow and peak flow
volumes and the contaminant loads and concentrations transported during flow events.
Moreover, increased water temperature and reduction in dissolved oxygen could put
further stress on aquatic environments. Despite the conceptual impacts of climate

Tool 2.4.1: Urban drainage modelling – data, issues and assumptions 15
change on water quality, these impacts have not been addressed in the literature
beyond contamination due to wastewater sewer overflows. There has been some
discussion of using stormwater management devices as an adaptation to the possible
impacts of climate change on water quantity (e.g., Semadeni-Davies et al., 2008 a and
b; Ashley et al., 2008; Shaw et al., 2007) which could also have an impact on water
quality, but this aspect of device function has not been discussed in relation to climate
change.
Part of the reason that the impact of climate change on contaminant loads from diffuse
sources has largely been excluded from impact assessments is that the processes
involved are complex and highly site specific making simulation problematic (for an
overview of modelling issues see Sutherland and Jelan, 2003). Important parameters
are the accumulation rate, the accumulation period between events (i.e., rainfall
frequency) and wash-off rates. Accumulation refers to the build-up of contaminants
such as chemical weathering of building materials, deposition of abraded road and tyre
particles, vehicle exhaust and industrial emissions and wind borne soil sediments. The
accumulation rate is not constant and can plateau between events. Wash-off varies
depending on the type of contaminant and the processes in operation (e.g., wash-off of
accumulated contaminants or mechanical weathering / erosion); generally, wash-off
rates increase with rainfall intensity. Theoretically, the projections for Auckland of
lowered annual rainfall but increased intensity of storm events could lead to increased
accumulation periods and a greater potential for first flushes and surface erosion
increasing event loads. However, increased flow volumes may also have the effect of
reducing event concentrations.
Changing contaminant sources and yields must also be considered along with changes
in imperviousness which affects flow rates. There is a trend towards the use of new
low yield building materials (e.g., coated vs. unpainted galvanised steel roofing) and a
shift in urban form and activities which will affect contaminant loads. The transport
sector in particular has a great impact on stormwater quality, with contaminants from
road and tyre wear-and-tear, brake pads and exhaust emissions. These yields are set to
change over the coming decades. The ratio of public to private transport, fleet
composition, use of alternative fuels, materials used in vehicle manufacture, journey
frequency and length will all have an impact on water quality. For instance, Los
Angeles encourages the use of electric cars to improve air quality and as a climate
change mitigation strategy (Dubin et al., 2011) and several American states have
introduced or are considering bills requiring low metal yield brake-pads (Washington -
SB6557; California - SB 346) to improve water quality.
Finally, stormwater management should also be considered, particularly given the
emphasis in the Auckland metropolitan area for LID (ARC, 2001). Timperley and
Reed (2008) demonstrated the potential impacts of land use change and water

Tool 2.4.1: Urban drainage modelling – data, issues and assumptions 16
treatment on annual sediment, zinc and copper loads from urban catchments to the
central Waitemata Harbour using the ARC Contaminant Loads Model. This model
does not include a climate component; assuming that over the course of a year, the
total wash-off from a surface is independent of rainfall dynamics. While Timperley
and Reed (2008) did not consider climate change, their work does offer an insight into
urban scenario creation for water quality modelling.
6. Conclusion
This purpose of this tool is to overview the issues and assumptions surrounding urban
drainage modelling with respect to climate change risk assessment. It is noted that
modelling is at the heart of the risk assessment process, as set out in the MfE Climate
Change Effects Manual (2008), for both preliminary screening and detailed analysis.
The too; has discussed model choice and development of both climate change (i.e.,
input data) and urbanisation scenarios (model set-up and parameters). The detail to
which urban drainage pathways are modelled and the data required depends on the
purpose of the assessment. It is noted that changes in climate are simulated by
adjusting or replacing input data whereas changes due to urbanisation are simulated by
changing model parameters. The report points to other tools for examples of how
models have been applied in the Auckland Region, notably Tools 2.4.2, 2.4.3 and
2.4.4.
References
Auckland Council (2011) Stormwater Flood Modelling Specifications. Draft
Manuscript – unpublished.
ARC, Auckland Regional Council, ARC (1999). Guidelines for stormwater
runoff modelling in the Auckland Region. Auckland Regional Council
Technical Publication No. 108. (ARC TP108). Auckland Regional
Council.
Auckland Regional Council, ARC (2001) Low Impact Design Manual for the
Auckland Region. Primary Author, Earl Shaver. TP 124.
ARC, Auckland Regional Council, ARC (2003) Stormwater management
devices: design guidelines manual. Second Edition, TP 10.
Arnbjerg-Nielsen, K. and Fleischer, H.S. (2009) Feasible adaptation strategies
for increased risk of flooding in cities due to climate change. Wat. Sci.
Tech. 60(2); 273–281.
Arnbjerg-Nielsen, K. and Mikkelsen, P.S. (2009) Design of urban drainage
structures incorporating climate change impacts in a risk framework.
Ozwater, 2009, Australian Water Association, Leonards, NSW, Australia

Tool 2.4.1: Urban drainage modelling – data, issues and assumptions 17
Ashley, R.; Blanksby, J.; Cashman, A.; Fewtrell, L.; Jack, L;. Wright, G.;,
Packman, J.; Maksimovic, C. and Kellagher, R. (2008) Building
Knowledge for a Changing Climate (BKCC): Adaptable Urban Drainage -
Addressing Change In Intensity, Occurrence And Uncertainty of
Stormwater (AUDACIOUS). Main summary report. EPSRC/UKCIP.
Ashley, R.M.; Balmforth, D.J.; Saul, A.J. and Blanskby, J.D. (2005) Flooding
in the future - predicting climate change, risks and responses in urban
areas. Wat. Sci. Tech. 52(5):265–273.
Baskaran, B.; Renwick, J. and Mullen, A. B. (2002) On the application of the
Unified Model to produce finer scale climate information for New
Zealand. Weather and Climate 22, 19-27.
Berkhout, F.; Hertin, J. and Jordan, A. (2002) Socio-economic futures in a
climate change impact assessment: using scenarios as ‘learning machines’.
Global Environ. Chang. Part A. 12(2):83-95.
CRCCH (2005) Music User Manual. Version 2.1. Cooperative Research Centre
for Catchment Hydrology, Urban Stormwater Quality Program, Australia
Clar, M.L.; Barfield, B.J. and O’Connor, T.P. (2004) Stormwater Best
Management Practice Design Guide Volume 2: Vegetative Bio-filters. US
Environmental Protection Agency, EPA/600/R-04/121A.
Cowpertwait, P.; Salinger, J. and Mullan, B. (2009) A spatial-temporal
stochastic rainfall model for Auckland City: Scenarios for current and
future climates. Journal of Hydrology (NZ) 48 (2): 95-109 2009.
Cowpertwait, P.S.P (2003). A Stochastic Rainfall Model for North Shore City.
Client Report for North Shore City Council, May 2003.
Cowpertwait, P.S.P.; Lockie, T. and Davies, M.D. (2006) A stochastic spatial-
temporal disaggregation model for rainfall, Journal of Hydrology New
Zealand, 45(1), 1-12.
Davis, M.D.; Kinley, P.; van Kalken, T.; Johnson, C.; Brown, N.; Islam, J.;
Dayananda, K.G. and Pathirana, J. (2010) a decade of flood inundation
assessment under climate change in the Auckland Region. Water NZ
Stormwater Conference, 2010.
Dayananda, K.G.; Pathirana, J.; Davis, M.D.; Salinger, M.J.; Mullan, A.B.;
Kinley P. and Paterson, G. (2005) Flood risk under existing and future
climate scenarios in Auckland City (New Zealand). World Water and
Environmental Resources Congress 2005, American Society of Civil
Engineers, Reston, Virginia, doi:10.1061/40792(173)477.
Denault, C., Millar, R.G, and Lence, B.J. (2006) Assessment of Possible
Impacts of Climate Change in an Urban Catchment. Journal of the
American Water Resources Association (JAWRA) 42(3):685-697.
Drost, F.; Renwick, J.; Bhaskaran, B.; Oliver, H. and McGregor, J. (2007)
Simulation of New Zealand’s climate using a high-resolution nested
regional climate model. Int. J. Climatol. 27: 1153–1169.

Tool 2.4.1: Urban drainage modelling – data, issues and assumptions 18
Dubin, J.; Barney, R.; Csontos, A.; Um, J. and Wu, N. (2011) Realizing the
potential of the Los Angeles electric vehicle market. Luskin Center
Electric Vehicle Research Program. UCLA Anderson, Los Angeles, USA.
Elliott, A.H.; Trowsdale, S. and Wadhwa, S. (2006) Upscaling a model of on-
site stormwater control devices. 7th International Conference on Urban
Drainage Modelling and the 4th International Conference on Water
Sensitive Urban Design, Melbourne, Australia, Volume 1. 271-278.
Elliott, A.H.; Trowsdale, S.A. and Wadhwa, S. (2009) Effect of aggregation of
on-site storm-water control devices in an urban catchment model. J.
Hydrologic Eng. Volume 14, Issue 9, pp. 975-983 (September 2009).
Harding, B.; Strayton, G.; Pattle, A.; Captain, X. and Ockleston G. (2008)
Auckland’s stormwater – increased disposal issues. NZWWA Stormwater
08 Conference.
He, J.; Valeo, C. and Bouchart, F.J-C. (2006) Enhancing infrastructure
investment planning practices for a changing climate. Water Science and
Technology, 53(10):13-20.
Hingray, B. and Ben Haha, M. (2005) Statistical performances of various
deterministic and stochastic models for rainfall series disaggregation. Atm.
Res., 77(1-4):152-175.
Huber, W. and Dickinson, R. (1988) Stormwater Management Model, V4.
USEPA, Athens, GA.
IPCC SRES (2000). Special Report on Emissions Scenarios: A Special Report
of Working Group III of the Intergovernmental Panel on Climate Change.
Cambridge University Press, Cambridge, U.K., 599 pp.
Kinley, P.; Sharman, B. and Davis, M. (2007) A pragmatic assessment of
climate change impacts on drainage infrastructure and resulting
management practices in Auckland City. 5th South Pacific Stormwater
Conference.
Kleidorfer, M., Möderl, M., Sitzenfrei, R., Urich, C. and Rauch, W. (2009) A
case independent approach on the impact of climate change effects on
combined sewer system performance. Wat. Sci. Tech. 60(6):1555-1564.
Lockie, T. and Brown, N (2010) Potential impact of climate change on
NSCC’s wastewater capital works programme. North Shore City Council
Report.
MfE Ministry for the Environment (2008) Preparing for climate change: A
guide for local government in New Zealand. Publication number: ME 891.
MfE Ministry for the Environment (2010) Preparing for future flooding: A
guide for local government in New Zealand. Publication number: ME
1012.
Newman, T.L.; Omer, T.A. and Driscoll E.D. (2000) “SWMM Storage-
Treatment for Analysis/Design of Extended-Detention Ponds.” In: Applied
Modeling of Urban Water Systems, Monograph 8 in the Series. William
James (Ed.), Proceedings of the Conference on Stormwater and Urban
Water Systems, Modeling, Toronto, Ontario, February, 1999.

Tool 2.4.1: Urban drainage modelling – data, issues and assumptions 19
Palmstrom, N. and Walker, W.W. (1990) P8 urban catchment model: User's
guide. Program documentation, and evaluation of existing models, design
concepts, and Hunt-Potowomut data inventory. The Narragansett Bay
Project Report No.NBP-90-50.
Parkinson, N.J., Hewitt, J., Summerhays, M., Ockleston, G. and Captain, X
(2008) Optimisation of basalt aquifer stormwater disposal for flood hazard
mitigation in Auckland City. NZWWA Stormwater Conference, Rotorua,
New Zealand.
Roberts, C. and van Kalken, T. (2010) Regional and local flood hazard
mapping. Presentation to the Auckland Regional Council Stormwater
Seminar, 21 July, 2010.
Schilling, W. (1991) Rainfall data for urban hydrology: what do we need?
Atmos. Res. 27:5-21.
Semadeni-Davies, A.; Hernebring, C.; Svensson, G. and Gustafsson, L.-G.
(2008a) The impacts of climate change and urbanisation on drainage in
Helsingborg, Sweden: combined sewer system. J. of Hydrology, 350:114-
125.
Semadeni-Davies, A.; Hernebring, C.; Svensson, G. and Gustafsson, L.-G.
(2008b) The impacts of climate change and urbanisation on drainage in
Helsingborg, Sweden: suburban stormwater. J. of Hydrology, 350:100-
113.
Shackley, S. and Deanwood, R. (2002) Stakeholder Perceptions of Climate
Change Impacts at the Regional Scale: Implications for the Effectiveness
of Regional and Local Responses. J. Environ. Plan. Managem., 45(3):381-
402.
Shaw, H.; Reisinger, A.; Larsen, H. and Stumbles C. (2005) Incorporating
climate change into stormwater design – why and how? 4th South Pacific
Stormwater Conference, Auckland, 2005.
Shaw, R.; Colley, M. and Connell, R. (2007) Climate change adaptation by
design: a guide for sustainable communities. TCPA, London.
Shoemaker, L.; Riverson. J.; Alvi, K.; Zhen, J.X.; Paul, S. and Rafi, T. (2009)
SUSTAIN – a framework for placement of best management practices in
urban watersheds to protect water quality. EPA/600/R-09/095, US EPA.
Sutherland, R.C. and Jelen, S.L. (2003) Stormwater Quality Modeling
Improvements Needed for SWMM., Practical Modeling of Urban Water
Systems Monograph 11, edited by William James, CHI Publications, pp.
253-289.
Thompson, C.S. (2002) The High Intensity Rainfall Design System: HIRDS.
Proceedings, International Conference on Flood Estimation, March 2002,
Berne, Switzerland. International Commission for the Hydrology of the
Rhine Basin, CHR Report II-17, pp 273 – 282.
Timperley, M. and Reed, J. (2008) Modelling the fate of Auckland’s
stormwater chemicals over the next 100 years. NZWWA Stormwater 08
Conference.

Tool 2.4.1: Urban drainage modelling – data, issues and assumptions 20
UKCIP (2001) Socio-economic scenarios for climate change impact
assessment: a guide to their use in the UK Climate Impacts Programme.
UKCIP, Oxford.
URS (2004) Climate Change and infrastructure design case study: Wairau
Catchment, North Shore City. 48232/046/R090. Summary report prepared
for North Shore City Council and NZ Climate Change Office.
van Kalken, T.; Taylor, A.; Davis, M. and Hellberg, B. (2009) Rapid two
dimensional flood hazard mapping in the Auckland Region. Water NZ
South Pacific Stormwater Conference, 2009.
Watt, W.E., Waters, D. and McLean, R. (2003) Climate Variability and Urban
Stormwater Infrastructure in Canada: Context and Case Studies. Toronto-
Niagara Region Study Report and Working Paper Series, Report 2003-1.
Meteorological Service of Canada, Waterloo, Ontario.


![Integrating GIS and Drainage Modelling to Better Manage ... · Research Approaches Fig 13: Different research approach for drainage modelling [3]. The approach taken in this research](https://img.pdfslide.us/doc/110x75/5f4fae5a42407e25d8544d38/integrating-gis-and-drainage-modelling-to-better-manage-research-approaches.jpg)