Embed Size (px)
Citation preview
POLICY INFORMATION CENTERResearch Division
Educational Testing ServicePrinceton, New Jersey 08541-0001
A POLICY INFORMATION PERSPECTIVE
Too Much Testingof the Wrong Kind;
Too Little of the Right Kindin K-12 Education
by Paul E. Barton
Additional copies of this report can beordered for $9.50 (prepaid) from:
Policy Information CenterMail Stop 04-REducational Testing ServiceRosedale RoadPrinceton, NJ 08541-0001(609) 734-5694Internet – [email protected]://www.ets.orgCopies can also be downloaded from
www.ets.org/research/pic
Copyright © 1999 by EducationalTesting Service. All rights reserved.Educational Testing Service is anAffirmative Action/Equal OpportunityEmployer. The modernized ETS logo is atrademark of Educational Testing Service.
March 1999

TOO MUCH TESTING • 1
15992 042 02 P li I f R t / T M h T ti F t B k l A t G d I k l k PMS 154 PM6 5 9 f b ’99/ b
TABLE OF CONTENTS
Preface. . . . . . . . . . . . . . . . . . . . . . . . . . . . . . . . . . . . . . . . . . . . . . . . . . . . . . . . . . . . . . 2
Acknowledgements . . . . . . . . . . . . . . . . . . . . . . . . . . . . . . . . . . . . . . . . . . . . . . . . . . . 3
Introduction . . . . . . . . . . . . . . . . . . . . . . . . . . . . . . . . . . . . . . . . . . . . . . . . . . . . . . . . 4
The Reason Why . . . . . . . . . . . . . . . . . . . . . . . . . . . . . . . . . . . . . . . . . . . . . . . . . . . . . 6
Promising Trends and Reducing Intrusion . . . . . . . . . . . . . . . . . . . . . . . . . . . . . . . . . . . 8
“National” Testing . . . . . . . . . . . . . . . . . . . . . . . . . . . . . . . . . . . . . . . . . . . . . . . . . . . . 10
An Alternative: National Help for Local Action . . . . . . . . . . . . . . . . . . . . . . . . . . . 14
The Patient Approach: Content Standards and Aligned Assessment . . . . . . . . . . . . . . . 16
The Challenge of Setting Performance Standards . . . . . . . . . . . . . . . . . . . . . . . . . . . . . 19
Accountability, but for the Right Things . . . . . . . . . . . . . . . . . . . . . . . . . . . . . . . . . . . 21
Exit Examinations? . . . . . . . . . . . . . . . . . . . . . . . . . . . . . . . . . . . . . . . . . . . . . . . . . . . 28
It Comes Back to Teachers . . . . . . . . . . . . . . . . . . . . . . . . . . . . . . . . . . . . . . . . . . . . . . 31

2 • TOO MUCH TESTING
15992-042 02 • Policy Info Report / Too Much Testing: • Fonts: Berkeley Avant Garde • Inks: lack PMS 154 • PM6 5 • 9 feb ’99/rcb
PREFACE
Any discussion in the United States of howwell American students are educated, andhow to “reform” education, comes — eitherquickly or eventually — to testing. The test-ing enterprise in K-12 education has mush-roomed the last quarter-century; Americanswant numbers when they look at students,schools, state education systems, and howAmerica’s students compare to those of othercountries. Among political leaders, testing
is turning into a means of reform, rather thanjust a way of finding out whether reformshave been effective.
I believe that there is much that is wrongin this system, that there are signs here andthere of improvement, and that there areways to make assessment much better inserving teaching and learning. We havemore and more of these numbers, but theyare too often not adding up to goodinformation.
Paul E. BartonDirectorPolicy Information Center
TOO MUCH TESTING • 3
15992 042 02 P li I f R t / T M h T ti F t B k l A t G d I k l k PMS 154 PM6 5 9 f b ’99/ b
ACKNOWLEDGEMENTS
I am indebted to a number of people forproviding thorough, thoughtful, andoften critical reviews: Robert Linn at theUniversity of Colorado, Robert Stake atthe University of Illinois, Emerson Elliott,former Commissioner of the NationalCenter for Education Statistics in the U.S.Department of Education, and at Educa-tional Testing Service, Henry Braun, Ted
Chittenden, and Charlotte Solomon.While there was substantial agreement onthe general thesis of the manuscript, notall would agree with all that is in the finalreport.
Carla Cooper provided desktop publish-ing, Kirsty Brown was the editor, RicardoBruce was the cover designer, and JimChewning was the production coordinator.
4 • TOO MUCH TESTING
15992-042 02 • Policy Info Report / Too Much Testing: • Fonts: Berkeley Avant Garde • Inks: lack PMS 154 • PM6 5 • 9 feb ’99/rcb
INTRODUCTION
“We need less frequent but far better testing.”Albert Shanker, President, American Federation of Teachers, 1993.
There is just too much standardized testinggoing on in our schools, lamented anunlikely source, the late Gregory Anrig,then-president of the world’s largest testingorganization, Educational Testing Service.(Before that, he was Chief State SchoolOfficer for Massachusetts, and had been aneducator throughout his career.)
The testing enterprise has mushroomedin the United States. To show you meanbusiness in dealing with crime, you call formore prisons and mandatory sentencing. Toshow you are tough on welfare reform, youask for time limits. To show seriousness inraising educational achievement in the U.S.,you call for more frequent and more rigor-ous testing. Those who oppose testing areaccused of protecting teachers and the edu-cational system, and not putting children first.
The critics of such massive testing,including many in educational measure-ment, offer the following complaints.Tests have been composed mostly ofmultiple-choice questions, which cannotassess a student’s ability to come up withhis or her own answers. Commercial orstate tests may not test what local schoolsare actually teaching. Some critics arguethat teachers are pushed in the directionof narrowing instruction to what theythink is on the test. Further, test prepara-tion sometimes becomes the instruction,with instructional materials mimicking
the formats and exercises that appear onsuch tests.
In the 1990s, there have been construc-tive attempts to improve the testing enter-prise. Serious efforts have been made tobroaden tests beyond multiple-choice ques-tions, and to include open-ended questions,“performance” assessments, and portfolios.(However, the assessment reform movementhas been slowed over issues of reliability andmeasurement error.) The National Assess-ment of Educational Progress (NAEP) hasbeen expanded. The large effort of the NewStandards Consortium of states and schooldistricts has tried to construct more educa-tionally useful tests, and has involved teach-ers extensively in building tests from theground up. And, in case tests are being“taught to,” the New Standards Consortiumwants to turn this into a positive, rather thana negative. There is no intention here ofreviewing this decade of reform in standard-ized testing — there have been improve-ments — but we are still left with somemajor challenges to fully harness assessmentto the purposes of education reform. Mostof the testing today is not much changedfrom what it was a dozen years ago.
This report starts with a quick review ofthe beginning of standardized testing in theschools, and the reasons for growing reli-ance on testing. It summarizes the recentpromising trends and suggests how testing

TOO MUCH TESTING • 5
15992 042 02 P li I f R t / T M h T ti F t B k l A t G d I k l k PMS 154 PM6 5 9 f b ’99/ b
for accountability could be less intrusive andprovide better information about achieve-ment in schools. The proposal for a volun-tary national test is examined, and analternative is offered in view of the politicalstalemate in which the proposal is mired.The most promising development on thehorizon — setting content standards andaligning curriculum and assessment tothem — is described as what I call the“patient approach.” The challenge in settingperformance standards is also set forth. Thepurposes of accountability assessment arerecognized; the alternative of measuring“value added” for these assessments isdescribed, and examples of its use are pro-vided; and exit examinations are discussed.Finally, the critical role of the teacher inassessing students is examined, as is the needto equip teachers with the knowledge andtools to use assessment in day-to-dayinstruction.
6 • TOO MUCH TESTING
15992-042 02 • Policy Info Report / Too Much Testing: • Fonts: Berkeley Avant Garde • Inks: lack PMS 154 • PM6 5 • 9 feb ’99/rcb
Robert Linn, in his 1995 Angoff Lecture atETS, explains why:
1. Tests and assessments are relativelyinexpensive. Compared to changes thatinvolve increasing instructional time,reducing class size, attracting more ablepeople to teaching, hiring teacher aides, orenacting programmatic change involvingsubstantial professional development forteachers, assessment is cheap.
2. Testing and assessments can beexternally mandated. It is far easier tomandate testing and assessment require-ments at the state or district level than tomandate anything that involves change inwhat happens inside the classroom.
3. Testing and assessment changes canbe rapidly implemented. New test orassessment requirements can be imple-mented within the term of elected officials.
4. Results are visible. Test results canbe reported to the press. Poor results in thebeginning are desirable for policymakerswho want to show they have had an effect ….
Exposing the existence of substandardeducation has long been the objective ofwritten examinations, and while the boom
has come in the last quarter century, thepopularity of testing is long-standing. InTesting in American Schools: Asking the RightQuestions (1992), the Office of Technol-ogy Assessment provides some early his-tory of testing in American schools fromthe mid-19th century.
“The idea underlying the implemen-tation of written examinations. . . was bornin the minds of individuals already con-vinced that education was substandard inquality. This sequence — perception of fail-ure followed by the collection of datadesigned to document failure (or suc-cess) — offers early evidence of what hasbecome a tradition of school reform and atruism of student testing: tests are oftenadministered not just to discover how wellschools or kids are doing, but to obtainexternal confirmation — validation —of the hypothesis that they are not doingwell at all.”
Robert Stake, of the University of Illi-nois, gives a succinct summary of the differ-ent waves of education reform in recentAmerican history (in “Some Comments onAssessment in U.S. Education”).
“Earlier, in the Century’s third quar-ter, the impetus for changing Americanschooling was the appearance of Sputnik.
THE REASON WHY
Improving testing is important because test-ing has become, over the last 25 years, the approach of first resort of policymakers.
TOO MUCH TESTING • 7
15992 042 02 P li I f R t / T M h T ti F t B k l A t G d I k l k PMS 154 PM6 5 9 f b ’99/ b
It was reasoned that the American schoolswere unsuccessful if the Soviets could befirst to launch spacecraft. College profes-sors at the National Science Foundationstepped forward to redefine mathematicseducation, and the rest of the curriculum,creating a new math, inquiry teaching,and many courses strange to the tasteof most teachers and parents. According toGallup polls year after year, citizensexpressed confidence in the local schoolbut increasingly worried about thenational system. In the 1960s, curriculumredevelopment was the main instrument ofreform, but in the 1970s state-levelpoliticians, reading the public asunhappy both with traditional andfederalized reform, created a reform oftheir own. Their reform spotlightedassessment of student performance.”
The mushrooming of standardized test-ing started in earnest in the early 1970s withthe “minimal competency” testing move-ment, which, at best, helped achieve moreminimal competency. It continued to growin the 1980s, as a response to A Nation atRisk. Such statewide testing probably mis-informed more than it informed. By 1987,John Cannell, a physician in West Virginia,had noticed that many states or schools wereclaiming that their students were aboveaverage. A sustained investigation revealedthat students’ scores almost everywhere wereabove average, a phenomenon that came to
be dubbed the Lake Wobegon effect. He con-cluded that “… standardized, nationallynormed achievement tests give children, par-ents, school systems, legislatures, and thepress inflated and misleading reports onachievement levels.”1
Robert Linn, in Assessment-BasedReform: Challenges to Educational Measure-ment (ETS Policy Information Center,1995) was a leader in assessing Cannell’scomplaints, and summarized his conclu-sions this way:
“There are many reasons for the LakeWobegon effect …among the many are theuse of old norms, the repeated use of thesame test form year after year, the exclu-sion of students from participation inaccountability testing programs at a higherrate than they are excluded from normingstudies, and the narrow focusing of instruc-tion on the skills and question types usedon the test ….”
Whatever the reason for the LakeWobegon effect, it is clear that the standard-ized test results widely reported as part ofaccountability systems in the 1980s weregiving an inflated impression of studentachievement.
1 Cannell, J. J. (1987). Nationally normed elementary achievement testing in America’s public schools: How all 50 states areabove the national average (2nd edition). Daniels. West Virginia: Friends of Education.
8 • TOO MUCH TESTING
15992-042 02 • Policy Info Report / Too Much Testing: • Fonts: Berkeley Avant Garde • Inks: lack PMS 154 • PM6 5 • 9 feb ’99/rcb
While the bulk of it was mass use of stan-dardized testing in ways that are deplored inthis report, there have been promising devel-opments. For example, in the 1980s theSouthern Regional Education Board (SREB)began to use NAEP to get state-level resultsamong member states, and led the way forthe expansion of NAEP to do this. SREB wasa leader both in using data to track policyimplementation — testing data included —and in setting goals for education, years aheadof the National Goals and the National Edu-cation Goals Panel.
Of course, in the 1990’s, tests are alsoexpected to somehow be a means of reform,and too often, to be the principal means. Howthis is to work is not clear. However, it is per-fectly clear that standardized testing is hereto stay. The question is whether it can bemade to play a more constructive role, or willcontinue to be used as a shortcut acrossquicksand.
Testing has been improving during the1990s, and is slowly being aligned to new andhigher content standards. However, pitfallsstill exist: testing is often an instrument ofpublic policy to affect schools, to gradeschools, to scold schools, and to judgewhether other improvements in the education
system are having the desired effect. Most ofthese tests have not been validated for thesepurposes. By and large, tests are not usedwithin the classroom by teachers as theirmeans of assessment; rather, teachers knowthe tests are used to grade them. Surveys haveshown that teachers use the tests they makethemselves, or the tests that accompany theinstructional materials provided by privatepublishers.
We can change the way we administerstandardized tests for school/teacher controland accountability, with much less intrusioninto the classroom. Sampling, as is done inNAEP, is more effective than testing every stu-dent frequently, with the same test, providingindividual scores for all. Sample-basedapproaches will provide better informationabout schools (see later discussion), and willbe much less intrusive into instructional set-tings and require less frequent testing. If theobjective is a report card on the schools, test-ing every couple of years will accomplish thepurpose.2 Changes in education cannot beaccomplished abruptly; a meaningful reorder-ing of an important phase of the instructionalprocess takes time. There is an impatience atwork here that is typically American; it is likepulling up the carrots to see how they aregrowing.
PROMISING TRENDS AND REDUCING INTRUSION
I n the 1980’s and 1990’s it was electedofficials — governors and state legislators — who continued to press for more testing.
2 How often tests are needed may depend partially on school size. Robert Linn points out that testing has to be morefrequent in small schools “because of instability in the scores as a function of cohort” and “having results every year enables oneto smooth out extreme fluctuations or reduce them by taking two-year averages, as has been done in Kentucky” (personalcorrespondence).
TOO MUCH TESTING • 9
15992 042 02 P li I f R t / T M h T ti F t B k l A t G d I k l k PMS 154 PM6 5 9 f b ’99/ b
While I am here advocating sample-basedassessment as less intrusive, and capable ofbroader coverage of subject matter than con-tinuous mass testing of all students, I do so inthe hopes of limiting the harm done toinstruction, and improving the measure ofwhat students have learned over a period oftime. Many questions remain, however. Mosttests are constructed to measure the knowl-edge a student has acquired. They have notbeen designed for the accountability purposesfor which they are now regularly used; theyare not designed, for example, as measures ofteachers’ capabilities. They have not been vali-dated in this use to assess whether they havethe intended consequences. Have the resultsbased on testing, for example, been comparedto results of other rigorous efforts to evaluateteacher and school performance? Have theresults been useful in changing teacherbehavior in desired ways? Do the tests actu-ally measure what it is that the policy makerswho ordered their use intended? I havepointed out elsewhere the misuses of standard-ized testing; the use of such tests foraccountability without meeting standard andwell-known methods of validation amountsto testing malpractice.
What we want from standardized test-ing is better information for teachers,administrators, policymakers, and the pub-lic. Testing used presently too rarely resultsin better information to aid instruction andachievement.
10 • TOO MUCH TESTING
15992-042 02 • Policy Info Report / Too Much Testing: • Fonts: Berkeley Avant Garde • Inks: lack PMS 154 • PM6 5 • 9 feb ’99/rcb
It was first discussed in the State of theUnion Address of 1997 as a “test.” Later, thePresident referred to the need for“national standards.” The test would be usedto determine the extent to which nationalstandards were being met. It is to be a testin which students receive individual scores,to establish how close students are comingto meeting the standards, and how theycompare to other students. This proposaltaps into a desire on the part of many par-ents and policy makers for some measuresof student performance that are external tothe school, a desire that can be met in avariety of ways, and at different levels ofgovernment.
At the present time, the development ofsuch a test is proceeding, under a $45 mil-lion contract with the American Institutesof Research and a host of subcontractors.The contractor is the National AssessmentGoverning Board (NAGB), the statutorypolicy board for NAEP. There is little ques-tion about the quality of the work whichwill go into developing such a test; the bestpeople available are involved. The debateconcerns the issue of doing it at all, and whatbenefit to American education will result.
Many statements have been made aboutwhat the test would tell us, and what itwould do to help education. The discussionoutside government revolves around the
information the test would make available. Itis worth being clear about this, because muchof this discussion is not well informed. Eventhe word “national” means different things todifferent people.
In fact, we already have a national test;it is called the National Assessment of Educa-tional Progress (NAEP), or the Nation’sReport Card. Seldom does an editorial or newsarticle commenting on the National Test pro-posal refer to NAEP, or point out how NAEPand the National Test differ. While the infor-mation from NAEP filters through the news-papers, it has not achieved wide identity for anumber of reasons. Although people knowabout the SAT, few would say they knowNAEP, although they have probably read theresults from NAEP in news stories. We alreadylearn from NAEP a whole lot of what isclaimed that a new test will tell us. The resultsof NAEP tell us:
● How well students are doing in the U.S.and regions of the U.S. in all major sub-jects, and how that has changed overtime.
● How minority students are doing, howstudents from different socioeconomicclasses are doing, how well inner- andouter-city students are doing, and howmales and females are doing.
“NATIONAL” TESTING
Amidst the testing explosion at the stateand district level, the Clinton Administration is attempting to launch a new NationalTest, something President Bush had also proposed.
TOO MUCH TESTING • 11
15992 042 02 P li I f R t / T M h T ti F t B k l A t G d I k l k PMS 154 PM6 5 9 f b ’99/ b
● How individual states are doing, andhow one state compares with another.Through linking with internationalassessments, each state can be comparedwith other countries.
● How a school district is doing; the lawnow permits districts to enter the sys-tem, and some have.
NAEP itself does not extend to the levelof the school. But NAEP is constructed so asto permit school level assessments if it isdesired, as long as schools recognize that theassessment is based on NAEP content frame-works. In NAEP, half the test exercises arereleased to the public; any capable testingorganization can construct a NAEP-linkedassessment and render scores on the NAEPachievement scale. This has been done regu-larly in the schools participating in the HighSchools That Work Consortium of the South-ern Regional Education Board for the last 10years, under a contract with Educational Test-ing Service.
Using these released NAEP items to con-struct an assessment linked to the NAEP scaleis quite feasible now. All it takes is desire andmoney. It has been done in the 21-state SREBConsortium referred to above. And about 10years ago it was done throughout Florida.
The defining difference between theNational Test now under development andthe existing NAEP is that the new test is to beused to provide individual student scores. Thematter of how these individual scores wouldbe used is unclear, and this might depend onwhat a school, or a district, or a state might
want to use them for. The program is “volun-tary,” and presumably the testing entity coulduse them as it pleases. The more the scorescome to mean in terms of consequences tothe students and to the teachers of those stu-dents, the more stringent the criteria must bewith respect to the validity and appropriate-ness of the test for the purposes for which itis used.
The most oft heard example of a good useis that a parent can look at their child’s scoreand know how good an education the schoolis providing — or perhaps, how well theteacher is teaching. We can compare studentachievement better by looking at average scoresfor a subject matter in a school, or for a class,which can be done now as described above,without yielding individual student scores.With this information, parents can compareachievement in their school with that of stu-dents across the state, or the nation. Theyalready know, from grades and class rankings,how well the student is doing within theschool. Comparing achievement is not thesame thing as comparing the quality ofinstruction; evaluating teachers and schoolsis a much more complex matter.
To give an individual student a score raisesthe bar for judging quality of the testinginstrument a whole lot, for consequences forthe individual begin to be attached to thescore. Even with high quality standards in con-structing a test, decisions about individualsshould not depend solely on an individual testscore.
The reason the NAEP approach will bet-ter enable parents to know how achievementin their school compares, is that each student

12 • TOO MUCH TESTING
15992-042 02 • Policy Info Report / Too Much Testing: • Fonts: Berkeley Avant Garde • Inks: lack PMS 154 • PM6 5 • 9 feb ’99/rcb
is not asked to answer the same questions. Byusing a sampling system in which studentsanswer different questions, and combining testresults into a composite score, tests can revealproficiency across a broad scope of subjectmatter. The scores can represent the results ofseveral hours of testing instead of the resultsof a one-hour individual student test. So wecan learn very well how a group of students isdoing in eighth-grade math, rather than howwell an individual student does on a relativelysmall number of questions that can representonly a fraction of the subject matter taught.
It is the limited range of subject matter inan individual student test that makes its usesuspect for any important purpose. Lyle Jonesin National Tests and Education Reform: Are TheyCompatible? (ETS Policy Information Center,1997), summarizes the case for viewing sucha simple standardized test with care. He quotesRobert Stake, from the University of Illinois:
“Mathematics test scores — that do agood job of indicating which students aredoing best and which are doing relativelypoorly, do not necessarily provide a validindication of subject-matter mastery. Onetest alone will not provide valid measure-ment of the mathematics achievement ofindividual students or of a group as a whole.Test content is almost always too narrow.Just as … a few books do not represent alibrary, 20 or 30 test items do not representthe broad range of mathematics skills andknowledge that teachers are teaching. Formeasurement of subject matter attained, thesimplicity of testing is at odds with the com-plexity of teaching and learning.”
All this is true of testing in a local schooldistrict, even where there is an agreementon the content of instruction within the dis-trict and a common curriculum. The prob-lem of having a test that measures masteryof a subject area, and enables comparisonof scores among students, is greatly magni-fied when the test is the same but the stu-dents are studying different content indiffering curricula — which is exactly whata national test does. There is some common-ality in American instruction, but there isvariation also, and this variation coupledwith the pitfalls in the use of a single test,even when there is uniformity in instruc-tion, makes the meaning of an individualscore in a National Test very problematic.
There is variation and there will be moreof it as states and localities struggle with rais-ing achievement. While the National Coun-cil of Teachers of Mathematics (NCTM) mathstandards are used in developing state stan-dards they are not copied verbatim, and thereare rebellions. California has recentlyinjected more math of the older style,rejecting the NCTM emphasis on so muchproblem-solving. A study by the AmericanFederation of Teachers found largedifferences in new state standards,using a number of criteria, as did the Coun-cil on Basic Education and the FordhamFoundation. The National Education GoalsPanel has compared the state-by-state evalu-ations made by different organizations.Even within states there will be variation.Fairfax County, VA has recently permittedfour schools to switch to the so-calledcore knowledge curriculum created by
TOO MUCH TESTING • 13
15992 042 02 P li I f R t / T M h T ti F t B k l A t G d I k l k PMS 154 PM6 5 9 f b ’99/ b
E. D. Hirsch, Jr., which focuses more onbasic knowledge and less on “thinkingskills,” which tend to get heavy emphasis inthe emerging content standards (Washing-ton Post, March 2, 1998, p. B1).
The Administration intends to linkindividual scores on the new National Testto the NAEP proficiency scale so that scoreson the new test will be comparable to thoseon NAEP. Given what is known to bepossible, this will be at best a very “roughand ready” link. A recent review of the mat-ter by the National Research Council con-cludes that a linkage of acceptable quality isdoubtful.
There is also a characterization of thewhole effort as “national standards,” as wellas a national test. While national “content”standards have been developed in severalsubjects, with assistance or prodding fromboth this administration and the prioradministration, these standards describe whatstudents should be taught. The Administrationis referring not to these standards, but to the“achievement levels” set for NAEP scores bythe National Assessment Governing Board.3
Through a fairly complex process called theModified Angoff Method, scores for each ofthe three grade levels tested by NAEP at thefourth, eighth, and twelfth grades, are set torepresent Basic, Proficient, or Advanced lev-els. NAEP then reports the percentage of
students below, at, or above these three lev-els of student performance.
This process involves a panel of judgeswho look at the test questions and decidewhich ones a student has to answer correctlyin order to reach one of these three levels.The methods used to do this have beenroundly criticized by most of the membersof the educational measurement communitywho have examined the process. NAGB,however, vigorously defends its procedures,while accepting that its judgment isinvolved. There is no intent here to judgethe matter. The Administration proposeslinking the scores of the new national vol-untary test, so that results determinewhether a student is below the Basic level,or at or above any one of these levels: Theselevels are the “standards” being referred to.Doing so will put a considerable strain onthis level-setting process, and, as conse-quences are attached to these individuals’scores,4 this process will come under veryclose scrutiny by many groups beyond edu-cational measurement experts. The questiongoes not only to the result, but also to thelegitimacy of the process by which standardsare set.
3 Such state content standards are most nearly comparable to the NAEP content frameworks that specify the content that isto be assessed, rather than either to NAEP achievement levels, or to “performance standards” generally, discussed later in thisreport.
4 The matter of the extent to which “consequences” are to be attached, and to whom, has not been clear; the fact that itis to be voluntary suggests this might vary among those entities that use the process.
14 • TOO MUCH TESTING
15992-042 02 • Policy Info Report / Too Much Testing: • Fonts: Berkeley Avant Garde • Inks: lack PMS 154 • PM6 5 • 9 feb ’99/rcb
AN ALTERNATIVE: NATIONAL HELP FOR
LOCAL ACTION
The National Test is under development, sowhether Congress blocks implementation ornot, the resources will be spent on develop-ing test exercises. One constructiveapproach, I believe, would be to use thispool of items to better enable schools, dis-tricts, and states to have a NAEP-linked testthey could use to measure achievement forwhole districts, and possibly whole schools.The contractors now involved, or otherintermediaries, could provide such a serviceto schools to assist in doing this, providinga “School Assessment and Comparison Ser-vice.” The state and local assessments sucha service would help to create would not beNAEP per se, since that really requires verysophisticated survey research to assure com-parability and link scores to a host of stu-dent, teachers, and school characteristics.But such services would be a much moreconstructive use of the $45 million to beexpended than to continue the pursuit ofindividual student scores on a National Test.It would clearly be more sensible thandeveloping this large volume of test items,only to be blocked by Congress frommaking a National Test operational.
Such a School Assessment and Compari-son Service could be a way out of the impassethat has occurred and the polarization in view-points that have developed. The service coulddo things such as the following:
● Supply NAEP-released items and thosenewly developed under the National Testcontract, to states, districts, and schools,and provide technical assistance for theiruse in developing and using tests thatenable estimation of NAEP scale scores(as is now done by the SREB Schools thatWork Consortium).
● Help states and localities develop validstatistical links between their ownaccountability assessments and theNAEP scale showing them the choicesthey can make in embedding NAEPassessment items, or blocks of items, intotheir own tests and alignments of vari-ous kinds.
● Help states and localities make use — ifthey so choose — of NAEP frameworksand scoring guides, perhaps helping aligncurriculum frameworks to the NAEPframeworks.
● Help get NAEP knowledge and toolsdown to the school level, through theliaisons the service would develop withthose who want to make greater use ofNAEP. The National Center for Educa-tion Statistics (NCES) competently“reports out” the NAEP results, but doesnot transform them into a variety offorms and levels of detail for more spe-cific applications.
TOO MUCH TESTING • 15
15992 042 02 P li I f R t / T M h T ti F t B k l A t G d I k l k PMS 154 PM6 5 9 f b ’99/ b
The work done by NAGB and NCES onNAEP and in development of a NAEP-linkedNational Test can be made valuable inimproving achievement at all levels, overand above the routine release of NAEPreports. And the new items developed forthe National Test can be used at state andlocal levels for a variety of purposes.Examples of existing uses of the presentNAEP are instructive:5
● West Virginia is aligning its contentstandards with NAEP frameworks,according to Henry Marockie, the statesuperintendent of schools. And the state’sown tests included “NAEP-like items.”
● “Staff members at the North CarolinaDepartment of Public Instruction arestudying the feasibility of tying NAEPachievement levels to the levels the stateuses to gauge student performances,”according to Michael Ward, state super-intendent of public instruction.
● In New York, BOCES (Board of Coop-erative Educational Services) used“NAEP results in designing pre-assessment and post-assessment tasksthat we embedded in instruction,”according to Phyllis Aldrich, coordina-tor of gifted education at an upstateBOCES.
● In designing a mathematics assessmentin Minnesota, a group of teachers doingthe design “found NAEP’s released math-ematics items to be a valuable source ofideas for their work,” according to JamesE. Ellingson, who served on the NationalAssessment Governing Board from 1995to 1998.
For the proponents of a National Test,such a School Assessment and ComparisonService could result in NAEP and NAEP-based assessments being used in a widevariety of ways, at district, school, andteacher levels. Also, achievement compari-sons could be made with national, regional,and state NAEP results (although not withthe rigor of regular NAEP assessments,which involve sophisticated research).
For the opponents of the National Test,who object to intrusion in state and localaffairs that might come about from such atest, teachers, schools, districts, and stateswould become clients of such a service, get-ting help in fashioning what they want todo, with different patterns emerging.
5 Culled from Standards Count, a volume of papers prepared for the Tenth Anniversary Conference of the National Assess-ment Governing Board, November 19, 1998.

16 • TOO MUCH TESTING
15992-042 02 • Policy Info Report / Too Much Testing: • Fonts: Berkeley Avant Garde • Inks: lack PMS 154 • PM6 5 • 9 feb ’99/rcb
This approach does require more patience.Both the Clinton and Bush administrationshave encouraged such efforts, and bothadministrations have played a role inencouraging national (not federal) contentstandards. These national standards have ledstates to develop their own modifications.The math standards led the way, emergingfrom the work of the National Council ofTeachers of Mathematics, begun in the early1980s; 42 states had content standards in1998. Science is second, with 41 states, andemerged from the work of the National Sci-ence Teachers Association, the AmericanAssociation for the Advancement of Science,and the National Research Council. Thereare now 40 states with social studies/historystandards; English and Language Arts fol-low, with 37 states having established stan-dards. About half the states now havestandards in foreign languages, health, andphysical education.
The Council of Chief State School Offi-cers (CCSSO) reports that these states have“standards ready for implementation.” Theextent of actual implementation varieswidely; such standards mean little until theyare translated into curricula.
This standard setting has led to a con-structive dialogue in the great majority ofstates about what should be taught in theschools, and at what level. What better placeis there to begin a process of reforming the
schools and raising achievement? The 1997review of these developments by the Coun-cil of Chief State School Officers summed itup this way:
“State initiatives in the 1990s todevelop state standards and frameworkdocuments differ from earlier state effortsin several ways. First, the pattern acrossstates is widespread involvement of localeducators, community leaders, businessgroups, and political leaders; a dialogue andreview concerning what should be taughtand learned in mathematics and science.
…a second development in the 1990sis active involvement of classroom teachersin writing and editing content standards andframeworks …. A common practice forstates in producing standards documents isto convene a large steering committee ortask force which represents educators,administrators, subject specialists, and com-munity leaders from across the state ….[The process also] developed new alliancesamong educators and the public, as theyjointly defined the directions for mathemat-ics and science education for children.”
These content standards vary in a num-ber of respects. Some just spell out content.Others go well beyond to give more detailed“benchmarks” concerning what students
THE PATIENT APPROACH:CONTENT STANDARDS AND ALIGNED ASSESSMENT
The greatest promise continues to be inintensifying efforts to establish strong standards for the content of instruction, develop-ing curricula reflecting this content, and aligning assessments to the curricula actuallybeing taught.
TOO MUCH TESTING • 17
15992 042 02 P li I f R t / T M h T ti F t B k l A t G d I k l k PMS 154 PM6 5 9 f b ’99/ b
should accomplish, describe what is expectedof students, give examples of approaches toteachers, give guidance on how to assess stu-dents’ accomplishments, and also address pro-fessional development. And some fall inbetween. They vary in rigor and quality, andthey are often a work in progress. Proposalsare also in various stages of implementation,with much to do to develop new curriculaand begin professional development of theteachers who have to use them.
A comprehensive review of the state ofstandards-setting in math and science isincluded in the CCSSO report of 1997, Math-ematics and Science Content Standards andCurriculum Frameworks, State Progress onDevelopment and Implementation (now updatedin 1998). The American Federation ofTeachers, the Council of Basic Education, andthe Fordham Foundation have all looked atthese standards with a critical eye, and haveoften reached strikingly different conclusions.For a great many states there is still a longway to go, even in math and science, whichare far ahead. But it is the right direction to go,and deserves the focused attention of all whowant to raise the level of achievement ofAmerican students. The path will be difficultto assess more subjects, to develop curricu-lum and instructional materials, to encourageteacher development and proper assessments,and to establish performance standards.
For most states, the alignment of assess-ments is a big task ahead. By 1998, CCSSOwas reporting that almost all the states hadsome kind of content standards in place. But29 of those states also reported in 1997 thattheir assessments were not yet aligned with
standards. So, frequently, the system is dividedagainst itself — new content standards withold tests that do not reflect the new contentand the curriculum. What counts for studentsand schools, still, are the results on the oldtests.
One example of what is required is whatPennsylvania is doing, beginning in the fall of1998, as reported by Education Daily(11/2/98). In a move to help teachers alignclassroom instruction to the standards, stateofficials have mailed 50,000 resource kits toschools across the state. Developed by morethan 100 teachers, the new ClassroomsConnection’s Resource Kit contains an over-view of the standards; assessment tips andinstruction strategies; resources for parents;sample lesson plans; and professional devel-opment ideas. All this is also available onCD-ROM and, by January 1999, all the mate-rials will be available on the state educationdepartment’s Web site. What alignmentmeans, however, will vary among the states,depending on how much local variation thestate tolerates, and its views concerningdesirable levels of decision-making. In gen-eral, activity has occurred at the state level.The process must devolve to the communitylevel, and educators in inner cities, who oftenfeel left out of the process, must participate.
A dialogue on what should be taught inschool seems healthy. Once “content stan-dards” are established, they mean nothingunless they affect the curriculum that is in use.However, whether these must be statewidestandards or localized standards, and to whatextent there is benefit in completely standard-izing the curriculum are open questions. The
18 • TOO MUCH TESTING
15992-042 02 • Policy Info Report / Too Much Testing: • Fonts: Berkeley Avant Garde • Inks: lack PMS 154 • PM6 5 • 9 feb ’99/rcb
benefit in any particular school or localitydepends on the circumstance of its schools,its history, and its current dynamics. In theU.S., the responsibility for education is givento the individual state. Exercising that respon-sibility, states have varied widely in how muchlocal discretion they have permitted, and howmuch uniformity they have required.
TOO MUCH TESTING • 19
15992 042 02 P li I f R t / T M h T ti F t B k l A t G d I k l k PMS 154 PM6 5 9 f b ’99/ b
States must assess how much of that contenta student needs to master, and whether anassessment will show that students havelearned the content standards. The questionbecomes: what score is necessary for per-formance to be judged acceptable, oradvanced? Teachers do it by judgment whenthey assign an A or a C to students who haveall studied the same material. Setting these“cut points” on assessments means confront-ing the wide dispersion of achievementamong students in any one grade. A stan-dard the bottom third of students can rea-sonably be expected to reach under highercontent standards will be no incentive forthe students higher up the scale. A standardhigh enough to challenge those up the scalewill likely be out of reach for those below,at least given the limitations schools arelikely to have in terms of resources.
A set of content standards and a set oftest questions intended to reflect that con-tent lead directly to setting performancestandards. Yet setting content standards hasbeen the work of educators (with theinvolvement of various publics). Setting per-formance standards on tests has been thework of measurement experts and psycho-metricians. The bridge between the two hasnot been constructed. A review of the
various means used to set such performancestandards was recently provided, in a formfor a more general audience, in a 20-pagereport called Setting Performance Standards:Contents, Goals, and Individual Differences, byBert F. Green of Johns Hopkins University,and published by the ETS Policy Informa-tion Center in 1996. He sums up the situa-tion as follows:6
“The performance standards have toreflect the content standards. The bridgefrom the content standards to the perfor-mance standards depends on the test speci-fications, the item writers and test editors,and on the resulting performance measure-ment scale. Logically, it would seem prefer-able for the judges to set standards just onthe content domain. They could identifywhat parts of the domain are basic, whatparts go with proficient persons, and whatparts would mainly be mastered byadvanced students. It is not at all clearhow to do this [emphasis supplied], but away might be found. Judges might also beuseful in evaluating the bridge from con-tent to performance. This would seem amore straightforward task than imaginingthe test behavior of marginally competenttest-takers ….
6 In other countries, there is greater reliance on the judgment of panels created to set standards, and much less use of thepsychometric procedures that have developed in the U.S.
THE CHALLENGE OF SETTING PERFORMANCE STANDARDS
Even when assessments reflect contentstandards, the task of establishing performance standards remains.

20 • TOO MUCH TESTING
15992-042 02 • Policy Info Report / Too Much Testing: • Fonts: Berkeley Avant Garde • Inks: lack PMS 154 • PM6 5 • 9 feb ’99/rcb
In summary, the psychometric problemof determining just where a cut-point shouldbe placed on a scale seems not to be a centralfeature of standard setting …. And finally,finding a way to map content standards ontoperformance standards is a challenge.
Beyond the performance standardsreflecting the content standards as discussedabove, there is the issue that the form ofthe assessment tasks be appropriate to thestandards. For example, if a standard callsfor the student “to know” something, a shortconstructed-response item might be appro-priate, but more might be required if thestandard calls for a student to “be able toanalyze the results of ….”
CCSSO reported that in November of1998, 21 states had established perfor-mance standards that met the review cri-teria established by the U.S. Departmentof Education. This means those stateswent through the prescribed steps, but theDepartment has not ruled on the qualityof the work, or the appropriateness of thecut points set by these states.
We are speaking of a challenge in settingcut points on a standardized instrument usedfor large-scale assessment, used for account-ability, or possibly for promotion or gradua-tion. At the classroom level these test resultsare not determinants of teachers’ judgmentsof student performance. Once content stan-dards have evolved into curriculum, and intopedagogical approaches, teachers will be thejudges in the classroom. They give the testsand assign the grades. They will do it as
professionals, not as psychometricians usingstatistical methodologies. (At the end of thisreport we say more about the critical rolethat teachers play, and the need to help themuse assessment in service of learning.)
Here then is the situation we find our-selves in at the end of about two decades ofeducation reform. Most states have contentstandards established in at least some sub-jects. A minority of these have assessmentsthat they say are aligned to these standards;and only 11 states have trend data on stu-dent achievement for two or three years. Insome key subjects, just half the states havecontent standards. Where performance stan-dards have been established, we do notknow how directly the standards are linkedto the content standards, and whether orhow these states overcame the challengesGreen says they face.
The whole content-assessment-perfor-mance approach is incomplete, and to theextent that this approach is the linchpinof “educational reform,” we don’t haveit adequately in place as we approach theyear 2000. But steady progress is beingmade.
TOO MUCH TESTING • 21
15992 042 02 P li I f R t / T M h T ti F t B k l A t G d I k l k PMS 154 PM6 5 9 f b ’99/ b
No, there would still be some work to do.In many respects, standardized testing isat its zenith, and reaches elegance in suchthings as its refined principles, standardsof validity and reliability, latent trait analy-sis, equating, and techniques of spottingbiased test items.
But the way tests are used in practicein elementary and secondary education —of rewarding and punishing schools,closing schools, and judging educationalprogress — is often appallingly primitive.Frequently,
● Commercial standardized tests are usedthat measure a blend of what is beingtaught across the nation — not what istaught in a school or district (and notwhat is supposed to be taught).7
● The test content changes from time totime to reflect changing views of whatshould be taught. Yet the scores from yearto year are used to judge whetherprogress is being made.
● In many cases, norm-referenced testsdesigned to show how one school’s
students compare with those in the entirenation are used to track change in theschool’s performance over time, a taskthey are not designed to do.
● While the tests are presumed to judgethe quality of what the school does, alarge part of an individual’s score isattributable to family backgroundand opportunities before schooland outside the classroom. Current teststhat measure both the quality of currentin-school instruction and out-of-schooldevelopment are used to unfairly rewardor punish schools, or close them downentirely.
● While tests are presumably usedto determine how well the schoolinstructs from the beginning of one gradeto the beginning of the next grade, thetests actually determine the cumulativelevel of knowledge of eighth graders, forexample — not what knowledge wasadded during the eighth grade. It is rareto have a measure of “value added,” ameasure of the change in the levels ofknowledge between two points in time.8
ACCOUNTABILITY, BUT FOR THE RIGHT THINGS
I f the standardized tests used for school,district, and state accountability were switched from the intrusive testing of everystudent to sample-based assessments, and assessments were aligned to content stan-dards, would we be on the right track in standardized testing for accountability?
7 Testing for what is actually taught has been given extended discussion and debate under the rubric of “opportunity tolearn,” and encompasses resource levels and adequacies as well as curriculum content and instruction.
8 Robert Stake points out the challenge to value added measures from the fact that single scores are more reliable than thechange in scores from, say, one year to the next (personal correspondence).
22 • TOO MUCH TESTING
15992-042 02 • Policy Info Report / Too Much Testing: • Fonts: Berkeley Avant Garde • Inks: lack PMS 154 • PM6 5 • 9 feb ’99/rcb
This summary covers a very wide terri-tory. Each point deserves elaboration. Anumber of scholars have examined thesematters and the impact such practices haveon instruction and student achievement.9
Measuring and comparing what studentshave learned in school in a given timeperiod is quite different from measuring andcomparing the total of what they know. Oneearly recognition of the difference wasreflected in the 1984 South Carolina Edu-cation Improvement Act, a broad measureto improve schools in the state. It called fora number of measurement approaches toreward and penalize schools; two aredescribed here.10
First, the act dealt with the different lev-els of students’ socioeconomic backgroundsby grouping the state’s schools into five com-parison groups based on certain context vari-ables. These included the percentage offree-lunch eligible students and, for elemen-tary schools, the percentage of first-gradestudents meeting the state readiness stan-dards. Schools within each of the five groupswere compared on achievement results.
Second, it dealt with the matter of howmuch is learned within a school year, as com-pared to total knowledge accumulated.Kaagan and Coley describe it this way:
“… The report cards present a matchedlongitudinal analysis of reading and math-ematics test scores for the two most recenttest administrations. Put simply, this pro-cedure allows the calculation of score gains(or losses) of the same students from oneyear to the next [emphasis supplied].”
Thus school accomplishments were notto be judged simply in terms of backgroundthat students brought to school with them;nor teachers in terms of what students hadalready been taught (or not taught) whenthey entered their classrooms. Instead, stu-dents would be judged on what they hadlearned in the classroom. This was a hugedeparture in the use of standardized testingas it had developed in the 1970s and 80s.While other states have used regressionapproaches to sort out school and non-school accomplishments, they have notused gains in scores as the measure ofachievement.
For the nation, regions, and for state dataon a comparable basis, we have relied onthe reports of the National Assessment ofEducational Progress (NAEP). For the nationand regions NAEP has been providing a con-tinuous record of school achievement foralmost three decades, and more recentlyhas provided a record for states that have
9 A recent survey of such work is “the Political Legacy of School Accountability Systems,” by Sherman Dorn of theUniversity of South Florida (In Education Policy Analysis Archives, 6, (1), January 2, 1998). Also, see “The Adverse Impact ofHigh Stakes Testing on Minority Students: Evidence From 100 Years of Test Data,” by George Madaus and Marguerite Clarke, atthe National Board on Educational Testing and Public Policy at Boston College, December, 1998. Also see Robert Stake, “TheInvalidity of Standardized Testing for Measuring Mathematics Achievement” in Thomas A. Romberg, Editor, Reform in SchoolMathematics and Authentic Assessment. Albany: SUNY Press, 1995.
10 The South Carolina indicator system is described in State Education Indicators: Measured Strides, Missing Steps, bySteven Kaagan and Richard Coley, published by Rutgers University and Educational Testing Service in 1989.
TOO MUCH TESTING • 23
15992 042 02 P li I f R t / T M h T ti F t B k l A t G d I k l k PMS 154 PM6 5 9 f b ’99/ b
participated in the program. These reportshave all been about levels of achievement atages 9, 13, and 17 or grades 4, 8, and 12.Thus, we can compare the scores in math-ematics for students in grade 4 in 1996 withscores of fourth-graders in earlier years.Again, when we look at trends in thesescores of fourth-graders, we know whetherthey now know more. We can’t tell whetherit is because they were better developed bythe time they were in the first grade, hadlearned more in grades 1 through 3, or hadlearned more in grade 4 — the year in whichthey were being tested. Have the schoolsperformed better? Or is it the family? If it isthe schools, was the change due to betterteaching in the second grade? Or the fourthgrade? Or both? Change over time may beinfluenced by any one of these, or by a com-bination of factors.
A redesign of NAEP in the early 1980sled to a provision for tracking a cohort ofthe same students, in addition to measur-ing the level of fourth graders at a given time,compared to some previous time. The datahas been examined from this standpoint; theETS Policy Information Center published areport in 1998 describing achievement inthese terms of “value added” (Growth inSchool: Achievement Gains from the Fourth tothe Eighth Grade, by Paul E. Barton andRichard J. Coley).
What emerged was quite a different pic-ture from that given by the NAEP reportsbased on the levels of student knowledge in
a particular grade (or at a particular age),compared with the levels of their counter-parts in earlier years. The report explainedit this way:
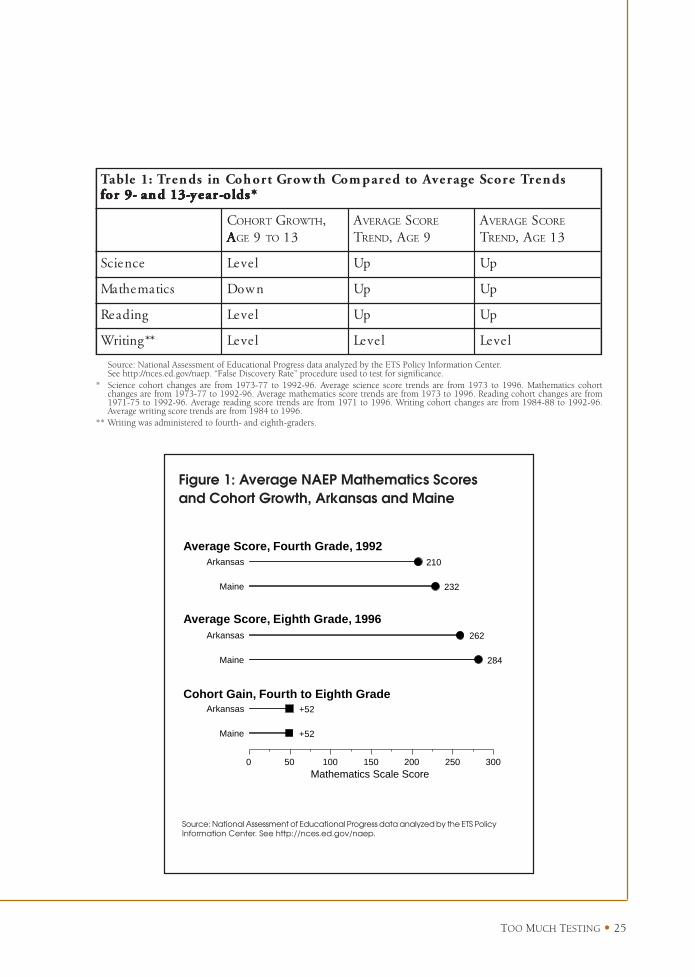
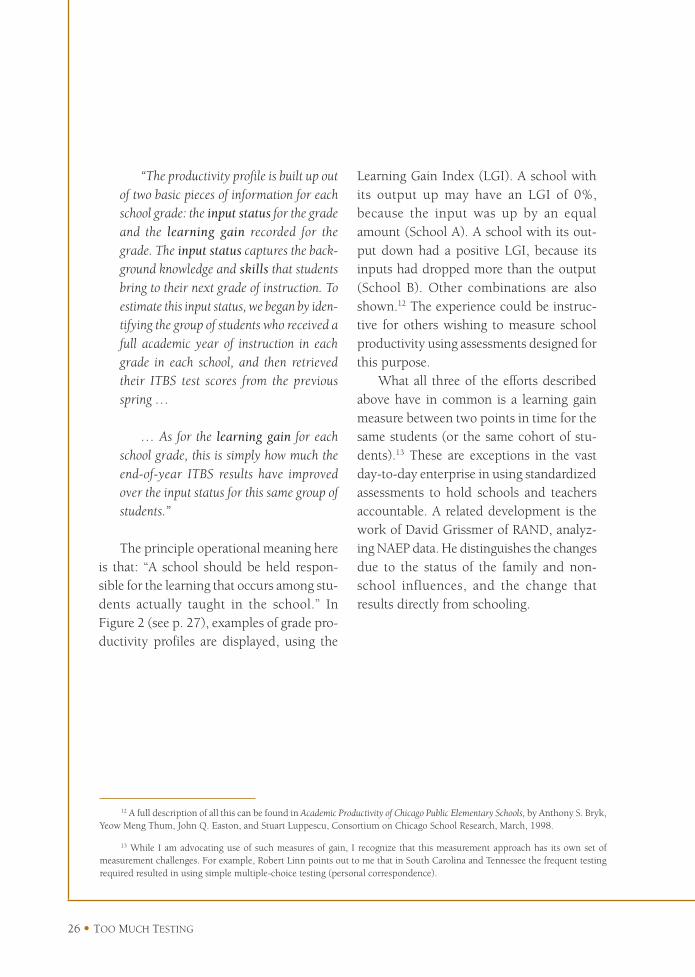
While in most cases the average NAEPscores of today’s students are slightly higherthan those of students 20 or 25 years ago,the cohort growth between the fourth andthe eighth grade is not. In fact, cohort growthis the same as, or lower than, it was duringthe earliest period for which we have data.
And when we compare states, there islittle difference in the cohort growth betweenthe fourth and eighth grade. While Mainewas the top-scoring state in the nation11 andArkansas was the bottom-scoring state, bothstates had the same cohort growth, 52 pointson the NAEP scale (in mathematics)between the fourth and eighth grade.
How do we, and how should we, lookat NAEP scores in reaching a judgment asto whether the education system is perform-ing better or worse over time? Are Maineand Arkansas at the two ends of the schoolquality continuum, or are they actuallyequal?
11 Among the 37 states participating in NAEP in both 1992 and 1996.

24 • TOO MUCH TESTING
15992-042 02 • Policy Info Report / Too Much Testing: • Fonts: Berkeley Avant Garde • Inks: lack PMS 154 • PM6 5 • 9 feb ’99/rcb
The comparison of trends in cohortgrowth and averages at a particular grade isshown in Table 1. The Maine/Arkansas com-parison is shown in Figure 1.
The Growth in School report urged thatwe be able to measure both changes in thelevels of same grade student knowledge, andchanges in the knowledge of the same stu-dents between two points in time. And weasked whether standards should be set forboth kinds of change, if we are to have astandards-based assessment system.
From NAEP, to state, to district, to schoolstandardized testing, it is levels of achieve-ment that are measured — not growth inwhat students know and can do. Theexception of South Carolina in the early1980s was noted above. Also, since 1992,Tennessee has used the Value-Added Assess-ment System. Recently, Memphis CitySchools used this assessment (TCAP) tocompare student achievement gains in 25elementary schools that began implement-ing national school redesign models in1995-96 with a comparable group of schoolsthat were not redesigned. The comparisonmeasured year-to-year gains in achievement,and redesigned schools showed greatergains. Chicago has also created a system thatenables judging schools on this basis, eventhough the testing system itself was notdesigned for this use.
Chicago’s changes were set in motionby the 1988 Chicago School Reform Act.That Act decentralized control to the indi-vidual school level, and created a need toexamine resulting improvement in achieve-ment. The test used then was the Iowa Test
of Basic Skills (ITBS). Because of the use ofdifferent forms of the test, changes in thecontent from time to time, and itsnorm-referenced characteristics, ITBS wasnot an accurate measure of trends in achieve-ment over time for individual schools, oreven for levels of achievement at individualgrades. The Consortium on Chicago SchoolResearch, working under the Chicago Panelon School Policy, has spent years creating asystem to measure the productivity of indi-vidual schools, and is now using it to do so.
Researchers equated the different formsof the ITBS, the different tests used in dif-ferent years, and the tests used at differentgrade levels. This enabled them to place allstudents who took the test on the sameachievement scale. They called this scale the“Measurement Ruler.” Test questions areplaced at different intervals along this ruler,to illustrate the level of difficulty. The result isa developmental scale similar to what NAEPuses. The difference is that NAEP assessmentsare designed to enable creation of a scale onwhich students in all three grades assessed canbe arrayed. Making such a scale out of theITBS norm-referenced test created a far-from-perfect result. Its creators (and others) pointout that the data limitations are considerable,and call for a better measure of achievement.This approach is described here because ofthe principle it has put into operation in evalu-ating schools in Chicago, despite the handi-caps of the tests that are now available.
What the Consortium has created iscalled a “Grade Productivity Profile.” Theconsortium describes it as follows:
TOO MUCH TESTING • 25
15992 042 02 P li I f R t / T M h T ti F t B k l A t G d I k l k PMS 154 PM6 5 9 f b ’99/ b
sdnerTerocSegarevAotderapmoChtworGtrohoCnisdnerT:1elbaT*sdlo-raey-31dna-9rof *sdlo-raey-31dna-9rof *sdlo-raey-31dna-9rof *sdlo-raey-31dna-9rof *sdlo-raey-31dna-9rof
C TROHO G HTWOR ,AAAAA EG 9 OT 31
A EGAREV S EROC
T DNER , A EG 9A EGAREV S EROC
T DNER , A EG 31
ecneicS leveL pU pU
scitamehtaM nwoD pU pU
gnidaeR leveL pU pU
**gnitirW leveL leveL leveL
Source: National Assessment of Educational Progress data analyzed by the ETS Policy Information Center.See http://nces.ed.gov/naep. “False Discovery Rate” procedure used to test for significance.
* Science cohort changes are from 1973-77 to 1992-96. Average science score trends are from 1973 to 1996. Mathematics cohortchanges are from 1973-77 to 1992-96. Average mathematics score trends are from 1973 to 1996. Reading cohort changes are from1971-75 to 1992-96. Average reading score trends are from 1971 to 1996. Writing cohort changes are from 1984-88 to 1992-96.Average writing score trends are from 1984 to 1996.
** Writing was administered to fourth- and eighth-graders.
Arkansas
Maine
Arkansas
Maine
Arkansas
Maine
0 50 100 150 200 250 300
210
232
262
284
+52
+52
Mathematics Scale Score
Average Score, Fourth Grade, 1992
Average Score, Eighth Grade, 1996
Cohort Gain, Fourth to Eighth Grade
Figure 1: Average NAEP Mathematics Scoresand Cohort Growth, Arkansas and Maine
Source: National Assessment of Educational Progress data analyzed by the ETS PolicyInformation Center. See http://nces.ed.gov/naep.
26 • TOO MUCH TESTING
15992-042 02 • Policy Info Report / Too Much Testing: • Fonts: Berkeley Avant Garde • Inks: lack PMS 154 • PM6 5 • 9 feb ’99/rcb
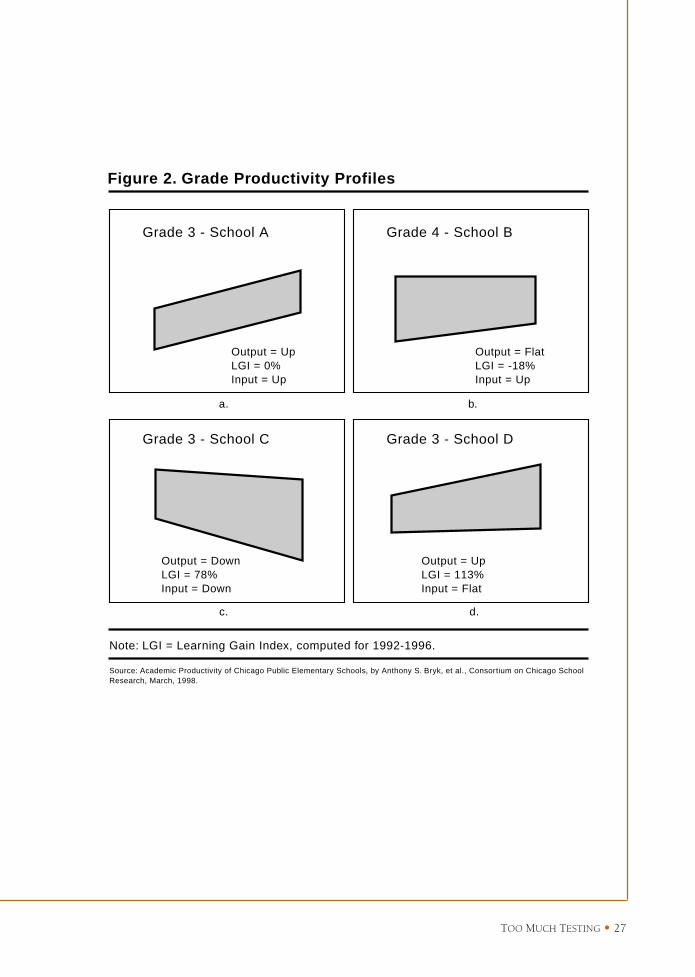
“The productivity profile is built up outof two basic pieces of information for eachschool grade: the input status for the gradeand the learning gain recorded for thegrade. The input status captures the back-ground knowledge and skills that studentsbring to their next grade of instruction. Toestimate this input status, we began by iden-tifying the group of students who received afull academic year of instruction in eachgrade in each school, and then retrievedtheir ITBS test scores from the previousspring …
… As for the learning gain for eachschool grade, this is simply how much theend-of-year ITBS results have improvedover the input status for this same group ofstudents.”
The principle operational meaning hereis that: “A school should be held respon-sible for the learning that occurs among stu-dents actually taught in the school.” InFigure 2 (see p. 27), examples of grade pro-ductivity profiles are displayed, using the
Learning Gain Index (LGI). A school withits output up may have an LGI of 0%,because the input was up by an equalamount (School A). A school with its out-put down had a positive LGI, because itsinputs had dropped more than the output(School B). Other combinations are alsoshown.12 The experience could be instruc-tive for others wishing to measure schoolproductivity using assessments designed forthis purpose.
What all three of the efforts describedabove have in common is a learning gainmeasure between two points in time for thesame students (or the same cohort of stu-dents).13 These are exceptions in the vastday-to-day enterprise in using standardizedassessments to hold schools and teachersaccountable. A related development is thework of David Grissmer of RAND, analyz-ing NAEP data. He distinguishes the changesdue to the status of the family and non-school influences, and the change thatresults directly from schooling.
12 A full description of all this can be found in Academic Productivity of Chicago Public Elementary Schools, by Anthony S. Bryk,Yeow Meng Thum, John Q. Easton, and Stuart Luppescu, Consortium on Chicago School Research, March, 1998.
13 While I am advocating use of such measures of gain, I recognize that this measurement approach has its own set ofmeasurement challenges. For example, Robert Linn points out to me that in South Carolina and Tennessee the frequent testingrequired resulted in using simple multiple-choice testing (personal correspondence).
TOO MUCH TESTING • 27
15992 042 02 P li I f R t / T M h T ti F t B k l A t G d I k l k PMS 154 PM6 5 9 f b ’99/ b
Grade 3 - School A
Output = UpLGI = 0%Input = Up
Grade 4 - School B
Output = FlatLGI = -18%Input = Up
Grade 3 - School C
Output = DownLGI = 78%Input = Down
Grade 3 - School D
Output = UpLGI = 113%Input = Flat
Note: LGI = Learning Gain Index, computed for 1992-1996.
Source: Academic Productivity of Chicago Public Elementary Schools, by Anthony S. Bryk, et al., Consortium on Chicago School Research, March, 1998.
Figure 2. Grade Productivity Profiles
a. b.
c. d.

28 • TOO MUCH TESTING
15992-042 02 • Policy Info Report / Too Much Testing: • Fonts: Berkeley Avant Garde • Inks: lack PMS 154 • PM6 5 • 9 feb ’99/rcb
EXIT EXAMINATIONS?
A discussion entitled “Too Much Testing”would be incomplete without pointing out that there is one area where there is verylittle testing whatsoever in the U.S., and there is a lot in other developed countries.
14 The book is entitled Secondary School Examinations: International Perspectives on Policies and Practices, by Max A.Eckstein and Harold J. Noah (published by the Yale University Press). I recommend it for anyone wanting an understandingof practice abroad and how it contrasts to practice in the U.S.
Most countries require extensive examina-tions at the exit point for secondary educa-tion. The U.S. does not have high schoolexit tests, except for students taking Regentscourses in New York State. (We are notspeaking of basic skills tests students mustpass to graduate, requiring minimal abili-ties in reading and mathematics.)
In 1993, a very comprehensive studywas published of the exit examinationapproaches of the U.S., China, Japan,Germany, England and Wales, France,Sweden, and the former Soviet Union.14 Thecontrast is stark. Eckstein and Noah put itthis way: “The United States is uniqueamong the countries we have studied inhaving no coordinated, public, national sys-tem for assessing student achievement at theend of secondary school.” (p. 238)
The examinations in these countries arevery closely related to the curriculum. Inthe U.S., it is hard to conceive of anynational exam being closely related to theactual curriculum for such a high stakesexamination, because of the decentralizedcontrol over the curriculum. Eckstein andNoah observe that “governmental control ofthe school curriculum in the United Statesand England and Wales has been extraordi-narily weak, sometimes even absent,” and
further that “Decentralization of school con-trol has been even greater in the UnitedStates than in England/Wales.”
While a centralized exit examination sys-tem in the U.S. may be out of the questiongiven the decentralized control and resourceallocation decisions, that does not limit theintroduction of decentralized exit examina-tion systems. Eckstein and Noah concludewith an examination of “The PersistentDilemmas of Examination Policy;” and tryto answer the question “How can the UnitedStates secure [the] advantages, while avoid-ing, or at least minimizing, the disadvan-tages that may accompany them?”
A more recent look at the internationalscene was reported in 1997 in InternationalComparisons of Entrance and Exit Examina-tions, by Harold W. Stevenson and Shin-yingLee, in collaboration with five of their col-leagues at the University of Michigan. Fromtheir study of Japan, the United Kingdom,France, and Germany they observe:
“Entrance and exit examinations inthese countries are based on a curriculumestablished by ministries of education at thelocal, regional, or national level. Ratherthan imposing some arbitrarily definedstandard of achievement, the examinations

TOO MUCH TESTING • 29
15992 042 02 P li I f R t / T M h T ti F t B k l A t G d I k l k PMS 154 PM6 5 9 f b ’99/ b
are closely tied to what the students havestudied in high school. Because teachers areaware of what students are expected toknow in examinations, it becomes theirresponsibility to equip students with theinformation and skills needed to pass theexamination.” (p. 47)
And on the nature of the examinationsthemselves:
“These examinations typically includeopen-ended questions that require organi-zation and application of knowledge, andoral examinations that require students toexpress themselves verbally” (p. 47)
This is all quite different from the manytests we have — tests that are cheap, allor heavily multiple-choice; used to establishhow much students don’t know and haven’tbeen taught; and used to grade teachers andschools rather than as a constructive tool ofinstruction.
But we do have some experience withtests that are designed to reflect curriculum.The Advanced Placement examinations dothat and represent an external verificationof whether standards were met. And we do,at present, have one set of examinations withsimilarities — the Regents Examinations inNew York State. The New York Regents arelow- to medium-stakes tests taken in differ-ent subjects in Regents courses at different
high school grades, at the student’s discre-tion. Regents courses or Regents tests arenot required to get a high schooldiploma (although that is changing).15 Andthe results of the tests are only a fraction ofwhat determines a grade. The results ofRegents tests, in terms of their effect onachievement, have been investigated by JohnBishop and reported in a monograph.16
New York State is now phasing in arequirement that all student pass Regentsexaminations in five core subject areas, tobe fully effective with students graduatingin 2003. This transforms these tests intohigh-stakes tests with widespread ramifica-tions. John Bishop’s analysis leads him toconclude that:
“Requiring that all students reach theRegents standard in 5 Core Subjects will sig-nificantly increase student achievement, col-lege attendance and completion, and thequality of jobs that students get after highschool. The biggest beneficiaries of the policywill be the students, often from disadvan-taged backgrounds, who have been allowedto avoid rigorous courses in the past. In theAll-Regents high schools,17 there was a mas-sive reallocation of teacher time andresources toward struggling students. It wasthese students whose achievement rose themost. Their probability of going to and com-pleting college rose significantly.” (p. 4)
15 But passing has been required for a “Regents Diploma.” This is a very old system and practices have varied.
16 Diplomas For Learning, Not Seat Time: The Impacts of New York Regents Examinations, published by the Cornell UniversityCenter for Advanced Human Resources (with Joan Moriarty and Ferran Mane).
17 Ten schools have already moved to all Regents courses.
30 • TOO MUCH TESTING
15992-042 02 • Policy Info Report / Too Much Testing: • Fonts: Berkeley Avant Garde • Inks: lack PMS 154 • PM6 5 • 9 feb ’99/rcb
John Bishop and his colleagues offer anumber of ways to avoid adverse effects.
Maryland also is now in the process ofinstalling high school exit tests. Of course,not all will agree with the New York orMaryland claims for their approach, or withJohn Bishop’s conclusions, but, nobodyagrees on much of anything in Americaneducation. For example, concerns have beenraised about the effect on lower-achievingstudents, and whether all students will havethe opportunity to learn what is required inthe examinations. John F. Jennings, directorof the Center on Education Policy, voicedthis concern strongly in his article in Educa-tion Week entitled “Opportunity to Learn orLose?”, referring to the general movementto raise standards in the schools. Studentsmust have an opportunity to learn, and stu-dents who are not challenged by high stan-dards and expectations will be shortchangedby the school they attend.
Obviously, I have not stated a clearposition on the value of exit examinations,yet I do think the matter is worth attentionand examination. Why is the U.S. uniquein not having such examinations? What canwe learn from the experience of other coun-tries? Such examinations can take manyforms, and can even be created by the teach-ers in an individual school. Unfortunately,there are also opportunities for a new arenafor the misuse of testing, of the kinddescribed in this report.
My criticisms of massive testing in theU.S. are not based on the philosophicaldebate about local control vs. higher con-trol. Above, I have argued on other bases,and I argue for higher standards. It wouldbe consistent with those arguments to haverigorous exit examinations.18 But examina-tions must be formulated at the same levelas the curriculum, and must involve teach-ers. They must cover the full curriculumstudied. They should be only one factor indeciding whether a student graduates, ratherthan the sole factor.
18 A similar set of issues and concerns arises in the use of standardized tests to determine promotion from one grade to theother, and I have not examined current experience and the evaluation of it for this paper. This use has been advanced to put anend to “social promotion.” But good teacher assessment and grading can do that, and a single test should not be the sole basis fora promotion.
TOO MUCH TESTING • 31
15992 042 02 P li I f R t / T M h T ti F t B k l A t G d I k l k PMS 154 PM6 5 9 f b ’99/ b
IT COMES BACK TO TEACHERS
This report began with a discussion of thecurrent excess of standardized testing.
While we need to complete the content-assessment-performance triad, we do notneed this ever-larger volume of standardizedtesting of individual students to renderindividual scores. Aligned assessments canexamine whether educational achievementis progressing, and for what kinds of stu-dents. Teachers should be the judges of per-formance, give out the grades, and pass orfail students. Aligned standardized instru-ments can be used on a sampling basis, orwithout assigning individual scores, forschool accountability purposes and track-ing achievement changes, as they have beenin the past.19
This position will leave a lot ofpeople concerned that while testing andgrading is left up to the teachers, theyhave not been well prepared to conductquality assessments. They are taught littleabout day-to-day classroom assessmentapproaches in school. Nor is much profes-sional development offered. Assessment ispart of teaching and instruction, and teach-ers must learn to adequately assess students.Given continued emphasis on standardizedtesting to hold teachers and schools account-able, the alternative of equipping teachersto do their jobs will continue to be neglected.Teachers and teaching need help. We canhave external verification of how well the
students in a class or school are doingthrough sample-based standardized assess-ments that are properly designed andaligned.
We are in danger of focusing too muchon highly structured systems — largely foroutside control — and not on the teacheras a professional. We give doctors the pro-fessional competencies to treat patients; allpatients with infections are not given stan-dardized examinations by third parties to seeat what rate their infections receded. It is,and will remain, the teacher who deliversthe “content,” who aligns his or her assess-ment methods to this content, and whojudges performance. The elevation of theteaching practice to a teaching professionthat has our confidence cannot be avoidedthrough these formal exercises taking placeoutside the classroom, as important as theymay be when properly used. If we examinethis problem realistically, for all the rhetoricand activity of the 1990s, we have not begunto remake the profession. A reading orre-reading of John Goodlad’s Teachers forOur Nation’s Schools would be a good placeto start.
There are many today who believe thatAmerican education was better, 30, 40, or50 years ago. Some have pointed toMcGuffey’s readers and made comparisons
19 If tests are used to judge teachers and schools, they should measure gains in achievement, not just levels of knowledge.
32 • TOO MUCH TESTING
15992-042 02 • Policy Info Report / Too Much Testing: • Fonts: Berkeley Avant Garde • Inks: lack PMS 154 • PM6 5 • 9 feb ’99/rcb
with Dick and Jane. People rememberdemanding teachers who took no nonsensein the classroom, and meted out punishmentsurely and swiftly. Examples of outstandingteaching abound, such as the one-roomschool in Kentucky, that the writer JesseStuart described in The Thread That RunsSo True. He describes how he taught hischarges, who won a contest in the cityschools. If there was such superior teachingand learning in the old days, it was donewithout the standardized testing we knowtoday. That is something worth thinkingabout.
We can move toward more profession-alism in teaching and toward respecting thejudgments teachers make about their stu-dents’ learning. At the same time, we canmove toward “less frequent but far bettertesting,” in the words of Albert Shanker’sreport in 1993. Shanker was a proponent ofgood testing with consequences to the stu-dent and to schools. Americans mustdemand higher standards in testing, as theyare demanding higher standards in educa-tion generally. Standardized testing, usedproperly, may tell us whether the standards-based reforms are working. In and of itself,testing is not the treatment.
* * * *There are worrisome trends in the
American testing enterprise. Standardizedtesting has produced more and more num-bers, and has fed a quantitative approach tomanaging the education system. But we areshort-changed in terms of the informationthat we are getting to help teachers andschools improve student performance. Atthe same time though, there are some hope-ful signs that the situation will improve. Andthere are prospects for harnessing assess-ment in the service of learning if we are will-ing to face squarely the situation we havecreated.

15992-04202 • S49M6 • Printed in U.S.A.I.N. 204928