Embed Size (px)
Citation preview
Integrated Tourism Management Case Study: Use Limits on the Tongariro Crossing
i
ESTABLISHING INTEGRATIVE USE
LIMITS ON THE TONGARIRO CROSSING,
TONGARIRO NATIONAL PARK
FINAL REPORT
AUGUST 2007
Paul Blaschke, Blaschke and Rutherford, 34 Pearce St, Wellington 2, New Zealand, [email protected]
Pauline Whitney, Boffa Miskell Ltd, PO Box 11 340, Wellington, New Zealand, [email protected]
The work reported here is a case study for the project “Integrated planning and managing of natural areas for tourism-related development”, funded by the New Zealand Foundation for Research, Science and Technology. Views expressed are not those of the Foundation for Science, Research and Technology, nor of the Department of Conservation.

Integrated Tourism Management Case Study: Use Limits on the Tongariro Crossing
ii
Integrated Tourism Management Case Study: Use Limits on the Tongariro Crossing
iii
Executive Summary Natural areas attract considerable tourism growth in New Zealand and internationally; while at the same time there is increasing concern about managing the environmental effects of tourism. This action case study addresses a number of management issues for the Tongariro Crossing (the Crossing) in the Tongariro National Park (TNP), New Zealand. Use of the walk has increased rapidly in the last 15 years and many users and managers now feel that the social carrying capacity is being reached or exceeded at times. As well as issues around the number of walkers, there are issues around the management of physical impacts on tracks and vegetation, management of human waste, cultural impacts of large numbers of visitors to an area of great importance to Maori, social impacts of different user groups, marketing, safety management, road-end management, and options for commercial guiding services.
This case study is part of the research programme: “Integrated planning and management of natural areas for tourism-related development”, funded by the Foundation for Research, Science and Technology. The programme’s research objectives are: to evaluate existing approaches to planning and managing tourism and related developments in natural areas; to define an integrated model for application in multi-stakeholder management contexts (with a particular focus on Maori stakeholders); and to pilot, evaluate and refine the model for specific cases. Four action-research case studies (of which this is one) are being used to develop and extend the integrated approach.
Aims and methodology The principal aim of this research is to evaluate the effectiveness of Limits of Acceptable Change methodology (LAC) for determining carrying capacity, by applying elements of LAC to the estimation of carrying capacity or use limits for the Tongariro Crossing that integrate physical, social and cultural impacts. The information presented here was not commissioned by management agencies and is intended primarily to illustrate the use of the LAC methodology, not to form the basis of any mechanism for setting actual limits.
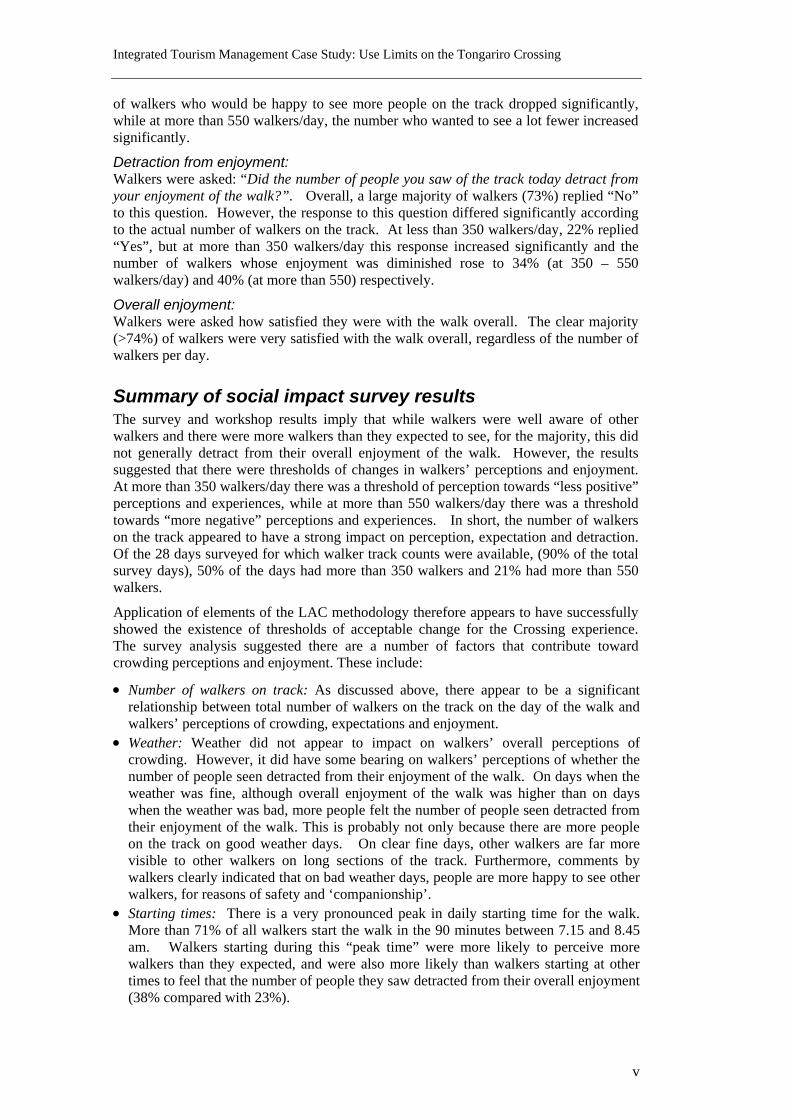
Surveys of walkers and a series of focus groups discussions were used to explore walkers’ experiences on the crossing and opinions held by walkers and stakeholders about values and management issues, and thereby to establish whether thresholds to desired use limits could be established. Two surveys of track walkers were undertaken, one in March-April 2004 and the other in February-May 2005. Just over 800 walkers were surveyed in the two surveys, mostly through a set of oral questions covering walker demography, perceptions of crowding, and satisfaction with overall experience, toilet facilities, marketing and provision of information. On most days that walkers were surveyed, the number of walkers on the Crossing was known from track counters, enabling the analysis of walker experiences to be related to counts of actual numbers of walkers.
Information from these surveys was supplemented by information from six focus group discussions, in which roughly the same issues were discussed in a free format. Focus groups consisted of: members of the community who work, live or undertake recreation activities in the National Park; Turangi-based hapu members; a local environmental group familiar with the Crossing and National Park issues; local concession holders and business offering track-related services; Wellington trampers with experience of the Crossing; and a Wellington high school group who had recently walked the Crossing.
Integrated Tourism Management Case Study: Use Limits on the Tongariro Crossing
iv
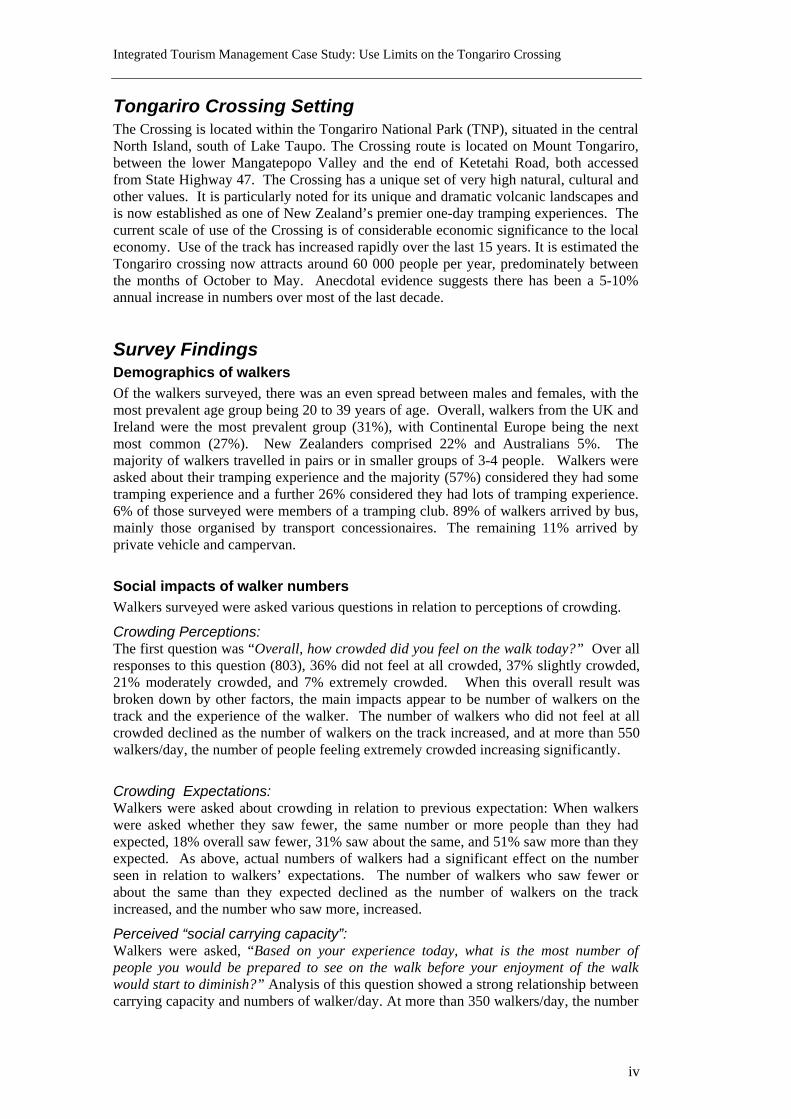
Tongariro Crossing Setting The Crossing is located within the Tongariro National Park (TNP), situated in the central North Island, south of Lake Taupo. The Crossing route is located on Mount Tongariro, between the lower Mangatepopo Valley and the end of Ketetahi Road, both accessed from State Highway 47. The Crossing has a unique set of very high natural, cultural and other values. It is particularly noted for its unique and dramatic volcanic landscapes and is now established as one of New Zealand’s premier one-day tramping experiences. The current scale of use of the Crossing is of considerable economic significance to the local economy. Use of the track has increased rapidly over the last 15 years. It is estimated the Tongariro crossing now attracts around 60 000 people per year, predominately between the months of October to May. Anecdotal evidence suggests there has been a 5-10% annual increase in numbers over most of the last decade.
Survey Findings Demographics of walkers Of the walkers surveyed, there was an even spread between males and females, with the most prevalent age group being 20 to 39 years of age. Overall, walkers from the UK and Ireland were the most prevalent group (31%), with Continental Europe being the next most common (27%). New Zealanders comprised 22% and Australians 5%. The majority of walkers travelled in pairs or in smaller groups of 3-4 people. Walkers were asked about their tramping experience and the majority (57%) considered they had some tramping experience and a further 26% considered they had lots of tramping experience. 6% of those surveyed were members of a tramping club. 89% of walkers arrived by bus, mainly those organised by transport concessionaires. The remaining 11% arrived by private vehicle and campervan.
Social impacts of walker numbers Walkers surveyed were asked various questions in relation to perceptions of crowding.
Crowding Perceptions: The first question was “Overall, how crowded did you feel on the walk today?” Over all responses to this question (803), 36% did not feel at all crowded, 37% slightly crowded, 21% moderately crowded, and 7% extremely crowded. When this overall result was broken down by other factors, the main impacts appear to be number of walkers on the track and the experience of the walker. The number of walkers who did not feel at all crowded declined as the number of walkers on the track increased, and at more than 550 walkers/day, the number of people feeling extremely crowded increasing significantly.
Crowding Expectations: Walkers were asked about crowding in relation to previous expectation: When walkers were asked whether they saw fewer, the same number or more people than they had expected, 18% overall saw fewer, 31% saw about the same, and 51% saw more than they expected. As above, actual numbers of walkers had a significant effect on the number seen in relation to walkers’ expectations. The number of walkers who saw fewer or about the same than they expected declined as the number of walkers on the track increased, and the number who saw more, increased.
Perceived “social carrying capacity”: Walkers were asked, “Based on your experience today, what is the most number of people you would be prepared to see on the walk before your enjoyment of the walk would start to diminish?” Analysis of this question showed a strong relationship between carrying capacity and numbers of walker/day. At more than 350 walkers/day, the number
Integrated Tourism Management Case Study: Use Limits on the Tongariro Crossing
v
of walkers who would be happy to see more people on the track dropped significantly, while at more than 550 walkers/day, the number who wanted to see a lot fewer increased significantly.
Detraction from enjoyment: Walkers were asked: “Did the number of people you saw of the track today detract from your enjoyment of the walk?”. Overall, a large majority of walkers (73%) replied “No” to this question. However, the response to this question differed significantly according to the actual number of walkers on the track. At less than 350 walkers/day, 22% replied “Yes”, but at more than 350 walkers/day this response increased significantly and the number of walkers whose enjoyment was diminished rose to 34% (at 350 – 550 walkers/day) and 40% (at more than 550) respectively.
Overall enjoyment: Walkers were asked how satisfied they were with the walk overall. The clear majority (>74%) of walkers were very satisfied with the walk overall, regardless of the number of walkers per day.
Summary of social impact survey results The survey and workshop results imply that while walkers were well aware of other walkers and there were more walkers than they expected to see, for the majority, this did not generally detract from their overall enjoyment of the walk. However, the results suggested that there were thresholds of changes in walkers’ perceptions and enjoyment. At more than 350 walkers/day there was a threshold of perception towards “less positive” perceptions and experiences, while at more than 550 walkers/day there was a threshold towards “more negative” perceptions and experiences. In short, the number of walkers on the track appeared to have a strong impact on perception, expectation and detraction. Of the 28 days surveyed for which walker track counts were available, (90% of the total survey days), 50% of the days had more than 350 walkers and 21% had more than 550 walkers.
Application of elements of the LAC methodology therefore appears to have successfully showed the existence of thresholds of acceptable change for the Crossing experience. The survey analysis suggested there are a number of factors that contribute toward crowding perceptions and enjoyment. These include:
• Number of walkers on track: As discussed above, there appear to be a significant relationship between total number of walkers on the track on the day of the walk and walkers’ perceptions of crowding, expectations and enjoyment.
• Weather: Weather did not appear to impact on walkers’ overall perceptions of crowding. However, it did have some bearing on walkers’ perceptions of whether the number of people seen detracted from their enjoyment of the walk. On days when the weather was fine, although overall enjoyment of the walk was higher than on days when the weather was bad, more people felt the number of people seen detracted from their enjoyment of the walk. This is probably not only because there are more people on the track on good weather days. On clear fine days, other walkers are far more visible to other walkers on long sections of the track. Furthermore, comments by walkers clearly indicated that on bad weather days, people are more happy to see other walkers, for reasons of safety and ‘companionship’.
• Starting times: There is a very pronounced peak in daily starting time for the walk. More than 71% of all walkers start the walk in the 90 minutes between 7.15 and 8.45 am. Walkers starting during this “peak time” were more likely to perceive more walkers than they expected, and were also more likely than walkers starting at other times to feel that the number of people they saw detracted from their overall enjoyment (38% compared with 23%).
Integrated Tourism Management Case Study: Use Limits on the Tongariro Crossing
vi
• Nationality: Responses to questions about crowding and experiences varied slightly between different groups of nationalities. The strongest trend was that walkers from the United Kingdom and Ireland were somewhat more likely to find the walk uncrowded than other groups, were more likely to find the track less crowded than they expected, and were more likely to be happy for a lot more people to be on the walk. New Zealanders did not stand out strongly from other groups in their experiences, except that they were the most likely to find the track more crowded than they expected.
• Factors contributing to people’s sense of crowding: When walkers were asked what contributed to any sense of crowding, the main contributing factor crowding was the overall number of people seen, followed by the whether people were clustered. Group size, walkers’ behaviour or attitudes, and physical features of the track were not perceived as determining factors. However, particular areas of the track were perceived as more crowded than others. These were the areas around the Crater Lakes, the Devil’s Staircase, South Crater, and Ketetahi Hut. The places where people perceived most crowding were where they were congregated by the nature of the track, e.g. on the Devil’s Staircase) and/or resting (e.g. around the Lakes and Ketetahi Hut).
Other Issues Facing the Crossing Management of physical impacts on tracks and vegetation The physical standard of the track varies at present, being largely dependent on topography and underlying material. Most lowland sections of the track have been extensively “hardened” through track and boardwalk construction, and further extension of this programme on the Devil’s Staircase section is planned. This reconstruction will also lessen perceptions of crowding on that section of the track.
However, much of the central crator portions of the track are formed on unconsolidated volcanic materials which are highly erodible. Built structures (boardwalks etc) on these sections of the track are largely unfeasible, and in any case inappropriate to the relatively wild setting and the cultural significance of the area. In these areas, some track erosion is inevitable. The scale of such erosion impacts does not seem to be a significant management issue at present but warrants ongoing monitoring.
Cultural impacts of large numbers of visitors to an area of great importance to Maori The mountains of TNP are of great spiritual and cultural significance to Maori. The establishment of the National Park stemmed from the gift of the three peaks of Ruapehu, Ngauruhoe and Tongariro by the Maori owners to the nation in 1887.
Continued interest in the cultural and other values of TNP by tangata whenua is manifested in a number of ongoing management issues for the Crossing. These include tangata whenua desire to be involved in decision-making over the issuing of any concessions for commercial guiding on the Crossing, concern over rubbish on the Crossing route (including any human waste not disposed of away from the mountain), and unauthorised public access to the Ketetahi Springs (not part of the TNP) below Ketetahi Hut. Behind these more specific issues lie ongoing more general concerns with the effects of commercialisation in the National Park, and a desire for a partnership approach to governance of the National Park. Discussions with the Maori focus group raised concerns over the interpretation of cultural aspects of the Crossing and their strong desire for a partnership approach to the management of the walk.
Promotion and safety management There was a widespread perception that a large number of walkers are not aware of the physically demanding nature of the walk and that often the walkers are ill-equipped and
Integrated Tourism Management Case Study: Use Limits on the Tongariro Crossing
vii
ill-prepared, especially in poor or changeable weather conditions. Responsibility for walker safety is an emerging issue linked to capacity and interpretation. Some walkers indicated that they wanted further information on track conditions, safety, etc to be available to walkers.
Management of human waste The management of human waste from walkers is a physical, social and cultural management issue. At present, there are toilets at the start of the walk, Mangatepopo Hut, Soda Springs, Ketetahi Hut and at Ketetahi carpark. Before the relatively recent installation of toilets at Soda Springs, there were some reported instances of human waste close to the track. This problem has decreased. Most walkers (86%) felt that there were sufficient toilets provided, and it would not be appropriate to place toilets on the high mountain slopes, for cultural reasons and to maintain the amenities-free zoning of this area. There is no disposal of toilet waste on the mountain; waste from all toilets is carried out by helicopter.
Management options The conclusion that the number of walkers on the track appeared to have a strong impact on perception, expectation and detraction from experience, raises questions about options for future management of social impacts of use on the Crossing. . It is unlikely that numbers of walkers on the Crossing will decrease in the short to medium term without intervention. A key management issue is that of adequate capacity to develop and implement any options for changed management. Capacity-building is an issue for both agencies and stakeholders. The principal pre-requisite for increased capacity is for better understanding of all aspects of the issues described in this case study. A further specific requirement is the ability to accurately monitor visitor numbers and other impacts of walkers on the Tongariro Crossing. None of the following options for change from the status quo are mutually exclusive. All would be potentially permissible under the recently revised TNP Management Plan. It is unlikely that numbers of walkers on the Crossing will decrease in the short to medium term without intervention.
Status quo The great majority of walkers currently enjoy their experience, and therefore the status quo may be seen as the best option. However, it may not be sustainable to provide these levels of satisfaction in the long term given the increasing number of walkers on the track. The ability to obtain more reliable track usage information will assist in determining whether the status quo is sustainable.
Road-end management and start times Crowding at the carparks has been identified as an issue. While neither carpark area was perceived by walkers as among the most crowded parts of the Crossing, there is a physical bottleneck of walkers and vehicles at the Mangatepopo carpark road end between 7.30 and 9 am on busy days. The carpark at Ketetahi road end also appeared to be at capacity on some of those days surveyed.
Given the tight clustering of start times between 7.15 and 8.45am, there appear to be options for staggering of start times by transport concession operators. However, there are several significant operational and safety issues associated with changes to the current patterns. The nature of the track (open landscape with certain constraining portions) means that at some places there will always be crowding on busy days, regardless of when people start the walk.
Implement limits on numbers focussed on high use days A further set of options revolve around restrictions on daily numbers of walkers on the Crossing, possibly through limits on the number of walkers able to be transported by
Integrated Tourism Management Case Study: Use Limits on the Tongariro Crossing
viii
transport concession holders, accompanied by management of carpark capacity for private vehicles. There are a number of options for selecting days on which any limits should apply. Traditionally high use days fell only on summer public holidays. However recent track counts also have shown high use days occurring throughout the week. Any controls on numbers need to be designed to take account of guaranteed public access to the National Park.
Information/Interpretation One way to protect special values and manage visitor use is to provide information about an area’s special cultural, natural and other qualities and, given these, the permitted and/or appropriate behaviour and activities.
The 2004 survey and focus group discussions found a clear demand (nearly 80%) for additional information and/or interpretation on the Crossing, for topics ranging from plants and wildlife, scenery, geological features, cultural values, history and safety. The greatest demand was for more information about geological features.
Of those that would like more information, 58% expressed support for more information on the track. However this was countered by other walkers who raised concerns about the visual impacts and distraction of having signboards etc on the track itself in what is largely an unmodified environment. There was a clear desire by Maori respondents to have a key role in the provision of any interpretation on the Crossing.
Integrated Tourism Management Case Study: Use Limits on the Tongariro Crossing
2
Contents
1 Introduction 1 1.1 The research programme background and objectives 1
1.2 The knowledge basket framework 3
1.2.1 Use of Limits of Acceptable Change (LAC) process for studying use limits 4 1.3 The Tongariro Crossing Case Study 4
2 The Tongariro Crossing – Setting 7 2.1 Tongariro National Park 7
2.2 The Crossing itself 8
2.3 Values of the Crossing 10
2.3.1 Natural/scenic/landscape values 10 2.3.2 Cultural and historical values 10 2.3.3 Economic values 10 2.3.4 Social and recreational values 10 2.4 Trends in visitor and walker numbers 11
2.5 Management of the National Park 12
2.5.1 Department of Conservation (DOC) 12 2.5.2 Tongariro/Taupo Conservation Board 12 2.5.3 District and regional councils 12 2.5.4 Iwi 13 2.5.5 Companies operating in and around TNP 13
3 Methods 14 3.1 Track user surveys 14
3.2 Survey analysis 15
3.3 Focus group discussions 15
4 Key findings from the survey 16 4.1 Survey Purpose 16
4.2 Demographics of walkers 16
4.3 Crowding and Perceptions 16
4.3.1 Overall crowding perceptions 17 4.3.2 Crowding expectations 17 4.3.3 Detract from enjoyment 17 4.3.4 Tolerance levels 18 4.4 Visitor satisfaction 18
Integrated Tourism Management Case Study: Use Limits on the Tongariro Crossing
3
5 Demonstrating application of the framework 19 5.1 Application of the framework 19
5.2 Recognising and setting limits - Establish daily and annual track capacity, recognising physical, social and cultural constraints 19
5.2.1 Social impacts of walker numbers 20 5.2.2 Cultural impacts of large numbers of visitors to an area of great importance to
Maori 23 5.2.3 Management of physical impacts on tracks and vegetation 24 5.2.4 Management of rubbish and human waste 25 5.2.5 Promotion and safety management 26 5.2.6 Road-end management and start times 27 5.3 Structured participation 29
5.3.1 Formal participation process 29 5.3.2 Informal and iwi and public participation 29 5.4 Impact monitoring including track visitor surveys 29
5.4.1 Options for resource and environmental indicators 30 5.5 Allocation of transport and guiding concessions 31
5.6 Strategic planning through National Park Management Plan; infrastructure/asset planning 32
5.7 Capacity building 32
5.8 Management options 33
5.8.1 Status quo 33 5.8.2 Implement limits on numbers focused on heavy use days 34 5.8.3 Road-end management and start times 34 5.8.4 Information and Interpretation 35 5.8.5 Reverse marketing 35 5.8.6 Comments on management options 36
6 Conclusion 37
6.1 Lessons from the integrated approach 37
6.2 What has the Limits of Acceptable Change methodology brought to this case study? 37
6.3 Conclusions 38
Appendix A - National Park setting 43
Appendix B - Past Visitor surveys 46
Appendix C – Survey questionnaires 48
Appendix D - Visitor Monitoring Plan 56
Appendix E - Survey Analysis Summary 57
Appendix F - Tongariro National Park Management Plan and Tongariro/Taupo Management Strategy 86
Integrated Tourism Management Case Study: Use Limits on the Tongariro Crossing
August 2007 1
1 Introduction
1.1 The research programme background and objectives
Natural areas attract considerable tourism growth in New Zealand and internationally, while at the same time there is increasing public concern about conservation and the environment, and managing the environmental effects of tourism (Newsome et al., 2002). Over the last decade there has been growing awareness that tourism in natural areas requires careful management, if tourism activities are to be sustainable. This theme is a significant focus of the New Zealand Tourism Strategy 2010 (New Zealand Tourism Board 2001). One goal of the Strategy, that of environmental protection, is: “to recognise the value of the natural environment and actively protect, support and promote its sustainability”.
This study addresses some of these concerns, focussing on an iconic New Zealand natural area setting: the spectacular volcanic landscapes of the Tongariro National Park (see Chapter 2). National parks are widely seen as the core of New Zealand protected areas, and are managed to a high standard “for the purpose of preserving in perpetuity as national parks, for their intrinsic worth and for the benefit use, and enjoyment of the public, areas of New Zealand that contain scenery of such distinctive quality, ecological systems, or natural features so beautiful, unique, or scientifically important that their preservation is in the national interest” (National Parks Act, section 4(1)).
The case study is part of the FRST-funded research programme Integrated planning and managing of natural areas for tourism-related development. The focus of the research is the development of an integrated approach to planning and managing natural areas for tourism and related activities in New Zealand. The research objectives of the programme are to evaluate existing approaches to planning and managing tourism and related developments in natural areas, define an integrated model for application in multi-stakeholder management contexts (with a particular focus on Maori stakeholders), and pilot, evaluate and refine the model for specific cases.
The research programme will contribute to the national strategic research objective of developing a “dynamic tourism industry which is environmentally, socially, culturally and economically sustainable”. The programme helps to provide direction for integration of these four principal components of sustainability, including recognition of a finite capacity for some activities at some sites; the sometimes competing requirements of tourism and outdoor recreation activities; ways of addressing cultural and amenity values for all sectors of society; and the need to monitor progress towards sustainability.
Key end-user groups are participating in the research - the tourism industry, government agencies, professional associations and iwi (as part of the industry, host communities and resource managers). The participation of user groups occurs through a research Reference Group, the inclusion of a range of research team clients from the tourism sector as active participants in the project, close interface with professional practitioners and other researchers, and the full-time involvement of a Maori researcher working closely with an iwi organisation.
Integrated Tourism Management Case Study: Use Limits on the Tongariro Crossing
3
1.2 The knowledge basket framework
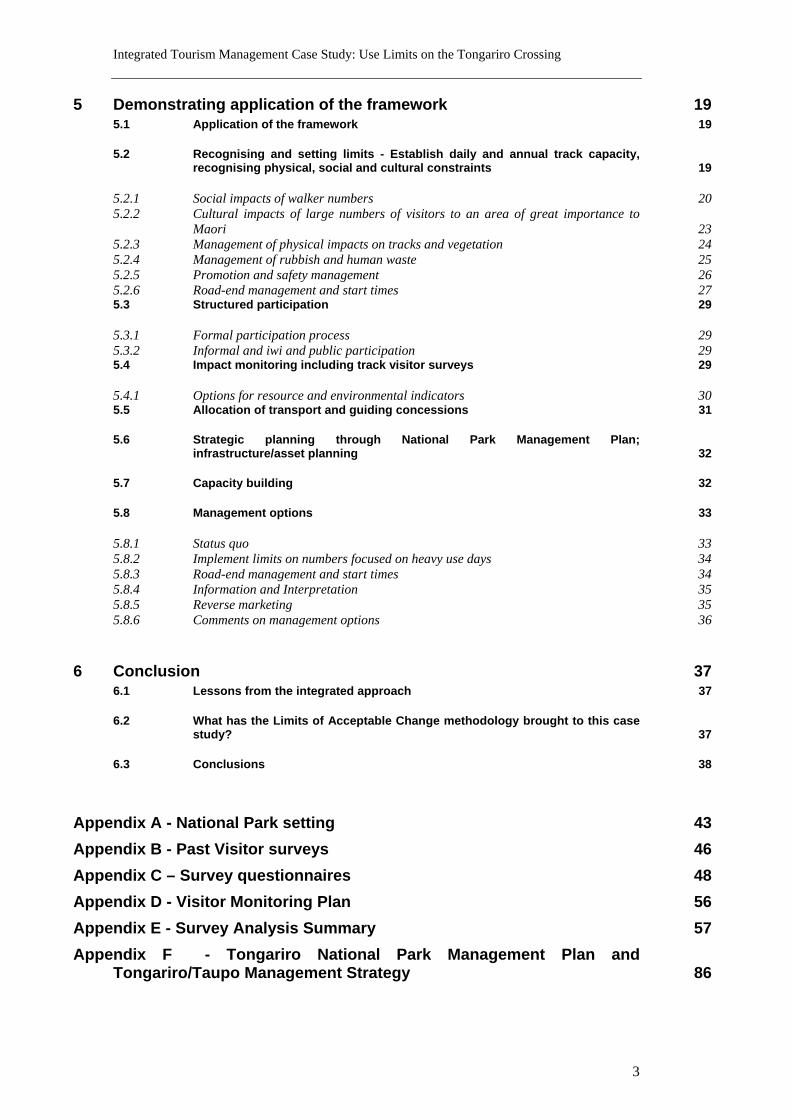
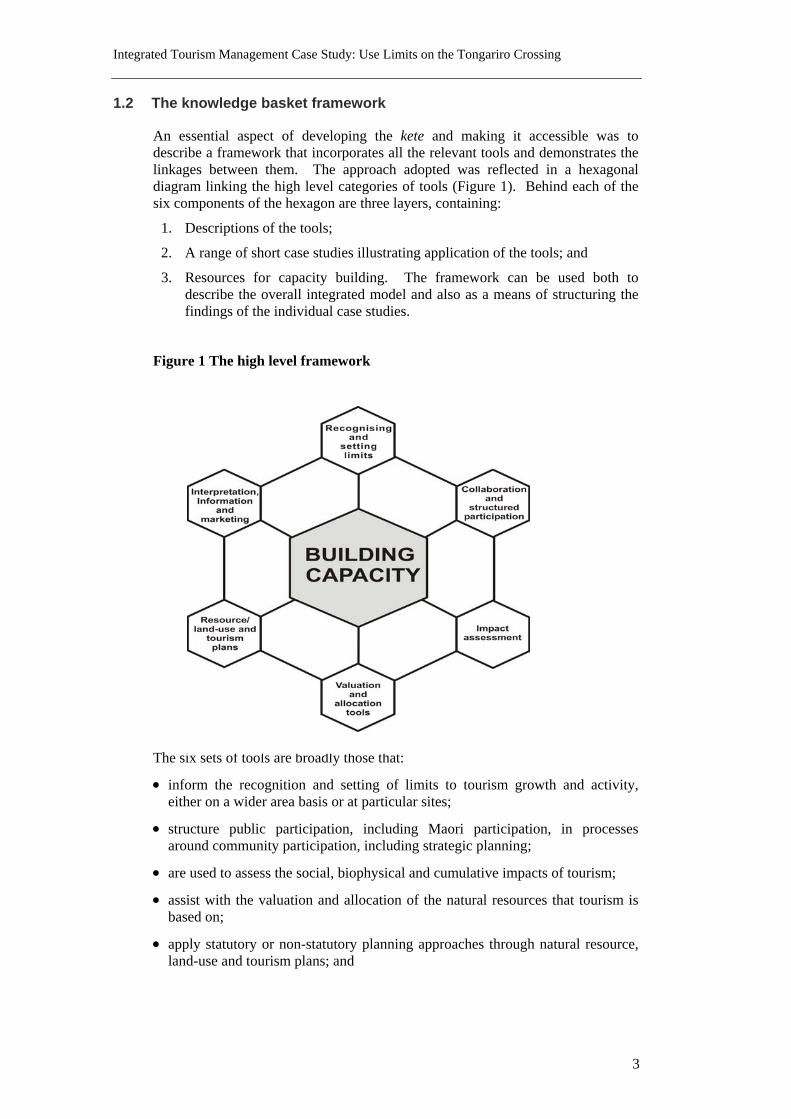
An essential aspect of developing the kete and making it accessible was to describe a framework that incorporates all the relevant tools and demonstrates the linkages between them. The approach adopted was reflected in a hexagonal diagram linking the high level categories of tools (Figure 1). Behind each of the six components of the hexagon are three layers, containing:
1. Descriptions of the tools;
2. A range of short case studies illustrating application of the tools; and
3. Resources for capacity building. The framework can be used both to describe the overall integrated model and also as a means of structuring the findings of the individual case studies.
Figure 1 The high level framework
The six sets of tools are broadly those that:
• inform the recognition and setting of limits to tourism growth and activity, either on a wider area basis or at particular sites;
• structure public participation, including Maori participation, in processes around community participation, including strategic planning;
• are used to assess the social, biophysical and cumulative impacts of tourism;
• assist with the valuation and allocation of the natural resources that tourism is based on;
• apply statutory or non-statutory planning approaches through natural resource, land-use and tourism plans; and
Integrated Tourism Management Case Study: Use Limits on the Tongariro Crossing
4
• provide visitor information, interpretation and marketing to attract and direct visitors to an area, modify their behaviour when they get there, and enhance their experience.
Together, the tools provide the basis for building community, industry and agency capacity to manage natural areas in an integrated way for tourism and related activities.
1.2.1 Use of Limits of Acceptable Change (LAC) process for studying use limits
The main tool for evaluating the carrying capacity or use limits for the case study on the Tongariro Crossing is that of the Limits of Acceptable Change methodology (LAC). The principal purpose of this study is to demonstrate the application of LAC for setting visitor number limits.
The LAC process (Stankey et al. 1985) has been developed as a means of coping with increasing demands on recreational areas in a visible logical fashion. The challenge is not how to prevent any human-induced change, but rather one of deciding how much change will be allowed to occur, where, and the actions needed to control it. The process requires deciding what kinds of conditions are acceptable, then prescribing actions to protect or achieve those conditions. If an area does not meet those acceptable conditions, then management actions must be taken to correct the situation.
There are five basic stages to the LAC framework:
• Stage 1— Identify the issues (preferably through a collaborative process involving input from stakeholders) and describe the recreational opportunity class(es) (a classification of the diversity of recreation opportunities for a natural area or a group of natural areas).
• Stage 2— Inventory a baseline of the current social and resource conditions for each of the opportunity classes.
• Stage 3— Define the minimally acceptable standards or limits.
• Stage 4— Identify and implement strategies to manage the area to remain within these limits.
• Stage 5— Monitor (against benchmark data) and evaluate to ensure that management objectives are being met.
The LAC methodology has been used on a number of occasions in New Zealand, most recently by Wray et al. (2006).
1.3 The Tongariro Crossing Case Study
Use of the Tongariro Crossing walking track in the Tongariro National Park has increased rapidly over the last 15 years and many users, managers and stakeholders in the National Park now feel that the social carrying capacity is being reached or even exceeded at times. There is also a perception that some backcountry walkers and wilderness seekers are actively avoiding the track. In addition to issues around the numbers of walkers, there are issues around:
• Cultural impacts of large numbers of visitors to an area of great importance to Maori
• Management of physical impacts on tracks and vegetation
Integrated Tourism Management Case Study: Use Limits on the Tongariro Crossing
5
• Management of human waste • Safety issues • Marketing and promotion of the Crossing walk • Road-end management • Options for use of guiding concessions to manage use
The principal aim of this research is to evaluate the effectiveness of Limits of Acceptable Change methodology (LAC) for determining carrying capacity by applying elements of LAC to the estimation of carrying capacity or use limits for the Tongariro Crossing that integrate physical, social, and cultural impacts. Other aims of the research are:
• To evaluate the implications of this information for developing management options.
• To develop appropriate indicators of resource and social conditions and environmental indicators on the Tongariro Crossing.
• To evaluate the effectiveness of LAC methodology for determining carrying capacity on the Tongariro Crossing and other New Zealand settings.
This study does not apply a full LAC methodology. Much of the work in Stages 1 and 2 (as identified above) has been done through previous studies in TNP, as summarised in the draft revised TNP Management Plan (see Appendix F). This study principally investigates steps 2 and 3 in detail in order for TNP managers, in consultation with stakeholders, to proceed to stages 4 and 5. The study aims to demonstrate that a LAC methodology can be applied to the issue of use limits on the Crossing. It is noted that as this is research project, any implementation (later stage of Stage 4) and monitoring (Stage 5) will be undertaken by DOC should they wish to further develop the research.
The approach adopted for the Tongariro Crossing case study was as follows:
Scoping - review of existing usage, interviews and discussions with the Department of Conservation (DOC) and with key people and relevant organisations in the community, review of existing and proposed regulatory documents and, and review of other related documents.
Information gathering - A survey of walkers and series of focus group discussions were used to explore walkers’ experiences on the Crossing, and establish specific desired use limits.
Analysis - detailed review of the interview results, and feedback from workshops to assess opportunities to develop and apply particular tools, identifying potential linkages and inconsistencies relating to different jurisdictional responsibilities and tools.
Application of LAC - using a multi-phase approach based on the ‘Limits of Acceptable Change’ (LAC) framework (Stankey et al. 1985), develop thresholds of tolerance for certain visitor impacts occurring on the Tongariro Crossing.
Application monitoring - bringing to the attention of DOC particular tools/approaches that might assist in the implementation of particular recommendations.
Integrated Tourism Management Case Study: Use Limits on the Tongariro Crossing
6
Review, evaluation and feedback - reviewing issues identified from the Tongariro Crossing case study for development of a more widely applicable integrated framework and information about specific tools in that framework.
The draft Tongariro National Park (TNP) Management Plan (DOC 2003) contains a number of policies relevant to the management of the Tongariro Crossing. Overall, there are clear policies for maintaining public access to and within the park, including Tongariro Crossing. However, it is also recognised that there is a carrying capacity within the park (social, ecological and physical) and once this level is reached, appropriate actions should be taken2.
Past research relating to crowding on the Tongariro Crossing is summarised in Appendix B - Past Visitor surveys. Together, this research provides detailed analysis of the relationship between perceptions of crowding, satisfaction, and visitor type. It has had an emphasis on the facilities on the Crossing, especially huts. By contrast, the current research provides more specific information on perceptions of crowding on the track itself, and relates information on perceptions to counts of actual numbers of walkers on the Crossing. It then relates this information to the Limits of Acceptable Change (LAC) methodology and to the development of integrated carrying capacity indicators. It also provides an update on the previous survey information during a time of rapid growth in numbers.
2 The revised Tongariro National Park Management Plan was approved by the New Zealand
Conservation Authority in January 2007, after the body of this report was written. A brief summary of relevant provisions in the approved Management Plan relating to the Tongariro Crossing is given in Appendix F.
Integrated Tourism Management Case Study: Use Limits on the Tongariro Crossing
7
2 The Tongariro Crossing – Setting
2.1 Tongariro National Park
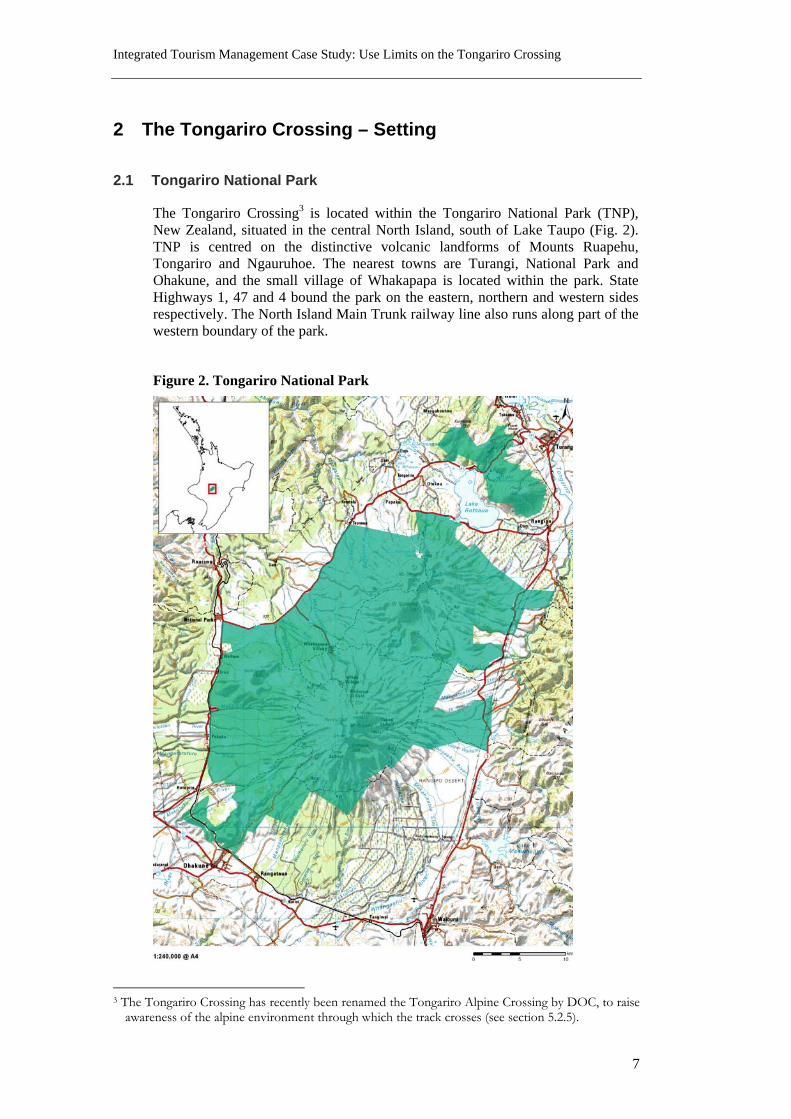
The Tongariro Crossing3 is located within the Tongariro National Park (TNP), New Zealand, situated in the central North Island, south of Lake Taupo (Fig. 2). TNP is centred on the distinctive volcanic landforms of Mounts Ruapehu, Tongariro and Ngauruhoe. The nearest towns are Turangi, National Park and Ohakune, and the small village of Whakapapa is located within the park. State Highways 1, 47 and 4 bound the park on the eastern, northern and western sides respectively. The North Island Main Trunk railway line also runs along part of the western boundary of the park.
Figure 2. Tongariro National Park
3 The Tongariro Crossing has recently been renamed the Tongariro Alpine Crossing by DOC, to raise
awareness of the alpine environment through which the track crosses (see section 5.2.5).
Integrated Tourism Management Case Study: Use Limits on the Tongariro Crossing
8
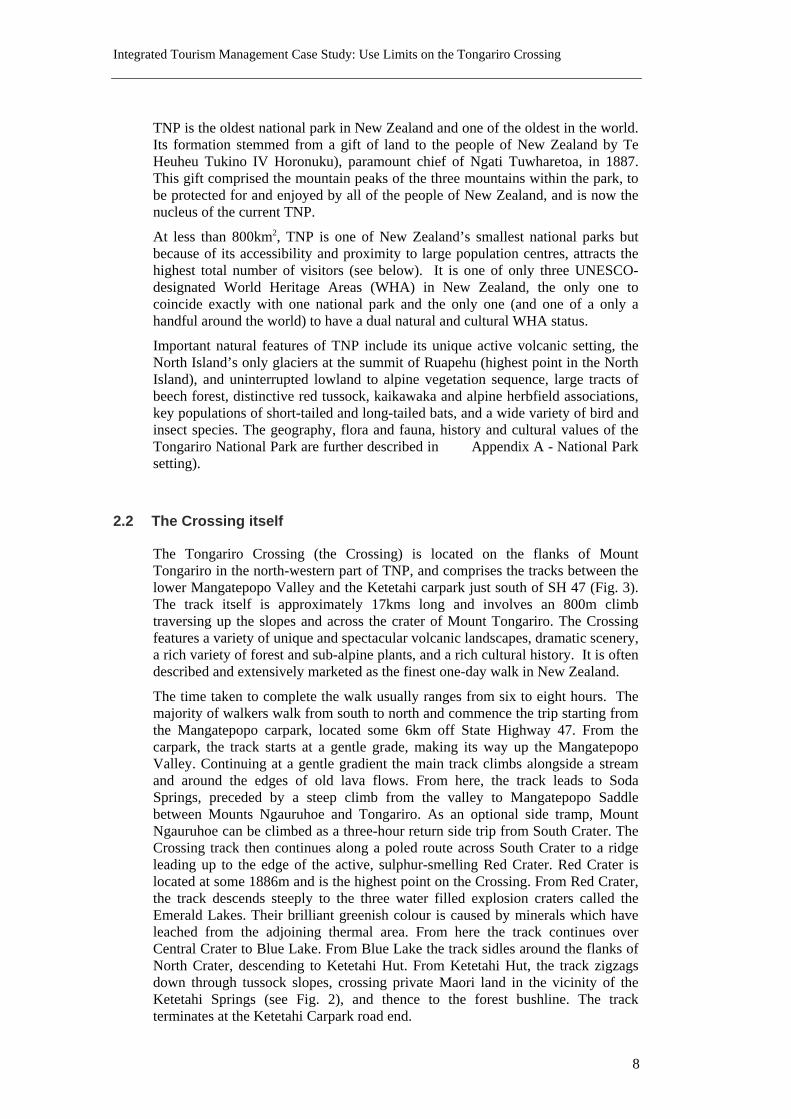
TNP is the oldest national park in New Zealand and one of the oldest in the world. Its formation stemmed from a gift of land to the people of New Zealand by Te Heuheu Tukino IV Horonuku), paramount chief of Ngati Tuwharetoa, in 1887. This gift comprised the mountain peaks of the three mountains within the park, to be protected for and enjoyed by all of the people of New Zealand, and is now the nucleus of the current TNP.
At less than 800km2, TNP is one of New Zealand’s smallest national parks but because of its accessibility and proximity to large population centres, attracts the highest total number of visitors (see below). It is one of only three UNESCO-designated World Heritage Areas (WHA) in New Zealand, the only one to coincide exactly with one national park and the only one (and one of a only a handful around the world) to have a dual natural and cultural WHA status.
Important natural features of TNP include its unique active volcanic setting, the North Island’s only glaciers at the summit of Ruapehu (highest point in the North Island), and uninterrupted lowland to alpine vegetation sequence, large tracts of beech forest, distinctive red tussock, kaikawaka and alpine herbfield associations, key populations of short-tailed and long-tailed bats, and a wide variety of bird and insect species. The geography, flora and fauna, history and cultural values of the Tongariro National Park are further described in Appendix A - National Park setting).
2.2 The Crossing itself
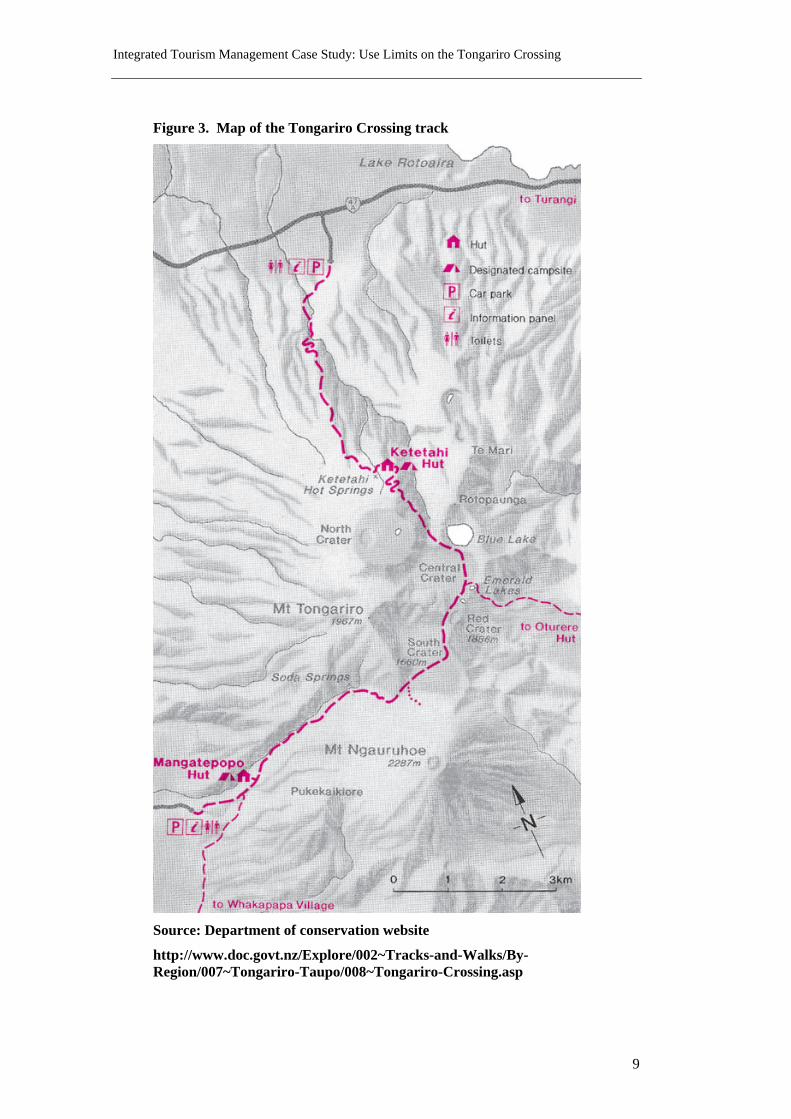
The Tongariro Crossing (the Crossing) is located on the flanks of Mount Tongariro in the north-western part of TNP, and comprises the tracks between the lower Mangatepopo Valley and the Ketetahi carpark just south of SH 47 (Fig. 3). The track itself is approximately 17kms long and involves an 800m climb traversing up the slopes and across the crater of Mount Tongariro. The Crossing features a variety of unique and spectacular volcanic landscapes, dramatic scenery, a rich variety of forest and sub-alpine plants, and a rich cultural history. It is often described and extensively marketed as the finest one-day walk in New Zealand.
The time taken to complete the walk usually ranges from six to eight hours. The majority of walkers walk from south to north and commence the trip starting from the Mangatepopo carpark, located some 6km off State Highway 47. From the carpark, the track starts at a gentle grade, making its way up the Mangatepopo Valley. Continuing at a gentle gradient the main track climbs alongside a stream and around the edges of old lava flows. From here, the track leads to Soda Springs, preceded by a steep climb from the valley to Mangatepopo Saddle between Mounts Ngauruhoe and Tongariro. As an optional side tramp, Mount Ngauruhoe can be climbed as a three-hour return side trip from South Crater. The Crossing track then continues along a poled route across South Crater to a ridge leading up to the edge of the active, sulphur-smelling Red Crater. Red Crater is located at some 1886m and is the highest point on the Crossing. From Red Crater, the track descends steeply to the three water filled explosion craters called the Emerald Lakes. Their brilliant greenish colour is caused by minerals which have leached from the adjoining thermal area. From here the track continues over Central Crater to Blue Lake. From Blue Lake the track sidles around the flanks of North Crater, descending to Ketetahi Hut. From Ketetahi Hut, the track zigzags down through tussock slopes, crossing private Maori land in the vicinity of the Ketetahi Springs (see Fig. 2), and thence to the forest bushline. The track terminates at the Ketetahi Carpark road end.
Integrated Tourism Management Case Study: Use Limits on the Tongariro Crossing
9
Figure 3. Map of the Tongariro Crossing track
Source: Department of conservation website
http://www.doc.govt.nz/Explore/002~Tracks-and-Walks/By-Region/007~Tongariro-Taupo/008~Tongariro-Crossing.asp
Integrated Tourism Management Case Study: Use Limits on the Tongariro Crossing
10
2.3 Values of the Crossing
During the information-gathering phase of this research, a series of focus group discussions were held with specific interest groups, community groups and stakeholders. From these discussions, a number of values of the Crossing were derived. These values include:
2.3.1 Natural/scenic/landscape values
Most people are attracted to the Crossing primarily for its natural values. The unique volcanic features and landscapes of the walk are most commonly recalled as attracting walkers. Specific features of the landscape include Mt Ngauruhoe, the diversity of terrain, the continually changing landscape and its “barrenness”. The combination of these features in such proximity is internationally unique, with a huge number of international visitors attracted to the National Park for these attractions.The physical uniqueness of these features also gives the Crossing a set of strong place-based geographical values.
2.3.2 Cultural and historical values
Reference was made to the cultural values of the Crossing in that it is a sacred place with a rich Maori history. To tangata whenua (people of the land) the mountains are a vital part of their history, their whakapapa (genealogy) and legends are venerated accordingly. Comments were made in respect of the amazing foresight of tangata whenua to gift the Park to the people of New Zealand.
2.3.3 Economic values
The Crossing attracts a large number of walkers to the region, the majority of which stay in the local area or region (between Taupo and Ohakune) for at least two nights (the night before and after the Crossing trip) and purchase accommodation, food and other services during this time. The Crossing also has huge economic value for businesses in the area in relation to concessions, particularly given 90% of walkers arrive by bus or through a private operator. A current study is estimating the economic value of the concessions associated with TNP to the region (Wouters, in prep).
2.3.4 Social and recreational values
The Crossing has strong social and recreational values in that it is seen as an iconic walk for international and New Zealand recreational walkers. The Crossing now has a recognised name as a ‘must do walk’ and is seen as a deliberate stop for international tourists. People often change their schedule to fit the walk in nice weather. In recent years many travellers have been inspired by the “Lord of the Rings” films to come and see the scenery of TNP. There appears to be a huge sense of achievement by those that complete the walk. Groups of friends are common on the track, thereby providing a sociable recreational setting for users.
Integrated Tourism Management Case Study: Use Limits on the Tongariro Crossing
11
2.4 Trends in visitor and walker numbers
Of the 1 million annual visitors to the national park, large numbers of visitors do short walks within or on the fringes of the park, but of the longer tramps the Crossing is by far the most popular. There has, however, been considerable uncertainty about the number of walkers undertaking the Crossing, and few figures from counters available until the last couple of years (see Appendix D - Visitor Monitoring Plan). There has been anecdotal information and informal counts suggesting a 5-10% annual increase in walker numbers since the mid 1990s, and daily numbers of more than 1000 on peak days. Peak days are public holidays and weekends in summer. By 2004 when scoping research on this study was beginning, many people thought that there were more than 80 000 walkers on the Crossing each year, with some estimates of over 100 000.
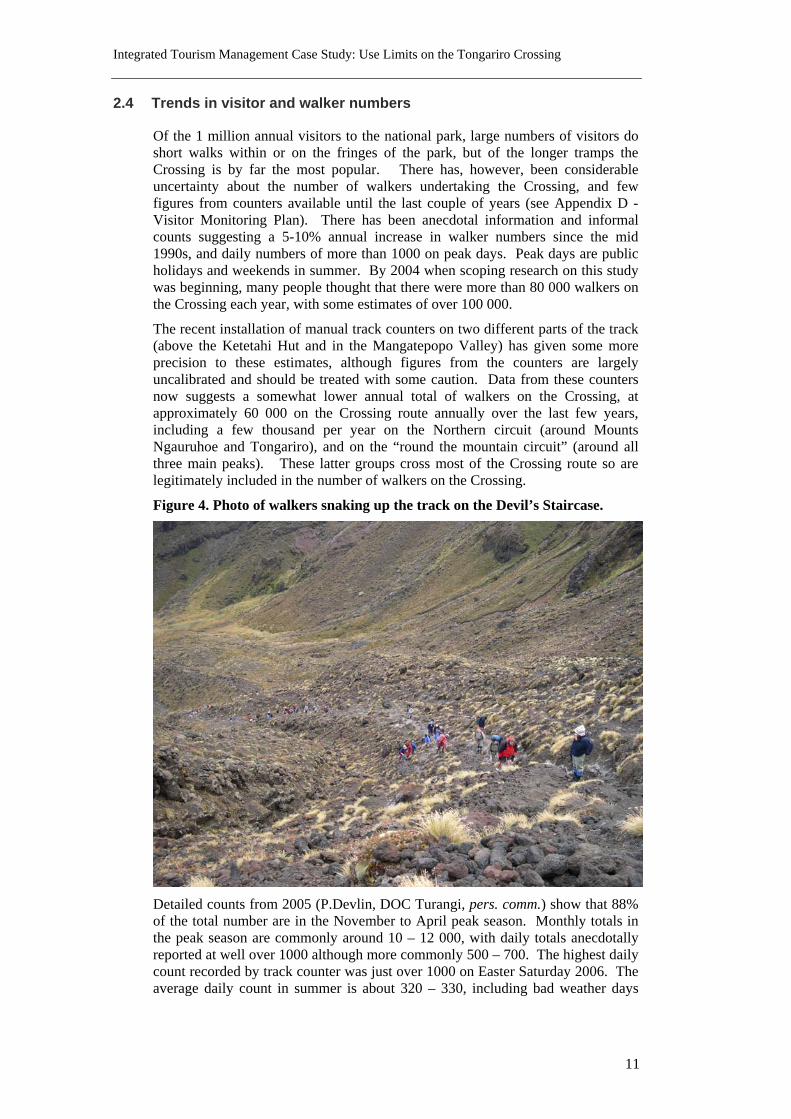
The recent installation of manual track counters on two different parts of the track (above the Ketetahi Hut and in the Mangatepopo Valley) has given some more precision to these estimates, although figures from the counters are largely uncalibrated and should be treated with some caution. Data from these counters now suggests a somewhat lower annual total of walkers on the Crossing, at approximately 60 000 on the Crossing route annually over the last few years, including a few thousand per year on the Northern circuit (around Mounts Ngauruhoe and Tongariro), and on the “round the mountain circuit” (around all three main peaks). These latter groups cross most of the Crossing route so are legitimately included in the number of walkers on the Crossing.
Figure 4. Photo of walkers snaking up the track on the Devil’s Staircase.
Detailed counts from 2005 (P.Devlin, DOC Turangi, pers. comm.) show that 88% of the total number are in the November to April peak season. Monthly totals in the peak season are commonly around 10 – 12 000, with daily totals anecdotally reported at well over 1000 although more commonly 500 – 700. The highest daily count recorded by track counter was just over 1000 on Easter Saturday 2006. The average daily count in summer is about 320 – 330, including bad weather days
Integrated Tourism Management Case Study: Use Limits on the Tongariro Crossing
12
when most commercial transport does not operate and there are fewer than 50 walkers – the same as the average winter daily number.
Counts from Ketetahi do not include the significant number of people who undertake short walks in the Mangatepopo Valley (as far as the top of the Devil’s Staircase), nor those who walk from the Ketetahi carpark end just as far as the Ketetahi Hut. Track counter figures for 2005 indicate about 68 000 walkers were counted in the Mangatepopo Valley close to the road end.
2.5 Management of the National Park
The key organisations operating both within the park and the Crossing include the following:
2.5.1 Department of Conservation (DOC)
The Department of Conservation manages TNP on behalf of the Crown. DOC management of TNP is centred on the Tongariro/Taupo Conservancy office in Turangi, with most day-to-day management undertaken from the Turangi Area Office, the TNP Headquarters at Whakapapa Village (the only settlement inside the park), or the Ohakune Field centre (southern part of the TNP). Management is principally through the National Parks Act, as interpreted in the Tongariro-Taupo Conservation Management Strategy, general policy for national parks, and the current TNP Management Plan. In addition, the Conservation Act and other conservation legislation is relevant.
2.5.2 Tongariro/Taupo Conservation Board
The Tongariro/Taupo Conservation Board is appointed by the Minister of Conservation to oversee the conservancy’s management and monitor its performance against policy. It also has an oversight role in the development of the Tongariro/Taupo Conservation Management Strategy and the TNP Management Plan. (Final approval of both plans is made by the New Zealand Conservation Authority after taking into account public submissions and the comments of the Minister of Conservation). The board is chosen by the Minister to be broadly representative of the general public. By statute, the Ngati Tuwharetoa iwi has a permanent position on the board.
2.5.3 District and regional councils
There are two regional councils, and two district councils within whose area TNP lies, being Waikato Regional Council, Manawatu-Wanganui Regional Council, Taupo District Council and Ruapehu District Council.
The Regional Councils have primary responsibility for the management of water, soil, geothermal resources and pollution control and for regional aspects of hazard mitigation, soil conservation and hazardous substances. The District (Territorial) authorities have primary responsibility for land use planning under the Resource Management Act 1991. Such responsibilities are implemented through the respective district and regional plans and policy statements. Any activities within the park are governed by these documents in that resource consent is required where the plans dictate. However, Section 4 of the Resource Management Act 1991 provides a limited exemption to the department for those land use activities within the park that are provided for in a management plan or a conservation management strategy which do not have significant adverse effects outside the boundary of the park. It is noted that the act does not provide any exemptions for activities which require consent from the Regional Council.
Integrated Tourism Management Case Study: Use Limits on the Tongariro Crossing
13
2.5.4 Iwi Maori
In general, resident Maori have a strong interest in the cultural values of the TNP. (Refer Appendix A - National Park setting)
There are two iwi with a specific interest in the TNP as tangata whenua. Ngati Tuwharetoa, as the gifting iwi, has a statutory position on the Tongariro/Taupo Conservation Board and maintains an active interest in the management of the park. Ngati Hikairo ki Tongariro is a hapu (sub-tribe) of Ngati Tuwharetoa who are kaitiaki within their rohe (tribal boundary), which includes much of the north-western part of TNP. The Ketetahi Trust is a group of representatives from within Ngati Tuwharetoa and Ngati Hikairo that was established in 1995 to manage and administer the Ketetahi Block on behalf of the owners of this block. The Ketetahi Block adjoins and lies partly within TNP. The portion within TNP includes the Ketetahi Springs and its immediate surrounds, through which the Tongariro Crossing track passes close to Ketetahi Hut (Fig. 2).
Ngati Rangi is tangata whenua in the south-eastern part of the park but have no direct tangata whenua interest in the Crossing.
2.5.5 Companies operating in and around TNP
There is a range of concessionaries and contractors operating in the park, the largest of which is Ruapehu Alpine Lifts which holds the long-term lease for both the major skifields. Approximately 15 concession holders provide transport services for the Crossing, and there is one guiding concession (although this is understood to have expired). Currently, there is wide interest in the provision of further professional guiding services. There are many accommodation, food and service businesses in both the Waikato and Manawatu-Wanganui regions which derive significant income from Crossing walkers.
Integrated Tourism Management Case Study: Use Limits on the Tongariro Crossing
14
3 Methods
3.1 Track user surveys
Two questionnaire type surveys were undertaken of Tongariro Crossing walkers over the summer periods of 2004 (March – April) and 2005 (January – March), in the vicinity of Ketetahi carpark and Ketetahi Hut. The first survey was undertaken by the researchers, and the second was undertaken by contractors supervised by DOC staff.
The main purpose of the surveys was for the gathering of information with respect to users’ experiences, expectations and impressions – specifically in relation to perceptions of crowding. The questions asked in the surveys covered:
• demographic profile (including home town/country, age, tramping experience);
• method of transport to the walk and walking start/finish times;
• perceptions and expectations of crowding, in relation to expectations;
• experiences of crowding behaviour;
• satisfaction with overall experience;
• number or walkers seen;
• thresholds of tolerance to other walkers;
• willingness to do other walks in TNP.
In the first series of surveys (2004), walkers were also asked questions on:
• satisfaction with marketing and information about the trip
• satisfaction with toilet facilities;
A sample of the survey questionnaires is attached as Appendix C – Survey questionnaires .
Most questions were multi-choice, asked and answered orally at Ketetahi carpark, between 2 – 5pm (i.e. the period when most walkers arrived at the end of the walk and were waiting to be picked up). A few questions were more open-ended and brief comments were recorded on the questionnaire form. The questionnaire form was written in a way that it could also be answered in writing, and some respondents at both Ketetahi carpark and Ketetahi Hut filled out written questionnaires themselves
As far as possible, surveyors worked systematically through the Ketetahi carpark, seeking to ask all groups of walkers to take part in the survey. Generally only one walker in each group was surveyed, (except for large groups) and as far as possible surveyors tried to solicit responses from just that person (i.e. people in the same group as the chosen respondent were not encouraged to help answer questions). All interviews were conducted in English; a few walkers (fewer than 5%) declined to take part because they felt their English was not good enough. On a few occasions when the surveyor judged that the respondent had not understood the question, the response was noted on the form to be omitted from analysis.
On most days that walkers were surveyed, a count of the number of walkers on the Crossing was available from the track counter near Ketetahi Hut (Refer Appendix C – Survey questionnaires enabling the analysis of walker experiences to be related to the actual numbers of walkers. Numbers recorded on the track ranged from 168 – 642 walkers in 2004 (average 357) and from 67- 693 in 2005 (average 370). The counter was placed on the track just uphill from Ketetahi Hut, in which position it would have recorded almost all Crossing walkers, and well as all
Integrated Tourism Management Case Study: Use Limits on the Tongariro Crossing
15
Tongariro Northern Crossing walkers, who walk most of the Crossing route and day walkers from Ketetahi carpark who go onto the Tongariro tops. It does not record Mangatepopo Valley walkers, or day walkers between Ketetahi Hut to Ketetahi carpark who go not further than the hut. All these walkers add in some way to social and crowding impacts.
Some 815 walkers were surveyed in total. Two hundred and sixty-eight walkers were surveyed over nine separate survey days throughout March and April 2004 in early/late afternoon, typically from 1pm to about 4pm. Thursday 8 April, Saturday 10 April and Sunday 11 April were specifically chosen as this was the Easter period, which is traditionally the busiest time for walkers on the Crossing. A further 547 walkers were surveyed over 22 days in January to March 2005.
3.2 Survey analysis
All quantifiable survey results were coded onto a spreadsheet. Analysis of results was carried out using the SPSS package. Most questions were analysed and reported simply in terms of percentage of respondents responding to each option. For some of the questions about perceptions of crowding and enjoyment, a two-way analysis of responses was carried out to further investigate responses according to demographic group. Significance of results was assessed using a Chi-squared test.
3.3 Focus group discussions
The second component of information gathering was a series of focus group discussions. These were held with groups of people who either have a specific interest in the Crossing for economic, cultural or recreational purposes, and people who have walked the Crossing. Focus groups were selected by the researchers after initial scoping work. Stakeholders did not include government agencies (DOC etc), but the researchers interviewed DOC staff members as the study progressed. Six focus groups were held, as follows:
• Members of the community who work, live or undertake recreation activities in the National Park.
• Turangi-based Maori with tangata whenua status over parts of the Crossing (members of Ngati Hikairo hapu)
• Concession holders and local business offering track-related services (transport and accommodation)
• A school group who had recently walked the Crossing (Onslow College, Wellington). • Wellington-based trampers with long experience of the Crossing (Tararua Tramping Club). • A local environmental group familiar with the Crossing and having a history of involvement
in management issues (Tongariro Natural History Society). • A total of some 60 people participated in the focus group discussions. The focus group discussions covered roughly the same material as the on-site interviews in addition to issues and material brought up thought the course of the discussions and components specific to the composition of the focus group.
3.4 Discussion of draft report
Final meetings to discuss draft findings were held with the Tongariro/Taupo Conservation Board (December 2005) and all stakeholders including DOC (May 2006). A draft report was sent to about 20 stakeholders or stakeholder groups, including DOC, in May 2006. Their comments were taken account of in the final report.
Integrated Tourism Management Case Study: Use Limits on the Tongariro Crossing
16
4 Key findings from the survey
Detailed results from the survey are given in Appendix E - Survey Analysis Summary. This chapter summarises key results that are principally used in the following discussion. Results presented in this summary are from analysis of combined results from both years’ responses unless otherwise recorded.
4.1 Survey Purpose
The main purpose of the surveys was for the gathering of information with respect to users’ experiences, expectations and impressions – specifically in relation to perceptions of crowding. The questions asked in the survey covered:
• demographic profile (including home town/country);
• perceptions and expectations of crowding, tolerance levels and detraction from enjoyment;
• satisfaction with overall experience.
4.2 Demographics of walkers
• Of the walkers surveyed, there was an even spread between males and females.
• By far the most prevalent age group was 20 to 39 years of age.
• With respect to the nationality of surveyed walkers, for the survey analysis, walkers were split into five categories (New Zealand, UK and Ireland, North America, Continental Europe, and ‘other’. Overall, walkers from the UK and Ireland were the most prevalent groups at 31%, with Continental Europe being the next most common nationality at 27%. Following this was walkers from New Zealanders at 22%. The “other” category was predominately comprised of people from Australia (approx 5% of total walkers), Asia (2%) and Israel.
• The majority of walkers travelled in pairs or in smaller groups of 3-4 people.
• Walkers were asked about their tramping experience. The majority (57%) considered they had some tramping experience and a further 26% considered they had lots of tramping experience. 6% were members of a tramping/walking club.
• In terms of transport mode, 89% of walkers arrived by bus. The remaining 11% arrived by private vehicle and campervan.
4.3 Crowding and Perceptions
Walkers surveyed were asked various questions in relation to perceptions of crowding. The five key questions summarised here were as follows:
1. “Overall, how crowded did you find/feel on the walk today?”
2. “Did you see more or fewer people (on the track) than you expected (today)”.
3. “Did the extent of crowding or number of people you saw on the Crossing detract from your enjoyment of the walk?”
Integrated Tourism Management Case Study: Use Limits on the Tongariro Crossing
17
4. “Based on your experience today, what is the most number of people you would be prepared to see on the walk before your enjoyment of the walk would start to diminish?”
5. “Overall, how satisfied were you with the walk?”
The responses to these questions are summarised below; first for the overall result, and then, significant differences with respect to number of walkers of the track, nationality, tramping experience, and weather are shown.
4.3.1 Overall crowding perceptions
Walkers were asked, “Overall, how crowded did you find/feel on the walk today?”
• Overall, 36 % did not feel at all crowded and 64 % of respondents perceived some degree of crowding. Of the latter group, 37% felt slightly crowded, 21% felt moderately crowded, and 7% felt extremely crowded.
• The total number of walkers on the track was the most important factor in walkers’ perceptions of crowding. The number of walkers who did not feel at all crowded declined as the number of walkers on the track increased. At more than 550 walkers/day, the number of people feeling extremely crowded increasing significantly.
• Weather conditions did not appear to impact on crowding perceptions, neither did start times.
• The survey results do not show any significant correlation between crowding perceptions based on nationality.
• There appear to be differences in crowding perceptions based on age and tramping experience. The data shows that the older the age group, the more tolerant people appear to be with respect to crowding: of the oldest group a large majority (68%) do not find the walk at all crowded. The more experienced walkers tended to find the track more crowded.
4.3.2 Crowding expectations
Walkers were asked, “Did you see more or fewer people on the track today than you expected?”.
• Overall. 51% saw more people than they expected, 31% saw about the same, and 18% saw less then they expected.
• As with visitor perceptions of crowding, there was a significant relationship between crowding expectations and the number of walkers on the track, with an increase in number of walkers relating to an increase in people who saw more than they expected. There is also a significant relationship between start times and expectation with a higher percentage of people who started in the peak time, seeing more people than they expected, compared to those who started in the off peak times.
• There is no significant relationship between expectations and country of origin or weather conditions.
4.3.3 Detraction from enjoyment
Walkers were asked, “Did the extent of crowding or number of people you saw on the Crossing detract from your enjoyment of the walk?”
• Overall, a clear majority, (73%) said that the number of people they saw did not detract from their enjoyment.
• However, the response differed significantly according to the actual number of walkers on the track. At up to 350 walkers per day on the track, fewer than 22% felt the number of people
Integrated Tourism Management Case Study: Use Limits on the Tongariro Crossing
18
seen detracted from their enjoyment of the walk. This percentage increased to 35% between 350 and 550 walkers, and further increased to 40% over 550 walkers.
• There also appears to be a significant relationship between enjoyment and start time and weather conditions.
• The data did not show any clear relationship with nationality and detraction from enjoyment, with all the countries experiencing similar reactions to the question.
4.3.4 Tolerance levels
Walkers were asked “based on your experience today, what is the most number of people you would be prepared to see on the walk before your enjoyment of the walk would start to diminish?”
• Overall, responses were evenly spread between those that wanted to see the same as seen on the day they did the walk (25%), a few more (27%), or a lot more than today (25%). 16% wanted to see fewer than seen today, and 7% wanted to see a lot fewer.
• At more than approximately 350 walkers/day, the number of walkers who would be happy to see a few or lot more people on the track drops significantly. This trend corresponds with an increase in the numbers who want to see less fewer people on the track.
• There was no relationship between the age of walkers, or their tramping experience, and the number they would be happy to see.
4.4 Visitor satisfaction
Walkers were asked how satisfied they were with the walk. The clear majority of walkers were very satisfied with the walk (>74% were “very satisfied” regardless of the number of walkers/day). There was no clear relationship between number of walkers, start times or weather.
4.5 Summary of Findings
The survey results show that there is a threshold of walker numbers, beyond which walkers’ perceptions of crowding increase and their tolerance of others and enjoyment are affected to some extent. The implications of these research results are discussed in more detail in the following section.
Integrated Tourism Management Case Study: Use Limits on the Tongariro Crossing
19
5 Demonstrating application of the framework
5.1 Application of the framework
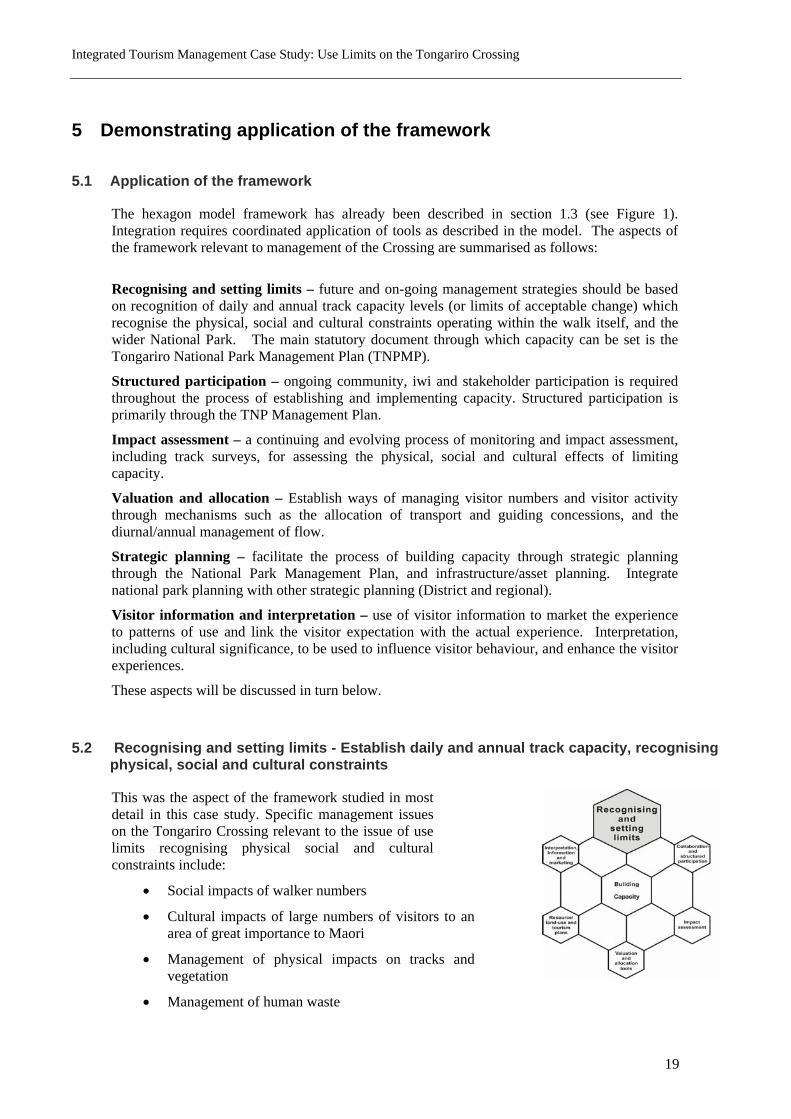
The hexagon model framework has already been described in section 1.3 (see Figure 1). Integration requires coordinated application of tools as described in the model. The aspects of the framework relevant to management of the Crossing are summarised as follows:
Recognising and setting limits – future and on-going management strategies should be based on recognition of daily and annual track capacity levels (or limits of acceptable change) which recognise the physical, social and cultural constraints operating within the walk itself, and the wider National Park. The main statutory document through which capacity can be set is the Tongariro National Park Management Plan (TNPMP).
Structured participation – ongoing community, iwi and stakeholder participation is required throughout the process of establishing and implementing capacity. Structured participation is primarily through the TNP Management Plan.
Impact assessment – a continuing and evolving process of monitoring and impact assessment, including track surveys, for assessing the physical, social and cultural effects of limiting capacity.
Valuation and allocation – Establish ways of managing visitor numbers and visitor activity through mechanisms such as the allocation of transport and guiding concessions, and the diurnal/annual management of flow.
Strategic planning – facilitate the process of building capacity through strategic planning through the National Park Management Plan, and infrastructure/asset planning. Integrate national park planning with other strategic planning (District and regional).
Visitor information and interpretation – use of visitor information to market the experience to patterns of use and link the visitor expectation with the actual experience. Interpretation, including cultural significance, to be used to influence visitor behaviour, and enhance the visitor experiences.
These aspects will be discussed in turn below.
5.2 Recognising and setting limits - Establish daily and annual track capacity, recognising physical, social and cultural constraints
This was the aspect of the framework studied in most detail in this case study. Specific management issues on the Tongariro Crossing relevant to the issue of use limits recognising physical social and cultural constraints include:
• Social impacts of walker numbers
• Cultural impacts of large numbers of visitors to an area of great importance to Maori
• Management of physical impacts on tracks and vegetation
• Management of human waste
Integrated Tourism Management Case Study: Use Limits on the Tongariro Crossing
20
• Promotion and safety management
• Road-end management
These issues are discussed below.
5.2.1 Social impacts of walker numbers
Survey results An analysis of the survey results is attached as Appendix E - Survey Analysis Summary and was summarised in Chapter 4. The data analysis shows three impacts on enjoyment – actual number of walkers on the track, start times, and weather. For perceptions of crowding, the main impacts appear to be number of walkers on the track and the age and experience of the walker. The weather and start times had no impact. For crowding expectations, as above, actual walker numbers, and the start time, impacted on the crowding expectation.
The survey results show that while walkers were well aware of other walkers and there were more walkers than they expected to see, for the majority, this did not detract from their overall enjoyment of the walk. Walkers’ perceptions of crowding appeared to change around 550 walkers/day. Expectation and detraction from enjoyment appear to change at around 350 walkers/day. Thus, walker numbers appeared to have a significant impact on perception, expectation and detraction.
In respect of tolerance levels, walkers were asked, based on your experience today, what is the most number of people you would be prepared to see on the walk before your enjoyment of the walk would start to diminish? In the 2005 survey, walkers were asked, How many people would you be prepared to see on this walk before your enjoyment would start to diminish? Respondents replied with either an actual number, or a statement relating to their experience on that particular day. The analysis shows a significant relationship between carrying capacity and walker numbers. At approximately 350 walkers, the number of walkers who would be happy to see a few or lot more people on the track drops significantly. This trend corresponds with an increase in the numbers who want to see less people on the track.
Interestingly, the results showed walker nationality played little part in affecting perception of crowding, expectation of crowding and numbers, and detraction from enjoyment given the number of people seen.
It may be argued that any questions on ‘crowding’ were leading, and implied a prior expectation that walkers would perceive crowding. However, the series of questions about crowding issues were preceded by a general statement that the surveyor was going to ‘ask a series of questions about the number of people on the track today and whether walkers perceived crowding’. In the 2005 survey, the question of overall perception of crowding was preceded by the question on whether walkers had seen more or less other walkers than they had expected. Therefore, although any mention of crowding could be perceived as leading, the overall pattern of results is consistent with significant numbers of walkers genuinely perceiving some degree of crowding. These perceptions were also consistent with responses given in all the focus group discussions. Factors contributing to crowding perception and enjoyment A commonly accepted model of crowding (Manning 1999) is based on the realisation that crowding is a perceptual concept, influenced by a number of factors including definition and concepts of crowding, prior expectations (Devlin et al 1995), and coping behaviours. The survey analysis is consistent with this model and suggests there are a number of factors that contribute toward crowding perceptions and enjoyment on the Crossing. There are likely to be a number of reasons for the key finding of high overall enjoyment and satisfaction levels in spite of significant perceptions of crowding and some detraction from enjoyment by crowding. The relevant factors include the following:
Integrated Tourism Management Case Study: Use Limits on the Tongariro Crossing
21
• Number of walkers on the track: There appear to be a significant relationship between walker numbers and crowding perceptions, expectations and enjoyment. The results suggested that there were thresholds of changes in walkers’ perceptions and enjoyment. At more than 350 walkers/day there was a threshold of perception towards “less positive” perceptions and experiences, while at more than 550 walkers/day there was a threshold towards “more negative” perceptions and experiences. In short, the number of walkers on the track appeared to have a significant impact on perception, expectation and detraction. Of the 28 days surveyed for which walker track counts were available, (90% of the total survey days), 50% of the days had more than 350 walkers and 21% had more than 550 walkers.
• Weather: Weather did not appear to impact on walkers’ perceptions of crowding. However, it did appear to impact on walkers’ enjoyment in terms of whether the number of people seen detracted from their enjoyment of the walk (Appendix E). On good weather condition days, more people felt the number of people seen detracted from their enjoyment of the walk. This may because there are more people on the track on good weather days, and on bad weather days, people are happy to see other walkers for safety reasons.
• Start times: There appears to be no relationship between start time and overall crowding perceptions (see below). However, the data does show a relationship between start time and crowding expectations and detraction from enjoyment. This suggests that people did not expect to see so many people at the start of the walk. In terms of enjoyment, the data shows the number of people did affect enjoyment. The reasons for this are unclear. It may be that people have initial annoyance at having a large number of people at the start in what is supposed to be a mountain tramp. Alternatively, people may be aware (in hindsight) that if they started earlier or later, they would be walking with less people.
• Factors contributing to people’s sense of crowding: The results show the main contributing factor to a sense of crowding was the overall number of people seen, followed by the clustering of people. Group size, behaviour of walkers and physical features of the track were not determining factors.
• Areas crowded and contributing factors: The surveys found particular areas of the track more crowded than others. The Crater Lakes, Devil’s Staircase and South Crater, and Ketetahi Hut were found to be the three most crowded areas of the Crossing. Some of these areas are where walkers are clustered because many of them are resting (e.g. the Crater Lakes and Ketetahi Hut areas). In resting areas, people are generally confined to an area, and have the opportunity to sit and observe how many other people there are around them. In addition, there is often a demand for optimum seating or viewing space. At the Devils Staircase and South Crater, the third most crowded area, walkers are clustered and constricted by the physical features of the track, i.e. slow and narrow track, and are able to see numerous other walkers as they walk up the Staircase and along the crater. This supports the relationship between place and the number of people seen and clustering of people. The physical value of openness on most of the Crossing may contribute to the perception of crowding in that landscape – unlike a closed canopy bush walk).
• By contrast, a far smaller proportion of walkers felt crowded at the start of the track (up to the beginning of the Devil’s Staircase), even though these areas might be expected to feel the most crowded because walkers starting in the peak time (7.15 – 8.45 am, see Appendix E - Survey Analysis Summary) have not started to space themselves out. Possible reasons for the lack of perception of crowding in these places is because walkers are strongly focussed on the beginning phases of the walk, because they are somewhat used to their group (busload), having been together on the bus for anything up to two hours before starting the walk, or because the track is somewhat confined in the Mangatepopo Valley and walkers do not have the opportunity to see large numbers of others. This last reason is probably why so few walkers feel crowded on the last section of the track, below Ketetahi
Integrated Tourism Management Case Study: Use Limits on the Tongariro Crossing
22
Hut. This is the only section which is forested and walkers generally only see people in their immediate vicinity.
• It is, however, surprising that so few walkers feel crowded at Ketetahi Carpark, which is physically constrained, and very crowded with walkers (waiting for their return transport) and vehicles for much of the afternoon on busy days. It is possible that because most walkers are particularly contented at having completed the Crossing, and/or focussed on the vehicle trip back to their base, that they are oblivious to crowding in this area.
• Conflicts between different groups of walkers: Two common sources of dissatisfaction among trampers in New Zealand and overseas studies are largely absent on the Tongariro Crossing. First, as a day walk, Crossing walkers do not experience the various sources of dissatisfaction associated with overnight stays in huts (Wray et al. 2006), including those reported at Ketetahi Hut for Tongariro Northern Circuit walkers (Cessford 1997; Olsen 2001). On the Crossing, walkers can choose not to enter Ketetahi Hut at all, or even to bypass it, although most walkers are likely to at least cross the front deck, and/or to use the toilets, so are likely to experience some clustering of people in these places on busy days, albeit briefly.
• Secondly, there are fewer opportunities for Crossing walkers to experience the conflicts associated with differing expectations of different groups of walkers (Wray et al.2006). Although walkers were not explicitly asked what their reasons for undertaking the walk, it is surmised (from walkers’ and focus group comments) that the primary motivations for most walkers are either to experience the scenery and natural features, and/or for the satisfaction/challenge of tackling a popular trip. Significantly, the survey did not cover any of the many people who make the shorter walk from Ketetahi carpark to the Ketetahi Hut and return, a popular half-day walk. Most people who do this walk have their own transport and are unlikely to linger at the carpark on their return. Walkers who choose to make this trip on a fine summer afternoon will inevitably encounter, on their ascent to Ketetahi hut, a large number of Crossing walkers on the final stage of the Crossing. It is reasonable to assume that a large number of the half-day walkers would not had have prior knowledge that this was going to happen, and also a reasonable hypothesis that many of these walkers would perceive crowding issues and experience lower levels of satisfaction.
Demographic factors An assumption of a number of people spoken to early in the study was that there would be clear differences in the experiences and perceptions of different groups of walkers, especially according to nationality. A common expectation, for example, was that New Zealanders would be less tolerant of crowding than other nationalities. Our results did not support this expectation, or at least not strongly. For example, Fig E33, Appendix E shows that although New Zealanders were more likely than the other national groups to want to see a lot fewer walkers on the track, they were not markedly so, whereas both Continental Europeans and “others” were more likely to want to see fewer walkers. New Zealanders showed the same high levels of satisfaction as other nationalities (Fig E 30, Appendix E) and had a fairly similar proportion of walkers whose enjoyment was detracted by the number of other walkers (Fig E25, Appendix E). Overall, New Zealanders seemed to have about the same tolerance and enjoyment levels as Continental Europeans and “others” (e.g. Australians). These findings are consistent with earlier findings of Gibson (1996), but not those of Olsen (2001) (see Appendix B).
New Zealanders were distinguished from other nationalities in two other respects. Firstly, they were much more likely than all other nationality groups to find the walk more crowded than they expected. This is thought to be due to the availability of prior information, especially travel guides. Almost all the three quarters of walkers from overseas had seen information about the walk in guide books, and guide books had been the first source of information for nearly 40% of all walkers. Examination of some of the common English guidebooks (e.g. “Lonely Planet”) showed that the information given on the walk was accurate and helpful, including the fact that
Integrated Tourism Management Case Study: Use Limits on the Tongariro Crossing
23
the walk was crowded on many summer days. New Zealanders generally do not access such information. It seems clear that the “average” New Zealander coming from an urban centre to experience the Crossing for the first time has no “inside knowledge” of what to expect on the Crossing.
The second aspect was not tested in the survey but was discussed in several focus groups. This was that New Zealanders are more likely to be present in winter and at other off-peak times covered in this survey, and correspondingly likely to be slightly under-represented in this survey. The New Zealanders who walk the track in off-peak times may be walkers who would be less tolerant of crowding, i.e. people who avoid the Crossing except at times when they know it will have few walkers. This factor is discussed in the next section. Avoidance by some groups of visitors The possibility of experienced trampers and wilderness-seekers actively avoiding the Crossing because they feel it is overcrowded was discussed with focus groups and other interviewees. Very little evidence was found of this effect. A few people said that solitude was an important part of the Crossing experience, and that they would only choose to walk on the Crossing when they knew there would be few other walkers. However, when asked about the possibility of restricting numbers of walkers on the Crossing to lessen perceptions of crowding, experienced trampers were generally not in favour of such options. Reasons for this included:
• The freedom to walk where and when you want on New Zealand public conservation land is an important principle.
• The Crossing is not as crowded as other places within TNP (e.g. the skifields).
• Everyone should have the opportunity to experience the Crossing – the scenery and natural features are the highlights of the experience and the presence of other walkers is secondary.
• If walkers want a wilderness experience they can always go to other places in TNP (including side walks close to the Crossing) or choose times of the day or the year when the route will not be crowded.
5.2.2 Cultural impacts of large numbers of visitors to an area of great importance to Maori
The mountains of TNP are of great spiritual and cultural significance to Maori, and specifically to the tangata whenua of the rohe (area) traversed by the Crossing. The establishment of the National Park stemmed from the gift of the three peaks of Ruapehu, Ngauruhoe and Tongariro by the Maori owners to the nation in 1887. Many older Maori still regard the mountain as physically tapu (sacred) and do not walk on it or at least do not use the mountain for recreation, but only for specific cultural purposes.
Continued interest in the cultural and other values of TNP by tangata whenua is manifested in a number of ongoing management issues for the Crossing. These include tangata whenua desire to be involved in decision-making over the issuing of any concessions for commercial guiding on the Crossing, concern over rubbish on the Crossing route (including any human waste not disposed of away from the mountain), and unauthorised public access to the Ketetahi Springs below Ketetahi Hut. The Springs themselves are not part of the National Park, but are owned by a Maori Trust, and a small portion of the Crossing track, by agreement of the Trust, crosses this enclave of private land close to the Springs.
Behind these more specific issues lie more general and ongoing concerns about the effects of commercialisation in the National Park, and a desire for a partnership approach to governance of the National Park and the Crossing. Discussions with the Maori focus group raised specific concerns over the interpretation of cultural aspects of the Crossing and their strong desire for a partnership approach to the management of the walk. They wished to be integrally involved in the use of information and interpretation through provision of guiding services, preferring this to the provision of more printed information.
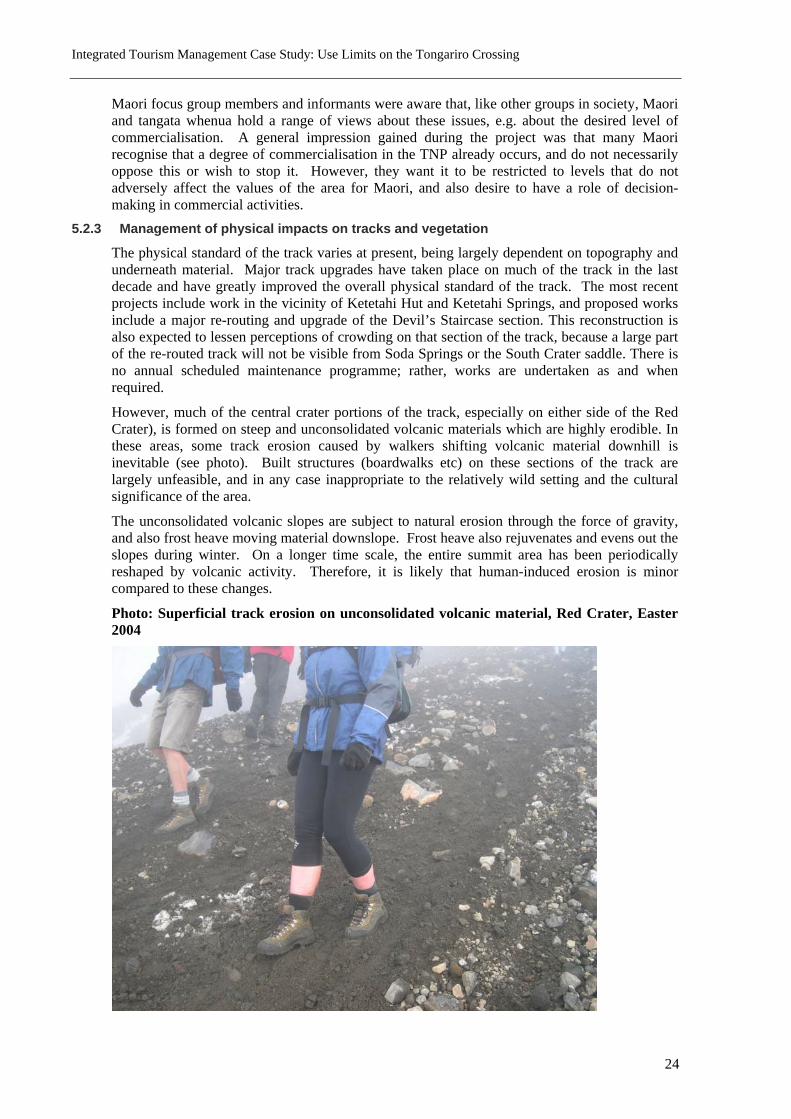
Integrated Tourism Management Case Study: Use Limits on the Tongariro Crossing
24
Maori focus group members and informants were aware that, like other groups in society, Maori and tangata whenua hold a range of views about these issues, e.g. about the desired level of commercialisation. A general impression gained during the project was that many Maori recognise that a degree of commercialisation in the TNP already occurs, and do not necessarily oppose this or wish to stop it. However, they want it to be restricted to levels that do not adversely affect the values of the area for Maori, and also desire to have a role of decision-making in commercial activities.
5.2.3 Management of physical impacts on tracks and vegetation
The physical standard of the track varies at present, being largely dependent on topography and underneath material. Major track upgrades have taken place on much of the track in the last decade and have greatly improved the overall physical standard of the track. The most recent projects include work in the vicinity of Ketetahi Hut and Ketetahi Springs, and proposed works include a major re-routing and upgrade of the Devil’s Staircase section. This reconstruction is also expected to lessen perceptions of crowding on that section of the track, because a large part of the re-routed track will not be visible from Soda Springs or the South Crater saddle. There is no annual scheduled maintenance programme; rather, works are undertaken as and when required.
However, much of the central crater portions of the track, especially on either side of the Red Crater), is formed on steep and unconsolidated volcanic materials which are highly erodible. In these areas, some track erosion caused by walkers shifting volcanic material downhill is inevitable (see photo). Built structures (boardwalks etc) on these sections of the track are largely unfeasible, and in any case inappropriate to the relatively wild setting and the cultural significance of the area.
The unconsolidated volcanic slopes are subject to natural erosion through the force of gravity, and also frost heave moving material downslope. Frost heave also rejuvenates and evens out the slopes during winter. On a longer time scale, the entire summit area has been periodically reshaped by volcanic activity. Therefore, it is likely that human-induced erosion is minor compared to these changes.
Photo: Superficial track erosion on unconsolidated volcanic material, Red Crater, Easter 2004
Integrated Tourism Management Case Study: Use Limits on the Tongariro Crossing
25
In terms of awareness of damage, walkers were not asked a specific questioning relating to damage to the track and there were no specific comments made. However in the 2004 survey, walkers were asked whether they stepped off the track. Approximately 40% of walkers said they stepped off the track at some stage in order to avoid or bypass other walkers. During this project, the researchers made several crossings, and noted that walkers frequently stepped or walked off the track, occasionally by several meters. Our observations would indicate that far more than 40% of walkers do this.
Focus group discussion also noted some degradation at the edges of the track, and instances of groups deliberately going off the track. This is thought to be mainly confined to relatively small numbers of experienced local walkers. For example, a route over the top of the North Crater and traversing the summit of Mount Tongariro, joining the main track at the top of the Devil’s Staircase, is a locally well-known alternative route. Experienced TNP users are aware of several other unofficial routes in the vicinity of the Crossing.
Very little systematic measurement or monitoring of erosion has been carried out, planning of track upgrading being based on direct observation of the more conspicuous walker impacts.
In summary, it is clear that some human-induced erosion on the Crossing occurs, mainly localised erosion in the immediate vicinity of the track through walkers stepping off the track, but possibly also through erosion in the vicinity of the Red Crater. The scale of such erosion impacts does not seem to be a significant management issue at present but probably warrants ongoing monitoring to assess its significance. Monitoring in the vicinity of tracks could be simply and adequately undertaken by repeat photography at fixed photo-points. Monitoring in the Red Crater section would require setting up of fixed observation points such as erosion pins. If monitoring showed that erosion on these sections was greater than the limits of acceptable change, then the only management option would be to restrict the overall number of walkers on the track.
5.2.4 Management of rubbish and human waste
The adequate and appropriate management of rubbish and human waste is an important aspect of management of the large numbers of walkers spending a day on the Crossing. It is not just a logistical management issue, as the presence of rubbish or any signs of human waste is not just a health and amenity issue, it is also socially and culturally offensive.
At present, there are five toilet locations on the Crossing: at the start of the walk, the Mangatepopo Hut, Soda Springs, Ketetahi Hut and the road end at Ketetahi carpark. Before the relatively recent installation of toilets at Soda Springs, there were some reported instances of human waste close to the track. This problem has decreased, although instances of walkers not using the toilets provided (particularly in the Crater Lakes section) have been noted to the researchers by DOC staff and other walkers. There are no sewage treatment or disposal facilities associated with the toilets: all toilet waste (and other rubbish from the huts) is carried out by helicopter. Among other reasons, it would be culturally highly offensive to dispose of human waste on the slopes of the sacred mountain.
In terms of adequacy of toilet facilities, the 2004 survey results found that 86% of those surveyed thought there were sufficient toilets on the track. Even on the busiest day, when 648 people were counted on the track, the clear majority of people (73%) still thought there were sufficient toilets on the track. The most commonly used toilets were at Ketetahi Hut, followed by the toilets at the start of the walk at Mangatepopo carpark, the toilet at Soda Springs, and then the toilets at Mangatepopo hut.
In general, DOC’s policy for all infrastructure, including toilets, is to provide the minimum necessary. Informal TNP policy was that there would be no further toilet facilities built on the Crossing, in particular none in the Craters area. This is because, as well as the “minimum necessary” policy noted above, it would not be appropriate to place toilets on the high mountain slopes, for cultural reasons and to maintain the amenities-free zoning of this area. The current
Integrated Tourism Management Case Study: Use Limits on the Tongariro Crossing
26
TNP Management Plan does not however rule out the placement of further toilets on the Crossing.
Walkers were not specifically asked as to whether they found the standard of toilets adequate. Volunteered comments from walkers were generally positive, although some comments were made about the state of the toilets (such as capacity, lack of hand wash cream, lack of toilet paper).
Wardens and DOC staff have commented that items of general rubbish on and near the track are an ongoing management issue. The main items encountered by the researchers during the project were paper tissues along the track, which were very conspicuous because they were mainly white. Possibly some walkers thought that these were biodegradable and therefore not a problem.
Our survey results are not consistent with observations about human waste on the Track. This raises the question of whether walkers are provided with enough information on the location of the toilets and the lack of toilets between Soda Springs and Ketetahi Hut. The provision of toilets was identified as an issue in the focus group discussions with Ngati Hikairo, and the discussion with the concession holders identified a greater need for information for the tourists as to the toilet locations. Currently there are no reminders for walkers on the Crossing to use only the toilets, although some of the public information on maps and pamphlets points out that there are no toilets between Soda Springs and Ketetahi Hut.
Because of the importance of the absence of rubbish, including human waste, to visitor satisfaction and the values of the national park, ongoing monitoring of rubbish and human waste is therefore justified. If unacceptable (very low) levels continue to be observed, then management intervention is justified. It is suggested that education about the need for a “zero tolerance” towards rubbish and human waste is a first step, but that if problems persist then provision of further toilets may need to be considered. It is noted that iwi have supported many proposals to encourage ongoing protection of the national park, including toilet and sewerage provision on the mountain.
5.2.5 Promotion and safety management
An issue raised in the focus group discussions and interviews was that of safety. There was a strong impression that many walkers are not aware of the physical demanding nature of the walk and that often the walkers are ill equipped and ill prepared, especially in bad weather conditions. The main safety concern is due to the very changeable nature of the mountain weather, and that a day that starts in fine conditions in the Mangatepopo Valley can rapidly deteriorate to hazardously cold and windy conditions in the Craters area, under which ill-prepared walkers could be subject to severe exposure and helicopter rescue is not possible. There have been a number of fatalities under such conditions on the Crossing, and helicopter rescues are becoming reasonably regular.
A typical comment was, “The standard of dress has lowered and the ‘idiot’ factor has become more prevalent with the increase in numbers”. These concerns were supported in comments from some of the walkers surveyed, particularly on days when the weather conditions were more adverse. This detracted from their experience of the walk in that they knew this could be a problem or dangerous to them if other people got into trouble.
There were some differing opinions between the focus groups in relation to responsibility for walker safety. The concession holders who participated in the focus groups felt that at times they were being unfairly held responsible for the safety of walkers. Most concession holders advise clients on suitable clothing and equipment for the trip. Some operators also have informal arrangements with each other to offer return transport to walkers who for various reasons emerge from the Crossing late in the day (i.e. miss their scheduled return trip). It was stressed by concession holders that while they can turn walkers away from their vehicles and not
Integrated Tourism Management Case Study: Use Limits on the Tongariro Crossing
27
transport them to the walk, they cannot refuse them entry into the park: once on the track, walkers are responsible for their own safety.
Some walkers indicated that they wanted further information on track conditions, safety, etc to be available. It was noted that those on guided walks tend to listen to the guide in relation to equipment and weather conditions. Responsibility for walker safety is an emerging issue linked to capacity and interpretation.
A further safety issue is that of volcanic hazard from unexpected eruptions of Mount Ngauruhoe. Eruptions from Mount Ngauruhoe do occur regularly – the last eruption occurred on 1975 (Appendix A) and a group of walkers in the South Crater were showered with stones and ash but uninjured. These eruptions cannot be predicted with precision at this stage and walkers are undoubtedly at some risk when walking between the upper Mangatepopo Valley and the Red Crater, or ascending Mt Ngauruhoe. Work on modelling these risks is currently underway at Massey University. The risks are high magnitude but of very low probability, so are lower overall than weather-related risks which are medium to high magnitude for any individual walker on particular days, and of relatively high probability. They are also much lower than for the thousands of skiers on Mt Ruapehu. The appropriate management response would seem to be to base hazard management planning to on an appropriate response to different levels of activity or estimated eruption risk at different times.
DOC tries to ensure that all prospective walkers who consult DOC sources are well informed about safe travel in the mountain environment. The DOC web site says: “The Tongariro Alpine Crossing is a full-day hike into a mountain environment. It travels over steep and often difficult terrain and is often subject to severe weather conditions. Although often described as a walking track it is in reality an alpine trek (or tramp in New Zealand terminology) and a change of weather for the worse can make the crossing difficult and even dangerous if you are not well prepared. It is important to have the appropriate clothing, equipment and fitness level.”
However many walkers have no direct contact with DOC during or prior to their walk. Therefore it appears that transport operators (who are all operating concessions with DOC) need to take some responsibility for this aspect of management.
5.2.6 Road-end management and start times
Crowding at the carparks has been identified as a particular crowding issue. The linear one way nature of the walk and setback of the walk ends from the State Highway mean that the majority of walkers catch a commercially-provided bus which drops them off at Mangatepopo carpark and picks them up at Ketetahi carpark. This pattern was reflected in the surveys in which 89% of walkers surveyed arrived at the track end by bus. As perhaps would be expected, the rate of New Zealanders who used buses was lower, being 72% overall. This would reflect the presumed higher car ownership of New Zealanders as opposed to overseas visitors.
At present, the largest bottleneck (both walkers and buses) is at the Mangatepopo carpark road end between 7.30 and 9.30am. The carpark at the Ketetahi road end was also very crowded on some of those days surveyed.
However, as shown in Appendix E (Fig. E15), relatively few walkers perceive either carpark area, or the start of the Crossing (Mangatepopo Valley), as being particularly crowded. This was surprising as it was often suggested that the perception of crowding is largely attributable to the number of people arriving in large groups from the buses. Possible factors for the lack of perception of crowding in these places are that crowding at the start does not bother people as they are focussed on the walk ahead; the scenery is not as dramatic and iconic; the gentle gradient of the track facilitates easier passing, the tussock and winding nature of the path assist in screening other walkers; or that walkers are not stopping to rest and observe the number of other walkers.
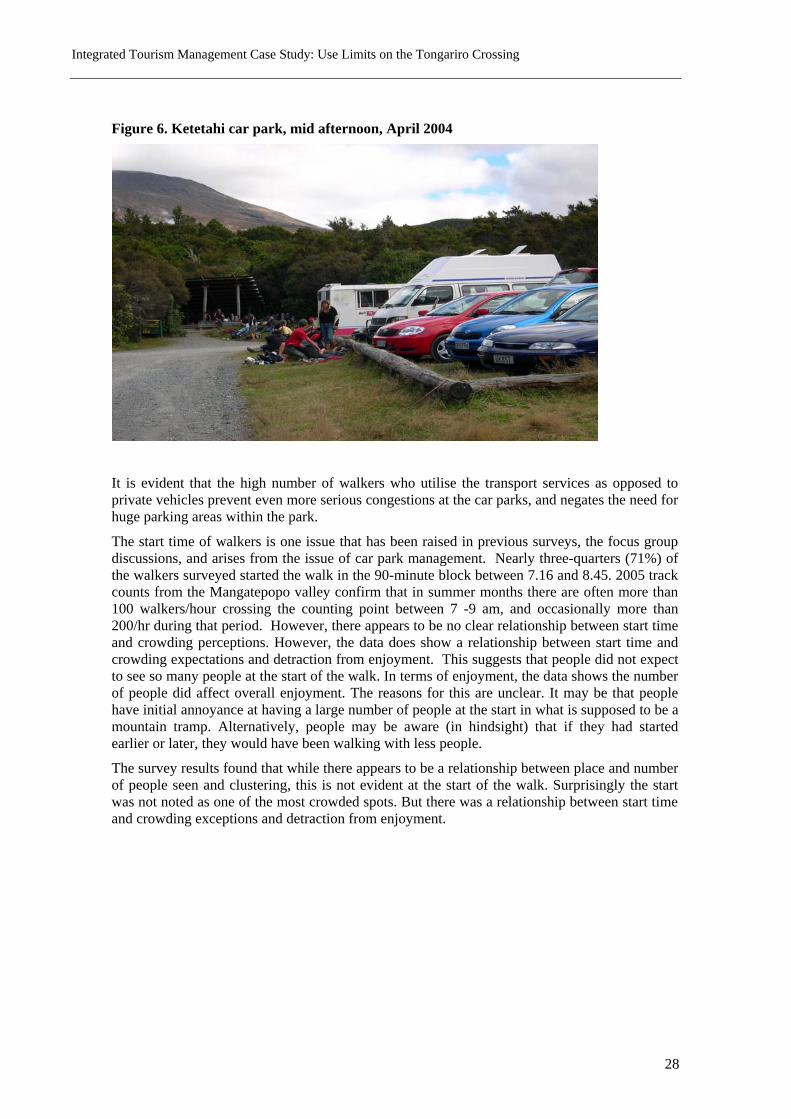
Integrated Tourism Management Case Study: Use Limits on the Tongariro Crossing
28
Figure 6. Ketetahi car park, mid afternoon, April 2004
It is evident that the high number of walkers who utilise the transport services as opposed to private vehicles prevent even more serious congestions at the car parks, and negates the need for huge parking areas within the park.
The start time of walkers is one issue that has been raised in previous surveys, the focus group discussions, and arises from the issue of car park management. Nearly three-quarters (71%) of the walkers surveyed started the walk in the 90-minute block between 7.16 and 8.45. 2005 track counts from the Mangatepopo valley confirm that in summer months there are often more than 100 walkers/hour crossing the counting point between 7 -9 am, and occasionally more than 200/hr during that period. However, there appears to be no clear relationship between start time and crowding perceptions. However, the data does show a relationship between start time and crowding expectations and detraction from enjoyment. This suggests that people did not expect to see so many people at the start of the walk. In terms of enjoyment, the data shows the number of people did affect overall enjoyment. The reasons for this are unclear. It may be that people have initial annoyance at having a large number of people at the start in what is supposed to be a mountain tramp. Alternatively, people may be aware (in hindsight) that if they had started earlier or later, they would have been walking with less people.
The survey results found that while there appears to be a relationship between place and number of people seen and clustering, this is not evident at the start of the walk. Surprisingly the start was not noted as one of the most crowded spots. But there was a relationship between start time and crowding exceptions and detraction from enjoyment.
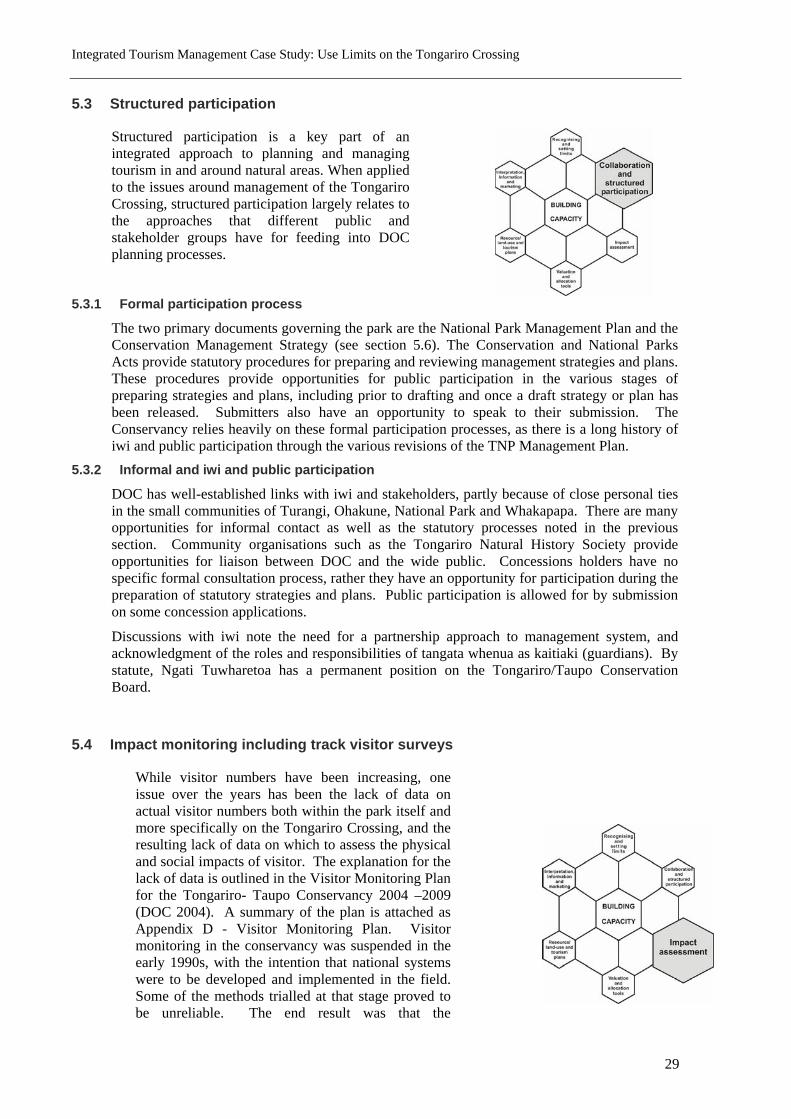
Integrated Tourism Management Case Study: Use Limits on the Tongariro Crossing
29
5.3 Structured participation
Structured participation is a key part of an integrated approach to planning and managing tourism in and around natural areas. When applied to the issues around management of the Tongariro Crossing, structured participation largely relates to the approaches that different public and stakeholder groups have for feeding into DOC planning processes.
5.3.1 Formal participation process
The two primary documents governing the park are the National Park Management Plan and the Conservation Management Strategy (see section 5.6). The Conservation and National Parks Acts provide statutory procedures for preparing and reviewing management strategies and plans. These procedures provide opportunities for public participation in the various stages of preparing strategies and plans, including prior to drafting and once a draft strategy or plan has been released. Submitters also have an opportunity to speak to their submission. The Conservancy relies heavily on these formal participation processes, as there is a long history of iwi and public participation through the various revisions of the TNP Management Plan.
5.3.2 Informal and iwi and public participation
DOC has well-established links with iwi and stakeholders, partly because of close personal ties in the small communities of Turangi, Ohakune, National Park and Whakapapa. There are many opportunities for informal contact as well as the statutory processes noted in the previous section. Community organisations such as the Tongariro Natural History Society provide opportunities for liaison between DOC and the wide public. Concessions holders have no specific formal consultation process, rather they have an opportunity for participation during the preparation of statutory strategies and plans. Public participation is allowed for by submission on some concession applications.
Discussions with iwi note the need for a partnership approach to management system, and acknowledgment of the roles and responsibilities of tangata whenua as kaitiaki (guardians). By statute, Ngati Tuwharetoa has a permanent position on the Tongariro/Taupo Conservation Board.
5.4 Impact monitoring including track visitor surveys
While visitor numbers have been increasing, one issue over the years has been the lack of data on actual visitor numbers both within the park itself and more specifically on the Tongariro Crossing, and the resulting lack of data on which to assess the physical and social impacts of visitor. The explanation for the lack of data is outlined in the Visitor Monitoring Plan for the Tongariro- Taupo Conservancy 2004 –2009 (DOC 2004). A summary of the plan is attached as Appendix D - Visitor Monitoring Plan. Visitor monitoring in the conservancy was suspended in the early 1990s, with the intention that national systems were to be developed and implemented in the field. Some of the methods trialled at that stage proved to be unreliable. The end result was that the
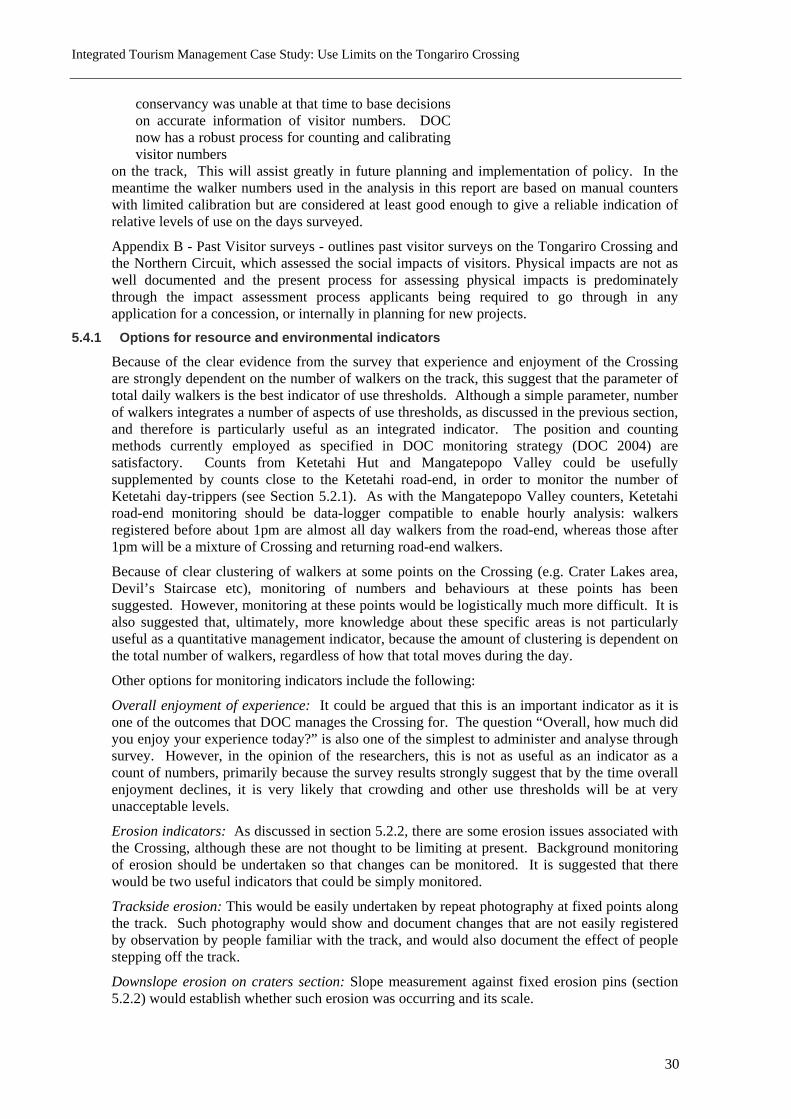
Integrated Tourism Management Case Study: Use Limits on the Tongariro Crossing
30
conservancy was unable at that time to base decisions on accurate information of visitor numbers. DOC now has a robust process for counting and calibrating visitor numbers
on the track, This will assist greatly in future planning and implementation of policy. In the meantime the walker numbers used in the analysis in this report are based on manual counters with limited calibration but are considered at least good enough to give a reliable indication of relative levels of use on the days surveyed.
Appendix B - Past Visitor surveys - outlines past visitor surveys on the Tongariro Crossing and the Northern Circuit, which assessed the social impacts of visitors. Physical impacts are not as well documented and the present process for assessing physical impacts is predominately through the impact assessment process applicants being required to go through in any application for a concession, or internally in planning for new projects.
5.4.1 Options for resource and environmental indicators
Because of the clear evidence from the survey that experience and enjoyment of the Crossing are strongly dependent on the number of walkers on the track, this suggest that the parameter of total daily walkers is the best indicator of use thresholds. Although a simple parameter, number of walkers integrates a number of aspects of use thresholds, as discussed in the previous section, and therefore is particularly useful as an integrated indicator. The position and counting methods currently employed as specified in DOC monitoring strategy (DOC 2004) are satisfactory. Counts from Ketetahi Hut and Mangatepopo Valley could be usefully supplemented by counts close to the Ketetahi road-end, in order to monitor the number of Ketetahi day-trippers (see Section 5.2.1). As with the Mangatepopo Valley counters, Ketetahi road-end monitoring should be data-logger compatible to enable hourly analysis: walkers registered before about 1pm are almost all day walkers from the road-end, whereas those after 1pm will be a mixture of Crossing and returning road-end walkers.
Because of clear clustering of walkers at some points on the Crossing (e.g. Crater Lakes area, Devil’s Staircase etc), monitoring of numbers and behaviours at these points has been suggested. However, monitoring at these points would be logistically much more difficult. It is also suggested that, ultimately, more knowledge about these specific areas is not particularly useful as a quantitative management indicator, because the amount of clustering is dependent on the total number of walkers, regardless of how that total moves during the day.
Other options for monitoring indicators include the following:
Overall enjoyment of experience: It could be argued that this is an important indicator as it is one of the outcomes that DOC manages the Crossing for. The question “Overall, how much did you enjoy your experience today?” is also one of the simplest to administer and analyse through survey. However, in the opinion of the researchers, this is not as useful as an indicator as a count of numbers, primarily because the survey results strongly suggest that by the time overall enjoyment declines, it is very likely that crowding and other use thresholds will be at very unacceptable levels.
Erosion indicators: As discussed in section 5.2.2, there are some erosion issues associated with the Crossing, although these are not thought to be limiting at present. Background monitoring of erosion should be undertaken so that changes can be monitored. It is suggested that there would be two useful indicators that could be simply monitored.
Trackside erosion: This would be easily undertaken by repeat photography at fixed points along the track. Such photography would show and document changes that are not easily registered by observation by people familiar with the track, and would also document the effect of people stepping off the track.
Downslope erosion on craters section: Slope measurement against fixed erosion pins (section 5.2.2) would establish whether such erosion was occurring and its scale.
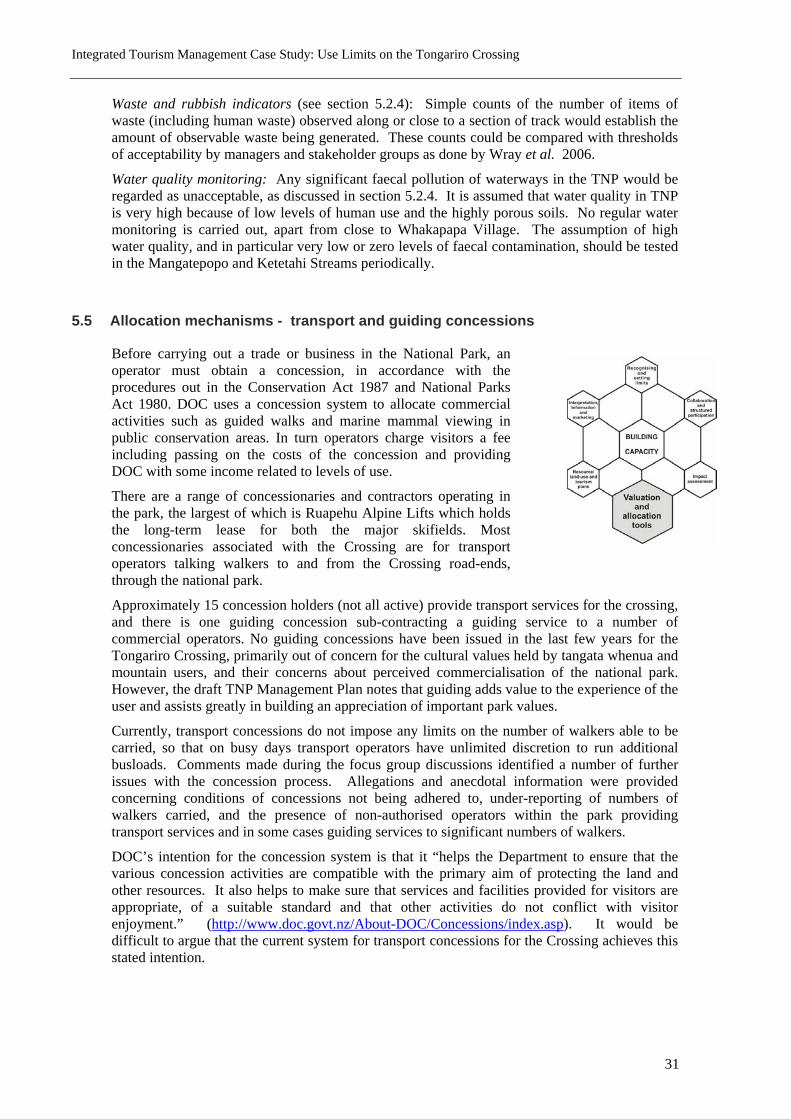
Integrated Tourism Management Case Study: Use Limits on the Tongariro Crossing
31
Waste and rubbish indicators (see section 5.2.4): Simple counts of the number of items of waste (including human waste) observed along or close to a section of track would establish the amount of observable waste being generated. These counts could be compared with thresholds of acceptability by managers and stakeholder groups as done by Wray et al. 2006.
Water quality monitoring: Any significant faecal pollution of waterways in the TNP would be regarded as unacceptable, as discussed in section 5.2.4. It is assumed that water quality in TNP is very high because of low levels of human use and the highly porous soils. No regular water monitoring is carried out, apart from close to Whakapapa Village. The assumption of high water quality, and in particular very low or zero levels of faecal contamination, should be tested in the Mangatepopo and Ketetahi Streams periodically.
5.5 Allocation mechanisms - transport and guiding concessions
Before carrying out a trade or business in the National Park, an operator must obtain a concession, in accordance with the procedures out in the Conservation Act 1987 and National Parks Act 1980. DOC uses a concession system to allocate commercial activities such as guided walks and marine mammal viewing in public conservation areas. In turn operators charge visitors a fee including passing on the costs of the concession and providing DOC with some income related to levels of use.
There are a range of concessionaries and contractors operating in the park, the largest of which is Ruapehu Alpine Lifts which holds the long-term lease for both the major skifields. Most concessionaries associated with the Crossing are for transport operators talking walkers to and from the Crossing road-ends, through the national park.
Approximately 15 concession holders (not all active) provide transport services for the crossing, and there is one guiding concession sub-contracting a guiding service to a number of commercial operators. No guiding concessions have been issued in the last few years for the Tongariro Crossing, primarily out of concern for the cultural values held by tangata whenua and mountain users, and their concerns about perceived commercialisation of the national park. However, the draft TNP Management Plan notes that guiding adds value to the experience of the user and assists greatly in building an appreciation of important park values.
Currently, transport concessions do not impose any limits on the number of walkers able to be carried, so that on busy days transport operators have unlimited discretion to run additional busloads. Comments made during the focus group discussions identified a number of further issues with the concession process. Allegations and anecdotal information were provided concerning conditions of concessions not being adhered to, under-reporting of numbers of walkers carried, and the presence of non-authorised operators within the park providing transport services and in some cases guiding services to significant numbers of walkers.
DOC’s intention for the concession system is that it “helps the Department to ensure that the various concession activities are compatible with the primary aim of protecting the land and other resources. It also helps to make sure that services and facilities provided for visitors are appropriate, of a suitable standard and that other activities do not conflict with visitor enjoyment.” (http://www.doc.govt.nz/About-DOC/Concessions/index.asp). It would be difficult to argue that the current system for transport concessions for the Crossing achieves this stated intention.
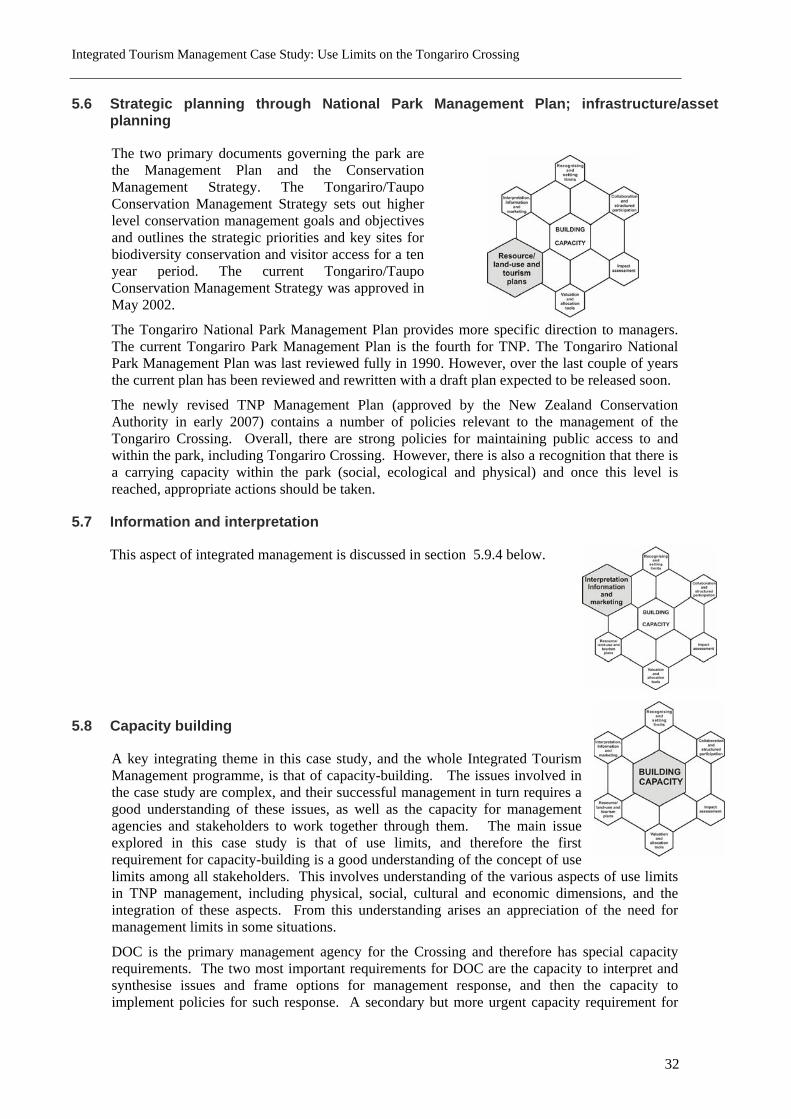
Integrated Tourism Management Case Study: Use Limits on the Tongariro Crossing
32
5.6 Strategic planning through National Park Management Plan; infrastructure/asset planning
The two primary documents governing the park are the Management Plan and the Conservation Management Strategy. The Tongariro/Taupo Conservation Management Strategy sets out higher level conservation management goals and objectives and outlines the strategic priorities and key sites for biodiversity conservation and visitor access for a ten year period. The current Tongariro/Taupo Conservation Management Strategy was approved in May 2002.
The Tongariro National Park Management Plan provides more specific direction to managers. The current Tongariro Park Management Plan is the fourth for TNP. The Tongariro National Park Management Plan was last reviewed fully in 1990. However, over the last couple of years the current plan has been reviewed and rewritten with a draft plan expected to be released soon.
The newly revised TNP Management Plan (approved by the New Zealand Conservation Authority in early 2007) contains a number of policies relevant to the management of the Tongariro Crossing. Overall, there are strong policies for maintaining public access to and within the park, including Tongariro Crossing. However, there is also a recognition that there is a carrying capacity within the park (social, ecological and physical) and once this level is reached, appropriate actions should be taken.
5.7 Information and interpretation
This aspect of integrated management is discussed in section 5.9.4 below.
5.8 Capacity building
A key integrating theme in this case study, and the whole Integrated Tourism Management programme, is that of capacity-building. The issues involved in the case study are complex, and their successful management in turn requires a good understanding of these issues, as well as the capacity for management agencies and stakeholders to work together through them. The main issue explored in this case study is that of use limits, and therefore the first requirement for capacity-building is a good understanding of the concept of use limits among all stakeholders. This involves understanding of the various aspects of use limits in TNP management, including physical, social, cultural and economic dimensions, and the integration of these aspects. From this understanding arises an appreciation of the need for management limits in some situations.
DOC is the primary management agency for the Crossing and therefore has special capacity requirements. The two most important requirements for DOC are the capacity to interpret and synthesise issues and frame options for management response, and then the capacity to implement policies for such response. A secondary but more urgent capacity requirement for
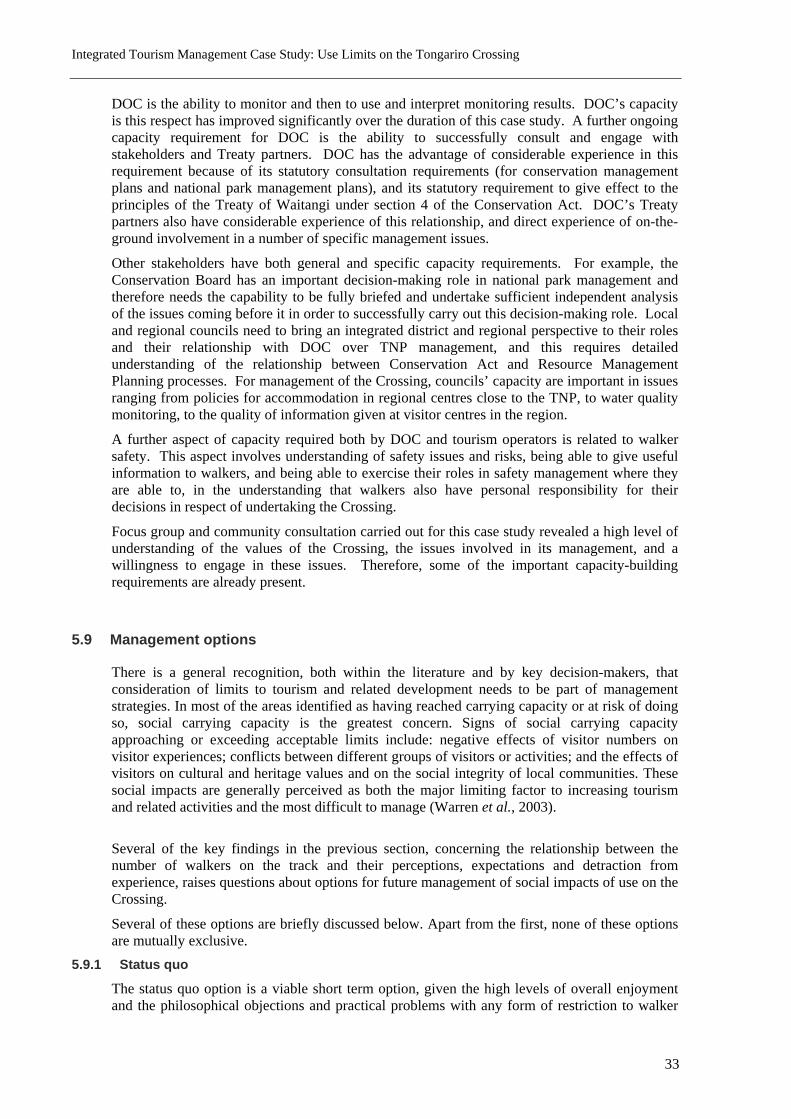
Integrated Tourism Management Case Study: Use Limits on the Tongariro Crossing
33
DOC is the ability to monitor and then to use and interpret monitoring results. DOC’s capacity is this respect has improved significantly over the duration of this case study. A further ongoing capacity requirement for DOC is the ability to successfully consult and engage with stakeholders and Treaty partners. DOC has the advantage of considerable experience in this requirement because of its statutory consultation requirements (for conservation management plans and national park management plans), and its statutory requirement to give effect to the principles of the Treaty of Waitangi under section 4 of the Conservation Act. DOC’s Treaty partners also have considerable experience of this relationship, and direct experience of on-the-ground involvement in a number of specific management issues.
Other stakeholders have both general and specific capacity requirements. For example, the Conservation Board has an important decision-making role in national park management and therefore needs the capability to be fully briefed and undertake sufficient independent analysis of the issues coming before it in order to successfully carry out this decision-making role. Local and regional councils need to bring an integrated district and regional perspective to their roles and their relationship with DOC over TNP management, and this requires detailed understanding of the relationship between Conservation Act and Resource Management Planning processes. For management of the Crossing, councils’ capacity are important in issues ranging from policies for accommodation in regional centres close to the TNP, to water quality monitoring, to the quality of information given at visitor centres in the region.
A further aspect of capacity required both by DOC and tourism operators is related to walker safety. This aspect involves understanding of safety issues and risks, being able to give useful information to walkers, and being able to exercise their roles in safety management where they are able to, in the understanding that walkers also have personal responsibility for their decisions in respect of undertaking the Crossing.
Focus group and community consultation carried out for this case study revealed a high level of understanding of the values of the Crossing, the issues involved in its management, and a willingness to engage in these issues. Therefore, some of the important capacity-building requirements are already present.
5.9 Management options
There is a general recognition, both within the literature and by key decision-makers, that consideration of limits to tourism and related development needs to be part of management strategies. In most of the areas identified as having reached carrying capacity or at risk of doing so, social carrying capacity is the greatest concern. Signs of social carrying capacity approaching or exceeding acceptable limits include: negative effects of visitor numbers on visitor experiences; conflicts between different groups of visitors or activities; and the effects of visitors on cultural and heritage values and on the social integrity of local communities. These social impacts are generally perceived as both the major limiting factor to increasing tourism and related activities and the most difficult to manage (Warren et al., 2003).
Several of the key findings in the previous section, concerning the relationship between the number of walkers on the track and their perceptions, expectations and detraction from experience, raises questions about options for future management of social impacts of use on the Crossing.
Several of these options are briefly discussed below. Apart from the first, none of these options are mutually exclusive.
5.9.1 Status quo
The status quo option is a viable short term option, given the high levels of overall enjoyment and the philosophical objections and practical problems with any form of restriction to walker
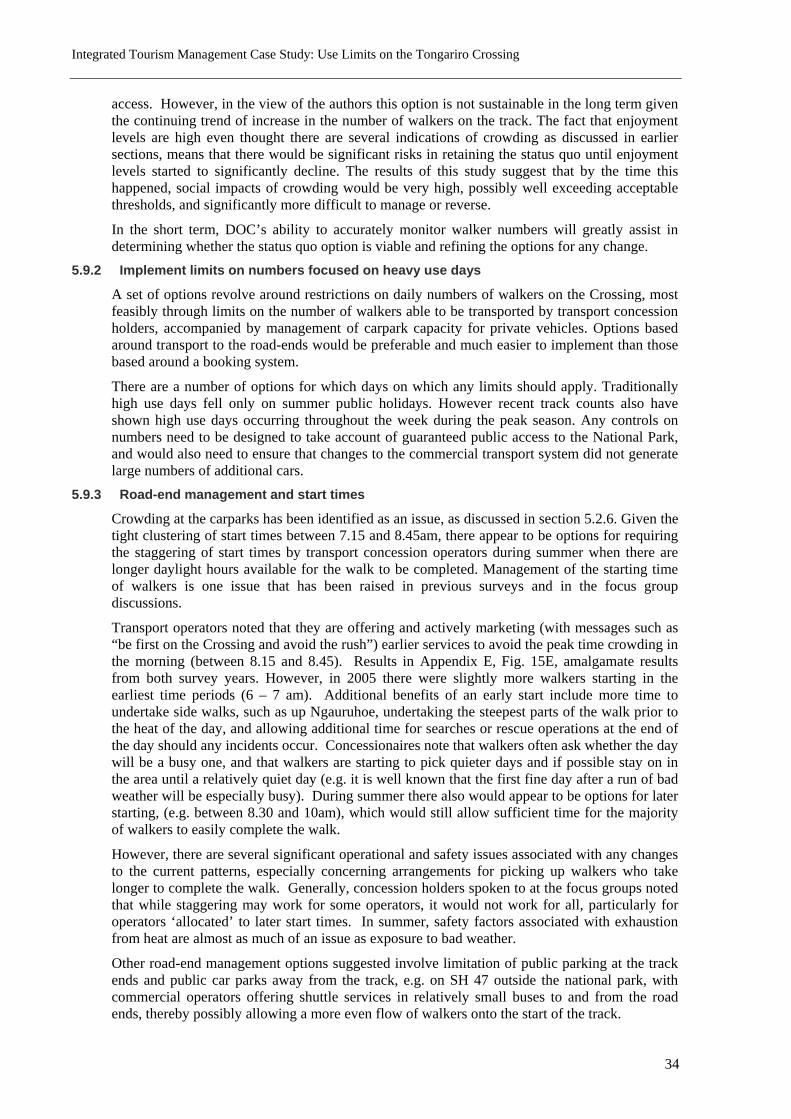
Integrated Tourism Management Case Study: Use Limits on the Tongariro Crossing
34
access. However, in the view of the authors this option is not sustainable in the long term given the continuing trend of increase in the number of walkers on the track. The fact that enjoyment levels are high even thought there are several indications of crowding as discussed in earlier sections, means that there would be significant risks in retaining the status quo until enjoyment levels started to significantly decline. The results of this study suggest that by the time this happened, social impacts of crowding would be very high, possibly well exceeding acceptable thresholds, and significantly more difficult to manage or reverse.
In the short term, DOC’s ability to accurately monitor walker numbers will greatly assist in determining whether the status quo option is viable and refining the options for any change.
5.9.2 Implement limits on numbers focused on heavy use days
A set of options revolve around restrictions on daily numbers of walkers on the Crossing, most feasibly through limits on the number of walkers able to be transported by transport concession holders, accompanied by management of carpark capacity for private vehicles. Options based around transport to the road-ends would be preferable and much easier to implement than those based around a booking system.
There are a number of options for which days on which any limits should apply. Traditionally high use days fell only on summer public holidays. However recent track counts also have shown high use days occurring throughout the week during the peak season. Any controls on numbers need to be designed to take account of guaranteed public access to the National Park, and would also need to ensure that changes to the commercial transport system did not generate large numbers of additional cars.
5.9.3 Road-end management and start times
Crowding at the carparks has been identified as an issue, as discussed in section 5.2.6. Given the tight clustering of start times between 7.15 and 8.45am, there appear to be options for requiring the staggering of start times by transport concession operators during summer when there are longer daylight hours available for the walk to be completed. Management of the starting time of walkers is one issue that has been raised in previous surveys and in the focus group discussions.
Transport operators noted that they are offering and actively marketing (with messages such as “be first on the Crossing and avoid the rush”) earlier services to avoid the peak time crowding in the morning (between 8.15 and 8.45). Results in Appendix E, Fig. 15E, amalgamate results from both survey years. However, in 2005 there were slightly more walkers starting in the earliest time periods (6 – 7 am). Additional benefits of an early start include more time to undertake side walks, such as up Ngauruhoe, undertaking the steepest parts of the walk prior to the heat of the day, and allowing additional time for searches or rescue operations at the end of the day should any incidents occur. Concessionaires note that walkers often ask whether the day will be a busy one, and that walkers are starting to pick quieter days and if possible stay on in the area until a relatively quiet day (e.g. it is well known that the first fine day after a run of bad weather will be especially busy). During summer there also would appear to be options for later starting, (e.g. between 8.30 and 10am), which would still allow sufficient time for the majority of walkers to easily complete the walk.
However, there are several significant operational and safety issues associated with any changes to the current patterns, especially concerning arrangements for picking up walkers who take longer to complete the walk. Generally, concession holders spoken to at the focus groups noted that while staggering may work for some operators, it would not work for all, particularly for operators ‘allocated’ to later start times. In summer, safety factors associated with exhaustion from heat are almost as much of an issue as exposure to bad weather.
Other road-end management options suggested involve limitation of public parking at the track ends and public car parks away from the track, e.g. on SH 47 outside the national park, with commercial operators offering shuttle services in relatively small buses to and from the road ends, thereby possibly allowing a more even flow of walkers onto the start of the track.
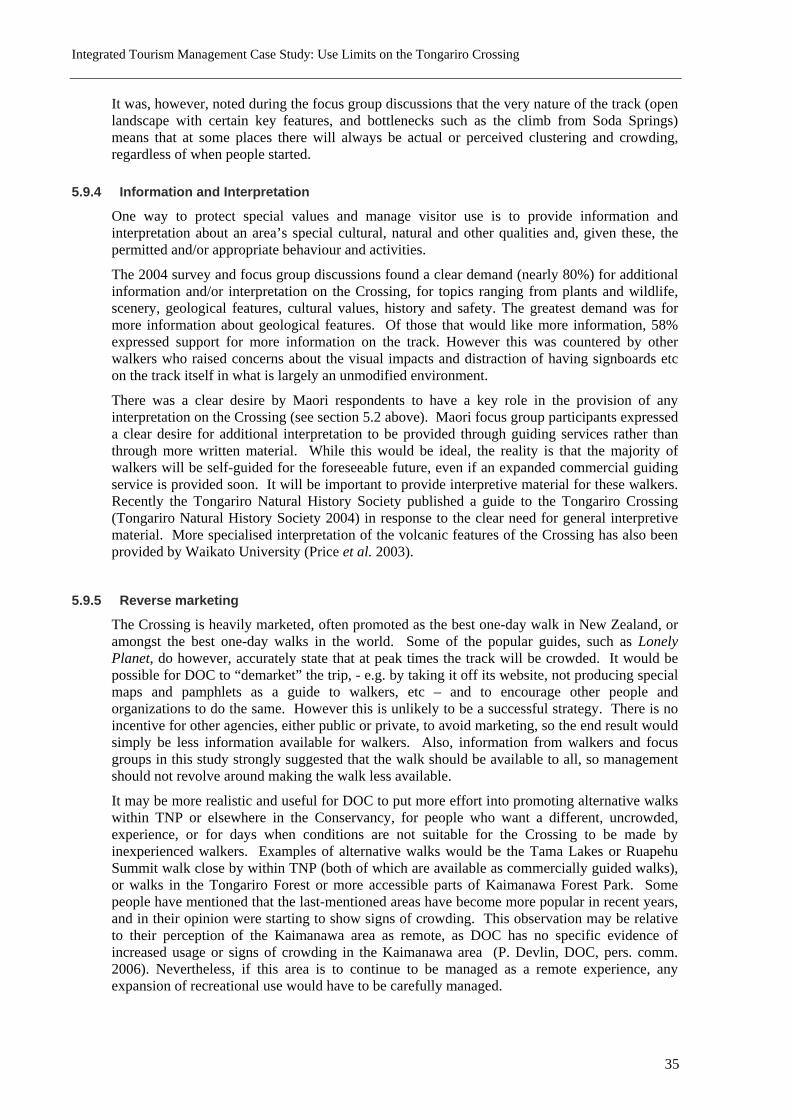
Integrated Tourism Management Case Study: Use Limits on the Tongariro Crossing
35
It was, however, noted during the focus group discussions that the very nature of the track (open landscape with certain key features, and bottlenecks such as the climb from Soda Springs) means that at some places there will always be actual or perceived clustering and crowding, regardless of when people started.
5.9.4 Information and Interpretation
One way to protect special values and manage visitor use is to provide information and interpretation about an area’s special cultural, natural and other qualities and, given these, the permitted and/or appropriate behaviour and activities.
The 2004 survey and focus group discussions found a clear demand (nearly 80%) for additional information and/or interpretation on the Crossing, for topics ranging from plants and wildlife, scenery, geological features, cultural values, history and safety. The greatest demand was for more information about geological features. Of those that would like more information, 58% expressed support for more information on the track. However this was countered by other walkers who raised concerns about the visual impacts and distraction of having signboards etc on the track itself in what is largely an unmodified environment.
There was a clear desire by Maori respondents to have a key role in the provision of any interpretation on the Crossing (see section 5.2 above). Maori focus group participants expressed a clear desire for additional interpretation to be provided through guiding services rather than through more written material. While this would be ideal, the reality is that the majority of walkers will be self-guided for the foreseeable future, even if an expanded commercial guiding service is provided soon. It will be important to provide interpretive material for these walkers. Recently the Tongariro Natural History Society published a guide to the Tongariro Crossing (Tongariro Natural History Society 2004) in response to the clear need for general interpretive material. More specialised interpretation of the volcanic features of the Crossing has also been provided by Waikato University (Price et al. 2003).
5.9.5 Reverse marketing
The Crossing is heavily marketed, often promoted as the best one-day walk in New Zealand, or amongst the best one-day walks in the world. Some of the popular guides, such as Lonely Planet, do however, accurately state that at peak times the track will be crowded. It would be possible for DOC to “demarket” the trip, - e.g. by taking it off its website, not producing special maps and pamphlets as a guide to walkers, etc – and to encourage other people and organizations to do the same. However this is unlikely to be a successful strategy. There is no incentive for other agencies, either public or private, to avoid marketing, so the end result would simply be less information available for walkers. Also, information from walkers and focus groups in this study strongly suggested that the walk should be available to all, so management should not revolve around making the walk less available.
It may be more realistic and useful for DOC to put more effort into promoting alternative walks within TNP or elsewhere in the Conservancy, for people who want a different, uncrowded, experience, or for days when conditions are not suitable for the Crossing to be made by inexperienced walkers. Examples of alternative walks would be the Tama Lakes or Ruapehu Summit walk close by within TNP (both of which are available as commercially guided walks), or walks in the Tongariro Forest or more accessible parts of Kaimanawa Forest Park. Some people have mentioned that the last-mentioned areas have become more popular in recent years, and in their opinion were starting to show signs of crowding. This observation may be relative to their perception of the Kaimanawa area as remote, as DOC has no specific evidence of increased usage or signs of crowding in the Kaimanawa area (P. Devlin, DOC, pers. comm. 2006). Nevertheless, if this area is to continue to be managed as a remote experience, any expansion of recreational use would have to be carefully managed.
Integrated Tourism Management Case Study: Use Limits on the Tongariro Crossing
36
5.9.6 Comments on management options
It was not an aim of this study to make recommendations on management options. However if a management tool is chosen, then authors believe that options involving the total number of daily walkers address integrated management better than density management (road end and starting times). If numbers of walkers are high, then clustering will occur in some places regardless of how starting times are staggered. In addition, focussing on total numbers addresses physical and cultural issues to some extent. Better information and interpretation, including information on cultural values, should be provided regardless of which other option is chosen.
Many of the management issues for the Crossing come down to the difficulties for DOC of maintaining a walking route in a back-country environment which carries large numbers of walkers, more than would normally be expected in such a setting. The ROS classification of the route as a “back-country walk-in” route, rather than “remote”, is realistic. The difficulty is maintaining the quality of the experience for a much larger number of walkers than would normally be expected for a “back-country walk-in” route. It is questionable whether many of the Crossing walkers would fit into the typical profile of the “back-country adventurer” type, but this is a consequence of the unique qualities of the walk and the success of its marketing. It would not be fair to discourage potential walkers of the Crossing because they do not fit the typical profile for such a walk. DOC’s challenge is to match the quality of walkers’ experience with the values of the Crossing, to ensure that the information walkers receive about the Crossing before and during their walk is accurate, and to provide opportunities through interpretation for walkers to learn more about the Crossing and thereby enhance their experience.
Pricing options (i.e. charging for access as a method of controlling demand) have not been included in this summary, even though they have been suggested from time to time (including by a number of track walkers). Charging for access to any part of national park is contrary to New Zealand law and policy and therefore pricing methods do not appear to be feasible options. Even if permitted, charging options may not greatly affect overall use, but only be a disincentive for less well-off national park visitors.
A key management issue is that of adequate capacity to develop and implement any options for changed management. Capacity-building is an issue for both agencies and stakeholders. The principal pre-requisite for increased capacity is for better understanding of all aspects of the issues described in this case study. A further specific requirement is the ability to accurately monitor visitor numbers and other impacts of walkers on the Tongariro Crossing.
Integrated Tourism Management Case Study: Use Limits on the Tongariro Crossing
37
6 Conclusion
6.1 Lessons from the integrated approach
Based on the above, the authors believe application of elements of the LAC methodology appears to have successfully showed the existence of thresholds of acceptable change for the Crossing experience (see below). As noted in section 5.2.1, at more than about 350 walkers/day there was a threshold of perception towards “less positive” perceptions and experiences, while at more than about 550 walkers/day there was a threshold towards “more negative” perceptions and experiences. In short, the number of walkers on the track appeared to have a significant impact on perception, expectation and detraction from enjoyment.
The survey analysis suggested there are a number of factors that contribute toward crowding perceptions and enjoyment. These include:
• Number of walkers on track: As discussed above, there appear to be a significant relationship between total number of walkers on the track on the day of the walk and walkers’ perceptions of crowding, expectations and enjoyment.
• Weather: Weather did not appear to impact on walkers’ overall perceptions of crowding. However, it did appear to impact on walker’s enjoyment in terms of whether the number of people seen detracted from their enjoyment of the walk.
• Starting times: There is a very pronounced peak in daily starting time for the walk. More than 71% of all walkers start the walk in the 90 minutes between 7.15 and 8.45 am. People starting during this “peak time” were more likely to perceive more walkers than they expected, and “peak time” walkers were also more likely than walkers starting at other times to feel that the number of people they saw detracted from their overall enjoyment (38% compared with 23%).
• Nationality: Responses to questions about crowding and experiences varied slightly between different groups of nationalities.
• Factors contributing to people’s sense of crowding: When walkers were asked what contributed to any sense of crowding, the main contributing factor was the overall number of people seen, followed by whether people were clustered. Group size, walkers’ behaviour or attitudes, and physical features of the track were not perceived as determining factors. Particular areas of the track were perceived as more crowded than others.
6.2 What has the Limits of Acceptable Change methodology brought to this case study?
The principal contribution that the Limits of Acceptable Change methodology has made to this case study is that it has provided robust evidence that social thresholds to acceptable use on the Crossing do exist. The study has found significant differences between walkers’ experiences depending on the total number of walkers on the track, and there are also differences between some groups of walkers. These thresholds appear to be best expressed as broad bands of total daily numbers of walkers. The social thresholds primarily suggested by the walker survey appear to be well backed up by focus group discussions and other interviews with stakeholders and managers.
The number thresholds suggested in this study could undoubtedly be improved by further surveys focusing on gaps in coverage in this survey. For example, further survey work could be conducted in selected foreign languages (especially Asian) in order to get better coverage of non-English speaking walkers. This further research could involve surveys of walkers after they have left the Ketetahi carpark, in order to test for the possibility that walkers have over-assessed their overall enjoyment the walk. That is, they might be in some euphoria of their immediate successful completion of the walk. Conducting the survey in the lounges of some of the popular
Integrated Tourism Management Case Study: Use Limits on the Tongariro Crossing
38
walkers’ accommodation places would be a logical way of testing this possibility. However, if overall enjoyment turns out to be lower than reported in this study, this would only reinforce the conclusions about limits of use being reached.
This study has also discussed other cultural and physical factors relevant to use limits on the Crossing. These factors have principally been studied through focus group discussions and interviews. It has not been easy to integrate these other factors empirically with the social factors; however, their implications are consistent with conclusions regarding social limits. Several other New Zealand studies have concluded that social impacts are usually the most acute in determining use limits in New Zealand conditions currently (PCE 1998).
This case study has not considered economic aspects of integrated management in detail, beyond an awareness of the economic importance of the Crossing to the regional economy. Any management option would have economic implications, particularly options limiting the number of walkers able to undertake the Crossing. It should not, however, be assumed that the implications would be negative, particularly in the longer term. Indeed it could well be argued that a status quo approach, if it led to a significant decrease in walkers’ enjoyment, would have the most serious adverse effects not only on the sustainability of the Crossing experience, but also on its economic contribution.
6.3 Conclusions
• The Tongariro Crossing has a unique set of very high natural, cultural and other values and presents unique scenic, natural and cultural experiences for a large and varied group of visitors.
• The Crossing route attracts about 60 000 walkers annually. Use of the Crossing has increased significantly over the last decade and is likely to continue to increase over at least the short to medium term.
• International travellers from Europe are by far the largest group of walkers. New Zealanders comprise fewer than a quarter of the total number of walkers.
• Nearly 90% of Crossing walkers arrive at the start of the walk using a commercial bus service.
• The current scale of use of the Crossing is of considerable economic significance to the local economy.
• Many walkers experience some degree of crowding, and many walkers saw more walkers than they had expected.
• For most walkers, any feelings of crowding do not detract from their enjoyment of the walk. Overall satisfaction levels with the experience are very high.
• For most of the key questions relating to social carrying capacity, responses were significantly affected by the number of walkers on the Crossing on the day of the walk.
• There are indications of thresholds in walkers’ experiences at about 350 and 550 walkers/day.
• At more than 350 walkers/day, trends of acceptability and enjoyment change. More walkers found the Crossing more crowded than they had expected, more said that the number of walkers detracted from their enjoyment, and more said that they would prefer to see fewer walkers on the Crossing than they had seen on that day.
• At more than 550 walkers/day, there is a significant increase in the number of walkers who found the track moderately or extremely crowded.
Integrated Tourism Management Case Study: Use Limits on the Tongariro Crossing
39
• These thresholds vary between demographic groups and according to track and weather conditions, but not strongly.
• New Zealanders were much more likely than other nationalities to have found the Crossing more crowded than they had expected, and somewhat more likely to prefer to see fewer walkers.
• Walkers with little tramping experience were somewhat more likely to find the Crossing not crowded, and experienced trampers somewhat more likely to prefer to see fewer walkers.
• The mountains of Tongariro National Park, including the Crossing route, are of great spiritual and cultural significance to Maori. Tangata whenua desire to be involved in decisions on management of the Crossing and its interpretation to visitors.
• Management response to these results appears to be justified. It is unlikely that numbers of walkers on the Crossing will decrease in the short to medium term without intervention. There are several options for managing visitor numbers, demand, or time of departure.
• The total daily number of walkers is the most important indicator of social impacts on the Crossing.
• Portions of the track are formed on erodible unconsolidated volcanic materials. Some track erosion is inevitable in these portions. The scale of such erosion impacts does not seem to be a significant management issue at present but warrants ongoing monitoring.
• The absence of rubbish, including human waste, is also an important indicator and is crucial to the values of the national park. If unacceptable (very low) levels continue to be observed, then management intervention may be justified.
• Many walkers are not well provided with information and interpretation about the Crossing. Provision of further interpretive material is justified. Walkers also need to be made aware of the significant safety issues and risks involved in walking this alpine route.
• New Zealanders are no more well-informed about what to expect on the Crossing than most overseas walkers, and often less so.
• Successful implementation of any changes in management would require increased agency and stakeholder capacity. The principal pre-requisite for such capacity is a better integrated understanding of the issues involved in management of this important visitor destination.
• Ongoing information about and monitoring of visitors and visitor experiences is fundamental to all aspects of management.
Integrated Tourism Management Case Study: Use Limits on the Tongariro Crossing
40
References
Buckley, R., Pickering, C., Weaver, D.B. 2003. Nature based tourism, environment and land management. CABI Publishing, UK.
Cessford, G. 1997. Visitor satisfaction, impact perceptions and attitudes toward management options on the Tongariro Circuit Track. Science for Conservation: 65, Department of Conservation, Wellington
Cowan, J. 1927. The Tongariro National Park - Its topography, geology, alpine and volcanic features, history and Maori folk-lore. Ferguson & Osborn Ltd for The Tongariro National Park Board.
Department of Conservation. 1994. Conservation Management Strategy for Tongariro/Taupo 1995 – 2005, Volume 1. Department of Conservation, Turangi.
Department of Conservation. 2003. Draft Tongariro National Park Management Plan. Department of Conservation, NZ
Department of Conservation. 2004 Visitor Monitoring Plan for the Tongariro/Taupo Conservancy 2004 –2009. Department of Conservation, Turangi.
Elder, N. 1965. Tongariro National Park Handbook
Gibson, L. Visitor Perception of the Tongariro Crossing. Department of Conservation, Turangi.
Hall, C.M., Jenkins, J., Kearsley, G. 1997. Tourism Planning and Policy in Australia and New Zealand, Cases, Issue and Practice. McGraw-Hill Book Company
Newsome, D., Moore, S., Dowling, R. 2002. Natural Area Tourism. Ecology, Impacts and Management. Channel View Publications.
Newsome, D., Moore, S.M. and Dowling, R.K. 2002. Natural Area Tourism: Ecology, Impacts and Management. Aspects of Tourism, 4. Channel View Publications, Clevedon, UK
Olsen, D. 2001. Overnight Facility Use in the Tongariro Northern Circuit. M. Appl. Sc. Thesis, Massey University.
Parliamentary Commissioner for the Environment. 1997. Management of the environmental effects associated with the tourism sector in New Zealand. Office of the Parliamentary Commissioner for the Environment, Wellington.
Price, R, Hobden, B., Smith, R., Briggs, R., Gleadow, A. and Kunz, P. 2003. Volcanogy of the Tongariro Crossing, a virtual field trip (CD ROM). University of Waikato, Hamilton.
Stankey, G., D., Cole, R., Lucas, M., Peterson, S., Frissel and Washbourne, R. 1985. Limits of Acceptable Change (LAC) System for Wilderness Planning. General Technical Report INT-176. Ogden, Ut.: Intermountain Forest and Range Experiment Station, U.S. Department of Agriculture Forest Service. US
Tongariro Natural History Society 2004. The Tongariro Crossing, an amazing journey. Tongariro Natural History Society 2004, Turangi.
Tyson, B. 1989. Limits of Acceptable Change (LAC) - An evaluation of the concept for introduction as a Department of Conservation resource planning technique. Department of Conservation, NZ
Warren, J., Pihema, W., Taylor, N., Gough, J., Blaschke, P., Baily, M. 2003. Recognising, Planning For And Managing Limits To Tourism Development In Natural Areas. Proceedings “Taking Tourism to the Limits” conference, Waikato University.

Integrated Tourism Management Case Study: Use Limits on the Tongariro Crossing
41
Wouters, M. (in prep). The socio-economic impacts of tourism concessions. Department of Conservation, Wellington.
Wray, K., Harbrow, M., and Kazmierow, B. 2005. Planning for visitor management at Mason Bay (Rakiura National Park, Stewart Island). DOC Research & Development Series 222. Science and Technology Publishing, Department of Conservation, NZ
Integrated Tourism Management Case Study: Use Limits on the Tongariro Crossing
42
Acknowledgments
Many people have assisted in this study. First we thank all walkers who agreed to be surveyed, and all focus group participants from local communities and businesses, Ngati Hikairo ki Tongariro, Tararua Tramping Club, Tongariro Natural History Society, and Onslow College (Wellington).
We had significant support and information from staff in the Department of Conservation, particularly: Paul Green, Sean Goddard, Bhrent Guy, Mark Davies, Peter Devlin, Derek Thompson, Harry Keys, Jim Maniapoto, Jimmy Johnson (Tongariro/Taupo Conservancy); and Steve Sutton, Mariska Wouters and Bronek Kazmierow (Head Office).
We thank the Tongariro/Taupo Conservation Board for their continued interest, staff of the Turangi Visitor centre and Bayview Chateau Tongariro, and Hugh Barr, Greg Carlyon, Pete Masters, Dave Mazey, Les Molloy, Vince Neall and Bubs Smith, for local information and assistance.
We thank staff of CRESA, especially Julie Warren, Luke Proctor and Sam Mortlock, and staff of Boffa Miskell Ltd, Wellington, for their interest and assistance, especially with data analysis and review of the draft report.
Integrated Tourism Management Case Study: Use Limits on the Tongariro Crossing
43
Appendix A - National Park setting
(Material sourced principally from DOC 2003)
Status
Tongariro National Park (TNP) is the oldest national park in New Zealand, originating with a gift by Ngati Tuwharetoa paramount chief Te Heuheu Tukino IV in 1887, of about 2400ha at the summits of Mounts Ruapehu, Ngauruhoe and Tongariro. From this nucleus, the park has grown in size to encompass an area of 79,598 hectares. It is also one of only three UNESCO designated World Heritage Areas (WHA) in New Zealand, the only one to coincide exactly with one national park and the only one (and one of a only a handful around the world) to have a dual natural and cultural WHA status. The park’s diverse ecological communities and outstanding scenic landscapes, along with its accessibility, contribute to making the park a significant visitor attraction.
At less than 800km2, TNP is one of New Zealand’s smallest natural parks but attracts the highest total number of visitors. Of the 1 million annual visitors to the national park, about 400,000 visit the skifields, (although this total fluctuates considerably from year to year according to skifield conditions). In recent years the number of people doing short walks and day trips has increased greatly and the 300,000 visitors to the Park Headquarters at Whakapapa village in 2002 was an increase of 30% over the 2001 figure. The ratio between skiers and other visitors was about 60:40 in the last few decades but has recently shifted to about 50:50, but the number of overnight visitors has been fairly stable for the last few years.
Geography
The popularity of TNP is largely attributable to its dramatic and unique volcanic landscape. This volcanic landscape is some of the worlds most active and violent volcanism, forming part of the “Pacific Ring of Fire”. The volcanoes themselves are active, especially Ruapehu, erupting on average every 1-3 years, producing hazardous eruptions every 7-10 years and major eruptions every 20-50 years. The most recent major eruptions in 1995-96 caused significant changes in the crater area and Whangaehu Valley. Ngauruhoe last erupted in 1975 and Tongariro in 1896.
The topography is typical of volcanic regions. Most of the area comprises mountain slopes which radiate from one of the three main mountains. The mountain slopes are typically gentle near the park boundaries but become progressively steeper toward the summits. Soils are generally strongly or moderately leached coarse soils developed from variable covers of recent andesitic ash, lahar debris, Taupo pumice and older brown silty andesitic soils.
Ngauruhoe, the youngest of the park’s volcanoes, shows the most regular form and the steeper slopes, with Ruapehu and Tongariro being older and more eroded.
Mount Tongariro rises to an altitude of 1968 metres. It is a complex, multiple volcano formed from numerous overlapping and coalescing vents. Some areas have been heavily glaciated forming deeply dissected centres but are now partially buried by younger substantially intact volcanic cones and modified by explosions. The South Crater, although called a crater, is actually thought to have formed from ice erosion.
A geothermal field, Ketetahi, exists under the northern and central areas of Mount Tongariro. This field has surface fumerolic features and ‘springs’ that surface at Ketetahi. The immediate area of the springs, which are believed to have healing powers, have been retained in Maori ownership. Some vents at the springs produce steam up to 138ºC, while other release hot gas charged water. The hydrothermal deposits and acidic, sulphate-rich water from the springs are
Integrated Tourism Management Case Study: Use Limits on the Tongariro Crossing
44
covered with red and blue-green heat tolerant algae. Two other smaller geothermal surface manifestations are present on Mount Tongariro. They are Red Crater and Te Maari Crater.
The climate within the park is that of a cold climate with considerable local variation, given the altitude variation between 600 to 2797 metres. Precipitation within the park varies from about 1250mm per year in the south and east, to about 5000mm on the summit slopes of Mount Ruapehu. Heavy rain can be expected at any time of the year and there is no significant difference between summer and winter precipitation levels. The prevailing westerly wind pattern and mountain topography produce a small rain shadow and reduce cloudiness in their lee (Tongariro National Park Management Plan Draft 2003).
Flora and fauna
Tongariro National Park is contained wholly within the Tongariro Ecological Region and demonstrates the dramatic contrast of forest, tussock grassland and gravelfields, and volcanic and glacial environments. A major feature of the vegetation is its diversity, due to the wide altitudinal range and landform diversity and the interaction of climatic and volcanic elements (Tongariro National Park Management Plan Draft 2003). Such diversity includes alpine herbs, flax, tussock, dense shrubs, and forest.
Over 550 species of native plants are found in the park and at least 80% of these are endemic to New Zealand. The diversity of natural vegetation reflects the wide range of climatic influences and the history of volcanism. Much of the central area of the park is low vegetation comprising tussock or woody shrubs and flax and is undergoing regeneration after disturbance. The Taupo pumice eruption of about AD 130 is known to have destroyed all forest in the northern and eastern sectors of the park. Other non-forested areas of the park, including the upper slopes of all the volcanoes and the eastern slopes of Ruapehu (Rangipo Desert), are areas where the climate is too harsh and the soil is inadequate to support the growth of forest. These areas, although sparsely vegetated, contain some of the most interesting plants and plant communities.
The Tongariro Crossing itself features a range of vegetation types. At Mangatepopo saddle, the porous surface of new lava, its blacker colour absorbing much of the sun’s heat, is a harsh environment for plants. Simple colonising mosses and lichens are the first to establish followed years later by successively larger plants each taking advantage of the slow build up of precious soil. This succession of plant communities is evident on the lava flows of varying ages that have flowed from the crater of Ngauruhoe. Soda springs are an oasis for the moisture-loving yellow buttercups and white foxgloves. Below Ketetahi Hut the track passes through tussock, which then changes to cool podocarp-hardwood forest. Much of the park is clothed in tall beech forest or podocarp forest (at lower altitudes). Weeds are a problem. In particular, the exotic heather (Calluna vulgaris) and wilding lodgepole pines (Pinus contorta) are a cause of ongoing concern.
Tongariro is home to many distinctive native animals including New Zealand's only native mammals, the short and long tailed bats. Birds include North Island robins, fantails, parakeets and even a kereru (native pigeon) or two. Smaller, but no less interesting are the numerous insects that live in the park.
Cultural values
To tangata whenua (people of the land) the mountains are a vital part of their history, their whakapapa (genealogy) and legends are venerated accordingly. It is said that their ancestor, Ngatoroirangi (the navigator and tohunga of the waka Arawa) was close to death after exploring this mountainous region. He called out to his sisters from his Pacific homeland, Hawaiiki, to send him fire. The fire came but its passage left a trail of volcanic vents, from Tongatapu, through Whakaari (White Island), Rotorua and Tokaanu, before reaching Ngatoroirangi on the slopes of Tongariro. The park plays an important cultural role in the traditions of the Maori in that it is of outstanding cultural importance as a spiritual home to the Maori people and the gifting of this scared land, providing the initial focus for the creation of the New Zealand’s national parks system, is of significance to the country as a whole.
Integrated Tourism Management Case Study: Use Limits on the Tongariro Crossing
45
Tongariro, Ngauruhoe and Ruapehu are mounts sacred to the Maori, especially the Tuwharetoa and Ngati Rangi peoples who have lived beneath them for many years. The mountains are recalled in ancient tribal stories as great forces in a universe where everything is live. They are seen as Atua, as places of spiritual forces which command and give life to the natural world, and whose wild and capricious actions can create and destroy on a huge scale. Accordingly they are regarded with respect and humility as well as with awe.
History of recreational use
Tongariro National Park receives about 1 million visitors annually and is a major tourist attraction, offering a range of outdoor recreation opportunities including skiing, ski mountaineering, tramping, climbing, nature study, photography and hunting. Skiing are the majority activity group with their activities focused on the two main fields of Whakapapa and Turoa. The main visitor seasons are from July to late October (ski season) and mid December to mid February (summer vacation period). Numbers decline in autumn and late spring.
To the Maori, the volcanoes of Tongariro, Ruapehu and Ngauruhoe were tapu (sacred) and they sought to prevent anybody from climbing them. Europeans were discouraged from the area. The first European to scale Mount Ngauruhoe was John Bidwill in 1839. For the next 12 years, the local tribe was successful in preventing further assents. But in 1851, one of the peaks of Mount Ruapehu was ascended, and in 1879 the first Europeans scaled Mount Ruapehu and saw Crater Lake.
Following the gifting of the peaks to the crown in 1887 and formation of the National Park in 1894, the development of the park was slow. The Department of Tourist and Health Resorts built huts at Ketetahi and Waihohonu in circa 1904 and from then on the park was visited more frequently. Earliest use of the park was concentrated on this east side but after completion of the main trunk railway on the west side in 1908, tourist use of Waihohonu decreased. The biggest impact on the park was the arrival of recreational skiing in 1913 (Conservation Management Strategy, DOC 1994). Propelled by post-world-war prosperity, lifts, ski huts and other structures mushroomed across the mountain in the 1950’s and 1960’s.
While walkers have walked the route of the Tongariro Crossing for a number of years as part of the Tongariro Circuit, it is only relatively recently (i.e. since the mid 1990’s) that the tramp has become popular and recognised in its own right.
Parts of the Crossing have been in existence since the early 1900’s and have been tramped as parts of other walks. The 1927 National Park Handbook (Cowan 1927) makes reference to Mangatepopo Hut being the most convenient place for the assent of Tongariro and Ngauruhoe. A track along the west side of Ngauruhoe connects this camp with that of Whakapapa. Suggested walks in the handbook do not show the walk now known as the “Tongariro Crossing”. However, reference is made to parts of the Crossing. These include the one day “expedition” from Waihohonu Hut to Tongariro, Ketetahi and Papakai. This walk follows an old horse track through the Outere Crater, along the south eastern slopes of Tongariro, descending to Ketetahi Hot springs. The track from Blue Lake to Ketetahi was created in 1901. Below the springs is the small Ketetahi Hut, built around 1901. The route at this point followed a formed bridle track to Papakai Pa. This route differs from the existing track from Ketetahi Hut to the Ketetahi Hut road end.
The 1965 Tongariro National Park handbook makes reference to the tramp from SH47 to Mangatepopo. This route appears to coincide with the existing Tongariro Crossing route. A focus group member recalls trampling the Crossing route during New Year 1952 (and seeing no one else on the route). It is understood thought that Ketetahi Hut was first built in 1901.
The Crossing became more popular in the mid to late 1990’s following active marketing by certain operators in the area. This was following the 1995-1996 Mount Ruapehu eruptions which devastated the following ski seasons.
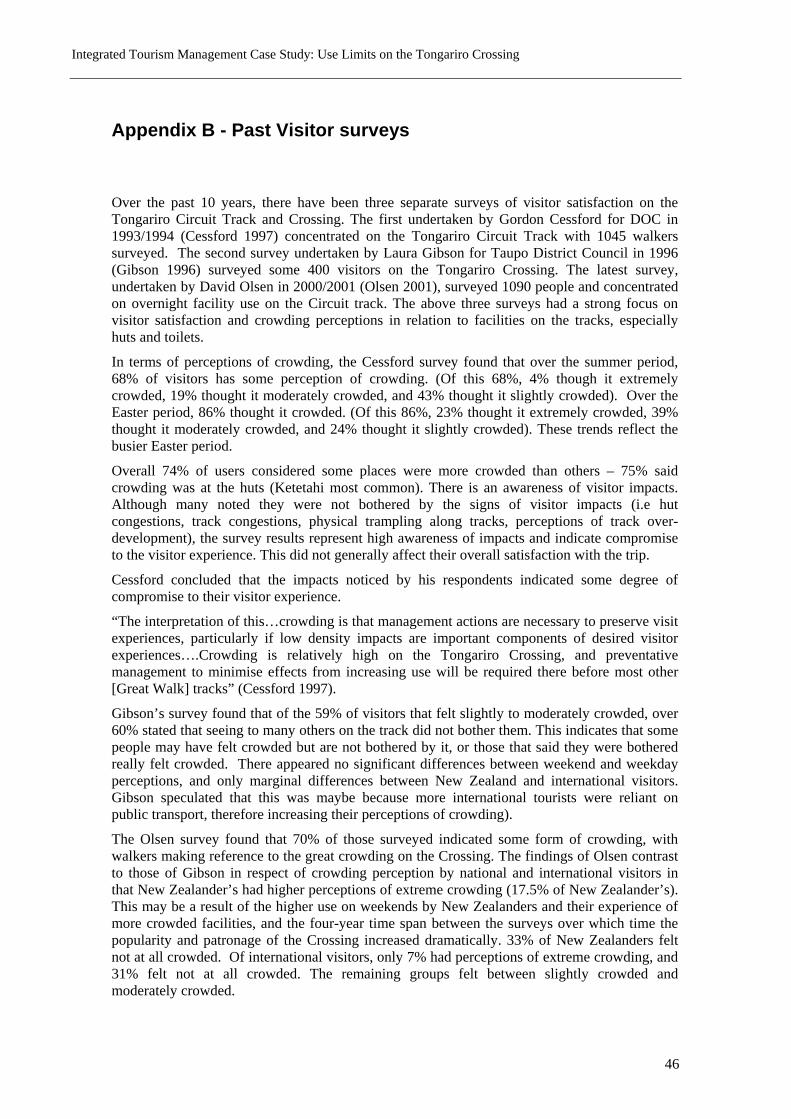
Integrated Tourism Management Case Study: Use Limits on the Tongariro Crossing
46
Appendix B - Past Visitor surveys
Over the past 10 years, there have been three separate surveys of visitor satisfaction on the Tongariro Circuit Track and Crossing. The first undertaken by Gordon Cessford for DOC in 1993/1994 (Cessford 1997) concentrated on the Tongariro Circuit Track with 1045 walkers surveyed. The second survey undertaken by Laura Gibson for Taupo District Council in 1996 (Gibson 1996) surveyed some 400 visitors on the Tongariro Crossing. The latest survey, undertaken by David Olsen in 2000/2001 (Olsen 2001), surveyed 1090 people and concentrated on overnight facility use on the Circuit track. The above three surveys had a strong focus on visitor satisfaction and crowding perceptions in relation to facilities on the tracks, especially huts and toilets.
In terms of perceptions of crowding, the Cessford survey found that over the summer period, 68% of visitors has some perception of crowding. (Of this 68%, 4% though it extremely crowded, 19% thought it moderately crowded, and 43% thought it slightly crowded). Over the Easter period, 86% thought it crowded. (Of this 86%, 23% thought it extremely crowded, 39% thought it moderately crowded, and 24% thought it slightly crowded). These trends reflect the busier Easter period.
Overall 74% of users considered some places were more crowded than others – 75% said crowding was at the huts (Ketetahi most common). There is an awareness of visitor impacts. Although many noted they were not bothered by the signs of visitor impacts (i.e hut congestions, track congestions, physical trampling along tracks, perceptions of track over-development), the survey results represent high awareness of impacts and indicate compromise to the visitor experience. This did not generally affect their overall satisfaction with the trip.
Cessford concluded that the impacts noticed by his respondents indicated some degree of compromise to their visitor experience.
“The interpretation of this…crowding is that management actions are necessary to preserve visit experiences, particularly if low density impacts are important components of desired visitor experiences….Crowding is relatively high on the Tongariro Crossing, and preventative management to minimise effects from increasing use will be required there before most other [Great Walk] tracks” (Cessford 1997).
Gibson’s survey found that of the 59% of visitors that felt slightly to moderately crowded, over 60% stated that seeing to many others on the track did not bother them. This indicates that some people may have felt crowded but are not bothered by it, or those that said they were bothered really felt crowded. There appeared no significant differences between weekend and weekday perceptions, and only marginal differences between New Zealand and international visitors. Gibson speculated that this was maybe because more international tourists were reliant on public transport, therefore increasing their perceptions of crowding).
The Olsen survey found that 70% of those surveyed indicated some form of crowding, with walkers making reference to the great crowding on the Crossing. The findings of Olsen contrast to those of Gibson in respect of crowding perception by national and international visitors in that New Zealander’s had higher perceptions of extreme crowding (17.5% of New Zealander’s). This may be a result of the higher use on weekends by New Zealanders and their experience of more crowded facilities, and the four-year time span between the surveys over which time the popularity and patronage of the Crossing increased dramatically. 33% of New Zealanders felt not at all crowded. Of international visitors, only 7% had perceptions of extreme crowding, and 31% felt not at all crowded. The remaining groups felt between slightly crowded and moderately crowded.
Integrated Tourism Management Case Study: Use Limits on the Tongariro Crossing
47
It should be noted that the Olsen and Cessford surveys concentrated on the Tongariro Circuit and facility use. It should also be noted that the reports and research were conducted some three to four years apart and the use of the Tongariro Crossing has changed significantly in this time with patronage of the Crossing increasing markedly in the past 10 years (since the mid 1990’s).
All the surveys found the majority of walkers experienced some element of crowding. Given the time span between the surveys, this may very well indicate that the perception of crowding relates to the amount of people they have seen on that particular day. Furthermore, given the very open nature of the walk itself, it may be that some form of crowding perception is inevitable.
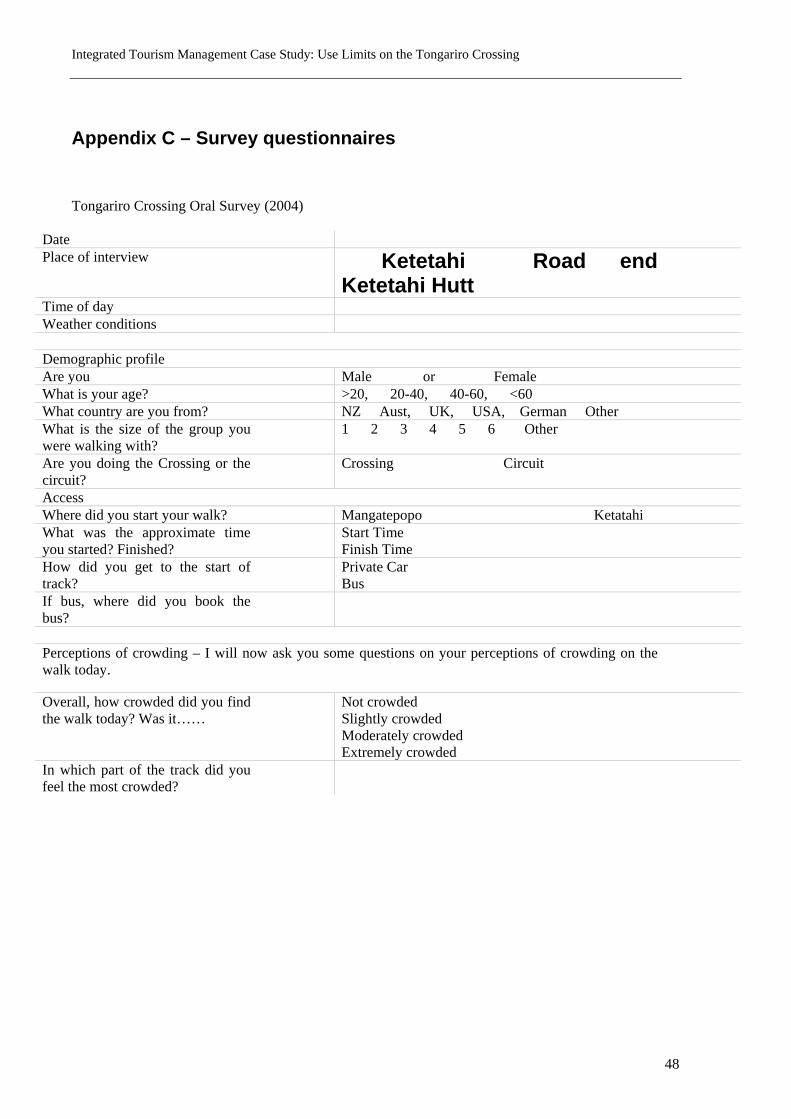
Integrated Tourism Management Case Study: Use Limits on the Tongariro Crossing
48
Appendix C – Survey questionnaires
Tongariro Crossing Oral Survey (2004)
Date Place of interview Ketetahi Road end
Ketetahi Hutt Time of day Weather conditions Demographic profile Are you Male or Female What is your age? >20, 20-40, 40-60, <60 What country are you from? NZ Aust, UK, USA, German Other What is the size of the group you were walking with?
1 2 3 4 5 6 Other
Are you doing the Crossing or the circuit?
Crossing Circuit
Access Where did you start your walk? Mangatepopo Ketatahi What was the approximate time you started? Finished?
Start Time Finish Time
How did you get to the start of track?
Private Car Bus
If bus, where did you book the bus?
Perceptions of crowding – I will now ask you some questions on your perceptions of crowding on the walk today.
Overall, how crowded did you find the walk today? Was it……
Not crowded Slightly crowded Moderately crowded Extremely crowded
In which part of the track did you feel the most crowded?
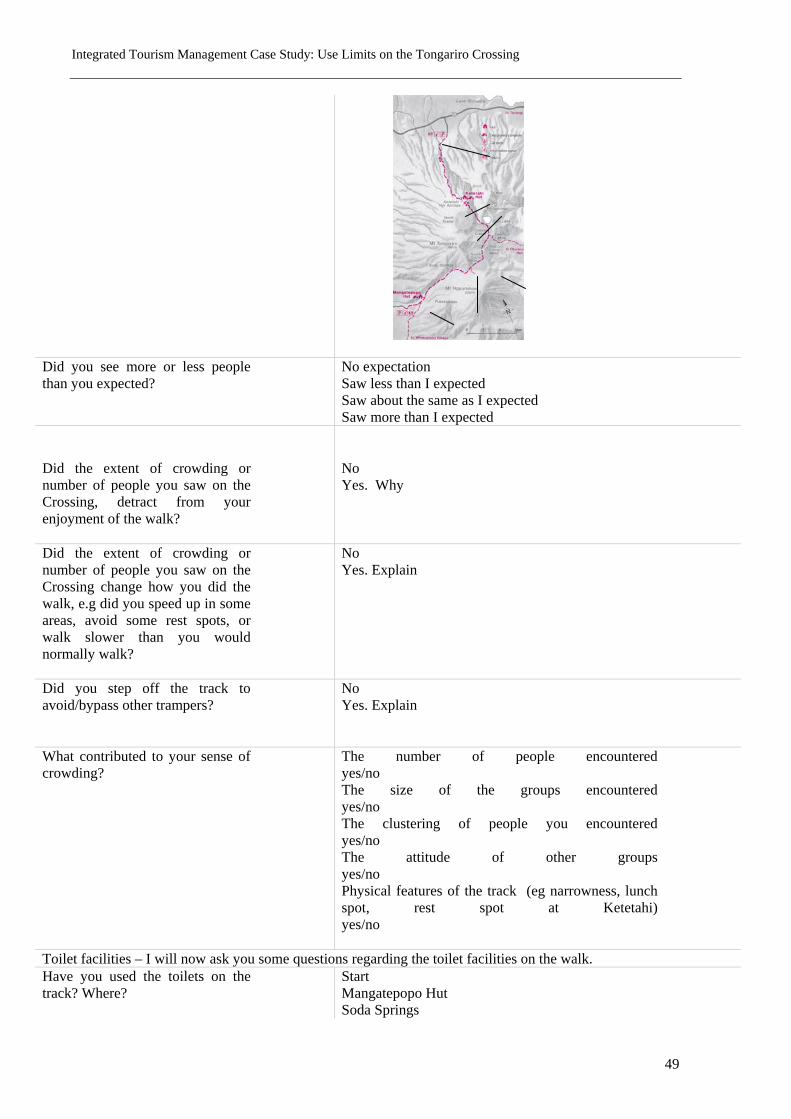
Integrated Tourism Management Case Study: Use Limits on the Tongariro Crossing
49
Did you see more or less people than you expected?
No expectation Saw less than I expected Saw about the same as I expected Saw more than I expected
Did the extent of crowding or number of people you saw on the Crossing, detract from your enjoyment of the walk?
No Yes. Why
Did the extent of crowding or number of people you saw on the Crossing change how you did the walk, e.g did you speed up in some areas, avoid some rest spots, or walk slower than you would normally walk?
No Yes. Explain
Did you step off the track to avoid/bypass other trampers?
No Yes. Explain
What contributed to your sense of crowding?
The number of people encountered yes/no The size of the groups encountered yes/no The clustering of people you encountered yes/no The attitude of other groups yes/no Physical features of the track (eg narrowness, lunch spot, rest spot at Ketetahi) yes/no
Toilet facilities – I will now ask you some questions regarding the toilet facilities on the walk. Have you used the toilets on the track? Where?
Start Mangatepopo Hut Soda Springs
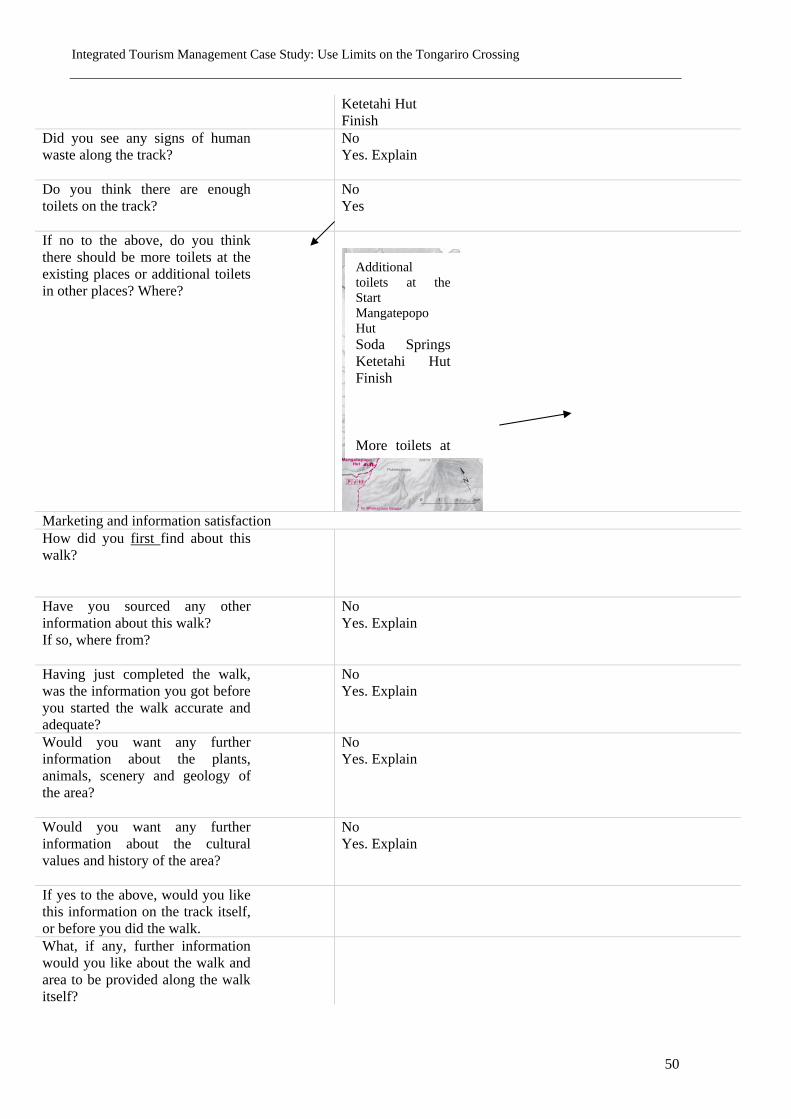
Integrated Tourism Management Case Study: Use Limits on the Tongariro Crossing
50
Ketetahi Hut Finish
Did you see any signs of human waste along the track?
No Yes. Explain
Do you think there are enough toilets on the track?
No Yes
If no to the above, do you think there should be more toilets at the existing places or additional toilets in other places? Where?
Marketing and information satisfaction How did you first find about this walk?
Have you sourced any other information about this walk? If so, where from?
No Yes. Explain
Having just completed the walk, was the information you got before you started the walk accurate and adequate?
No Yes. Explain
Would you want any further information about the plants, animals, scenery and geology of the area?
No Yes. Explain
Would you want any further information about the cultural values and history of the area?
No Yes. Explain
If yes to the above, would you like this information on the track itself, or before you did the walk.
What, if any, further information would you like about the walk and area to be provided along the walk itself?
Additional toilets at the Start Mangatepopo Hut Soda Springs Ketetahi Hut Finish More toilets at
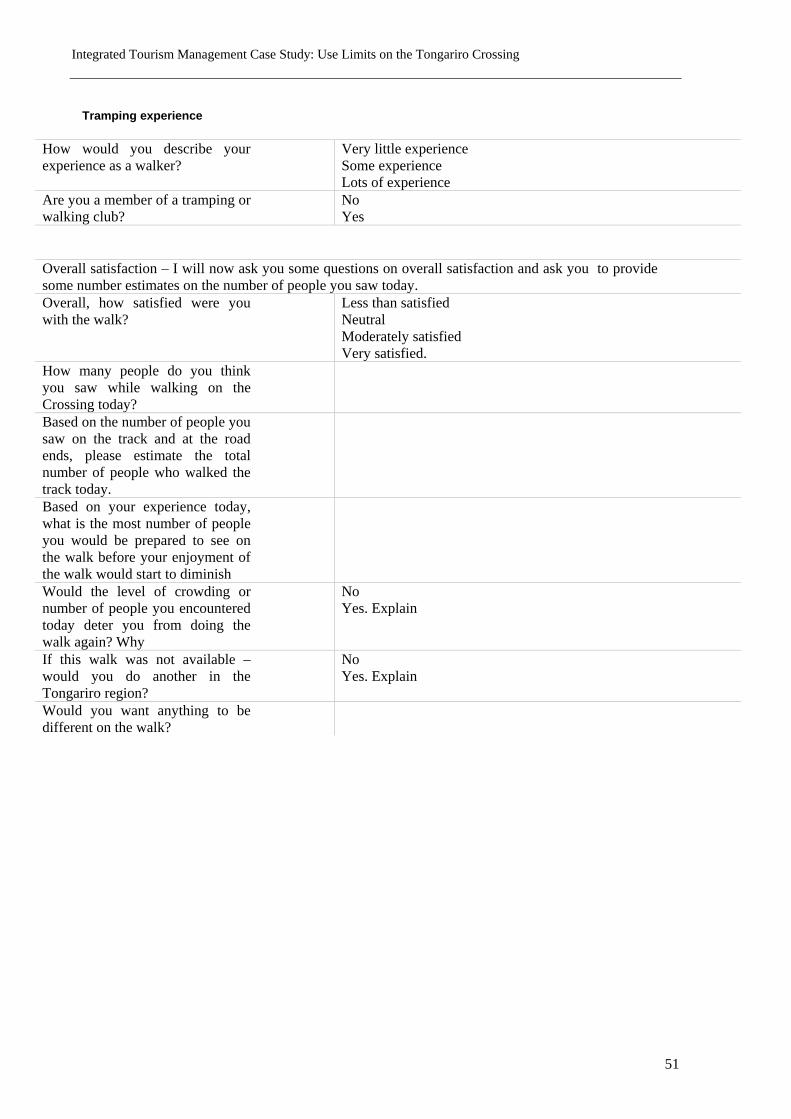
Integrated Tourism Management Case Study: Use Limits on the Tongariro Crossing
51
Tramping experience
How would you describe your experience as a walker?
Very little experience Some experience Lots of experience
Are you a member of a tramping or walking club?
No Yes
Overall satisfaction – I will now ask you some questions on overall satisfaction and ask you to provide some number estimates on the number of people you saw today. Overall, how satisfied were you with the walk?
Less than satisfied Neutral Moderately satisfied Very satisfied.
How many people do you think you saw while walking on the Crossing today?
Based on the number of people you saw on the track and at the road ends, please estimate the total number of people who walked the track today.
Based on your experience today, what is the most number of people you would be prepared to see on the walk before your enjoyment of the walk would start to diminish
Would the level of crowding or number of people you encountered today deter you from doing the walk again? Why
No Yes. Explain
If this walk was not available – would you do another in the Tongariro region?
No Yes. Explain
Would you want anything to be different on the walk?
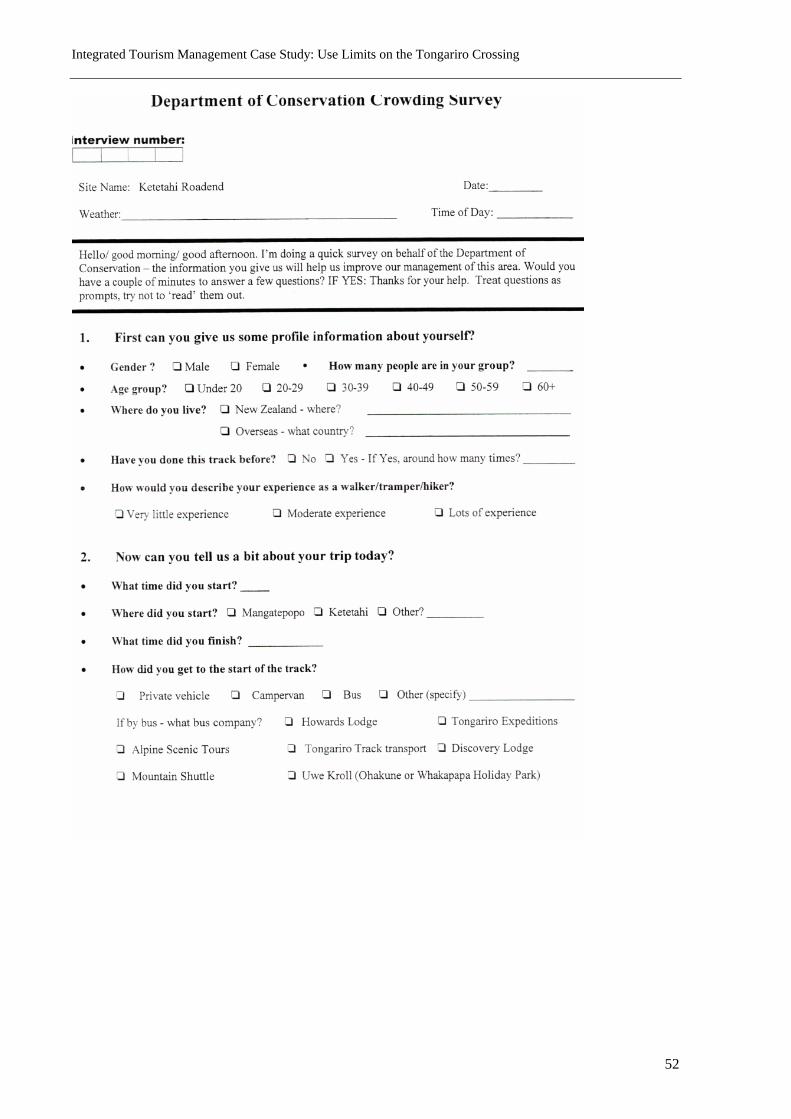
Integrated Tourism Management Case Study: Use Limits on the Tongariro Crossing
52
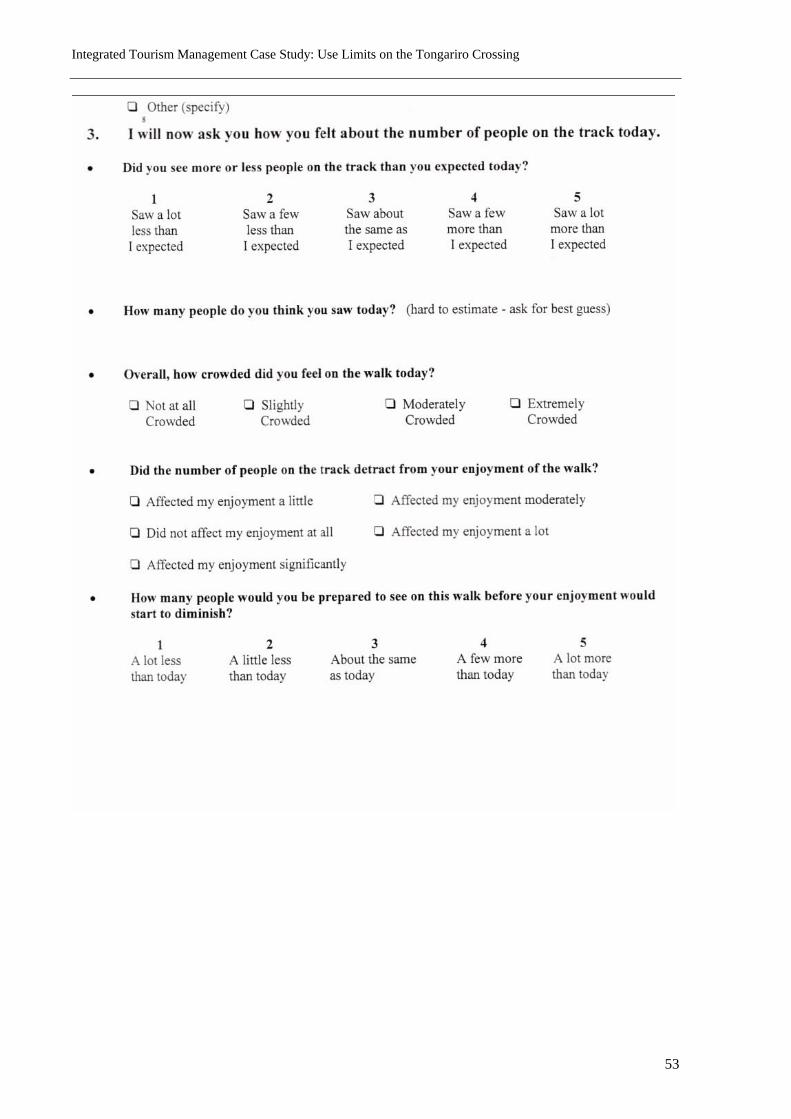
Integrated Tourism Management Case Study: Use Limits on the Tongariro Crossing
53
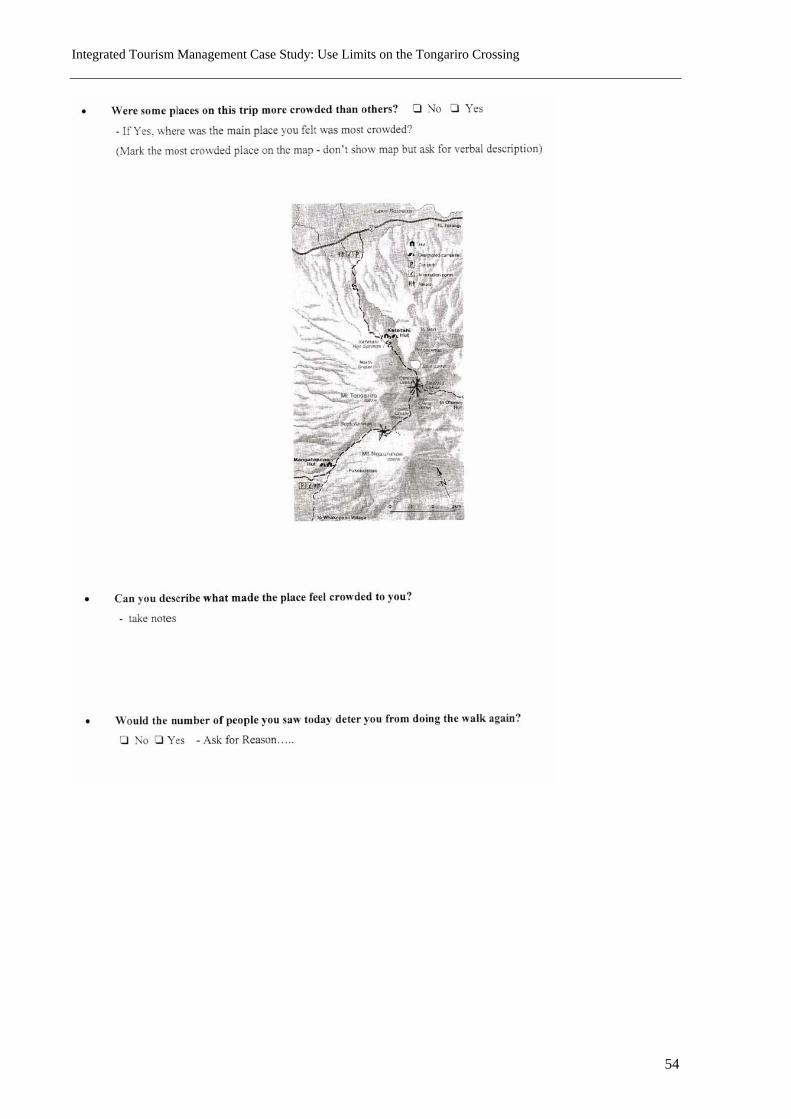
Integrated Tourism Management Case Study: Use Limits on the Tongariro Crossing
54
Integrated Tourism Management Case Study: Use Limits on the Tongariro Crossing
55
Integrated Tourism Management Case Study: Use Limits on the Tongariro Crossing
56
Appendix D - Visitor Monitoring Plan
The goals of the Visitor Monitoring Plan (DOC 2004) are to:
• Ensure the natural, cultural, historic and recreational resources managed by the Department in the Tongariro/Taupo Conservancy are not significantly degraded by the impacts of visitor activities, visitor behaviour or visitor facilities and services and
• To provide accurate information to management so that appropriate management actions are taken to sustain the intrinsic values of conservation resources for present and future generations (Visitor Monitoring Plan 2004 - 2009).
The Plan outlines the objectives for visitor monitoring and the research programme. Information will be gathered from approximately 10% of all visitor sites (excluding Remoteness Seeker sites) with some 28 sites identified. This approach is consistent with the national approach in terms of picking sites that are representative of the user groups within a conservancy and record and follow trends in use. The information to be gathered includes:
• The number of visitors by location over time;
• Visitor and visitor characteristics
• Visitor experiences
• Demand and supply
• Benefits and values
• Impacts of visitors.
Calibrated track counter will be used in the form of simple tally counters, built into a small boardwalk system. On the Tongariro Crossing, data will be checked weekly by hut wardens for seven months of the year minimum, and by hut wardens and rangers over the remaining five winter months.
Integrated Tourism Management Case Study: Use Limits on the Tongariro Crossing
57
Appendix E - Survey Analysis Summary
Introduction
As part of the process of identifying area issues, concerns and opportunities, an oral and written multi-choice questionnaire type survey was undertaken of Tongariro Crossing walkers over the summer periods of 2004 and 2005, in the vicinity of Ketetahi carpark and Ketetahi Hut. The first series of surveys were undertaken by the researchers, and the second (over the 2005 period) were undertaken by Doc staff.
The main purpose of the surveys was for the gathering of information with respect to users experiences, expectations and impressions – specifically in relation to perceptions of crowding. The questions asked in the survey covered:
• demographic profile (including home town/country). • perceptions and expectations of crowding. • satisfaction with overall experience.
The questions asked in the two surveys were predominantly identical in the type of questions asked and the responses provided. However where there are differences, these are noted in the following analysis.
In the first series of surveys (over the 2004 summer period), further questions were asked on:
• satisfaction with information about the trip. • Satisfaction with toilet facilities.
A sample of the survey questionnaire’s are attached to the main report.
Some 815 surveys were undertaken in total. A total of 268 surveys were undertaken over nine separate survey days throughout March and April 2004 in early/late afternoon, typically from 1pm to 5pm. The days selected were pre chosen at random. However, Thursday 8 April, Saturday 10 April and Sunday 11 April were specifically chosen, as this was the Easter period, which is traditionally the busiest time for walkers on the Crossing.
A total of 547 surveys were undertaken over 22 days in January to March 2005. Of the 815 surveys, 166 were written, with the rest conducted orally.
105 of the 2004 surveys were taken at Ketetahi hut. It was considered appropriate to include surveys taken from this location within the survey results as the majority of the walk has been completed, and all those points on the track where crowding was noted to be most prevalent (i.e. at the start, the devils staircase and the Emerald Lakes) have been passed.
The following assessment outlines a discussion of the survey results, followed by the data results themselves. The following matters are covered:
• Demographics and profile • Crowding expectations and perception • Factors contributing to crowding perception • Tolerance levels • Visitor satisfaction • Interpretation
The following table, Figure 1, shows the actual number of people on the track on each of the days surveyed.
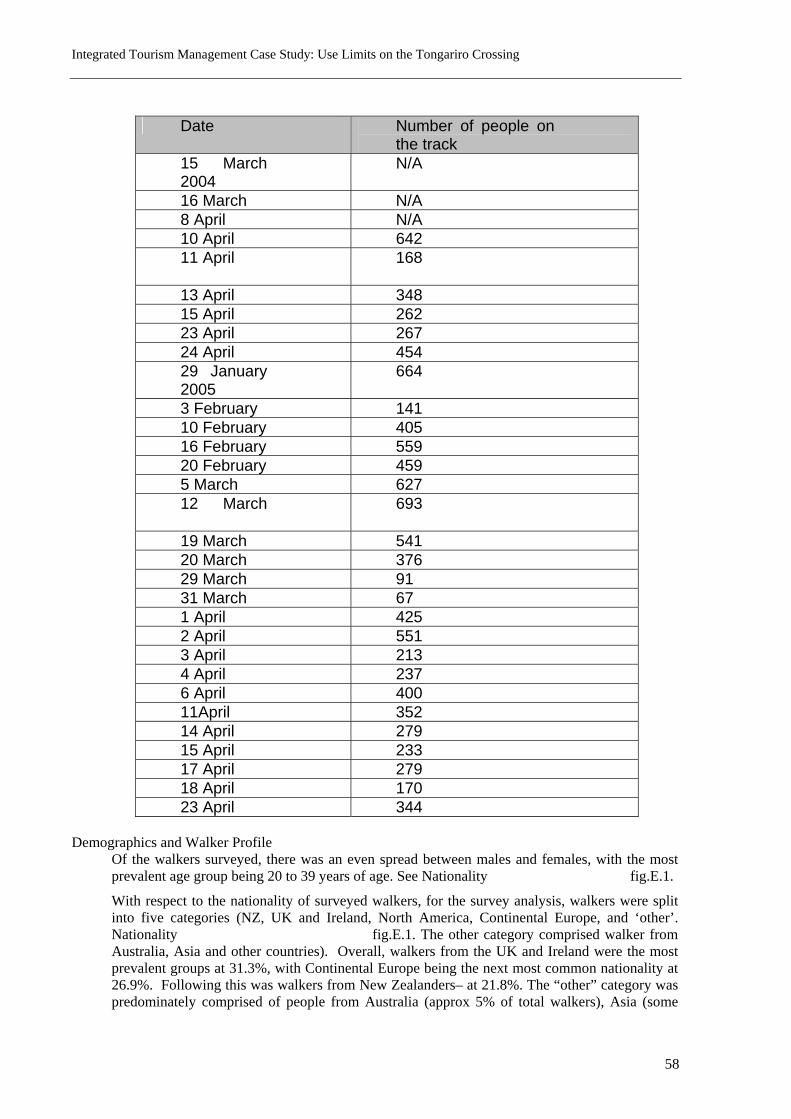
Integrated Tourism Management Case Study: Use Limits on the Tongariro Crossing
58
Date Number of people on
the track 15 March 2004
N/A
16 March N/A 8 April N/A 10 April 642 11 April
168
13 April 348 15 April 262 23 April 267 24 April 454 29 January 2005
664
3 February 141 10 February 405 16 February 559 20 February 459 5 March 627 12 March
693
19 March 541 20 March 376 29 March 91 31 March 67 1 April 425 2 April 551 3 April 213 4 April 237 6 April 400 11April 352 14 April 279 15 April 233 17 April 279 18 April 170 23 April 344
Demographics and Walker Profile
Of the walkers surveyed, there was an even spread between males and females, with the most prevalent age group being 20 to 39 years of age. See Nationality fig.E.1.
With respect to the nationality of surveyed walkers, for the survey analysis, walkers were split into five categories (NZ, UK and Ireland, North America, Continental Europe, and ‘other’. Nationality fig.E.1. The other category comprised walker from Australia, Asia and other countries). Overall, walkers from the UK and Ireland were the most prevalent groups at 31.3%, with Continental Europe being the next most common nationality at 26.9%. Following this was walkers from New Zealanders– at 21.8%. The “other” category was predominately comprised of people from Australia (approx 5% of total walkers), Asia (some
Integrated Tourism Management Case Study: Use Limits on the Tongariro Crossing
59
2%) and Israel. The discussion group with concession holders noted the wide range of nationalities on the track.
At Easter, which is traditionally the busiest time of the year for New Zealanders to walk the track, the percentage of walkers surveyed who were New Zealanders increased to 29% on Easter Saturday and 30% on Easter Sunday. This supports anecdotal evidence which notes the large number of New Zealanders on the walk over Easter, and the high number of walkers overall on the track over this period. Waitangi weekend is also noted for high patronage of New Zealanders on the walk. One issue identified in the discussion groups with the Tararua Tramping Club was the limited times in which New Zealanders can walk the track in terms of public holidays.
The majority of walkers travelled in pairs or in smaller groups of 3-4 people. Refer Travel group size fig.E.4. However, the sampling practice of tending to talk to one person in a group meant large groups may have been underrepresented in the survey data. Larger groups were observed on the track.
The above pattern was reflected over the busier Easter period. Larger groups were noted, but appeared the exception rather than the rule. It was noted that larger groups often broke up into smaller groups over the duration of the walk and met up at certain locations. This was the case with the Onslow College school group who re-grouped at Red Crater and Ketetahi Hut. A number of those surveyed were part of larger groups, but walked the track in smaller sub groups. This was evident at Ketetahi carpark in which the surveyors witnessed pairs of walkers meeting up with larger groups at the carpark. Large groups encountered during the surveys included school groups, a Dutch walking group, and a tramping club over Easter.
Walkers were asked about their tramping experience. Refer Tramping experience fig.E.3. The majority (57%) considered they had some tramping experience and a further 25.6% considered they had lots of tramping experience. 6% of those surveyed were members of a tramping club. This number increased to 8% over the Easter period of 2004. During the Easter period of 2004, the percentage of New Zealanders on the track on Easter Saturday increased to 29%.
In terms of transport mode, 89% of walkers arrived by bus. Refer Transport mode fig.E.5. The remaining 11% arrived by private vehicle and campervan. This supports anecdotal evidence that the vast majority of walkers arrived by organised transport. The nature of the bus system is such that users are required to pay for a return trip as there is no service which enables users to leave their car at one end, and access transport at the other and return them to pick up their car.
It is unclear from our observations whether other operators are providing a service without applying for a concession. Discussions with some existing service operators suggest this is the case and that a number of accommodation providers within the larger region, are now providing a transport service.
Crowding perceptions Walkers were asked various questions in relation to perceptions of crowding. Overall responses were then further analysed in terms of demographic factors, numbers of walkers on the track and other factors of the walk. The significance of relationships between responses to questions and these demographic and other factors was tested by a chi-squared test. Where the significance was tested the chi-squared value is shown next to the title of the distribution chart (see for example Fig E11). Statistically significant results (i.e. the result is not likely to have arisen by chance) are asterisked.
The first question was “Overall, how crowded did you find/feel on the walk today?” Four answer options were provided:
• Not crowded, • Slightly crowded,
Integrated Tourism Management Case Study: Use Limits on the Tongariro Crossing
60
• Moderately crowded; and • Very crowded. Of the responses to this question, nearly two-thirds of walkers (64.2%) perceived some crowding (whether this be slightly, moderately or very crowded). 35.9% felt not crowded, 36.5% felt slightly crowded, 21.2% felt moderately crowded, and 6.5% felt very/extremely crowded. Refer Crowding Perceptions fig.E.8.
There is a relationship between crowding perceptions and number of walkers on the track. An increase in the number of people on the track coincided with an increase in the number of people who felt moderately and extremely crowded and decrease in the number who felt not or slight crowded. The data shows that at more than 550 walkers/day, tolerance levels change with the number of people feeling extremely crowded increasing significantly. Refer fig.E.11.
Weather conditions did not appear to impact on crowding perceptions, neither did start times. These issues are discussed in greater depth in the next section of this report.
In respect of age, the data shows that the older the age group, the more tolerant people appear to be with respect to crowding. For those over 60, the majority (68%) found the walk not crowded. Refer Crowding Perceptions fig.E.9.
The data shows a relationship between those with tramping experience and perceptions of crowding. Those with greater experience generally found the tramp more crowded and those with very little experience generally found the walk less crowded. This could be because more experienced trampers are used to remote and wilderness tramping experiences. Refer Tramping experience fig.E.10
A perception noted during the focus groups discussions was that New Zealanders are less tolerant of the crowding than international visitors (i.e. they find the walk more crowded and it detracts from their enjoyment), and that New Zealanders have a greater awareness of the potential crowding issues on the track. One comment from the community focus group was that to a large majority of international visitors, a daily total of 500-600 persons is still considered uncrowded. This perception was not reflected in the survey results. The survey results do not show any significant correlation between crowding perceptions based on nationality, although the UK and Ireland walkers found it somewhat less crowded on average. Refer Nationality fig.E.14. 63% of New Zealanders saw more people than they expected, compared to 50% of North Americans, 53/% of Europeans, 38/% of UK and Ireland and 62% of other of surveyed walkers overall.
Crowding expectations
In terms of crowding expectations, walkers were asked, “Did you see more or less people (on the track) than you expected (today)”. Overall, 51.4% saw more people than they expected, 40% saw about the same, and 17.7% saw less then they expected. Refer Crowding Expectations fig.E.16.
As with visitor perceptions of crowding, there was a significant relationship between crowding expectations and numbers of walkers, with an increase in number of walkerss relating to an increase in people who saw more than they expected. There appears to be a change in pattern particularly at more than 350 walkers/day. Refer
Number of walkers on track fig.E.18.
There is also a significant relationship between start times and expectation of crowding with a higher percentage of people who started in the peak time, seeing more people than they
Integrated Tourism Management Case Study: Use Limits on the Tongariro Crossing
61
expected, compared to those who started in the off peak times, refer Start times fig.E.20.
There is no significant relationship between expectations and country of origin (Refer Nationality fig.E.17) and weather conditions, refer Weather fig.E.19.
Detraction from enjoyment
Walkers were further asked, “Did the extent of crowding or number of people you saw on the Crossing detract from your enjoyment of the walk?” For the purposes of the survey analysis, the 2005 survey results were classified into yes or no responses. Overall, a clear majority (72.8%) said that the number of people seen saw did not detract from their enjoyment. Refer Detraction from Enjoyment fig.E.21.
There is a significant relationship between number of walkerss and detraction from enjoyment. Up to 350 walkers per day on the track, under 22% felt the number of people seen detracted from their enjoyment of the walk. This percentage increased to 35% between 350 and 550 walkers, and further increased to 40% over 550 walkers. The data appears to show a threshold in enjoyment when numbers of walkers rise above 350 walkers people per day. Refer Number of walkers on track fig.E.22.
There is also a significant relationship between enjoyment and start time. Start times fig.E.23). 37% felt the number of people seen detracted from their enjoyment when they started between the peak times of 8am to 10am. This reduced to 23% at non-peak times.
There also appears to be a significant relationship between detraction from enjoyment and weather conditions. On good days, the percentage of people who thought the number of people seen detracted from their enjoyment of the walk was 33%. Contrastingly, on bad days, this number reduced to 20%. This is discussed later in the next section of this report. Refer Weather fig.E.24.
The data did not show any clear relationship with nationality and detraction from enjoyment, with all the countries experiencing similar reactions to the question. Refer Nationality fig.E.25. However, there where significant differences in the detraction rate for the countries. Continental Europe had a higher detraction rate and UK and Ireland had a lower one.
Overall satisfaction Walkers were asked how satisfied, overall, they were with the walk. This question was generic and did not specifically relate to crowding. The clear majority of walkers were very satisfied Refer Satisfaction fig.E.26. Furthermore, this result was not dependent on the numbers of walkers on the track (Refer Number of walkers on the track fig.E.27,), or start times. Refer Start times fig.E.29). However, predictably, on good weather days, there were more people who were every satisfied, and less people who were less than or neutral in their satisfaction. Refer Weather Conditions fig.E.28.
Overview The data analysis shows three significant impacts on crowding and detraction from enjoyment – start times, weather and actual number of walkerss. For perceptions of crowding, the main impacts appears to be number of walkers on the track and the age and experience of the walker. The weather and start times had no impact.
For crowding expectations, actual walker numbers, and the start time, impacted on the crowding expectation. Again, weather appeared to have no impact on crowding expectation.
The above results imply that while walkers were well aware of other walkers and there were more walkers than they expected to see, for the majority, this did not detract from their overall enjoyment of the walk. Walker’s perceptions and expectations of crowding appeared to change around 550 walkers. Detraction from enjoyment appear to change at around 350 walkers/day.
Integrated Tourism Management Case Study: Use Limits on the Tongariro Crossing
62
Therefore, walker numbers appeared to have a significant impact on perception, expectation and detraction.
Factors contributing to crowding perception and enjoyment The survey analysis suggests there are a number of factors that contribute toward crowding perceptions and enjoyment. These include:
• Number of walkers on the track; • Weather (see next section); and • Start times
The survey analysis also found some areas to be more crowded than others.
Walker numbers As would be expected, there appear to be a clear relationship between walker numbers and crowding perceptions, expectations and enjoyment.
The data shows a change in visitor perceptions when number of walkerss rise above 550 people per day. In relation to visitor expectations of crowding, the data shows a change in pattern when visitor numbers exceed 550. The data shows a sharp change in enjoyment when number of walkers rise above 350 walkers’ people per day. Refer Number of walkers on track fig.E.22.
Weather The weather on the walk was analysed and split into “good weather days” (clear, not particularly windy or cold), “bad weather days” (very cold, wet or windy, particularly at higher altitudes) and marginal days. All marginal days were discounted and only the good and bad weather days included for analysis of this factor. This equated to 22 out of the 29 days surveyed. As noted previously, the weather did not appear to impact on walkers’ perceptions of crowding. Refer Weather fig.E.12. However, it did appear to impact on walkers’ enjoyment in terms of whether the number of people seen detracted from their enjoyment of the walk. The survey analysis found that on good weather condition days, more people felt the number of people seen detracted from their enjoyment of the walk. Refer Weather fig.E.24.
The suggested reasons for this are twofold –
• there are generally more people on the walk on good weather days. On the days surveyed that experienced good weather, some 66% had over 400 people on the track. This contrasts to 25% on bad weather days where there were more than 400 people; and
• on bad weather days, people are happy to see other walkers for safety reasons in that they prefer to see other people around and like to know where to go, by following the trail of people.
These two reasons were borne out in discussion with the walkers during the surveys, and in focus groups. Note that this analysis did not consider the effect of particularly hot days, which may also affect perceptions and enjoyment).
Start times Interestingly, the same scenario does not apply in relation to perceptions and start times.
More than 70% of the walkers surveyed started the walk in a 90-minute hour block between 7.15 and 8.45. As such, the bulk of walkers started in one specific time slot. However, there appears to be no relationship between start time and crowding perceptions. As such, the analysis shows that the start time does not impact on how crowded people found the walk. Refer Start times fig.E.6 and Start Times fig.E.13.
However, the data does show a relationship between start time and crowding expectations and detraction from enjoyment. This suggests that people did not expect to see so many people at
Integrated Tourism Management Case Study: Use Limits on the Tongariro Crossing
63
the start of the walk. In terms of enjoyment, the data shows the start (peak) time did affect enjoyment, refer Start times fig.E.23. The reasons for this are unclear. It may be that people have initial annoyance at having a large number of people at the start in what is supposed to be a mountain tramp. Alternatively, people may be aware (in hindsight) that if they started earlier or later, they would have been walking with less people.
Areas crowded and contributing factors It was noted during the focus groups discussion that the very nature of the track (open dramatic landscape with certain key features) means that at some places there will always be crowding, regardless of when people started.
The surveys found particular areas of the track more crowded than others. Refer (Combined Survey No. 763)
Integrated Tourism Management Case Study: Use Limits on the Tongariro Crossing
64
Most Crowded Spots fig.E.15. 18.4% felt most crowded at the start of the track, 19.3% felt most crowded between the Mangetopopo Hut and Soda Springs, 39% felt most crowded at the Devils staircase and South Crater, 43.5% felt most crowded at Red Crater and the Lakes, 30.2% felt most crowded at Ketetahi Hut, 7.5% felt most crowded between Ketetahi Hut and the carpark, and 3.7% felt most crowded at Ketetahi carpark. This, the Lakes and Red Crater, Devil’s Staircase and South Crater, and around Ketetahi Hut were found to be the three most crowded spots.
Surprisingly, despite anecdotal evidence that people find the track most crowded at the start, only 18.4% found the start of the track most crowded.
One further question in relation to crowding concerned what contributes to people’s sense of crowding4. Was it the number of people seen, the size of groups encountered, the clustering of people, the attitude of walkers, or physical features of the walk? The results show the main contributing factor to a sense of crowding was the number of people seen, followed by the clustering of people. The size, attitude and physical features of the track were not determining factors.
As such, there appears to be a relationship between areas of crowding and contributing factors. These connections include:
• People feel most crowded in places where people are congregated and resting (e.g. the Lakes and Ketetahi Hut). The data indicates it is the number of people and clustering which make these places crowded. Generally in these areas, people are confined to an area, and have the opportunity to sit and observe how many other people there are around them. In addition, there is often a demand for optimum seating or viewing space. While the same might be expected to apply to the Ketetahi car park, it doesn’t. This may be because people are happy to have finished the walk, have a sense of accomplishment and companionship having finished the walk, and are entertained observing other people while they wait for their transport.
• At the Devils Staircase and South Crater, the second most crowded area, walkers are generally clustered (by the physical features of the track) and are able to see numerous other walkers as they walk up the staircase and along the crater. This supports the relationship between place and the number of people seen and clustering of people.
• However, the relationship between place and number of people seen and clustering, is not evident at the start of the walk. Surprisingly this area was not noted as one of the most crowded. But there was a relationship between start time and crowding expectations and detraction from enjoyment. Throughout the research period, it was often suggested that the perception of crowding is largely attributable to the number of people arriving on-mass from the buses, and the survey analysis which indicated the start time impacted on their overall enjoyment of the walk. However the survey results do not support this theory in that only 18.4% of those surveyed found the start of the walk most crowded. It may be that crowding at the start does not bother people as the scenery is not as dramatic and iconic, the gentle gradient of the track facilitates easier passing, the tussock and winding nature of the path assist in screening other walkers; and walkers are not stopping to rest and observe the number of other walkers.
Tolerance levels In the 2004 survey, walkers were asked, based on your experience today, what is the most number of people you would be prepared to see on the walk before your enjoyment of the walk would start to diminish? In the 2005 survey, walkers were asked, How many people would you be prepared to see on this walk before your enjoyment would start to diminish?
Respondents replied with either an actual number, or a statement relating to their experience on that particular day, i.e. the number we saw today was the limit, or I would be happy to see twice as many people as seen today. The analysis was split into five response categories: Significantly
4 This question was only asked in the 2004 survey.
Integrated Tourism Management Case Study: Use Limits on the Tongariro Crossing
65
less than today, slightly less that today, the same as today, slightly more than today, significantly more than today.
Overall, it was evenly spread between those that wanted to see the same as seen on the day they did the walk (25.4%), a few more (26.9%), or a lot more than today (24.6%). Refer Tolerance fig.E.31. 16% wanted to see less than seen today, and 7.2% wanted to see a lot less. Generally therefore, people were happy to see the same or more people than see on that particular day. The comments made to support this stance largely relate to the fact that people don’t want others to miss out on the experience and everyone should have access to the walk.
The analysis shows there appears to be a relationship between carrying capacity and walkers numbers. At approximately more than 350 walkers, the number of walkers who would be happy to see a few or lot more people on the track drops significantly. This trend corresponds with an increase in the numbers who want to see less people on the track. Refer Numbers on track fig.E.32.
There appeared no relationship between the age of walkers, and tramping experience and the number they would be happy to see.
The above suggest that walkers do not consider crowding or the number of other walkers as effecting their overall satisfaction. Thereby while they are aware of other walkers, they do not impact on their overall satisfaction. The issue of visitor satisfaction and the effect this has on people’s perceptions of the walk was raised in the focus group discussion with operators. It was noted that the walk is very impressive with some operators conveying that walkers were more impressed than they thought they would be. This combined with the huge sense of accomplishment in completing the walk, may “soften” any earlier concerns or negative perceptions people experienced on the walk. It was also proposed that the weather plays a huge part in people perceptions with those experiencing more favorable weather conditions having an overall more positive attitude towards the walk.
Interpretation The issue of visitor information and interpretation was one that was discussed with the walkers surveyed in 2004, and the participants at the focus group discussions.
The 268 people surveyed were asked “Having just completed the walk, was the information you got before you started the walk accurate and adequate?”. The clear majority (78%) replied that they were satisfied. Walkers were then asked whether they would want any further information about the plants, animals, scenery, geology, cultural values and history of the area, and whether they would like this information on the walk itself or before they started the walk. Between 18% and 40% would like more information on each of the factors asked about, including the geological features (the most commonly requested area of additional information), plants, animals, scenery, Maori, history of the area, safety, distance in time and main lookouts. Transport operators who took part in the focus group discussion commented that the main information sought for walkers they encounter is on toilet and drinking water facilities.
Based on the above, there is a clear demand from those walking on the track for additional information. Altogether 70% of walkers expressed a desire for more information on some aspect of the walk. Of those that would like more information, 58% expressed support for the additional information to be located on the track itself. However this was countered by other walkers who raised concerns about the visual impacts and distraction of having billboards and so forth on the track itself in what is largely an unmodified environment.
There was also a clear message for increased interpretation/information raised during the focus group discussions. It was suggested that walkers would get increased enjoyment out of the walk if they were made aware of the historical, cultural and geographic features of the area. One comment was that the interactive traveller wants an integrated package and is willing to pay for it. In the late 1990’s the Chateau provided guided walks on the cultural aspects of the walk

Integrated Tourism Management Case Study: Use Limits on the Tongariro Crossing
66
which were very well regarded. The issue of guided walks was one that was supported by all the focus groups. It was felt that improved interpretation would improve the visitor experience, and potentially offset any restriction in numbers. A further benefit would be an increase in preservation and conservation. However, it was identified that while this may be applicable to the overseas visitor – it may not apply to New Zealanders.
Visitor information In response to the questions concerning information sourcing, the majority of people first heard about the walk via word of mouth. Guide books were the next main source of information. Further information was sourced mainly from Guide books, pamphlets and the visitor centres.
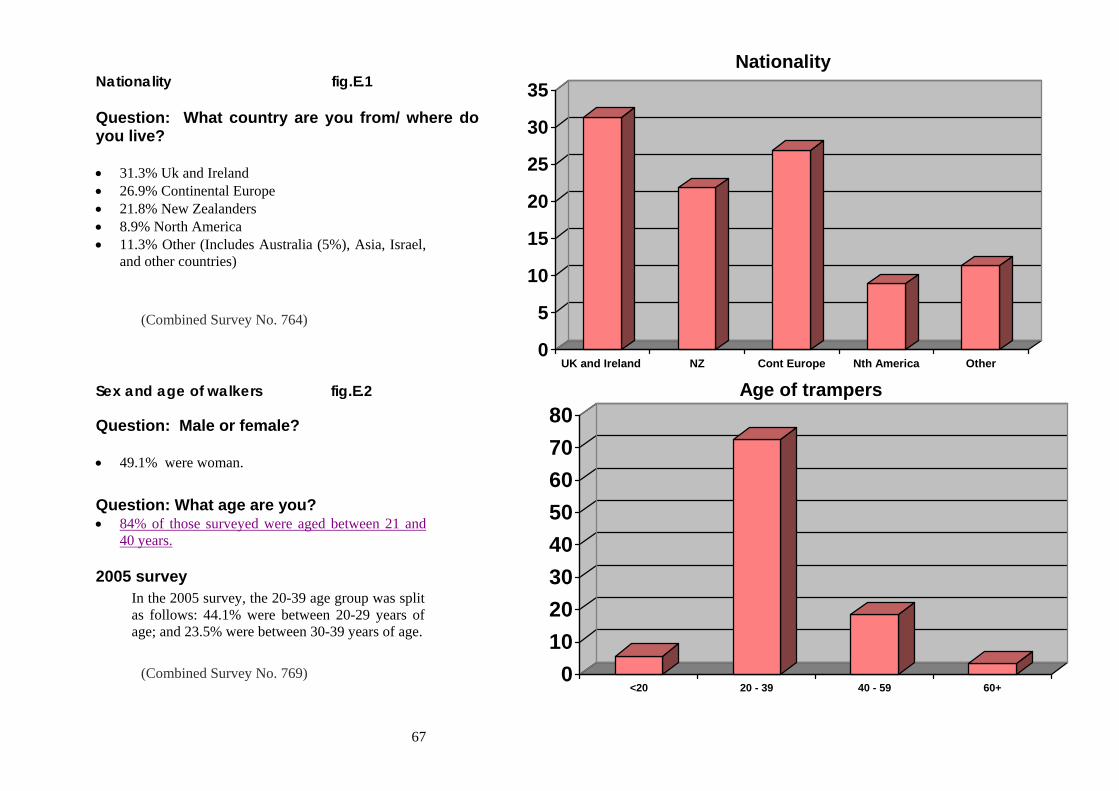
67
Nationality fig.E.1 Question: What country are you from/ where do you live? • 31.3% Uk and Ireland • 26.9% Continental Europe • 21.8% New Zealanders • 8.9% North America • 11.3% Other (Includes Australia (5%), Asia, Israel,
and other countries)
(Combined Survey No. 764)
Sex and age of walkers fig.E.2
Question: Male or female? • 49.1% were woman. Question: What age are you? • 84% of those surveyed were aged between 21 and
40 years. 2005 survey
In the 2005 survey, the 20-39 age group was split as follows: 44.1% were between 20-29 years of age; and 23.5% were between 30-39 years of age.
(Combined Survey No. 769)
0
5
10
15
20
25
30
35
UK and Ireland NZ Cont Europe Nth America Other
Nationality
01020304050607080
<20 20 - 39 40 - 59 60+
Age of trampers
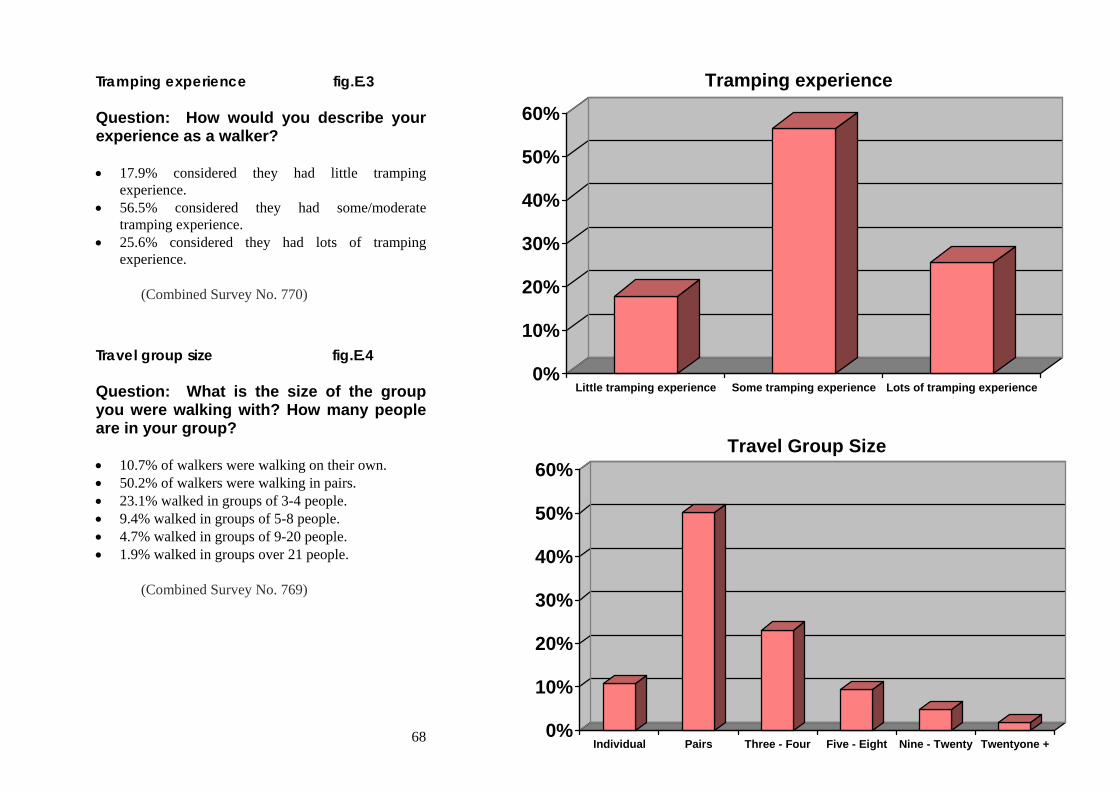
68
Tramping experience fig.E.3
Question: How would you describe your experience as a walker? • 17.9% considered they had little tramping
experience. • 56.5% considered they had some/moderate
tramping experience. • 25.6% considered they had lots of tramping
experience.
(Combined Survey No. 770)
Travel group size fig.E.4 Question: What is the size of the group you were walking with? How many people are in your group? • 10.7% of walkers were walking on their own. • 50.2% of walkers were walking in pairs. • 23.1% walked in groups of 3-4 people. • 9.4% walked in groups of 5-8 people. • 4.7% walked in groups of 9-20 people. • 1.9% walked in groups over 21 people.
(Combined Survey No. 769)
0%
10%
20%
30%
40%
50%
60%
Little tramping experience Some tramping experience Lots of tramping experience
Tramping experience
0%
10%
20%
30%
40%
50%
60%
Individual Pairs Three - Four Five - Eight Nine - Twenty Twentyone +
Travel Group Size
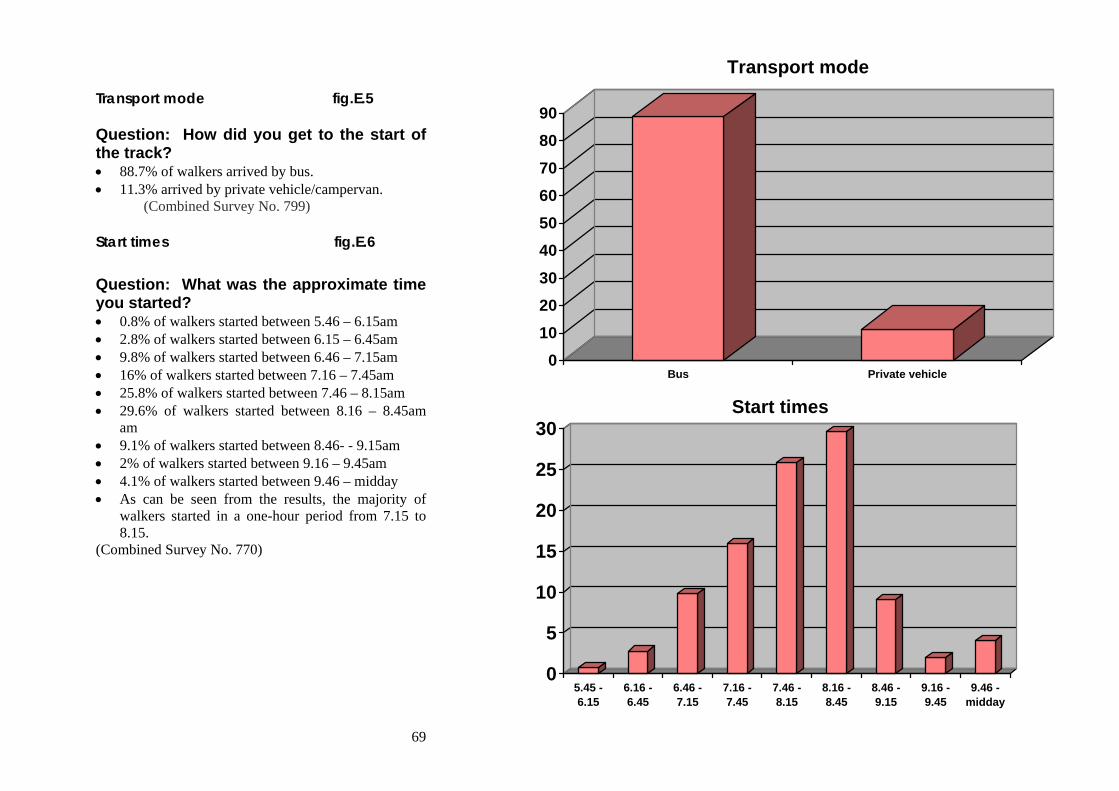
69
Transport mode fig.E.5 Question: How did you get to the start of the track? • 88.7% of walkers arrived by bus. • 11.3% arrived by private vehicle/campervan. (Combined Survey No. 799) Start times fig.E.6
Question: What was the approximate time you started? • 0.8% of walkers started between 5.46 – 6.15am • 2.8% of walkers started between 6.15 – 6.45am • 9.8% of walkers started between 6.46 – 7.15am • 16% of walkers started between 7.16 – 7.45am • 25.8% of walkers started between 7.46 – 8.15am • 29.6% of walkers started between 8.16 – 8.45am
am • 9.1% of walkers started between 8.46- - 9.15am • 2% of walkers started between 9.16 – 9.45am • 4.1% of walkers started between 9.46 – midday • As can be seen from the results, the majority of
walkers started in a one-hour period from 7.15 to 8.15.
(Combined Survey No. 770)
0102030405060708090
Bus Private vehicle
Transport mode
0
5
10
15
20
25
30
5.45 -6.15
6.16 -6.45
6.46 -7.15
7.16 -7.45
7.46 -8.15
8.16 -8.45
8.46 -9.15
9.16 -9.45
9.46 -midday
Start times
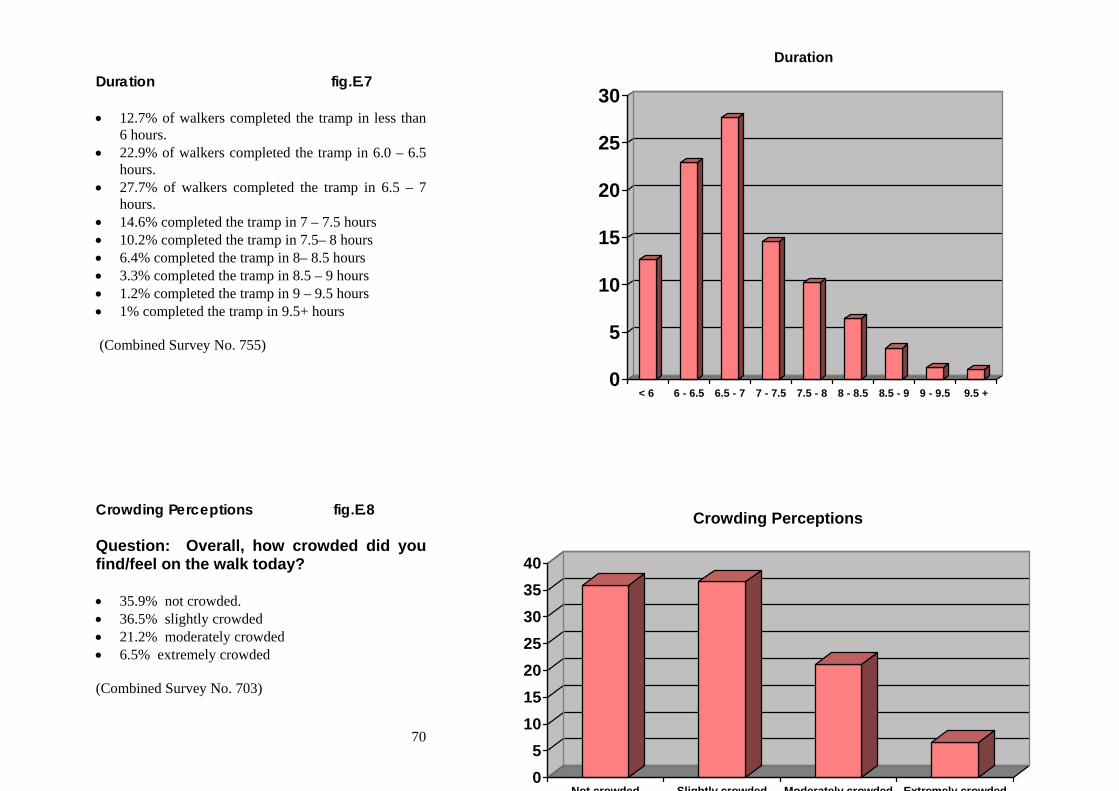
70
Duration fig.E.7 • 12.7% of walkers completed the tramp in less than
6 hours. • 22.9% of walkers completed the tramp in 6.0 – 6.5
hours. • 27.7% of walkers completed the tramp in 6.5 – 7
hours. • 14.6% completed the tramp in 7 – 7.5 hours • 10.2% completed the tramp in 7.5– 8 hours • 6.4% completed the tramp in 8– 8.5 hours • 3.3% completed the tramp in 8.5 – 9 hours • 1.2% completed the tramp in 9 – 9.5 hours • 1% completed the tramp in 9.5+ hours (Combined Survey No. 755) Crowding Perceptions fig.E.8 Question: Overall, how crowded did you find/feel on the walk today? • 35.9% not crowded. • 36.5% slightly crowded • 21.2% moderately crowded • 6.5% extremely crowded (Combined Survey No. 703)
0
5
10
15
20
25
30
< 6 6 - 6.5 6.5 - 7 7 - 7.5 7.5 - 8 8 - 8.5 8.5 - 9 9 - 9.5 9.5 +
Duration
05
10152025303540
Not crowded Slightly crowded Moderately crowded Extremely crowded
Crowding Perceptions
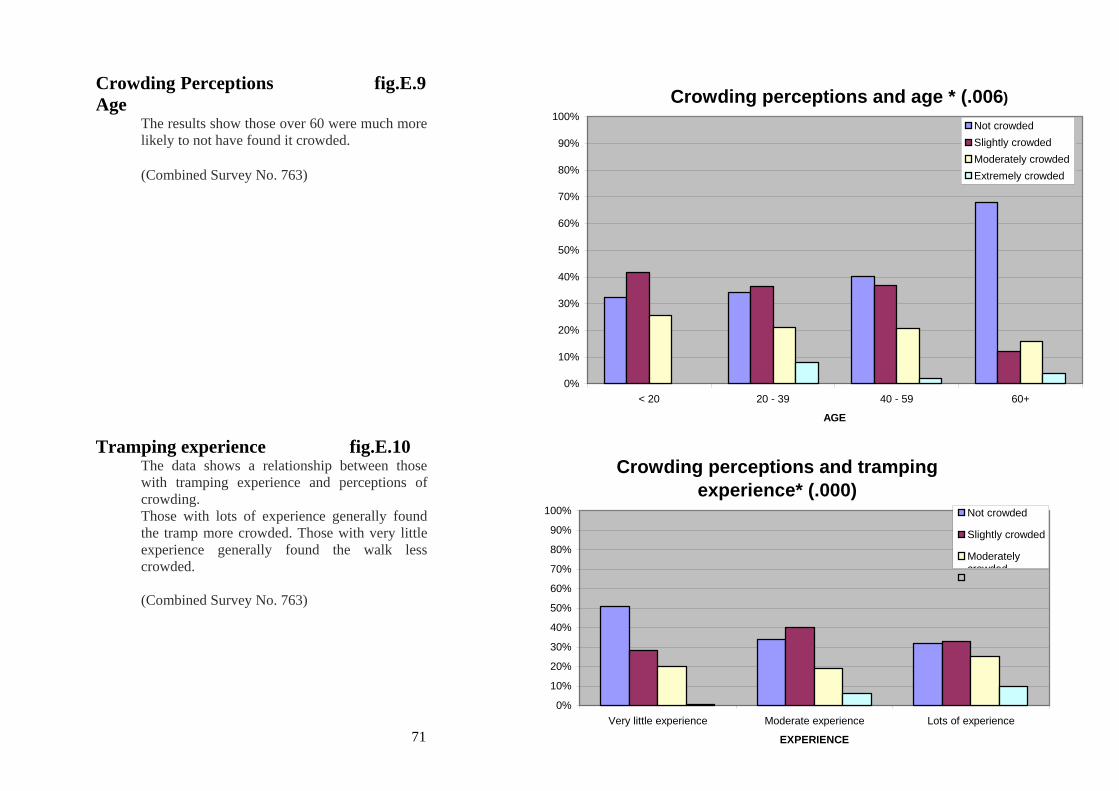
71
Crowding Perceptions fig.E.9 Age
The results show those over 60 were much more likely to not have found it crowded.
(Combined Survey No. 763)
Tramping experience fig.E.10
The data shows a relationship between those with tramping experience and perceptions of crowding. Those with lots of experience generally found the tramp more crowded. Those with very little experience generally found the walk less crowded. (Combined Survey No. 763)
Crowding perceptions and age * (.006)
0%
10%
20%
30%
40%
50%
60%
70%
80%
90%
100%
< 20 20 - 39 40 - 59 60+
AGE
Not crowdedSlightly crowdedModerately crowdedExtremely crowded
Crowding perceptions and tramping experience* (.000)
0%
10%
20%
30%
40%
50%
60%
70%
80%
90%
100%
Very little experience Moderate experience Lots of experience
EXPERIENCE
Not crowded
Slightly crowded
Moderatelycrowded
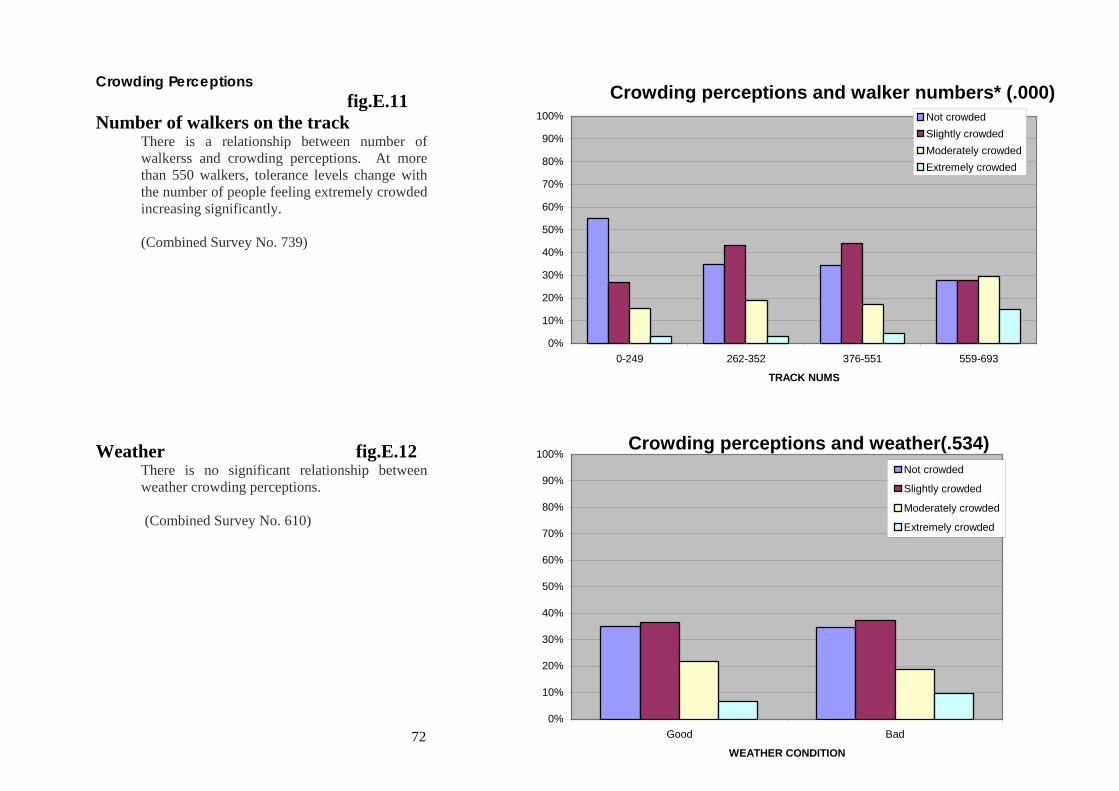
72
Crowding Perceptions fig.E.11 Number of walkers on the track
There is a relationship between number of walkerss and crowding perceptions. At more than 550 walkers, tolerance levels change with the number of people feeling extremely crowded increasing significantly.
(Combined Survey No. 739)
Weather fig.E.12
There is no significant relationship between weather crowding perceptions.
(Combined Survey No. 610)
Crowding perceptions and walker numbers* (.000)
0%
10%
20%
30%
40%
50%
60%
70%
80%
90%
100%
0-249 262-352 376-551 559-693
TRACK NUMS
Not crowdedSlightly crowdedModerately crowdedExtremely crowded
Crowding perceptions and weather(.534)
0%
10%
20%
30%
40%
50%
60%
70%
80%
90%
100%
Good Bad
WEATHER CONDITION
Not crowded
Slightly crowded
Moderately crowded
Extremely crowded
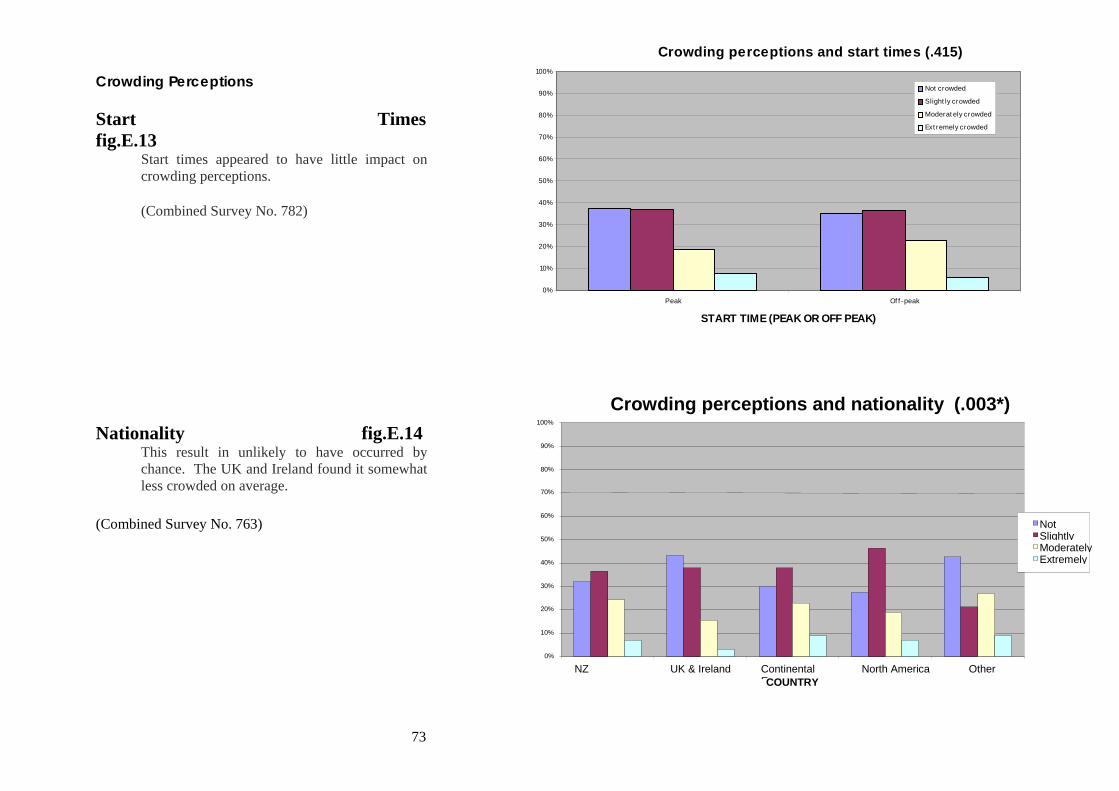
73
Crowding Perceptions Start Times fig.E.13
Start times appeared to have little impact on crowding perceptions.
(Combined Survey No. 782)
Nationality fig.E.14
This result in unlikely to have occurred by chance. The UK and Ireland found it somewhat less crowded on average.
(Combined Survey No. 763)
Crowding perceptions and start times (.415)
0%
10%
20%
30%
40%
50%
60%
70%
80%
90%
100%
Peak Of f -peak
START TIME (PEAK OR OFF PEAK)
Not crowded
Slight ly crowded
Moderat ely crowded
Ext remely crowded
Crowding perceptions and nationality (.003*)
0%
10%
20%
30%
40%
50%
60%
70%
80%
90%
100%
NZ UK & Ireland Continental Europe
North America Other COUNTRY
Not Slightly Moderately Extremely
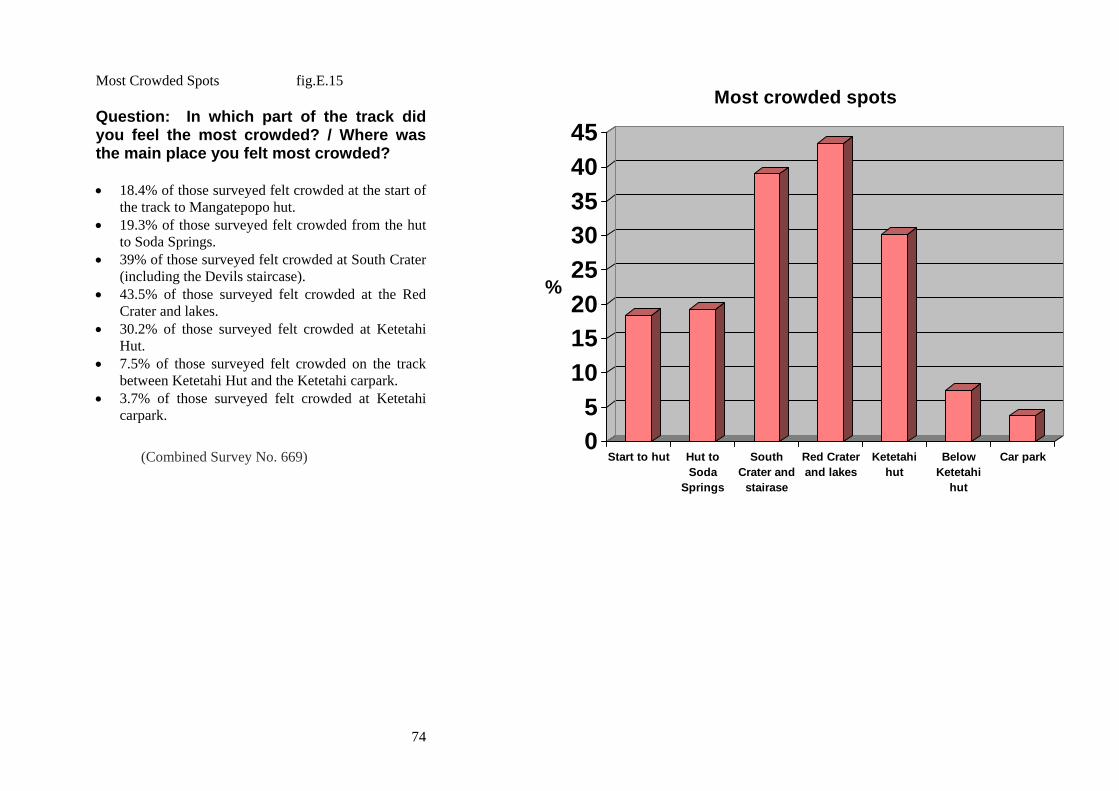
74
Most Crowded Spots fig.E.15 Question: In which part of the track did you feel the most crowded? / Where was the main place you felt most crowded? • 18.4% of those surveyed felt crowded at the start of
the track to Mangatepopo hut. • 19.3% of those surveyed felt crowded from the hut
to Soda Springs. • 39% of those surveyed felt crowded at South Crater
(including the Devils staircase). • 43.5% of those surveyed felt crowded at the Red
Crater and lakes. • 30.2% of those surveyed felt crowded at Ketetahi
Hut. • 7.5% of those surveyed felt crowded on the track
between Ketetahi Hut and the Ketetahi carpark. • 3.7% of those surveyed felt crowded at Ketetahi
carpark.
(Combined Survey No. 669)
05
1015202530354045
%
Start to hut Hut toSoda
Springs
SouthCrater and
stairase
Red Craterand lakes
Ketetahihut
BelowKetetahi
hut
Car park
Most crowded spots
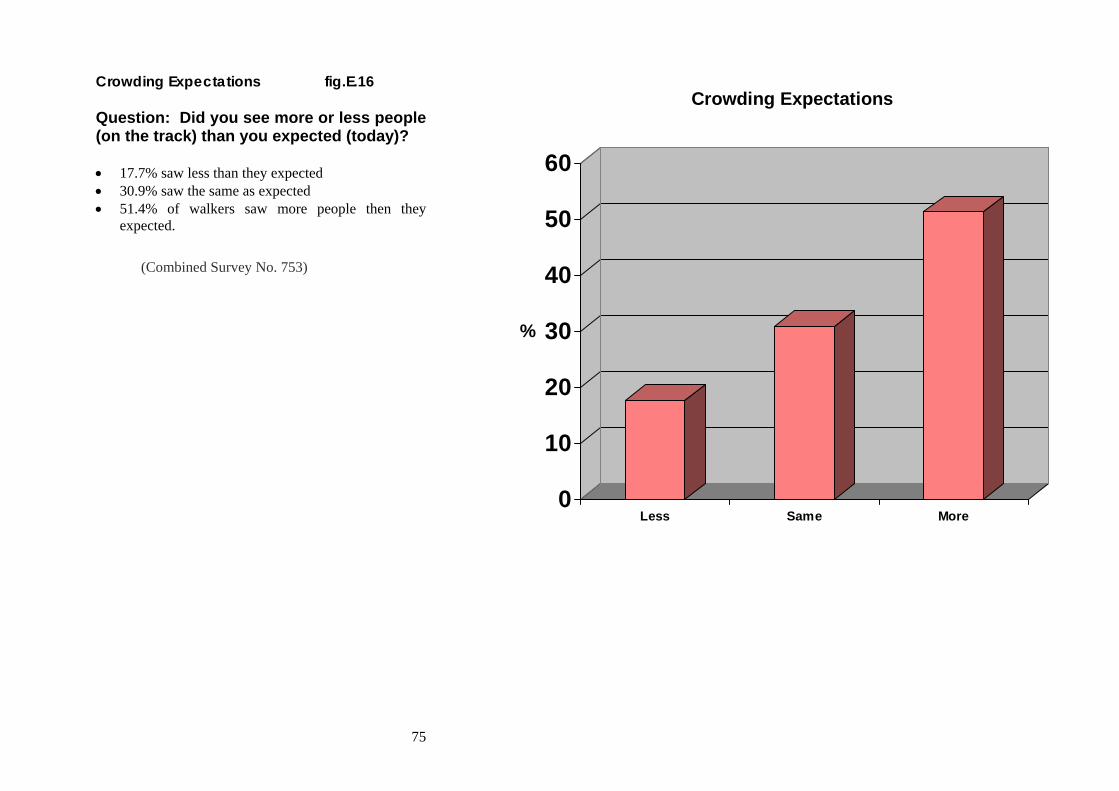
75
Crowding Expectations fig.E.16 Question: Did you see more or less people (on the track) than you expected (today)? • 17.7% saw less than they expected • 30.9% saw the same as expected • 51.4% of walkers saw more people then they
expected.
(Combined Survey No. 753)
0
10
20
30
40
50
60
%
Less Same More
Crowding Expectations
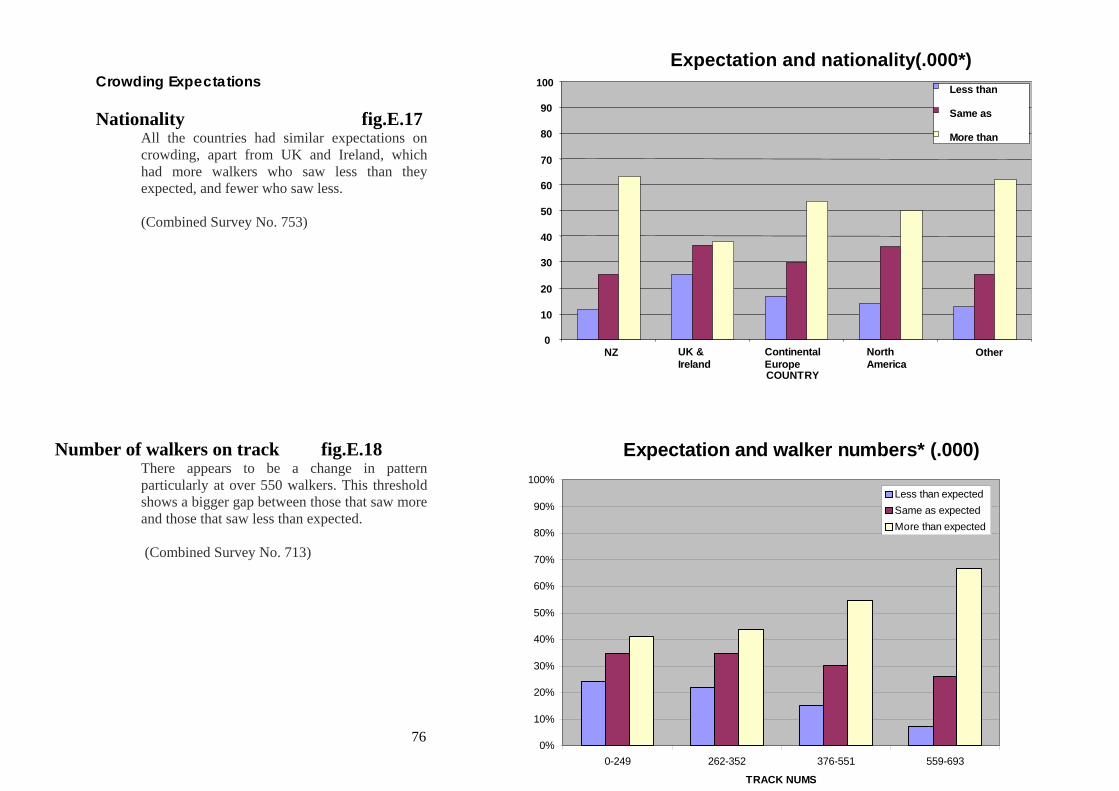
76
Crowding Expectations Nationality fig.E.17
All the countries had similar expectations on crowding, apart from UK and Ireland, which had more walkers who saw less than they expected, and fewer who saw less. (Combined Survey No. 753)
Number of walkers on track fig.E.18
There appears to be a change in pattern particularly at over 550 walkers. This threshold shows a bigger gap between those that saw more and those that saw less than expected.
(Combined Survey No. 713)
Expectation and nationality(.000*)
0
10
20
30
40
50
60
70
80
90
100
NZ UK & Ireland
Continental Europe
North America
Other
COUNTRY
Less than
Same as
More than
Expectation and walker numbers* (.000)
0%
10%
20%
30%
40%
50%
60%
70%
80%
90%
100%
0-249 262-352 376-551 559-693
TRACK NUMS
Less than expectedSame as expectedMore than expected
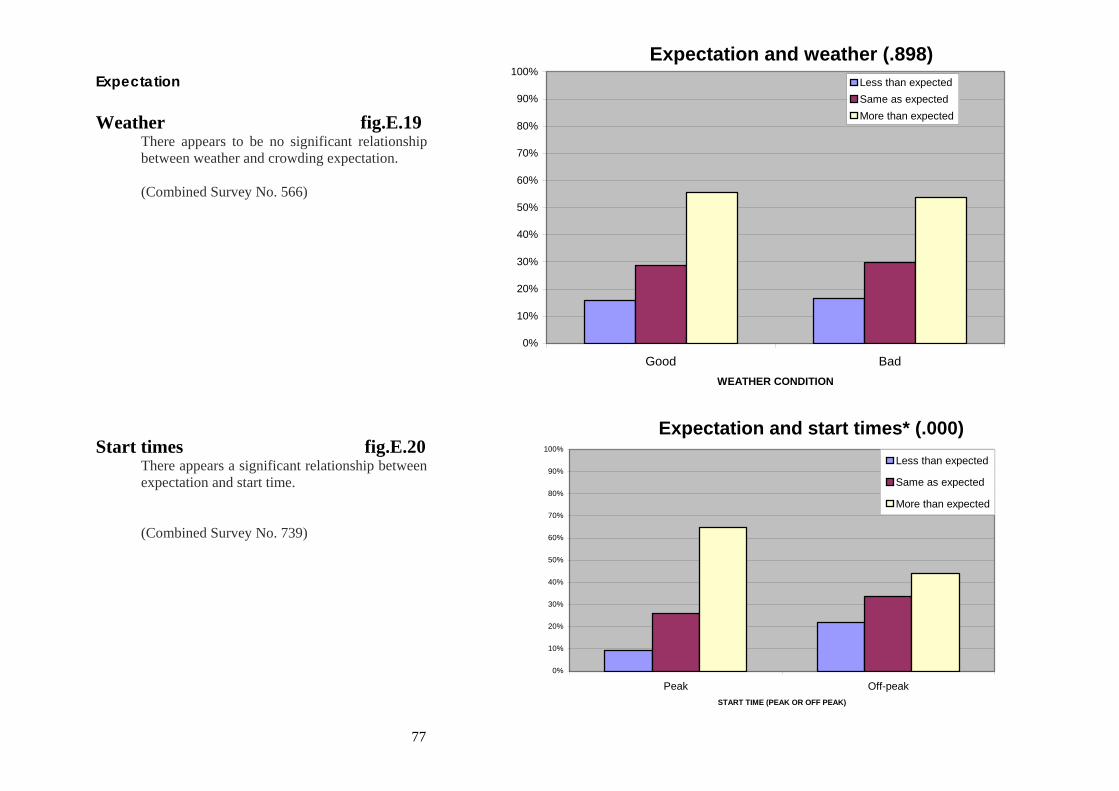
77
Expectation Weather fig.E.19
There appears to be no significant relationship between weather and crowding expectation. (Combined Survey No. 566)
Start times fig.E.20
There appears a significant relationship between expectation and start time. (Combined Survey No. 739)
Expectation and weather (.898)
0%
10%
20%
30%
40%
50%
60%
70%
80%
90%
100%
Good BadWEATHER CONDITION
Less than expectedSame as expectedMore than expected
Expectation and start times* (.000)
0%
10%
20%
30%
40%
50%
60%
70%
80%
90%
100%
Peak Off-peakSTART TIME (PEAK OR OFF PEAK)
Less than expected
Same as expected
More than expected
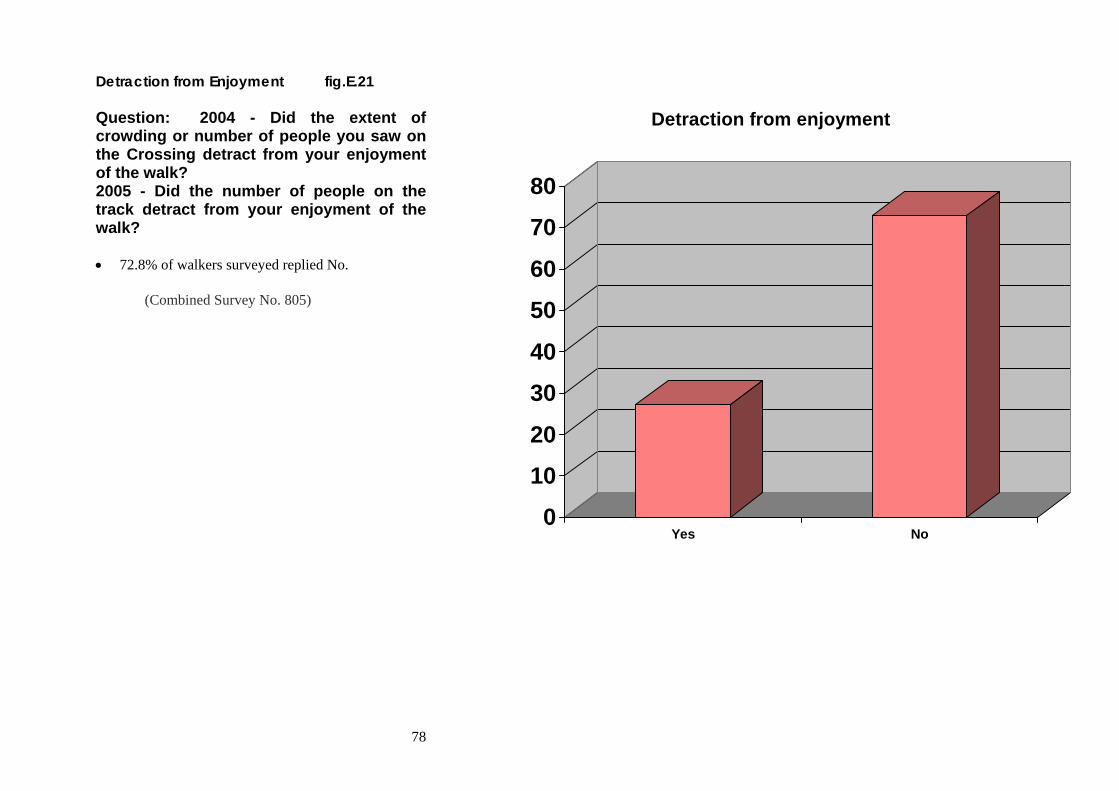
78
Detraction from Enjoyment fig.E.21 Question: 2004 - Did the extent of crowding or number of people you saw on the Crossing detract from your enjoyment of the walk? 2005 - Did the number of people on the track detract from your enjoyment of the walk? • 72.8% of walkers surveyed replied No.
(Combined Survey No. 805)
0
10
20
30
40
50
60
70
80
Yes No
Detraction from enjoyment
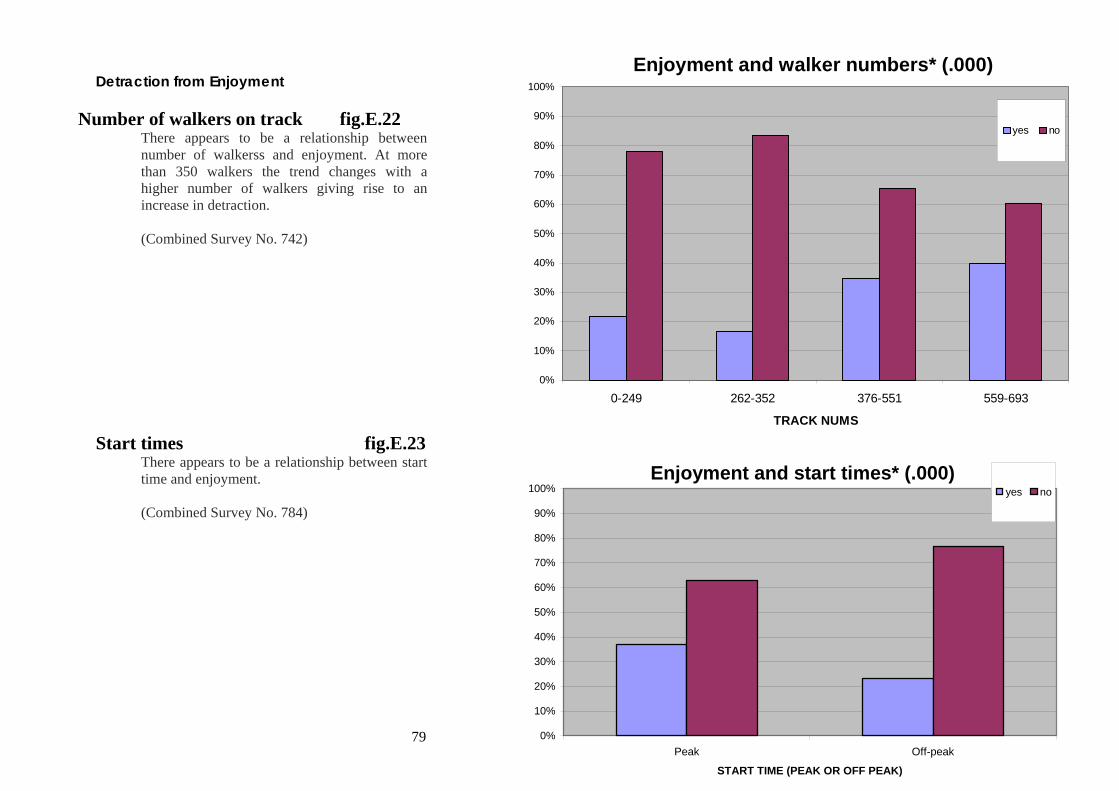
79
Detraction from Enjoyment
Number of walkers on track fig.E.22 There appears to be a relationship between number of walkerss and enjoyment. At more than 350 walkers the trend changes with a higher number of walkers giving rise to an increase in detraction.
(Combined Survey No. 742)
Start times fig.E.23
There appears to be a relationship between start time and enjoyment. (Combined Survey No. 784)
Enjoyment and walker numbers* (.000)
0%
10%
20%
30%
40%
50%
60%
70%
80%
90%
100%
0-249 262-352 376-551 559-693
TRACK NUMS
yes no
Enjoyment and start times* (.000)
0%
10%
20%
30%
40%
50%
60%
70%
80%
90%
100%
Peak Off-peak
START TIME (PEAK OR OFF PEAK)
yes no
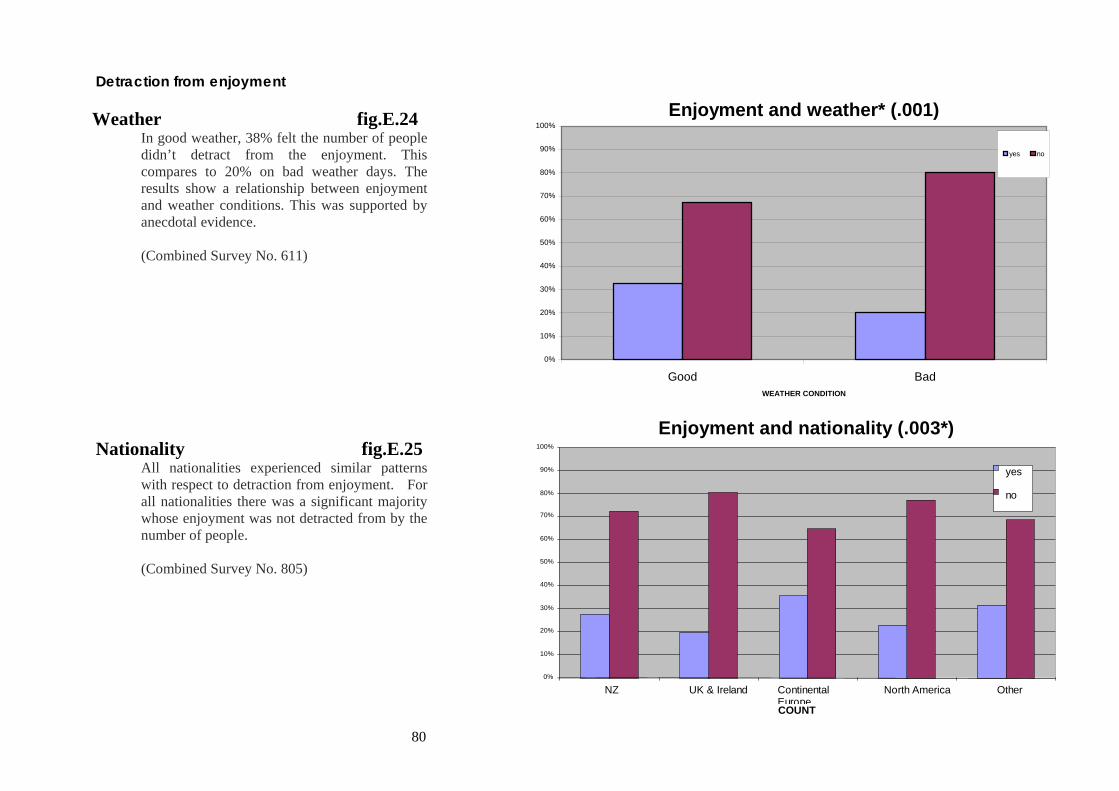
80
Detraction from enjoyment
Weather fig.E.24 In good weather, 38% felt the number of people didn’t detract from the enjoyment. This compares to 20% on bad weather days. The results show a relationship between enjoyment and weather conditions. This was supported by anecdotal evidence. (Combined Survey No. 611)
Nationality fig.E.25
All nationalities experienced similar patterns with respect to detraction from enjoyment. For all nationalities there was a significant majority whose enjoyment was not detracted from by the number of people. (Combined Survey No. 805)
Enjoyment and weather* (.001)
0%
10%
20%
30%
40%
50%
60%
70%
80%
90%
100%
Good BadWEATHER CONDITION
yes no
Enjoyment and nationality (.003*)
0%
10%
20%
30%
40%
50%
60%
70%
80%
90%
100%
NZ UK & Ireland Continental Europe
North America Other
COUNT
yes
no
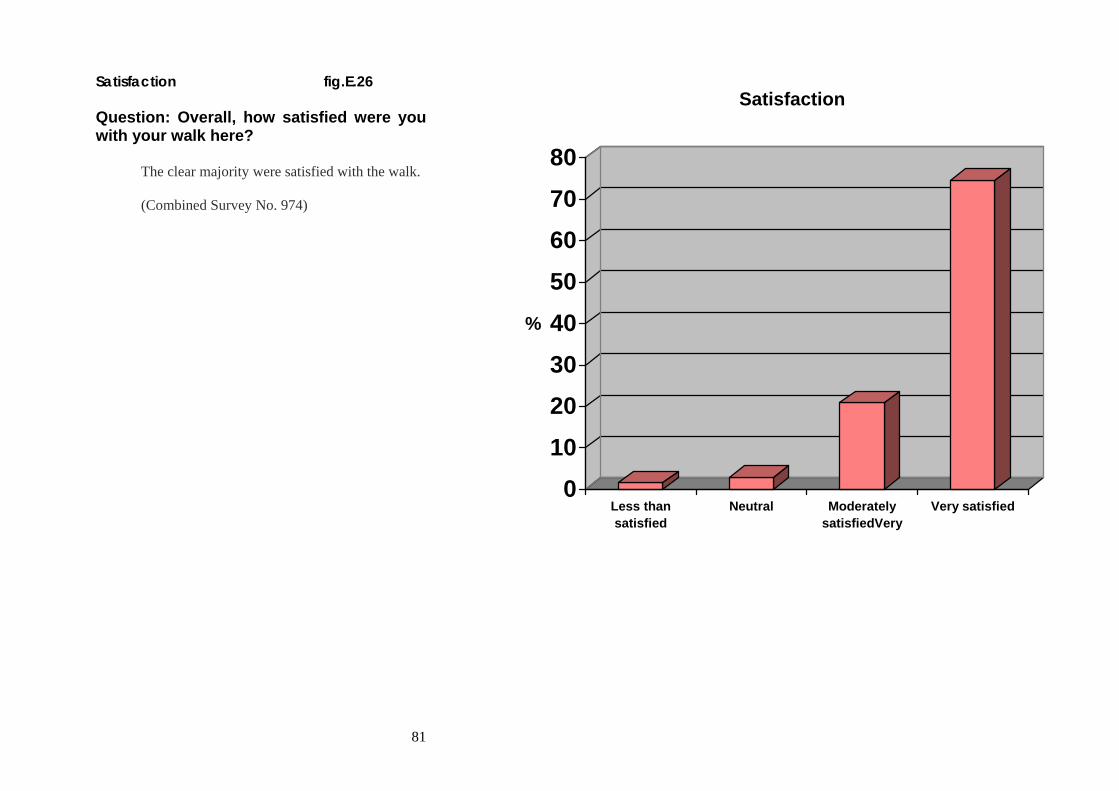
81
Satisfaction fig.E.26 Question: Overall, how satisfied were you with your walk here?
The clear majority were satisfied with the walk. (Combined Survey No. 974)
010
2030
40
50
6070
80
%
Less thansatisfied
Neutral ModeratelysatisfiedVery
Very satisfied
Satisfaction
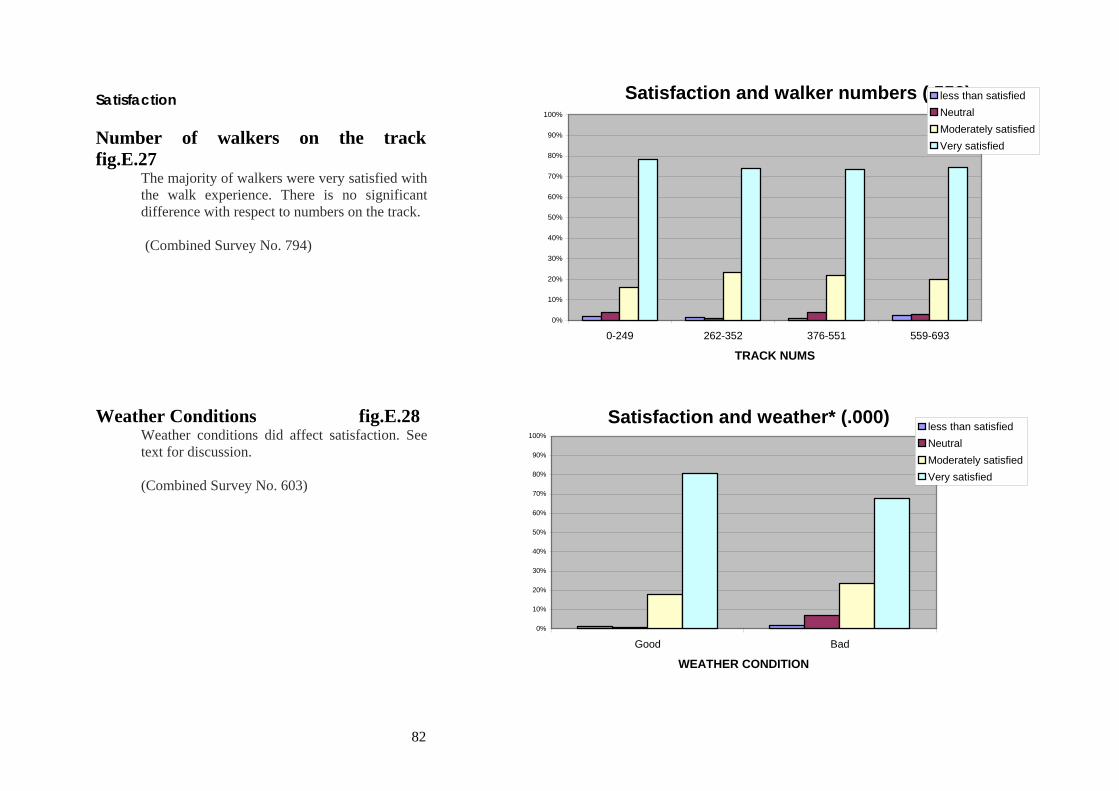
82
Satisfaction Number of walkers on the track fig.E.27
The majority of walkers were very satisfied with the walk experience. There is no significant difference with respect to numbers on the track.
(Combined Survey No. 794)
Weather Conditions fig.E.28
Weather conditions did affect satisfaction. See text for discussion. (Combined Survey No. 603)
Satisfaction and walker numbers (.552)
0%
10%
20%
30%
40%
50%
60%
70%
80%
90%
100%
0-249 262-352 376-551 559-693
TRACK NUMS
less than satisfiedNeutralModerately satisfiedVery satisfied
Satisfaction and weather* (.000)
0%
10%
20%
30%
40%
50%
60%
70%
80%
90%
100%
Good Bad
WEATHER CONDITION
less than satisfiedNeutralModerately satisfiedVery satisfied
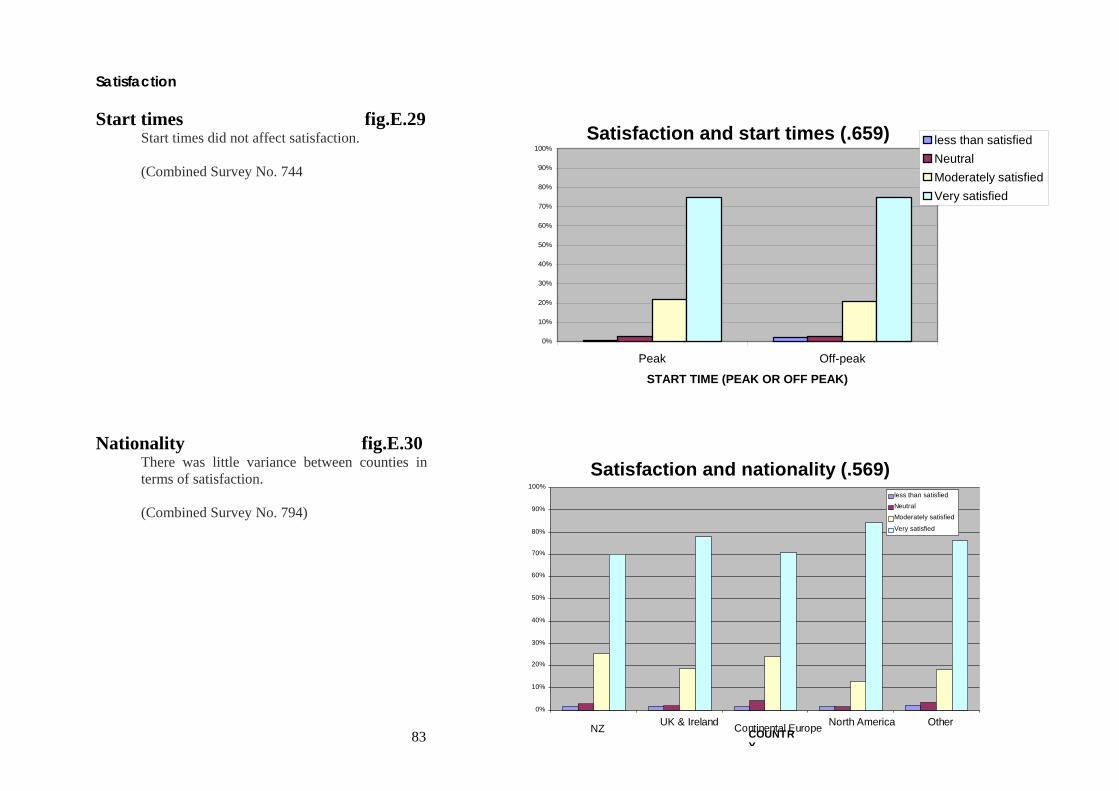
83
Satisfaction Start times fig.E.29
Start times did not affect satisfaction. (Combined Survey No. 744
Nationality fig.E.30 There was little variance between counties in terms of satisfaction. (Combined Survey No. 794)
Satisfaction and start times (.659)
0%
10%
20%
30%
40%
50%
60%
70%
80%
90%
100%
Peak Off-peak
START TIME (PEAK OR OFF PEAK)
less than satisfiedNeutralModerately satisfiedVery satisfied
Satisfaction and nationality (.569)
0%
10%
20%
30%
40%
50%
60%
70%
80%
90%
100%
NZ UK & Ireland Continental Europe North America Other COUNTRY
less than satisfiedNeutralModerately satisfied
Very satisfied
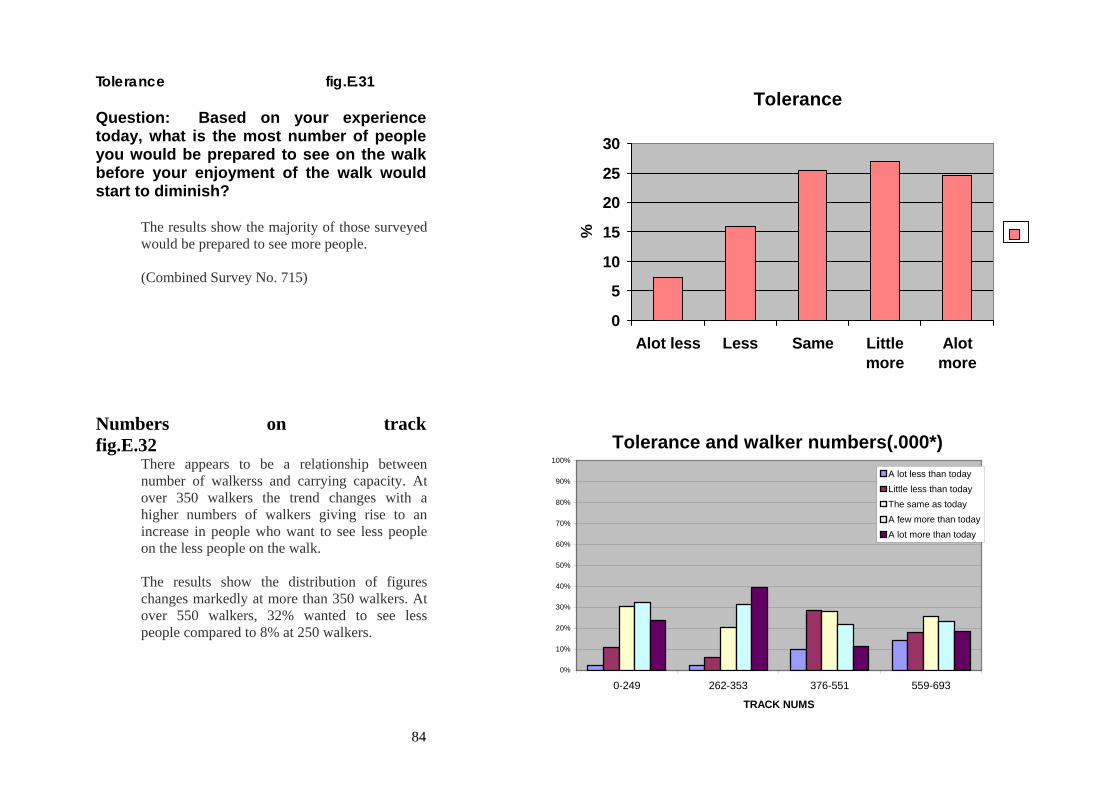
84
Tolerance fig.E.31 Question: Based on your experience today, what is the most number of people you would be prepared to see on the walk before your enjoyment of the walk would start to diminish?
The results show the majority of those surveyed would be prepared to see more people. (Combined Survey No. 715)
Numbers on track fig.E.32
There appears to be a relationship between number of walkerss and carrying capacity. At over 350 walkers the trend changes with a higher numbers of walkers giving rise to an increase in people who want to see less people on the less people on the walk. The results show the distribution of figures changes markedly at more than 350 walkers. At over 550 walkers, 32% wanted to see less people compared to 8% at 250 walkers.
Tolerance and walker numbers(.000*)
0%
10%
20%
30%
40%
50%
60%
70%
80%
90%
100%
0-249 262-353 376-551 559-693
TRACK NUMS
A lot less than todayLittle less than todayThe same as todayA few more than todayA lot more than today
Tolerance
0
5
10
15
20
25
30
Alot less Less Same Littlemore
Alotmore
%
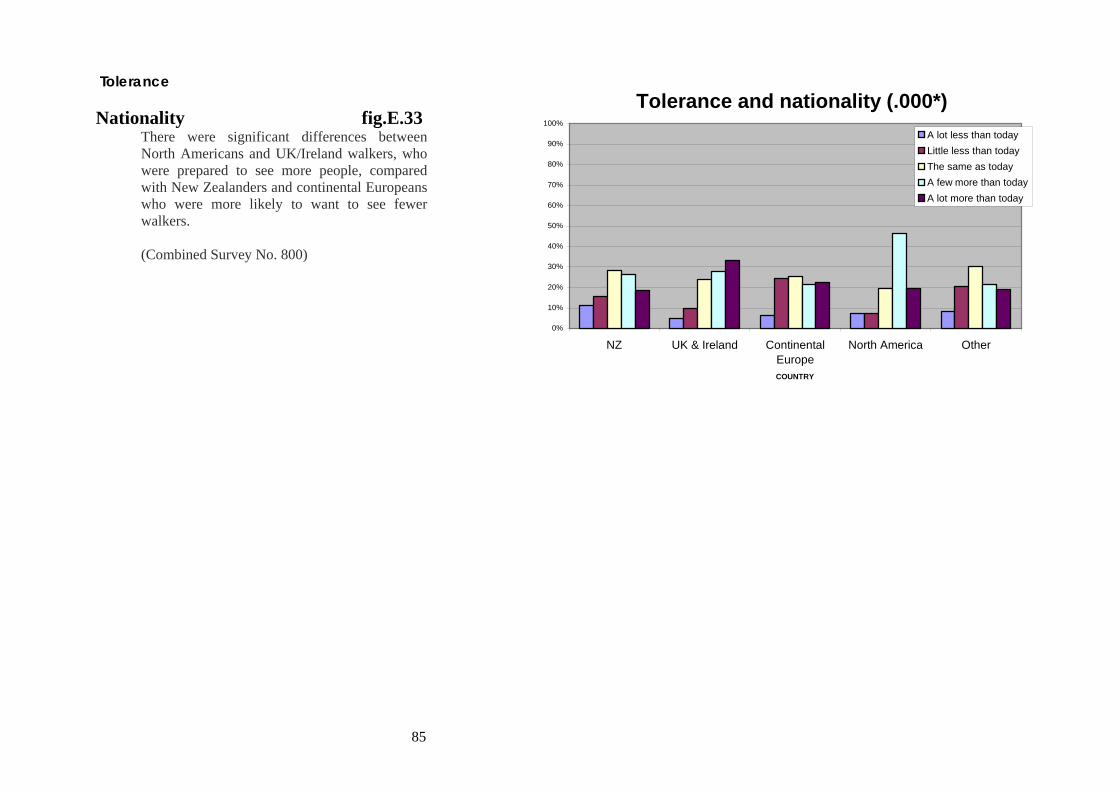
85
Tolerance Nationality fig.E.33
There were significant differences between North Americans and UK/Ireland walkers, who were prepared to see more people, compared with New Zealanders and continental Europeans who were more likely to want to see fewer walkers.
(Combined Survey No. 800)
Tolerance and nationality (.000*)
0%
10%
20%
30%
40%
50%
60%
70%
80%
90%
100%
NZ UK & Ireland ContinentalEurope
North America Other
COUNTRY
A lot less than todayLittle less than todayThe same as todayA few more than todayA lot more than today
86
Appendix F - Tongariro National Park Management Plan and Tongariro/Taupo Management Strategy
The two primary documents governing the park are the TNP Management Plan and the Tongariro/Taupo Conservation Management Strategy.
The Tongariro/Taupo Conservation Management Strategy sets out higher level conservation management goals and objectives and outlines the strategic priorities and key sites for biodiversity conservation and visitor access for a ten year period. The Tongariro National Park Management Plan provides more specific direction to managers.
The Tongariro /Taupo Conservation Management Strategy is a statutory document which implements general policies and establishes objectives for the integrated management of natural and historic resources. The current Tongariro Taupo Conservation Management Strategy was approved in May 2002. It involved extensive public consultation and, in particular, discussion with Maori to reach agreement on how the principles of the Treaty of Waitangi would be applied to the management of the Tongariro Taupo Conservancy. Key principles include the “Provision of recreation resources”. The next principle “Limiting Visitor Use” highlights the right of access. However it is then clarified that it is important not to degrade the visitor experience by overuse or by threatening natural or historic values. The explanation makes specific reference to the Tongariro Crossing and overcrowding.
Section 3.8 relates to Recreation Opportunities, Access and Facilities. The objectives relating to Visitor Access focus on the provision and encouragement of public access to land and resources, unless restrictions are necessary to protect natural or historic values or for safety reasons. Implementation method (h) provides that where natural and historic values are being adversely affected, management of visitor access using techniques such as limiting numbers of visitors or one-way tracks will be considered. It is noted that there is no reference to controlling numbers for social reasons in relation to visitor access.
The Strategy contains a specific policy in relation to Non-Commercial Organised Club or Group Activities. The objective is to Allow use of land administered by the Department for non-commercial organised club or group use consistent with the protection of natural and historic values and the use and enjoyment of the area by other visitors. Implementation method (b) provides that the Department may apply restrictions by way of maximum numbers of people, timing of visits, and locations visited, in order to manage pressure on high use facilities by the use of by-laws and regulations.
87
Provision 3.8.4 relates to Visitor facilities provided by the Department. Such facilities include tracks. One of the objectives provides: To ensure that existing facilities both enhance visitor experiences and minimise visitor impacts. Implementation method (h) provides that at high use facilities where physical, environmental and/or social impacts are escalating the Department may implement management techniques to control or limit use in order to ensure that impacts on natural or historic vales and effects on the enjoyment of visitors are minimised. The Tongariro/Taupo Conservation Board will be asked to give guidance to the Department on introducing such regulatory systems at the appropriate time. This implementation method makes clear reference to social impacts and the provision of techniques to limit use to address the issue.
The current revised Tongariro Park Management Plan is the fourth for TNP. There has been a long history of facilitating recreation and tourism at Mt Ruapehu, starting with the first Park Board (forerunner of the Tongariro-Taupo Conservation Board) constituted in 1922 and the construction of the Chateau in 1929, and continuing right up to the calling of tenders to develop a new skifield (Turoa) on the southern slopes of the mountain in the mid 1970s. Between the mid 1950s and mid 1970s there was a period of major development around the skifields. Since then there has been a change to a much more preservationist philosophy, as expressed in the National Parks Act 1980. The four Management Plans have shown the change in park management philosophy and evolution of attitudes. The previous Management Plan (1990) in particular changed the course of national park management from development to protection.
The new (2007) TNP Management Plan contains a number of objectives and policies relevant to the management of the Tongariro Crossing. Objectives relate to protecting and enhancing the natural, cultural and historical values of the Crossing, and to the quality of visitor experience on the Crossing. Overall, there are strong policies for maintaining public access to and within the park, including Tongariro Crossing. However, there is also specific recognition that there is a carrying capacity (social, ecological and physical) within the park and on the Crossing, and once this level is reached, appropriate actions should be taken. The department will monitor visitor numbers and impacts, and will identify the carrying capacity of the Tongariro Crossing. If visitor numbers become necessary to achieve the identified objectives, the department will impose controls to manage visitor flows, impacts and/or numbers.