Embed Size (px)
Citation preview
Journal of Atmospheric and Solar-Terrestrial Physics 64 (2002) 2003–2011www.elsevier.com/locate/jastp
Tomographic imaging of the ionosphere using the GPS/METand NNSS data
L.-C. Tsaia;b;∗, C.H. Liub, W.H. Tsaib, C.T. LiubaCenter for Space and Remote Sensing Research, National Central University, 320 Chung-Li, Taiwan, ROC
bInstitute of Space Science, National Central University, Chung-Li, Taiwan, ROC
Received 30 July 2001; received in revised form 17 April 2002; accepted 5 July 2002
Abstract
The earlier experiments of ionospheric tomography were conducted by receiving satellite signals from ground-based stationsand then reconstructing electron density distribution from measures of the total electron content (TEC). In June 1994, NationalCentral University built up the low-latitude ionospheric tomography network (LITN) including six ground stations spanninga range of 16:7◦ (from 14:6◦N to 31:3◦N) in latitude within 1◦ of 121◦E longitude to receive the naval navigation satellitesystem (NNSS) signals (150 and 400 MHz). In the study of tomographic imaging of the ionosphere, TEC data from anetwork of ground-based stations can provide detailed information on the horizontal structure, but are of restricted utilityin sensing vertical structure. However, an occultation observation mission termed the global positioning system/meteorology(GPS/MET) program used a low Earth orbiting (LEO) satellite (the MicroLab-1) to receive multi-channel GPS carrier phasesignals (1.5 and 1:2 GHz) and demonstrate active limb sounding of the Earth’s atmosphere and ionosphere. In this paper, wehave implemented the multiplicative algebraic reconstruction technique (MART) to reconstruct and compare two-dimensionalionospheric structures from measured TECs through the receptions of the GPS signals, the NNSS signals, and/or both of thesystems. We have also concluded the pro>les retrieved from tomographic reconstruction showing much reasonable electrondensity results than the original vertical pro>les retrieved by the Abel transformation and being in more agreement in peakelectron density to nearby ionosonde measurements.c© 2002 Elsevier Science Ltd. All rights reserved.
Keywords: Ionospheric tomography; Total electron content (TEC); The multiplicative algebraic reconstruction technique (MART); GPSoccultation; NNSS
1. Introduction
Tomography has been applied to many di?erent >elds(e.g., see Lee and Wade, 1985). Its application to iono-spheric research was >rst proposed by Austen et al. (1986)to image the electron density distribution in the iono-sphere. From the earlier studies (Austen et al., 1988; Huanget al., 1999; Raymund et al., 1990, 1994; Sutton and Na,1995) computerized ionospheric tomography (CIT) can
∗ Corresponding author. Center for Space and Remote SensingResearch, National Central University, 320 Chung-Li, Taiwan.Tel.: +886-3-4227151; fax: +886-3-4254908.
E-mail address: [email protected] (L.-C. Tsai).
provide information of electron density distribution belowand above the F2 peak over large geographic coverage andbe suitable for investigations of ionospheric structures ofhorizontal scales of several hundred kilometers or larger.In these studies of CIT, total electron content (TEC) datafrom a network of ground-based receiving stations to lowEarth orbiting (LEO) satellites or the global positioningsystem (GPS) satellites can provide detailed informationon the horizontal structure, but are of extremely restrictedutility in sensing vertical structure. In 1993 the UniversityCorporation for Atmospheric Research (UCAR) organizeda proof-of-concept experiment on a LEO satellite (theMicroLab-1 satellite) at a nearly circular orbit of ∼735 kmaltitude and ∼70◦ inclination angle to receive GPS signals
1364-6826/02/$ - see front matter c© 2002 Elsevier Science Ltd. All rights reserved.PII: S1364 -6826(02)00218 -3
2004 L.-C. Tsai et al. / Journal of Atmospheric and Solar-Terrestrial Physics 64 (2002) 2003–2011
Earth
Ionosphere
rt a
LEO (P1)GPS LEO (P2)
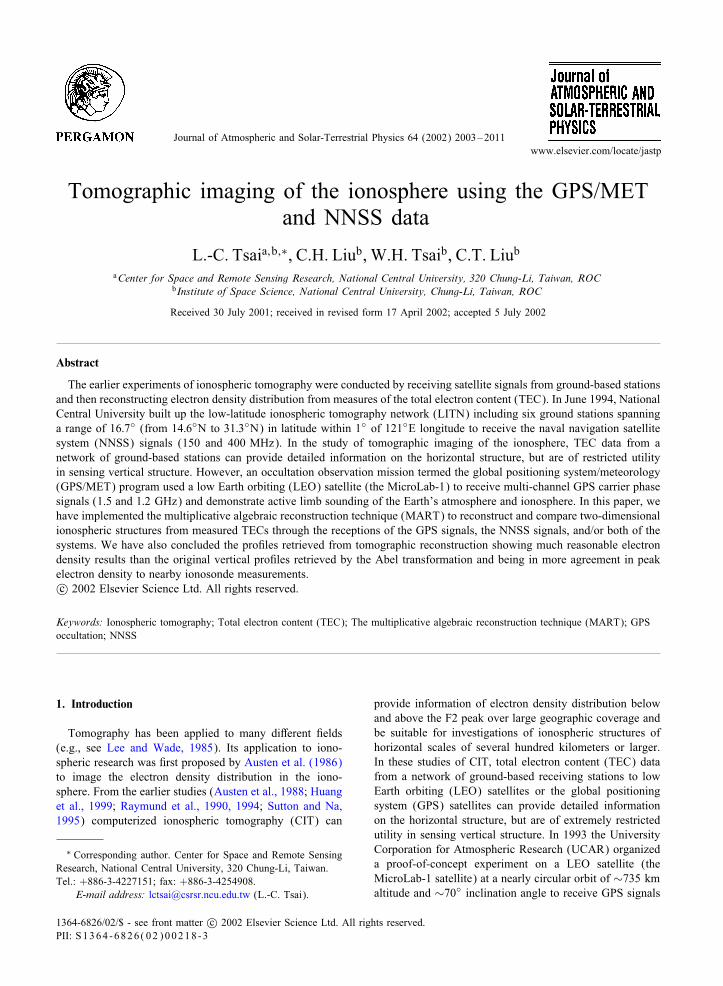
Fig. 1. Illustration of the geometry of the GPS-LEO occultationproblem for ionosphere observations, where P1 is an occulting LEOpoint, P2 is an auxiliary LEO point with the same impact distanceof P1, � is the bending angle, rt is the ray’s tangent radius, and ais the impact parameter.
and demonstrate active limb sounding of the Earth’s atmo-sphere and ionosphere by radio occultation technique. Asa LEO satellite passed behind the Earth, the radio pathsof the signals would be systematically refracted by thevertical gradient of atmospheric refractivity as shown inFig. 1; then the Doppler shifted signals are used to esti-mate atmospheric properties. The main objectives of thisGPS-LEO occultation mission were numerical weatherprediction and long-term monitoring of the Earth’s climateand thus it was termed the GPS/meteorology (GPS/MET)program (Zou, et. al, 1995; Ware, et al., 1996; Kursinskiet al., 1997). GPS/MET has also been able to sound theionosphere from the orbit altitude to the Earth’s surfaceand provide high-resolution pro>les of ionospheric electrondensity. These retrieval processes generally assume spheri-cal symmetry of refractivity at the locality of occultationsand use the Abel integral transform to invert the data. It isobvious that this assumption of spherical symmetry in theionosphere is almost never true. There are several works toexamine and estimate the accuracy of retrieved GPS/METelectron density pro>les obtained with the Abel inversionby comparing them with vertical ionosonde data (Hajj andRomans, 1998; Schreiner et al., 1999; Tsai et al., 2001). Tsaiet al. (2001) further pointed that due to the e?ect of thespherical symmetry assumption utilized for the Abel in-version, even an asymmetry at the equatorial anomalywould likely cause the Abel inversion to systematicallyunder-estimate the electron density near the peak.
In this paper, we propose to regularize the inverse prob-lem of TEC data associated with computerized ionospherictomography using the GPS/MET and NNSS data. Under theassumption of straight-line propagation but without the as-sumption of local spherical symmetry for the Abel transfor-mation, the measured TECs between occultating points andequivalent “calibrated” points on the LEO satellite orbit havebe derived and used for tomographic reconstruction of theionosphere. Given the availability of GPS/MET occultationand NNSS data for that same period of observation time,we have now evaluated the performance of derived iono-
spheric stochastic tomography by ground-based ionosonderesults and comparing the determined electron density ver-tical pro>les from the MART algorithm and the Abel in-version method. Early examples of tomographic reconstruc-tion from GPS/MET data are given by Rius et al. (1997,1998). In their works, three spatial and one temporal dimen-sional global maps of ionospheric electron density with highvertical (1–2 km) and horizontal (200–500 km) resolutionwill become available for the >rst time. Hajj et al. (2000)presents some tomographic images of the ionosphere usingGPS/MET data. Leitinger et al. (1997) also provided sev-eral possible data scenarios with combinations of satelliteoccultation reception of global navigation satellite system(GNSS) signals and ground reception of Navy NavigationSatellite System signals and some simulation results.
2. GPS-LEO radio occultation observation for TECmeasurements
An occultation takes place when the GPS satellite setsor rises behind the Earth’s ionosphere or lower neutral at-mosphere as seen by a receiver in LEO. Each occultationtherefore consists of a set of links with tangent points rang-ing from the LEO satellite height to the surface of the Earth.As shown in Fig. 1 of a GPS-LEO geometrical optics ap-proximation, a ray passing through the ionosphere and theneutral atmosphere is refracted according to Snell’s law dueto the vertical gradient of refractive index. In the case of adescending or setting occultation, bending angle decreasesfrom zero to a maximum negative value at near the F2 peak,and then increases to a positive value when the ray propa-gates through the lower atmosphere. The overall e?ect of therefractive index changes can be used to extract informationsuch as pro>les of electron density in the ionosphere, or tem-perature, pressure and water vapor in the lower neutral at-mosphere. Actually, even during the daytime and near solarmaximum, the absolute magnitude of the bending angle doesnot exceed 0:016◦ and 0:026◦ for L1 (1:57542 GHz) andL2 (1:22760 GHz) GPS frequencies, respectively, in the Fregion (Hajj and Romans, 1998; Schreiner et al., 1999). Theray separation from straight-line propagation can be simplyestimated: Kh∼� (in rad) LR, where LR is the distance be-tween tangent point and the MicroLab-1 satellite positionand is about 3100 km for an usual occultation observation.This estimation shows that the height error for a straight-linepropagation is normally less than 1:5 km, which is about theFresnel zone size. In this study, we thus use the assumptionof straight-line propagation to simplify the correspondingradio ray geometry problem for CIT inversion.
In this paper, the GPS/MET TEC values or the cor-responding ionospheric delay are derived from signalphase measurements, which can approach 0:01 TECUwhen anti-spoo>ng (AS) is o? or with enhanced code-less GPS receivers. Actually, the GPS receiver onMicroLab-1 can also detect pseudorange (derived from
L.-C. Tsai et al. / Journal of Atmospheric and Solar-Terrestrial Physics 64 (2002) 2003–2011 2005
coded group delay of transmitter and receiver clockso?sets), but the determined TECs have a code bias of1–3 TECU (1 TECU = 1016 e=m3). Formally, phase mea-surements in units of distance (or excess phase) can bemodeled as
Si =− cfi
i = mi�i + �+ �i + 40:3TECi
f2i
+CT + CR + �i; (1)
where i = 1 or 2 for L1 or L2 frequencies, respectively; is the recorded phases in cycles; c is the light speed in freespace;m is an integer which is constant over a connected arc;� is the operating wavelength; � is the true range betweenGPS and LEO; � is the extra delay due to the lower neu-tral atmosphere; TEC is the total electron content betweenGPS and LEO; CT and CR are transmitter and receiver clockerrors, respectively, and � is the phase measurement noise.Because bending angles at two GPS frequencies are negli-gible in this study, i.e. assuming straight-line propagation isvalid, the derived TEC is thus the same whether calculatedfrom either S1 or S2, or from S1 − S2. Therefore, TEC alonga ray is related to electron density ne, index of refraction n,and the excess phase S1 or S2 at either the L1 or L2 GPScarrier frequencies, respectively, and is given as
TEC =∫
ne dl=− f2
40:3
∫(n− 1) dl=−f2
1S140:3
=−f22S2
40:3=
(S1 − S2)f21f
22
40:3(f21 − f2
2); (2)
where TEC is in e=m2, and S1 and S2 are in meters. In thisstudy, the limb TEC values are derived by dual frequencyexcess phases; the excess phases were obtained from 0:1 HzGPS carrier phase change data but interpolated to 300 valuesfrom top to bottom of occultation using a cubic spline >t.It is noted that GPS is a one-way and code-based observingsystem and thus reveals orbit and clock errors in the carrierphase measurements. The use of dual GPS frequencies forTEC calculation can automatically remove both orbit and
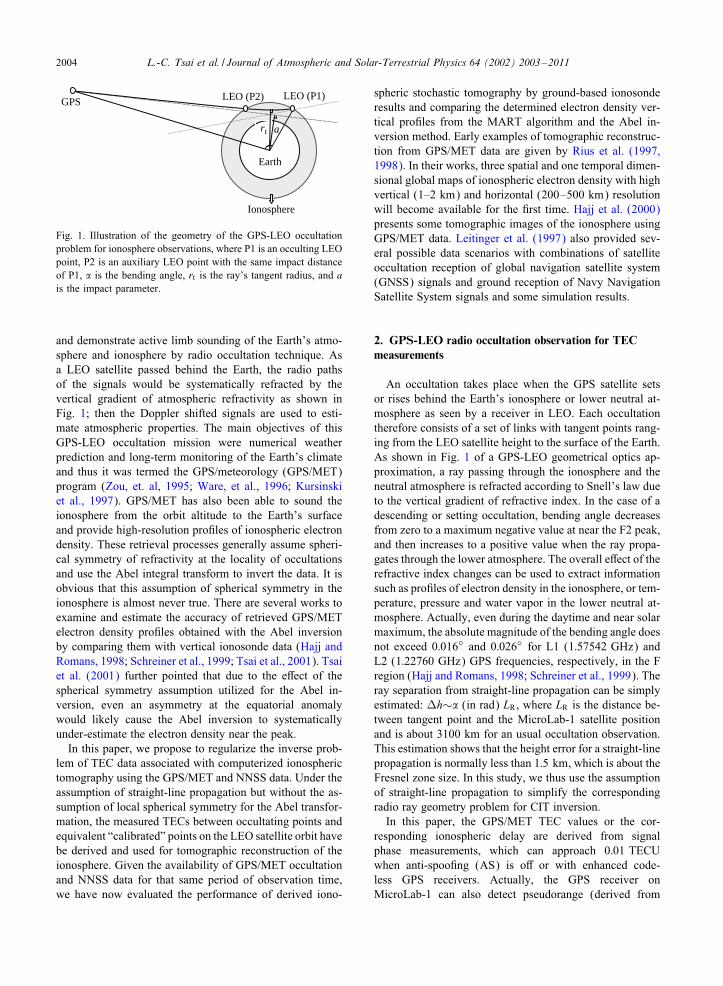
Fig. 2. Vertical cross section depicting scanning of radio rays as one naval navigation satellite system (NNSS) satellite passes overhead ofsix receiving stations in LITN on the ground.
clock errors and allow TEC determination to be performedin near real time. To focus the study of ionospheric regionto be below the LEO height and remove the parts of TECabove the LEO height along GPS-LEO links, we further as-sume that the ionosphere distribution above the LEO heightis static and locally spherical symmetry over the durationof an occultation. We can thus determine the path TEC be-tween an occulting LEO position and another “calibrated”position having the same LEO height along a “straight” ra-dio ray to be the TEC di?erence obtained from the origi-nal occulting LEO position and another auxiliary LEO posi-tion (at the other side of an occultation observation) havingthe same impact distance as illustrated as the P1 and P2 inFig. 1. Under the assumption of straight-line propagation,in each occultation observation a set of path TECs betweenoccultating points and equivalent calibrated points can bedetermined and used for tomographic reconstruction of theionosphere region below the LEO height as follows.
3. TEC measurements from the low-latitude ionospherictomography network (LITN)
The LITN is an ionospheric tomography network alongTaiwan meridian, which consists of a chain of six navalnavigation satellite system (NNSS) ground-based receivingstations with data acquisition systems, has been developedby the National Central University and the University ofIllinois at Urbana Champaign since 1994. The six receivingstations are, from south to north, Manila (121:0◦E; 14:6◦N),Baguio (120:5◦E, 16:4◦N), Kaohsiung (121:0◦E; 22:5◦N),Chungli (120:6◦E; 25:0◦N), Wenzhou (120:6◦E; 28:0◦N),and Shanghai (121:5◦E; 31:3◦N). As depicted in Fig. 2,the geographic locations of the six stations span a rangeof 16:7◦ (from 14:6◦N to 31:3◦N) in latitude within 1◦
of 121◦E longitude or a distance of more than 1800 kmalong the surface of the Earth. Geomagnetically, the visibleregion extends from 25◦ in the north to just south of themagnetic equator in the south, with the northern equatorial
2006 L.-C. Tsai et al. / Journal of Atmospheric and Solar-Terrestrial Physics 64 (2002) 2003–2011
anomaly region completely nested inside. The LITN is thusspeci>cally designed to observe large-scale ionosphericstructures over the northern equatorial region by applyingtomographic imaging techniques to TEC measurementsfrom the NNSS satellite beacon. Each station in LITNcan receive both the 400 and 150 MHz signals transmittedfrom NNSS and derive � which is de>ned by the phasedi?erence between 150 MHz signal phase divided by 3and the 400 MHz signal phase divided by 8. The TECalong the ray path can then be deduced as a linear func-tion of the determined phase di?erence � (Leitinger et al.,1975):
TEC =∫
ne dl= 6:2× 10¹⁴(� + 0); (3)
where ne is the electron density in el=m3, and 0 is the un-known initial phase for a given receiver. In this study, 1 Hzphase di?erence data has been used to determine slant TECvalues. Meanwhile, to determine 0 and obtain the abso-lutely slant TEC values, we use a modi>ed two-station pro-cedure here (Huang et al., 1997), which is initially proposedby Leitinger et al. (1975) but assumes the correspondingvertical TEC values to be distributed as the IRI-90 modelalong the sited station latitudes. The modi>ed two-stationprocedure then uses the least-squares method to minimizethe measured phase errors from more than one receivingstations and determine 0 at each ground-based receiverin LITN.
4. The MART algorithm for tomographic reconstruction
To facilitate digital computations for ionospheric tomog-raphy, we >rst discretize the reconstruction plane, i.e. theMicroLab-1 orbital plane at ∼70◦ inclination, into pixels.It is noted that, in the GPS/MET mission, the GPS-to-LEOrays deviate less than 45◦ out of the MicroLab-1 orbit planeand only about 250 rising occultations per day have been col-lected. Meanwhile, the NNSS satellites have di?erent orbitsto the MicroLab-1 and the LITN is a ground-based receivingnetwork system; the NNSS-to-LITN rays have certain devia-tions from the MicroLab-1 orbital plane in usual. Therefore,we have to assume a certain extent of the pixels (perpendic-ular to the reconstruction plane) to be “three-dimensional”pixels or cells. With the straight-line propagation assump-tion, the line integrals of electron density represent TEC val-ues from several GPS-LEO occultations and NNSS-LITNobservations. The problem is thus expressed as an algebraicequation in matrix form:
Y = AX + E; (4)
where Y is a column of p measurements for TEC, X isa column of q electron density unknowns for cells in thetargeted ionosphere region and is assumed to be constantinside each cell, A is an p × q observation matrix with aji
being the link length of the observation j that lies in cell i,and E represents TEC measurement errors.
The tomography inverse problem as described is in gen-eral under-determined. Raymund (1994) reviewed CIT re-construction algorithms proposed by various investigators.One of the most commonly used approaches is the algebraicreconstruction technique (ART) >rst introduced in CIT byAusten et al. (1988). This is an iterative procedure for solv-ing a linear equation system. A modi>ed version of ART isthe so-called the multiplicative ART (MART) in which thecorrection in each iteration is obtained by making a multi-plicative modi>cation to X rather than an additive correc-tion (Raymund et al., 1990). MART has an advantage overART to determine electron densities to avoid unreasonablenegative values and has been used in this paper. Basically,the MART algorithm is taken up cyclically also and can beimplemented as the following equation:
xk+1j =
(yi
〈ai; xk〉)�k a
ij
· xkj ; j = 1; 2; : : : ; q; (5)
where yi is the ith observed TEC in a column of p mea-surements, xj is the jth resulted cell electron density in acolumn of q unknowns, ai
j being the length of link i that liesin cell j, and the inner product of the vectors X and ai isthus the simulated TEC for the ith path. Furthermore, �k arerelaxation parameters at the kth iteration and 0¡�k ¡ 1.The electron density matrix X is therefore corrected in it-eration by a ratio of the measured TEC and the simulatedTEC with a relaxation parameter of �. In this study, the to-mography geometry for the MART algorithm is built at acell resolution of 0:25◦ in latitude and 10 km in altitude onthe corresponding LEO satellite (the MicroLab-1 satellite)orbital plane. It is noted that any iterative algorithm requiresan initial condition before iteration begins. Because limitedoccultation observations and only a few ground receiversover a limited range of zenith angles are available in a re-alistic experiment, such data are necessarily incomplete forthe tomography inverse problem. The poor geometry makesthat the initialization could represent what the reconstruc-tion might look like. In practice, the closer the initial condi-tion is to the true electron density distribution, the more ac-curate reconstruction will be. Early studies of tomographicreconstruction use artifacts or IRI-90 models to be an initialguess (Raymund et al., 1994; Huang et al., 1997). However,in the GPS/MET mission ∼17 occultation observations canbe recorded during one revolution of the MicroLab-1 satel-lite round the Earth, and ∼85% of observations, i.e. ∼15occultation observations, can successfully retrieve verticalelectron density pro>le through the Abel transformation. Areally analyzed two-dimensional electron density distribu-tion can thus be deduced as an excellent initial approxima-tion through relaxation using red–black smoothing, makingone pass through the mesh updating the “red” cells (like thered squares of a checkerboard) and another pass updatingthe “black” cells (like the black squares). Actually, the ver-
L.-C. Tsai et al. / Journal of Atmospheric and Solar-Terrestrial Physics 64 (2002) 2003–2011 2007
tical electron density pro>les derived by the Abel inversionapproach have been examined by comparing the determinedfo F2 and hmF2 values with vertical ionosonde data (Hajjand Romans, 1998; Schreiner et al., 1999; Tsai et al., 2001).Hajj et al. (2000) also performed a more extensive compar-ison of 4411 occultations and a 45-ionosonde network databetween April 1995 and February 1997 and concluded thatthe fractional di?erences in fo F2 agree at a 13% rms levelfor correlative data. Such initial approximation of red–blacksmoothing on the Abel inversion derived pro>les can be bet-ter in usual when more occultation observations are recordedand used. We then continue by calculating both of the “sim-ulated” path TECs within the determined pre-cycle electrondensity image and the measured path TECs during severalGPS-LEO occultations and NNSS-LITN observations.
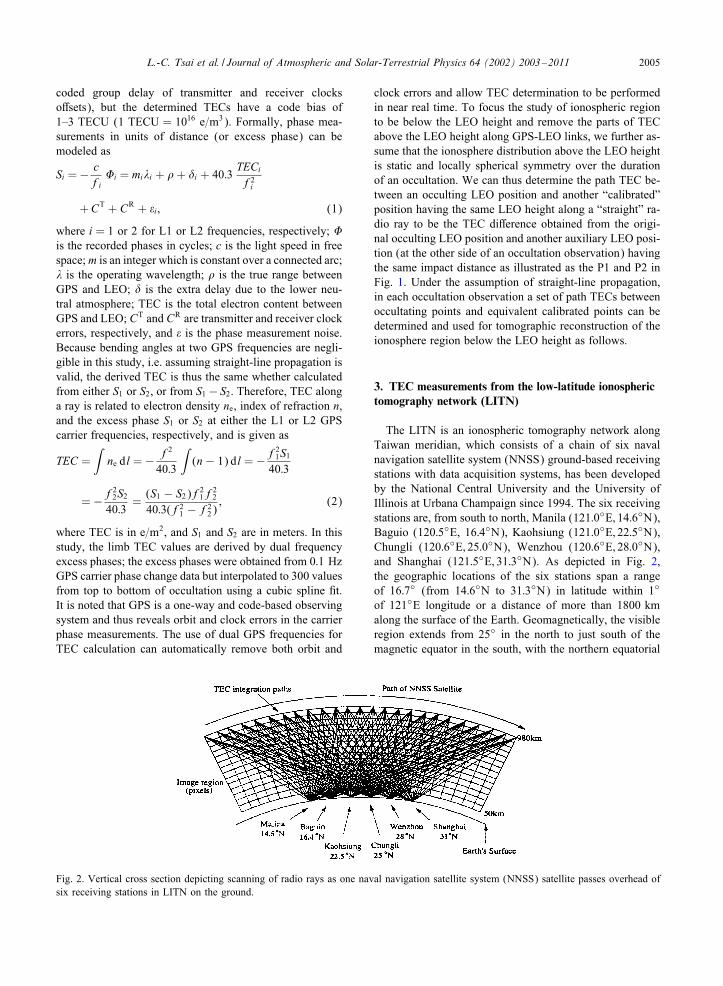
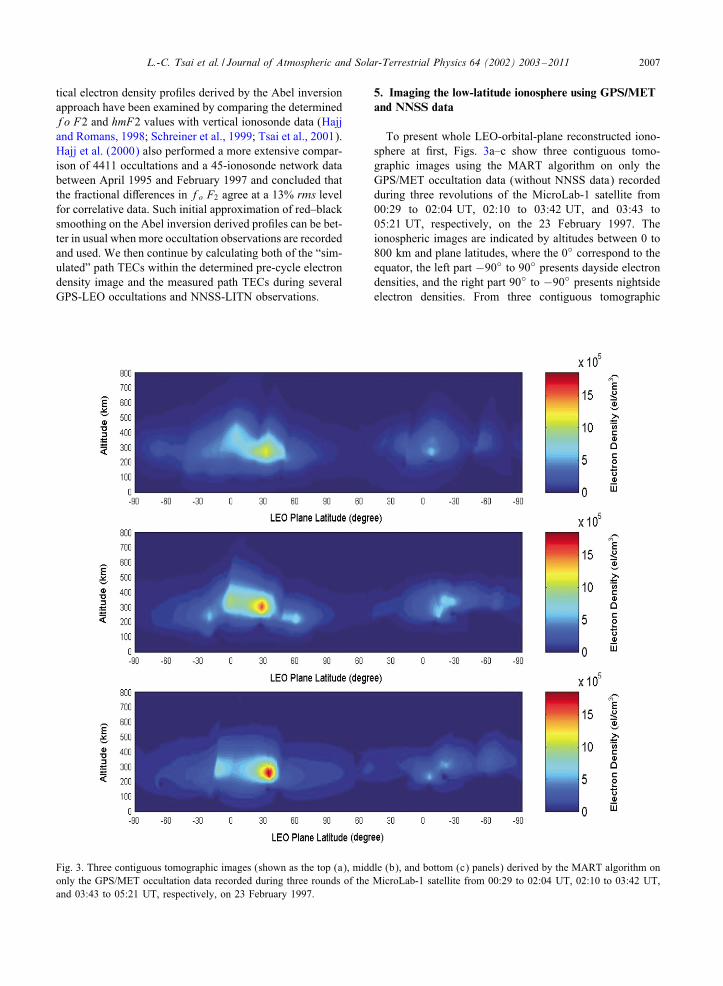
Fig. 3. Three contiguous tomographic images (shown as the top (a), middle (b), and bottom (c) panels) derived by the MART algorithm ononly the GPS/MET occultation data recorded during three rounds of the MicroLab-1 satellite from 00:29 to 02:04 UT, 02:10 to 03:42 UT,and 03:43 to 05:21 UT, respectively, on 23 February 1997.
5. Imaging the low-latitude ionosphere using GPS/METand NNSS data
To present whole LEO-orbital-plane reconstructed iono-sphere at >rst, Figs. 3a–c show three contiguous tomo-graphic images using the MART algorithm on only theGPS/MET occultation data (without NNSS data) recordedduring three revolutions of the MicroLab-1 satellite from00:29 to 02:04 UT, 02:10 to 03:42 UT, and 03:43 to05:21 UT, respectively, on the 23 February 1997. Theionospheric images are indicated by altitudes between 0 to800 km and plane latitudes, where the 0◦ correspond to theequator, the left part −90◦ to 90◦ presents dayside electrondensities, and the right part 90◦ to −90◦ presents nightsideelectron densities. From three contiguous tomographic
2008 L.-C. Tsai et al. / Journal of Atmospheric and Solar-Terrestrial Physics 64 (2002) 2003–2011
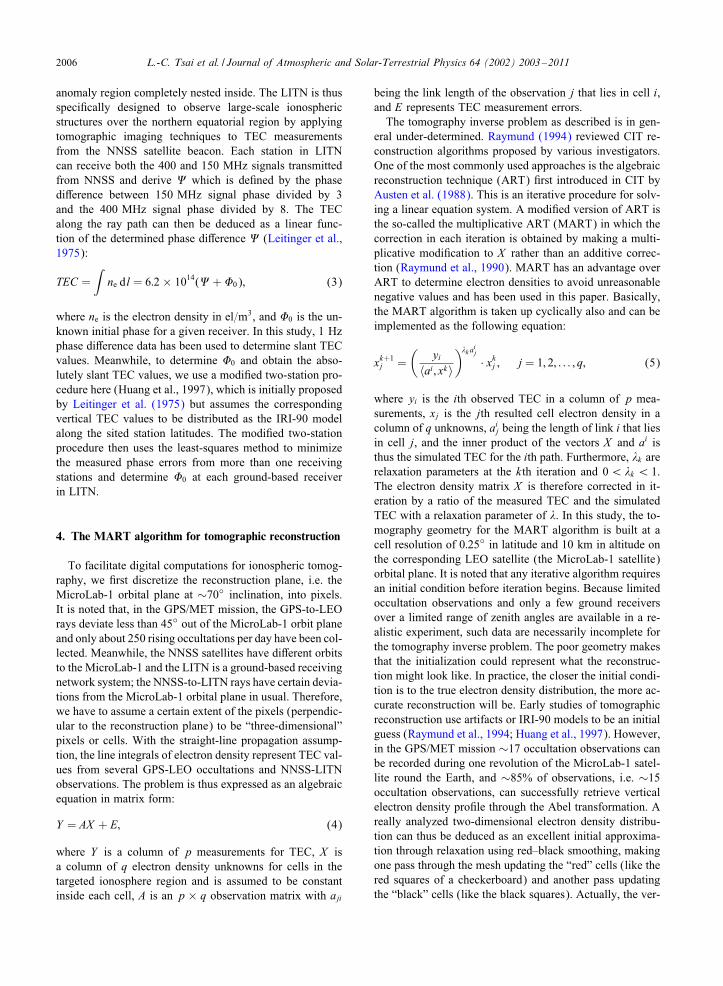
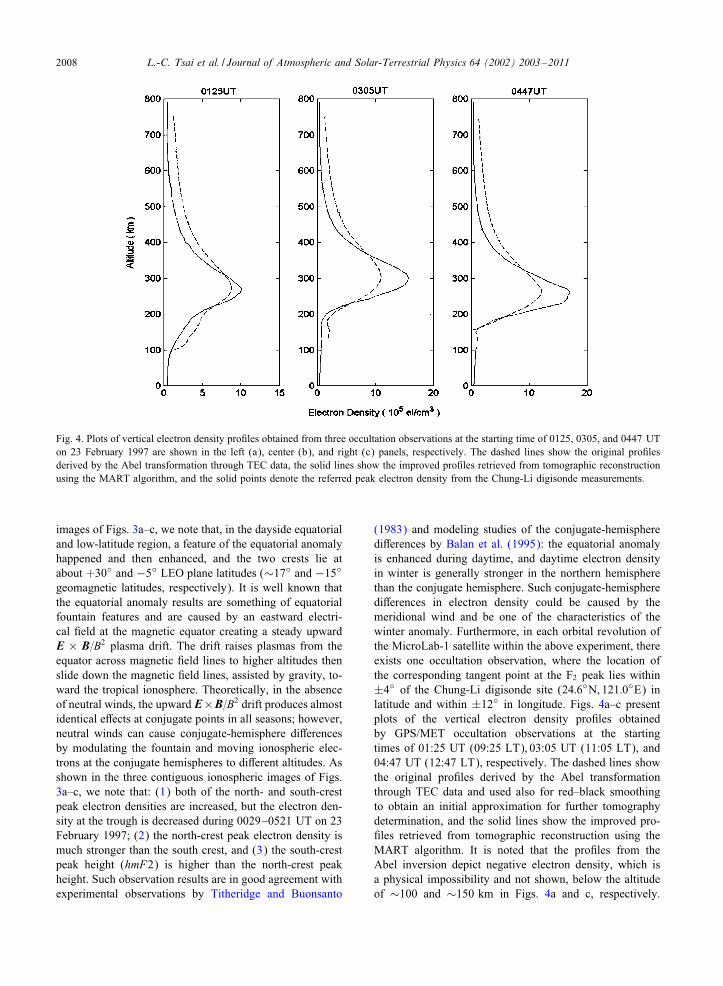
Fig. 4. Plots of vertical electron density pro>les obtained from three occultation observations at the starting time of 0125, 0305, and 0447 UTon 23 February 1997 are shown in the left (a), center (b), and right (c) panels, respectively. The dashed lines show the original pro>lesderived by the Abel transformation through TEC data, the solid lines show the improved pro>les retrieved from tomographic reconstructionusing the MART algorithm, and the solid points denote the referred peak electron density from the Chung-Li digisonde measurements.
images of Figs. 3a–c, we note that, in the dayside equatorialand low-latitude region, a feature of the equatorial anomalyhappened and then enhanced, and the two crests lie atabout +30◦ and −5◦ LEO plane latitudes (∼17◦ and −15◦
geomagnetic latitudes, respectively). It is well known thatthe equatorial anomaly results are something of equatorialfountain features and are caused by an eastward electri-cal >eld at the magnetic equator creating a steady upwardE × B=B2 plasma drift. The drift raises plasmas from theequator across magnetic >eld lines to higher altitudes thenslide down the magnetic >eld lines, assisted by gravity, to-ward the tropical ionosphere. Theoretically, in the absenceof neutral winds, the upward E×B=B2 drift produces almostidentical e?ects at conjugate points in all seasons; however,neutral winds can cause conjugate-hemisphere di?erencesby modulating the fountain and moving ionospheric elec-trons at the conjugate hemispheres to di?erent altitudes. Asshown in the three contiguous ionospheric images of Figs.3a–c, we note that: (1) both of the north- and south-crestpeak electron densities are increased, but the electron den-sity at the trough is decreased during 0029–0521 UT on 23February 1997; (2) the north-crest peak electron density ismuch stronger than the south crest, and (3) the south-crestpeak height (hmF2) is higher than the north-crest peakheight. Such observation results are in good agreement withexperimental observations by Titheridge and Buonsanto
(1983) and modeling studies of the conjugate-hemispheredi?erences by Balan et al. (1995): the equatorial anomalyis enhanced during daytime, and daytime electron densityin winter is generally stronger in the northern hemispherethan the conjugate hemisphere. Such conjugate-hemispheredi?erences in electron density could be caused by themeridional wind and be one of the characteristics of thewinter anomaly. Furthermore, in each orbital revolution ofthe MicroLab-1 satellite within the above experiment, thereexists one occultation observation, where the location ofthe corresponding tangent point at the F2 peak lies within±4◦ of the Chung-Li digisonde site (24:6◦N; 121:0◦E) inlatitude and within ±12◦ in longitude. Figs. 4a–c presentplots of the vertical electron density pro>les obtainedby GPS/MET occultation observations at the startingtimes of 01:25 UT (09:25 LT); 03:05 UT (11:05 LT), and04:47 UT (12:47 LT), respectively. The dashed lines showthe original pro>les derived by the Abel transformationthrough TEC data and used also for red–black smoothingto obtain an initial approximation for further tomographydetermination, and the solid lines show the improved pro->les retrieved from tomographic reconstruction using theMART algorithm. It is noted that the pro>les from theAbel inversion depict negative electron density, which isa physical impossibility and not shown, below the altitudeof ∼100 and ∼150 km in Figs. 4a and c, respectively.
L.-C. Tsai et al. / Journal of Atmospheric and Solar-Terrestrial Physics 64 (2002) 2003–2011 2009
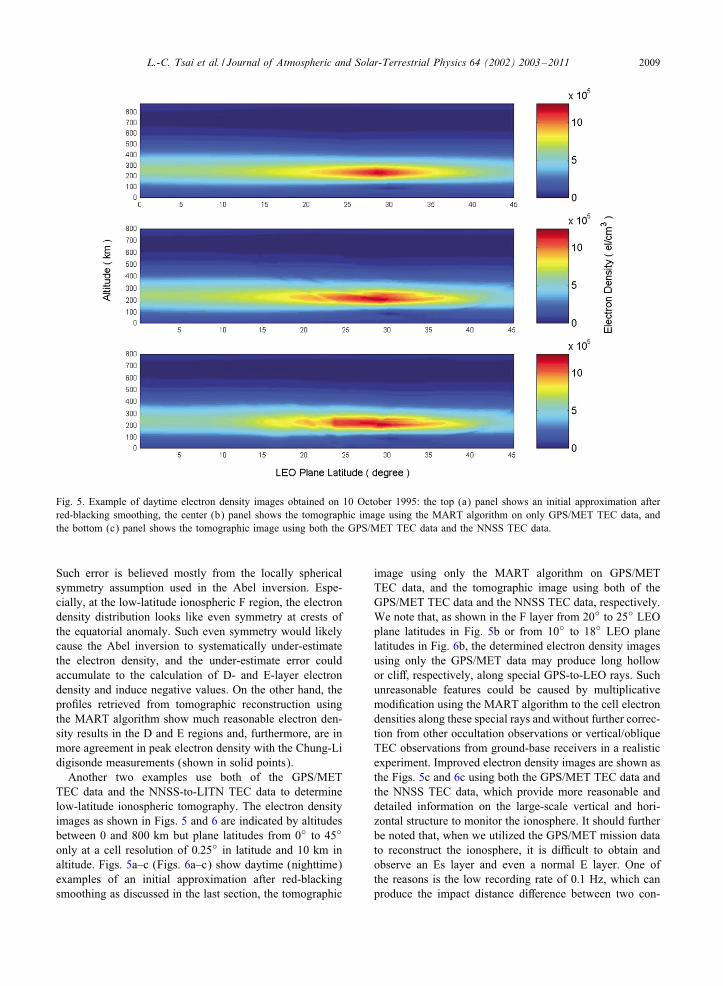
Fig. 5. Example of daytime electron density images obtained on 10 October 1995: the top (a) panel shows an initial approximation afterred-blacking smoothing, the center (b) panel shows the tomographic image using the MART algorithm on only GPS/MET TEC data, andthe bottom (c) panel shows the tomographic image using both the GPS/MET TEC data and the NNSS TEC data.
Such error is believed mostly from the locally sphericalsymmetry assumption used in the Abel inversion. Espe-cially, at the low-latitude ionospheric F region, the electrondensity distribution looks like even symmetry at crests ofthe equatorial anomaly. Such even symmetry would likelycause the Abel inversion to systematically under-estimatethe electron density, and the under-estimate error couldaccumulate to the calculation of D- and E-layer electrondensity and induce negative values. On the other hand, thepro>les retrieved from tomographic reconstruction usingthe MART algorithm show much reasonable electron den-sity results in the D and E regions and, furthermore, are inmore agreement in peak electron density with the Chung-Lidigisonde measurements (shown in solid points).
Another two examples use both of the GPS/METTEC data and the NNSS-to-LITN TEC data to determinelow-latitude ionospheric tomography. The electron densityimages as shown in Figs. 5 and 6 are indicated by altitudesbetween 0 and 800 km but plane latitudes from 0◦ to 45◦
only at a cell resolution of 0:25◦ in latitude and 10 km inaltitude. Figs. 5a–c (Figs. 6a–c) show daytime (nighttime)examples of an initial approximation after red-blackingsmoothing as discussed in the last section, the tomographic
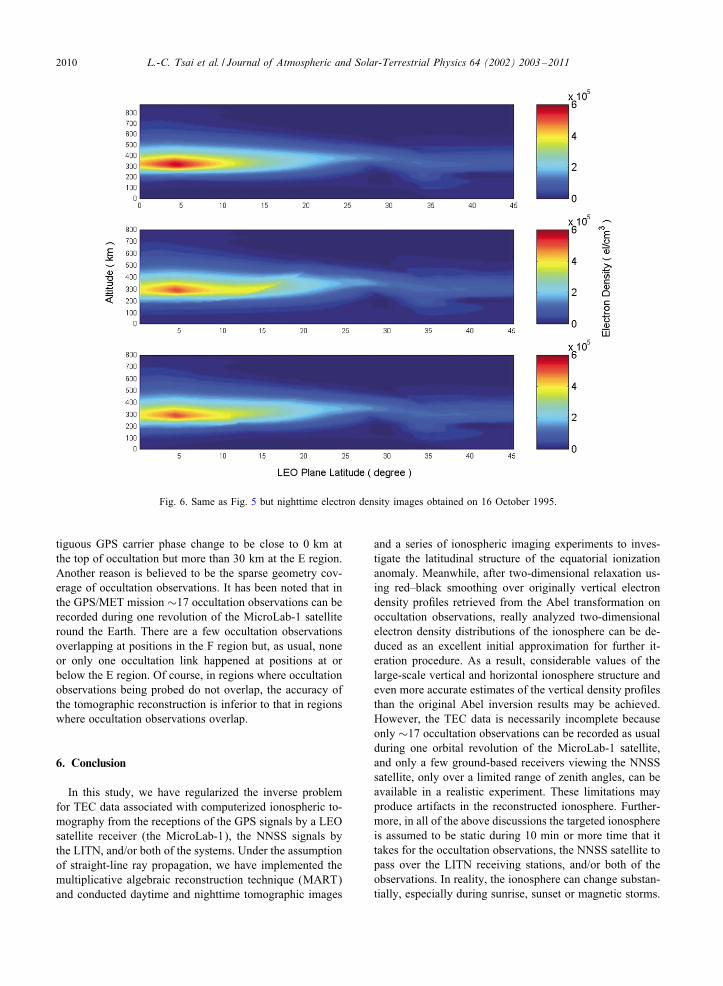
image using only the MART algorithm on GPS/METTEC data, and the tomographic image using both of theGPS/MET TEC data and the NNSS TEC data, respectively.We note that, as shown in the F layer from 20◦ to 25◦ LEOplane latitudes in Fig. 5b or from 10◦ to 18◦ LEO planelatitudes in Fig. 6b, the determined electron density imagesusing only the GPS/MET data may produce long hollowor cli?, respectively, along special GPS-to-LEO rays. Suchunreasonable features could be caused by multiplicativemodi>cation using the MART algorithm to the cell electrondensities along these special rays and without further correc-tion from other occultation observations or vertical/obliqueTEC observations from ground-base receivers in a realisticexperiment. Improved electron density images are shown asthe Figs. 5c and 6c using both the GPS/MET TEC data andthe NNSS TEC data, which provide more reasonable anddetailed information on the large-scale vertical and hori-zontal structure to monitor the ionosphere. It should furtherbe noted that, when we utilized the GPS/MET mission datato reconstruct the ionosphere, it is diPcult to obtain andobserve an Es layer and even a normal E layer. One ofthe reasons is the low recording rate of 0:1 Hz, which canproduce the impact distance di?erence between two con-
2010 L.-C. Tsai et al. / Journal of Atmospheric and Solar-Terrestrial Physics 64 (2002) 2003–2011
Fig. 6. Same as Fig. 5 but nighttime electron density images obtained on 16 October 1995.
tiguous GPS carrier phase change to be close to 0 km atthe top of occultation but more than 30 km at the E region.Another reason is believed to be the sparse geometry cov-erage of occultation observations. It has been noted that inthe GPS/MET mission ∼17 occultation observations can berecorded during one revolution of the MicroLab-1 satelliteround the Earth. There are a few occultation observationsoverlapping at positions in the F region but, as usual, noneor only one occultation link happened at positions at orbelow the E region. Of course, in regions where occultationobservations being probed do not overlap, the accuracy ofthe tomographic reconstruction is inferior to that in regionswhere occultation observations overlap.
6. Conclusion
In this study, we have regularized the inverse problemfor TEC data associated with computerized ionospheric to-mography from the receptions of the GPS signals by a LEOsatellite receiver (the MicroLab-1), the NNSS signals bythe LITN, and/or both of the systems. Under the assumptionof straight-line ray propagation, we have implemented themultiplicative algebraic reconstruction technique (MART)and conducted daytime and nighttime tomographic images
and a series of ionospheric imaging experiments to inves-tigate the latitudinal structure of the equatorial ionizationanomaly. Meanwhile, after two-dimensional relaxation us-ing red–black smoothing over originally vertical electrondensity pro>les retrieved from the Abel transformation onoccultation observations, really analyzed two-dimensionalelectron density distributions of the ionosphere can be de-duced as an excellent initial approximation for further it-eration procedure. As a result, considerable values of thelarge-scale vertical and horizontal ionosphere structure andeven more accurate estimates of the vertical density pro>lesthan the original Abel inversion results may be achieved.However, the TEC data is necessarily incomplete becauseonly ∼17 occultation observations can be recorded as usualduring one orbital revolution of the MicroLab-1 satellite,and only a few ground-based receivers viewing the NNSSsatellite, only over a limited range of zenith angles, can beavailable in a realistic experiment. These limitations mayproduce artifacts in the reconstructed ionosphere. Further-more, in all of the above discussions the targeted ionosphereis assumed to be static during 10 min or more time that ittakes for the occultation observations, the NNSS satellite topass over the LITN receiving stations, and/or both of theobservations. In reality, the ionosphere can change substan-tially, especially during sunrise, sunset or magnetic storms.
L.-C. Tsai et al. / Journal of Atmospheric and Solar-Terrestrial Physics 64 (2002) 2003–2011 2011
Studies of time-dependent nature of the ionosphere must betaken into account in the future tomography analysis.
Acknowledgements
The authors would like to thank UCAR for permittingthem to use the occultation data. This work has been sup-ported by Projects NSC89-2111-M008-047 (L.-C. Tsai),NSC89-2111-M008-049 (C.H. Liu and W.H. Tsai).
References
Austen, J.R., Franke, S.J., Liu, C.H., Yeh, K.C., 1986. Applicationof computerized tomography techniques to ionospheric research.In: Taurianen, A. (Ed.), Proceedings of the URSI and COSPARInternational Beacon Satellite Symposium on Radio BeaconContribution to the Study of Ionization and Dynamics ofthe Ionosphere and to Corrections to Geodesy and TechnicalWorkshop, Part 1. University of Oulu, Finland, pp. 23–35.
Austen, J.R., Franke, S.J., Liu, C.H., 1988. Ionospheric imagingusing computerized tomography. Radio Science 23, 299–307.
Balan, N., Bailey, G.J., Mo?ett, R.J., Su, Y.Z., Titheridge, J.E.,1995. Modelling studies of the conjugate-hemisphere di?erencesin ionospheric ionization at equatorial anomaly latitudes. Journalof Atmospheric and Terrestrial Physics 57, 279–292.
Hajj, G.A., Romans, L.J., 1998. Ionospheric electron densitypro>les obtained with the global positioning system: results fromthe GPS/MET experiment. Radio Science 33 (1), 175–190.
Hajj, G.A., Lee, L.C., Pi, X., Romans, L.J., Schreiner, W.S., Straus,P.R., Wang, C., 2000. COSMIC GPS ionospheric sensing andspace weather. Terrestrial, Atmospheric and Oceanic Science 11(1), 235–272.
Huang, C.R., Liu, C.H., Yeh, H.C., Tsai, W.H., 1997. Thelow-latitude ionospheric tomography network (LITN)—initialresults. Journal of Atmospheric and Terrestrial Physics 59,1553–1567.
Huang, C.R., Liu, C.H., Yeh, K.C., Lin, K.H., Tsai, W.H.,Yeh, H.C., Liu, J.Y., 1999. A study of tomographicallyreconstructed ionospheric images during a solar eclipse. Journalof Geophysical Research 104 (A1), 79–94.
Kursinski, E.R., Hajj, G.A., Scho>eld, J.T., Lin>eld, R.P., Hardy,K.R., 1997. Observing Earth’s atmosphere with radio occultationmeasurements using the global positioning system. Journal ofGeophysical Research 102, 23,429–23,465.
Lee, H., Wade, G., 1985. Imaging Technology. IEEE Press, NewYork.
Leitinger, R., Schmidt, G., Tauriainen, A., 1975. An evaluationmethod combining the di?erential Doppler measurements fromtwo stations and enables the calculation of the electron contentof the ionosphere. Journal of Geophysics 41, 201–213.
Leitinger, R., Ladreiter, H.-P., Kirchengast, G., 1997. Ionospheretomography with data from satellite reception of globalnavigation satellite system signals and ground reception ofNavy Navigation Satellite System signals. Radio Science 32,1657–1669.Raymund, T.D., 1994. Ionospheric tomography algorithms,International Journal of Imaging Systems and Technology 5,75–85.
Raymund, T.D., Austen, J.R., Franke, S.J., Lin, C.H., Klobuchar,J.A., Sralker, J., 1990. Application of computerized tomographyto the investigation of ionospheric structures. Radio Science 25,771–789.
Raymund, T.D., Franke, S.J., Yeh, K.C., 1994. Ionospherictomograph: its limitations and reconstruction methods. Journalof Atmospheric and Terrestrial Physics 56, 637–657.
Rius, A., RuPni, G., Cucurull, L., 1997. Improving the verticalresolution of ionospheric tomography with GPS occultations.Geophysical Research Letters 24 (18), 2291–2294.
Rius, A., RuPni, G., Romeo, A., 1998. Analysis of ionosphericelectron density distribution from GPS/MET occultations.IEEE Transactions on Geoscience & Remote Sensing 36 (2),383–394.
Schreiner, W.S., Sokolovskiy, S.V., Rocken, C., Hunt, D.C., 1999.Analysis and validation of GPS/MET radio occultation data inthe ionosphere. Radio Science 34 (4), 949–966.
Sutton, E., Na, H., 1995. Comparison of geometries for ionospherictomography. Radio Science 30, 115–125.
Tsai, L.-C., Tsai, W.H., Schreiner, W.S., Berkey, F.T., Liu, J.Y.,2001. Comparisons of GPS/MET retrieved ionospheric electrondensity and ground based ionosonde data. Earth, Planets andSpace 53, 193–205.
Titheridge, J.E, Buonsanto, M.J., 1983. Annual variations in theelectron content and height of the F-layer in the northern andsouthern hemispheres, related to neutral composition. Journal ofAtmospheric and Terrestrial Physics 45, 683–696.
Ware, R., et al., 1996. GPS sounding of the atmosphere fromlow Earth orbit: preliminary results. Bulletin of the AmericanMeteorological Society 77, 19–40.
Zou, X.Y., Kuo, H., Guo, Y.-R., 1995. Assimilation of atmosphericradio refractivity using a nonhydrostatic mesoscale model.Monthly Weather Review 123, 2229–2249.