Embed Size (px)
Citation preview

The heterogeneity of “private school effect” in Italy
Tommaso Agasisti*, Samuele Murtinu and Piergiacomo Sibiano Politecnico di Milano (Italy)
Department of Economics, Management and Industrial Engineering
Abstract We empirically investigate the differentials between public and private schools’ performances in the most important Italian Region (Lombardy), employing a novel dataset comprising 74,265 students in 1,050 primary schools (grade 5) and 74,538 students in 900 middle schools (grade 6). Our analyses rely on Instrument Variables, taking advantage of a particular characteristic of the voucher plan implemented in the Region. The results show that, on average, there is not a statistically significant “private school effect”. When exploring the potential heterogeneity of such effect, we found that private schooling is associated with lower performances in math and reading in the case of immigrant students. However, private schooling is also positively associated with reading scores for disadvantaged students, at grade 5, and with math scores for students in non-urban areas and those who have a socioeconomic indicator above the mean, at grade 6. Suggestive explanations and policy implications are then derived; therefore, the main message is that the effect of attending a private school is likely to be heterogeneous and strongly dependent upon students’ characteristics.
Keywords Schools’ performances, private schools, Instrumental Variables, heterogeneity
JEL Codes
I21

“Improving Education through Accountability and Evaluation: Lessons from Around the World” Rome, October 3-5, 2012
2
Acknowledgments We are grateful to INVALSI (Istituto nazionale per la valutazione del sistema educativo di istruzione e di formazione) that provided us the original datasets; P. Falzetti and R. Ricci gave us valuable help in managing the data. We acknowledge the support of a grant from the Lombardy Regional Government (Project name: A report about Lombardy Regional education system 2009/10). The views expressed in this paper are our own, and do not necessarily coincide with those of INVALSI and Lombardy Regional Government. Previous versions of this paper have been presented during seminars at Institute of Education – University of London and Lancaster University. We are indebted with colleagues who provided useful and valuable comments on the paper: D. Checchi, C. Green, I. Cornelisz. Tommaso is also grateful to Teachers College, Columbia University, which hosted him during the work on a first draft of this paper (February 2012). The eventual errors are our solely responsibility.

“Improving Education through Accountability and Evaluation: Lessons from Around the World” Rome, October 3-5, 2012
3
1. Introduction
The comparison between public and private schools’ performance is fiercely debated.
The Friedman’s (1955) idea of freedom of choice pushing towards competition led to
increasing claim for market-oriented school systems (Chubb & Moe, 1990; Hoxby,
1998). The typical policy suggested – which in some cases was also implemented, such
as in the U.S.A., Sweden, Chile – is the adoption of voucher schemes (Barrow & Rouse,
2008). The framework behind such policy is that private schools perform better than
public ones, and that competition will provide good incentives to improve the overall
performance of the educational system (for a deep discussion about the theoretical basis
for school choice, see Hoxby, 2003). Although the idea is appealing, especially for poor
families who cannot afford private schooling, it is hard to demonstrate the first
assumption, which is the better quality of private education. At the heart of problem there
is a methodological obstacle that is the likely endogeneity of school choice: the pupils are
not randomly assigned to schools, but their parents choose them generating potential self-
sorting problems. In other words, even after observing that private schools usually obtain
better results than their public counterparts (Bosker, 2011), the question is: do private
schools have just a better school intake (in terms of pupils quality and motivation) or do
they really outperform public schools?
This debate is of particular relevance in Italy, both from an academic and institutional
perspective. With reference to the former, the empirical evidence from international
datasets (especially OECD-PISA) and previous literature seems to suggest that public
schools outperform private ones, when students’ background is properly taken into
account; such characteristic puts Italy among those few countries for which private
schools provide less quality education than public ones (OECD, 2011). These results lead
some scholars to argue that private schools in Italy have a “remedial” function, that is to
assist lower quality, less motivated students instead of providing higher level education
(Bertola et al., 2004). However, this interpretation requires further testing, as it was based
on studies that did not consider students’ achievement as output, and refer to some
specific grades (especially, high schools). Thus, there is space to improve the quality of

“Improving Education through Accountability and Evaluation: Lessons from Around the World” Rome, October 3-5, 2012
4
academic analyses on this ground. As for the institutional view, it is important to recall
that some Italian Regions introduced voucher plans for stimulating attendance of private
schools. It was especially the case of the biggest and richest region, named Lombardy
(for some details about educational vouchers in Italy, see Agasisti 2011). Thus, the
policy-making problem of evaluating the relative performances of the two types of school
became relevant also for justifying (or not) this political orientation.
For the first time, we used a new dataset to analyse the relative performances of public
and private schools in Italy. Data come from the National Institute for the Evaluation of
Schools (Istituto nazionale per la valutazione del sistema educativo di istruzione e di
formazione – hereafter, INVALSI). INVALSI started in 2007 its activity of administering
standardized tests for measuring students’ achievement. Unfortunately, no panel data are
available (as students’ identity has not been retained by INVALSI until 2011), so our
study is based on a cross-section of 74,265 students attending grade 5 (last year of
primary school) and 74,538 students at grade 6 (first year of middle school), academic
year 2009/10. The sample is limited to the schools located in a specific region, namely
Lombardy1
To anticipate our main results, based on an Instrumental Variables (IV) approach, we
found that private schooling attendance has a positive effect on Math and Reading scores
for (relatively) richer students and those enrolled at school in a non-urban area, when
. The choice of focusing on a single region makes our results limited to a
specific case within the Italian context, not extendable to the whole country
straightforwardly. However, it also eliminates some confounding effects, which are
typical in the Italian context, as the performances of students and schools are very
different across regions (the well-known North/South gap): Invalsi (2010) reports that
between-regions variance accounts for 40% of total variance between-schools in terms of
achievement scores. Data contain some detailed information about students’ background
characteristics, as well as school-level information.
1 Since many years, the choice of focusing on a specific area is often used in the literature about the comparison of private and public schools. Coulson (2009) in his meta-analysis reports many studies, which specifically target limited areas; for instance, Rouse (1998) – Milwaukee. The recent study by Angrist et al. (2011) deals with charter schools in Massachusetts.

“Improving Education through Accountability and Evaluation: Lessons from Around the World” Rome, October 3-5, 2012
5
considering grade 6. Instead, it exerts a negative effect on Math scores for students
attending primary schools (grade 5) for immigrant students, but a positive effect on
Reading scores for disadvantaged students (those who are “relatively” poorer). These
findings shed more light on the heterogeneity of the so called “private school effect”, that
is they claim for a more cautious interpretation of the role of private schools in the Italian
context. In particular, they stress the importance of looking at this effect for different
subpopulations of students and schools, as well as of taking into account heterogeneity
across grades. One-fits-all conclusions about the role and effects of private schooling in
Italy tend to provide an unreliable picture.
The remainder of the paper is organised as follows. The next section 2 reviews the
relevant literature as a background for our analysis. Section 3 illustrates the different
methodological approaches and data; section 4 contains the results; section 5 provides
additional robustness checks and further analyses. Lastly, section 6 debates the main
findings, suggests policy implications and concludes.
2. Background
2.1. The Italian educational system
The Italian educational system cannot be considered as a market-oriented setting, as it is
characterised by (i) the lack of instruments for fostering parents’ choice (vouchers, tax
credits, charter schools, etc.), (ii) low school autonomy and (iii) intrusive regulation by
the national government – as in procedures for hiring teachers, the content of the subjects,
the organisation of curricular activities, the composition of governing bodies.
More than 90% of Italian schools belong to the public sector; differently from other
countries, it should be mentioned that selective schools do not exist, and private schools
have a particular status: they are accredited as public schools, but a negligible amount of
money is devolved to them, hence they set student fees that only advantaged families can
afford. A national public fund is devoted to private schools and it is managed by the
Ministry of Education; but this fund is just about 500 millions euro – compared with the
Ministry’s expenditure for public schools, about 43 billions euro. In terms of expenditure

“Improving Education through Accountability and Evaluation: Lessons from Around the World” Rome, October 3-5, 2012
6
per student, the Ministry’s spending is about 6,000€ for public and 500€ for private
schools, on average. As the (annual) fee at private schools is about 3,000€ per student
(even less for primary schools), on average private schools seem to cost much less than
the public ones – it must be kept in mind that this is a raw comparison, because the
information about how many resources private schools are able to raise is not available.
One explanation could rely upon the different organizational setting, as private schools
(whether religious or not) benefit more autonomy than public ones: they can make
decisions about hiring and paying teachers and staff, composition of governing bodies,
articulation of their curricular and extracurricular activities. As a consequence, salaries
are lower in private than in public schools; and the number of teachers and non-teaching
staff employed is also lower.
Moreover, within the public educational sector there is no diversity. For example, it is not
the case as in England, with different school types, like community schools, academy
schools, trust schools, voluntary-aided or voluntary-controlled schools, special schools
and grammar schools. In the English case, all these schools have differences regarding
the level of autonomy, the religious status and the admission requirements. Similarly, the
introduction of charter schools in the US, has led more choice within the public sector.
Instead, in Italy some kind of difference can be seen at the upper-secondary level (grades
9-13), while in the primary and middle schools – the grades considered in this paper –
there is no difference between school types.
To sum up the organisation of the Italian educational sector, on the one hand there is the
“State sector”, which is undifferentiated within the country; on the other hand there is the
“private sector”, which actually is quite differentiated. It is possible to find schools that
belong to the Roman Catholic Church, schools that belong to other religious institutions,
schools that belong to no profit enterprises, which can be (or cannot be) religious-
oriented. Unfortunately, the Ministry of Education does not collect any detailed
information regarding the specific status of all these organizations, so it is not possible to
compare students also within the private sector, and not just between public and private
sector.

“Improving Education through Accountability and Evaluation: Lessons from Around the World” Rome, October 3-5, 2012
7
Italian families have the right to choose (even within the public educational sector) any
school they want and, normally, they get it: there are no prescribed catchment areas, nor
oversubscribed schools. It can seldom happen that some schools are oversubscribed, but
the number of pupils rejected is negligible. Yet, when it happens, the government does
not determine the criteria schools use but by the school board, and such criteria refer to
proximity, siblings, and disabled students. Only in residual cases (virtually none) a lottery
is used. Rejected students go to the second choice school. Thus, in Italy there is “no
choice” between public and private schools (as high fees prevent disadvantaged families
to choose), but families can decide among public schools. However, the public sector
does not supply diversity of schools and there is no publicly available information at
school level; often, families are not aware of differences in terms of performance.
As anticipated, Italian public schools have weak autonomy; for instance, schools have no
power over recruiting, pay-roll and dismissing of teachers. The process through which
teachers are recruited is quite complicated. It embodies three different actors: the national
government (that is the employer), Ufficio Scolastico Regionale (USR), and Ufficio
Scolastico Provinciale (USP) – a sort of local education authorities. The first determines
the number of classes and the second the allocation between schools, given their requests
(Fontana & Petrina, 2001). It is worthwhile to notice that schools request not a particular
person but just somebody teaching a certain subject; in other words, they do not select
their own teachers. Teachers’ salaries are determined and paid by the government, apart
from short-term contracts. Schools just manage facilities, integrative projects and the
possibility to collect money by private or local public institutions. As a result, Italian
school funding deals only with facilities. Until 2006 USR distributed funds of facilities
but, since 2007, the competence has been attributed to the government. The amount of
resources that schools receive for that is determined, in part through a formula, and in
part according to national agreements between (i) the government (or USR and USP
according to different matters) and (ii) trade unions. The formula takes account of the
number of students (disabled students are weighted for additional funding), the school
type and school size. Lastly, there is another national fund “for the widening of schooling

“Improving Education through Accountability and Evaluation: Lessons from Around the World” Rome, October 3-5, 2012
8
supply and for redistributive interventions”, which is distributed according to ministerial
priorities, dealing with teacher training, disadvantaged areas and evaluation or innovation
projects. Its amount is around 180 millions and, moreover, not all of this funding has
been distributed directly to schools, roughly: one-fourth via USR, one-fourth via the
Ministry of Education, and one-half to schools. Therefore, the proportion of budget that is
managed by the school is pretty low, as 97% of total expenditures are related to salaries
of teachers and administrative/support staff.
The educational system in Lombardy has certain peculiar characteristics that make it
different from the other Italian Regions, because of two main reasons: i) the extent of
private schooling and ii) the (regional) policies implemented. With reference to the
former, table 1 shows that in Italy there are, on average, more than 90% of public schools
and more than 94% of students attend to those schools, while in Lombardy the
corresponding numbers are 86% and 90%. Second, and most importantly, since 2000
Lombardy region implemented a voucher scheme. With a regional law, the Lombardy
government has introduced a school voucher (SV) program, with the aim of reducing the
economic obstacles that prevent student participation to private schools. This was a direct
grant directed to students attending primary and secondary school in Lombardy. The
income threshold requested to be eligible for SV consisted in the ratio between income of
family members and an index taking into account the number of family members. The
voucher amount could not be less than 52 € and over € 1,050 (excluding students with
disabilities whose ceiling was equal to 1,400 €). Nowadays, more than 65,000 students
are beneficiaries of a SV (which is the most part of students attending to private schools,
around 70%), whose amount is 700€, on average. Data about Lombardy private schools
fees are not publicly available, however fees are about 2,000€ (on average) for primary
schools, 2,800€ for middle schools and 3,500€ for high schools.
<table 1> around here
2.2. Investigating private schooling effect

“Improving Education through Accountability and Evaluation: Lessons from Around the World” Rome, October 3-5, 2012
9
Comparisons between public and private schools have been conducted since the Coleman
Report (Coleman et al., 1982). Yet, to date it is not clear whether private education per se
is better. At the basis of this open debate in the literature, there is the difficulty to obtain
unbiased estimations, which can be summarised in two main methodological issues.
Firstly, it is difficult to control for variables that affect student’s performance apart from
measurable dimensions. In other words, the student’s performance (measured by the
score from a standardised test) could be much more related to the individual student’s
characteristics than the contribution of the school. More simply, the aim is to consider
that school intakes between public and private students are different in terms of
socioeconomic background, ability and intrinsic motivation. Moreover, even in cases
where such data are available (i.e. parents background and occupations) some of them
remain not measurable, as motivation and innate ability. The second problem is that it is
impossible to compare the performance of a single student at the same time but in two
different schools; in other words, it is impossible to have a pure counterfactual. The
recent literature took advantage from newly developed methodological instruments (i.e.
Angrist & Pischke, 2009; Murnane & Willett, 2011) and faced these issues in different
ways, either for national or cross-national analysis, cross-section or panel data settings.
2.3. Comparisons across different countries
A number of previous studies attempted at analysing the relative performance of private
and public schools in different countries, with the aim to obtain overall information in an
international perspective. Somers et al. (2004) analysed private schools effectiveness
across Latin America countries. They relied on a multilevel model, separating variance at
student and school level. Controlling for family background and peer group, other than
school type, they did not find difference between public and private schools. This
contribution especially pointed at highlighting how important is considering peer effects,
while previous literature failed to control for this factor (and limited itself to individual-
level students’ features). Vandenberghe & Robin (2004) extended the cross-countries
analysis by including also some European countries. They used different methodologies:

“Improving Education through Accountability and Evaluation: Lessons from Around the World” Rome, October 3-5, 2012
10
OLS, Instrumental Variable (IV), Heckman methods and propensity score matching
(PSM). The authors employed many variables such as: percentage of girls enrolled in the
school, students with siblings in the same school, whether student’s father is an
immigrant and the school location (urban/non-urban area). They found a significant and
positive effect through any methods just in some countries (Belgium and Brazil), while
for others (Mexico, Denmark and Spain) the propensity score matching results were not
significant. Some contradictory results between IV and Heckman models and propensity
score matching have been found, as well across countries. Relying on OECD data,
Dronkers & Robert (2008) compared the different school type’s performance of sixteen
European countries other than US and New Zealand, by means of multilevel models.
They were able to control for students’ and principals’ perception about their schools’
climate. The results are that only some school types (government-dependent) have a
higher net educational achievement than comparable public schools with the same social
composition, and their suggested explanation stays in a better school climate.
The interested reader could also refer to Coulson (2009) who, through a meta-analysis,
reviewed more than 150 statistical comparisons across different countries and concludes
that, in most cases, private and market schools outperform public ones.
2.4. Country-specific studies
McEwan (2001) investigated the effectiveness of public, catholic and non-religious
private schools in Chile, where a voucher system was implemented in 1980. He follows a
Heckman approach where in the first stage he estimates the probability of being enrolled
in a private school through a multinomial logit model. The number of schools per square
kilometre of each type of municipality has been chosen as instrument. Controlling also
for peer group effect, he found that all private schools types lost their advantage apart
from Catholic schools. Also Anand et al. (2009) relied on the Chile case. In order to
overcome the selection bias problem they take advantage of the provision of scholarships
to low-income students (through a random fashion) attending to free schools in order to
give them the opportunity to enrol to fee-charging private voucher schools. They used
“Improving Education through Accountability and Evaluation: Lessons from Around the World” Rome, October 3-5, 2012
11
scholarships to identify a treatment group. The empirical strategy is based on three
subsequent steps: estimating the probability to receive a scholarship, through a logit
model; estimating a multinomial logit model for school choice (probability of being
enrolled in a private school); finally, propensity scores matching to compare the
outcomes of students in the treatment and control groups. The findings show that private
schools outperform public schools.
The issue of private school effectiveness is debated in the UK as well, where the
educational system is significantly differentiated, as most religious schools are not
private. Gibbons & Silva (2011) precisely address this case. The comparison is between
Faith and Secular schools, both funded by the government. Since the requirement for
going in a Faith school is the religion, much more focus has been devoted to this
dimension. The authors tried to distinguish between the specific effects of religious
affiliation on academic achievement from the effects of a private education. In order to
overcome the selection bias they carried out a bounding exercise. They used fixed-effects
models, and estimate the Faith-primary school effect in two pupil subgroups: the
“stayers” and the “switchers”. The first ones remain in a Faith school also for the
secondary school, while the second ones change. According to the authors, the regression
based on stayers provides an upper bound of school effect while the switcher regression
provides a lower bound. Their findings suggest that all of the advantage of Faith
schooling can be explained by differences between pupils who attend Faith schools and
those who do not.
Many studies focused on the US case. There is a wide literature in this field (an overview
is provided by Sander & Cohen-Zada, 2010 and Zimmer & Buddin, 2010), part of which
specifically refers to Catholic private schools (Evans & Schwab, 1995; Goldhaber, 1996;
Neal, 1997; Figlio & Stone, 1997; Nguyen & Taylor, 2003). Among many others, the
contribution by Nguyen et al. (2006) is particularly interesting, as the authors use panel
data techniques to estimate the effect of Catholic schooling through propensity score
matching and difference-in-difference models. Differently from many studies, they also
used the change in test score over time (gains) as dependent variable, other than the cross

“Improving Education through Accountability and Evaluation: Lessons from Around the World” Rome, October 3-5, 2012
12
sectional scores (levels). They found positive and significant Catholic schooling effect,
albeit these findings are not confirmed by the difference-in-difference results.
Another stream of US research compares charter schools with traditional public schools.
Angrist et al. (2010) use a two-stage approach (2SLS) for comparing charter and public
schools in Boston. They take advantage of the fact that charter schools admit students
through a lottery and that some schools are oversubscribed. Therefore, they have all
students who would have liked to attend a charter school but not all of them attend
actually. As a consequence, treatment and control groups are well defined. The randomly
assigned lottery is used as instrument. In the second stage the dependent variable is
students’ scores in a certain year in a certain grade. They found positive and significant
effects of attending charter schools. Abdulkadiroglu et al. (2011) analysed the Boston
case as well, but considering also Pilot schools (which are similar to public schools but
have more autonomy). They use an IV approach relying on the lottery admission system,
and it results that charter schools outperform pilot and traditional public schools. Angrist
et al. (2011) go more in depth in this same analysis. They compared also charter schools
located in urban or non-urban areas. Basically, the empirical strategy again follows a
two-stage regression. Firstly, they conduct a semi-parametric analysis of heterogeneous
potential outcomes that assigns a role to variation in no-treatment counterfactuals and to
charter applicants’ demographic characteristics and baseline scores. Then they attempt to
isolate school-level characteristics that might explain differences in charter school
effectiveness. The authors found that urban charter schools boost achievement beyond
urban non-charter students. Student demographics explain some of these gains; yet, non-
urban charter schools are uniformly ineffective. Moreover, there is significant
heterogeneity among urban charter schools.
2.5. Previous studies on Italian private schools
The issue of relative public and private schools’ performance also received attention in
Italy. To date, the academic literature concludes that Italian private schools, on average,

“Improving Education through Accountability and Evaluation: Lessons from Around the World” Rome, October 3-5, 2012
13
attract less talented (but richer) students, and attributes to these schools a “remedial”
function.
Brunello & Checchi (2005) pointed at four pieces of evidence supporting this idea. First,
by estimating a probit model on the probability of enrolment in remedial programs they
found a positive and significant impact of a dummy for students enrolled in a private
school (after conditioning for family background). Second, through an ordered probit
model they found that the quantity of homework at private schools is lower than at public
ones. Third, since the percentage of older (i.e., not regular) students increases in private
schools during upper secondary school, the authors argue that private schools attract
students “in trouble”, those who switch during the academic year to attend to easier
schools. Finally, they performed both OLS and IV regressions considering PISA 2000
literacy score as dependent variable; in the IV approach, they chose two instruments
namely household wealth and preference for cultural activities. They found a negative
and significant impact of the dummy private school on student achievement. Overall,
these results are not free from some drawbacks. First, since private institutions provide
the most part of remedial programs, the first finding is expectable; while no evidence is
provided about the proportion of private schools that cannot be classified as “remedial”
(as it is difficult to identify a priori different types of private schools). Thus, it can be the
case that the results are driven by the particular sample of schools included in the study.
Further, the “quantity of homework” is a partial indicator of student motivation and
quality. Lastly, the main drawback of the quantitative approach is the hardly reliable
sample of PISA: it is not representative at school level, and it defines Italian schools in a
questionable manner (see, for instance, the discussion in Agasisti & Vittadini, 2012).
Some studies inferred public and private schools students’ performance relying on their
performance at university. Bertola & Checchi (2004) used a dataset of the Milan
University, which includes all students enrolled in the 1999-2000 academic year. They
performed IV models by using the university student’s performance as independent
variable and as dependent variables the school type he/she attended, his/her “ability”
(measured by the secondary school exit marks) and other control variables. Different

“Improving Education through Accountability and Evaluation: Lessons from Around the World” Rome, October 3-5, 2012
14
variables were used as performance (output), such as (i) average (university) exam mark
and (ii) the number of passed exams per year. As instrument they used a measure of
economic wealth. Importantly, they distinguished school type not just between
ownership, but they further considered public high schools, private confessional high
schools, private lay high schools, public vocational schools, private confessional
vocational schools and private lay vocational schools. Through their analysis they found
that the different school types perform according to the ranking just mentioned.
Moreover, when they allow for self-sorting of students in different types of secondary
schools, they find that the attendance of private schools improve the performance of a
subgroup of students whose choice of private school attendance is correlated with family
wealth. They conclude that private schools play just a remedial role for students from
wealthier families.
Bertola et al. (2007) compare students who attend private and public schools, in terms of
(i) probability of college enrolment and (ii) observed earnings once entered the job
market. More specifically, they firstly estimate the probability of attending a private
school through a probit model, whose covariates are individual (observable)
characteristics and the (unobservable) student’s ability. Secondly, through both probit IV
and Heckman approaches, they estimate the probability of attending a university. They
used two instruments: (i) whether grandfather or grandmother completed secondary
school or college as household financial resources and (ii) the availability of private
lessons as a trigger to private school enrolment. The authors found that attending private
schools has a negative (or no) significant impact on both dependent variables. Some
weaknesses of this study are related to the quality of data, derived from interviews. Also,
the indicator used for student’s talent is questionable; since the grading was not uniform
across schools, (i.e., the marks do not derive from standardised tests, but are subjective
judgments of teachers) any robust comparison is hardly feasible (Checchi & Jappelli,
2004).

“Improving Education through Accountability and Evaluation: Lessons from Around the World” Rome, October 3-5, 2012
15
Di Pietro & Cutillo (2006) investigated the influence of Italian Catholic schools2
Brunello & Rocco (2008) addressed the public/private issue with a different approach.
They considered two different equilibrium points through a micro-economic model,
similar to the one by Epple & Romano (1998). The model assumes just one public and
one private school and no liquidity constraints for households. They added that there
on
university enrolment and university drop out. They adopted a bivariate probit approach;
the model consisted in two equations – a school attendance and a university enrolment
equation – which were performed jointly and simultaneously using maximum likelihood.
Firstly, they estimate the probability of being enrolled in a Catholic school and of being
enrolled at a university by relying on three instruments. Secondly, in order to model
university drop out risk, they again estimate a two-equation model: (i) a university
enrolment equation (which is the same of the first stage) and (ii) a dropout equation. With
reference to the first stage, they choose the proportion of people living in the relative
Province and who reported visiting a place of religious worship at least once per week as
instrument. In the second stage, they used the number of siblings and a dummy variable
recording whether the individual’s grandfather has either a high school degree or a
university degree. The most interesting finding is a positive and significant coefficient for
students deriving from Catholic schools in the university enrolment equation, while non-
significant effects have been found through the drop out equation. Moreover, they found
a negative relationship between the unobservable factors associated with school choice
and Catholic school attendance. Since this holds true even when controlling for school
quality and peer effects, the authors argue that the positive effect of Catholic schools on
university participation cannot be attributed to high quality school inputs but to other
factors. However, two principal drawbacks of this study should be carefully borne in
mind. Firstly, they relied just on 548 students attending Catholic schools for the whole
country. Secondly, the variables used to capture the school quality effect is questionable,
as they used the average class size for final year students and the proportion of students in
double or triple shifts at a high school due to school congestion.
2 However, the definition of “Catholic school” is weird, and it probably refers to all the private schools.

“Improving Education through Accountability and Evaluation: Lessons from Around the World” Rome, October 3-5, 2012
16
could be not only an equilibrium point where public schools offer low quality education
and private ones offer high quality education, but also a reverse one could exist. In an
empirical exercise, by replacing in the model estimates regarding the return of increase in
grading standards to earnings, the student’s ability, the number of private and public
schools, the public expenditure for public education and the average income both for US
and Italy, it turned out the two different equilibrium points. In case of US the equilibrium
is the one with high quality private schools while in case of Italy with low quality private
schools. The basic idea is that when educational standards are low in public sector (US),
then private sector will offer high quality education, while the reverse would occur
otherwise (Italy). However, the assumption regarding just one school per school type –
drawback explicitly admitted by the authors – excludes any kind of heterogeneity, which,
instead, was considered by previous studies (Bertola & Checchi, 2004; Brunello &
Checchi, 2005) and was explicitly modelled in our paper from an empirical perspective.
In a recent study focusing devolution powers to Regions in education, also Turati et al.
(2011) argue that Italian public schools outperform the private ones. However, the study
suffers a main problem due to too few observations (at best 40 private schools for the
whole country).
2.6. This paper’s contribution
The results from previous studies about different countries are mixed at best; and the
evidence provided is still sparse. Most importantly, the literature about Italian private
schools currently suffers a main limitation, which is the lack of data about the most
immediate and direct output of schools’ activities, i.e. achievement.
Our paper innovates in several directions. First, we explicitly model the heterogeneity of
private schools’ effect. Our idea is that private schools can outperform public ones under
certain circumstances but not in others, i.e. in urban contexts, and they can benefit some
types of students but not others, i.e. immigrants versus Italians, or relatively
poorest/richest. Moreover, given that our dataset comprises both primary and middle
schools, we can investigate whether the private school effect is different in two separate
“Improving Education through Accountability and Evaluation: Lessons from Around the World” Rome, October 3-5, 2012
17
grades (5 and 6) – which is another source of potential heterogeneity. With special
reference to the Italian previous literature, we use a new dataset provided by INVALSI,
which contains student-level achievement scores – while other papers chose more
“indirect” output variables, like enrolling at university or dropping-out. Therefore, we
investigate the effects of private schooling on the most direct measure of schools’
outputs. Moreover, we have data for all the students enrolled at grade 5 and 6 in an Italian
region in the reference year (2009/10), so our analysis does not suffer of potential
inconsistencies due to the selection of the sample (as other studies that extracted data for
students enrolled at a single university). Lastly, we focus also on primary schooling,
while the most part of previous studies analyses secondary schools (an exception is
represented by Jepson, 2003); to the best of our knowledge, it is the first research
studying the private school effect at primary education level in Italy.
3. Data and methods
3.1. Data
Data come from INVALSI, which runs standardized tests within the country since 2007;
tested subjects are reading (R) and mathematics (M). The tests are carried out at the
second and fifth (last) grade of primary schools (grades 2 and 5), at the first and third one
for middle schools (grades 6 and 8) and at second and fifth (last) for secondary schools
(grades 10 and 13). In this paper, we use data for grades 5 and 6. Indeed, also data for
grade 2 were at disposal of authors, but the socio-economic indicator reflecting students’
background was not collected at that level; as our purpose is explicitly to control for this
feature, we had to choose not to include that grade.
The original datasets were two: one at student-level and one at school-level, and they
were merged by using (anonymous, but coded) information about the students.
The dataset at student-level contains individual background characteristics such as:
gender, age, family background, nationality, parents’ nationality, whether the student
attended to nursery or kindergarten (preschool education), whether the student repeated
one or more years, and the municipality and province where he/she lives. There are also

“Improving Education through Accountability and Evaluation: Lessons from Around the World” Rome, October 3-5, 2012
18
many variables reflecting family’s background, such as the parents’ job and their
educational level, together with an indicator for the possession of particular goods 3
<table 2> around here
,
considered as proxies for different economic and cultural contexts, which in turn have
different impact on student’s achievement. INVALSI created an indicator, called ESCS
(Economic, Social and Cultural Status) that takes into account all these variables
(Campodifiori et al., 2010): parents’ occupation and education, and the possession of
goods related to different socio-economic context. This indicator was built to have mean
equal to 0 and standard deviation equal to 1. Lastly, student-level information also reports
the score obtained in the standardized tests (Math and Reading). Specifically, the values
are expressed in the range [0;100] as a percentage of right answers. The dataset at school
level contains: school type (private or public), number of students, classes, immigrant
students (both first and second generation), disabled students, rejected students, teachers
and the location. A complete list of the variables is contained in table 2, which also
provides a short description and metric for each of them.
After the merging of the two datasets, a procedure for cleaning the resulting one has been
undertaken. At the end, the sample contains data for 74,265 and 74,538 students, 1,050
and 900 schools, for grade 5 and 6 respectively.
Table 3 reports the descriptive statistics of our dataset - separated by students attending to
public and private schools; figure 1 shows histograms from categorical variables. Raw
students’ performances, on average, are slightly higher for those students attending a
private school, while the standard deviation is similar across school-types – suggesting
heterogeneity within sub-sectors. Some background characteristics are similar between
the two groups (for instance, the percentage of students who attended a nursery or
kindergarten); while others reveal striking differences, as the educational levels of parents
that reveal how students in private schools come from more educated families. This
3 More specifically, these “goods” concern: a quiet place to study; a personal desk for homework; encyclopaedias; internet connection; burglar alarm; a room exclusively devoted to the student; more than one bathroom; more than one car in the family; more than one hundred books at home.

“Improving Education through Accountability and Evaluation: Lessons from Around the World” Rome, October 3-5, 2012
19
noticeable difference is made evident through the indicator for overall social, economic
and cultural status (ESCS), where the distance between the two groups is particularly
marked (ESCS is around -0.01 for public schools, >0.7 for private). Therefore, also the
difference in terms of immigrant students’ share is clear, with >14% in public schools
and <2% in private. T-tests revealed that such differences are statistically significant
indeed. Turning to school-level characteristics, size matters in that public schools are, on
average, larger than private ones (more than two times bigger indeed); when looking at
the teachers:students ratio as a proxy of resource intensity, such divergences are not
evident instead.
<table 3; figure 1> around here
In a descriptive perspective, it is also useful to refer not only to average values, but also
to look at the entire distribution of the variables; for this purpose, boxplots are used with
the aim of indicating the different moments of the distribution (the box representing 25th
and 75th percentiles, and the whiskers 10th and 90th
<figure 2> around here
). From the panel A of the figure 2, it
is clear that all the different characteristics of the private (primary) schools described
above – higher ESCS, smaller size, lower share of foreign students – are determined by a
real different distribution, with a small number of outliers. Interestingly, it looks like the
output variable’s distribution is narrower for private schools, suggesting higher
homogeneity but also the existence of a relevant number of (negative) outliers. Almost
the same holds for middle schools (panel B), with even more accentuated differences
when considering ESCS and the share of immigrant students.
Finally, some further descriptive insights of the data are useful to understand the Italian
context and the main relationships between variables. First, the correlation between
students’ performance and background is well known. Figure 3 simply describes this
relationship, by plotting the two variables one against each other. It is clear that the
background of students attending private schools is higher than the students in public
schools, while the correlation of students’ background and proficiency scores seems to be
quite similar both in public and in private schools, though for private schools the slope of
“Improving Education through Accountability and Evaluation: Lessons from Around the World” Rome, October 3-5, 2012
20
the regression line is lower. A potential reason for this difference could be related to the
lower variation of students’ background in private schools. Second, another aspect of
potential interest is the school’s location. Figure 4 shows a comparison of students’
performance by separating cases in which the school is located in an urban or non-urban
area; however, the figure does not show any relevant difference.
<figures 3,4> around here
To sum up, descriptive statistics point out a (slight) advantage of private schools in terms
of performances, but also a much better socio-economic background of their students. It
is difficult to straightforwardly understand whether higher performances are due to better
schooling or better student intakes. In this paper two methodologies are applied to
disentangle compositional effects and school effectiveness, keeping into account the
endogeneity of school choice.
3.2. Methodology and estimation strategy
As previously explained, the aim of this work is to estimate the effect (more precisely,
the treatment effect) of private schooling on students’ achievement. Many prior studies
did not properly control for student, family and peer characteristics. Thus, any systematic
difference between students enrolled in private schools (i.e. “treated” students) and those
enrolled in public ones might explain a great portion of the observed difference in
achievement between the two types of students (e.g. differences in the composition of
students). Moreover, once controlled such characteristics, there might still be a difference
in schools’ resources and organizational characteristics. Finally, once schools’
characteristics are included in the model, there is still necessity to account for unobserved
heterogeneity. In the methodological perspective, our questions are: is the estimated
effect of private schooling reliable? Does it reflect the contribution of private schools to
students’ achievement or only the effect of unobserved variables related to students,
families, peers and/or schools?
3.2.1. Instrumental variables (IV) approach

“Improving Education through Accountability and Evaluation: Lessons from Around the World” Rome, October 3-5, 2012
21
A potentially baseline to estimate the impact of private schooling on students'
achievement with cross-section data is represented by Ordinary Least Squares (OLS)
regression:
(1)
where Yi is the achievement of student i; PRIVi is a dummy variable that equals one
whether the student i attends a private school; Xi is a vector of variables representing
student and family characteristics; and εi is the usual error term, which is assumed to be
uncorrelated with PRIVi. If the latter assumption holds, i.e. there are not variables not
included in the model that are correlated with PRIVi, we can consistently estimate eq. (1)
through OLS estimation.4,5
To address this unobserved heterogeneity issue (endogeneity), we resort to a two-step IV
approach, which is indeed widely used in studies about the relative performances of
students in private and public schools (for similar applications, see e.g. Vandenberghe &
Robin, 2004; Di Pietro & Cutillo, 2006; Gibbons & Silva, 2011). Our model is composed
by two equations: (i) an “attendance equation” estimated through probit (to describe the
probability of attending a private school, given the observable characteristics); and (ii) an
“achievement equation” estimated through OLS.
Conversely, OLS estimates are likely to be biased (e.g. a non-
random selection process in students’ distribution between private and public schools
might “confound” the private schooling effect).
As regards the first equation, the likelihood to attend a private school is given by the
following equation:
4 However, even though this assumption holds, there is still another problem related to the standard errors of our estimation. Suppose that we observe peer characteristics and/or school-level characteristics. If we insert such variables in our model to remove a potential correlation between them (included in εi when they are not included in the vector Xi), we have to cluster the standard errors of our model, usually at school level. 5 It is worth noting that in OLS estimation, the average treatment effect on treated (ATT) and the average treatment effect (ATE) are equivalent (for more details, see Heckman and Navarro-Lozano, 2003).

“Improving Education through Accountability and Evaluation: Lessons from Around the World” Rome, October 3-5, 2012
22
(2)
where PRIVi is a dummy variable that equals one whether the student i attends a private
school (0 otherwise); X1i and X2i are two vectors of student-level and family-level
characteristics, respectively; Zi represents the exclusion restriction (explained in the next
sub-section) acting as a source of randomness in treatment assignment;6 and ε1i
The second equation is modeled in two versions. The first version is given by the
following expression:
is the
usual (potentially heteroskedastic) error term. Student-level characteristics include:
gender, living in urban or non-urban area, nationality and parents’ nationality. Family-
level characteristics include the indicator for socioeconomic condition, ESCS.
(3a)
where PRIVi is the predicted probability of attending a private school, obtained in the
first equation. X1i and X2i are two vectors of student-level and family-level
characteristics, respectively; and ε2i
In the second (extended) version of our second equation, we control for school-level
variables (X
is the usual (potentially heteroskedastic) error term.
Standard errors of eq. (3a) are bootstrapped: the covariance matrix of the final parameters
must take into account of the sampling variation introduced in the two stages of the
estimation. In order to decide the exact number of replications we resort to the rule of
thumb suggested by Efron & Tibshirani (1993).
3i) and peer effects (X4i
):
(3b)
6 Our first equation must include at least one variable that is not included in the second equation. This variable acts as exclusion restriction, i.e. it is correlated with the likelihood to attend a private school but it is not correlated to students' achievement. Alternatively, to identify our model we need to rest on the often 'implausible-in-practice' assumption that private school attendance is a non-linear function of the independent variables included in both equations (for an application, see Somers et al., 2004).

“Improving Education through Accountability and Evaluation: Lessons from Around the World” Rome, October 3-5, 2012
23
Among school-level variables, we include the number of pupils per class, the percentage
of immigrant students, the percentage of disabled students, teachers-students ratio, and
the percentage of rejected students. As peer effect, we include the index ESCS at class-
level.7,8
In this last specification, we cluster the bootstrapped standard errors at class
level.
3.2.2. Choosing the instrument: the expenditure for vouchers
Despite its fascinating methodological characteristics, the implementation of a credible
IV strategy is extremely challenging. In our setting, the main difficulty relies on finding a
variable, which is related to the probability of attending a private school, but unrelated
with the students’ achievement. As suggested by Stock et al. (2002, p. 518): “Finding
exogenous instruments is hard work, and the features that make an instrument plausibly
exogenous, such as occurring sufficiently far in the past to satisfy a first-order condition
or the as-if random coincidence that lies behind a quasi experiment, can also work to
make the instrument weak”. However, for this purpose, we took advantage of a peculiar
characteristic of the school voucher system in the Lombardy Region (for more details on
the voucher plan, see Agasisti, 2009).
First, it is necessary to specify that the institutional settings inhibit private schools to
receive public money; thus they are allowed to charge tuition fees. This financial
constrain actually prevents many families (especially those in economic difficulties) to
enrol. Lombardy was the first Italian region that implemented a voucher scheme in the
year 2000/01, with the explicit aim to stimulate enrolment to private schools 9
7 Through the inclusion of peer effects, we are able to estimate the 'type B effect' (Somers et al., 2004).
. The
political rationale for such policy is that many parents desire to opt for private schools,
but they cannot because of financial obstacles; so that, they should receive public money
8 In the annex A2, we also report the results when considering ESCS at school level instead than at class level. The results turn as completely unaffected by this choice. 9 In 2008/09, the policy has been slightly changed, and now also students in public schools can receive a (small) voucher – its amount is less than on third of that private schools. New details do not affect our considerations here; indeed, the information refers to characteristics of the policy in 2009/10 – the reference year of our analysis. For more details about the new policy, see again Agasisti (2009).

“Improving Education through Accountability and Evaluation: Lessons from Around the World” Rome, October 3-5, 2012
24
to exert their choice. The criterion for vouchers eligibility is twofold: (i) to be enrolled in
a private school, and (ii) to be subjected to a “means test”. With reference to the latter,
only families with an economic indicator below a pre-determined threshold
(46,500€/equivalent) can receive the voucher. This limit is pretty high; the effect is that
the percentage of students who received a voucher was about 70% of the target
population – those attending private schools. However, setting a threshold prevents all
students attending a private school to receive the voucher; this feature of the plan is
extremely important, as it will be used to introduce random variation in the selection
equation to identify the probability of enrolling to a private school.
Overall, in 2009/10, about 100,000 students attended a private school in Lombardy
(around 9% of the whole student population). The practical functioning of the voucher
plan is quite simple. All families who trust to meet the economic requirement (financial
indicator under the threshold and with children attending a private school) can send
(online) an application to the regional government, and if eligible, the chosen school will
receive a voucher covering 25% of the up-front fee (a maximum limit was set at
1,050€/per student). For the families with the lowest financial indicator
(<8,500€/equivalent), a further contribution is available (of a fixed amount: 500€ for
primary schools, 700€ for middle schools, 1,000€ for secondary schools).
One relevant feature for our strategy is that attending a private school is a prerequisite for
obtaining the voucher. That is, our hypothesis is that, all other factors equal, the
availability of vouchers for those attending private schools does stimulate families to
evaluate this opportunity; and, at the margin, some families can decide for going private.
At the same time, there is not any particular reason for which this higher probability to
attend a private school should be related to higher achievement scores.
Moreover, for being a credible instrument, the incentive to attend private schools should
be not uniform, but heterogeneous across Region’s subunits (Provinces) 10
10 Provinces are administrative entities nested into Regions.
. For this
purpose, one argument is that, while the voucher plan is uniform, the geographical
distribution of private schools is not. So that, families are likely to respond differently to

“Improving Education through Accountability and Evaluation: Lessons from Around the World” Rome, October 3-5, 2012
25
the incentive; and this source of variation is related to the probability of attending a
private school but again not to students’ achievement. Moreover, the distribution of
incomes across Provinces is also heterogeneous: for instance, the average “income per
capita” ranges between 25,000€ per worker (Milan) and 15,000€ (Lodi) (source:
Lombardy Region Statistical Office, data are available on request from the authors).
Hence, the threshold set for obtaining a voucher introduces a source of variation that can
be used to estimate the probability to attend a private school, combining this information
with that of available private schools.
Therefore, we use the following indicator as the instrument for attending private school:
Expenditure_inhabitants: [expenditure per voucher (at Province level)/number of
inhabitants (at Province level)]. As the literature pointed out that the instrument itself
could potentially suffer of endogeneity problems, we collected data for 2008/09 instead
of 2009/10, as the 1-year lag can reduce its potential correlation with decisions made by
parents in the reference year. The choice of considering the previous year is also
consistent with the mechanism we have in mind for the instrument: parents observe the
funding level at year t-1, and then make decisions about their children’s enrolment for the
year t. Data were collected from the Lombardy Regional Government; table 4 tabulated
the values taken by this variable (as well as its components, the expenditure level and the
number of inhabitants) for the 11 Lombardy Provinces, together with the “density” of
private schools in such Provinces (number of private schools for every 1,000 students).
<table 4> around here
As can be seen, there is variance among Provinces in the expenditure for vouchers, so we
exploited this variance to instrument the propensity to attend a private school. It is
interesting to note that variance exists in several dimensions: across Provinces – with
some of them attracted higher proportion of expenditures (net of the number of
inhabitants); across grades – with less intensity of the expenditure at grade 6. Also, the
density of private schools shows a relevant variance, which seems also related to the
instrument; the figure 5 plots one variable against the other, and a clear upward slope is
detectable. However, good correlations have been found among the instrument, the

“Improving Education through Accountability and Evaluation: Lessons from Around the World” Rome, October 3-5, 2012
26
density of private schools and the share of students enrolled in private schools, by
Province (table 5).
<figure 5, table 5> around here
After the theoretical justification of our instrument, we tested whether it is relevant from
an empirical point of view. In “first-stage” regressions, all values of the statistic related to
our instrument are above the critical value of 10 (Staiger & Stock, 1997), pointing to a
stronger relevance of our instrument. 11
We also tested a different version of our
instrument, namely the expenditures for voucher divided by the number of students (by
Province), but its explanatory power is not statistically significant in first-stage equations
(z-values <10); we suspect that the original instrument is preferable as it is more
exogenous to the context of the analyses (results in Annex 1).
4. Results
The results are presented in three different subsections. The first contains the (average)
estimated performances’ differentials between public and private schools for the whole
students’ population of the Lombardy Region. The second and third sections deal with
our intuition that the private school effect can be heterogeneous, depending on some
relevant students’ characteristics (like citizenship, location in urban/non-urban area,
socio-economic background). Given the arguments described in section §3, our preferred
estimations are those based on the IV approach, and we rely much of the discussion on
these. However, with the aim of providing a wider picture of our results, we report also
OLS results. In general, we consider OLS estimations as biased, as they did not consier
self-selection of students in private schools; as expected, when controlling for this
through the adequate IV approach, the results change significantly – and we consider IV
results as reliable.
11 Stock et al. (2002) show a table (p. 522) in which they provide critical values of first stage F statistic to detect weak instruments in relation to the number of instruments employed to instrument one endogenous variable. In our case the critical value is 8.96 because Wald tests in first-stage regressions are performed on one instrument. However, such critical values rely on the assumption of homoskedastic serially uncorrelated errors. Conversely, our estimation is robust to heteroskedasticity and autocorrelation among residuals.

“Improving Education through Accountability and Evaluation: Lessons from Around the World” Rome, October 3-5, 2012
27
All tables in this section are structured as follows. They are divided in two parts (panels):
the first panel (A) contains results from regressions that include student-level variables
only (that is, OLS and IV regressions include only student-level data among the
regressors), while the second panel (B) includes also school-level variables. The
organization of the tables makes it easier to consider “raw” effects in panels A, and “net”
effects in panels B, as in the latter compositional variables of schools (i.e. their students’
average socio-economic background) are taken explicitly into account. Only the Average
Treatment on Treated (ATT) effect of attending a private school is reported, while other
coefficients are contained in the Supplementary_Files_(1), which contains details for all
the estimates. ATT coefficients are reported with their t-values (z when adequate). The
regressions, when necessary, have standard errors adjusted at school/class level for
considering the clustered nature of data. General robustness checks are provided to test
the reliability of our results: (i) the use of an alternative instrument (Annex A1), and (ii)
the substitution of ESCS at class level with ESCS at school level (Annex A2). We
reported “beta coefficients”, which are calculated by standardizing variables to have their
variances equal to 1. This is the most common way to report results, as the magnitude of
the effect can be easily interpreted as how many standard deviations a dependent variable
(in this case, test score) will change, per standard deviation increase in the independent
variable (in this case, attending a private school). Lastly, it is important to point out that
in some elaborations we missed some observations, given that observations with missing
values in one or more of the variables are excluded. However, we checked for potential
differences between population and sample (namely, the distribution across Provinces,
and the proportion of students attending private schools), and chi-square tests reveal that
the sample does not lose the ability to represent the original population (results available
from the authors).
4.1. Comparing the performances of private and public schools: a first glance
Table 6 reports the estimated effect of attending a private school at grade 5 (primary
schools). The first column for both Reading and Math scores reports a negative
“Improving Education through Accountability and Evaluation: Lessons from Around the World” Rome, October 3-5, 2012
28
coefficient, thus suggesting that attending a private school has a negative effect on
students’ outcome. This result seems in line with previous studies about Italy (section 2).
IV estimates, however, reports negative coefficients that are not statistically significant
(Panel B); our interpretation is that Panel A indicates a compositional effect. Some
explanation is needed here. Along all the paper, we separated the estimations in which
student-level variables only are used from those where we also included school-level
variables. In the IV approach case, it means that the second-stage regression (that in
which the predicted probability to attend a private school is among covariates) includes
student-level variables in Panel A, and both student and school-level variables in Panel
B12
Overall, the results for grade 5 show no “private school effect” for reading and math
scores; potential explanations for this finding are discussed in the section 5.
. As school-level variables include information about compositional effects (i.e. the
students’ average socioeconomic background), a difference in the estimated effect of
attending a private school between Panel A and B can be attributed to the explanatory
power captured by school variables – others than the “treatment” private-school effect. In
this case of reading scores, for instance, the second stage regression with school-level
covariates shows that the average ESCS (measured at class level) has a negative impact
on students’ achievement; so that the regression without such variable (panel A)
attributed this negative effect to the dummy “Private”.
Table 7 reports the estimated effect of attending a private school at grade 6 (middle
schools). The first column for both Reading and Math scores reports the well-known
negative coefficient. While IV results deriving from regressions with student-level
variables only evidenced a positive effect of private (even statistically significant for
Math, and equal to 0.18 sd, which is pretty high), when including school-level
compositional variables such effect disappears. Our interpretation is that the advantages
related to attending private schools actually masked a compositional effect of these
schools (in terms of better socio-economic average conditions).
<tables 6, 7> around here 12 However, the probability to attend a private school is always computed with reference to student-level variables only plus the instrument.

“Improving Education through Accountability and Evaluation: Lessons from Around the World” Rome, October 3-5, 2012
29
To sum up this first part of results, it seems to be no evidence of a positive “private
school effect”. However, results from previous studies about Italian students, which
found a negative effect associated with attendance of private schooling, are not confirmed
as well.
4.2. More on the “private school” effect: heterogeneity
Our intuition is that the effect of attending a private school can be differentiated across
subgroups. More specifically, we would test whether ATT is different in case of (i)
school’s location (non-urban/urban area), (ii) citizenship (Italian; immigrant), and (iii)
socioeconomic status (ESCS index below/above the mean = 0).
The results for primary schools show no particular patterns (tables 8a,b; 9a,b; 10a,b).
Generally, the OLS estimations report negative coefficients related to the private school
effect, but as we consider them biased no comments are provided for them. The
remarkable result is that IV estimates suggest that attending a private school is
statistically associated with lower performances for immigrant students. Here, the
statistical significance is still not high (10% level for Reading scores, 5% for Math) but
the magnitude is really high (ranging from 0.9 to 1.2 s.d.). Lastly, heterogenous effects
for reading are detected in the two separate groups of “relatively rich” and “relatively
poor” students (ESCS indicator above/below the mean = 0): attending a private school
seems beneficial for less advantaged students, and the magnitude of the effect is large
(around 0.7 s.d.).
Then, the analysis focuses on middle schools. Tables 11a,b contain the estimates for the
schools located in urban and non-urban area. It is important to recall that the former
refers to the location in the leading city of the Province, so there are 11 urban areas, and
11 corresponding non-urban. Here, it turns out that attending a private school is
beneficial for students in non-urban area; while Panel A suggests that part of this effect is
driven by compositional effects, IV estimates are still positive after controlling for
school-level factors for math scores. The effect is quite large (0.42 s.d.) compared with

“Improving Education through Accountability and Evaluation: Lessons from Around the World” Rome, October 3-5, 2012
30
other school-level variables (e.g. the percentage of foreign students, that is -0.33 s.d.) and
even individual characteristics, like ESCS (0.24 s.d.).
The results for the immigrants and Italian students are separately presented in the table
12a,b. In this case, the findings are less intriguing, as there are not statistically significant
results (apart from the likely biased OLS negative coefficients).
Lastly, the picture that emerges from the comparison between students who are relatively
well-off (ESCS>0) and those who are in a relative socio-economic difficulty (ESCS<0)
reveals some interesting patterns (table 13a,b). First, attending a private school is not
associated with higher performances for the less favourite students. This result is in
contrast with previous literature, especially in the US, which found benefits for students
from poorest families. Our results suggest quite the contrary, that is more favoured
students (ESCS>0) do obtain a relative advantage from attending a private school. This
latter effect seems not to be driven exclusively by compositional characteristics of the
school (see that it is also likely to exist, panel A) but it is an independent effect when
considering math score as output. Indeed, the ATT estimate is about 0.37 s.d. net of
school level variables; the magnitude of the effect is high (in comparison with the
percentage of foreign students, that is -0.11 s.d., even not statistically significant; and
ESCS, which is equal to 0.16 s.d.) and it is statistically significant at 5% level.
<tables 8a,b; 9a,b; 10a,b; 11a,b; 12a,b; 13a,b> around here
Overall, the picture that emerges from analyses on primary schools is that heterogeneity
of private schooling does exist: it has been found that immigrant students perform worse
in private than in public schools. The magnitude of these negative effects is relevant,
even huge for immigrants (ranging from 0.9 to 1.1 s.d.). At the same time, private
schooling is related to higher reading performances for disadvantaged students. From the
findings about middle schools, it could be also that there is a quite heterogeneous effect
of private schooling on students’ outcomes (achievement), but with a different direction.
Indeed, our findings reveal that attending a private school is beneficial on math scores (i)
for students enrolled in schools located in non-urban areas, or (ii) for those with higher
ESCS (>0). The magnitude of these effects is also high (between 0.37 and 0.42 s.d.) and

“Improving Education through Accountability and Evaluation: Lessons from Around the World” Rome, October 3-5, 2012
31
statistically significant. Given these results, it is difficult to build a unitary picture of the
“private school effect”; rather, it makes sense to consider heterogeneity as the keyword
here. While the previous literature about Italian education aimed at concluding that “(…)
private schools appear to play a remedial role (…), they increase the performance of
students from rich families, but their value added seems to be the recovery of less
brilliant students rather than across-the-board high quality education” (Bertola &
Checchi, 2004; p.97), we provide evidence that the story seems more complex, and that
the role of private schooling is likely to be heterogeneous and dependent on differences
among students, classes and schools.
4.3. More on heterogeneity
Following our intuition, we performed some further analyses about the different impact
associated with the attendance of a private school.
First, we tried to investigate more the effect for immigrant students, as they represent a
particularly important sample for the Italian context. As immigrants suffer some well-
known problems in their educational career (related to difficulties in language and worse
socio-economic background), it is important to test whether attending a private school
could be beneficial for them. While the results from our estimates do not provide any
evidence in this direction, we looked at potential differences between first-generation
immigrants (sons of immigrants, born in a foreign country) and second-generation
immigrants (sons of immigrants, born in Italy). Table 14 reports the results by
distinguishing the private school effects for the two groups13
<Table 14> here
.
The results are interesting as they depict an intriguing story. On one side, the negative
effect associated with the attendance of a private school is confirmed for immigrant
students at grade 5; however, this effect is confined to first-generation immigrants,
suggesting that they receive more attention into public schools, which educate every year
a large number of immigrant students so they can benefit from experience with this group 13 IV estimates suffer the low powerfulness of the instrument in the first-stage (z-values <10), but it may be due to the small number of foreign students so we did not consider this as a major problem.
“Improving Education through Accountability and Evaluation: Lessons from Around the World” Rome, October 3-5, 2012
32
of special-needs students. On the other side, private school effect is positive (for reading)
for second-generation immigrants at grade 6; this result probably suggests that these
students, who are better integrated in the society, actually benefit from private schooling.
Overall, the results about private school effects for immigrant students reveal another
source of heterogeneity, which is related to the different status of these students – namely
the “degree of integration” into the society; such differentiation should be borne in mind
by policy-makers when defining interventions for improving the educational performance
of immigrant students.
Second, we considered the potential heterogeneity of private schooling effect at different
points of the socioeconomic background’s (ESCS) distribution. For this purpose, we
replicated our IV estimates in the following subgroups of students, according to their
ESCS’s percentiles: 90th, 75/90th, 50/75th, 25/50th, 10/25th, 10th
<table 15> around here
. It is important to note
here that the meaning of the results, and their interpretation, is different from what we
analysed in section 4.2, when we compared students with ESCS higher or lower than
zero. Indeed, in the latter case, the results reveal whether private schooling has a different
effect on (relatively) rich and poor students, considering their absolute socioeconomic
condition. Instead, here the aim is to understand whether is there a private school effect
for students at different point of the ESCS distribution; this information is useful as the
ESCS distributions between students attending public and private schools are
significantly different. By looking the figure 2 (panels a,b), it could be noted that ESCS
mean is around 0 for students attending public schools, while it is around 0.7 for students
attending private counterparts. Consequently, the results here show whether (relatively)
richer students attending private schools obtain higher results than students attending
public schools in different percentiles of the ESCS distribution. Table 15 reports these
estimates.
Our findings interestingly reveal that, when considering grade 5 (primary schools), there
is a positive effect of private schools on reading achievement, for the better-off students
(>90th percentile, and 50/75th percentile). These results seem contradictory with the
“Improving Education through Accountability and Evaluation: Lessons from Around the World” Rome, October 3-5, 2012
33
baseline figures reported in table 8, which underlined a positive effect for worse-off
students (ESCS<0). However, the number of students attending private schools with a
ESCS<0 is very low, so baseline results can be highly determined by this skewed
distribution. Nevertheless estimates at the lowest percentiles of the ESCS distribution
have a low statistical power because of the small number of students from disadvantaged
background attending private schools, but they report a positive effect (albeit not
statistically significant) also on students between 10th and 50th
Turning to grade 6 (middle schools), there is a positive and statistically significant private
school effect on math achievement, almost on the entire distribution (but not at the
extremes), as well as positive effects at the some percentiles for reading.
percentile.
In general, it looks like that private schooling exerts a positive effect on students’
achievement at grade 6, even though such effect is generally higher at lower points of the
ESCS distribution. On the other side, the only positive effect at grade 5 is limited to
reading at the higher points of the distribution (>50th
Once again, the main message from this further analysis is that private schooling’s effect
is very heterogeneous.
percentile).
5. Discussion and concluding remarks
The present paper investigates the relative performance of public and private schools
located in an Italian Region, by analysing 74,265 students in 1,050 primary schools
(grade 5) and 74,358 students in 900 middle schools (grade 6) – reference year: 2009/10.
Employing an IV approach we found that, overall, private schooling attendance is
associated with worse academic results in primary-level and better results in middle-level
education. The (negative) effects especially hold for foreign students, when considering
grade 5, while there is a positive effect for less advantaged students (ESCS<0); the
positive effects at grade 6 are for (relatively) better-off students and those attending a non
urban-school. These impacts are statistically significant when using math score as output,
except for the effect on reading score for students enrolled in non-urban middle private
schools. A synthetic and qualitative glance to the results is contained in table 16.

“Improving Education through Accountability and Evaluation: Lessons from Around the World” Rome, October 3-5, 2012
34
The main finding of this research is that the so-called “private school effect” does not
exist as a whole, but it is likely to be heterogeneous depending on students, classes and
students’ characteristics. The investigation of such heterogeneity should become an
increasingly important focus when comparing private and public schools.
A key point is also related to the different estimates for primary and middle schools, as
there seems to be a positive association between private schooling and performance, for
grade 6 and negative for grade 5 (net of heterogeneous effects). With the aim of
providing an intuitive preliminary argument towards that objective, we looked at the
initial distributions of test scores across grades (5/6) and school types (private/public).
We graphed the (kernel) densities of scores, and report them in the appendix B (figures
B1 and B2)14
Another specific point related to differences across grades is that the results for primary
schools are based on comparison among students who attended those schools for five
years; while students at grade 6 attended their middle school only for one year. As we
cannot control for prior achievement – this is unavailable information – this must be kept
. Obviously, it is hard to infer anything robust from simple distributions.
Nevertheless, there is an interesting pattern to note in these figures. While for primary
schools the distributions of public and private schools’ performances almost overlap
(with only a small higher peak for the former), when looking to middle-level education
the private schools’ distribution of test scores seems to be slightly shifted to the right than
the public schools’ distribution (especially, for math). A potential suggestive
interpretation should be that there are no “raw” differences in test score between private
and public primary schools, so that as the former have better background, they are
relatively worse than the latter all other else equal. On the contrary, private middle
schools outperform their public counterparts – as the distribution shown – but this effect
is lower when the confounding compositional variables are equalized. A related story is
that public schools’ quality is higher at primary than at middle-level of education, so that
the relative performance of private schools (which in this interpretation is similar in the
two grades) results higher for middle and lower for primary-level education.
14 Figure B3 reports the same distributions by means of boxplots.

“Improving Education through Accountability and Evaluation: Lessons from Around the World” Rome, October 3-5, 2012
35
in mind, as estimations of “private school effects” at grade 6 can be affected by
unobservable differences in the type of education attended at primary education-level.
The lack of prior achievement is, however, a minor problem if a positive relationship
between a student’s SES and academic results can be trust; if it is the case (as
demonstrated in this paper and in the literature), the (available) indicator of SES partly
contains information also about previous students’ performances.
Even after having obtained credible results about the effects of private schooling on
students’ achievement, a key question remains unanswered: why do private schools
influence (positively or negatively) the performance of students? The economic literature
provided good pieces of empirical evidences on the direction of the effects (see section
2), but did not go into deeper explanations of particular school characteristics that “make
the difference” – with the exception of the socio-economic composition. In our view, this
is a strong limitation of the economics of education in this field, and the present paper
suffers this limitation too. As a direction for future research, we believe that school-level
variables included in the empirical analyses should be improved (i.e. should measure
more sophisticated schools’ processes and features) also through positive contaminations
with other disciplines. In this perspective, two streams of the literature appear as
particularly promising for potential integration: the “educational effectiveness” approach
(Scheerens & Bosker, 1997) and the study of “academic optimism” as a latent concept (a
good summary in contained in Hoy, 2012).
Our findings have two clear policy consequences. The first is that agencies that are in
charge of evaluating schools should consider compositional variables and institution-
level factors for “adjusting” their performances. We demonstrated in this paper that
simple OLS estimates fail to account for schools’ compositional effects. Especially when
agencies (or the Ministry) intend using school-level (average) academic results for
economic and organisational rewards or punishments, this methodological shortcoming
should be born in mind. The second policy implication deals with the provision of
information to parents. It is not clear whether the Italian families’ perception of private
schools is of better or worse quality institutions; in both cases, it is unlikely that such

“Improving Education through Accountability and Evaluation: Lessons from Around the World” Rome, October 3-5, 2012
36
perceptions are based on solid and robust scientific evidence. If it is the case, all the
arguments in favour of competition among schools are questionable, as the market
mechanism requires as much information as possible for the “clients”. This problem is
exacerbated by the fact that scores in standardized tests at school level are confidential,
so the citizens cannot access them. Recently, many schools decided to disclosure their
score; but as information about school’s composition is generally missing, then the result
itself is only a (very) partial piece of the true “school effect”. This paper demonstrates
how this problem is particularly affecting the comparison between private and public
schools, and this will affect the families’ awareness when making their educational
choices.
The political and institutional debate in favour or against the introduction of market
mechanisms in the educational system is still open in Italy. Recently, some members of
the Government and the Parliament proposed to start a deregulation process in the
educational sector, towards a School Based Management (SBM) approach; if it will
happen, robust information about the relative performances of private and public schools
will become crucial. The present contribution can be interpreted as a step towards this
objective; and our main message is that “private school effect” is likely to be
heterogeneous, and it requires broad information, numbers and statistics to be correctly
evaluated across grades and different subgroups of students and schools.

“Improving Education through Accountability and Evaluation: Lessons from Around the World” Rome, October 3-5, 2012
37
References
Abadie, A., Imbens, G.W., (2006), Large Sample Properties of Matching Estimators for
Average Treatment Effects, Econometrica, 74(1), 235-267.
Abdulkadiroglu, A., Angrist, J.D., Dynarski, S.M., Kane, T.J. and Pathak, P.A. (2011),
Accountability and flexibility in public schools: evidence from Boston’s Charters and
Pilots, Quarterly Journal of Economics, 129, 699-748.
Agasisti, T., (2009), School vouchers in Italy: theory, design, effects, available online
at http://papers.ssrn.com/sol3/papers.cfm?abstract_id=1482852.
Agasisti, T., (2011), “Does competition affect schools’ performance? Some evidence
from Italy through OECD-PISA data”, European Journal of Education, 46(4), 549-
565.
Agasisti, T., Vittadini, G., (2012), Regional economic disparities as determinants of
students’ achievement in Italy, Research in Applied Economics, 4(1), 33-53.
Anand, P., Mizala, A. and Repetto, A. (2009), Using school scholarships to estimate the
effect of private education on the academic achievement of low-income students in
Chile, Economics of Education Review, vol. 28, pp. 370-381.
Angrist, J.D., Pischke, J.S., (2009), Mostly Harmless Econometrics: an empiricist’s
companion, Princeton University Press: Princeton (USA).
Angrist, J.D., Dynarski, S.M., Kane, T.J., Pathak, P.A. and Walters, C. R. (2010), Inputs
and impacts in charter schools: KIPP Lynn, American Economic Review, vol. 100, pp.
239-243.
Angrist, J.D., Pathak, P.A. and Walters, C.R. (2011), Explaining Charter School
Effectiveness, NBER Working Paper no. 17332, available
at http://www.nber.org/papers/w17332.
Barrow, L. and Rouse, C.E. (2008), School vouchers: recent findings and unanswered
questions, 3Q/2008, Economic Perspectives, available at http://ssrn.com/
abstract=1268316.

“Improving Education through Accountability and Evaluation: Lessons from Around the World” Rome, October 3-5, 2012
38
Bertola, G., Checchi, D., (2004), Sorting and private education in Italy, in Checchi, D.,
and Lucifora, C. (eds.), Education, Training and Labour market outcomes in Europe,
Palgrave, London.
Bertola, G., Checchi, D. and Oppedisano, V. (2007), Private School Quality in Italy,
Giornale degli Economisti e Annali di Economia, 66(3), 375-400.
Bosker, R.J., (2011), The international evidence about the relative performance of public
and private schools – theory and practice, Invited Lecture at the CRISP seminar “La
qualità della scuola pubblica e privata in Italia”, April 28th
Brunello, G., Checchi, D., (2005), School Vouchers Italian Style, IZA Dicussion Paper
No. 1475.
: Milan (Italy).
Brunello, G. Rocco, L. (2008), Educational Standards in Private and Public Schools, The
Economic Journal, 118, 1866-1887.
Campodifiori, E., Figura, E., Papini, M., Ricci, R., (2010), Un indicatore di status socio-
economico-culturale degli allievi della quinta primaria in Italia (An indicator for
students’ socio-economic background), INVALSI Working Paper no. 02/2010,
INVALSI, available at http://www.invalsi.it/download/wp/wp02_Ricci.pdf.
Checchi, D. and Jappelli, T. (2004), School Choice and Quality, CEPR Discussion Paper
No. 4748.
Chubb, J.E. and Moe, T.M. (1990), Politics, Markets and America’s schools, Brookings
Institution, Washington, DC.
Coleman, J.S., Hoffer, T., Kilgore, S. (1982), High school achievement: Public, Catholic
and private schools compared, Basic Books, New York.
Coulson, A.J., (2009), Comparing public, private and market schools: the international
evidence, Journal of School Choice, 3(31), 31-54.
Dehejia, R.H. and Wahba, S. (2002), Propensity score-matching methods for
nonexperimental causal studies, The Review of Economics and Statistics, 84(1),151-
161.
Di Pietro, G., Cutillo, A., (2006), Does attending a Catholic school make a difference?
Evidence from Italy, Bulletin of Economic Research, 58(3), 193-234

“Improving Education through Accountability and Evaluation: Lessons from Around the World” Rome, October 3-5, 2012
39
Dronkers, J. and Robert, P. (2008), Differences in Scholastic Achievement of Public,
Private Government-Dependent, and Private Independent Schools – A Cross-National
Analysis, Educational Policy, 22(4), 541-577.
Efron B., Tibshirani, R., (1993), An introduction to the bootstrap, Chapman & Hall: New
York (US).
Epple, D. and Romano, R. (1998), Competition between private and public schools,
vouchers and peer group effects, American Economic Review, 88, 33-62.
Evans, W., Schwab, R., (1995), Finishing high school and starting college: do Catholic
schools make a difference? Quarterly Journal of Economics, 110, 941-74.
Figlio, D., Stone, J.A., (1997), School choice and student performance: are private
schools really better?, Discussion paper 1141-97, Institute for Research on Poverty,
University of Wisconsin-Madison.
Friedman, M. (1955), The role of Government in Education, in Solo, E.A. (ed.),
Economics and the Public Interest, Rutgers University Press: New Brunswick, (USA).
Gibbons, S. and Silva, O. (2011), Faith Primary Schools: Better Schools or Better
Pupils?, Journal of Labor Economics, 29(3), 589-635.
Goldhaber, D., (1996), Public and private high schools: is school choice an answer to the
productivity problem?, Economics of Education Review, 15, 93-109.
Heckman, J., Navarro-Lozano, S., (2004), Using Matching, Instrumental Variables, and
Control Functions to Estimate Economic Choice Models, The Review of Economics
and Statistics, 86(1): 30-57.
Hoy, W., (2012), School characteristics that make a difference for the achievement of all
students: A 40-year odyssey, Journal of Educational Administration, 50(1), 76-97.
Hoxby, C. (1998), What Do America’s ‘Traditional’ Forms of School Choice Teach Us
about School Choice Reforms?, Federal Reserve Bank of New York Economic Policy
Review, 4(1), 47-59.
Hoxby, C., (ed.) (2003), School choice and school productivity: could school choice be a
tide that lifts all boats?, in Hoxby, C. (ed.), The economics of school choice, 287-340,
University of Chicago Press: Chicago (USA).

“Improving Education through Accountability and Evaluation: Lessons from Around the World” Rome, October 3-5, 2012
40
INVALSI, (2010), Esami di Stato 2009/10, INVALSI: Rome.
Jepson, C., (2003), The effectiveness of Catholic schooling, Journal of Human
Resources, 38(4), 928-41.
Lechner, M., (2002), Program Heterogeneity and Propensity Score Matching: An
Application to the Evaluation of Active Labor Market Policies, The Review of
Economics and Statistics, 84(2), 205-220.
McEwan, P. (2011), The Effectiveness of Public, Catholic, and Non-Religious Private
Schools in Chile’s Voucher System, Education Economics, 9(2), 105-128.
Murnane, R.J., Willet, J.B. (2011), Methods matter: improving causal inference in
educational and social science research, Oxford University Press: New York (USA).
Neal, D., (1997), The effects of Catholic secondary schooling on educational
achievement, Journal of Labor Economics, 15, 98-123.
Nguyen, A.N., Taylor, J., (2003), Post-high school choices: new evidence from a
multinomial logit model, Journal of Population Economics, 16(2), 287-306.
Nguyen, A.N., Taylor, J., Bradley, S. (2006), The estimated effect of Catholic schooling
on educational outcomes using propensity score matching, Bulletin of Economic
Research, 58(4), 285-307.
OECD, (2011), Private schools: who benefits? PISA in Focus, 2011/7, August, OECD:
Paris (France).
Rosenbaum, P., (1995), Observational Studies, Springer: New York (US).
Rosenbaum, B., Rubin, D., (1983), The central role of the propensity score in
observational studies for causal effects, Biometrika, 70(1), 41-55.
Rouse, C.E., (1998), Private school vouchers and student achievement: an evaluation of
the Milwaukee parental choice program, Quarterly Journal of Economics, 113(2), 553-
602.
Sander, W., Cohen-Zada, D., (2010), The economics of Catholic schools, in Brewer, D.J.,
McEwan, P.J. (eds.), The Economics of Education, 317-322, Elsevier Academic Press:
San Diego (USA).

“Improving Education through Accountability and Evaluation: Lessons from Around the World” Rome, October 3-5, 2012
41
Scheerens, J. & Bosker, R., (1997), The foundations of educational effectiveness,
Elsevier Science Press: Oxford (UK).
Smith, J., Todd, P., (2005), Does matching overcome Ladonde’s critique of
nonexperimental estimators?, Journal of Econometrics, 125, 305–353.
Somers, M.A., McEwan, P.J. and Willms, J.D. (2004), How Effective Are Private
Schools in Latin America?, Comparative Education Review, 48(1), 48-69.
Staiger, D., Stock, J.H. (1997), Instrumental Variables Regression with Weak
Instruments, Econometrica, 65(3), 557-586.
Stock, J.H., Wright, J.H., Yogo, M., (2002), A Survey of Weak Instruments and Weak
Identification in Generalized Method of Moments, Journal of Business & Economic
Statistics, 20(4), 518-529.
Turati, G., Montolio, D., Piacenza, M., (2011), Fiscal decentralisation, private school
funding, and students’ achievement. A tale from two Roman Catholic countries, IEB
Working Papers, n. 2011/44.
Vanderberghe, V. and Robin, S. (2004), Evaluating the effectiveness of private education
across countries: a comparison of methods, Labour Economics, 11, 487-506.
Zimmer, R., Buddin, E., (2010), The economics of charter schools, in Brewer, D.J.,
McEwan, P.J. (eds.), The Economics of Education, 329-335, Elsevier Academic Press:
San Diego (USA).

“Improving Education through Accountability and Evaluation: Lessons from Around the World” Rome, October 3-5, 2012
42
Table 1. Public and private schools in Italy and in the Lombardy Region, 2009
Public schools Private schools Students attending public schools
Students attending
private schools # % # % # % # %
Lombardy 4,581 86.4% 722 13.6% 981,220 90.9% 98,189 9.1% Italy 33,644 a 90.1% 3,713 9.9% 6,871,889 94.3% 418,386 5.7%
Notes: a
Source: MIUR (
It also embodies schools directly managed by Valle d’Aosta and Trentino Alto Adige but accredited by the Ministry of Education. These regions have more autonomy than other regions.
http://oc4jesedati.pubblica.istruzione.it/Sgcnss/index.jsp).

Table 2. Variable list and definitions Name Definition Dependent Variables math The individual math score obtained in 2009/10 [0;100] read The individual reading score obtained in 2009/10 [0;100] private Dummy variable that takes the value 1 in case of private school and 0 in case of public school Student’s characteristics nursery Dummy variable that takes the value 1 if the student attended to nursery and 0 otherwise kinderg Dummy variable that takes the value 1 if the student attended to kindergarten and 0 otherwise born_father, born_mother
Dummy variable that takes a value in according to the place where the student's father/mother bore. It takes the value: 1 in case of Italy; 2 in case of European Union Country; 3 otherwise
edu_father, edu_mother
Categorical variable that takes a value in according to the place where the student's father/mother bore. It takes the value: 1 in case of primary school; 2 in case of middle school; 3 in case of vocational school; 4 in case of secondary school; 5 in case of higher education; 6 in case of PhD.
job_father, job_mother
Categorical variable that takes a value in according to the work type that of the student's father/mother. It takes the value: 1 in case of unemployed; 2 in case of housewife; 3 in case of professor, army officer or manager; 4 in case of entrepreneur; 5 in case of dependent professionist, physician, lawyer or researcher; 6 in case of artisan, retailer or mechanic; 7 in case of teacher or office worker; 8 in case of worker; 9 in case of retired.
gender Dummy variable that takes the value 1 if the student is a female and 0 otherwise
year Categorical variable that takes a value in according to the student's date of birth. It takes the value: 1 in case 1995 or before; 2 in case of 1996; 3 in case of 1997; 4 in case of 1998; 5 in case of 1999; 6 in case of 2000 and onward.
born Categorical variable that takes a value in according to the place where the student was born. It takes the value: 1 in case of Italy; 2 in case of European Union Country; 3 otherwise
ontime Categorical variable that takes a value in according to the time in which the student enrolled in the school comparing with supposed time (by the law). It takes the value: 1 in case of regular; 2 in case of early enrolment; 3 in case of later enrolment
citizenship Categorical variable that takes a value in according to the student's citizenship. It takes the value: 1 in case of Italian; 2 in case of first generation foreign; 3 in case of second generation foreign

“Improving Education through Accountability and Evaluation: Lessons from Around the World” Rome, October 3-5, 2012
44
ESCS Indicator of the economic, social and cultural student's background School’s characteristics class Number of classes per school pupils Number of pupils per school teach_tot Number of teachers per school pupils_class Number of pupils per class pdisabled Percentage of disabled students per school teach_stud Teachers:students ratio prejected Percentage of rejected students per school pforeign Percentage of foreign students per school Contextual Variables v_sum_non-urban Total amount of voucher resources awarded in the non-urban area of each province v_sum_unnon-urban Total amount of voucher resources awarded in the urban area of each province v_avg_non-urban Average amount of single voucher awarded in the non-urban area of each province v_avg_unnon-urban Average amount of single voucher awarded in the urban area of each province v_avg_tot Average amount of single voucher awarded in each province v_sum_tot Total amount of voucher resources awarded in each province citizen Number of inhabitants in each province
prov Dummy variable that takes a value in according to province where the student lives. It takes value from 1 to 11, for each province
urban Dummy variable that takes the value 1 in case of the school is located in an urban area and 0 in case of non-urban area

“Improving Education through Accountability and Evaluation: Lessons from Around the World” Rome, October 3-5, 2012
45
Table 3. Descriptive statistics, by school type
Primary Schools Middle Schools
Public Schools Private Schools Public Schools Private Schools Variables Obs. Mean St.Dev. Obs. Mean St.Dev. N mean sd Obs Mean St.Dev.
read 72,228 68.51 17.03 7,020 70.80 16.25 74,335 62.88 15.03 7831 67.67 12.92 math 71,436 62.63 17.28 6,961 65.07 16.10 74,300 54.03 18.08 7835 58.21 17.19 nursery 48,688 0.23 0.42 4,148 0.30 0.46 49,519 0.23 0.42 4646 0.26 0.44 kinderg 66,811 0.97 0.18 6,168 0.99 0.10 60,991 0.96 0.20 6513 0.98 0.13 edu_father 58,192 3.20 1.38 5,851 4.21 1.47 56,356 3.17 1.38 6351 4.10 1.48 job_father 58,743 6.45 1.68 6,162 5.48 1.54 56,631 6.44 1.70 6973 5.52 1.53 edu_mother 59,077 3.37 1.34 5,907 4.27 1.36 57,226 3.31 1.34 6405 4.18 1.37 job_mother 60,267 5.14 2.50 6,257 5.17 2.10 58,149 5.12 2.52 7089 5.18 2.12 gender 73,704 0.49 0.50 7,124 0.49 0.50 73,664 0.48 0.50 7730 0.48 0.50 year 73,785 4.00 0.29 7,134 4.06 0.28 73,674 3.93 0.39 7799 4.03 0.28 born 72,018 1.21 0.71 6,988 1.08 0.42 72,498 1.28 0.80 7648 1.07 0.41 citizenship 73,195 1.21 0.55 7,131 1.07 0.35 73,558 1.22 0.53 7817 1.05 0.30 ESCS 72,228 -0.03 0.95 7,020 0.77 0.93 74,335 -0.01 0.95 7831 0.84 0.93 class 74,265 28.20 8.95 7,191 9.21 4.04 74,538 19.21 8.69 7852 7.70 3.43 pupils 74,265 562.34 188.03 7,191 206.80 89.96 74,538 429.40 207.61 7852 190.15 96.49 urban 74,265 0.19 0.39 7,191 0.50 0.50 74,538 0.20 0.40 7852 0.46 0.50 pupils_class 74,265 19.93 2.07 7,191 22.50 3.25 74,538 22.11 1.81 7852 24.11 3.40 pforeign 74,265 0.15 0.08 7,191 0.02 0.04 74,538 0.14 0.08 7852 0.01 0.02 pdisabled 74,265 0.03 0.01 7,191 0.01 0.02 74,538 0.04 0.02 7852 0.02 0.02 prejected 74,265 0.00 0.00 7,191 0.00 0.00 74,538 0.04 0.03 7852 0.01 0.02 teach_stud 74,265 0.10 0.02 7,191 0.08 0.03 74,538 0.11 0.02 7852 0.11 0.04

Table 4. The expenditure for vouchers in the Lombardy Provinces, 2008/09
Primary Schools Middle Schools
Province Inhabitants Expend
(total) for vouchers (€)
Expend_Inhab.
Private Schools Density (#private
schools/inhab.*1,000)
Expend (total) for vouchers
(€)
Expend_ Inhab.
Private Schools Density (#private
schools/inhab.*1,000)
(1) (2) (3) (4) (5) (6) (7)
Bergamo 1,098,740 2,109,071 1.92 0.58 2,052,122 1.87 0.74 Brescia 1,256,025 1,219,187 0.97 0.41 1,355,943 1.08 0.61 Como 594,988 925,782 1.56 0.48 877,448 1.47 0.74 Cremona 363,606 357,813 0.98 0.52 245,829 0.68 0.32 Lecco 340,167 717,664 2.11 0.57 697,520 2.05 0.85 Lodi 227,655 207,678 0.91 0.50 177,375 0.78 0.48 Milano 4,006,330 7,228,495 1.80 0.64 5,960,591 1.49 0.83 Mantova 415,442 83,240 0.20 0.16 68,104 0.16 0.19 Pavia 548,307 349,715 0.64 0.36 248,515 0.45 0.38 Sondrio 183,169 75,495 0.41 0.12 40,791 0.22 0.18 Varese 883,285 1,210,869 1.37 0.50 1,337,172 1.51 0.75
Notes. The number of inhabitants has been extracted by the Regional Statistical Agency. The expenditure for vouchers has been collected from the Regional Government Office for Education. The number of private schools has been crosschecked in our dataset and in the Ministry of Education dataset. The expenditures refer to academic year 2008/09 and not to 2009/10. The use of a lagged measure for this variable (that has been used as an instrument) reduces its potential endogeneity.

“Improving Education through Accountability and Evaluation: Lessons from Around the World” Rome, October 3-5, 2012
47
Table 5. Figures about the instrument, the density of private schools and the share of students enrolled in private schools Primary schools Middle schools
Province % enrolled in
private schools
Instrument Private schools' density
% enrolled in private schools
Instrument Private schools' density
(1) (2) (3) (4) (5) (6) BG 0.10 1.92 0.58 0.12 1.87 0.74 BS 0.07 0.97 0.41 0.08 1.08 0.61 CO 0.07 1.56 0.48 0.10 1.47 0.74 CR 0.08 0.98 0.52 0.05 0.68 0.32 LC 0.10 2.11 0.57 0.14 2.05 0.85 LO 0.09 0.91 0.50 0.05 0.78 0.48 MI 0.11 1.80 0.64 0.11 1.49 0.83 MN 0.01 0.20 0.16 0.01 0.16 0.19 PV 0.05 0.64 0.36 0.04 0.45 0.38 SO 0.01 0.41 0.12 0.01 0.22 0.18 VA 0.08 1.37 0.50 0.12 1.51 0.75 Correlations (1) (2) (3) (4) (5) (6)
(1) 1.000 (2) 0.882 1.000 (3) 0.986 0.866 1.000 (4) 0.845 0.955 0.828 1.000 (5) 0.840 0.975 0.814 0.986 1.000 (6) 0.846 0.933 0.828 0.977 0.958 1.000 Notes: in bold, the relevant correlations (by grade). Data about the share of schools enrolled in private schools were crosschecked between our dataset and the data from the Ministry of Education. See table 3 for other notes.

Figure 1. Descriptive statistics – histograms from categorical variables Panel A. Primary schools – grade 5

“Improving Education through Accountability and Evaluation: Lessons from Around the World” Rome, October 3-5, 2012
49
Panel B. Middle schools – grade 6

“Improving Education through Accountability and Evaluation: Lessons from Around the World” Rome, October 3-5, 2012
50
Figure 2. Descriptive statistics, overall distributions, by school type Panel A. Primary schools – grade 5

“Improving Education through Accountability and Evaluation: Lessons from Around the World” Rome, October 3-5, 2012
51
Panel B. Middle schools – grade 6

Figure 3. The correlation between proficiency scores and students’ background Panel a. Primary schools
Panel b. Middle schools

“Improving Education through Accountability and Evaluation: Lessons from Around the World” Rome, October 3-5, 2012
53
Figure 4. The comparison of students’ performance between public and private schools and between urban and non-urban area Panel a. Primary schools
Panel b. Middle schools
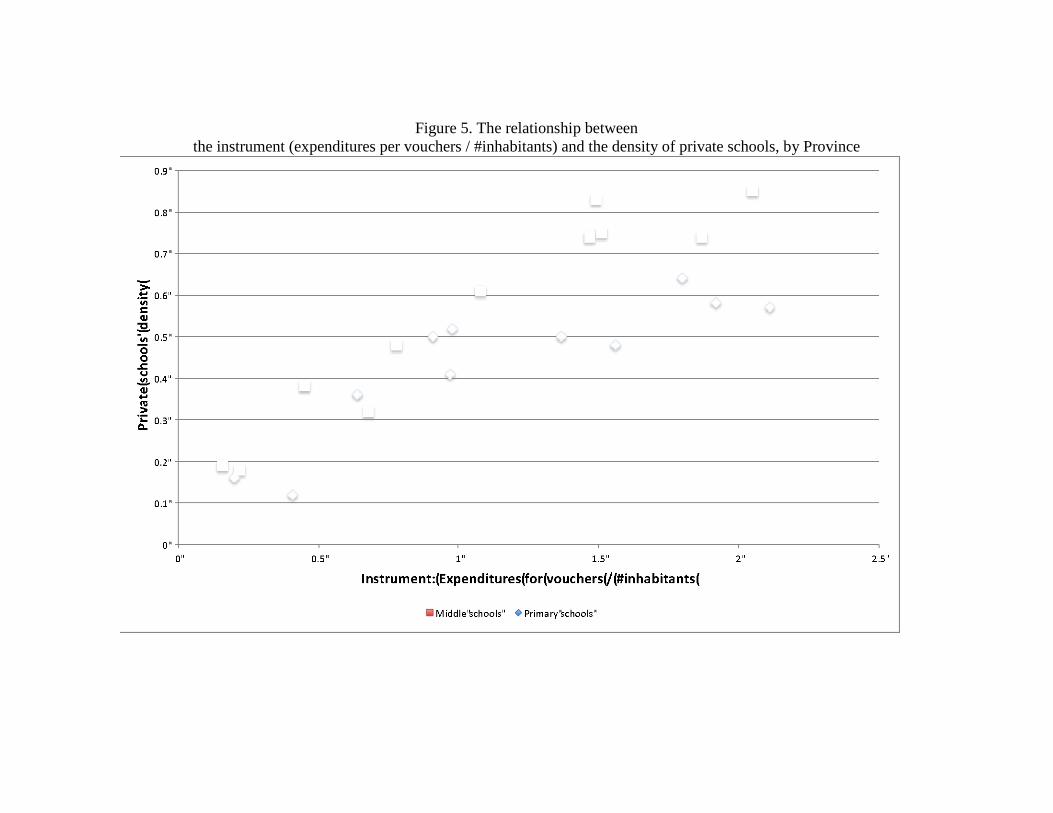
Figure 5. The relationship between the instrument (expenditures per vouchers / #inhabitants) and the density of private schools, by Province

Table 6. The impact of attending a private school: Primary schools (grade 5)
Panel A: student-level characteristics
Reading Math (1) (2) (3) (4) OLS IV OLS IV
ATT -0.1288*** -0.2857*** -.0945*** -0.2595*** t -10.33 - -7.58 - z - -3.39 - -3.07
Panel B: student and school-level characteristics Reading Math
(1) (2) (3) (4) OLS IV OLS IV
ATT -0.1945*** -0.2043 -0.1036*** -0.2526 t -4.74 - -2.85 - z - -1.47 - -1.59
Notes: ***, ** and * indicate p < 0.01, p < 0.05 p < 0.10, respectively. In columns 1 and 3, estimates are derived from OLS regressions. In Panel B, robust standard errors are clustered at school-level. In columns 2 and 4, estimates are derived from IV regressions with robust clustered standard errors at school-level. At the first step, the predicted probability to attend a private school is derived through probit estimation with robust standard errors. At the second step, standard errors are bootstrapped (200 replications).
Table 7. The impact of attending a private school:
Middle schools (grade 6) Panel A: student-level characteristics
Reading Math (1) (2) (3) (4) OLS IV OLS IV
ATT -0.0276** 0.0631 -0.0495*** 0.1830** t -2.51 - -4.06 - z - 0.99 - 2.54
Panel B: student and school-level characteristics Reading Math
(1) (2) (3) (4) OLS IV OLS IV
ATT -0.1649*** -0.0978 -0.1679*** 0.0648 t -5.99 - -4.79 - z - -0.87 - 0.54
Notes: ***, ** and * indicate p < 0.01, p < 0.05 p < 0.10, respectively. In columns 1 and 3, estimates are derived from OLS regressions. In Panel B, robust standard errors are clustered at school-level. In columns 2 and 4, estimates are derived from IV regressions with robust clustered standard errors at school-level. At the first step, the predicted probability to attend a private school is derived through probit estimation with robust standard errors. At the second step, standard errors are bootstrapped (200 replications).

“Improving Education through Accountability and Evaluation: Lessons from Around the World” Rome, October 3-5, 2012
56
Table 8. The impact of attending a private school: Primary schools (grade 5)
a. Urban schools
Panel A: student-level characteristics Reading Math
(1) (2) (3) (4) OLS IV OLS IV
ATT -0.0577*** -0.2885 -0.1023*** -0.0969 t -3.25 - -5.44 - z - -1.56 - -0.52
Panel B: student and school-level characteristics Reading Math
(1) (2) (3) (4) OLS IV OLS IV
ATT -0.1398*** -0.2398 -0.1284** -0.0850 t -2.83 - -2.52 - z - -0.75 - -0.23
b. Non-urban schools Panel A: student-level characteristics
Reading Math (1) (2) (3) (4) OLS IV OLS IV
ATT -0.1869*** -0.6023*** -0.0798*** 0.1018 t -10.66 - -4.77 - z - -4.51 - 0.70
Panel B: student and school-level characteristics Reading Math
(1) (2) (3) (4) OLS IV OLS IV
ATT -0.2450*** -0.4374 -0.0815 0.0086 t -3.95 - -1.60 - z - -1.57 - 0.03
Notes: ***, ** and * indicate p < 0.01, p < 0.05 p < 0.10, respectively. In columns 1 and 3, estimates are derived from OLS regressions. In Panel B, robust standard errors are clustered at school-level. In columns 2 and 4, estimates are derived from IV regressions with robust clustered standard errors at school-level. At the first step, the predicted probability to attend a private school is derived through probit estimation with robust standard errors. At the second step, standard errors are bootstrapped (200 replications).

“Improving Education through Accountability and Evaluation: Lessons from Around the World” Rome, October 3-5, 2012
57
Table 9. The impact of attending a private school:
Primary schools (grade 5)
a. Italian students Panel A: student-level characteristics
Reading Math (1) (2) (3) (4) OLS IV OLS IV
ATT -0.1348*** -0.2801*** -0.0982*** -0.1398 t -10.66 -7.70 - z - -2.95 - -1.41
Panel B: student and school-level characteristics Reading Math
(1) (2) (3) (4) OLS IV OLS IV
ATT -0.1894*** -0.1041 -0.1078*** -0.1036 t -4.52 - -2.87 - z - -0.70 - -0.58
b. Immigrant students Panel A: student-level characteristics
Reading Math (1) (2) (3) (4) OLS IV OLS IV
ATT 0.0755 -0.5375 0.0719 -0.9445** t 1.06 - 1.14 - z - -1.28 - -2.11
Panel B: student and school-level characteristics Reading Math
(1) (2) (3) (4) OLS IV OLS IV
ATT -0.0237 -0.9184* 0.0491 -1.1745** t -0.20 - 0.64 - z - -1.65 - -2.14
Notes: ***, ** and * indicate p < 0.01, p < 0.05 p < 0.10, respectively. In columns 1 and 3, estimates are derived from OLS regressions. In Panel B, robust standard errors are clustered at school-level. In columns 2 and 4, estimates are derived from IV regressions with robust clustered standard errors at school-level. At the first step, the predicted probability to attend a private school is derived through probit estimation with robust standard errors. At the second step, standard errors are bootstrapped (200 replications).

“Improving Education through Accountability and Evaluation: Lessons from Around the World” Rome, October 3-5, 2012
58
Table 10. The impact of attending a private school:
Primary schools (grade 5)
a. Students with ESCS<0 Panel A: student-level characteristics
Reading Math (1) (2) (3) (4) OLS IV OLS IV
ATT -0.0822*** 0.5607*** 0.0046 0.1187 t -3.26 0.19 - z - 2.29 - 0.43
Panel B: student and school-level characteristics Reading Math
(1) (2) (3) (4) OLS IV OLS IV
ATT -0.1807*** 0.7074* -0.0179 0.0626 t -3.35 - -0.38 - z - 1.81 - 0.16
b. Students with ESCS>0 Panel A: student-level characteristics
Reading Math (1) (2) (3) (4) OLS IV OLS IV
ATT -0.1377*** -0.0013 -0.1253*** 0.1032 t -9.62 - -8.58 - z - -0.01 - 0.79
Panel B: student and school-level characteristics Reading Math
(1) (2) (3) (4) OLS IV OLS IV
ATT -0.1830*** 0.1622 -0.1340*** 0.0726 t -4.32 - -3.40 - z - 0.79 - 0.29
Notes: ***, ** and * indicate p < 0.01, p < 0.05 p < 0.10, respectively. In columns 1 and 3, estimates are derived from OLS regressions. In Panel B, robust standard errors are clustered at school-level. In columns 2 and 4, estimates are derived from IV regressions with robust clustered standard errors at school-level. At the first step, the predicted probability to attend a private school is derived through probit estimation with robust standard errors. At the second step, standard errors are bootstrapped (200 replications).

“Improving Education through Accountability and Evaluation: Lessons from Around the World” Rome, October 3-5, 2012
59
Table 11. The impact of attending a private school: Middle schools (grade 6)
a. Urban schools
Panel A: student-level characteristics Reading Math
(1) (2) (3) (4) OLS IV OLS IV
ATT -0.0330* -0.2325 -0.0416** 0.0121 t -1.85 - -2.11 - z - -1.46 - 0.07
Panel B: student and school-level characteristics Reading Math
(1) (2) (3) (4) OLS IV OLS IV
ATT -0.2184*** -0.3759 -0.1652** -0.0003 t -4.46 - -2.30 - z - -1.37 - -0.00
B. Non-urban Schools Panel A: student-level characteristics
Reading Math (1) (2) (3) (4) OLS IV OLS IV
ATT -0.0232* 0.2989*** -0.0513*** 0.6081*** t -1.65 - -3.30 - z - 3.34 - 6.94
Panel B: student and school-level characteristics Reading Math
(1) (2) (3) (4) OLS IV OLS IV
ATT -0.1170*** 0.1037 -0.1512*** 0.4216*** t -3.56 - -4.02 - z - 0.74 - 2.66
Notes: ***, ** and * indicate p < 0.01, p < 0.05 p < 0.10, respectively. In columns 1 and 3, estimates are derived from OLS regressions. In Panel B, robust standard errors are clustered at school-level. In columns 2 and 4, estimates are derived from IV regressions with robust clustered standard errors at school-level. At the first step, the predicted probability to attend a private school is derived through probit estimation with robust standard errors. At the second step, standard errors are bootstrapped (200 replications).
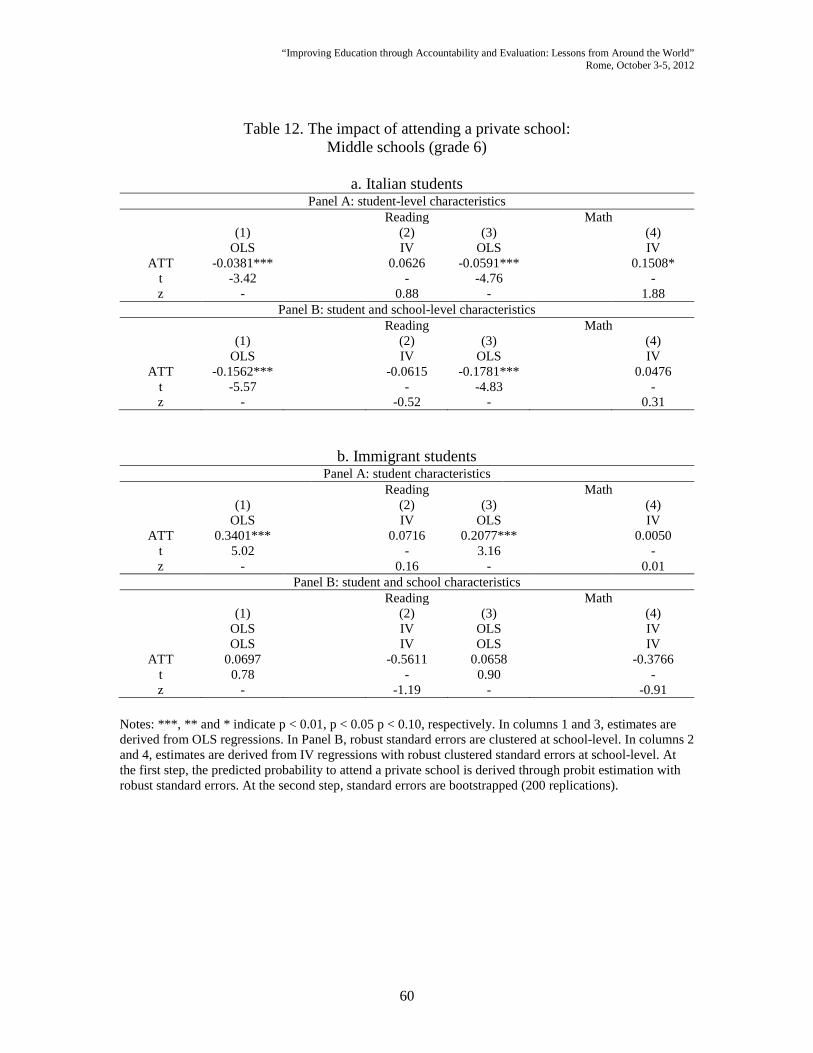
“Improving Education through Accountability and Evaluation: Lessons from Around the World” Rome, October 3-5, 2012
60
Table 12. The impact of attending a private school: Middle schools (grade 6)
a. Italian students
Panel A: student-level characteristics Reading Math
(1) (2) (3) (4) OLS IV OLS IV
ATT -0.0381*** 0.0626 -0.0591*** 0.1508* t -3.42 - -4.76 - z - 0.88 - 1.88
Panel B: student and school-level characteristics Reading Math
(1) (2) (3) (4) OLS IV OLS IV
ATT -0.1562*** -0.0615 -0.1781*** 0.0476 t -5.57 - -4.83 - z - -0.52 - 0.31
b. Immigrant students Panel A: student characteristics
Reading Math (1) (2) (3) (4) OLS IV OLS IV
ATT 0.3401*** 0.0716 0.2077*** 0.0050 t 5.02 - 3.16 - z - 0.16 - 0.01
Panel B: student and school characteristics Reading Math
(1) (2) (3) (4) OLS IV OLS IV OLS IV OLS IV
ATT 0.0697 -0.5611 0.0658 -0.3766 t 0.78 - 0.90 - z - -1.19 - -0.91
Notes: ***, ** and * indicate p < 0.01, p < 0.05 p < 0.10, respectively. In columns 1 and 3, estimates are derived from OLS regressions. In Panel B, robust standard errors are clustered at school-level. In columns 2 and 4, estimates are derived from IV regressions with robust clustered standard errors at school-level. At the first step, the predicted probability to attend a private school is derived through probit estimation with robust standard errors. At the second step, standard errors are bootstrapped (200 replications).

“Improving Education through Accountability and Evaluation: Lessons from Around the World” Rome, October 3-5, 2012
61
Table 13. The impact of attending a private school:
Middle schools (grade 6)
a. Students with ESCS<0 Panel A: student-level characteristics
Reading Math (1) (2) (3) (4) OLS IV OLS IV
ATT 0.1004*** 0.0488 0.0742*** 0.1675** t 4.34 - 3.02 - z - 0.83 - 2.42
Panel B: student and school-level characteristics Reading Math
(1) (2) (3) (4) OLS IV OLS IV
ATT -0.0671 -0.1091 -0.0648 0.0520 t -1.64 - -1.56 - z - -1.04 - 0.46
b. Students with ESCS>0 Panel A: student characteristics
Reading Math (1) (2) (3) (4) OLS IV OLS IV
ATT -0.0597*** 0.2891*** -0.0820*** 0.4076*** t -4.78 - -5.84 - z - 3.32 - 4.03
Panel B: student and school characteristics Reading Math
(1) (2) (3) (4) OLS IV OLS IV
ATT -0.1759*** 0.2116 -0.1970*** 0.3778** t -6.14 - -5.04 - z - 1.46 - 2.04
Notes: ***, ** and * indicate p < 0.01, p < 0.05 p < 0.10, respectively. In columns 1 and 3, estimates are derived from OLS regressions. In Panel B, robust standard errors are clustered at school-level. In columns 2 and 4, estimates are derived from IV regressions with robust clustered standard errors at school-level. At the first step, the predicted probability to attend a private school is derived through probit estimation with robust standard errors. At the second step, standard errors are bootstrapped (200 replications).

“Improving Education through Accountability and Evaluation: Lessons from Around the World” Rome, October 3-5, 2012
62
Table 14. The impact of attending a private school: First-generation and second-generation immigrant students
Reading Math
IV IV Primary schools (grade 5)
1st generation immigrant students -2.2089* (-1.70)
-2.0506* (-1.79)
2nd generation immigrant students -0.3655 (-0.70)
-0.6469 (-1.26)
Middle schools (grade 6)
1st generation immigrant students -1.2238 (-1.17)
-0.8773 (-1.07)
2nd generation immigrant students 0.9050* (1.79)
0.3035 (0.57)
Notes: ***, ** and * indicate p < 0.01, p < 0.05 p < 0.10, respectively. Estimates are derived from IV regressions with robust clustered standard errors at school-level. At the first step, the predicted probability to attend a private school is derived through probit estimation with robust standard errors. At the second step, standard errors are bootstrapped (200 replications).
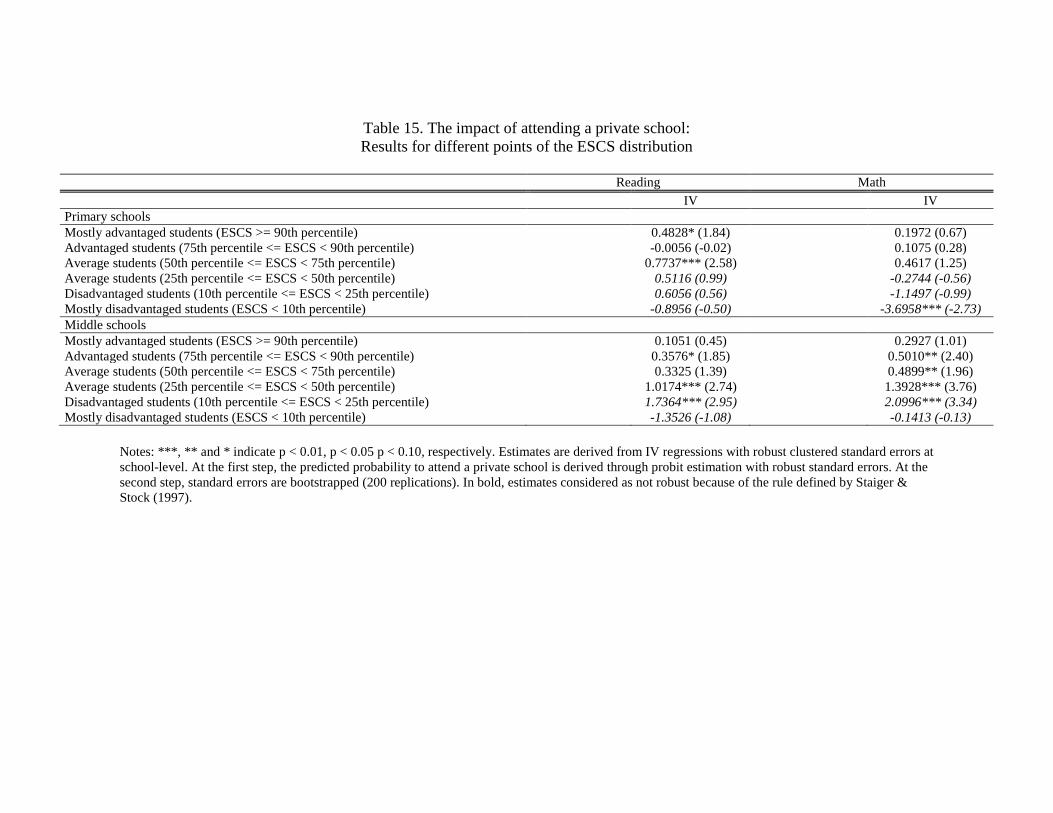
Table 15. The impact of attending a private school: Results for different points of the ESCS distribution
Reading Math
IV IV Primary schools Mostly advantaged students (ESCS >= 90th percentile) 0.4828* (1.84) 0.1972 (0.67) Advantaged students (75th percentile <= ESCS < 90th percentile) -0.0056 (-0.02) 0.1075 (0.28) Average students (50th percentile <= ESCS < 75th percentile) 0.7737*** (2.58) 0.4617 (1.25) Average students (25th percentile <= ESCS < 50th percentile) 0.5116 (0.99) -0.2744 (-0.56) Disadvantaged students (10th percentile <= ESCS < 25th percentile) 0.6056 (0.56) -1.1497 (-0.99) Mostly disadvantaged students (ESCS < 10th percentile) -0.8956 (-0.50) -3.6958*** (-2.73) Middle schools Mostly advantaged students (ESCS >= 90th percentile) 0.1051 (0.45) 0.2927 (1.01) Advantaged students (75th percentile <= ESCS < 90th percentile) 0.3576* (1.85) 0.5010** (2.40) Average students (50th percentile <= ESCS < 75th percentile) 0.3325 (1.39) 0.4899** (1.96) Average students (25th percentile <= ESCS < 50th percentile) 1.0174*** (2.74) 1.3928*** (3.76) Disadvantaged students (10th percentile <= ESCS < 25th percentile) 1.7364*** (2.95) 2.0996*** (3.34) Mostly disadvantaged students (ESCS < 10th percentile) -1.3526 (-1.08) -0.1413 (-0.13)
Notes: ***, ** and * indicate p < 0.01, p < 0.05 p < 0.10, respectively. Estimates are derived from IV regressions with robust clustered standard errors at school-level. At the first step, the predicted probability to attend a private school is derived through probit estimation with robust standard errors. At the second step, standard errors are bootstrapped (200 replications). In bold, estimates considered as not robust because of the rule defined by Staiger & Stock (1997).

“Improving Education through Accountability and Evaluation: Lessons from Around the World” Rome, October 3-5, 2012
64
Table 16. The impact of attending a private school: A synthesis of the results
ATT (Average Treatment on Treated) - Private schooling Grade 5 Grade 6 Reading Math Reading Math Overall effect no no no no
Heterogeneity (1) Urban schools no no no no Non-urban schools no no no + Italian students no no no no Immigrant students yes/- yes/- no no Students with ESCS<0 yes/+ no no no Students with ESCS>0 no no no yes/+
Heterogeneity (2) 1st generation immigrants yes/- yes/- yes/+ no 2nd generation immigrants no no no no Mostly advantaged students (ESCS>90th percentile) no no no no Advantaged students (75th - 90th percentile) no no yes/+ yes/+ Average students (50th - 75th percentile) yes/+ no no yes/+ Average students (25th - 50th percentile) n.v. n.v. yes/+ yes/+ Disadvantaged students (10th - 25th percentile) n.v. n.v. n.v. n.v. Mostly disadvantaged students (ESCS<10th percentile) n.v. n.v. n.v. n.v.
Legend: no = no statistically significant effect; yes/+: positive and statistically significant effect; yes/-: negative and statistically significant effect; n.v.: not valid estimation.
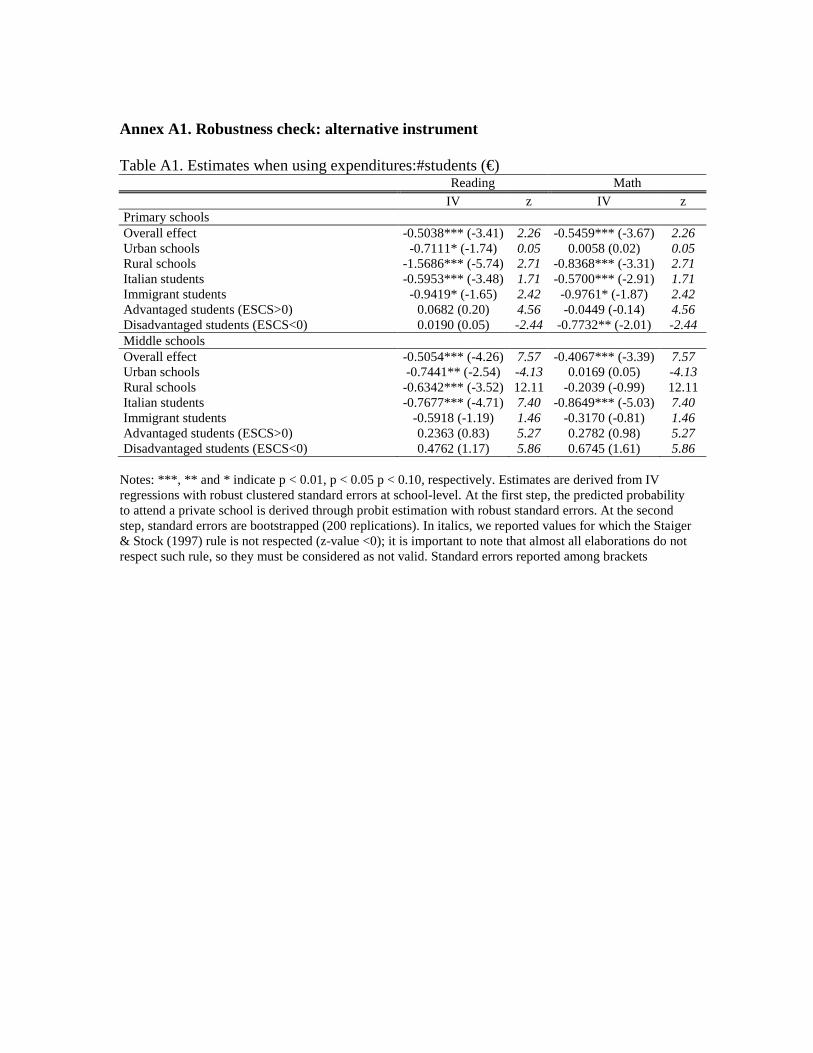
Annex A1. Robustness check: alternative instrument Table A1. Estimates when using expenditures:#students (€) Reading Math
IV z IV z Primary schools Overall effect -0.5038*** (-3.41) 2.26 -0.5459*** (-3.67) 2.26 Urban schools -0.7111* (-1.74) 0.05 0.0058 (0.02) 0.05 Rural schools -1.5686*** (-5.74) 2.71 -0.8368*** (-3.31) 2.71 Italian students -0.5953*** (-3.48) 1.71 -0.5700*** (-2.91) 1.71 Immigrant students -0.9419* (-1.65) 2.42 -0.9761* (-1.87) 2.42 Advantaged students (ESCS>0) 0.0682 (0.20) 4.56 -0.0449 (-0.14) 4.56 Disadvantaged students (ESCS<0) 0.0190 (0.05) -2.44 -0.7732** (-2.01) -2.44 Middle schools Overall effect -0.5054*** (-4.26) 7.57 -0.4067*** (-3.39) 7.57 Urban schools -0.7441** (-2.54) -4.13 0.0169 (0.05) -4.13 Rural schools -0.6342*** (-3.52) 12.11 -0.2039 (-0.99) 12.11 Italian students -0.7677*** (-4.71) 7.40 -0.8649*** (-5.03) 7.40 Immigrant students -0.5918 (-1.19) 1.46 -0.3170 (-0.81) 1.46 Advantaged students (ESCS>0) 0.2363 (0.83) 5.27 0.2782 (0.98) 5.27 Disadvantaged students (ESCS<0) 0.4762 (1.17) 5.86 0.6745 (1.61) 5.86
Notes: ***, ** and * indicate p < 0.01, p < 0.05 p < 0.10, respectively. Estimates are derived from IV regressions with robust clustered standard errors at school-level. At the first step, the predicted probability to attend a private school is derived through probit estimation with robust standard errors. At the second step, standard errors are bootstrapped (200 replications). In italics, we reported values for which the Staiger & Stock (1997) rule is not respected (z-value <0); it is important to note that almost all elaborations do not respect such rule, so they must be considered as not valid. Standard errors reported among brackets

“Improving Education through Accountability and Evaluation: Lessons from Around the World” Rome, October 3-5, 2012
66
Annex A2. Robustness checks: using ESCS-school instead of ESCS-class Table A.2. Estimates when including ESCS-school among controls (instead of ESCS-class) Reading Math
IV z IV z Primary schools Overall effect -0.1364 (-0.90) 20.27 -0.1871 (-1.13) 20.27 Urban schools -0.1280 (-0.39) 10.11 0.0208 (0.05) 10.11 Rural schools -0.3994 (-1.50) 17.68 0.0447 (0.18) 17.68 Italian students -0.0210 (-0.13) 20.17 -0.0164 (-0.09) 20.17 Immigrant students -0.8714 (-1.53) 2.88 -1.1771** (-2.28) 2.88 Advantaged students (ESCS>0) 0.2031 (0.95) 18.68 0.1098 (0.48) 18.68 Disadvantaged students (ESCS<0) 0.6578* (1.65) 9.10 0.0093 (0.03) 9.10 Middle schools Overall effect -0.0547 (-0.49) 30.84 0.1172 (1.01) 30.84 Urban schools -0.2040 (-0.77) 10.27 0.1732 (0.53) 10.27 Rural schools 0.0952 (0.68) 29.78 0.4085*** (2.63) 29.78 Italian students -0.0138 (-0.11) 30.91 0.1075 (0.69) 30.91 Immigrant students -0.5921 (-1.26) 3.06 -0.3840 (-0.94) 3.06 Advantaged students (ESCS>0) 0.2185 (1.58) 25.20 0.3870** (2.01) 25.20 Disadvantaged students (ESCS<0) 1.2444*** (4.39) 17.81 1.6680*** (5.18) 17.81 Notes: ***, ** and * indicate p < 0.01, p < 0.05 p < 0.10, respectively. Estimates are derived from IV regressions with robust clustered standard errors at school-level. At the first step, the predicted probability to attend a private school is derived through probit estimation with robust standard errors. At the second step, standard errors are bootstrapped (200 replications). In italics, we reported values for which the Staiger & Stock (1997) rule is not respected (z-value <0). Standard errors reported among brackets.

Annex B. Test scores’ distributions, by subject, grade, school-type
Figure B.1. Test scores’ distribution (reading), by grade

“Improving Education through Accountability and Evaluation: Lessons from Around the World” Rome, October 3-5, 2012
68
Figure B.2. Test scores’ distribution (math), by grade

“Improving Education through Accountability and Evaluation: Lessons from Around the World” Rome, October 3-5, 2012
69
Figure B.3. Test scores’ distribution, by grade and type (public/private), through boxplots


![1 Machine Learning with Apache Hama Tommaso Teofili tommaso [at] apache [dot] org](https://img.pdfslide.us/doc/110x75/56649d1a5503460f949eff67/1-machine-learning-with-apache-hama-tommaso-teofili-tommaso-at-apache-dot.jpg)