Embed Size (px)
Citation preview

���
����������������� � �� �������� �� ����� �� ����
http://dx.doi.org/10.7494/drill.2016.33.2.379
* AGH University of Science and Technology, Faculty of Drilling, Oil and Gas, Krakow, Poland** AGH University of Science and Technology, Faculty of Drilling, Oil and Gas, Krakow, Poland,
Student Scientific Association NAFTA i GAZ*** This work has been prepared within the research cofounded by The National Centre of Research
and Development (NCBiR) under Research Program GEKON, Project HESTOR, AGH USTagreement number: 17.17.190.672/2015/O60
Tomasz Włodek*, Mariusz Łaciak*, Katarzyna Kurowska**,Łukasz Węgrzyn**
THERMODYNAMIC ANALYSISOF HYDROGEN PIPELINE TRANSPORTATION –
SELECTED ASPECTS***
1. INTRODUCTION
Nowadays the hydrogen is considered by industry as a fuel of the future, which maysuccessfully replace conventional, non-renewable fuels. Because of this fact hydrogen isperceived as an efficient source of environmental-friendly energy.
Presenting the idea of using the hydrogen as a substitute of hydrocarbons is a for-ward thinking, because there are no large scale hydrogen production methods, whichwould be effective, economically justified and less time consuming to produce amountsrequired by industry. Actually the hydrogen is obtained from thermo-chemical processes,which main source of power is a combustion of coal, natural gas or oil. Unfortunately theresources of hydrocarbons are limited, this is why the industry should focus on diversifiedtypes of fuels.
The way of obtaining the hydrogen is not the only one issue that should be faced byindustry, because there is a necessity of development effective methods of its transporta-tion and storage. This type of fuel can be stored as a gas under the pressure or a liquid(hydrides, carbonaceous materials) which is not a leading issue, because those methodsare used today and all action needed to be taken is to adapt them to store bigger amounts
���
of hydrogen. A not effective truck transportation is more problematic issue, because canprovide a limited fuel volume on a relative short distances. This is the main reason whythe industry should focus on a hydrogen pipeline transportation. For transportation ofhydrogen the special dedicated pipeline network can be developed. Furthermore usingthe natural gas pipelines for hydrogen transport should be considered as a component ofnatural gas. Industry practice in the USA shows that effective pipeline transport of hy-drogen is possible also as a natural gas mixture component. Natural gas pipelines arelong distance pipelines with high maximum operating pressure. The most importantadvantage of pipeline networks is their availability. Nowadays this type of transportis expensive and used for a short distances only. Despite this fact some countries(e.g. USA) are considering a conversion of their natural gas pipelines for hydrogen trans-portation. Using existing infrastructure the transportation of hydrogen would be defi-nitely cheaper than building special dedicated pipelines. However there are some disad-vantages of using natural gas pipelines. Hydrogen has a higher ability to penetratethrough construction materials of gas pipelines than natural gas. Moreover, hydrogen ishighly corrosive. This fact requires that additional material research for pipeline steelshould be performed. Those issues would require some special improvements that willprotect pipelines from negative influence of hydrogen.
This article is focused on thermodynamic analysis of hydrogen transportationby dedicated pipelines or natural gas pipelines. The flow of the pure hydrogen and bi--component mixtures of methane and hydrogen was analyzed especially for a pressuredrops during the transportation in the pipeline. Increasing interest in hydrogen as a newmedium of storage an excess energy is the main issue why pipeline transportation(for long distances in short time) becomes a challenge for scientists and engineers.
2. TECHNICAL AND THERMODYNAMIC ASSUMPTIONS
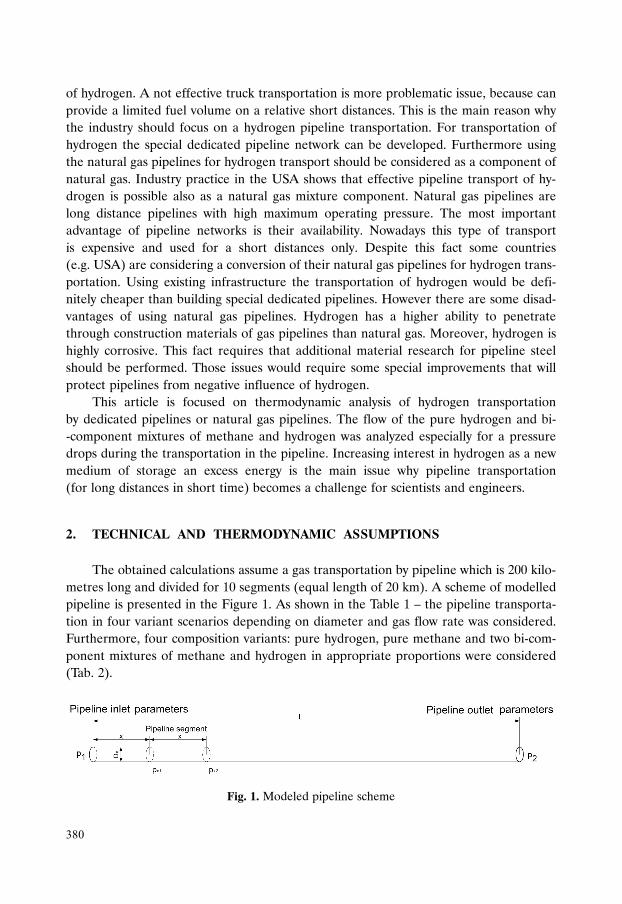
The obtained calculations assume a gas transportation by pipeline which is 200 kilo-metres long and divided for 10 segments (equal length of 20 km). A scheme of modelledpipeline is presented in the Figure 1. As shown in the Table 1 – the pipeline transporta-tion in four variant scenarios depending on diameter and gas flow rate was considered.Furthermore, four composition variants: pure hydrogen, pure methane and two bi-com-ponent mixtures of methane and hydrogen in appropriate proportions were considered(Tab. 2).
Fig. 1. Modeled pipeline scheme
���
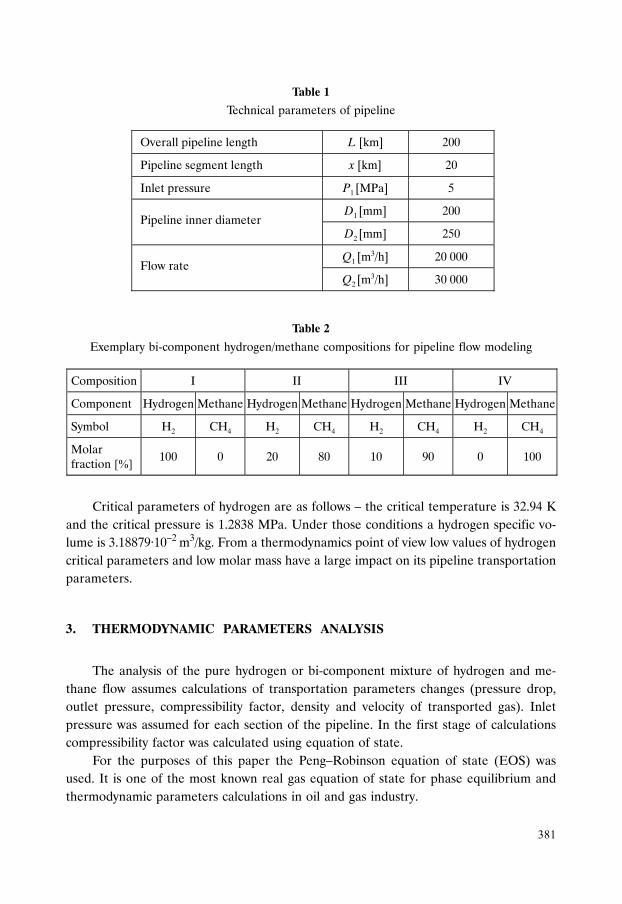
Table 1
Technical parameters of pipeline
Table 2
Exemplary bi-component hydrogen/methane compositions for pipeline flow modeling
Critical parameters of hydrogen are as follows – the critical temperature is 32.94 Kand the critical pressure is 1.2838 MPa. Under those conditions a hydrogen specific vo-lume is 3.18879·10–2 m3/kg. From a thermodynamics point of view low values of hydrogencritical parameters and low molar mass have a large impact on its pipeline transportationparameters.
3. THERMODYNAMIC PARAMETERS ANALYSIS
The analysis of the pure hydrogen or bi-component mixture of hydrogen and me-thane flow assumes calculations of transportation parameters changes (pressure drop,outlet pressure, compressibility factor, density and velocity of transported gas). Inletpressure was assumed for each section of the pipeline. In the first stage of calculationscompressibility factor was calculated using equation of state.
For the purposes of this paper the Peng–Robinson equation of state (EOS) wasused. It is one of the most known real gas equation of state for phase equilibrium andthermodynamic parameters calculations in oil and gas industry.
Overall pipeline length L [km] 200
Pipeline segment length x [km] 20
Inlet pressure P1 [MPa] 5
D1 [mm] 200 Pipeline inner diameter
D2 [mm] 250
Q1 [m3/h] 20 000
Flow rate Q2 [m
3/h] 30 000
Composition I II III IV
Component Hydrogen Methane Hydrogen Methane Hydrogen Methane Hydrogen Methane
Symbol H2 CH4 H2 CH4 H2 CH4 H2 CH4
Molar fraction [%]
100 0 20 80 10 90 0 100 �
���
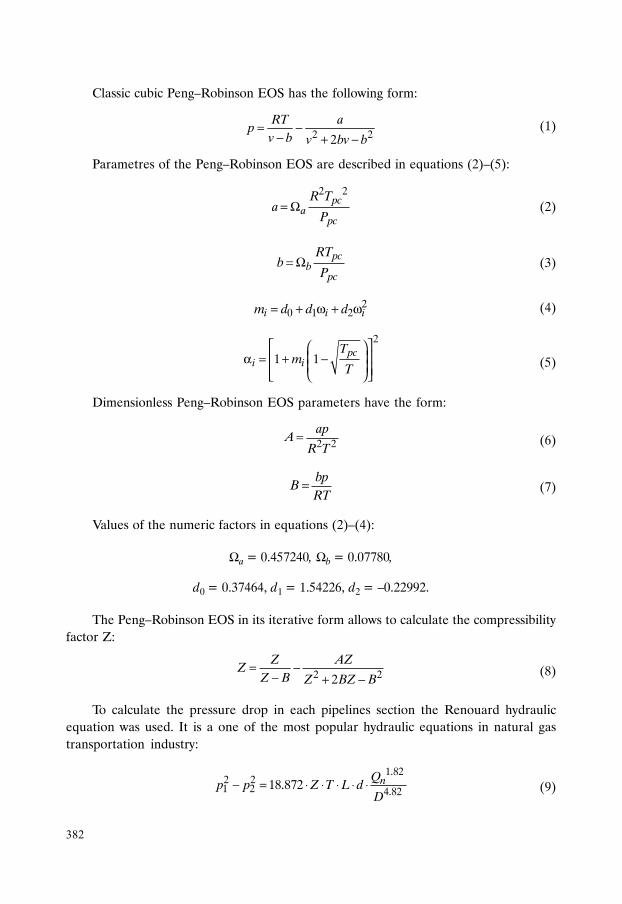
Classic cubic Peng–Robinson EOS has the following form:
2 22
RT ap
v b v bv b= −
− + −(1)
Parametres of the Peng–Robinson EOS are described in equations (2)–(5):
2 2pc
apc
R Ta
P= Ω (2)
pcb
pc
RTb
P= Ω (3)
20 1 2i i im d d d= + ω + ω (4)
2
1 1 pci i
Tm
T
⎡ ⎤⎛ ⎞⎢ ⎥⎜ ⎟α = + −⎜ ⎟⎢ ⎥⎝ ⎠⎣ ⎦
(5)
Dimensionless Peng–Robinson EOS parameters have the form:
2 2ap
AR T
= (6)
bpB
RT= (7)
Values of the numeric factors in equations (2)–(4):
Ωa = 0.457240, Ωb = 0.07780,
d0 = 0.37464, d1 = 1.54226, d2 = –0.22992.
The Peng–Robinson EOS in its iterative form allows to calculate the compressibilityfactor Z:
2 22
Z AZZ
Z B Z BZ B= −
− + −(8)
To calculate the pressure drop in each pipelines section the Renouard hydraulicequation was used. It is a one of the most popular hydraulic equations in natural gastransportation industry:
1.822 21 2 4.8218.872 nQ
p p Z T L dD
− = ⋅ ⋅ ⋅ ⋅ ⋅ (9)
���
Obviously to define a value of the pressure drop it is possible to use different widelyavailable hydraulic equations (e.g. Panhandle, Gas Technology Institute hydraulic equa-tions).
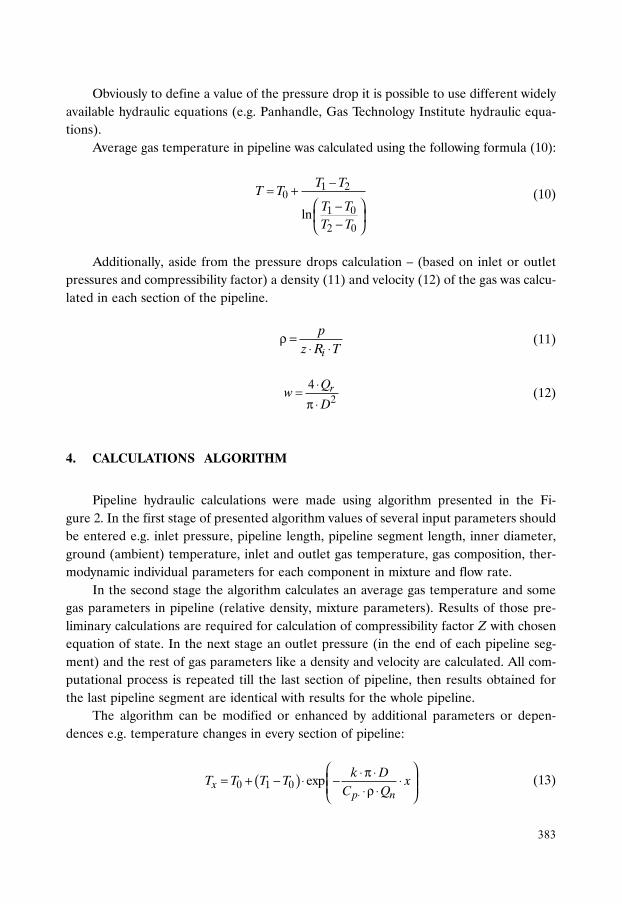
Average gas temperature in pipeline was calculated using the following formula (10):
1 20
1 0
2 0ln
T TT T
T TT T
−= +⎛ ⎞−⎜ ⎟−⎝ ⎠
(10)
Additionally, aside from the pressure drops calculation – (based on inlet or outletpressures and compressibility factor) a density (11) and velocity (12) of the gas was calcu-lated in each section of the pipeline.
i
pz R T
ρ =⋅ ⋅
(11)
24 rQ
wD
⋅=π ⋅
(12)
4. CALCULATIONS ALGORITHM
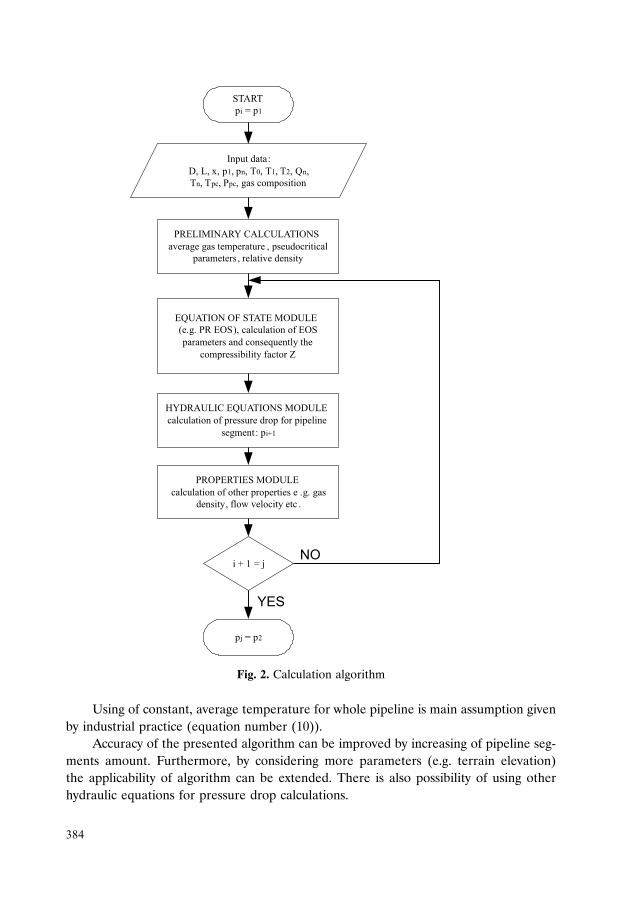
Pipeline hydraulic calculations were made using algorithm presented in the Fi-gure 2. In the first stage of presented algorithm values of several input parameters shouldbe entered e.g. inlet pressure, pipeline length, pipeline segment length, inner diameter,ground (ambient) temperature, inlet and outlet gas temperature, gas composition, ther-modynamic individual parameters for each component in mixture and flow rate.
In the second stage the algorithm calculates an average gas temperature and somegas parameters in pipeline (relative density, mixture parameters). Results of those pre-liminary calculations are required for calculation of compressibility factor Z with chosenequation of state. In the next stage an outlet pressure (in the end of each pipeline seg-ment) and the rest of gas parameters like a density and velocity are calculated. All com-putational process is repeated till the last section of pipeline, then results obtained forthe last pipeline segment are identical with results for the whole pipeline.
The algorithm can be modified or enhanced by additional parameters or depen-dences e.g. temperature changes in every section of pipeline:
( )0 1 0 expxp n
k DT T T T x
C Q⋅
⎛ ⎞⋅ π ⋅= + − ⋅ − ⋅⎜ ⎟⎜ ⎟⋅ρ ⋅⎝ ⎠(13)
���
Fig. 2. Calculation algorithm
Using of constant, average temperature for whole pipeline is main assumption givenby industrial practice (equation number (10)).
Accuracy of the presented algorithm can be improved by increasing of pipeline seg-ments amount. Furthermore, by considering more parameters (e.g. terrain elevation)the applicability of algorithm can be extended. There is also possibility of using otherhydraulic equations for pressure drop calculations.
��
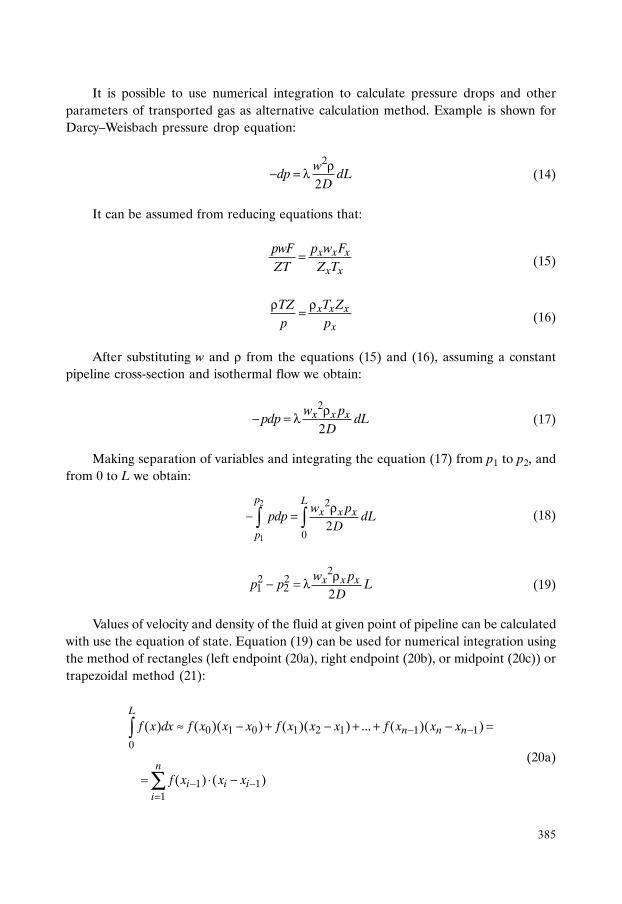
It is possible to use numerical integration to calculate pressure drops and otherparameters of transported gas as alternative calculation method. Example is shown forDarcy–Weisbach pressure drop equation:
2
2w
dp dLDρ− = λ (14)
It can be assumed from reducing equations that:
x x x
x x
pwF p w FZT Z T
= (15)
x x x
x
TZ T Zp p
ρ ρ= (16)
After substituting w and ρ from the equations (15) and (16), assuming a constantpipeline cross-section and isothermal flow we obtain:
2
2x x xw p
pdp dLD
ρ− = λ (17)
Making separation of variables and integrating the equation (17) from p1 to p2, andfrom 0 to L we obtain:
2
1
2
02
p Lx x x
p
w ppdp dL
Dρ− =∫ ∫ (18)
22 21 2 2
x x xw pp p L
Dρ− = λ (19)
Values of velocity and density of the fluid at given point of pipeline can be calculatedwith use the equation of state. Equation (19) can be used for numerical integration usingthe method of rectangles (left endpoint (20a), right endpoint (20b), or midpoint (20c)) ortrapezoidal method (21):
0 1 0 1 2 1 1 10
1 11
( ) ( )( ) ( )( ) ... ( )( )
( ) ( )
L
n n n
n
i i ii
f x dx f x x x f x x x f x x x
f x x x
− −
− −=
≈ − + − + + − =
= ⋅ −
∫
∑(20a)
���
1 1 0 2 2 1 10
11
( ) ( )( ) ( )( ) ... ( )( )
( ) ( )
L
n n n
n
i i ii
f x dx f x x x f x x x f x x x
f x x x
−
−=
≈ − + − + + − =
= ⋅ −
∫
∑(20b)
11
10
( ) ( )2
L ni i
i ii
x xf x dx f x x−
−=
−⎛ ⎞≈ ⋅ −⎜ ⎟⎝ ⎠∑∫ (20c)
11
10
( ) ( )( ) ( )
2
L ni i
i ii
f x f xf x dx x x−
−=
−≈ −∑∫ (21)
5. CALCULATION RESULTS
Pressure drop
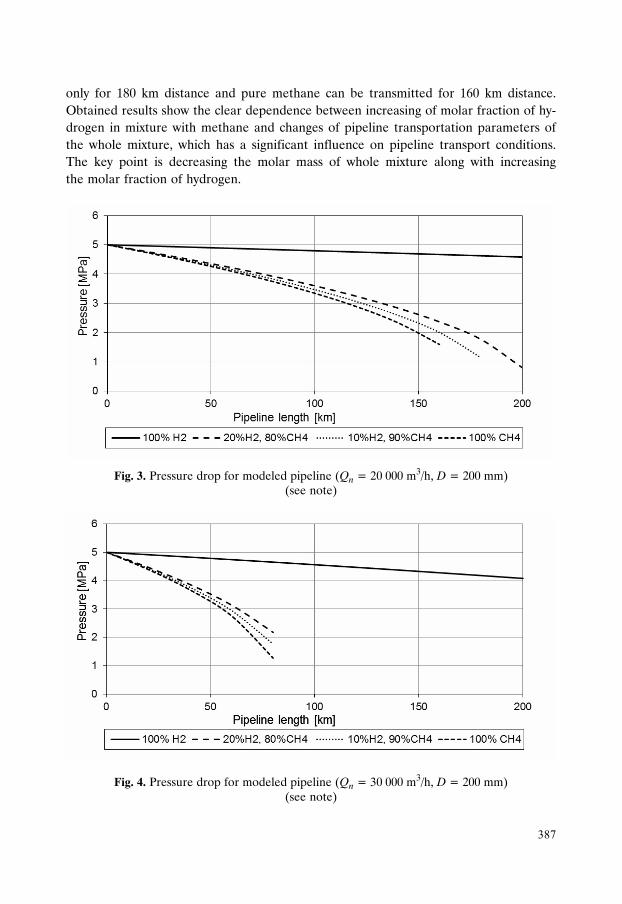
In Figures 3–5 the pressure drop in exemplary pipeline is shown for pure hydrogen,pure methane and bi-component mixture of methane and hydrogen transportation:
a) Figure 3 for case with flow rate: Qn = 20 000 m3/h and inner pipeline diameter:D = 200 mm;
b) Figure 4 for case with flow rate: Qn = 30 000 m3/h and inner pipeline diameter:D = 200 mm;
c) Figure 5 for case with flow rate: Qn = 30 000 m3/h and inner pipeline diameter:D = 250 mm.
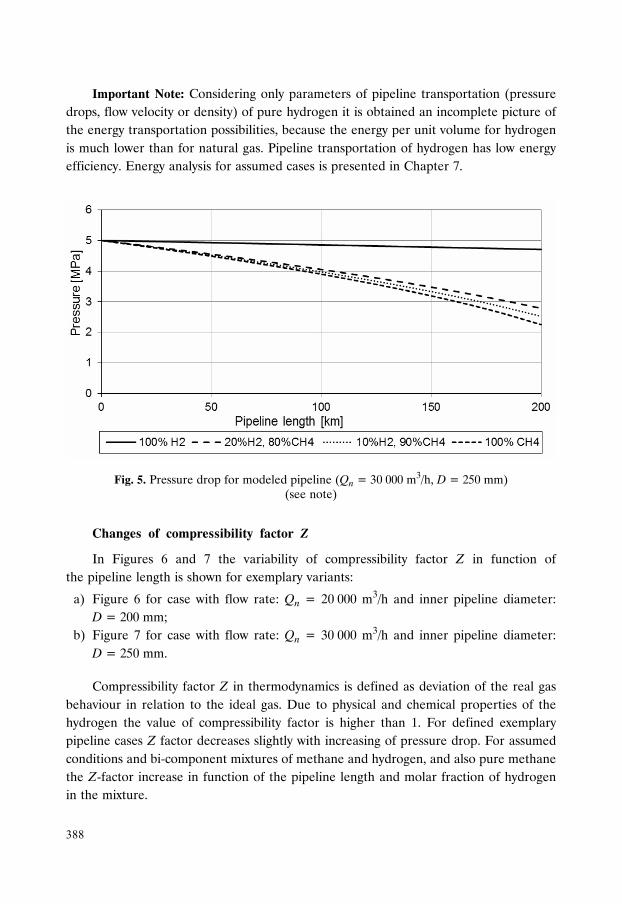
The analysis of pressure drop calculated with use the Renouard hydraulic equationshows low pressure drops for transported pure hydrogen. For flow rate of 30 000 m3/hand 200 mm inner diameter case the value of pressure drop is 0.9 MPa and for 250 mmdiameter case is only 0.3 MPa. The pressure drop for mixtures of methane and hydrogenwith 30 000 m3/h flow rate and 250 mm pipeline diameter is 2.2 MPa including 20 molarfraction of hydrogen, 2.5 MPa including 10 molar fraction of hydrogen and 2.75 MPafor pure methane. For pipeline diameter 200 mm and flow rate 30 000 m3/h bi-compo-nent hydrogen-methane mixtures, and pure methane can be transported only for 80 kmdistance because of high pressure drops.
For the variant of flow rate 20 000 m3/h and 200 mm diameter the pressure drop forpure hydrogen is 0.6 MPa and for mixture of methane and 20 of hydrogen is until4.2 MPa. In these conditions, the mixture containing 10 of hydrogen can be transported
���
only for 180 km distance and pure methane can be transmitted for 160 km distance.Obtained results show the clear dependence between increasing of molar fraction of hy-drogen in mixture with methane and changes of pipeline transportation parameters ofthe whole mixture, which has a significant influence on pipeline transport conditions.The key point is decreasing the molar mass of whole mixture along with increasingthe molar fraction of hydrogen.
Fig. 3. Pressure drop for modeled pipeline (Qn = 20 000 m3/h, D = 200 mm)(see note)
Fig. 4. Pressure drop for modeled pipeline (Qn = 30 000 m3/h, D = 200 mm)(see note)
���
Important Note: Considering only parameters of pipeline transportation (pressuredrops, flow velocity or density) of pure hydrogen it is obtained an incomplete picture ofthe energy transportation possibilities, because the energy per unit volume for hydrogenis much lower than for natural gas. Pipeline transportation of hydrogen has low energyefficiency. Energy analysis for assumed cases is presented in Chapter 7.
Fig. 5. Pressure drop for modeled pipeline (Qn = 30 000 m3/h, D = 250 mm)(see note)
Changes of compressibility factor Z
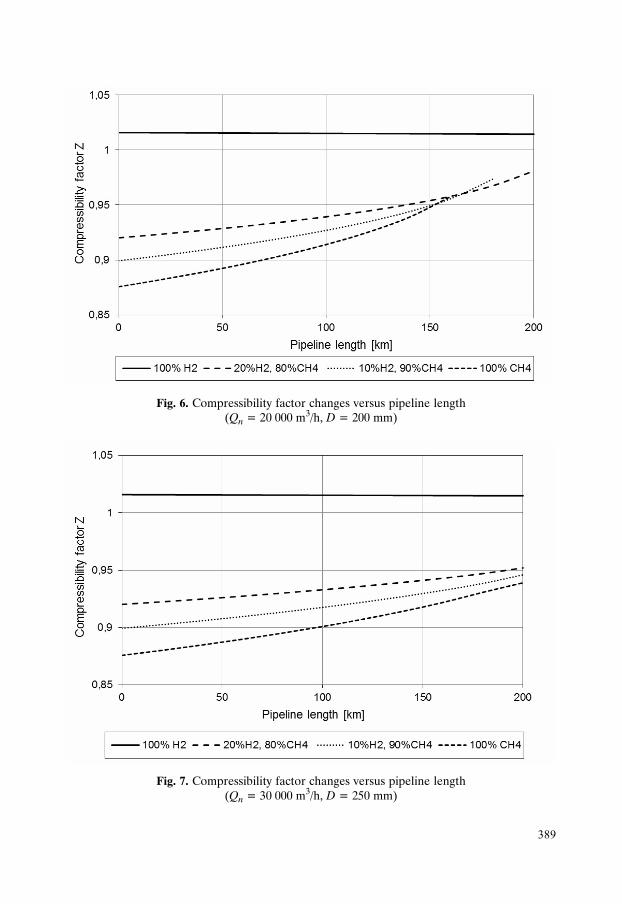
In Figures 6 and 7 the variability of compressibility factor Z in function ofthe pipeline length is shown for exemplary variants:
a) Figure 6 for case with flow rate: Qn = 20 000 m3/h and inner pipeline diameter:D = 200 mm;
b) Figure 7 for case with flow rate: Qn = 30 000 m3/h and inner pipeline diameter:D = 250 mm.
Compressibility factor Z in thermodynamics is defined as deviation of the real gasbehaviour in relation to the ideal gas. Due to physical and chemical properties of thehydrogen the value of compressibility factor is higher than 1. For defined exemplarypipeline cases Z factor decreases slightly with increasing of pressure drop. For assumedconditions and bi-component mixtures of methane and hydrogen, and also pure methanethe Z-factor increase in function of the pipeline length and molar fraction of hydrogenin the mixture.
���
Fig. 6. Compressibility factor changes versus pipeline length(Qn = 20 000 m3/h, D = 200 mm)
Fig. 7. Compressibility factor changes versus pipeline length(Qn = 30 000 m3/h, D = 250 mm)
���
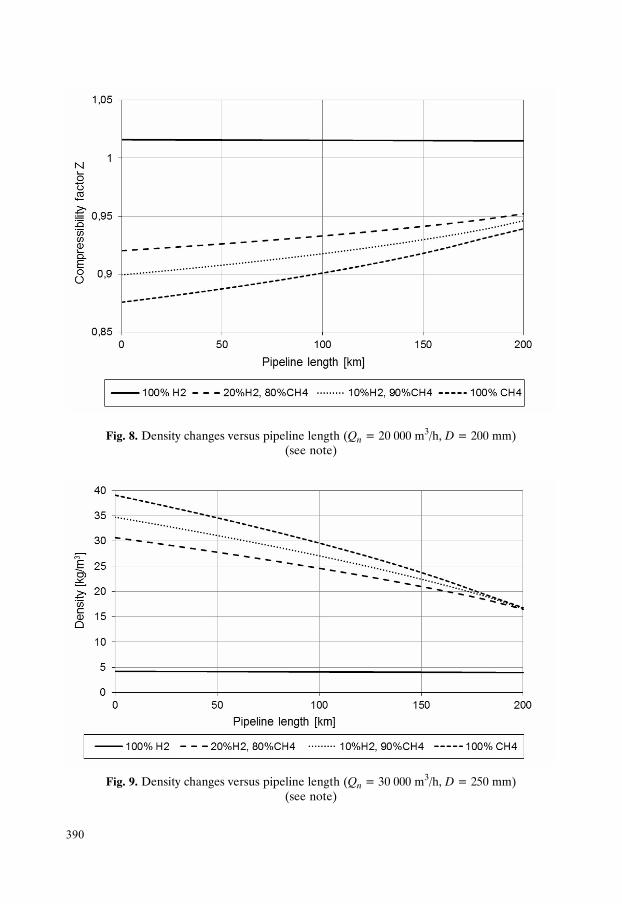
Fig. 8. Density changes versus pipeline length (Qn = 20 000 m3/h, D = 200 mm)(see note)
Fig. 9. Density changes versus pipeline length (Qn = 30 000 m3/h, D = 250 mm)(see note)
���
Density changes analysis
In Figures 8 and 9 changes of gas density in function of pipeline length are shownfor exemplary variants:
a) Figure 8 for case with flow rate: Qn = 20 000 m3/h and inner pipeline diameter:D = 200 mm.
b) Figure 9 for case with flow rate: Qn = 30 000 m3/h and inner pipeline diameter:D = 250 mm.
The gas density is strictly related to pressure, temperature and compressibilityfactor. In the algorithm temperature was assumed with a constant value, thereforethe density depends on the first two parameters.
Hydrogen flow with assumed flow rate is characterised by a slight decrease of densi-ty due to low pressure drops. Density of transported hydrogen in assumed conditionsis about 4 kg/m3. For bi-component methane-hydrogen mixtures and pure methanethe density drop is much higher because of higher pressure drop.
Flow velocity analysis
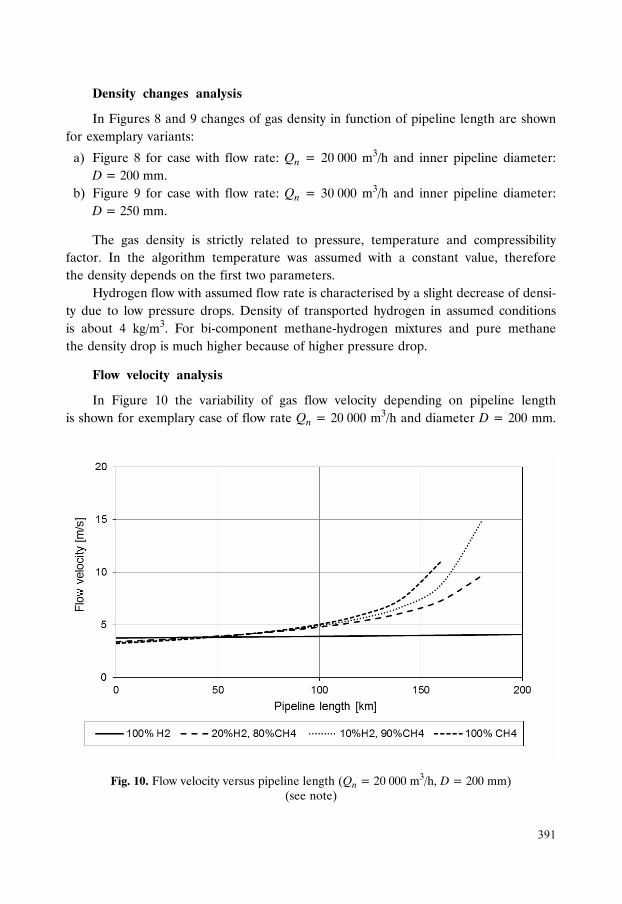
In Figure 10 the variability of gas flow velocity depending on pipeline lengthis shown for exemplary case of flow rate Qn = 20 000 m3/h and diameter D = 200 mm.
Fig. 10. Flow velocity versus pipeline length (Qn = 20 000 m3/h, D = 200 mm)(see note)
���
For assumed case the flow velocity of pure methane and bi-component methane-hydrogen mixtures is lower in the pipeline inlet (about 3.5 m/s) than velocity of purehydrogen (about 4 m/s). The flow velocity for assumed methane-hydrogen and forpure methane increase rapidly in function of pipeline length. Because of low pressuredrop the flow velocity changes of pure hydrogen are not significant. The increase ofthe flow velocity is higher for mixtures with lower hydrogen molar fraction. The highestvalue of flow velocity has a pure methane but in assumed conditions it can be transportedonly for 160 km distance. For the mixture with 20� molar fraction of hydrogen the valueof velocity has increased by 6 m/s and for mixture with 10� hydrogen molar fraction by11 m/s. Double increase of the hydrogen molar fraction in the mixture causes 30� flowvelocity value drop of its velocity at a 180 km distance.
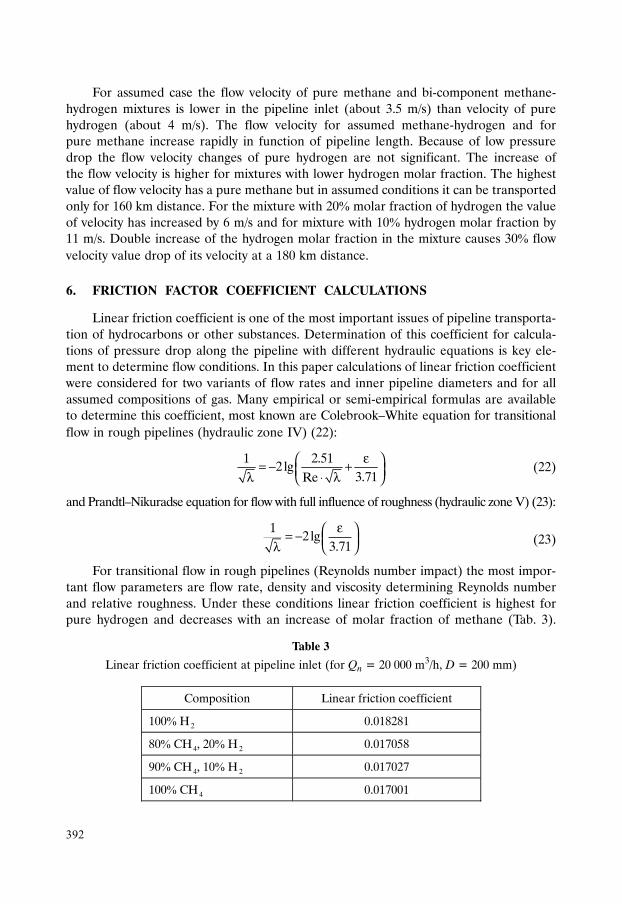
6. FRICTION FACTOR COEFFICIENT CALCULATIONS
Linear friction coefficient is one of the most important issues of pipeline transporta-tion of hydrocarbons or other substances. Determination of this coefficient for calcula-tions of pressure drop along the pipeline with different hydraulic equations is key ele-ment to determine flow conditions. In this paper calculations of linear friction coefficientwere considered for two variants of flow rates and inner pipeline diameters and for allassumed compositions of gas. Many empirical or semi-empirical formulas are availableto determine this coefficient, most known are Colebrook–White equation for transitionalflow in rough pipelines (hydraulic zone IV) (22):
1 2.512 lg
3.71Reε⎛ ⎞= − +⎜ ⎟λ ⋅ λ⎝ ⎠
(22)
and Prandtl–Nikuradse equation for flow with full influence of roughness (hydraulic zone V) (23):
12 lg
3.71ε⎛ ⎞= − ⎜ ⎟λ ⎝ ⎠ (23)
For transitional flow in rough pipelines (Reynolds number impact) the most impor-tant flow parameters are flow rate, density and viscosity determining Reynolds numberand relative roughness. Under these conditions linear friction coefficient is highest forpure hydrogen and decreases with an increase of molar fraction of methane (Tab. 3).
Table 3
Linear friction coefficient at pipeline inlet (for Qn = 20 000 m3/h, D = 200 mm)
���
Linear friction coefficient is a constant value depending on diameter and absoluteroughness of pipeline for full roughness impact flow zone.
7. ENERGY TRANSPORTATION
Another issue of hydrogen pipeline transportation is energy transport. It has lowmolar mass and consequently low density. Due to these two facts higher amount of ener-gy is required for its compression process. On the other hand low pressure drops allowto minimize the number of compression stations used for hydrogen transport. Hydrogen,as additive in natural gas, has positive impact on pipeline transportation of natural gaswhich can be transported for longer distances. The important issue for hydrogen pipelinetransportation is its energy value. Combustion heat of hydrogen per mass unit is muchhigher (141.9 MJ/kg) than methane (54 MJ/kg). Because of lower density hydrogen haslower heat of combustion (12.67 MJ/mn
3) per volume unit in normal conditions thanmethane (38.55 MJ/mn
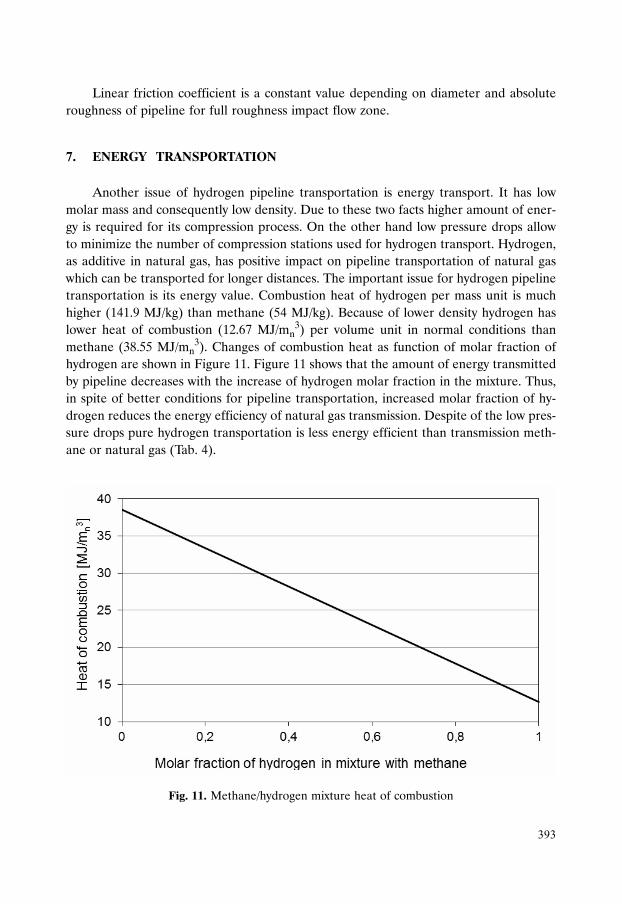
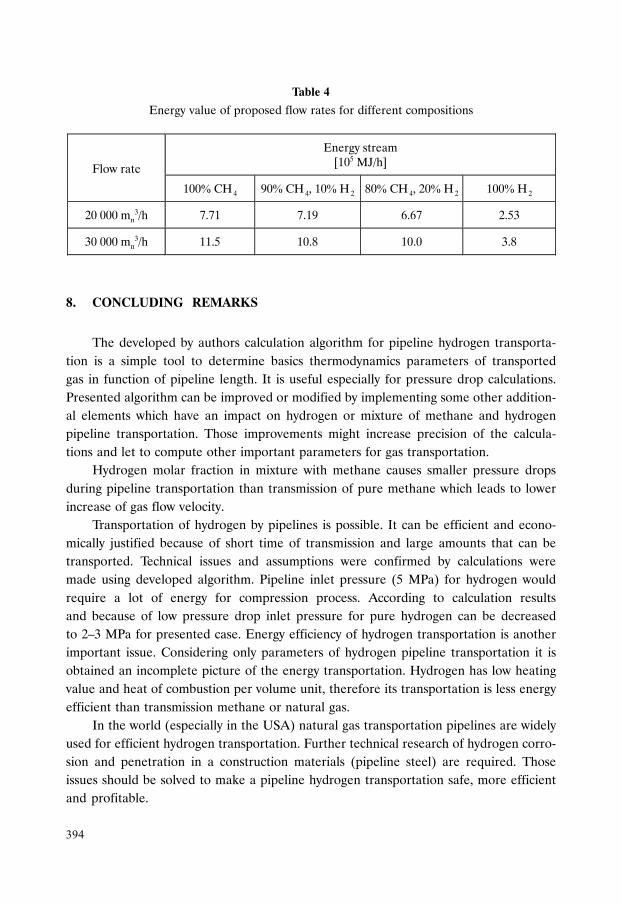
3). Changes of combustion heat as function of molar fraction ofhydrogen are shown in Figure 11. Figure 11 shows that the amount of energy transmittedby pipeline decreases with the increase of hydrogen molar fraction in the mixture. Thus,in spite of better conditions for pipeline transportation, increased molar fraction of hy-drogen reduces the energy efficiency of natural gas transmission. Despite of the low pres-sure drops pure hydrogen transportation is less energy efficient than transmission meth-ane or natural gas (Tab. 4).
Fig. 11. Methane/hydrogen mixture heat of combustion
���
Table 4
Energy value of proposed flow rates for different compositions
8. CONCLUDING REMARKS
The developed by authors calculation algorithm for pipeline hydrogen transporta-tion is a simple tool to determine basics thermodynamics parameters of transportedgas in function of pipeline length. It is useful especially for pressure drop calculations.Presented algorithm can be improved or modified by implementing some other addition-al elements which have an impact on hydrogen or mixture of methane and hydrogenpipeline transportation. Those improvements might increase precision of the calcula-tions and let to compute other important parameters for gas transportation.
Hydrogen molar fraction in mixture with methane causes smaller pressure dropsduring pipeline transportation than transmission of pure methane which leads to lowerincrease of gas flow velocity.
Transportation of hydrogen by pipelines is possible. It can be efficient and econo-mically justified because of short time of transmission and large amounts that can betransported. Technical issues and assumptions were confirmed by calculations weremade using developed algorithm. Pipeline inlet pressure (5 MPa) for hydrogen wouldrequire a lot of energy for compression process. According to calculation resultsand because of low pressure drop inlet pressure for pure hydrogen can be decreasedto 2–3 MPa for presented case. Energy efficiency of hydrogen transportation is anotherimportant issue. Considering only parameters of hydrogen pipeline transportation it isobtained an incomplete picture of the energy transportation. Hydrogen has low heatingvalue and heat of combustion per volume unit, therefore its transportation is less energyefficient than transmission methane or natural gas.
In the world (especially in the USA) natural gas transportation pipelines are widelyused for efficient hydrogen transportation. Further technical research of hydrogen corro-sion and penetration in a construction materials (pipeline steel) are required. Thoseissues should be solved to make a pipeline hydrogen transportation safe, more efficientand profitable.
��
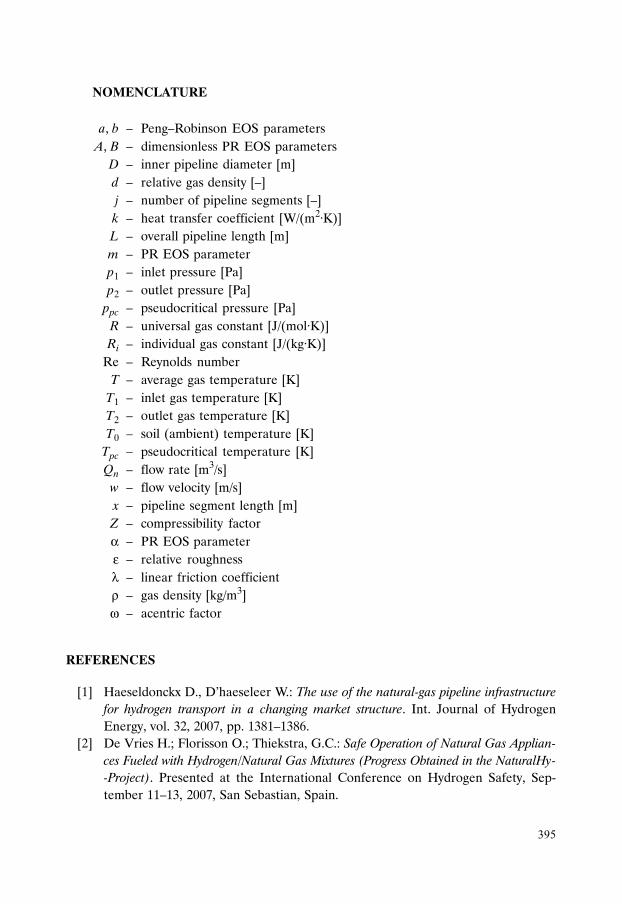
NOMENCLATURE
a, b – Peng–Robinson EOS parametersA, B – dimensionless PR EOS parameters
D – inner pipeline diameter [m]d – relative gas density [–]j – number of pipeline segments [–]k – heat transfer coefficient [W/(m2·K)]L – overall pipeline length [m]m – PR EOS parameterp1 – inlet pressure [Pa]p2 – outlet pressure [Pa]
ppc – pseudocritical pressure [Pa]R – universal gas constant [J/(mol·K)]Ri – individual gas constant [J/(kg·K)]
Re – Reynolds numberT – average gas temperature [K]
T1 – inlet gas temperature [K]T2 – outlet gas temperature [K]T0 – soil (ambient) temperature [K]
Tpc – pseudocritical temperature [K]Qn – flow rate [m3/s]
w – flow velocity [m/s]x – pipeline segment length [m]
Z – compressibility factorα – PR EOS parameterε – relative roughnessλ – linear friction coefficientρ – gas density [kg/m3]ω – acentric factor
REFERENCES
[1] Haeseldonckx D., D’haeseleer W.: The use of the natural-gas pipeline infrastructurefor hydrogen transport in a changing market structure. Int. Journal of HydrogenEnergy, vol. 32, 2007, pp. 1381–1386.
[2] De Vries H.; Florisson O.; Thiekstra, G.C.: Safe Operation of Natural Gas Applian-ces Fueled with Hydrogen/Natural Gas Mixtures (Progress Obtained in the NaturalHy--Project). Presented at the International Conference on Hydrogen Safety, Sep-tember 11–13, 2007, San Sebastian, Spain.
���
[3] Tabkhi F., Azzaro-Pantel C. , Pibouleau L., Domenech S.: A mathematical frame-work for modelling and evaluating natural gas pipeline networks under hydrogeninjection. International Journal of Hydrogen Energy, vol. 33, Issue 21, 2008,pp. 6222–6231.
[4] Wurm J., Pasteris R.F.: The transmission of gaseous hydrogen. SPE4526, 1973.[5] Peet Y., Saguut P., Charron Y.: Pressure loss reduction in hydrogen pipeline by sur-
face restructuring. International Journal of Hydrogen Energy, vol. 34, 2009,pp. 8964–8973.
[6] Takahashi K.: Transportation of Hydrogen by pipeline. Energy Carriers and Conver-sion Systems, vol. II, Editor: Tokio Ohta, EOLSS 2004.
[7] Bedel L., Junker M.: Natural gas pipelines for hydrogen transportation. Paper pre-sented at WHEC Conference Session, June 13–16, 2006, Lyon, France.
[8] Vademecum gazownika. T. 1, Podstawy gazownictwa ziemnego: pozyskiwanie, przygoto-wanie do transportu, magazynowanie [Gas engineer handbook]. Stanisław Nagy (Ed.).SITPNiG, Kraków, 2014.
[9] Peng D.Y., Robinson D.B.: A New Two-Constant Equation of State. Industrial andEngineering Chemistry Fundamentals, vol. 15, No. 1, 1976, pp. 59–64.
[10] Gondal I.A.: Hydrogen transportation by pipeline In: Compendium of HydrogenEnergy Vol. 2: Hydrogen Storage, Distribution and Infrastructure, Ram B. Gupta,Angelo Basile and T. Nejat Veziroglu (Eds). A volume in Woodhead Publishing,Series in Energy 2015.
[11] Colebrook C.F., White C.M.: Experiments with fluid friction in roughened pipes.Proc. R. Soc. A: Math. Phys. Eng. Sci., 161 (906), 1937, pp. 367–381.
[12] Kurowska K., Węgrzyn Ł.: Analiza termodynamiczna możliwości rurociągowego trans-portu wodoru. Paper presented at LV Student Conference Session, December 11,2014, AGH UST, Krakow 2014.