Embed Size (px)
Citation preview
Factors Relating to Misanthropy in Contemporary American Society
Tom W. Smith
National Opinion Research Center University of Chicago
June, 1996
GSS Topical Report No. 29
This research was done for the General Social directed by James A. Davis and Tom W. Smith. supported by the National Science Foundation, 9122462.
Survey project The project is Grant No. SES-


Introduction
In both academic and popular discourse over last year and an half considerable attention has been devoted to the issue of social capital in contemporary America (Elshtain, 1996; Putnam, 1995a; Putnam, 1995b; Putnam, 1995.c; Putnam, 1996; Fukuyama, 1995; Brehm and Rahn, 1995; Uslaner, 1995; Wright, 1995; Samuelson, 1996; Hong, 1996; Ladd, 1996; Stengel, 1966). Robert Putnam and other proponents of the social capital school have argued that social capital is a set of both beliefs and behaviors relating to interpersonal relations (e.g. trust in other people) and social connectedness (e.g. membership in voluntary associations and interaction with neighbors) that are essential for the harmonious functioning of society. Without such attitudinal predispositions and social ties to facilitate social exchange, individuals become isolated and suspicious of other citizens, groups, and government itself and social, economic, and political life functions poorly. In effect, social capital is both a glue that bonds society together and a lubricant that permits the smooth running of society's interactions (both inter-personal and among people, groups, and organizations). Moreover, the social capital school contends that social capital has been declining for the last 20-30 years and that it has been depleted to a dangerously low level.
In this paper we examine one key element of social capital, the degree of misanthropy in contemporary American society. We consider how the level of misanthropy has changed over the last 40 years and what are the factors that predict misanthropy.
Measuring Misanthropy
Misanthropy is measured by a three-item scale adapted from Morris Rosenberg's original five-item misanthropy index (Rosenberg, 1956; Robinson, Shaver, and Wrightsman, 1991) (see below). As
Generally speaking, would you say that most people can be trusted or that you can't be too careful in dealing with people? (TRUST)
Do you think most people would try to take advantage of you if they got a chance, or would' they try to be fair? (FAIR)
Would you say that most of the time people try to be helpful,· or that they are mostly just looking out for themselves? (HELPFUL)
conceptualized by Rosenberg (1956) the scale taps "faith in people," "attitudes towards human nature," or an "individual's view of humanity". The misanthropic believe that people in general are untrustworthy, unfair, and unhelpful. As Luhmann ( 1979) characterizes them they have a lack of faith in human nature, a negative and pessimistic outlook on people, and feel besieged and isolated, suffering from "negative atomism." Similarly Lewis and
1
Weigert (1985a; 1985b) describe them as lacking'both interpersonal and system trust and suffering from "social atomism." 1
The Rosenberg scale has been a core battery on the General Social Surveys (GSSs) of the National Opinion Research Center since 1972. The GSSs are full-probability samples of the adult household population of the United States using in-person interviews (Davis and Smith, 1994) . The three misanthropy items on the GSS were receded so that 1 expresses the judgement that people are trustworthy, fair, or helpful, 2 equals "depends," and 3 means that you "can't be too careful in dealing with people, " that people "try to take advantage of you," or that people "are mostly just looking out for themselves." Scores run from 3 for someone who considers people to be trustworthy, fair, and helpful to 9 for those who consider people untrustworthy, unfair, and unhelpful. Across all years 26.5% saw people in the most favorable light, 22.3% in the most negative light and the mean score was 5.85. ·
The three items form a good, short scale with a Cronabach's alpha of .67 and an average inter-item correlation of .40. The misanthropy items are distinct from, but correlated with, items taping related concepts. They differentiate themselves from other i terns on the GSS measuring anomia (ANOMIAS, ANOMIA6, ANOMIA 7) , views about the nature of the world (WORLD1, WORLD4), and confidence in leaders of institutions (CONFINAN, CONBUS, CONCLERG, CONEDUC, CONFED, CONLABOR, CONPRESS, CONMEDIC, CONTV, CONJUDGE, CONSCI, CONLEGIS, CONARMY). The misanthropy questions form their own three-item factor in all comparisons with each alternative set of items either singly or altogether. 2
However, the misanthropy scale is related to these other scales as one would expect (Table 1) . The misanthropic are more anomie, have negative views of the nature of the world, and have less confidence in the leaders of most institutions. The relationships with anomia and world views are moderate in magnitude and consistent in direction. The associations with low confidence in institutional leaders are more modest and there are two exceptions. First, the relationships are modest bec~use attitudes towards people in general are both conceptually and usually empirically distinct from attitudes towards institutions and elites. Second, the exceptions are that misanthropy is associated with having slightly more confidence in the people running labor unions and television. Since previous research has identified these as two non-establishment institutions that oft~n had low or even negative associations with confidence in the other 11 institutions (Smith, 1981; Lipset and Schneider, 1983), this pattern is not unexpected.
1For some alternative conceptualizations or refinements of misanthropy and inter-personal trust see Lagace and Rhodes, 1988; Lewis and Weigert, 1985a & 1985b; Robinson, Shaver, and Wrightsman, 1991; Yamagishi and Yamagishi, 1994.
2Factor analysis available from author.
2
Trends in Misanthropy
The social capital school argues that social capital in general and inter-personal trust. in particular has been declining. As Putnam (1995a) has written, "Americans are also less trusting. the proportion of Americans saying that most people can be trusted fell by more than a third between 1960, when 59 percent chose that alternative, and 1993, when only 37 percent did."
But trends in misanthropy in general and trust in particular are difficult to reliably ascertain. 3 First, responses are very sensitive to both wording and context. Regarding question wording, a 1983 GSS experiment found that 57% thought that "most people can be trusted" (Table 2A), but only 36.5% believed that "most people can be trusted" vs "you can't be too careful in dealing with people" (Table 3). Also, a non-experimental comparison of the variant wording used in 1960 and 1978 (Table 2B) suggests that it gathers 4-8 percentage points more trust than the standard GSS
.. wording (Tables 3 and 4). In addition, No Opinion levels on the three measures on the self-administered Monitoring the Future (MTF) surveys .of high school seniors are much higher than for the same items on the interviewer administered GSS (23-35% in the former vs. 3-7% in the latter,· see Tables 4 and 5). While these differences could result from the different populations being sampled, it is likely that the much higher non-response on MTF results from the fact that "Don't Know, undecided" is a pre-coded, middle option on MTF, but that "Depends" and "Don't Know" are unread responses on the GSS. 4
Regarding question order, both the trust and helpful items have experienced large context effects of respectively 7.7 and 9.4 percentage points (Table 3) (Smith, 1983; 1990; 1991a). These items are probably especially prone to context effects because they call for global assessments of people in general based presumably on one's entire life experience. Making judgments based on such massive, cognitive retrievals are difficult and open to variability. Sampling of ones own memories on such broad topics tend to be biased rather than complete or random. Questionnaire context is one factor that biases the cognitive processing and in turn influences the summary judgments (Smith, 1991a; 1991b) .
The Trust1 series (See Table 5, Adujusted) is preceded by an item on whether ones life is exciting and a ranking of five work values in all years and then by an item on getting ahead in life and two sexual morality questions in 1976-1994. The Trust2 series
3We discuss both trends in the individual components of the scale as well of the scale itself because a) there is considerable data that relates to the individual items rather than the scale and b) there are differences in trends across the components.
4Looking at people 18-24 on the GSS doesn't indicate that Don't Know responses are higher among young adults. Thus age is not likely to be a major factor in explaining the differences.
3

is preceded by three or four crime attitude items and then in 1978 to 1994 by items on political ideology, equalizing wealth, divorce laws, and legalizing marijuana. The focusing on crime and victimization may account for the lower trust expressed in the latter context.
The Helpful1 series is preceded by three items on personal finances and a measure of subjective social class. Three anomia items come next in 1973 and 1976 and two batteries on the use of violence in 1980-1994. In 1976 the hit items come immediately before the anomia items. The Helpful2 series is preceded by media use items: viewing TV and reading newspaper in 1975 and 1986 to 1994 and radio listening, viewing TV, and reading the newspaper in 1978 and 1983. From 1978 to 1994 these are preceded by items of smoking, drinking, and socializing. The anomia and violence items in the former series may be causing the lower ratings of helpfulness in that context.
Because of these context effects on the GSS the times series are reported separately for each context (Table 5, Adjusted).
In sum, the sensitivity of the misanthropy items to variations in wordings and context means that comparisons across different wordings (as Putnam. did) 5 are unwise and that even inter-survey comparisons of identical wordings are suspect because of possible context effects.
In part undoubtedly due to these measurement factors, trends in misanthropy are complex and somewhat contradictory. Looking at the individual components first, we see considerable variation, but no clear trend, in trust for the oldest series from 1948 to 1983 (Table 6). The series from the mid-1960s on (NORC 1960-78; non-NORC 1964-1995; and GSS 1973-94 and 1975-94) do point to a decline in trust of about 0.3 to 0.4 percentage points per annum, but when the non-NORC series are broken down into sub-series by program (NES, QOL, Gallup, and PSRA) the pattern is much less consistent. Next, for being helpful there are either constant fits (GSS 1973-94) or non-directional change (GSS 1975-94 and non-NORC 1964-95) for the main, adult times series with only the student MTF series showing a decline. Finally, for being fair the series agree that a decline is occurring, but differ a great deal on its magnitude from -0.16 percentage points per annum on the 1972-94 GSS to -0.66 percentage points on the 1975-1992 MTF. Thus, with the· exception of the reasonably consist MTF student series (Easterlin and Crimmins, 1991), the trends for the individual misanthropy items are complex and only partly consistent.
Looking at the composite scale on the GSS shows a modest increase in misanthropy. It is significantly related to year, but
5Putnam compared the 1960 point in Table 2b with the 1993 GSS point in Table 4a.
6Despite the context effects on two of the three items on the GSS, it is possible to combine them together into a relatively unbiased, across-time measure. First, the trust and helpful context
4

the correlation is only 0.033 and the mean rose from a low of 5.6 in 1978 to a high of 6.1 in 1994 (Table 7) . Furthermore, close inspection of the data indicates the even this modest trend became established only since 1991. 7 Thus, at most one can talk about only a modest and fairly recent decline in misanthropy. 8
Predictors of Misanthropy
Based on a review of the literature on misanthropy and related concepts, we formulated a number of hypotheses about the factors that influence misanthropy.
First, we expect that misanthropy will decrease with socioeconomic status (Bahr and Martin, 1983; Brehm and Rahn, 1995; DeMaris and Yang, 1994 Grabb, 1980; Huang and Anderson, 1991; Robinson, Shaver, and Wrightsman, 1991; Smith, 1985). The betteroff people are materially and the higher their social standing, the more likely they will view the world and other people in a favorable light. Specifically, misanthropy should decline as household income and respondent's education increase.
Second, misanthropy should decrease with upward social mobility. Improvements in social standing, both inter- and intragenerationally, should reduce negative evaluations.
Third, misanthropy should increase as negative life events or traumas occur (Brehm and Rahn, 1995; House and Wolf, 1978; Norris and Kaniasty, 1991; Smith, 1976). Negative experiences, especially those caused by other people, should lead to unfavorable evaluations of people. Specifically, pessimism should increase with experiences of a) criminal victimization (having been robbed or burglarized in the last year) , b) inter-personal violence (having been hit or shot at) , c) illness and hospitalization, d) unemployment, and e) deaths in the family.
Fourth, misanthropy should increase with disruptive family situations especially those involving divorce (Brehm and Rahn, 1995; Southworth and Schwarz, 1987; Yoder and Nichols, 1980). It should be higher among those who a) were children of divorced parents, b) have been divorced themselves, c) are currently divorced or separated, and d) have never been married. While it is possible to see divorce as just another miscellaneous negative life
effects are largely off-setting with trust high in surveys (and years) that helpful is low and vise versa. Second, because of this, there is no statistically significant context effect for the scale (means in 1988-94 are 5.91 for context1 and 6.01 for context2; prob.=.056).
7That is, the correlation for 1972-1991 is only . 010 and prob.=.191. Only with the addition of the 1993 data point does the relationship become statistically significant.
8See also Yamagishi's (1995) analysis of the joint trends of trust and helpfulness.
5

event, we hypothesis that divorce will have a distinct and especially strong impact on shaping judgments about human nature since they concern broken commitments involving very close, interpersonal relationships.
Fifth, misanthropy should be greater in large metropolitan areas where more people are strangers and the environment is perceived as more threatening and impersonal (House and Wolf, 1978; Robinson, Shaver, and Wrightsman, 1991; Wilson, 1985).
Sixth, misanthropy should be higher among cultural groups and minorities that have been discriminated against and isolated from the majority culture (Calhoun and Cann,· 1994; DeMaris and Yang, 1994; Robinson, Shaver, and Wrightsman, 1991; Terrell and Barrett, 1979; Thomas and Hughes, 1986; Wilson, 1985). Specifically, negative assessments should be higher among Blacks and Hispanics and perhaps among Jews and recent immigrants. In addition, social contact between the minorities and the majority should reduce misanthropy coming from exclusion (Smith, 1996) . 9 However, for the majority social contact with minorities should·have minimal impact. The social contact hypothesis can be tested in reference to Blacks and Whites, but not other racial groups.
Seventh, religious belief should reduce misanthropy (Bahr and Martin, 1983; Luhmann, 1979); Schoenfeld, 1978). In addition, those who attend church more should be less misanthropic (Bahr and Martin, 1983; Schoenfeld, 1979) . However, among the religious those with Fundamentalist beliefs, which emphasize the sinful nature of humans and a stern and authoritarian God, should be more misanthropic than those with a liberal religious orientation, which emphasizes human goodness and a compassionate and caring God (Bahr and Martin, 1983; Robinson, Shaver, and Wrightsman, 1991; Schoenfeld, 1979).
Eight, misanthropy should be lower among older adults (Brehm and Rahn, 1995; DeMaris and Yang, 1994; :Robinson, Shaver, and Wrightsman, 199110). This may result from life course adjustments, as adults adapt to their surroundings and find friends, employers, etc. whom they can trust. For example, job satisfaction improves with age as people eventually find jobs that met their particular talents, temperament, and expectations. Alternatively, lower misanthropy among older adults might be a function of cohort. Older adults were raised during a period in which society and ones fell~w
9The social contact literature (e.g. Powers and Ellison, 1995; Sigelman and Welch, 1993) suggests that inter-racial contacts that are cooperative, voluntary, between people of equal status, and endorsed by authorities lead to better, inter-group relations. Presumably this involves increasing inter-group trust which for the minority group should in particular promote judgments that people in general are trustworthy.
10But Robinson, Shaver, and Wrightsman (1991) find a curvilinear association with misanthropy highest among the young and the old.
6

citizens were more civil (e.g. less crime, less divorce, more people living outside of large metropolitan areas) . To the extent that their assessments of human nature were forged by a Mannheimian generational socializing process, they should be less misanthropic than more recent generations socialized in more troubled situations and more impersonal environments.
Ninth, misanthropy should be higher among· men than women (DeMaris and Yang, 1994; Lagace and Gassenheimer, 1989; Robinson, Shaver, and Wrightsman, 1991; Terrell and Barrett, 1991) . 11
Traditionally men see the world in more competitive and conflictual terms, while women are more cooperative and nurturing. Of course, these traditional gender roles and perspectives have been changing in recent decades and these distinctions have attenuated.
Tenth, misanthropy should be greater in the South (Ellison, 1991; Robinson, Shaver, and Wrightsman, 1991). Higher levels of violence, greater inter-group hostility, lower standards of living, isolation from national centers of power, and its status as a defeated, sub-ordinate region should tend to make Southerners more suspicious of people than non-Southerners are.
Eleventh, misanthropy might be greater among recent movers. Movers are outsiders in their new communities and may have few affirming ties to friends and neighbors. On the other hand, movers maybe more adaptive and cosmopolitan than stayers and being more at ease with others they maybe less misanthropic.
Finally, we expect a number of other variables to be associated with misanthropy, but we are much less sure of the casual, .ordering. Misanthropy should be lower among those who belong to many voluntary associations (Brehm and Rahn, 1995) , people who do not drink to excess, those who are happy, and, among the married, those in happy marriages.
Bivariate Tests of Hypotheses
Table 8 shows the bivariate tests of these expectations. Overall, there are significant relationships in the predicted direction in all but three cases.
First, higher income and education are both associated with less misanthropic evaluations.
Second, both intergenerational downward occupational mobility and a recent worsening in financial situation are related to negative assessments.
Third, with one exception recent negative life events (including criminal victimization and violence, health problems, unemployment, and traumas in general) increase misanthropy. However, counter to this pattern and to expectations, deaths in the family are associated with less misanthropy.
11Lagace and Gassenheimer (1989) found no gender differences on global trust, but found that men were more suspicious than women. In a student sample Terrell and Barrett (1991) found that women were less trusting than men were.
7

Furthermore, these relationships were explored by using a more extensive measure of traumas available in 1991 that measured the occurrence of 64 negative life events during the last year (Smith, 1992). In various variations of the basic regression equation number of negative life events was a significant predictor of misanthropy. The coefficient was typically between . 09 and .10 which placed it about seventh among all predictors.· However, adding negative life events to the model only marginally altered the other relationships. The fairly modest impact of negative life events may reflect the fact that we are measuring such occurrences only over the last 12 months. The cumulative impact of such experiences over a lifetime maybe much greater. Also, while many of the negative life events were linked to the actions of others (e ~g. marital discord, mistreatment by an employer, criminal victimization) and therefore might be seen as evidence for pessimism towards people in general, other events were probably unrelated to the actions of others (e.g. illnesses and personal substance abuse) and in many cases people may have received positive assistance from others (e.g. friends, families, doctors, police officers, etc.)
Fourth, having come from a broken home, having been divorced oneself, or not being married are related to negative judgments.
Fifth, those living in a large· central city are more misanthropic.
Sixth, in general minorities have more pessimistic outlooks than do majority groups. Elaborating on the groups used in Table 8,
· ethno-racial differences were examined for more than 40 groups. This showed that misanthropy was lowest among early European immigrant groups (British) and Scandinavians and higher for· more recent European immigrant groups and non-European groups (Africans, Asians, Amerindians, and Hispanics). To simplify the pattern and come up with enough observations for reasonably stable estimates seven groups were distinguished in the final analysis (1-early immigrants from Scandinavia and Great Britain, 2-middle immigrants from France, French Canada, Belgium, Ireland, Germany, Austria, Holland, 3-late immigrants from Eastern and Southern Europe, Jewish, and miscellaneous, 4-Hispanics from Spanish-speaking countries, 5-Amerindians, 6-Asians, and 7-Blacks (Table 9).
This breakdown shows that the difference between Blacks and Whites is especially pronounced. Blacks are much more misanthropic than Whites: 51.2% of Whites and 80.9% of Blacks consider people untrustworthy (+ 25.4 percentage points), 31.5% of Whites and 60.6% of Blacks judge people as unfair (+25.0), and 40.9% of Whites and 62.7% of Blacks think people are unhelpful (+21.8%). These singleitem differences convert into a mean difference of +1.58 on the misanthropy scale (5.65 for Whites vs. 7.23 for Blacks).
The racial difference is probably a joint reflection of the position of Blacks as a social and numerical minority. Two of the misanthropy items are framed in terms of whether the majority of people are trustworthy or fair. In America of course the majority of people are White. So from a strictly demographic point of view the questions essentially ask Blacks whether most Whites are trustworthy or fair. For the trust dimension we know how Blacks
8
explicitly evaluate the trustworthiness of Whites. In the 1982 GSS Blacks were asked "Do you feel you can trust most white people, some white people, or no white people?" Only 7. 3% thought most Whites could be trusted, 81.4% that some Whites could be trusted, and 11.3% that no Whites could be trusted. This is even more negative than the judgment about people in general since in 1980-83 17.5% of Blacks thought most people could be trusted, 4.7% said it depends, and 77. 8% thought most people were untrustworthy. 12 The connection between race and trust is also shown by the fact that Blacks have more trust in local governments where a Black is the mayor than they do in governments with White mayors (Bobo and Gilliam, 1990; Howell and Fagan, 1988). Thus, the lower ratings of people by Blacks is consistent with and probably largely a reflection of how Blacks view Whites . 13
Among Blacks those who are the most isolated (i.e. having less contact with non-Blacks) are the most negative. As expected, among non-Blacks there is no association between inter-racial contacts &n.d evaluations of human nature (Pearson's r =-.001/NS).
Second, the relationship between immigration status and misanth;r:opy is complex. Negative perspectives decline from immigrants (6.15) to the third generation (5.4) (native born of native born parents), but then rise again for those in the 4+ generation (grandparents + ·native born) (6. 0). As a result, the overall relationship is weakly positive (r=.036/.000) with higher immigrant generation associating with more misanthropy, opposite the hypothesis. This is probably due to the concentrations of Blacks and Southerners in the latter category.
Finally, the lower misanthropic level among Jews is also counter to our hypothesis: Some earlier research (Schoenfeld, 1978) reported that Jews were more misanthropic than non-Jews and hypothesized that this was due to the negative impact of the Holocaust on the world view of Jews. However, the 1972-1994 GSSs ·find that Jews have the least negative view of people of adherents of major religions (Jews=5.45; Catholics=5.73; Protestants~5.88; No Religion=6. 09; and Other Religion=6 .11) . We searched for the proposed Holocaust connection by looking at misanthropy by immigrant status, birth cohort, and period. We assumed that a Holocaust effect would be greater among Jews in greater proximity to the Holocaust: the foreign-born vs. those born ih America, those who were adults in the 1940s vs. those in later cohorts, and those interviewed in the 1970s vs. those in later surveys.
12This negative assessment on inter-racial trust is also shared by the general population. In response to the question "Do you think most blacks trust whites, or do you think most blacks don't trust whites?" 17% said Trust, 67% Don't Trust, and 17% Don't Know and Other (New York Times poll, 2/1994, n=1193).
130n Black mistrust of Whites in general see Biafora, Taylor, Warheit, Zimmerman, and Vega, 1993; Jeanquart-Barone, 1993; and Kuran, 1993; Taylor, Biafora, and Warheit 1994.
9

First, we found that foreign-born Jews (most of whom would have come from Europe) were somewhat more misanthropic than American-born Jews (5.44 vs. 5.26), but the difference was not statistically significant and foreign-born Jews were not more pessimistic than immigrants of other faiths (Protestants=5.46; No Religion=6.12; Other=6.24; Catholics=6.38).
Second, Jews born in earlier cohorts were generally less misanthropic than Jews from more recent cohorts and this was similar to the pattern shown by the other faiths.
Finally, Jews did show · a slight decrease in pessimism (Pearson's r with year=-.076), but the trend was not statistically significant. However, since non-Jews had a even more modest but statistically significant increase in misanthropy (r=+.035), the relative negativism of Jews decreased over time. In 1972-1978 Jews were marginally more pessimistic than non-Jews (5.99 - 5.60=+0.39; prob.=;88), while by 1989-1994 they were less misanthropic (5.41 -5.97=-0.56; prob.=.02).
Overall, there is limited support for the idea that the Holocaust increased misanthropy among Jews. Misanthropy is marginally higher among immigrants than the native born and at least compared to non-Jews it has declined as time from the Hol6caust has increased.~ However, Jews born in cohorts closer to the Holocaust are not more misanthropic than Jews from more recent cohorts, nor are Jews more misanthropic than non-Jews.
Seventh, having no religion is weakly (but significantly) related to more misanthropy as is attending church less frequently. However, being a member of a Fundamentalist denomination is associated with more negative views.
Eighth, misanthropy-declines with age. Ninth, men are slightly more misanthropic than women. Tenth, misanthropy is higher in the South than in other
_regions. Eleventh, geographic mobility is associated with lower
misanthropy . 15
Finally, non-membership in voluntary associations, personal and marital unhappiness, and excessive drtnking are related to
140f course the relative gain in trust among Jews in recent years may not be tied to distance from the Holocaust. Perhaps the Jewish edge in education increased or possibly optimism about Israel improved. We do know that anti-Semitism in the United States declined during the post-World War period (Smith, 1994) .
15However, three other measures of geographic mobility asked in single years showed a mixed pattern. In the 1987 GSS having recently changed residences was associated with more misanthropy. In the 1986 and 1987 GSSs two measures of how long one had lived in the local community were not significantly related to misanthropy.
10
pessimistic judgments . 16
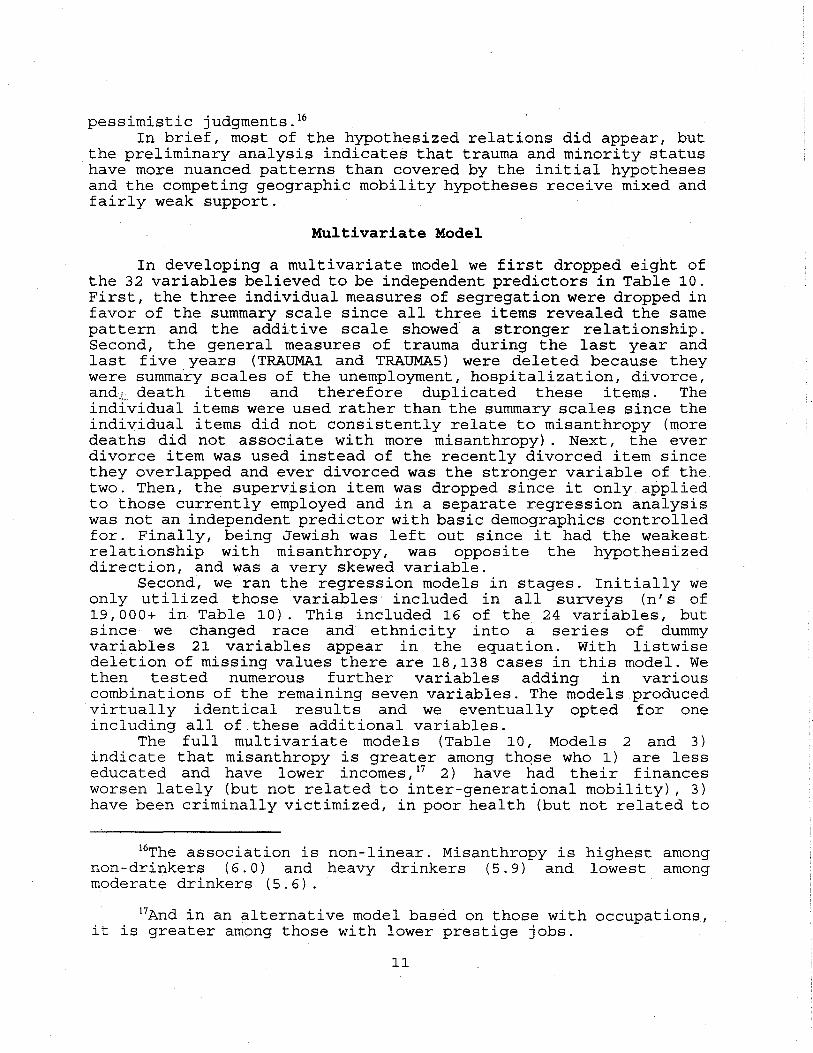
In brief, most of the hypothesized relations did appear, but the preliminary analysis indicates that trauma and minority status have more nuanced patterns than covered by the initial hypotheses and the competing geographic mobility hypotheses receive mixed and fairly weak support.
Multivariate Model
In developing a multivariate model we first dropped eight of the 32 variables believed to be independent predictors in Table 10. First, the three individual measures of segregation were dropped in favor of the summary scale since all three items revealed the same pattern and the additive scale showed a stronger relationship. Second, the general measures of trauma during the last year and last five years (TRAUMA1 and TRAUMAS) were deleted because they were summary scales of the unemployment, hospitalization, divorce, and 1 death items and therefore duplicated these items. The individual items were used rather than the summary scales since the individual items did not consistently relate to misanthropy (more deaths did not associate with more misanthropy). Next, the ever divorce item was used instead of the recently divorced item since they overlapped and ever divorced was the stronger variable of the two. Then, the supervision item was dropped since it only applied to those currently employed and in a separate regression analysis was not an independent predictor with basic demographics controlled for. Finally, being Jewish was left out since it had the weakest relationship with misanthropy, was opposite the hypothesized direction, and was a very skewed variable.
Second, we ran the regression models in stages. Initially we only utilized those variables· included in all surveys (n' s of 19,000+ in Table 10). This included 16 of the 24 variables, but since we changed race and ethnicity into a series of dummy variables 21 variables appear in the equation. With listwise deletion of missing values there are 18,138 cases in this model. We then tested numerous further variables adding in various combinations of the remaining seven variables. The models produced virtually identical results and we eventually opted for one including all of these additional variables.
The full multivariate models (Table 10, Models 2 and 3) indicate that misanthropy is greater among thqse who 1) are less educated and have lower incomes, 17 2) have had their finances worsen lately (but not related to inter-generational mobility), 3) have been criminally victimized, in poor health (but not related to
16The association is non-linear. Misanthropy is highest among non-drinkers ( 6. 0) and heavy drinkers ( 5. 9) and lowest among moderate drinkers (5.6).
17And in an alternative model based on those with occupations, it is greater among those with lower prestige jobs.
11
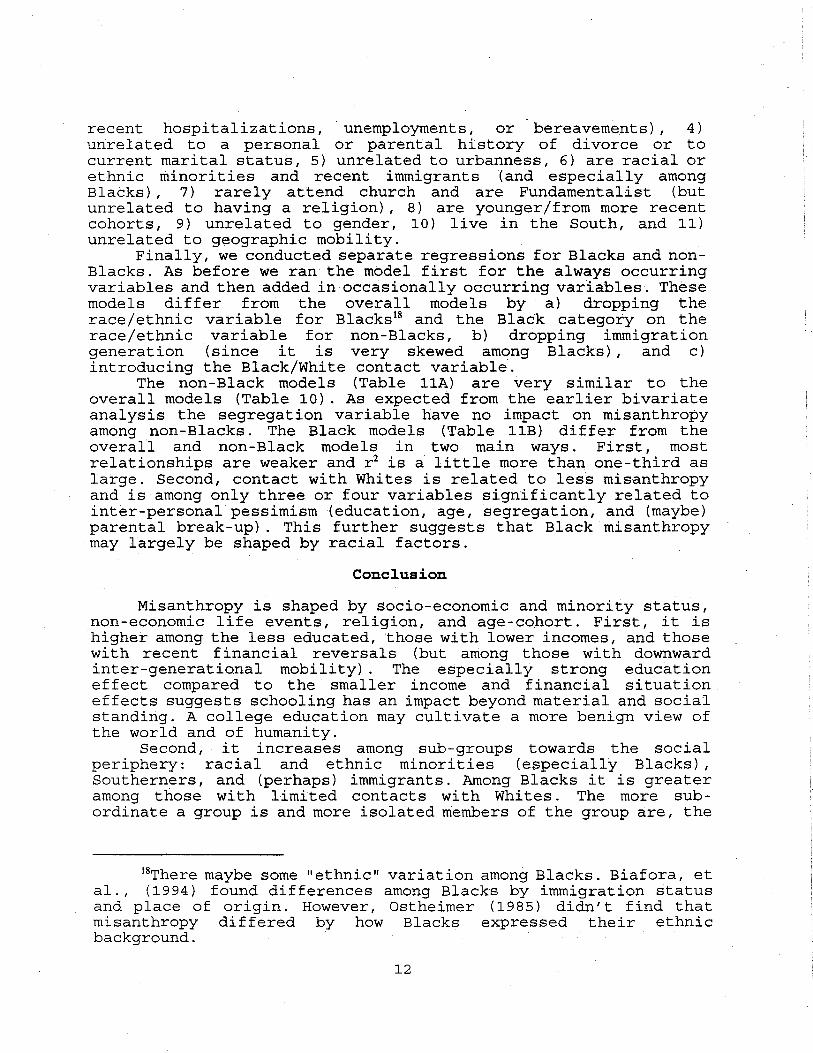
recent hospitalizations, unemployments, or bereavements), 4) unrelated to a personal or parental history of divorce or to current marital status, 5) unrelated to urbanness, 6) are racial or ethnic minorities and recent immigrants (and especially among Blacks), 7) rarely attend church and are Fundamentalist (but unrelated to having a religion), 8) are younger/from more recent cohorts, 9) unrelated to gender, 10) live in the South, and 11) unrelated to geographic mobility.
Finally, we conducted separate regressions for Blacks and nonBlacks. As before we ran the model first for the always occurring variables and then added in occasionally occurring variables. These models differ from the overall models by a) dropping the race/ ethnic variable for Blacks18 and the Black category on the race/ethnic variable for non-Blacks, b) dropping immigration generation (since it is very skewed among Blacks) , and c) introducing the Black/White contact variable.
The non-Black models (Table 11A) are very similar to the overall models (Table 10). As expected from the earlier bivariate analysis the segregation variable have no impact on misanthropy among non-Blacks. The Black models (Table 11B) differ from the overall and non-Black models in two main ways. First, most relationships are weaker and r 2 is a little more than one-third as large. Second, contact with Whites is related to less misanthropy and is among only three or four variables significantly related to inter-personal pessimism (education, age, segregation, and (maybe) parental break-up) . This further suggests that Black misanthropy may largely be shaped by racial factors.
Conclusion
Misanthropy is shaped by socio-economic and minority status, non-economic life events, religion, and age-cohort. First, it is higher among the less educated, those with lower incomes, and those with recent financial reversals (but among those with downward inter-generational mobility) . The especially strong education effect compared to the smaller income and financial situation effects suggests schooling has an impact beyond material and social standing. A college education may cultivate a more benign view of the world and of humanity.
Second, it increases among sub-groups towards the social periphery: racial and ethnic minorities (e~pecially Blacks), Southerners, and (perhaps) immigrants. Among Blacks it is greater among those with limited contacts with Whites. The more subordinate a group is and more isolated members of the group are, the
18There maybe some "ethnic" variation among Blacks. Biafora, et al., (1994) found differences among Blacks by immigration status and place of origin. However, Ostheimer (1985) didn't find that misanthropy differed by how Blacks expressed their ethnic background.
12

greater the misanthropy. Third, it is greater among those with recent or on-going, non
economic problems - victims of crime and violence and those in poor health.
Fourth, it is higher among those who do not attend church and among Fundamentalists. These effects are counter to each other since Fundamentalists tend to be more frequent church attenders than non-Fundamentalists. Church attendance probably diminishes misanthropy both because attendees tend to be people with faith (in God, their church, and, perhaps by extension, their fellow citizens) and because of the positive inter-personal ties that congregations further. Fundamentalists however are taught a theology that both stresses the sinful nature of people and tends to divide people into the few devout and the many fallen away.
Finally, misanthropy is greater among younger adults/members of more recent cohorts. The relationship between age/cohort and misanthropy may help to explain the trends over time. At least over the last two decades the evidence points to some decline. The MTF series start to tip downwards in the early to mid-1980s and the GSS scale shows a modest, cumulative decline after the 1993/94 points are added to the 1972-1991 time series. Other series also mostly point in a negative direction, but the pattern and magnitude of the change is complicated and not very clear. If the MTF youths areundergoing an Mannheimian socialization process and if some substantial part of the current age differential among adults represents a cohort effect, then misanthropy should grow in the near-term future due to cohort replacement. Davis' work (1995) suggests that this is at least partially the case with cohort replacement accounting for just over 40% of the total change in trust from the 1970s to the 1990s.
It is also instructive what does not explain misanthropy. _First, urbanness has no direct impact on negativism and the one distinctly misanthropic region, the South, is not highly urbanized. Thus, the notion that closely-knit, small-town communities engender faith in people is not supported. Second, having gone through a divorce as a child or as a spouse does not increase misanthropy. Whatever the long-term impacts of divorce maybe, misanthropy does not appear to be one of them. This is particularly noteworthy since it- had been hypothesized that the "intimate betrayal" of parental or spousal divorce was would have a strong impact on faith in people. Third, never having been married does not lead to more pessimism. Thus, while isolation has an impact in other circumstances (e.g. minority status), being without a spouse does not exert a similar effect . 19 Fourth, geographic mobility has no
19In 1986, 1987, and 1988 different measures friends (or similar) were included on the GSS. misanthropy was lower when people had more friends, 1987 variable based on a listing of people with discussed important personal matters recently was related when added to Model3 in- Table 10.
13
of number of In general,
but only the whom one had significantly

clear relationship. Its impact may pull in opposite directions as the competing hypotheses had suggested. Fifth, gender is unrelated. Finally, while some traumas (e.g. victimization) are associated with more misanthropy, others .(e.g. deaths, unemployments, and hospitalizations) are not. Combined with the null divorce findings, this indicates that some, but not all, negative ·life events influence misanthropy.
14
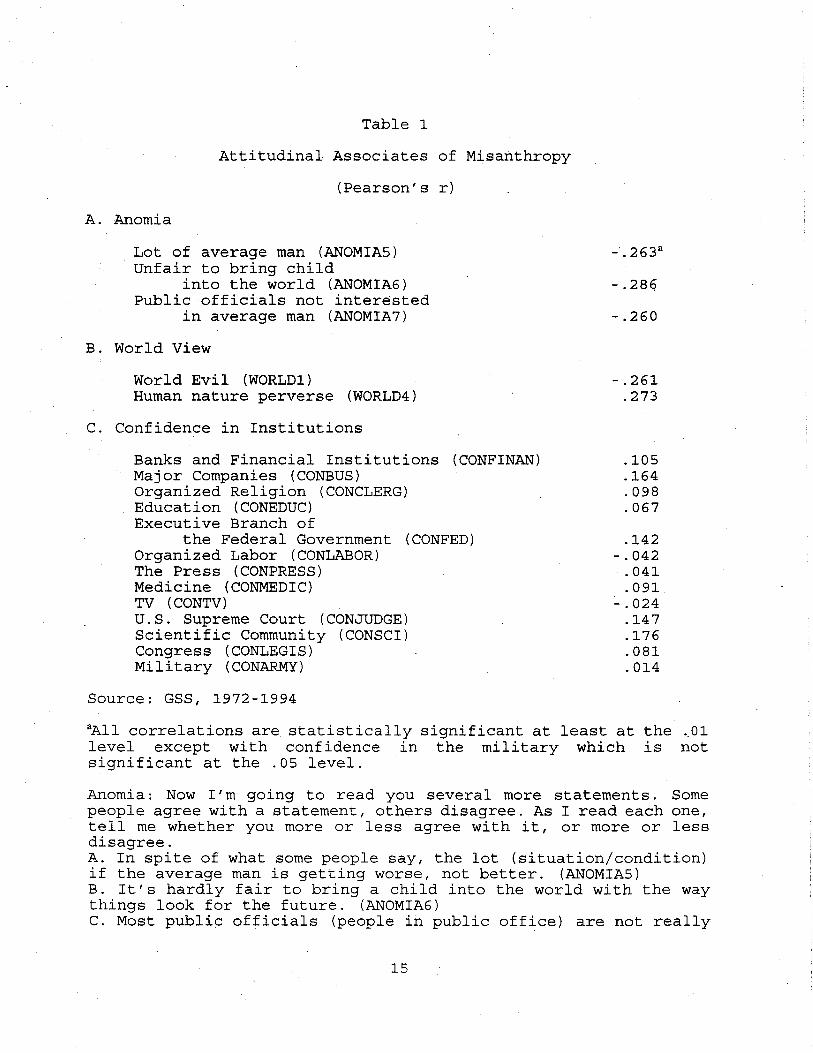
Table 1
Attitudinal Associates of Misanthropy
(Pearson's r)
A. Anomia
Lot of average man (ANOMIA5) Unfair to bring child
into the world (ANOMIA6) Public officials not interested
in average man (ANOMIA?)
B. World View
World Evil (WORLD1) Human nature perverse (WORLD4)
C. Confidence in Institutions
Banks and Financial Institutions (CONFINAN) Major Companies (CONBUS) Organized Religion (CONCLERG) Education (CONEDUC) Executive Branch of
the Federal Government (CONFED) Organized Labor (CONLABOR) The Press (CONPRESS) Medicine (CONMEDIC) TV (CONTV) U.S. Supreme Court (CONJUDGE) Scientific Community (CONSCI) Congress (CONLEGIS) Military (CONARMY)
Source: GSS, 1972-1994
-.28q
-.260
-.261 .273
.105
.164
.098
.067
.142 -.042
.041
.091 -.024
.147
.176
.081
.014
aAll correlations are statistically significant at least at the .. 01 level except with confidence in the military which is not significant at the .05 level.
Anomia: Now I'm going to read you several more statements. Some people agree with a statement, others disagree. As I read each one, tell me whether you more or less agree with it, or more or less disagree. A. In spite of what some people say, the lot (situation/condition) if the average man is getting worse, not better. (ANOMIA5) B. It's hardly fair to bring a child into the world with the way things look for the future. (ANOMIA6) C. Most public officials (people in public office) are not really
15

interested in the problems of the average man. (ANOMIA?)
Table 1 (continued)
World View: People have different images of the world and human nature. We'd like to know the kinds of images you have. Here is a card with sets of contrasting images. On a scale of 1-7 where would you place your image of the world and human nature between the two contrasting images. Look at the first set of contrasting images. If you think that "The world is basically filled with evil and sin," you would place yourself at 1. If you think "There is much goodness in the world which hints as God's goodness" you would place yourself at 7. If you think things are somewhere between these two you would place yourself at 2, 3, 4, 5, or 6. A. The world is basically filled with evil and sin ... There is much goodness in the world which hints at God's goodness (WORLD1) B. Human nature is basically good ... Human nature is fundamentally perverse and corrupt (WORLD4)
Confidence:! am going to name some institutions in this country. As far as the people running these institutions are concerned, would you say you have a great deal of confidence, only some confidence, or hardly any confidence at all in them?
16

Table 2
Trends in Trust of People
A. Do you think most people can be trusted?
Date % Yes % No % DK N
3/1948 65 30 4 1289 8/1952 68 30 2 1297 11/1953 57 39 4 1232 1/1954 62 34 4 1250 11/1954 65 32 3 1201 4/1957 75 22 3 1279 10/1964 77 21 2 1975 3/1983 56 41 3 790a 3/1983 57 40 3 790
0~
Source: National Opinion Research Center
aThe first GSS figure does not weight for number of eligible respondents in the household, while the second figure does. The latter is more accurate, but the former is probably more comparable to the other figures in the series.
B. Some people say that most people can be trusted. Others say you can't be too careful in your dealing(s) with people. How do you feel about it?b
Year Trust Not Trust DK/Other N
.1960 55.3 40.4 4.2 970 1978 48 51 1 1635
Source: National Opinion Research Center
bplural in 1960; singular in 1978.
17

Table 3
Non-NORC Trends in Misanthropy
Year Trust Not Trust DK/Other N
1964 53.4 44.7 1.9 . 1446 1966 52.9 45.6 1.5 1284 1968 55.2 43.2 1.6 1343 1971 48.5 50.0 1.5 2164 1972 45.8 52.4 1.8 2179 1974 46.6 52.1 1.3 2486 1976 51.3 45.9 2.8 2400 1978 47.9 51.9 0.2 3630 1979 43 56 2 1635 1981 43 54 3 2325 1981 47 50 3 1729 1983 40 55 5 1207 1990 49 49 3 1839 1991 34 63 3 600 1992 44.7 54.5 0.8 2244 1995 35 63 2 1514
Year Helpful Not Helpful DK/Other N
1964 54.3 41.3 4.4 1445 1966 51.9 45.7 2.4 1285 1968 58.2 45.7· 3.2 1344 1971 54.8 41.7 3.5 2164 1972 46.9 50.7 4.2 2174 .1974 50.7 46.5 2.8 2450 1976 51.9 43.8 4.3 2394 1978 57.9 41.5 0.6 3605 1979 41 56 2 1635 1983 49 45 6 1207 1991 43 48 9 600 1992 58.7 39.2 2.1 2229 1994 37 58 6 600 1995 49 48 3 1514
18

Year
1964 1968 1971 1972 1974 1976 1977 1978 1979 1983 1995
Fair
67.3 66.8 65.9 58.9 57.6 59.9 58 67.0 56 56 50
Table 3
Not Fair
28.6 30.1 31.5 36.8 39.5 35.5 35 32.0 41 36 48
(continued)
DK/Other N
4.2 1443 3.1 1342 2.6 2164 4.3 2179 2.8 2473 4.6 2390 7 1447 1.0 3604 3 1207
·8 1207 2 1514
Source: NES/SRC - 1964, 1966, 1972, 1974, 1976, 1992 QOL/SRC - 1971, 1978 Gallup - 1981, 1981, 1990, 1994 Audits and Surveys - 1983 Princeton Survey Research Associates - 1991, 1995
Wordings: Trust: Generally speaking, would you say that most people can be trusted or that you can't be too careful in dealing with people?
Helpful: Would you say that most of the time people try to be helpful, or that they are mostly just looking out for themselves? "Generally speaking" precedes question in 1979. "Just" omitted in· 1991.
Fair: Do you think most people would try to take advantage of you if they got a/the chance, or would they try to be fair?
19

Table 4
GSS Trends in Misanthropy
A. Unadjusted
Year Trust Not Trust DK/Other N
1972 46.3 50.0 3.8 1598 1973 46.8 50.4 2.8 1499 1975 39.7 56.1 4.2 1479 1976 44.0 52.6 3.4 1494 1978 39.9 55.7 4.4 1528 1980 44.3 51.9 3.7 1463 1983 36.5 59.2 4.3 801 1984 48.9 48.7 2.4 1462 1986 37.7 59.5 2.7 1466 1987 43.6 52.8 3.6 1460 1988 39.5 56.1 4.4 990 1989 41.1 55.5 3.3 1018 1990 38.4 57.4 4.2 892 1991 38.9 56.0 5.1 1019 1993 35.3 60.6 4.1 1061 1994 34.4 61.3 4.3 1976
Year Helpful Not Helpful DK/Other N
1972 45.9 47.9 6.2 1586 1973 46.7 49.6 3.7 1496 1975 56.7 36.9 6.3 1477 1976 42.0 51.9 6.1 1493 1978 59.4 35.5 5.1 1523 1980 48.8 46.8 4.5 1459 1983 57.4 38.5 4.1 1586 1984 52.2 44.1 3.7 1466 1986 56.3 38.4 5.2 1458 1987 47.6 47.8 4.6 1456 1988 49.6 46.1 4.3 987 1989 50.9 44.2 4.9 1014 1990 51.6 43.0 5.5 884 1991 49.3 44.5 6.2 1012 1993 52.2 41.9 5.6 1052 1994 46.9 46.6 6.4 1977
20

Table 4 (continued)
Year Fair Not Fair DK/Other N
1972 59.0 35.2 5.8 1590 1973 57.5 37.6 4.9 1496 1975 61.7 31.3 7.0 1474 1976 59.4 36.6 4.0 1490 1978 64.2 30.4 5.3 1516 1980 61.5 34.2 4.3 1454 1983 58.9 35.8 5.2 1584 1984 63.0 34.1 2.9 1468 1986 63.0 33.3 3.7 1456 1987 58.7 37.6 3.7 1446 1988 60.6 33.7 5.7 985 1989 59.2 35.3 5.4 1016 1990 58.0 36.0 6.0 887 1991 57.1 37.5 5.4 1009 1993 55.8 37.3 7.0 1055 1994 53.5 39.6 6.8 1969
B. Adjusted
Trust1 Trust2 Helpful1 Helpful2
1972 46.3 45.9 1973 46.8 46.7 1975 39.7 56.7 1976 44.0 42.0 1978 39.9 59.4 1980 44.3- 48.8 1983 36.5 57.4 1984 48.9 52.2 1986 37.7 56.3 1987 43.6 47.6 1988 44.2 34.7 44.5 54.7 1989 47.8 34.2 48.8 53.1 1990 42.0 35.1 47.6 55.2 1991 43.5 34.6 46.0 52.4 1993 38.4 32.3 48.7 56.3 1994 36.6 32.0 39.8 54.5
Trust1 is preceded by an item on whether ones life is exciting and a ranking of five work values in all years and then by an item on getting ahead in life and two sexual morality questions in 1976-1994. Trust2 is preceded by three or four crime attitude items and then in 1978 to 1994 by items on political ideology, equalizing wealth, divorce laws, and legalizing marijuana.
21

Table 4 (continued)
Helpful1 is preceded by three items on personal finances and a measure of subjective social class. Three anomia items come next in 1973 and 1976 and two batteries on the use of violence in 1980-1994. In 1976 the hit items come immediately before the anomia items. Helpful2 is preceded by media· use items: viewing TV and reading newspaper in 1975 and 1986 to 1994 and radio listening, viewing TV, and reading the newspaper in 1978 and 1983. From 1978 to 1994 these are preceded by items of smoking, drinking, and socializing.
22
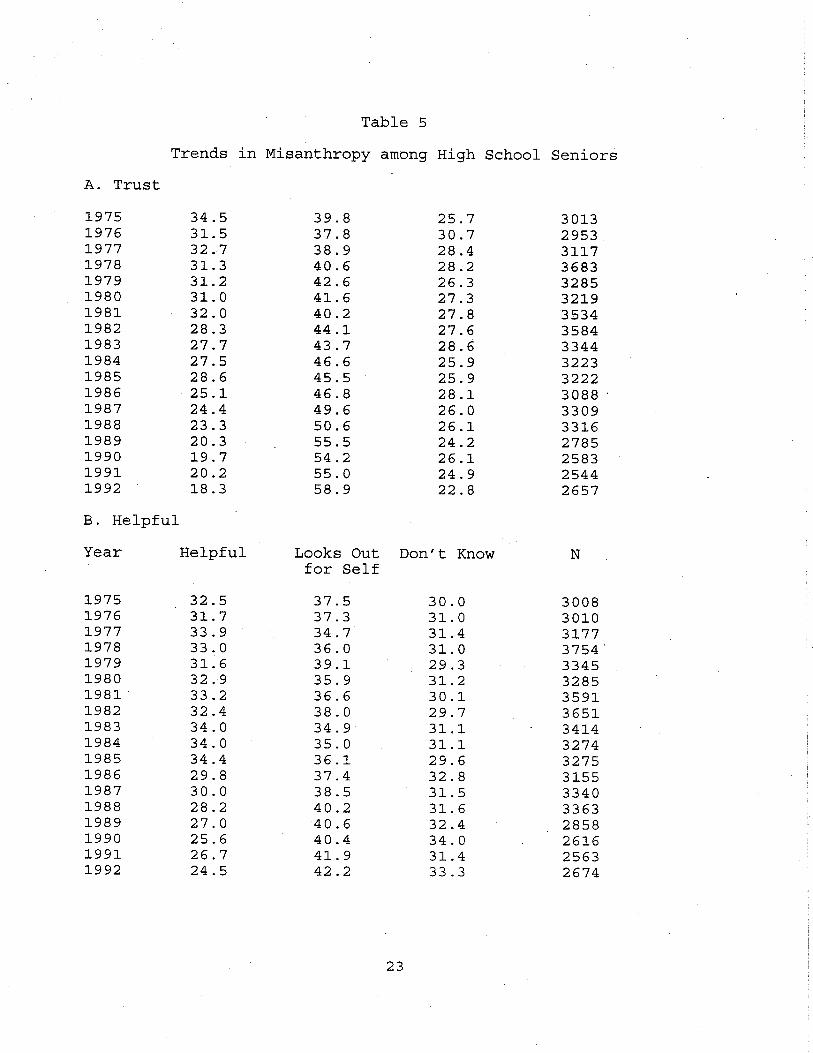
Table 5
Trends in Misanthropy among High School Seniors
A. Trust
1975 34.5 39.8 25.7 3013 1976 31.5 37.8 30.7 2953 1977 32.7 38.9 28.4 3117 1978 31.3 40.6 28.2 3683 1979 31.2 42.6 26.3 3285 1980 31.0 41.6 27.3 3219 1981 32.0 40.2 27.8 3534 1982 28.3 44.1 27.6 3584 1983 27.7 43.7 28.6 3344 1984 27.5 46.6 25.9 3223 1985 28.6 45.5 25.9 3222 1986 25.1 46.8 28.1 3088 . 1987 24.4 49.6 26.0 3309 1988 23.3 50.6 26.1 3316 1989 20.3 55.5 24.2 2785 1990 19.7 54.2 26.1 2583 1991 20.2 55.0 24.9 2544 1992 18.3 58.9 22.8 2657
B. Helpful
Year Helpful Looks Out Don't Know N for Self
1975 32.5 37.5 30.0 3008 1976 31.7 37.3 31.0 3010 1977 33.9 34.7 31.4 3177 1978 33.0 36.0 31.0 3754' 1979 31.6 39.1 29.3 3345 1980 32.9 35.9 31.2 3285 1981 33.2 36.6 30.1 3591 1982 32.4 38.0 29.7 3651 1983 34.0 34.9 31.1 3414 1984 34.0 35.0 31.1 3274 1985 34.4 36.1 29.6 3275 1986 29.8 37.4 32.8 3155 1987 30.0 38.5 31.5 3340 1988 28.2 40.2 31.6 3363 1989 27.0 40.6 32.4 2858 1990 25.6 40.4 34.0 2616 1991 26.7 41.9 31.4 2563 1992 24.5 42.2 33.3 2674
23
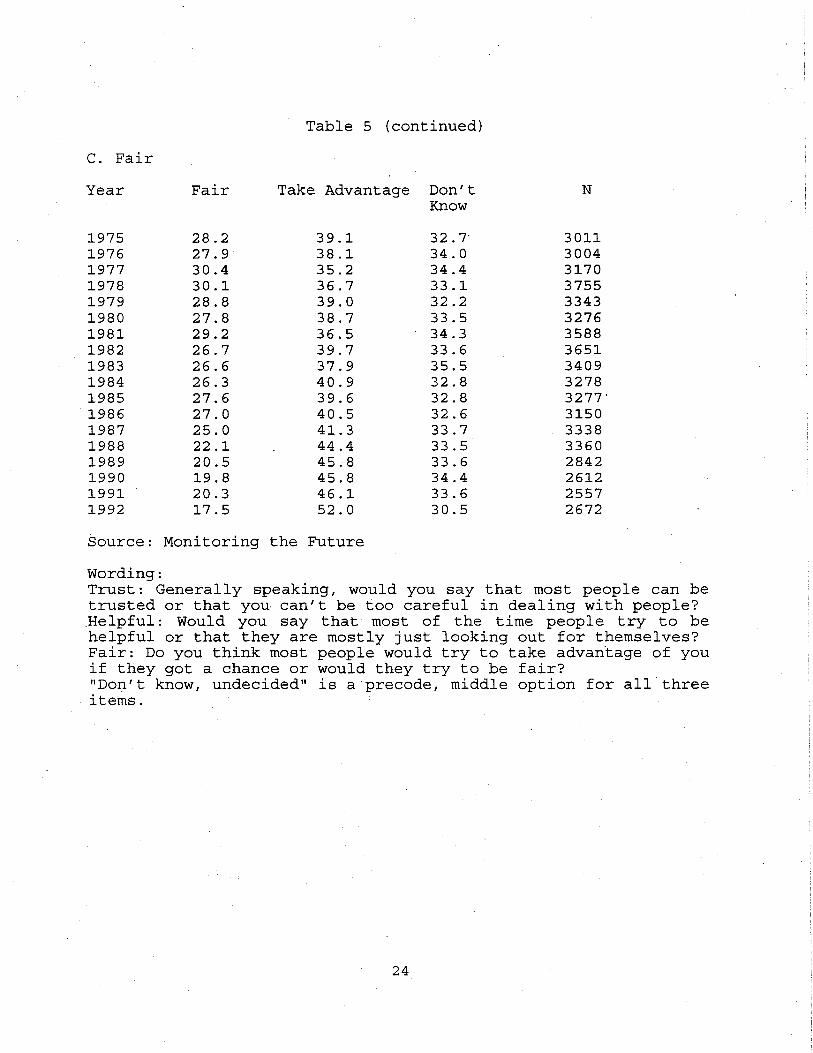
Table 5 (continued)
c. Fair
Year Fair Take Advantage Don't N Know
1975 28.2 39.1 32. 7' 3011 1976 27.9 38.1 34.0 3004 1977 30.4 35.2 34.4 3170 1978 30.1 36.7 33.1 3755 1979 28.8 39.0 32.2 3343 1980 27.8 38.7 33.5 3276 1981 29.2 36.5 34.3 3588 1982 26.7 39.7 33.6 3651 1983 26.6 37.9 35.5 3409 1984 26.3 40.9 32.8 3278 1985 27.6 39.6 32.8 3277' 1986 27.0 40.5 32.6 3150 1987 25.0 41.3 33.7 3338 1988 22.1 44.4 33.5 3360 1989 20.5 45.8 33.6 2842 1990 19.8 45.8 34.4 2612 1991 20.3 46.1 33.6 2557 1992 17.5 52.0 30.5 2672
Source: Monitoring the Future
Wording: Trust: Generally speaking, would you say that most people can be trusted or that you can't be too careful in dealing with people? Helpful: Would you $ay that most of the time people try to be helpful or that they are mostly just looking out for themselves? Fair: Do you think most people would try to take advan'tage of you if they got a chance or would they try to be fair? "Don't know, undecided" is a precode, middle option for all.three items.
24

Table 6
Models of Trendsa
Time Model Per Annum rz
A. TRUST
1948-83 NCNL (+.0007) .03 1960-78 SLT -. 0041 ;1..0
1964-95 SLC -.0041 .59 1964-92(NES) SLC -.0031 .54 1971-78{QOL) c (-.0009) 1.0 ·1981- 90 (Gal.) SLC +.0048 .57 1991-95(PSRA) c (+.0025) 1.0
1972-94(GSS) SLC -.0039 .40 1973-94(GSS) SLC -.0028 .33 1975-94(GSS) SLC -.0041 .89
1975-92(MTF) SLC -.0092 .93
B. HELPFUL
1964-95 NCNL (-.0013) .19 1964-92(NES) SLC +.0019 .11 1971-78(QOL) SLT +. 00.44 1.0 1991-95(PSRA) SLT +.0015 1.0
1973-94(GSS) NCNL (-.0002) .00 1975-94(GSS) c (-.0023) .45
1975-92(MTF) SLC -.0046 .60
c. FAIR
1964-95 SLC -.0052 .66 1964-76(NES) SLC -.0082 .78 1971-78(QOL) c (+.0016) 1.0
1972-94(GSS) SLC -.0019 .21
1975-92(MTF) SLC -.0066 .79
Sources: Data from Tables 2-6
aTo categorize each trends a series of models are fitted to the data points. First, the constant model is tried that assumes that all data points are random variations around a stable level. An estimate of the pooled or average level is made and a test is made
25
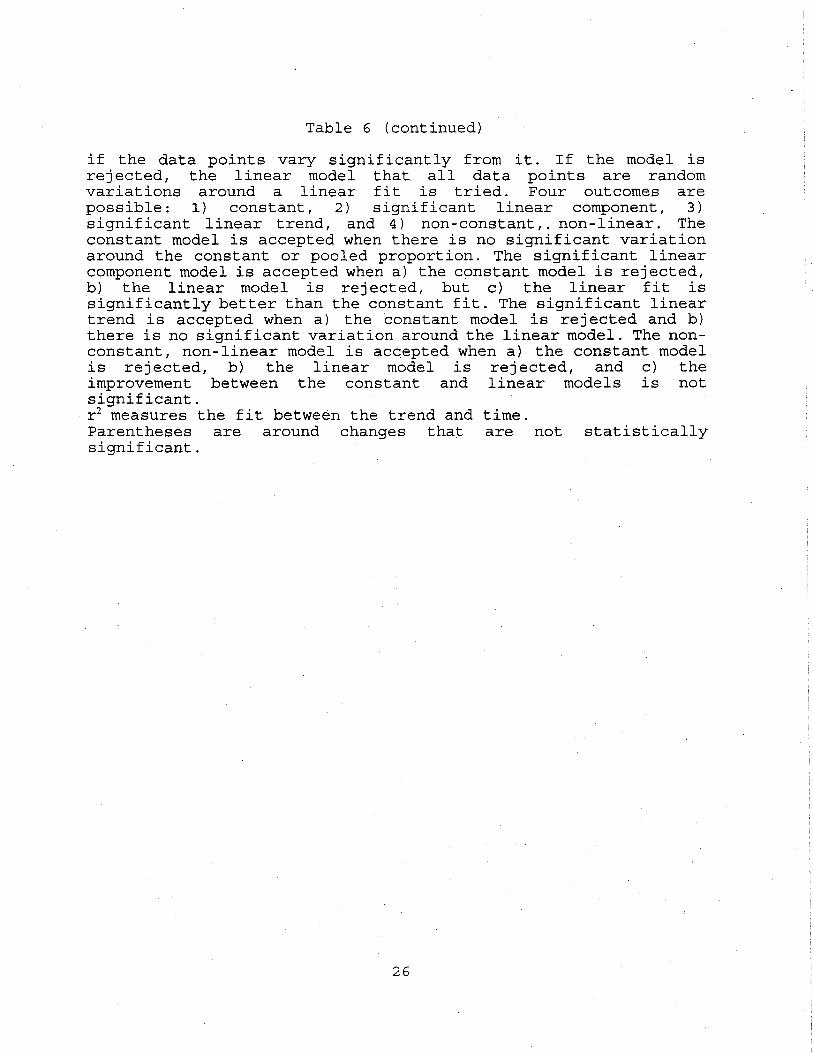
Table 6 (continued)
if the data points vary significantly from it. If the model is rejected, the linear model that all data points are random variations around a linear fit is tried. Four outcomes are possible: 1) constant, 2) significant linear component, 3) significant linear trend, and 4) non-constant,. non-linear. The constant model is accepted when there is no significant variation around the constant or pooled proportion. The significant linear component model is accepted when a) the constant model is rejected, b) the linear model is rejected, but c) the linear fit is significantly better than the constant fit. The significant linear trend is accepted when a) the constant model is rejected and b) there is no significant variation around the linear model. The nonconstant, non-linear model is accepted when a) the constant model is rejected, b) the linear model is rejected, and c) the improvement between the constant and linear models is not significant. r 2 measures the fit between the trend and time. Parentheses are around changes that are not statistically significant.
26

Table 7
Trends in GSS Misanthropy Scale
Mean N
1972 5.81 1559 1973 5.87 1485 1975 5.65 1455 1976 5.95 1484 1978 5.57 1510 1980 5.78 1442 1983 5.88 789 1984 5.63 1454 1986 5.74 1444 1987 5.87 1433 1988 5.87 976 1989 5.83 1007 1990 5.88 879 1991 5.91 1001 1993 5.96 1043 1994 6.12 1953
27

Table 8
Bivariate Correlates of Misanthropy
A. Socio-Economic Status r/prob. Fit' Most Misanthropic
Category
Household income -.191/.000 LC Less than $10,000 ( 19823) (REALINC)
Education (EDUC) -.233/.000 LC LT High Schoolb (20871)
B. Social Mobility
Inter-generational' -.060/.000 L Downwardly Mobile (19906) Recent Financial .114/.000 L Got Worse (20766)
Changes (FINALTER)
c. Life Events
Robbed/Burglarizecf .100/.000 L 2 Victimizations ( 9927) Hit/Threatened' .137/.000 LC 2 Occurrences ( 15737) Hospitalized/Dis-
abled (HOSDIS5)1 .058/.000 L 2 Occurrences ( 13307)
Health (HEALTH) .144/.000 LC Poor Health ( 13720) No job (UNEMPS)' .144/.000 L 2 Occurrences (13383) Family Deaths
(DEATHS)h -.056/.000 LC None (13370)
Traumas in Last Year .088/.000 L 4 Occurrences (12892) (TRAUMA1)
Traumas Last 5 Years .082/.000 LC 4 Occurrences (12892) (TRAUMAS)
D. Family Status/Divorce
Marital Status; .110/.000 s Separated (20912) Parents Divorced -.102/.000 L Parents Djvorced (20903) Ever Divorced; .079/.000 L Been Divorced (20913) Recent Divorce
(DIVORCE5)1 .059/.000 LC 2 Divorces ( 13208)
-E. Conmunity Typem -.090/.000 LC Big Cen. Cities (20913)
F. Minorities
Race (RACE)" -.225/.000 L Black (20913) Jewish (RELIG)' .025/.000 L Non-Jewish (20862) Contacts (Blacks Only)
Same Neighborhood .067/.014 L Segregated 1633) (RACLIVE)
Same Church .081/.003 L Segregated 1483) (RACCHURH)
Dinner Guest .082/.029 L No Non-Black 869) (RACHOME) Guests
Segregated' .128/.000 L No Non-Black 749) Contact
Inmigrant Status' .028/.000 LC Inmigrants (13974)
G. Religion
Has Religion .032/.000 L None (20862) (RELIG)'
Attends Church -.101/.000 LC Never (20756) (ATTEND)
Theology (FUND) -.139/.000 LC Fundamentalist (20315)
28

Table 8 (continued)
Most Misanthropic r/prob. Fit Category
H. Age CAGE) -.130/.000 LC Younger Adults (20855)
I. Gender (SEX) -.031/.000 L Men (20913)
J. Geographic Location
Region (REGION) .125/.000 s South (20913) Mobility CMOBILE16) -.069/.000 LC Same City (20624)
K. Work Situation
Supervision' -.093/.000 L Bottom ( 6979)
L. Other
Group membership -.182/.000 LC No Meni>erships (14889) CMEMNUM)
Drinking' -.026/.000 LC Drinks to Excess (13362) General Happiness .182/.000 LC Not too Happy (20765)
(HAPPY) Marital Happiness .095/.000 LC Not .too Happy (12618)
CHAPMAR)'
'One way analysis of variance. L=l inear - a .statistically significant difference between groups and no statistically significant deviation from linearity. Note that all dichotomies that statistically differ are necessarily linear. LC=linear component - a statistically significant linear component and a statistically significant deviation from linearity. S=a statistically significant difference between groups, but a nominal variable for which the linearity test is not appropriate. bEDUC was used for the Pearson's r and DEGREE for the breakdown. 'Respondent's occupational prestige minus father's occupational prestige. dRobbed CROBBRY) and/or burglarized (BURGLR) in the last year. 'Hit (HIT) or shot at/threatened with a gun (GUN) as an adult. 1Times hospftalized/disabled during last five years. 'Times unemployed during last five years. bRecoded into O, 1, 2+ deaths of relatives during last five years. ;For the Pearson's r marital status (MARITAL)·was receded married vs. never married .
. ;Coded as family intact=1, not intact, but not divorced=2; and'not intact because of divorce=3 (FAMILY16 and FAMDIF16) 'Either currently or ever divorced (MARITAL and DIVORCE) 1Recoded no divorce in last five years, one divorce, two divorces. mcombination of SRCBELT and XNORCSIZ 1=exurbia, 2=small town, suburbs, etc., 3=central cities, 4=top 12 central cities. 'Recede Black vs. not Black 'Receded Jewish vs. not Jewish. 'Scale of RACLIVE, RACCHURH, and RACEHOME ranging from 0 contacts to 3 contacts. 'Scale of immigrant generation (BORN, PARBORN, and GRANBORN) ranging from 0 (first generation - born outside country) to 3 (all four grandparents born in country) 'Receded has region vs. no religion. 'Supervision over others - supervision by others. 2=supervises those who supervise others and no one supervises respondent to -2=supervises no one is supervised by someone who is supervised by someone else (WKSUP WKSUPS WKSUB WKSUBS) Uoesn't drink=1, drinks, but not to excess=2, sometimes drinks to excess=3 (DRINK and DRUNK) ~ords in capitals are GSS mnemonics (Davis and Smith, 1994).
29

Table 9
Ethno-Racial Differences in Misanthropy
A. Ethno-Racial Groups
Blacks Late Inmigrants Hispanics Amerindians Middle Inmigrants Asians
Beta
.308
.142
.125
.086
.069
.035
.078
(21243)
Prob.
.000
.000
.000
.000
.000
.000
Early Inmigrants=from Scandinavia and Great Britain (omitted category) Middle Inmigrants=France, French Canada, Belgium, Ireland, Germany, Austria, Holland Late Inmigrants=from Eastern and Southern Europe, Jewish, Misc. Hispanics=from Spanish-speaking country on ETHNIC Amerindians=American Indian on ETHNIC Asians=from Asian country on ETHNIC Blacks=Black on RACE
B. Race (Black/Non-Black)
Beta· Prob.
Race .237 .000
.056
(21243)
Race=Non-Black=O vs. Black=1 on RACE
30

Variables (top category)
Household Income (high) Education (more years) Inter-generational Mobility (up) Recent Financial Changes (down) Marital Status (never married) Parents Divorced (divorced) Ever Divorced (been divorced) Community Type (big cities) Race/Ethni city'
Black Hispanic Asian Amerindian Late lnmigrants Middle lnmigrants
Has Religion (no religion) Attends Church (weekly+) Theology (liberal) Age Colder) Gender (female) Region (South) Mobility (changed states)
Robber/Burglarized (both) Hit/Threatened (both) Hospitalized/Disabled (both) Health Status (poor) Unemployment (2+ times) Family Deaths (2+) lnmigrants (4+ generation)
r2
N
Table 10
Multiple Regression Models of Misanthropy
(Standardized Coefficient/Prob.)
Model1 Model2 Model3
-.052/.000 -.049/.001 -.046/.001 -.197/.000 -.168/.000 -.170/.000 -.013/.080 -.018/.190 -.015/.242
.072/.000 .050/.000 .051/.000
.013/.098 -.005/.738 -.009/.545 -.020/.004 -.018/.168 - .021! .096
.038/.000 .001! .928 -.001! .940
.032/.000 .016/.239 .021/.110
.193/.000 .195/.000 .190/.000
.076/.000 .064/.000 .074/.000
.026/.000 .003/.820 .008/.501
.038/.000 .037/.008 .037/.006
.089/.000 .071/.000 .080/.000
.044/.000 .023/.179 .025/.131
.025/.001 .005/.727 -.001!.950 -.078/.000 -.079/.000 -.079/.000 -.060/.000 -.039/.009 -.041/.005 -.163/.000 -.189/.000 -.189/.000 -.040/.000 -.016/.232 -.014/.272 .068/.000 .078/.000 .076/.000
-.014/.050 -.018/.177 .014/.254
.033/.011 .081/.000
.080/.000 .041/.001
.003/.832 -.003/.796
.090/.000 .087/.000
.011/.436 .011/.398 -.022/.097 -.022/.097 -.029/.049
.172 .190 .191
18,138 5,124 5,444
'Early arriving ethnicities are the omitted category. See Table 9.
31

A. Non-Blacks
Variables
Household Income Education Inter-generational Mobility Recent Financial Changes Marital Status Parents Divorced Ever Divorced Conmuni ty Type Race/Ethnicity Hispanic Asian Amerindian Late Immigrants Middle Immigrants
Has Religion Attends Church Theology Age Gender Region Mobility
Robber/Burglarized Hit/Threatened Hospitalized/Disabled Health Status Unemployment Family Deaths
Segregated
N
Table 11
Multiple Regression Models for Misanthropy by Race
(Standardized Coefficient/Prob.)
Model1
-.050/.000 -.207/.000 -.014/.075
.075/.000
.008/.368 -.023/.002
.043/.000
.035/.000
.078/.000
.028/.000
.037/.000
.090/.000
.045/.000
.024/.004 -.082/.000 -.062/.000 -.170/.000 -.045/.000
.073/.000 -.015/.056
.136
16,118
Model2
-.059/.000 -.195/.000 -.032/.016
.062/.000 -.029/.184 -.020/.131
.028/.039
.029/.024
.075/.000
.010/.428
.046/.001
.092/.000
.027/.104
.005/.737 -.084/.000 -.050/.001 -.202/.000 -.042/.001
.072/.000 -.012/.381
-.011/.418
• 138
5,384
32
Model3
-.050/.002 -.181/.000 -.019/.194
.056/.000 -.013/.407 -.011/.418
.007/.652
.023/.104
.069/.000
.008/.542
.032/.031
.077/.000
.026/.155 -.009/.562 -.082/.000 -.036/.021 -.196/.000 -.016/.288 .082/.000
-.010/.487
.035/.012
.086/.000 -.004/.775
.096/.000
.013/.389 -.027/.061
-.004/.760
. 153
4,320

Table 11 (continued)
B. Blacks
Variables Model1 Model2 Model3
Household Income -.063/.013 -.048/.280 -.044/.375 Education -.143/.000 -.168/.000 -.148/.003 Inter-generational Mobility -.000/.985 -.003/.948 -.012/.785 Recent Financial Changes .069/.003 .000/.996 -.019/.651 Marital Status .061/.028 .068/.185 -.088/.109 Parents Divorced .005/.822 -.078/.043 -.062/.134 Ever Divorced .006/.814 .043/.323 .007/.889 Conmuni ty Type -.019/.430 -.003/.948 -.037/.426 Has Religion -.063/.013 .047/.301 .045/.359 Attends Church -.059/.020 -.068/.113 -.043/.352 Theology -.023/.386 -.004/.938 .013/.794 Age -.116/.000 -.125/.015 -.130/.030 Gender -.030/.187 -.012/.755 -.005/.915 Region .012/.649 .015/.756 -.008/.870 Mobility -.008/.740 -.029/.477 -.029/.499
Robber/Burglarized .056/.183 Hit/Threatened .086/.058 Hospitalized/Disabled .056/.226 Health Status .003/.955 Unemployment .010/.830 Family Deaths .023/.602
Segregated .103/.014 .105/.018
r2 .052 .053 .055
N 1,999 667 588
33


References
Bahr, Howard M. and Mart in, Thomas K. , " 'And Thy Neighbor as Thyself': Self-Esteem and Faith in People as Correlates of Religiosity and Family Solidarity among Middletown High School Students," Journal for the Scientific Study of Religion, 22 (1983) 1 132-144.
Barber, Bernard, The Logic and Limits of Trust. New Brunswick, NJ: Rutgers University Press, 1983.
Biafora, Frank A.; Taylor, Dorthy L.; Warheit, George J.; Zimmerman, RickS.; and Vega, William A., "Cultural Mistrust and Racial .Awareness Among Ethically Diverse Black ~dolescent Boys," Journal of Black Psychology, 19 (August, 1993), 266-281.
Bobo, Lawrence and Gilliam, Franklin D. , Jr., "Race, Sociopolitical Participation, and Black Empowerment," American Political Science Review, 84 (June, 1990), 377-393.
Brehm, John and Rahn, Wendy, "An Audit of the Deficit in Social Capital," Unpublished report, July, 1995.
Calhoun, Lawrence G. and Cann, Arnie, "Differences in Assumptions about a Just World: Ethnicity and Point of View," Journal of Social Psychology, 134 (1994), 765-770.
Campbell, Bruce A., "The Interaction of Race and Socioeconomic Status in the Development of Political Attitudes," Social Science Quarterly, 60 (1980), 651-658.
Davis, James A., "Patterns of Attitudes Change in the USA: 1972-1994," Paper presented to the Conference on "A Decade of Change in Social Attitudes," London, November, 1995.
Davis, James A. and Smith, Tom W., General Social Surveys, 1972-1994: Cumulative Codebook. Chicago: NORC, 1994.
DeMaris, A. and Yang, R., "Race, Alienation, and Interpersonal Mistrust," Sociological Spectrum, 14 (1994), 327-349
Easterlin, Richard A. and Crimmins, Eillen M., "Private Materialism, Personal Self-fulfillment, Family Life, and Public Interest: The Nature, Effects, and Causes of Recent Changes in the Values of American Youth, " Public Opinion Quarterly, 55 (Winter, 1991), 499-533.
Ellison, Christopher G., "An Eye for an Eye: A note of the Southern Subculture of Violence Thesis," Social Forces, 69 (June, 1991) 1 1223-1239.
34

Elshtain, Jean Bethke, "Marriage in Civil Society," Family Affairs, 7 (Spring, 1996), 1-5.
Fukuyama, Francis, Trust: The Social Virtues and the Creation of Prosperity. New York: The Free Press, 1995.
Grabb, Edward G., "Social Class, Authoritarianism, and Racial Contact: Recent Trends, " Sociology and Social Research, 64 (1980) 1 208-220 •
Hanson, David J., "Misanthropy and Candidate Preference in the 1988 Presidential Election," Psychology, 26 (1989), 56.
Hoge, Dean R. and Hoge, Jann L., "The Return of the Fifties? Values ·Trends at the University of Michigan," Sociological Quarterly, 33 (Winter, 1992), 611-624.
Hong, Peter V., "Bowling Alley Tour Refut·es Theory of Social Decline," Los Angeles Times, March 18, 1996.
House, James S. and Wolf, Sharon, "Effects of Urban Residence on Interpersonal Trust and Helping Behavior," Journal of Personality and Social Psychology, 36 (1978), 1029-1043.
Howell, Susan E. and Fagan, Deborah, "Race and Trust in Government: Testing the Political Reality Model," Public Opinion Quarterly, 52 (1988), 343-350.
Huang, Chien Ju Reassessing presented Cincinnati,
and Anderson, James G. , "Anomie and Deviancy: Racial and Social Status Differences, " Paper
to the American Sociological Association, August, 1991.
Jeanquart-Barone, Sandy, "Trust Differences between Supervisors and Subordinates: Examining the Roles of Race and Gender," Sex Roles, 29 (July, 1993), 1-11.
Kuran, Timur, "Race and Social Mistrust," Current, No. 358 (December, 1993), 4.
Ladd, Everett C., "The Data Just Don't Show Erosion of America's 'Social Capital'," The Public Perspective, 7 (June/July, 1996), 1, 5-22.
Lagace, Rosemary R. and Gassenheimer, Jule B. , "A Measure of Global Trust and Suspicion: Replication," Psychological Reports, 65 (1989) 1 473-474 •
Lagace, Rosemary R. and Rhoads, Gary K., "Evaluation of the MacDonald, Kessel, and Fuller Self-Report Trust Scale," Psychological Reports, 63 (1988), 961-962.
35
Lewis, J. David and Weigert, Andrew J., "Social Atomism, Holism, and Trust," Sociological Quarterly, 26 (Winter, 1985a), 455-472.
Lewis, J. Davis and Weigert, Andrew J., "Trust as a Social Reality," Social Forces, 63 (June, 1985b), 967-985.
Lipse~, Seymour and Schneider, William, The Confidence Gap. New York: The Free Press, 1983.
Luhmann, Niklas, Trust and Power. New York: John Wiley & Sons, 1979.
Norris, Fran H. and Kaniasty, Krzystof, "The Psychological Experience of Crime: A Test of.the Mediating Role of Beliefs in Explaining the Distress of Victims," Journal of Social and Clinical Psychology, 10 (1991), 239-261.
Ostheimer, John M., "Identification with Africa among Black Americans, " Paper presented to the African Studies Association, November, 1985.
Powers, Daniel A. and Ellison, Christopher G., "Interracial Contact and Black Racial Attitudes: The Contact Hypothesis and Selectivity Bias," Social Forces, 74 (1995), 205-226.
Putnam, Robert D. , "Bowling Alone: America's Declining Social Capital," Journal of Democracy, 6 (1995a), 65-78.
Putnam, Robert Community,
D. , "Bowling Alone, (1995b)' 18-33.
Revisited," The Responsive
Putnam, Robert D., "How to Revitalize Democracy in America?" People, September 25, 1995c, 125.
Putnam, Robert D., "Tuning In, Tuning Out: The Strange Disappearance of Social Capital in America," PS, 28 (1995d), 664-683.
Putnam, Robert D. , "Why We're on Our Worst Behavior, " Chicago Tribune, January 10, 1996.
Robinson, John P.; Shaver, Phillip R.; and Wrightsman, Lawrence S., Measures of Personality and Social Psychological Attitudes. New York: Academic Press, 1991.
Rosenberg, Morris, "Misanthropy and Political Ideology," American Sociological Review, 21 (December, 1956), 690-695.
Samuelson, Robert, "Harvard Scholar Misses the Point of 'Real Life'," Chicago Tribune, April 12, 1996.
36

Sigelman, Lee and Welch, Susan, "The Contact Hypothesis Revisited: Black-White Interaction and Positive Racial Attitudes," Social Forces, 71 (March, 1993), 781-795.
Schoenfeld, Eugen, "Image of Man: The Effect of Religion on Trust, " Review of Religious Research, 20 (Fall, 1978), 61-67.
Smith, A. Wade, "Social Class and Racial Cleavages on Major Social Indicators, " in Research in Race and Ethnic Relations, 4 (1985) 1 33-65 ..
Smith, David Lewis, "The Aftermath of . Victimization: Fear and Suspicion," in Victims and Society, edited by Emilio C. Viano. Washington, DC: Visage Press, 1976.
Smith, Tom W., Anti-Semitism in Contemporary America. New York: American Jewish Committee, 1994.
Smith, Tom W., "Can We Have Confidence in Confidence? Revisited," in The Measurement of Subjective Phenomena, Denis D. Johnston (ed.), Washington, DC: GPO, 1981.
Smith, Tom W., "Context Effects in the General Social Survey," in Measurement Errors in Surveys, edited by Paul E. Biemer, et al. New York: John Wiley & Sons, 1991a
Smith, Tom W., "An Experimental Comparison of Clustered and Scattered Scale Items," Social Psychology Quarterly, 46 (June, 1983) 1 163-168.
Smith, Tom W., "Is There Real Opinion Change?" International Journal of Public Opinion Research, 6 (1994), 187-203.
Smith, Tom W., "A Life Events Approach to Developing an Index of Societal Well-Being," Social Science Review, 21 (1992), 353-379.
Smith, Tom W., "Thoughts on the Nature of Context Effects," in Context Effects in Social and Psychological Research, edited by Norbert Schwarz and Seymour Sudman. New York: Springer Verlag, 1991b.
Smith, Tom W., "Timely Artifacts: A Review of Measurement Variation in the 1972-1989 GSS," GSS Methodological Report No. 56. Chicago: NORC, 1990.
Southworth, Suzanne and Schwarz, J. Conrad, "Post-Divorce Contact, Relationship with Father, and Heterosexual Trust in Female College Students, " American Journal of Orthopsychiatry, 57 (1987) 1 371-382 •
Stengel, Richard, "Bowling Together: Civic Engagement in America
37

Isn't Disappearing But Reinventing Itself," Time, July 22, 1996, p. 35-36.
Taylor, Dorothy L. ; Biafora, Frank A. ; and Warhei t, George J. , "Racial Mistrust and Disposition to Deviance among African American, Haitian, and Other Caribbean Island Adolescent Boys," Law and Human Behavior, 18 (June, 1994), 291-303.
Terrell, Francis and Barrett, Ronald K., "Interpersonal Trust among College Students as a Function of Race, Sex, and Socioeconomic Class," Perceptual and Motor Skills, 48 (June, 1979), 1194.
Thomas, Melvin E. and Hughes, Michael, "The Continuing Significance of Race: A Study of Race, Class, and Quality of Life in America: 1972-1985," American Sociological Review, 51 (December, 1986), 830-841.
Uslaner, Eric M., The Decline of Comitv in Congress. ·Ann Arbor: University of Michigan Press, 1993.
Uslaner, Eric M., "Faith, Hope, and Charity: Social Capital, Trust, and Collective Action," Paper presented to the American Political Science Association, Chicago, September, 1995.
Wilson, Thomas C., "Urbanism, Misanthropy, and Subcultural Processes," Social Science Journal, 22 (July, 1985), 90-101.
Wright, Robert, "The Evolution of Despair," Time, August 28, 1995, 50-57.
Yamagishi, Toshio, "Have Americans Really Become Distrustful?" Paper presented to the American Sociological Association, Washington, DC, August, 1995.
Yamagishi, Toshio and Yamagishi, Midori, "Trust and Commitment in the United States and Japan," Motivation and Emotio'n, 18 (1994) f 129-166.
Yoder, Jan D. and Nichols, Robert C., "A· Life Perspective Comparison of Married and Divorced Persons, " Journal of Marriage and the Family, 42 (May, 1980), 413-419.
38