Embed Size (px)
Citation preview

Proceedings of ASME 2017 International Mechanical Engineering Congress & ExpositionIMECE 2017
Nov 3–9, 2017, Tampa, FL, U.S.A.
IMECE2017–70404
TOLERANCES AND UNCERTAINTY IN ROBOTIC SYSTEMS
F. Proctor, Marek Franaszek, and J. MichaloskiNational Institute of Standards
and TechnologyGaithersburg, Maryland
ABSTRACT
The ability to be programmed for a wide range of tasks iswhat differentiates robots from dedicated automation. Conse-quently, robots can be faced with often-changing requirementsand conditions. Conventional application development based onteach programming takes robots out of production and occupiespersonnel, limiting robots’ effectiveness in these environments.Off-line programming solves these problems, but robot inaccu-racy must be compensated by a combination of calibration, com-pliance, and sensing. This complicates up-front systems engi-neering and application development, but results in systems thatcan operate in a wider range of requirements and conditions. Per-formance can be optimized if application tolerances and processuncertainties are known. If they often change, optimization mustbe done dynamically. Automating this optimization is a goalof smart manufacturing. With its trend of increasing connec-tivity between the components of robotic systems both withinworkcells and to the enterprise, exchanging this information hasbecome more important. This includes tolerance informationfrom design through process planning to production and inspec-tion, and measurement uncertainty from sensors into operations.Standards such as ISO 10303 (STEP), the Quality InformationFramework (QIF), the Robot Operating System (ROS), and MT-Connect support this exchange to varying degrees. Examplesinclude the assignment of assembly tasks based on part toler-ances and robot capabilities; the automated generation of robotpaths with tolerances arising from sensed obstacles; and the op-timization of part placement to minimize the effects of positionuncertainty. This paper examines requirements for exchangingtolerance and uncertainty in robotics applications, identifies howthese requirements are being met by existing standards, and sug-
gests improvements to enable more automated information ex-change.
KeywordsUncertainty, tolerance, error, robot, computer aided process
planning
NomenclatureADC Analog to Digital ConversionCAD Computer-Aided DesignCAM Computer-Aided ManufacturingCAPP Computer Aided Process PlanningD-H Denavit–HartenbergDME Dimensional Measurement EquipmentDMSC Dimensional Metrology Standards ConsortiumDMIS Dimensional Measuring Interface StandardDoF Degrees of FreedomGD&T Geometric dimensioning and tolerancingHTM Homogeneous Transform MatrixHTTP Hypertext Transfer ProtocolISO International Organization for StandardizationMBD Model Based DesignPMI Product and Manufacturing InformationPOI Point of InterestQIF Quality Information FrameworkQMR Quality Measurement ResultsROS Robot Operating SystemSTEP STandard for the Exchange of Product model dataURDF Unified Robot Description Format

XML eXtensible Markup LanguageXSD XML Schema Definition
INTRODUCTIONIndustrial robots have had much success automating repet-
itive tasks in structured environments, where their ability to beprogrammed has enabled their proliferation into a wide varietyof applications such as part handling, spray painting, and weld-ing. The predominant method of teach programming is effectivebut time consuming, and is an impediment to applying robots forshort-turnaround jobs. Off-line programming solves this prob-lem, but relies on robot accuracy which is typically much worsethan that of machine tools, necessitating the use of sensors tocompensate for this inaccuracy. Sensors also enable robots tooperate in unstructured dynamic environments, and the contin-ued improvement and cost reductions in sensors, especially vi-sion, have now made it possible to deploy robots into previouslyhard-to-automate operations and for jobs with small lot sizes andshort lead times, and often-changing performance requirements.
These changing requirements and uncertain environmentsmake automated offline programming a necessity, but they alsoafford an opportunity to optimize manufacturing [1]. Effectivelyconveying information throughout the design, planning, and pro-duction phases is key to achieving this optimization. Until re-cently, this was a manual process, since product and manufactur-ing information resided in proprietary systems with no support instandards for preserving the semantic content throughout the ex-port and import steps. The situation has improved, with standardsin place for design, process planning, execution, and quality ac-tivities that make full semantic exchange possible. This paperwill examine the state of these information exchange standards,and identify needs for revisions that can improve the efficiencyand effectiveness of the exchange of tolerance and uncertaintyinformation through the manufacturing chain for robots.
USE CASE SCENARIOIn this section, a use case scenario will be presented to pro-
vide context for the following sections on information exchangeissues. At the outset, systems engineering is done to determinehow the overall manufacturing activities will be carried out in thefacility, given budgets, the equipment market, and staff capabili-ties. In this scenario, an assembly workcell has been establishedthat combines industrial robots, dexterous manipulators, auxil-iary equipment, and sensors, that together can achieve assem-bly performance to desired accuracy. This workstation includestwo robots, each with dexterous grasping abilities, vision systemthroughout to determine the actual locations of parts and obsta-cles, force sensing for insertion of close-fitting parts, and auxil-iary equipment for the staging and fixturing of parts as needed.
The process begins with a designer preparing a set of de-sign files for components of an assembly that fulfills customerrequirements for form, fit, and function. The design files spec-ify product and manufacturing information, including geomet-ric dimensions and tolerances. Using the design information, anassembly planner determines the order of operations needed tocomplete the full assembly, including any tooling requirementsor other resources necessary to carry out individual steps. Forcomplex assemblies, this may require the assignment of tasks todifferent resources, including people, depending on their capabil-ities. In this scenario, a process planner prepares a sequence ofjobs for fabricating the assembly components [2, 3]. Robot pro-gramming for the assembly tasks is done offline, with no teachprogramming. Computer-aided design (CAD) files for the as-sembly components are loaded into an assembly planning sys-tem, which generates the sequence of operations, possibly wellahead of the actual assembly event. Because of the potentialfor robot collisions, the exact sequence of robot motions will bedetermined during execution, using information from the robotcontrollers and sensors. This can be done using explicit syn-chronization elements in the individual robot programs, throughthe sequential execution of programs through a supervisory con-troller, or through a single controller that does real-time planningfor both robots as if they were a combined unit. In this scenario,a supervisory controller is used for high-level sequencing of pro-grams for each robot.
The components arrive in two sets: a base assembly struc-ture, in this case an engine block, and a kit of parts to be attachedto it. The engine block has a single feature with tight assemblytolerances, and must be located so that this feature is accessibleto the more accurate robot, and in its zone of highest accuracy.A prior inspection step has measured the actual location of thisfeature, and the CAD model has been updated. The block is af-fixed to a pallet that can be shuttled onto a rotary worktable viaa mobile cart and conveyor. Once on the rotary table, it can berotated to its most favorable orientation.
The parts kit is in an area accessible to both robots. The lo-cation of parts in the kit is not known a priori, so a vision systemis used to determine their identity and location to sufficient accu-racy. In general, parts may not be graspable in the orientation inwhich they are to be inserted, or in the order in which they mustbe assembled, so robot plans must be generated dynamically toreorient parts or clear out obstructing parts. In this scenario, ashared staging area is provided for these operations.
The location (six-degree-of-freedom (DoF) pose) of partsdetermined by the vision system will have some uncertainty, aswill the location of the robot as it grasps the part, resulting incompounded uncertainty in the part as it is presented to its as-sembly location. To overcome this, a visual localization step isconducted just prior to assembly, where the robot presents thegrasped part to a vision system that determines its actual loca-tion. The final robot path for assembly is adjusted by an offset to

the nominal pose.A nominal free space robot path is computed that includes
tolerances on position and orientation that ensure an envelope ofcollision-free motion. The tolerances give flexibility to the real-time path planner to optimize motion using machine-specific costfunctions, such as minimizing joint motion or energy consump-tion [4].
For assembly tasks with tight clearances, position control isnot sufficient, and force control must be done to ensure properfit. The inclusion of force control may reduce the need for highaccuracy, necessitating only moderate accuracy to bring the partinto the range where it can engage the assembly location withinthe region required to begin the force-controlled insertion.
The parts kit arrives first, and the vision system shows thatthe parts are present and accessible, but that several need to be re-oriented in order to be grasped properly for insertion. The super-visory controller generates a set of programs for the robots, con-sisting of a series of pick-and-place moves with path tolerancesthat ensure collision-free motion over their full duration, elim-inating the need to synchronize motion during execution. Therobots proceed to reorient the affected parts.
The engine block arrives and is shuttled into its nominallocation on the rotary table. The vision system determines itsactual pose, and the part is rotated so that the region of min-imum uncertainty contains the high-tolerance feature, and thislies within the robot’s region of maximum accuracy. This is thefirst assembly operation, and the robot acquires the part from thekit, takes it to the vision system to determine its actual graspedpose, and the offset insertion path is executed to bring the partinto contact for the final force-controlled insertion.
Assembly of the other components continues. In most cases,the robots can operate independently, with their paths envelopedin tolerances that ensure collision-free motion. In some cases,however, there is the potential for collision unless the motion issynchronized. In these cases, the programs are sequenced by thesupervisory controller, which suspends the activities of one robotwhile the other completes its task.
Once the assembly process is done, the completed assemblyis transferred to a final quality assurance step, where the locationof features and connections is verified according to the designrequirements.
In the following sections, this use case scenario will serveas a reference example to illustrate the applicability of standardsfor exchanging tolerance and uncertainty, and issues that couldbe addressed through revisions to these standards.
TOLERANCES IN DESIGNAs described in the use case scenario, the process begins
with a designer preparing a set of design files that define productgeometry including geometric dimensions and tolerances. Thesetolerances signify how much variation is acceptable for satisfac-
tory form, fit, and function. The assignment of optimal toler-ances that keep manufacturing costs low while still meeting re-quirements can be difficult, and in many cases, they are informedby practical experience of the manufacturer. Standard practice isto represent this information in geometric dimensioning and tol-erancing (GD&T) callouts, which could be interpreted visuallybut do not support automated querying, as shown in Figure 1.
FIGURE 1: A part with typical GD&T annotations
Standards for visually representing GD&T are ASMEY14.5-2008 [5] and ISO 1101:2012 [6]. These standards havebeen used for decades and cover a wide range of variations inproduct features, such as flatness, perpendicularity, location, cir-cularity, and straightness. It is important to distinguish betweenthe presentation of GD&T information, and the representation.Representation includes the information necessary to fully de-fine the meaning of the tolerances, without resorting to visualdepiction.
Standards for exchanging semantic information on nominalproduct information have been available for many years throughthe ISO 10303 ”STEP” family [7]. STEP is a methodology fordescribing product information throughout its life cycle. CADsystems exchange STEP information through their import andexport facilities, converting between native formats and STEP sothat partners in the supply chain can each use software that bestfits their needs. The advent of ISO 10303 Part 242 in 2014 stan-dardized an information model for the meaning of GD&T. Thisimprovement allows for the more full automation of informationexchange further downstream, into production and quality assur-ance. An example from this information model is depicted inFigure 2.
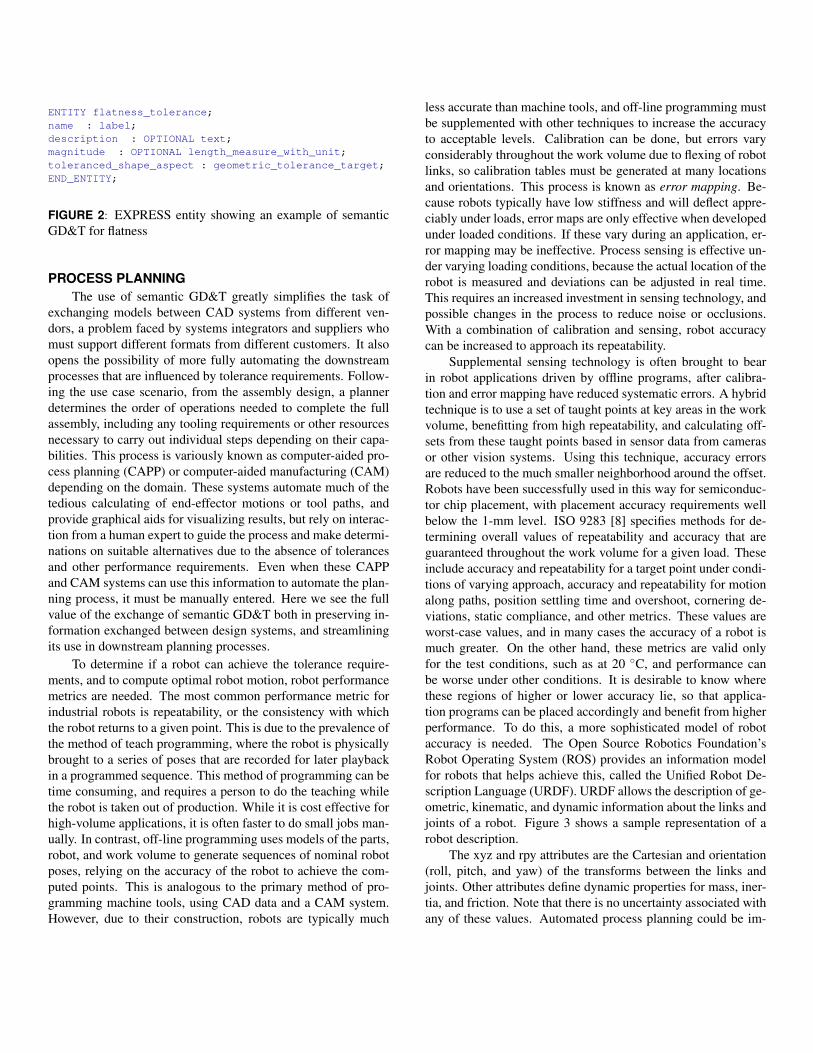
ENTITY flatness_tolerance;name : label;description : OPTIONAL text;magnitude : OPTIONAL length_measure_with_unit;toleranced_shape_aspect : geometric_tolerance_target;END_ENTITY;
FIGURE 2: EXPRESS entity showing an example of semanticGD&T for flatness
PROCESS PLANNINGThe use of semantic GD&T greatly simplifies the task of
exchanging models between CAD systems from different ven-dors, a problem faced by systems integrators and suppliers whomust support different formats from different customers. It alsoopens the possibility of more fully automating the downstreamprocesses that are influenced by tolerance requirements. Follow-ing the use case scenario, from the assembly design, a plannerdetermines the order of operations needed to complete the fullassembly, including any tooling requirements or other resourcesnecessary to carry out individual steps depending on their capa-bilities. This process is variously known as computer-aided pro-cess planning (CAPP) or computer-aided manufacturing (CAM)depending on the domain. These systems automate much of thetedious calculating of end-effector motions or tool paths, andprovide graphical aids for visualizing results, but rely on interac-tion from a human expert to guide the process and make determi-nations on suitable alternatives due to the absence of tolerancesand other performance requirements. Even when these CAPPand CAM systems can use this information to automate the plan-ning process, it must be manually entered. Here we see the fullvalue of the exchange of semantic GD&T both in preserving in-formation exchanged between design systems, and streamliningits use in downstream planning processes.
To determine if a robot can achieve the tolerance require-ments, and to compute optimal robot motion, robot performancemetrics are needed. The most common performance metric forindustrial robots is repeatability, or the consistency with whichthe robot returns to a given point. This is due to the prevalence ofthe method of teach programming, where the robot is physicallybrought to a series of poses that are recorded for later playbackin a programmed sequence. This method of programming can betime consuming, and requires a person to do the teaching whilethe robot is taken out of production. While it is cost effective forhigh-volume applications, it is often faster to do small jobs man-ually. In contrast, off-line programming uses models of the parts,robot, and work volume to generate sequences of nominal robotposes, relying on the accuracy of the robot to achieve the com-puted points. This is analogous to the primary method of pro-gramming machine tools, using CAD data and a CAM system.However, due to their construction, robots are typically much
less accurate than machine tools, and off-line programming mustbe supplemented with other techniques to increase the accuracyto acceptable levels. Calibration can be done, but errors varyconsiderably throughout the work volume due to flexing of robotlinks, so calibration tables must be generated at many locationsand orientations. This process is known as error mapping. Be-cause robots typically have low stiffness and will deflect appre-ciably under loads, error maps are only effective when developedunder loaded conditions. If these vary during an application, er-ror mapping may be ineffective. Process sensing is effective un-der varying loading conditions, because the actual location of therobot is measured and deviations can be adjusted in real time.This requires an increased investment in sensing technology, andpossible changes in the process to reduce noise or occlusions.With a combination of calibration and sensing, robot accuracycan be increased to approach its repeatability.
Supplemental sensing technology is often brought to bearin robot applications driven by offline programs, after calibra-tion and error mapping have reduced systematic errors. A hybridtechnique is to use a set of taught points at key areas in the workvolume, benefitting from high repeatability, and calculating off-sets from these taught points based in sensor data from camerasor other vision systems. Using this technique, accuracy errorsare reduced to the much smaller neighborhood around the offset.Robots have been successfully used in this way for semiconduc-tor chip placement, with placement accuracy requirements wellbelow the 1-mm level. ISO 9283 [8] specifies methods for de-termining overall values of repeatability and accuracy that areguaranteed throughout the work volume for a given load. Theseinclude accuracy and repeatability for a target point under condi-tions of varying approach, accuracy and repeatability for motionalong paths, position settling time and overshoot, cornering de-viations, static compliance, and other metrics. These values areworst-case values, and in many cases the accuracy of a robot ismuch greater. On the other hand, these metrics are valid onlyfor the test conditions, such as at 20 ◦C, and performance canbe worse under other conditions. It is desirable to know wherethese regions of higher or lower accuracy lie, so that applica-tion programs can be placed accordingly and benefit from higherperformance. To do this, a more sophisticated model of robotaccuracy is needed. The Open Source Robotics Foundation’sRobot Operating System (ROS) provides an information modelfor robots that helps achieve this, called the Unified Robot De-scription Language (URDF). URDF allows the description of ge-ometric, kinematic, and dynamic information about the links andjoints of a robot. Figure 3 shows a sample representation of arobot description.
The xyz and rpy attributes are the Cartesian and orientation(roll, pitch, and yaw) of the transforms between the links andjoints. Other attributes define dynamic properties for mass, iner-tia, and friction. Note that there is no uncertainty associated withany of these values. Automated process planning could be im-

<link name="link1"><inertial><origin xyz="0 0 0.5" rpy="0 0 0"/><mass value="1"/><inertia ixx="100" ixy="0" ixz="0"
iyy="100" iyz="0" izz="100"/></inertial>
<collision><origin xyz="0 0 0" rpy="0 0 0"/><geometry><cylinder radius="1" length="0.5"/>
</geometry></collision>
</link>
<joint name="joint1"><origin xyz="0 0 1" rpy="0 0 3.1416"/><parent link="link1"/><child link="link2"/><dynamics damping="0.0" friction="0.0"/><limit effort="30" velocity="1.0"
lower="-2.2" upper="0.7"/></joint>
FIGURE 3: Sample Unified Robot Description Format (URDF)showing how links and joints are represented
proved if this information were available when selecting robotsfor assembly tasks.
Run-time tolerances are supported by ROS in the form ofposes with covariance, where the pose representation is Carte-sian location and quaternion orientation. The tolerances (or un-certainty, depending on the context) are expressed using a co-variance matrix on the Cartesian location, and the roll, pitch, andyaw equivalents of the quaternion orientation. This covarianceapproach to orientation is not well suited for uncertainty analysis,a point described in detail in the section on the use of orientationuncertainty in assembly tasks.
Robot path tolerances are also available in ROS, using toler-ances on end points.
These tolerances apply to the joints values, not the Cartesianvalues, and so are dependent on the robot selected. ROS doesprovide various Cartesian motion planners, such as Descartes [9],but tolerance information is experimental. For example, orienta-tion tolerances using a cone about the tool’s directional axis havebeen used for insertion tasks.
QUALITY ASSURANCEThe Quality Information Framework (QIF) [10] is an ANSI
standard sponsored by the Dimensional Metrology StandardsConsortium (DMSC) that defines an integrated set of Extensi-ble Markup Language (XML) information models to enable the
FollowJointTrajectoryActionGoaltrajectory_msgs/JointTrajectoryPoint[] pointsfloat64[] positionsfloat64[] velocitiesfloat64[] accelerationsfloat64[] effortduration time_from_start
control_msgs/JointTolerance[] path_tolerancefloat64 positionfloat64 velocityfloat64 acceleration
control_msgs/JointTolerance[] goal_tolerancefloat64 positionfloat64 velocityfloat64 acceleration
duration goal_time_tolerance
FIGURE 4: Tolerances on paths and goals for robot trajectoriesin ROS
effective exchange of metrology data throughout the entire man-ufacturing quality measurement process from product definitionto inspection planning to execution to analysis and reporting.QIF handles feature-based dimensional metrology, quality mea-surement planning, first article inspection, and discrete qualitymeasurement. QIF is gaining attention as an important qualitytechnology [11–16].
QIF is based on XML, and uses terminology and semanticsfrom the inspection world to represent the various elements in theQIF specification. The QIF information models are containedin files written in the XML Schema Definitions (XSD). TheQIF XSD Version 2.0 models consists of six application schemafiles QIFRules, QIFResults, QIFPlans, QIFProduct, QIFStatis-tics, and QIFMeasurementResources bundled into a QIF Docu-ment. QIF also includes a library of XSD schema files containinginformation items used by all QIF applications (Auxiliary, Char-acteristics, Expressions, Features, GenericExpressions, Geome-try, IntermediatesPMI, Primitives, PrimitivesPD, PrimitivesPMI,Statistics, Topology, Traceability, Units, and Visualization).
The flow of QIF data starts with generation of CAD + PMIdata exported as QIF Model Based Design (MBD) applicationdata. Quality planning systems import the MBD and gener-ate Plans (whats), then import Resources and Rules informa-tion and export Plans (whats and hows). Programming systemsimport Plans to generate Dimensional Measurement Equipment(DME) specific programs, or general instructions to guide in-spection. Dimensional measurement equipment executes pro-grams and evaluates characteristics of a single manufactured partor assembly and exports the measurements as Results. Analy-sis systems, typically performing statistical process control, im-port single parts Results and generate analysis of multiple partbatches as QIF Statistics data.
The role of uncertainty in QIF would be to characterize the

FIGURE 5: QIF 2 Architecture
statistical distribution of the error. Underlying all measurementdata in QIF is the assumption that the QIF Dimensional Mea-surement Equipment is of order of magnitude ten times moreaccurate than the inspected feature. Thus, a feature characteristicof 1 mm would require a DME that measures to .1 mm accu-racy. This inspection rule-of-thumb allays many concerns, but isnot absolute. In fact, QIF has a separate section on detailing theenvironment and other inspection factors, (e.g., ambient temper-ature), that could contribute to quality inspection errors.
QIF provides for inspection measurements to have an at-tached uncertainty associated with the result. In QIF, the mea-surement actual values (e.g., the diameter of an instance of Cir-cleFeatureActualType) are elements that can have the optionalattributes “meanError” and “combinedUncertainty”. Those areattributes of the ActualDecimalType in Units.xsd shown below.Measurement data which correspond to actual value types in QIFare derived from ActualDecimalType.
<xs:complexType name="ActualDecimalType"><xs:annotation><xs:documentation>An ActualDecimalType defines a SpecifiedDecimalTypewith two additional optional attributes: meanErrorand combinedUncertainty. These attributes shouldeither both be used or both be omitted.</xs:documentation>
</xs:annotation><xs:simpleContent><xs:extension base="SpecifiedDecimalType"><xs:attribute name="combinedUncertainty"type="NonNegativeDecimalType"><xs:annotation><xs:documentation>The optional combinedUncertainty attributeis a value expressing the combineduncertainty assigned to theSpecifiedDecimalType.
</xs:documentation></xs:annotation>
</xs:attribute><xs:attribute name="meanError"type="NonNegativeDecimalType"><xs:annotation><xs:documentation>The optional meanError attribute is avalue expressing the mean errorassigned to the SpecifiedDecimalType.
</xs:documentation></xs:annotation>
</xs:attribute></xs:extension>
</xs:simpleContent></xs:complexType>
Determining the uncertainty for a QIF actual measurementis an optional reporting attribute often viewed as unnecessary.It would be preferable if the vendor of the inspection softwarecould have access to the numerous factors that play into deter-mining the uncertainty, for example, ambient temperature, lastcalibration, and the model of DME reported benchmarks. If thiswere the case, taking inspection measurements in an intemperate30 ◦C ambient temperature would result in a large uncertainty.
SENSOR UNCERTAINTYMTConnect is an integration standard to solve the “Island
of Automation” problem in the discrete manufacturing industry.MTConnect is an open, royalty-free standard that uses prevalentcommercial off-the-shelf technology - XML and HTTP. The MT-Connect intent is to foster greater interoperability between con-trols, devices, and software applications by publishing data overnetworks using the Internet Protocol [17]. Over the course of theMTConnect standards development, sensors have gone from animplicit modeling role within devices to an explicit informationmodel. This is especially important as sensors can provide real-time production information to better understand and optimizemanufacturing activities in a factory.
A sensor may measure in one dimension, such as tempera-ture or acceleration whose fluctuations are a function of time, ora sensor can be multidimensional, such as an image which can bea function of two or three-dimensional space and time. MTCon-nect Part 2 V1.2 [18] presents a sensor model that defines sen-sor data formats and communication interfaces. MTConnect in-cludes sensor information models for sensors of one dimension:acceleration, angular acceleration, angular velocity, amperage,angle, concentration, conductivity, direction, displacement, elec-trical energy, flow, frequency, fill level, linear force, load, mass,pH, pressure, position, power factor, resistance, rotary velocity,sound level, strain, temperature, time, tilt, torque, volt ampere,volt ampere reactive, velocity, viscosity, voltage, and wattage.At present, MTConnect only provides information models forone-dimensional sensor values.

In MTConnect, a sensor is comprised of two major com-ponents - a sensing element and a sensor interface. A sensingelement provides a signal or measured value. It is modeled asan MTConnect DataItem. Each sensor model includes a sensingelement, calibration, signal conditioning, and analog-to-digitalconversion (ADC) information [19]. A sensor interface has ca-pabilities, such as signal processing, conversion, and communi-cations, and it is modeled as an MTConnect Component calledSensor. Each sensor interface may have multiple sensing ele-ments, which represent the data for a variety of measured values.Further, when an MTConnect sensor represents multiple sensingelement(s), each sensing element is represented by a Channel.A Channel represents one sensing element and can have its ownattributes and Configuration data.
FIGURE 6: Sensor Architecture of MTConnect
The MTConnect architecture has an “Agent” that is a webservice and acts as a “bridge” between an MTConnect “Device”and a Client Application. An MTConnect Device is a pieceof equipment, like a robot, organized as a set of componentsthat provide data. An MTConnect “Adapter” is a process thatprovides a data stream from a device to the agent. MTCon-nect defines XML information models in order to exchange stan-dard data items. MTConnect has a so-called “Streams” infor-mation model that defines data reporting of Events, Samples,
Conditions, and Asset data items through continually-updatedchannels. MTConnect has a standard configuration informationmodel that provides data as a “probe”. Figure 6 shows the dual-ity of MTConnect sensor configuration as two types: A Sensorbuilt into an MTConnect Device (i.e., Robot) and an indepen-dent Sensor as a standalone MTConnect Device. In Figure 6, therobot “contains” the sensors and will report sensed values as partof its data reporting.
The MTConnect standard provides an XML configurationreport colloquially known as a “probe”. The MTConnect probeenumerates the DataItems that will be reported in a “stream”.The MTConnect probe represents sensor values as a DataItemsample, which includes XML attributes for sensor type, units,name, and XML id. Also included in the DataItem XML foracceleration is an attribute called statistic which is calculatedspecific to the sensor DataItem. The statistic attribute indi-cates that the data has been processed using a statistical op-eration like average, mean, or root square. Examples of MT-Connect statistic attributes are AVERAGE, MINIMUM, MAXI-MUM, ROOT MEAN SQUARE, RANGE, MEDIAN, MODE,and STANDARD DEVIATION. Below is the XML reportedfrom the temperature (thermistor) sensor when querying the MT-Connect Agent for a system configuration (i.e., probe) [20].<DataItem type="TEMPERATURE" category="SAMPLE"
name="Rtemp" id="temp" units="CELSIUS" ><Source componentId="s1">channel:1</Source>
</DataItem>
The above XML uses the MTConnect Devices XSD as theInformation Model schema to describe each device and its dataitems available. Below, the XML shows the data reporting asconfigured using the MTConnect Streams XSD as the Informa-tion Model. MTConnect streams describe a time series of dataitems, including samples, events, and conditions. Below theStreams snippet describes the sensor readings for sensor one, the“temp” temperature sensor:<Temperature dataItemId="temp"
timestamp="2017-03-07T21:17:42.814257"name="Robotemp"sequence="839777883"> 19.9
</Temperature >
A sensor measured value is rarely observed in isolation froma combination of noise and distortion [21]. In fact, noise anddistortion are the fundamental source of the limitations in theaccuracy of sensor measurements. For example, the sources ofaccelerometer noise can be broken down into the electronic noisefrom the circuitry that is converting the motion into a voltage sig-nal or mechanical noise from the sensor itself. If an MTConnectsensor sample is returned as a data item, especially a sensor thatmay be noisy and prone to providing outlier values, a quantifica-tion of the error would be desirable. For example, temperaturesensors typically provide a statement that the thermistor is accu-rate to ± 3 degrees. To translate this into an uncertainty value

(or statistical distribution of the error), we assume that the errormean is zero and that three standard deviations from this meanprovides approximately 99.7 % of the error statistical populationassuming a normal error distribution. Of note, it is assumed thatthe vendor in providing a bounds on the sensor accuracy, hasused a sufficiently large number of observations to provide a re-liable estimate of the accuracy. For the thermistor example, thethree-degree bounded limit translates into a standard deviationuncertainty of one degree.
It would be desirable for MTConnect to report the un-certainty associated with any measurement, especially sensors,since noisy measurements or outliers could pass through the datareporting system as ground truth, when in fact the numbers areabnormal and should be discarded or should be filtered. Below isan MTConnect sensor that incorporates uncertainty as an associ-ated MTConnect data item:
<DataItem type="TEMPERATURE"category="SAMPLE"name="Robotemp"id="temp" units="CELSIUS" >
<Source componentId="s1">channel:1</Source></DataItem><DataItem type="TEMPERATURE"statistics="STANDARD_DEVIATION"category="SAMPLE" name=" RobotempUnc"id="tempuncertainty" units="CELSIUS" >
</DataItem>
Now, every sensor temperature sensor measurement willhave an associated uncertainty value associated with the read-ing. Below is MTConnect data stream XML snippet reportingthe temperature sensor measurement, but now containing an as-sociated data item to explicitly state the uncertainty of the tem-perature sensor measurement. For example, in the temperaturesensor uncertainty reading, we assume measurement units corre-spond to those described in the probe XML given above, so thetemperature uncertainty is given as a standard deviation of onedegree
<Temperature dataItemId="temp"timestamp="2017-03-07T21:17:42.814257"name="Robotemp"sequence="839777883"> 19.9
</Temperature ><Temperature dataItemId="tempuncertainty"timestamp="2017-03-07T21:17:42.814257"name="RobotempUnc" sequence="839777883"> 1.0
</Temperature >
Now, the uncertainty of the MTConnect data item can alsobe used to register abnormal changes detected internally by thesensor that may affect its measurements. For example, supposean acceleration sensor contains an internal temperature moni-tor and detects that its board’s internal temperature is exceed-ing 40 ◦C, which adversely effects the sensor operation and itsacceleration measurements. In this case, the uncertainty value
could be negative, indicating the measures can never be equal tothe mean. Although there is no explicit MTConnect facility forexpressing multidimensional sensor data such as images, MT-Connect has the ability to incorporate and transport XML dataindependent of the core MTConnect information models. Usingthe MTConnect “asset” model, MTConnect agents can pass sen-sor data as embedded “asset” data. This facility along with assetnotification and the “statistic” attribute can form the basis for re-porting 2D and 3D sensor data. A brief overview will show thedeployment of the MTConnect “asset” mechanism.
MTConnect defines “assets,” which use an associative arrayof key/value stores to store the XML. This allows the ability tocollect and report entire XML documents as they change withinapplications. Below, the XML shows how an AssetChanged tagwith an asset type Sensor and READING value that would be up-dated within the MTConnect XML query to indicate new qualityresults from an inspection.
<AssetChanged dataItemId="multidimsensor_asset_chg"timestamp="2016-09-08T19:42:16.855924Z" sequence="46"assetType="Sensor"> Reading</AssetChanged>
For our implementation, the Quality Measurement Results(QMR) XML Schema was used to develop the XML that is thenassessable via the Internet with the following query to an MT-Connect agent –
http://xxx.xxx.xxx.xxx/asset/INSPECTION?type=Part
where xxx.xxx.xxx.xxx is the ip address of the MTConnectserver, and which returns a so-called “blob” of otherwise unstruc-tured multidimensional sensor data, outlined by the followingXML snippet:
<MultiDimSensor timestamp="2011-07-25T13:55:22"assetId="Reading">
<Reading><!-- this is the start of the sensor blob data -->. . .</Reading></MultiDimSensor>
Multidimensional sensors are affected by noise and distor-tion, so the uncertainty should reflect this. Although it is pos-sible to embed another sensor data item in the MTConnect sys-tem configuration to reflect the uncertainty, it would be easier toincorporate an existing standard such as the Metadata WorkingGroup Standard [22] to handle image data.
In theory, using the MTConnect sequence number to pack-age data, a client could query an MTConnect agent to streammultidimensional data. No tests were done to verify this capabil-ity.

USE OF ORIENTATION UNCERTAINTY IN ASSEMBLYTASK
If a CAD model of a part is available, any Point of Inter-est (POI) associated with that part can be determined using six-degree-of-freedom data acquired by a pose measuring system.Uncertainty of a selected POI is derived from uncertainty of posemeasurement. Uncertainty of a part’s location propagates homo-geneously to its all POIs but propagation of orientation uncer-tainty may be more complicated and may have directional de-pendence.
FIGURE 7: Two vector bars mounted rigidly to a part form alocal frame which is tracked by a pose measuring system. Thelocation of any POI on a part (marked by an arrow) can be deter-mined from dynamically tracked pose and fixed location of thePOI in a local frame. Uncertainty in pose measurement must bepropagated to the POI.
Let us assume the j-th noisy pose measurement yields RRR jrotation and ttt j translation. If a location of a POI in the CADcoordinate frame is UUU = U uuu(θ ,ϕ), where U =‖UUU‖ and a unitvector u points in the direction of azimuth ϕ and elevation θ ,then the location of a POI on the rotated object in the coordinateframe of the pose measuring system is
UUU i =Uwww j + ttt j , (1)
where a unit vector www j points to a rotated POI
wwwi = RRRuuu(θ ,ϕ) . (2)
Uncertainty in the orientation RRR j is propagated to www j and thenoisy orientation can be represented as
RRR j = R̄RR ∆ RRR j , (3)
where the mean orientation R̄RR is used as the approximation ofthe unknown true orientation and ∆RRR j is a small random rotationwhich can be expressed in axis-angle representation (a j,ρ j) as
∆RRR j(aaa j,ρ j)≈ III +
0 −qzj qy
jqz
j 0 −qxj
−qyj qx
j 0
, (4)
where I is the identity matrix and
qqq j = ρ j aaa j . (5)
From N repeated measurements of noisy orientation RRR j, j =1, . . . ,N, a covariance matrix of orientation data cov(q) can becalculated and its three eigenvalues {∧1,∧2,∧3}(∧1 < ∧2 < ∧3)and associated eigenvectors {eee1,eee2,eee3} can be calculated. Noisyrotations RRR j can also be used to investigate distribution of trans-formed unit vectors w j in (2). One way of doing this is to charac-terize a distribution of µ j defined as the angle between www j and themean unit vector w̄ww. The spread of this distribution may be char-acterized by the angular uncertainty σ : smaller σ correspond toa tighter concentration of noisy www j around the mean direction w̄wwand larger σ correspond to wider spread of www j around w̄ww.
For a large class of pose measuring systems, angular uncer-tainty depends on direction, i.e., σ = σ(θ ,ϕ) where azimuth andelevation angles determine direction of unit vector u(θ ,ϕ) in (2).Directional distribution of σ(θ ,ϕ) is closely correlated with thedistribution of axes a j of small noisy rotations ∆RRR j in (4,5), ascan be seen in Figure 8 and Figure 9.
Thus, depending on the directions of eigenvectors of the co-variance matrix of the orientation data, different POIs of the mea-sured object will be affected differently. Such situation is shownin Figure 10.
In summary, the covariance matrix of the orientation dataneeds to be carefully analyzed, as not only the values of its di-agonal elements (variances of orientation data) and off-diagonalelements (correlation coefficients) are important.
CONCLUSIONImprovements in sensing and control have enabled robots to
be deployed in difficult-to-automate applications characterized

FIGURE 8: Histograms of axes a j of small random rotations ∆RRR jon log scale in (a), −in f indicates empty bins; (b) directionaldistribution of angular uncertainty σ in [mrad]. Based on ori-entation data obtained with an Optitrack Duo, the length of dataN > 50,000. Plotted directions of eigenvectors correspond toeigenvalues ∧1,∧2,∧3 of the covariance matrix of the orienta-tion data q.
FIGURE 9: The same as in Figure 8 but based on orientation dataobtained with another pose measuring system (iGPS).
FIGURE 10: Angular uncertainty mapped onto a CAD modelbased on the data acquired with: a) iGPS (same as in Figure 9b)and b) OptiTrack Duo (same as in Figure 8b).
by often-changing requirements for operation in uncertain envi-ronments. To more fully automate the optimization of these ac-tivities, it is important to be able to exchange information aboutthe tolerance on required performance, and the uncertainty inmeasured performance. Standards for the exchange of this in-formation have been revised with this objective, to varying suc-cess. This paper examined the support of these standards usinga use case scenario, and showed the results of a case study onthe use of orientation uncertainty to optimally place objects in
a robot workcell. Future work by the authors will examine theperformance improvements achievable in robot path control.
DISCLAIMERCommercial equipment and software, many of which are
either registered or trademarked, are identified in order to ade-quately specify certain procedures. In no case does such identi-fication imply recommendation or endorsement by the NationalInstitute of Standards and Technology, nor does it imply that thematerials or equipment identified are necessarily the best avail-able for the purpose.
REFERENCES[1] Proctor, F. M., Hoorn, G. v. d., and Lipman, R., 2016. “Au-
tomating robot planning using product and manufacturinginformation”. Procedia CIRP, 43, pp. 208 – 213.
[2] Huang, Y. F., and Lee, C. S. G. “A framework ofknowledge-based assembly planning”. In Proceedings.1991 IEEE International Conference on Robotics and Au-tomation, pp. 599–604 vol.1.
[3] Dini, G., and Santochi, M., 1992. “Automated sequencingand subassembly detection in assembly planning”. CIRPAnnals - Manufacturing Technology, 41(1), pp. 1–4.
[4] Proctor, F., Balakirsky, S., Kootbally, Z., Kramer, T.,Schlenoff, C., and Shackleford, W., 2016. “The canoni-cal robot command language (crcl)”. Industrial Robot: AnInternational Journal, 43(5), pp. 495–502.
[5] American Society of Mechanical Engineers, 2008. ASMEY14.5-2008, Dimensioning and Tolerancing.
[6] International Organization for Standardization, 2004. ISO1101:2004, Geometrical Product Specifications (GPS) -Geometrical tolerancing – Tolerances of form, orientation,location and run-out.
[7] International Organization for Standardization, 1994. ISO1101:2004, ISO 10303-1:1994 Industrial automation sys-tems and integration – Product data representation and ex-change – Part 1: Overview and fundamental principles.
[8] International Organization for Standardization, 1998. ISO9283, Manipulating industrial robots - Performance criteriaand related test methods.
[9] ROS Industrial. Descartes. http://wiki.ros.org/descartes.[Online: accessed 8-March-2017].
[10] ANSI, 2014. ANSI/QIF Part 1-2014: Quality InformationFramework (QIF) an integrated model for manufacturingquality information part 1: Overview and fundamental prin-ciples version 2.0. Report, Dimensional Metrology Stan-dards Consortium, Inc. (DMSC).
[11] Kramer, T., Stone, R., Hoffman, M., Hoffman, S., andRippey, W., 2012. “Design and usage guide for version0.92 of the Quality Information Framework data model and

XML schemas”. US Department of Commerce, NationalInstitute of Standards and Technology Technical Note 1777.
[12] Morey, B., 2014. “Metrology takes flight”. ManufacturingEngineering, 152(2).
[13] Pippenger, B. “Three-dimensional model for manufactur-ing and inspection”. In Proceedings ASME Turbo Expo2013: Turbine Technical Conference and Exposition.
[14] Zhao, Y., Kramer, T., Brown, R., and Xu, X., 2011. Infor-mation modeling for interoperable dimensional metrology.Springer Science & Business Media.
[15] Zhao, Y. F., Horst, J. A., Kramer, T. R., Rippey, W., andBrown, R. J., 2012. “Quality information framework - inte-grating metrology processes”. IFAC Proceedings Volumes(IFAC-PapersOnline), 14(Part 1), pp. 1301 – 1308.
[16] Zhao, Y., Kramer, T., Rippey, W., Horst, J., and Proctor,F. “An integrated data model for quality information ex-change in manufacturing systems”. In Proceedings of the37th International MATADOR 2012 Conference, pp. 239 –242.
[17] MTConnect FAQ. www.mtconnect.org/institute/mtconnect-overview/faqs.aspx. [Online: accessed 8-March-2017].
[18] MTConnect. MTConnect Standard Version 1.3.1, Part 2:Components and data items. www.mtconnect.org/standard-documents. [Online: accessed 8-March-2017].
[19] Lee, K. B., Song, E. Y., and Gu, P. S. “A sensor modelfor enhancement of manufacturing equipment data interop-erability”. In ASME 2012 International Mechanical Engi-neering Congress and Exposition, pp. 705–712.
[20] MTConnect Sensors. http://www.mtcup.org/wiki/Sensors.[Online: accessed 8-March-2017].
[21] Vaseghi, S. V., 2008. Advanced digital signal processingand noise reduction. John Wiley & Sons.
[22] Metadata Working Group . Specifications.www.metadataworkinggroup.com. [Online: accessed8-March-2017].