Embed Size (px)
Citation preview

Tokyo Development Learning Center Policy Paper Series 2:
CASE STUDY ON TERRITORIAL DEVELOPMENT IN JAPAN
Pub
lic D
iscl
osur
e A
utho
rized
Pub
lic D
iscl
osur
e A
utho
rized
Pub
lic D
iscl
osur
e A
utho
rized
Pub
lic D
iscl
osur
e A
utho
rized
AuthorsResearch Institute for Urban and Environmental Development (UED)Vibhu Jain, Consultant, TDLC, World BankYuko Okazawa, Urban Specialist, TDLC, World Bank
Peer ReviewersSomik Lall, Lead Urban Economist, World Bank
© 2017 The World Bank Group
1818 H Street NW
Washington, DC 20433
Telephone: 202-473-1000
Internet: www.worldbank.org
All rights reserved.
This volume is a product of the staff of the World Bank Group. The World Bank Group refers to the member institutions of the World Bank Group: The World Bank (International Bank for Reconstruction and Development); International Finance Corporation (IFC); and Multilateral Investment Guarantee Agency (MIGA), which are separate and distinct legal entities each organized under its respective Articles of Agreement. We encourage use for educational and non-commercial purposes.
The findings, interpretations, and conclusions expressed in this volume do not necessarily reflect the views of the Directors or Executive Directors of the respective institutions of the World Bank Group or the governments they represent. The World Bank Group does not guarantee the accuracy of the data included in this work.
Rights and PermissionsThis work is product of the staff of the World bank with external contributions. The findings, interpretations, and conclusions expressed in this work do not necessarily reflect the views of the World Bank, its Board of Executive Directors, or the governments they represent. Nothing herein shall constitute or be considered to be a limitation upon or waive of the privileges and immunities of the World Bank, all of which are specifically reserved.
Contact:World Bank GroupSocial, Urban, Rural and Resilience Global PracticeTokyo Development Learning Center (TDLC) ProgramFukoku Seimei Bldg. 10F, 2-2-2 Uchisaiwai-cho, Chiyoda-ku, Tokyo 100-0011 JapanPhone: +81(3)3597-1333Fax: +81(3)3597-1311Web: http://www.jointokyo.org
About Tokyo Development Learning Center (TDLC)The Tokyo Development Learning Center (TDLC) program is a partnership of Japan and the World Bank. TDLC supports and facilitates strategic WBG and client country collaboration with select Japanese cities, agencies and partners for joint research, knowledge exchange, capacity building and other activities that develop opportunities to link Japanese and global expertise with specific project-level engagements in developing countries to maximize development impact.
CONTENTS
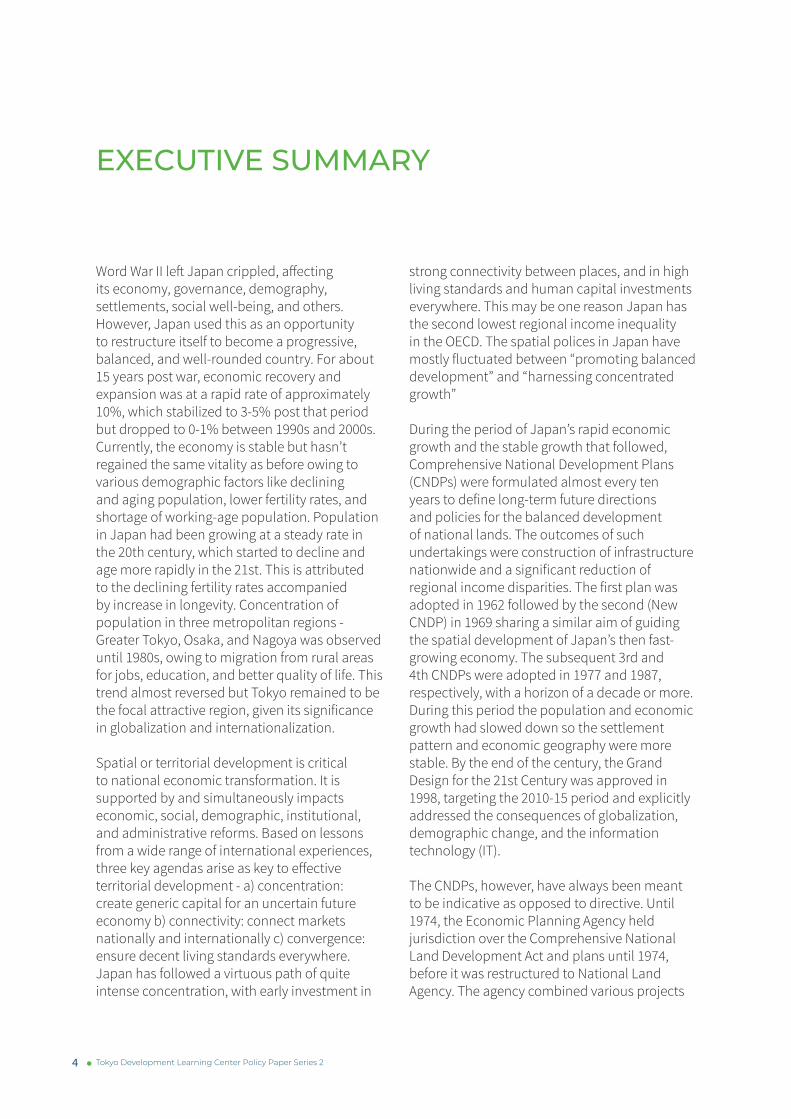
Executive Summary 41. Japan’s Post-War Economic and Demographic Development and Changes 6 Historical Trend of Japan’s Economy 6 Population Dynamics of Japan 6 From Concentration in the Three Largest Metropolitan Areas to Concentration in Tokyo 8
2. Spatial Development Policies and Comprehensive National Development Plans 9 Comprehensive National Development Plans 10 The 1st Comprehensive National Development Plan 13 New (the 2nd) Comprehensive National Development Plan 15 The 3rd Comprehensive National Development Plan 17 The 4th Comprehensive National Development Plan 19 The 5th Comprehensive National Development Plan - Grand Design for the 21st Century 22 Change in the Outlook towards the Territorial Development Policy 26
3. Economic and Administrative Policies and Concepts Impacting Spatial Developments 28 Investment in Social Overhead Capital 28 Reform of the Planning System 29 Promotion of Underdeveloped Areas 30 Decline in Regional Income Inequality 30
4. Key Message on Territorial Planning 31
4 Tokyo Development Learning Center Policy Paper Series 2
EXECUTIVE SUMMARY
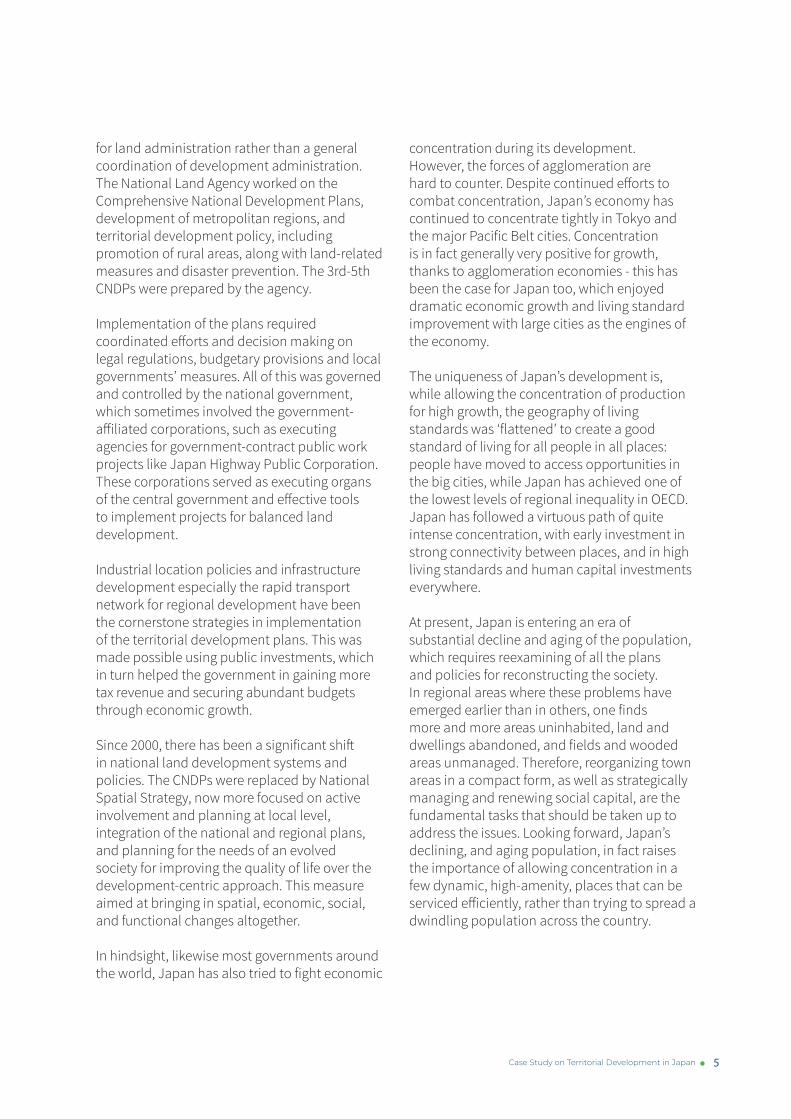
Word War II left Japan crippled, affecting its economy, governance, demography, settlements, social well-being, and others. However, Japan used this as an opportunity to restructure itself to become a progressive, balanced, and well-rounded country. For about 15 years post war, economic recovery and expansion was at a rapid rate of approximately 10%, which stabilized to 3-5% post that period but dropped to 0-1% between 1990s and 2000s. Currently, the economy is stable but hasn’t regained the same vitality as before owing to various demographic factors like declining and aging population, lower fertility rates, and shortage of working-age population. Population in Japan had been growing at a steady rate in the 20th century, which started to decline and age more rapidly in the 21st. This is attributed to the declining fertility rates accompanied by increase in longevity. Concentration of population in three metropolitan regions - Greater Tokyo, Osaka, and Nagoya was observed until 1980s, owing to migration from rural areas for jobs, education, and better quality of life. This trend almost reversed but Tokyo remained to be the focal attractive region, given its significance in globalization and internationalization.
Spatial or territorial development is critical to national economic transformation. It is supported by and simultaneously impacts economic, social, demographic, institutional, and administrative reforms. Based on lessons from a wide range of international experiences, three key agendas arise as key to effective territorial development - a) concentration: create generic capital for an uncertain future economy b) connectivity: connect markets nationally and internationally c) convergence: ensure decent living standards everywhere. Japan has followed a virtuous path of quite intense concentration, with early investment in
strong connectivity between places, and in high living standards and human capital investments everywhere. This may be one reason Japan has the second lowest regional income inequality in the OECD. The spatial polices in Japan have mostly fluctuated between “promoting balanced development” and “harnessing concentrated growth”
During the period of Japan’s rapid economic growth and the stable growth that followed, Comprehensive National Development Plans (CNDPs) were formulated almost every ten years to define long-term future directions and policies for the balanced development of national lands. The outcomes of such undertakings were construction of infrastructure nationwide and a significant reduction of regional income disparities. The first plan was adopted in 1962 followed by the second (New CNDP) in 1969 sharing a similar aim of guiding the spatial development of Japan’s then fast-growing economy. The subsequent 3rd and 4th CNDPs were adopted in 1977 and 1987, respectively, with a horizon of a decade or more. During this period the population and economic growth had slowed down so the settlement pattern and economic geography were more stable. By the end of the century, the Grand Design for the 21st Century was approved in 1998, targeting the 2010-15 period and explicitly addressed the consequences of globalization, demographic change, and the information technology (IT).
The CNDPs, however, have always been meant to be indicative as opposed to directive. Until 1974, the Economic Planning Agency held jurisdiction over the Comprehensive National Land Development Act and plans until 1974, before it was restructured to National Land Agency. The agency combined various projects
5Case Study on Territorial Development in Japan
for land administration rather than a general coordination of development administration. The National Land Agency worked on the Comprehensive National Development Plans, development of metropolitan regions, and territorial development policy, including promotion of rural areas, along with land-related measures and disaster prevention. The 3rd-5th CNDPs were prepared by the agency.
Implementation of the plans required coordinated efforts and decision making on legal regulations, budgetary provisions and local governments’ measures. All of this was governed and controlled by the national government, which sometimes involved the government-affiliated corporations, such as executing agencies for government-contract public work projects like Japan Highway Public Corporation. These corporations served as executing organs of the central government and effective tools to implement projects for balanced land development.
Industrial location policies and infrastructure development especially the rapid transport network for regional development have been the cornerstone strategies in implementation of the territorial development plans. This was made possible using public investments, which in turn helped the government in gaining more tax revenue and securing abundant budgets through economic growth.
Since 2000, there has been a significant shift in national land development systems and policies. The CNDPs were replaced by National Spatial Strategy, now more focused on active involvement and planning at local level, integration of the national and regional plans, and planning for the needs of an evolved society for improving the quality of life over the development-centric approach. This measure aimed at bringing in spatial, economic, social, and functional changes altogether.
In hindsight, likewise most governments around the world, Japan has also tried to fight economic
concentration during its development. However, the forces of agglomeration are hard to counter. Despite continued efforts to combat concentration, Japan’s economy has continued to concentrate tightly in Tokyo and the major Pacific Belt cities. Concentration is in fact generally very positive for growth, thanks to agglomeration economies - this has been the case for Japan too, which enjoyed dramatic economic growth and living standard improvement with large cities as the engines of the economy.
The uniqueness of Japan’s development is, while allowing the concentration of production for high growth, the geography of living standards was ‘flattened’ to create a good standard of living for all people in all places: people have moved to access opportunities in the big cities, while Japan has achieved one of the lowest levels of regional inequality in OECD. Japan has followed a virtuous path of quite intense concentration, with early investment in strong connectivity between places, and in high living standards and human capital investments everywhere.
At present, Japan is entering an era of substantial decline and aging of the population, which requires reexamining of all the plans and policies for reconstructing the society. In regional areas where these problems have emerged earlier than in others, one finds more and more areas uninhabited, land and dwellings abandoned, and fields and wooded areas unmanaged. Therefore, reorganizing town areas in a compact form, as well as strategically managing and renewing social capital, are the fundamental tasks that should be taken up to address the issues. Looking forward, Japan’s declining, and aging population, in fact raises the importance of allowing concentration in a few dynamic, high-amenity, places that can be serviced efficiently, rather than trying to spread a dwindling population across the country.
6 Tokyo Development Learning Center Policy Paper Series 2
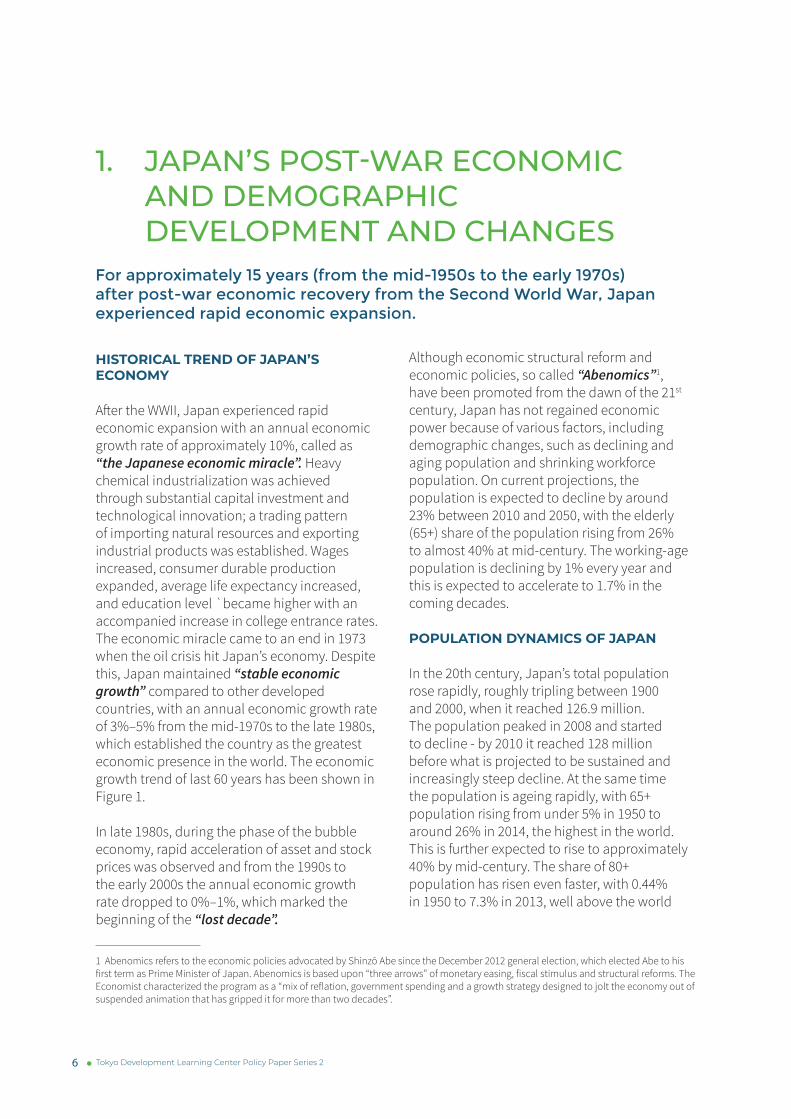
1. JAPAN’S POST-WAR ECONOMIC AND DEMOGRAPHIC DEVELOPMENT AND CHANGES
HISTORICAL TREND OF JAPAN’S ECONOMY
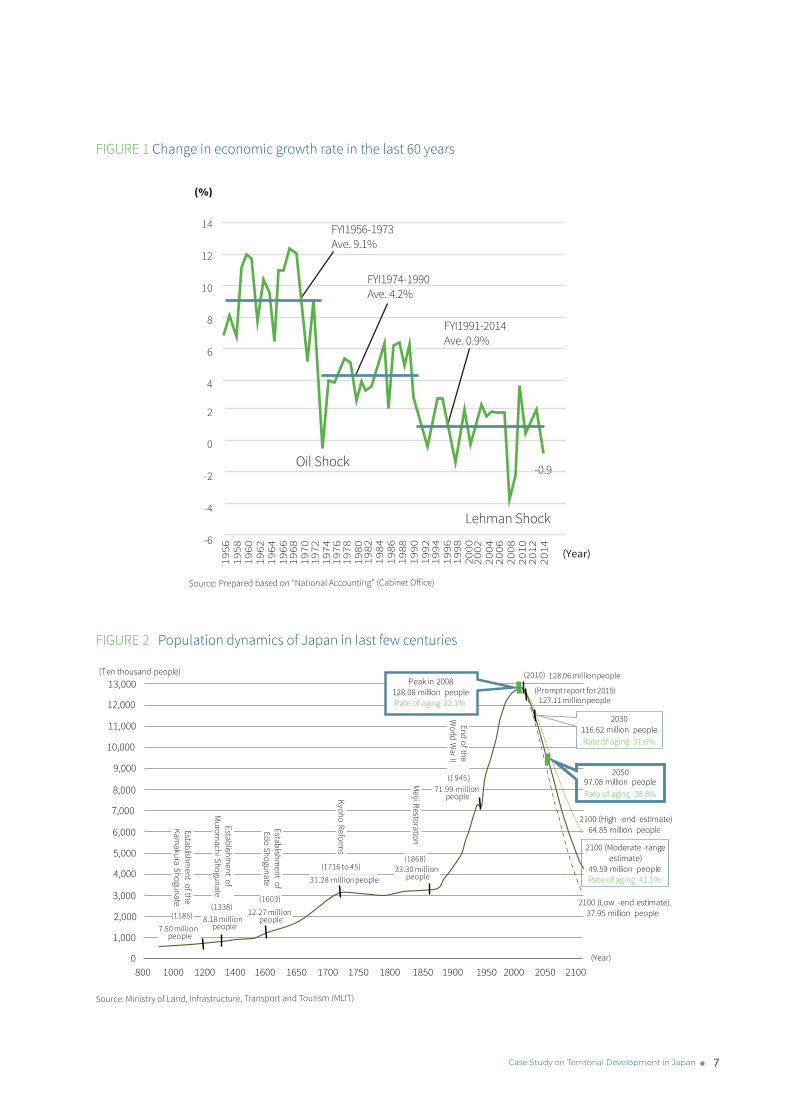
After the WWII, Japan experienced rapid economic expansion with an annual economic growth rate of approximately 10%, called as “the Japanese economic miracle”. Heavy chemical industrialization was achieved through substantial capital investment and technological innovation; a trading pattern of importing natural resources and exporting industrial products was established. Wages increased, consumer durable production expanded, average life expectancy increased, and education level `became higher with an accompanied increase in college entrance rates.The economic miracle came to an end in 1973 when the oil crisis hit Japan’s economy. Despite this, Japan maintained “stable economic growth” compared to other developed countries, with an annual economic growth rate of 3%–5% from the mid-1970s to the late 1980s, which established the country as the greatest economic presence in the world. The economic growth trend of last 60 years has been shown in Figure 1.
In late 1980s, during the phase of the bubble economy, rapid acceleration of asset and stock prices was observed and from the 1990s to the early 2000s the annual economic growth rate dropped to 0%–1%, which marked the beginning of the “lost decade”.
Although economic structural reform and economic policies, so called “Abenomics”1, have been promoted from the dawn of the 21st century, Japan has not regained economic power because of various factors, including demographic changes, such as declining and aging population and shrinking workforce population. On current projections, the population is expected to decline by around 23% between 2010 and 2050, with the elderly (65+) share of the population rising from 26% to almost 40% at mid-century. The working-age population is declining by 1% every year and this is expected to accelerate to 1.7% in the coming decades.
POPULATION DYNAMICS OF JAPAN
In the 20th century, Japan’s total population rose rapidly, roughly tripling between 1900 and 2000, when it reached 126.9 million. The population peaked in 2008 and started to decline - by 2010 it reached 128 million before what is projected to be sustained and increasingly steep decline. At the same time the population is ageing rapidly, with 65+ population rising from under 5% in 1950 to around 26% in 2014, the highest in the world. This is further expected to rise to approximately 40% by mid-century. The share of 80+ population has risen even faster, with 0.44% in 1950 to 7.3% in 2013, well above the world
1 Abenomics refers to the economic policies advocated by Shinzō Abe since the December 2012 general election, which elected Abe to his first term as Prime Minister of Japan. Abenomics is based upon “three arrows” of monetary easing, fiscal stimulus and structural reforms. The Economist characterized the program as a “mix of reflation, government spending and a growth strategy designed to jolt the economy out of suspended animation that has gripped it for more than two decades”.
For approximately 15 years (from the mid-1950s to the early 1970s) after post-war economic recovery from the Second World War, Japan experienced rapid economic expansion.
7Case Study on Territorial Development in Japan
FIGURE 1 Change in economic growth rate in the last 60 years
4
6
8
10
12
14
(%)
-6
-4
-2
0
2
1956
1958
1960
1962
1964
1966
1968
1970
1972
1974
1976
1978
1980
2002
2004
2006
2008
2010
2012
2014
1982
1984
1986
1988
1990
1992
1994
1996
1998
2000 (Year)
FYI1956-1973Ave. 9.1%
FYI1974-1990Ave. 4.2%
FYI1991-2014Ave. 0.9%
Oil Shock
Lehman Shock
-0.9
Source: Prepared based on “National Accounting” (Cabinet Office)
FIGURE 2 Population dynamics of Japan in last few centuries
0
1,000
2,000
3,000
4,000
5,000
6,000
10,000
11,000
12,000
(1338)
(1716 to 45)(1868)
2030116.62 million peopleRate of aging 31.6%
205097.08 million people Rate of aging 38.8%
2100 (Moderate -range estimate)
49.59 million peopleRate of aging 41.1%
2100 (High -end estimate)64.85 million people
2100 (Low -end estimate)37.95 million people(1185)
7.50 million people
8.18 million people
(1603)
12.27 million people
31.28 million people33.30 million
people
(1 945)71.99 million
people
Establishment of the
Kamakura Shogunate
Meiji Restoration
Establishment of
Murom
achi Shogunate
Kyoho Reforms
Establishment of
Edo Shogunate
End of the W
orld War II
(2010) 128.06 million peoplePeak in 2008
128.08 million peopleRate of aging 22.1%
(Prompt report for 2015)127.11 million people
(Ten thousand people)
(Year)
7,000
8,000
9,000
13,000
800 1000 1200 1400 1600 1650 1700 1750 1800 1850 1900 1950 2000 2050 2100
Source: Ministry of Land, Infrastructure, Transport and Tourism (MLIT)
8 Tokyo Development Learning Center Policy Paper Series 2
average. (statistics from the Ministry of Land, Infrastructure, Transport and Tourism).
Both these processes- declining and ageing population – are occurring at different rates and bringing about different impacts all over Japan, resulting in significant changes to both labor markets and settlement patterns. The two-factor interplay that are driving these processes are fertility and longevity. • The main factor underlying Japan’s rapid
demographic decline is low fertility. The total fertility ration (TFR) in Japan fell sharply in the early 1950’s. from a peak of almost 4.5 during the post-war baby boom to 2.00 – 2.16 until 1974, after which it began a sustained decline to 1.26 in 2005 before recovering somewhat to 2.43 in 2014.
• The collapse in fertility has coincided with an extraordinary increase in longevity. Life expectancy at birth rose from 51.68 years in 1947 to 83.48 years in 2013. Such a rapid increase in life expectancy enabled Japan to sustain overall population growth long after the birth rates have fallen off but that implies rapidly rising old-age dependency ratio.
Unlike many other countries, migration is not a major driver of the population dynamics in Japan. Emigration from and immigration into Japan have been very low since 1945, with foreign born population constituting less than 1.7% of the total in 2010. Japan faced labor shortages during high growth period in the late 20th century but it didn’t rely on foreign labor. Instead, it pursued automated production, supported with specific forms of subcontracting and by employment systems that emphasized multi-skilling and teamwork rather than narrow specialization.
The Ministry of Land, Infrastructure, Transport and Tourism (MLIT) projects that more than 60% of the inhabited grid squares in the country will lose more than half their population by 2050; 19% are expected to become uninhabited. By contrast, only 2% are projected to experience population growth. If fertility does not increase, the projections point to a sharper decline, to perhaps 86 million in 2060 and 43 million early in the next century.
FROM CONCENTRATION IN THE THREE LARGEST METROPOLITAN AREAS TO CONCENTRATION IN TOKYO
The long-term trend in the drift of the population between rural and urban areas shows substantial migration from rural areas into the Greater Tokyo Area, Greater Osaka Area, and Greater Nagoya Area during the period of the Japanese economic miracle from the late 1950s to the early 1970s with setting up of the Pacific Belt Zone2. People migrating to this zone mainly comprised younger generations who moved to these areas for work or college. The three large conurbations are home to almost half of Japan’s population, though they occupy only 5.2% of the national territory, on the Pacific side of the island stretching around 500 km.
However, in the 1970s, this flow of population into the three metropolitan areas decreased exponentially, owing to the decentralization policies as depicted in Figure 3 (excess incoming migration peaked around 1961). Since the 1980s, migration has slowed down to these areas but continues for the Greater Tokyo Area (beginning in the 1980s and peaking once in 1987, then in 2007-2008). In the Greater Osaka Area, the population outflow has exceeded the inflow, whereas the population inflow has slightly exceeded the outflow in the Greater Nagoya Area.

9Case Study on Territorial Development in Japan
FIGURE 3 Change in population movement in three metropolitan and regional areas
20
30
40
50
60
70
0
10
-101955 1960 1965 1970 1975 1980 2005 2010 20151985 1990 1995 2000
3 Areas TotalGreater
Tokyo Area
Greater Osaka Area
Greater Nagoya Area
Total of three Metropolitan AreasGreater Tokyo Area: Tokyo, Kanagawa, Saitama, ChibaGreater Osaka Area: Osaka, Kyoto, Hyogo, NaraGreater Nagoya Area: Aichi, Gifu, Mie
Source: Prepared by The Ministry of Land, Infrastructure, Transport and Tourism (MLIT), based on “Basic resident resister migration report”
10 Tokyo Development Learning Center Policy Paper Series 2
2. SPATIAL DEVELOPMENT POLICIES AND COMPREHENSIVE NATIONAL DEVELOPMENT PLANS
Spatial or territorial development is not a stand-alone phenomenon. It is supported by and simultaneously impacts economic, social, demographic, institutional, and administrative reforms.
Distilling lessons from a wide range of international experiences, three key agendas arise as key to effective territorial development for national economic transformation:
• Concentration: Create generic capital for an uncertain future economyThis translates into focusing on putting in place the foundational capital that will be essential to productivity for any future economy. It includes developing quality institutions; fluid factor markets; broad-purpose infrastructure; human capital
• Connectivity: Connect markets nationally and internationallyConnectivity is not just about linking places through roads and railways, it’s also about access to labour markets, information and services, and goods. Connecting markets promotes specialization of production across places, and production at scale, both of which are key to productivity. For economic growth, it is critical to connect cities with each other domestically, and with global markets externally.
• Convergence: Ensure decent living standards everywhere Focusing on the concept that people everywhere deserve decent living standards and opportunities, while firms and institutions may concentrate, reduces regional disparities. Therefore, instead of trying to flatten the geography of production, aim should be to ‘flatten’ the geography of living standards and human capital.
In case of Japan, since the beginning of the 20th century, economy was concentrated, and has continued to concentrate tightly in Tokyo and the major Pacific Belt cities. Tokyo boasts a population of over 40 million (which is more than a third of the national total), and has continued to expand particularly in post WWII years. It also contributes to 38% of the national GDP. Reflecting on the findings from global experience - the forces of agglomeration are hard to counter – and is in fact generally very positive for growth. Japan has been continually growing economically and improving living standards with large cities serving as the engines of growing economy, and many people accessing opportunities in these cities.
Japan has followed a virtuous path of quite intense concentration, with early investment in strong connectivity between places, and in high living standards and human capital investments everywhere. This may be one reason Japan has the second lowest regional income inequality in the OECD.
The spatial polices in Japan have mostly fluctuated between “promoting balanced development” and “harnessing concentrated growth” (e.g. policies aiming to decentralize industrial centers versus supporting the economic development in Greater Tokyo).
As early as 1962, the Comprehensive National Development Plan (CNDP) was prepared that explicitly aimed to decentralize the industrial structure developed under Pacific Zone
11Case Study on Territorial Development in Japan
Initiative, to depopulate the large cities. Similar targets were set out in the 1969 and 1977 plans. While the plans led to relocation of infrastructure investments and activities outside the Tokyo-Nagoya-Osaka urban region, the dominant trend has been towards further concentration of people and economic activity. By the 4th CNDP, natural phenomenon was leading to concentration in Greater Tokyo region, which was accepted and harnessed in this plan. The 1998 Grand Design for the 21st Century focused more on the overall growth in the larger global context, promoting regional independence and inter-regional cooperation. In contemporary
national planning, Tokyo’s role as the key engine of growth, and hub, of the national economy seems to be acknowledged, and the strategy became about harnessing concentration in the Greater Tokyo Area for the benefit of all, and managing its negative externalities, rather than fighting concentration. The current strategies emphasize on Japan’s more modest recent economic growth rates, and the prospects of the aging and declining national population.
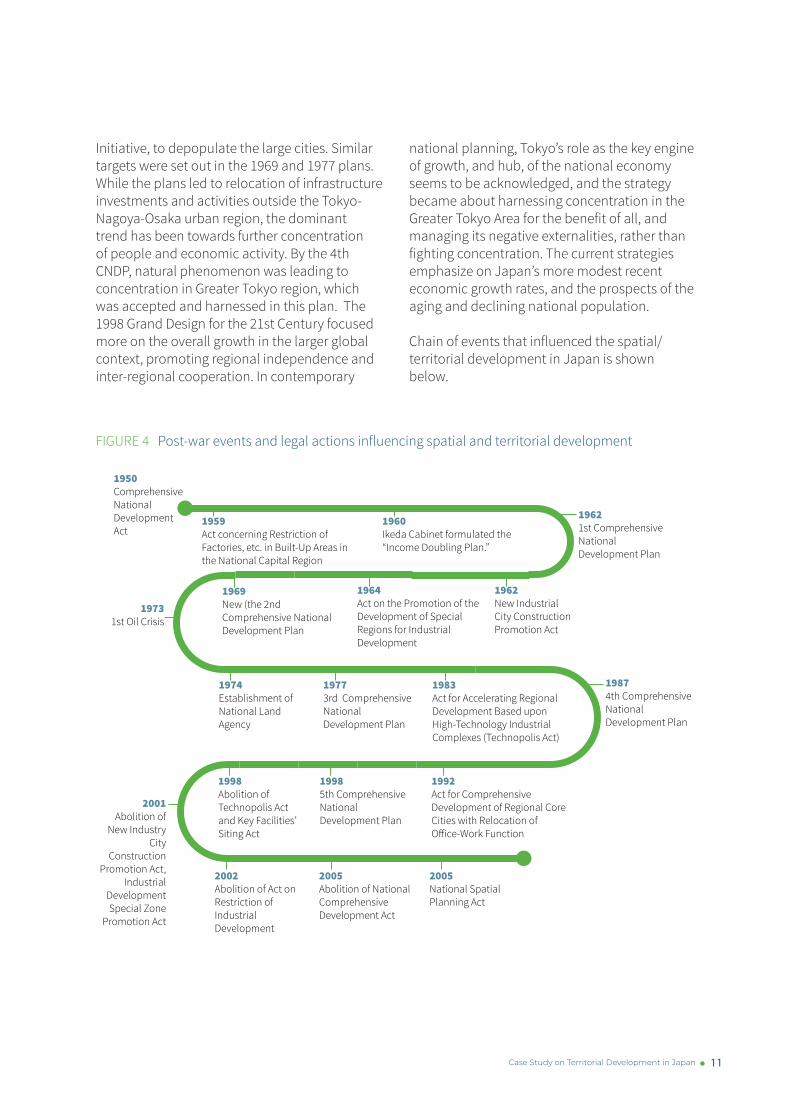
Chain of events that influenced the spatial/ territorial development in Japan is shown below.
FIGURE 4 Post-war events and legal actions influencing spatial and territorial development
1950Comprehensive National Development Act
1959 Act concerning Restriction of Factories, etc. in Built-Up Areas in the National Capital Region
1960Ikeda Cabinet formulated the “Income Doubling Plan.”
19621st Comprehensive National Development Plan
1962New Industrial City Construction Promotion Act
1964Act on the Promotion of the Development of Special Regions for Industrial Development
1969New (the 2nd Comprehensive National Development Plan
19731st Oil Crisis
1974Establishment of National Land Agency
19773rd Comprehensive National Development Plan
1983Act for Accelerating Regional Development Based upon High-Technology Industrial Complexes (Technopolis Act)
19874th Comprehensive National Development Plan
1992Act for Comprehensive Development of Regional Core Cities with Relocation of O�ice-Work Function
19985th Comprehensive National Development Plan
1998Abolition of Technopolis Act and Key Facilities’ Siting Act
2001Abolition of
New Industry City
Construction Promotion Act,
Industrial Development Special Zone
Promotion Act
2002Abolition of Act on Restriction of Industrial Development
2005Abolition of National Comprehensive Development Act
2005National Spatial Planning Act

12 Tokyo Development Learning Center Policy Paper Series 2
COMPREHENSIVE NATIONAL DEVELOPMENT PLANS Japan initiated its national-level spatial planning process as early as 1950 with the formulation of the Comprehensive National Land Development Act. The first Comprehensive National Development Plan was adopted more than 10 years later in 1962, with a horizon to 1970. It was followed by the New Comprehensive National Development Plan, which was developed in 1969 with a similar aim of guiding the spatial development of Japan’s then fast-growing economy. This period was observing rapid population growth, urbanization, and industrialization having important spatial consequences.
The subsequent 3rd and 4th Comprehensive National Development Plans were adopted in 1977 and 1987, respectively, with a horizon of a decade or more. During this period the population and economic growth had slowed down so the settlement pattern and economic geography were more stable. By the end of the century, the Grand Design for the 21st Century was approved in 1998, targeting the 2010-15 period and explicitly addressed the consequences of globalization, demographic change, and the information technology (IT).
INDUSTRIAL LOCATION POLICIES: The have been devised by the government after World War II, starting from 1950’s. There have been modifications to the policy during each of the CNDP period aligning with the objectives of the plans. Attempts have been made to concentrate and deconcentrate the cities and areas of Japan through changes in location of industries.
However, the industries have typically flourished in the Pacific Belt area.
INSTITUTIONAL FRAMEWORK: National level territorial development plans and laws in the recent history of Japan have primarily been marked by the CNDPs based on the 1950 law, as mentioned earlier. Subordinate to the national plans were the Comprehensive Development Plans pertaining to regions, prefectures and designated areas, which were further supported by other Regional Development Plans as part of the hierarchy of national land development plans. Economic Planning Agency was solely responsible for the CNDPs until 1974, which was later reformed to National Land Agency and the law was revised to the National Land Formation Planning Law (2005).
TRANSPORTATION POLICIES AND INVESTMENTS: Postwar, territorial and transport plans have been prepared in coordination in Japan. Each of the five CNDPs aimed at spatially equitable growth of a better and more stable living environment. To achieve these goals, transport investment has always been emphasized as the major policy instrument.
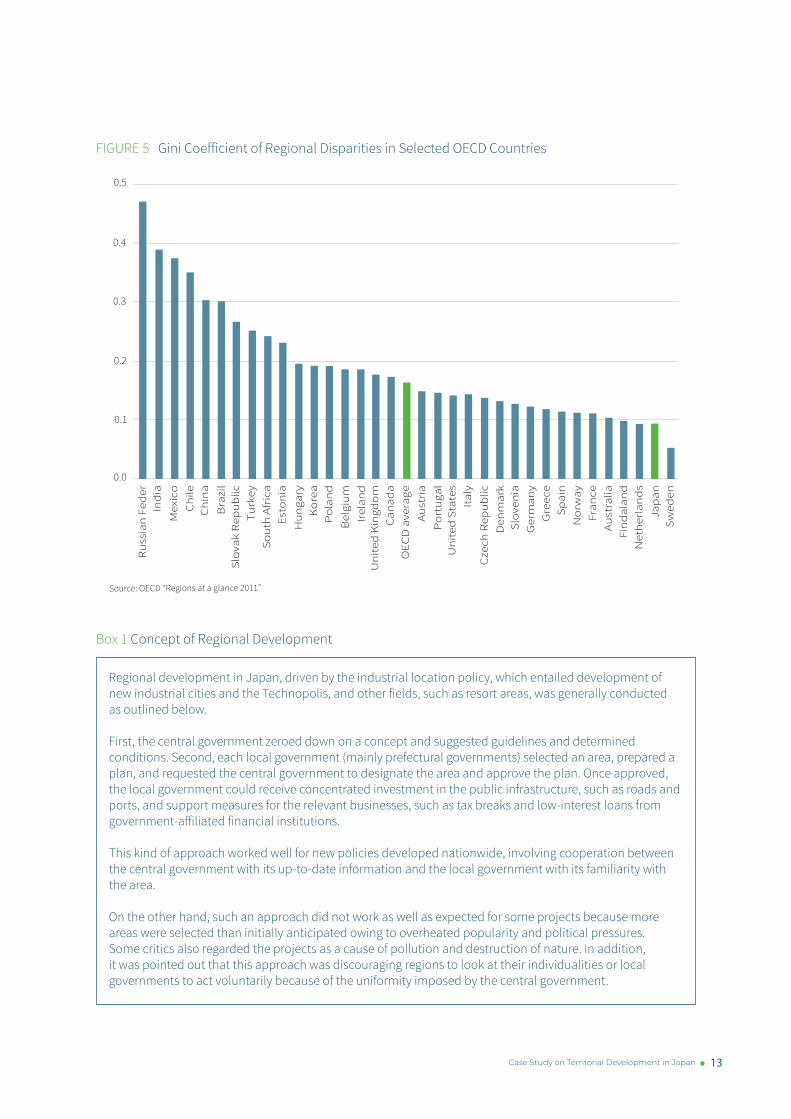
REGIONAL INCOME INEQUALITIES: Japan is one of the countries with exceptionally low inter-regional inequalities in income by OECD standards. If balanced territorial development means reduction in the two imbalances among regions (i.e., differences in income levels and living standard on one hand and differences in the use of the national territory or population density and frequency of economic activities on the other) to acceptable levels, it may be said that Japan has succeeded with the former, as seen in figure below.
13Case Study on Territorial Development in Japan
FIGURE 5 Gini Coefficient of Regional Disparities in Selected OECD CountriesR
uss
ian
Fed
erIn
dia
Mex
ico
Ch
ileC
hin
a
Bra
zil
Slo
vak
Rep
ub
licT
urk
eyS
ou
th A
fric
aEs
ton
iaH
un
gary
Ko
rea
Po
lan
d
Den
mar
kS
love
nia
Ger
man
yG
reec
eS
pai
nN
orw
ayFr
ance
Bel
giu
mIr
elan
dU
nit
ed K
ingd
om
Can
ada
OEC
D a
vera
geA
ust
ria
Po
rtu
gal
Un
ited
Sta
tes
Ital
y
Cze
ch R
epu
blic
Au
stra
liaFi
nd
alan
dN
eth
erla
nd
sJa
pan
Sw
eden
0.0
0.1
0.2
0.3
0.4
0.5
Source: OECD “Regions at a glance 2011”
Box 1 Concept of Regional Development
Regional development in Japan, driven by the industrial location policy, which entailed development of new industrial cities and the Technopolis, and other fields, such as resort areas, was generally conducted as outlined below.
First, the central government zeroed down on a concept and suggested guidelines and determined conditions. Second, each local government (mainly prefectural governments) selected an area, prepared a plan, and requested the central government to designate the area and approve the plan. Once approved, the local government could receive concentrated investment in the public infrastructure, such as roads and ports, and support measures for the relevant businesses, such as tax breaks and low-interest loans from government-affiliated financial institutions.
This kind of approach worked well for new policies developed nationwide, involving cooperation between the central government with its up-to-date information and the local government with its familiarity with the area.
On the other hand, such an approach did not work as well as expected for some projects because more areas were selected than initially anticipated owing to overheated popularity and political pressures. Some critics also regarded the projects as a cause of pollution and destruction of nature. In addition, it was pointed out that this approach was discouraging regions to look at their individualities or local governments to act voluntarily because of the uniformity imposed by the central government.

14 Tokyo Development Learning Center Policy Paper Series 2
THE 1ST COMPREHENSIVE NATIONAL DEVELOPMENT PLAN
Japan’s rapid economic expansion was guided by the Income-Doubling plan established in 1960 as an economic plan. This was aimed to be realized by establishing the Pacific Belt Zone (Fig 6). On establishment of this initiative, underdeveloped areas expressed strong criticism; which led to the preparation of the 1st Comprehensive National Development Plan, for an overall and balanced development.
The Plan was established in 1962 with the “growth pole strategy,” aiming at controlling overpopulation in large cities and correcting regional disparities. Meaning the plans were formed in accordance with a new concept called polarized development, which implied the creation of growth poles which could potentially influence on the hinterland development; industry in mid-sized cities, and the creation of
transport infrastructure. In a nutshell, the plan intended to limit the further concentration of industry in the four largest industrial zones of Japan and narrow the gap between the various regions’ development levels.
THE INDUSTRIAL LOCATION POLICY: In response to the 1st Comprehensive National Development Plan, 15 new industrial cities mainly outside the Pacific Belt Zone and six special areas for industrial consolidation in the Pacific Belt Zone were specified (Fig 7). As part of concrete measures of the growth pole strategy, the Law to Promote the Construction of New Industrial Cities was enacted in 1962 (repealed in 2001) and the Law on the Promotion of the Development of Special Areas for Industrial Consolidation was enacted in 1964 (also repealed in 2001). According to these laws, heavy and chemical industrial sites were to be constructed along the coastal areas nationwide.
Pacific Belt Zone
Douou area
Akita Bay area
Niigata area
Hachinohe area
Sendal Bay area
Iwaki-kooriyama areaKashima area
Matsumoto Suwa area
Higashi-suruga areaHigashi-mikawa area
Minami area, Okayama Pref.Tokushiama area
Toyo areaOita areaHyga/Nobeoka area
Shiramui/Ariake/Omuta area
Bingo areaChukai area
Harima area
Toyama/Takaoka area
New industrial city
Special areas for industrial consolidation
Shunan area
Figure 6 Pacific Belt Zone as part of Income-Doubling Plan
Figure 7 New industrial cities and special areas for industrial consolidation as part of 1st CNDP

15Case Study on Territorial Development in Japan
INSTITUTIONAL FRAMEWORK: Until 1974, the Economic Planning Agency, responsible for developing Territorial Development Plans held jurisdiction over the Comprehensive National Land Development Act, Comprehensive National Development Plan, regional development plans for Tohoku, etc. The National Capital Region Development Committee, Kinki Region Development Headquarters, and Chubu Region Development Headquarters under the Prime Minister’s Office were responsible for plans and development in the three largest metropolitan areas – Tokyo, Osaka, and Nagoya respectively. The Ministry of Home Affairs took care of the promotion of underpopulated regions.
TRANSPORT INVESTMENTS: The 1960s saw great improvement in the economy, including the railways. In 1965, when the economic miracle set in, the Tōkaidō Shinkansen, the first modern high-speed rail line connecting Tokyo and Osaka opened up. An expressway between Nagoya and Osaka was also completed, enhancing the connectivity.
The highway network as of 1965 (Tokaido Shinkansen and Meishin Expressway)
Figure 8 Development of high-speed transportation networks during 1st CNDP
REGIONAL INCOME INEQUALITIES: Period between 1960s to 1970s observed rapid economic growth and an increase in economic
and income disparities between rural and urban areas. This was addressed through spatial policies covered under the 1st CNDP of promoting balanced development nationwide and local industrial promotion.
NEW (THE 2ND) COMPREHENSIVE NATIONAL DEVELOPMENT PLAN
During the continuing economic growth, problems related to national development, including urban problems and regional disparities, were becoming more serious; the need for correction was vociferously advanced.
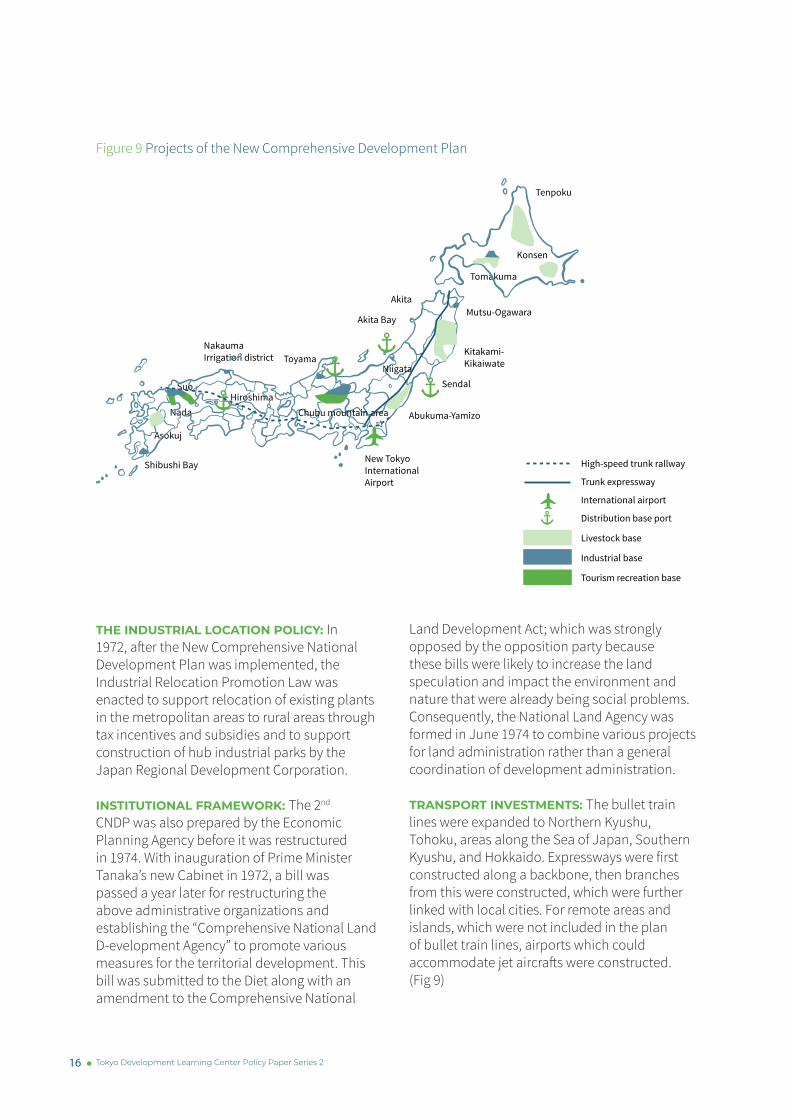
The New Comprehensive National Development Plan (1969) proposed a large-scale development project, which comprised construction of a nationwide transportation network of rapid national railways/ bullet rail (“Shinkansen”) and expressway network and industrial complexes, farming, and sightseeing sites along this infrastructure. Measures were also taken to relocate industries from over-concentrated areas (“removal areas”) to less developed areas (“promotion areas”). The network of express traffic services (Fig 9) was developed in response to strong demands of local governments and produced great effects, including improved convenience for citizens and businesses, promotion of industrial relocation to rural areas, fostering high-value added agriculture, and promotion of tourism. The development of the network systems enabled local economic development and de-concentration of the metropolitan areas.
After formulating the Plan, realization of various other projects was also considered, but some of those were forced to be postponed or reviewed because of unfavorable circumstances, such as issues of increasing environmental pollution, and starting of oil crisis from 1973.
16 Tokyo Development Learning Center Policy Paper Series 2
Figure 9 Projects of the New Comprehensive Development Plan
High-speed trunk rallway
Trunk expressway
International airport
Distribution base port
Livestock base
Industrial base
Tourism recreation base
Shibushi Bay
Asokuj
Nada
SuoHiroshima
NakaumaIrrigation district Toyama
New Tokyo International Airport
Akita Bay
Akita
Abukuma-Yamizo
Sendal
Kitakami-Kikaiwate
Mutsu-Ogawara
Tenpoku
Konsen
Tomakuma
Chubu mountain area
Niigata
THE INDUSTRIAL LOCATION POLICY: In 1972, after the New Comprehensive National Development Plan was implemented, the Industrial Relocation Promotion Law was enacted to support relocation of existing plants in the metropolitan areas to rural areas through tax incentives and subsidies and to support construction of hub industrial parks by the Japan Regional Development Corporation.
INSTITUTIONAL FRAMEWORK: The 2nd CNDP was also prepared by the Economic Planning Agency before it was restructured in 1974. With inauguration of Prime Minister Tanaka’s new Cabinet in 1972, a bill was passed a year later for restructuring the above administrative organizations and establishing the “Comprehensive National Land D-evelopment Agency” to promote various measures for the territorial development. This bill was submitted to the Diet along with an amendment to the Comprehensive National
Land Development Act; which was strongly opposed by the opposition party because these bills were likely to increase the land speculation and impact the environment and nature that were already being social problems. Consequently, the National Land Agency was formed in June 1974 to combine various projects for land administration rather than a general coordination of development administration.
TRANSPORT INVESTMENTS: The bullet train lines were expanded to Northern Kyushu, Tohoku, areas along the Sea of Japan, Southern Kyushu, and Hokkaido. Expressways were first constructed along a backbone, then branches from this were constructed, which were further linked with local cities. For remote areas and islands, which were not included in the plan of bullet train lines, airports which could accommodate jet aircrafts were constructed. (Fig 9)

17Case Study on Territorial Development in Japan
DECLINE IN REGIONAL INCOME INEQUALITY: Per capita income inequality amongst Japanese prefectures began to narrow down since the first half of the 1970s and generally remained at a low level, except some fluctuations (Fig 10). During the period of 2nd CNDP, efficient transport network was developed and this enabled the development of regions and areas outside Pacific Belt Zone too. The gap was subsequently reduced by uplifting rural income through the following measures - a) improving productivity with development of manufacturing sector, where underproductive agriculture had previously been the most important industry, and b) substantial increase in public investments. The reduction in regional income inequality also led to the slowing down of the population migration from rural to urban areas. This was owing to sluggish income growth and employment absorption rate in the largest metropolitan areas because of the decreased economic growth rate, resulting in lower population inflow. Slower economic growth could also be attributed to the decentralization of the industries and increased
Figure 10 Income Disparity Ratio over the CNDP Period
0.14
0.13
0.12
0.11
0.10
0.09
0.08
0.07
0.061955 1960 1965 1970 1975 1980 1985 1990 1995 2000 Year
1st Plan 2nd Plan 3rd Plan 4th Plan 5th Plan
0.134
0.079
0.070
Source: Regional economic accounting (Cabinet Office), National Census Report and Annual Population Report (Ministry of Internal Affairs and Communication)
public investment in rural areas, which perhaps retained the workforce in the underproductive rural areas. This phase also marked the end of the peak rural-to-urban migration by post-war baby boomers (1947-49), that were migrating for college or work.
THE 3RD COMPREHENSIVE NATIONAL DEVELOPMENT PLAN
As Japan’s economy was shifting from the rapid growth to the stable growth phase, the concentration of the population in the three metropolitan areas slowed down. The population census conducted in 1980 showed population growth in each of the 46 prefectures other than Tokyo. The 3rd Comprehensive National Development Plan (1977) was intended to harmonize nature, life, and production with human habitation. This Plan shifted its focus to living environments rather than industrial infrastructure, placing importance on the development of settlement areas and a balanced placement of educational, cultural, and medical facilities.
18 Tokyo Development Learning Center Policy Paper Series 2
To promote the 3rd Comprehensive National Development Plan, a model settlement area was constructed for each prefecture, and various projects were implemented for the development of the residential environment, specifically featuring preservation and use of traditional culture and historic properties within the region.
With discontent over the Pacific Belt Zone initiative, sub-national governments were
1
Figure 11 Model Settlement Areas based on the 3rd Comprehensive National Development Plan
looking for targeted investments in the lagging regions. This led to the surge of “localism” against a backdrop of improved socio-economic conditions. During this period, governors and mayors of local governments along with the citizens initiated voluntary regional activities for growth and development, based on their local advantageous characteristics. An example of one such program was the “One Village One Product” movement. It began in Ōita Prefecture in 1979 when the then-governor advocated the program. Communities selectively began to produce goods with high added value. One village produced one competitive and staple product as a business to gain sales revenue to improve the standard of living for the residents of that village, such as shiitake, kabosu, greenhouse mikan, beef, aji, and barley shōchū. Over 300 such products were selected.
INDUSTRIAL LOCATION POLICY: A short time after the 3rd Plan, the Ministry of International Trade and Industry proposed the idea of Technopolis, aiming at promotion of local industries with the development and transfer of technologies as the driving force, focusing on cutting-edge technologies and regional development with linkages between industry, universities, and living environments for the 26 areas specified under the Technopolis Law (1983).
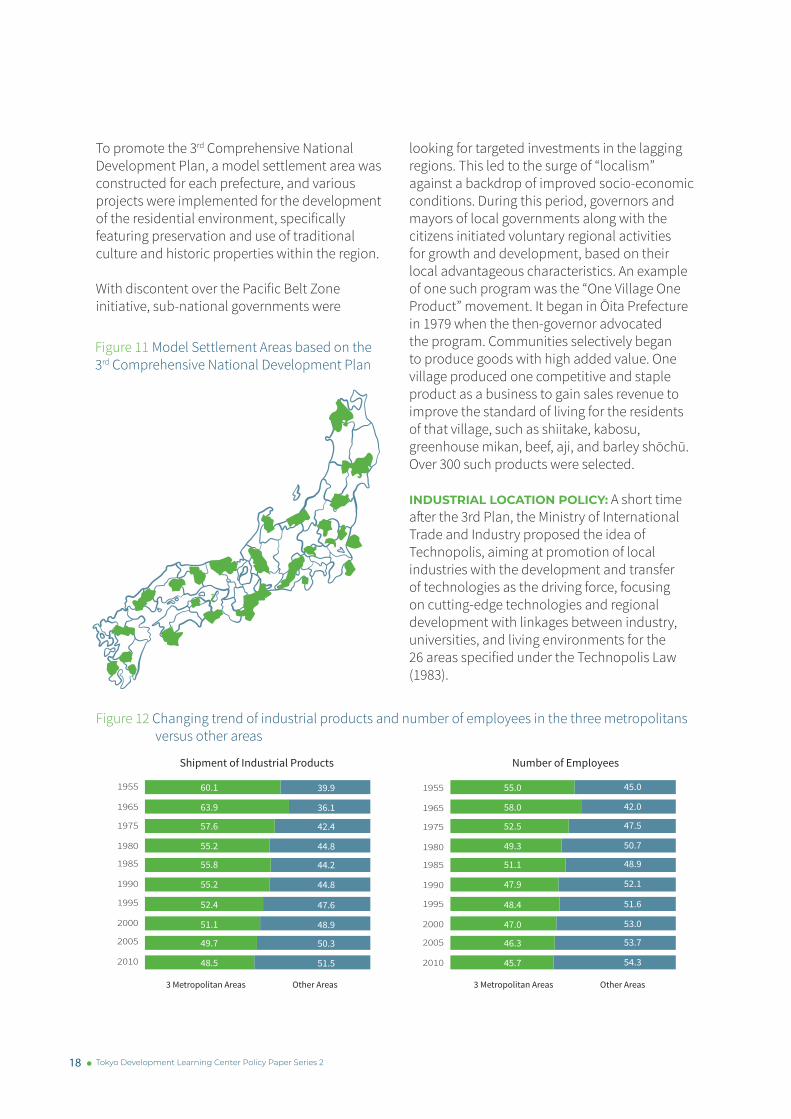
Figure 12 Changing trend of industrial products and number of employees in the three metropolitans versus other areas
60.1
63.9
57.6
55.2
55.8
55.2
52.4
51.1
49.7
48.5
55.0
58.0
52.5
49.3
51.1
47.9
48.4
47.0
46.3
45.7
39.9
36.1
42.4
44.8
44.2
44.8
47.6
48.9
50.3
51.5
45.0
42.0
47.5
50.7
48.9
52.1
51.6
53.0
53.7
54.3
Shipment of Industrial Products Number of Employees
3 Metropolitan Areas Other Areas 3 Metropolitan Areas Other Areas
1955
1965
1975
1980
1985
1990
1995
2000
2005
2010
1955
1965
1975
1980
1985
1990
1995
2000
2005
2010

19Case Study on Territorial Development in Japan
INSTITUTIONAL FRAMEWORK: The National Land Agency instituted in 1974, worked on the Comprehensive National Development Plans, development of metropolitan regions, and territorial development policy, including promotion of rural areas, along with land-related measures and disaster prevention. The 3rd–5th CNDPs were prepared by the Agency. The Agency worked with the Ministry of Construction; Ministry of Transport; Ministry of Agriculture, Forestry and Fisheries; Ministry of Industry and Trade; and Ministry of Home Affairs for planning and promoting measures, as a general coordinator, because its work was closely related with social infrastructures and other related measures. Personnel exchanges were also adopted.
TRANSPORT INVESTMENTS AND POLICIES: In 1980 Japanese National Railways (JNR), a state-owned public corporation was reorganized under the JNR Reconstruction Act, which mandated low-profit railway lines to be abandoned. Portliner, Japan’s first automated guideway transit (AGT) was opened in Kobe in 1981. One of the world’s first driverless urban transit systems, this urban AGT system is operated by Kobe New Transit. A huge turning point was the privatization of JNR to Japan Railways Group in 1987.
REGIONAL INCOME INEQUALITY: Trends in the early 1980s point towards increasing trend in the income inequalities in the regions, with changes in financial reforms directing increased investments in Tokyo metropolitan area. The gap widened further in the 4th CNDP phase.
THE 4TH COMPREHENSIVE NATIONAL DEVELOPMENT PLAN
In the 1980s, concentration of higher levels of urban functions and re-concentration of the population in the Greater Tokyo Area were prominently visible. This was a result of many factors – a) land prices in Tokyo declined due to higher supply than demand b) Building Standards Law 1970 was revised incorporating higher permissible FARs of the buildings as per
the 1968 City Planning Law revisions c) the city offered a better living environment, free from pollution of industrial zones, especially after the citizens’ movement for livable environment as articulated and dealt by 3rd CNDP. Ultimately, higher concentration in the region stemmed up issues of soaring land values, monetary easing, and others. This necessitated the formulation of the 4th CNDP in 1987.
The 4th Comprehensive National Development Plan (1987) aimed to address the issue of overconcentration in the Greater Tokyo Area. Targeting the year 2000, it approached the de-concentration of big cities by creating the multiple satellite cities with different characteristics, known as “multipolar patterned national land”. The satellite cities shall be connected via interactive network systems. This meant to build an information and communication system and “a transportation network enabling one-day trips,” the development of an expressway network across the country, which could enable people to go to and return from major cities in a single day. It described the distribution strategy of the population and economical activities by transferring the Public administrative institutions to the sub-centers.
The Fourth Plan differs from earlier plans with its emphasis on the National Capital Region (NCR) and its positive role that it plays in the development of Japan. The NCR was divided into two zones - the Tokyo Metropolitan Area and the ‘Outer Areas’. This strategy envisaged the development of the NCR as a national and international center of political, economic and cultural activities. The NCR’s interrelation with its suburbs (Outer Areas) as well as other regional urban centers was seen within a supportive multicore framework, where natural and man-made environments also received prominence. One of the characteristics of this policy was that it positioned Tokyo as the pivotal city, supported by the other smaller cities and sub-centers, and put it on the world map in the era of globalization and information-driven economy. Such policies reflect a turning point where Tokyo

20 Tokyo Development Learning Center Policy Paper Series 2
Figure 13 Increase and Distribution of “Daily Exchange Population”
(1970) (1985) (Future)
30 %15 30 % 7 15 %
0 7 %
Ratio of the daily interchangeable population to the total population of Japan
Daily interchangeable population is the total number of people living within a range that can be reached within about 3 hours on one way starting from a certain point.Consider each capital of the prefecture as a main point of the prefecture, calculation is carried out based on the shortest time distance between these main point.For the future transportation system, it is assumed with the case the development of the high-speed transportation system was made during the planning period in the description of the text.
1.
2.
3.
Note: “Daily exchange population” refers to the sum of the people residing in all areas within 3-hours of travel from a given point. The legend indicates the percentage of this “daily exchange population” against the national population. Hence, the higher this percentage, the more people one can exchange/ interact in a day travel (no stayover days).
was accepted as a hub of the economy, and the strategy became about managing concentration in the Greater Tokyo Area (rather than fighting concentration).
THE INDUSTRIAL LOCATION POLICY: After the establishment of 4th Comprehensive National Development Plan, the development of research parks for software and design industries based on the Key Facilities Siting Law (1988) and development of business parks based on the Act Concerning the Promotion of the Development of Regional Core Urban Areas and the Relocation of Facilities for Industrial Business (1992) was promoted in rural areas. These policies led to considerable progress in industrial decentralization and aimed at attracting businesses to rural areas, in line with the local characteristics, to overcome barriers in business activities and to promote balanced territorial development and regional vitalization through the development of an industrial infrastructure (both hard and soft), subsidization, preferential
treatment in financial services and tax breaks, and deregulation.
INSTITUTIONAL FRAMEWORK: In 1986, the National Land Agency of Japan published the Development Plan for the National Capital Region and the outline of the 4th Comprehensive National Development Plan.
TRANSPORT INVESTMENTS: In 1988 the zairaisen (3’6” gauge) networks of Hokkaido and Shikoku were connected to Honshu following the opening of the Seikan Tunnel (the longest railway tunnel in the world until 2016) and the Great Seto Bridge, with the Shinkansen network extended to Hakodate following the dual-gauging of the Seikan Tunnel in 2016.
Focusing on harnessing concentration in Tokyo, the subway system of the city was further strengthened with opening of “Tokyo Metro Namboku Line”. As of 2015, Tokyo’s subway network comprises 278 stations and 13 lines covering a total system length of 304.1 kilometers (189.0 mi).
21Case Study on Territorial Development in Japan
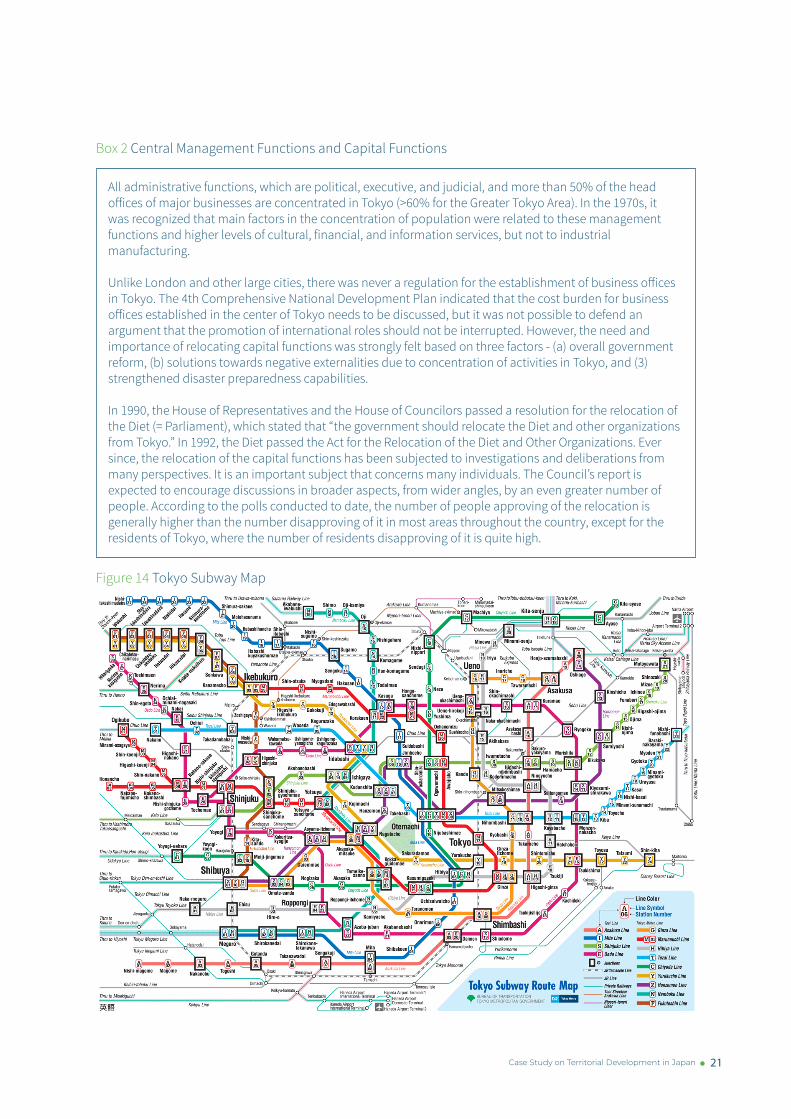
Box 2 Central Management Functions and Capital Functions
All administrative functions, which are political, executive, and judicial, and more than 50% of the head offices of major businesses are concentrated in Tokyo (>60% for the Greater Tokyo Area). In the 1970s, it was recognized that main factors in the concentration of population were related to these management functions and higher levels of cultural, financial, and information services, but not to industrial manufacturing.
Unlike London and other large cities, there was never a regulation for the establishment of business offices in Tokyo. The 4th Comprehensive National Development Plan indicated that the cost burden for business offices established in the center of Tokyo needs to be discussed, but it was not possible to defend an argument that the promotion of international roles should not be interrupted. However, the need and importance of relocating capital functions was strongly felt based on three factors - (a) overall government reform, (b) solutions towards negative externalities due to concentration of activities in Tokyo, and (3) strengthened disaster preparedness capabilities.
In 1990, the House of Representatives and the House of Councilors passed a resolution for the relocation of the Diet (= Parliament), which stated that “the government should relocate the Diet and other organizations from Tokyo.” In 1992, the Diet passed the Act for the Relocation of the Diet and Other Organizations. Ever since, the relocation of the capital functions has been subjected to investigations and deliberations from many perspectives. It is an important subject that concerns many individuals. The Council’s report is expected to encourage discussions in broader aspects, from wider angles, by an even greater number of people. According to the polls conducted to date, the number of people approving of the relocation is generally higher than the number disapproving of it in most areas throughout the country, except for the residents of Tokyo, where the number of residents disapproving of it is quite high.
Figure 14 Tokyo Subway Map
22 Tokyo Development Learning Center Policy Paper Series 2
REGIONAL INCOME INEQUALITY: In the late 1980s and until 1990’s regional income inequality widened (Fig 10) and the population inflow increased in the Greater Tokyo area during this boom period. Financial institutions increased their loan for investment in stocks and real estate, especially in the Tokyo metropolitan area, as it became one of the major international financial and information centers in the world, following the deregulation and liberalization of the financial sector in Japan. As a result, the prices of stocks and real estate increased conspicuously, and their respective capital gain brought huge wealth tothe investors creating wealth inequalities, which was later dealt with land price control policy. However, this bubble economy collapsed in the early 1990s with a drastic fall in the prices of stocks and real estate, and the Japanese economy entered a period of long recession and subsequently reversal of trends. THE 5TH COMPREHENSIVE NATIONAL DEVELOPMENT PLAN - GRAND DESIGN FOR THE 21ST CENTURY
With approaching of 21st Century, it was clear that the new century will undoubtedly bring with it an increased consciousness of nature and the limited resources on the globe, and raise people’s hopes of leading comfortable and dignified lives in which they can enjoy both economic wealth and intellectual satisfaction. As a prerequisite to providing this kind of life, a national land plan is necessary to lead the country toward the following goals: maintaining socioeconomic vitality as the sources of affluence; conserving and recovering the natural environment in order to soothe and heal the human spirit by its blessings; creating the basis for a culture that brings fulfillment and significance to human activities; and providing its citizens with the capability to choose their own lifestyles from various possibilities. This led to the proposal and development of the “Grand Design for the 21st Century” in 1998.
The 5th Comprehensive National Development Plan targeted to promote regional independence and create a beautiful national land with inter-regional cooperation as a national policy for the 21st century. The plan aimed to strategize based on the following policy agendas, which seemed to be the need of 21st century.
1. Significant changes in national consciousness: this period observed changes in people’s values towards – a) placing more importance on quality than on quantity, on comfortable living than on higher income b) giving significance to freedom to choose and on self-responsibility c) realizing that nature is a precious part of life and importance of natural environment d) believing in equal opportunity and equal responsibility for men and women in society.
2. Global age: increasing threat to the
environment from global warming and other factors may lead to restricted supplies of food, resources and energy on a global scale. In response to such concerns, international systems were planned to be strengthened to preserve the global environment and to promote the circulatory use of resources. In these circumstances, the efforts to conserve the natural environment as a common asset of the future generations and the global community are being undertaken. Also, it was realized that regional competition will intensify beyond national boundaries. To survive the competition, each region needs to have its own many-sided attractions, including a high quality of life environment, richness in nature and culture, substantiality of the intellectual resources, efficiency of industrial infrastructure, a high-quality transportation infrastructure, and especially accessibility to the global network. For regions to develop in the right way, drastic reforms must be made to the socioeconomic system to change the existing high-cost structure.

23Case Study on Territorial Development in Japan
3. Decreasing population and aging society: Japan’s population growth has been slowing rapidly mainly because of the declining birthrate. Concurrently, the number of elderly will increase further. In the aging society of the 21st century, the economic growth rate will fall off and availability of investment will decrease. To counteract this trend, Japan is promoting economic efficiency and technical innovation, and pursuing well-focused and more efficient investment in the infrastructure. With a stagnant population growth, the necessity to transform into urban land use style to support an increasing population, will diminish at a country level. Instead, the possibility to develop land from a long-term viewpoint needs to be explored.
4. Highly informatized society: From the beginning of the 21st century, restrictions caused by time and distance will be overcome on both national and global scales, and two-way communications almost “face-to-face,” will be possible. As a result, information and communications will take on dramatically greater roles, in various socioeconomic aspects. New industries will appear in the field of information and communications. Regional communities, which has suffered from disadvantages that include limited accumulation, and the distance from the large cities, will have greater opportunities to develop themselves. To lead regional development, the efforts to utilize global information networks will be one of the significant factors.
Addressing these agendas and issues, this plan developed the new land structure, focusing on the following concept. • First, the hierarchical inter-city structure
with Tokyo at the top has created a “hub and dependent satellites” relationship. This hierarchy needs to be flattened to create one based on independence and mutual support, to pursue merits through
interregional cooperation and interactions of cities over the wide range.
• Second, comfortable living conditions must be supported by more efficient production, distribution and consumption. Each region should be developed to provide wide-ranging functions including protecting and restoring the natural environment and creating new cultures and lifestyles.
• Third, each region should have the facilities to conduct international exchange and be able to provide the most advanced urban functions, not only according to their role within the regional structure of Japan, but also as a member of the Asian Pacific region and of the global society.
Looking forward, Japan’s declining, and aging population, in fact raises the importance of allowing concentration in a few dynamic, high-amenity, places that can be serviced efficiently, rather than trying to spread a dwindling population across the country. With a declining population increasingly concentrated in the Pacific Belt/Tokyo (see Figure 15), maintaining the connective infrastructure built may impose a difficult fiscal burden, which is a forward-looking challenge of Japan’s largely successful investments in quality connective infrastructure. The other map on the right displays the areas which the government deems will be abandoned by 2050 - it is estimated that 20% of current inhabited area will become abandoned, and the total inhabited area nationwide will decrease from 50% of the territory to 40%.
INDUSTRIAL LOCATION POLICY: Most of the industrial location policies achieved their goals by this period and were repealed in around 2000 when the economy was globalizing. As a substitute for these policies, new regional industrial policies, such as the Industrial Cluster Policy, were promoted, but these policies covered the largest metropolitan areas and had different characteristics from previous industrial location policies, which aimed at balanced territorial development.
INSTITUTIONAL FRAMEWORK: While the 5th

24 Tokyo Development Learning Center Policy Paper Series 2
CNDP was prepared under the jurisdiction of the National Land Agency, administrative reforms for territorial and other sector developments were initiated during this period. Prime Minister Hashimoto’s Cabinet, which took office in 1996, raised the idea of administrative reform as an important issue. The Administrative Reform Council which was formed immediately under the Prime Minister mainly discussed the reform of the central government ministries and the enhancement of the Prime Minister’s Office functions. Consequently, the central government was reformed from one Cabinet and 22 ministries to one Cabinet and 12 ministries. As part of the reform, the Ministry of Land, Infrastructure, Transport and Tourism (MLIT) was established, integrating the Ministry of Construction, Ministry of Transport, National Land Agency, and Hokkaido Development Agency, responsible for the comprehensive and systematic development and use of the national land, and resulted in consistent development of infrastructure. MLIT was established in January 2001 and took over the role of the National Land
Agency, except disaster prevention. The 1st and 2nd National Spatial Strategies were developed by MLIT.
TRANSPORT INVESTMENTS: This plan focused on improving the transportation and communications systems while considering harmony with nature, safety and the environment, based on suitable role-sharing between the public and private sectors as well as between the national and local governments. Under this plan, projects were designed to provide equal access to diversified functions that will help each region to become broadly independent, including employment opportunities and advanced urban services, establish transportation and communications systems that are convenient and easy to use even for the elderly at reasonable prices.
DECLINE IN REGIONAL INCOME INEQUALITY: Despite increasing concentration of activity and population, Japan in 2010 recorded the second lowest inter-regional Gini co-efficient for GDP per
Figure 15 Current Distribution of Population Figure 16 Prospective Abandoned Areas by 2050
Population density01-99100-299300-9991,000-2,9993,000-4,999Over 5,000
Prospective areas to be abandoned by 2050
Source: National Census 2010
Source: Intermediate results from “Long-term Prospects of Territorial Development” (2011)

25Case Study on Territorial Development in Japan
2.40
2.30
2.20
2.10
2.00
1.90
1.80
1.70
1.60
1.50
1.401955 1960 1965 1970 1975 1980 1985 1990 1995 2000 2005
2.32
1.98
1.581.57
Figure 17 Ratio difference in the average per-capita income between the top five and the bottom five prefectures
Source: Prepared based on the Cabinet Office, “Prefectural Accounts” and the Ministry of Internal Affairs and Communications, “Population Census Report” and “Annual Report on Current Population Estimates”
Note: The prefectural incomes between FY1955 and FY1989 are based on 68 SNA (System of National Accounting); those from FY1990 are based on 93SNA.
capita in the OECD and the lowest disparities in the OECD between predominantly urban and rural regions, reflecting, among other things, a long-standing commitment to well-defined levels of infrastructure and service provision across the country. In 2000’s, Japan exhibited
a commendably lower difference of average per-capita income between the top five and the bottom five prefectures, which has reduced significantly from 1960, as shown in figure 17.
CHANGE IN THE OUTLOOK TOWARDS
26 Tokyo Development Learning Center Policy Paper Series 2
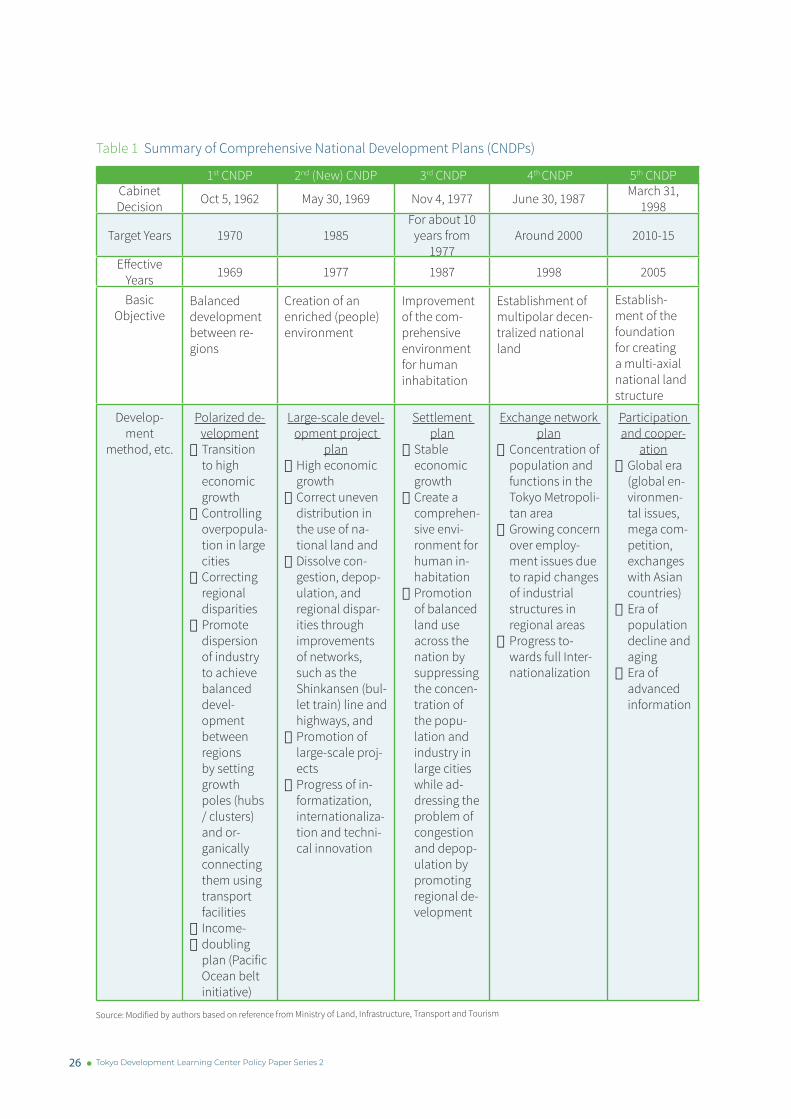
Table 1 Summary of Comprehensive National Development Plans (CNDPs)
Source: Modified by authors based on reference from Ministry of Land, Infrastructure, Transport and Tourism
1st CNDP 2nd (New) CNDP 3rd CNDP 4th CNDP 5th CNDPCabinet Decision Oct 5, 1962 May 30, 1969 Nov 4, 1977 June 30, 1987 March 31,
1998
Target Years 1970 1985For about 10
years from 1977
Around 2000 2010-15
Effective Years 1969 1977 1987 1998 2005
Basic Objective
Balanced development between re-gions
Creation of an enriched (people) environment
Improvement of the com-prehensive environment for human inhabitation
Establishment of multipolar decen-tralized national land
Establish-ment of the foundation for creating a multi-axial national land structure
Develop-ment
method, etc.
Polarized de-velopment
·Transition to high economic growth
·Controlling overpopula-tion in large cities
·Correcting regional disparities
·Promote dispersion of industry to achieve balanced devel-opment between regions by setting growth poles (hubs / clusters) and or-ganically connecting them using transport facilities
·Income-·doubling
plan (Pacific Ocean belt initiative)
Large-scale devel-opment project
plan·High economic
growth ·Correct uneven
distribution in the use of na-tional land and
·Dissolve con-gestion, depop-ulation, and regional dispar-ities through improvements of networks, such as the Shinkansen (bul-let train) line and highways, and
·Promotion of large-scale proj-ects
·Progress of in-formatization, internationaliza-tion and techni-cal innovation
Settlement plan
·Stable economic growth
·Create a comprehen-sive envi-ronment for human in-habitation
·Promotion of balanced land use across the nation by suppressing the concen-tration of the popu-lation and industry in large cities while ad-dressing the problem of congestion and depop-ulation by promoting regional de-velopment
Exchange network plan
·Concentration of population and functions in the Tokyo Metropoli-tan area
·Growing concern over employ-ment issues due to rapid changes of industrial structures in regional areas
·Progress to-wards full Inter-nationalization
Participation and cooper-
ation·Global era
(global en-vironmen-tal issues, mega com-petition, exchanges with Asian countries)
·Era of population decline and aging
·Era of advanced information
27Case Study on Territorial Development in Japan
THE TERRITORIAL DEVELOPMENT POLICY
Five Comprehensive National Development Plans were formulated from the 1960s to the 1990s to give direction to territorial development based on the philosophy of “balanced territorial development.” They had successfully uplifted the Japanese cities and people, ensured balanced regional income disparities, improved public facilities and infrastructure, added element of nature and beauty in Japanese settlements and people’s attitude, and overall improved the quality of life. However, it was realized later that the unipolar structure concentrated in Tokyo and the Pacific Belt Region was not yet entirely redressed. There were still many provincial areas troubled by outmigration to central urban districts and it was becoming a serious problem in local cities. In metropolitan areas, issues such as over congestion of urban districts were issues in terms of disaster prevention and living environment. Furthermore, the landscape also quite disordered due to the sprawl in
suburbs, and the land use lacked harmony with its surroundings in rural areas. Land and water contamination and dumping of illegal wastes became threatening social problems. With effectiveness of Omnibus Decentralization Act in 2000, roles played by the national and local governments largely changed with local authorities becoming more autonomous than hierarchical, which also meant more opportunities for decentralized development under the aegis and guidance of the central government and that could not be supported with the CNDP framework. All the above led to the need for restructuring planning systems aligned with spatial, economic, social, political, and governance requirements of the 21st century.
With approaching of the new century, urban renaissance became an important theme in the national policy under Prime Minister Koizumi. The policy aimed at the promotion of economic revitalization and increase in Tokyo’s global competitiveness, and the philosophy of “balanced territorial development” diminished.
28 Tokyo Development Learning Center Policy Paper Series 2
3. ECONOMIC AND ADMINISTRATIVE POLICIES AND CONCEPTS IMPACTING SPATIAL DEVELOPMENTS
INVESTMENT IN SOCIAL OVERHEAD CAPITAL
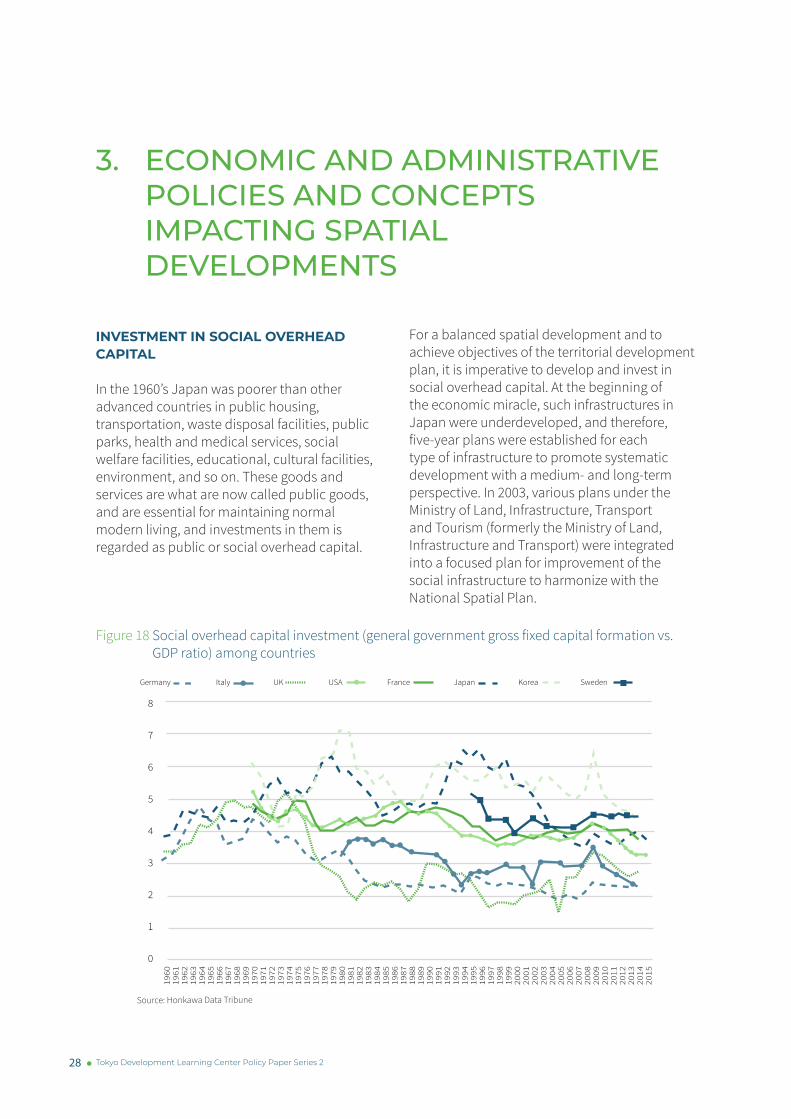
In the 1960’s Japan was poorer than other advanced countries in public housing, transportation, waste disposal facilities, public parks, health and medical services, social welfare facilities, educational, cultural facilities, environment, and so on. These goods and services are what are now called public goods, and are essential for maintaining normal modern living, and investments in them is regarded as public or social overhead capital.
For a balanced spatial development and to achieve objectives of the territorial development plan, it is imperative to develop and invest in social overhead capital. At the beginning of the economic miracle, such infrastructures in Japan were underdeveloped, and therefore, five-year plans were established for each type of infrastructure to promote systematic development with a medium- and long-term perspective. In 2003, various plans under the Ministry of Land, Infrastructure, Transport and Tourism (formerly the Ministry of Land, Infrastructure and Transport) were integrated into a focused plan for improvement of the social infrastructure to harmonize with the National Spatial Plan.
Source: Honkawa Data Tribune
Figure 18 Social overhead capital investment (general government gross fixed capital formation vs. GDP ratio) among countries
8
7
6
5
4
3
2
1
0
France
1960
1961
1962
1963
1964
1965
1966
1967
1968
1969
1970
1971
1973
1985
1986
1987
1988
1989
1990
1991
1974
1975
1976
1977
1979
1980
1981
1982
1983
1984
1972
1978
1992
1993
1994
1996
2008
2009
2010
2011
2012
2013
2014
1997
1998
1999
2000
2002
2003
2004
2005
2006
2007
1995
2001
2015
Germany Italy Korea SwedenUK USA Japan

29Case Study on Territorial Development in Japan
Source: Cabinet Office (Tottori, Aomori, Tokyo, Aichi and Osaka Prefectures – top to bottom)
Figure 19 Ratio of Administrative Capital Investment per Capita
200
180
160
140
120
100
80
601960 1965 1970 1975 1980 1985 20101990 1995 2000 2000
Tottori Aomori Tokyo Aichi Osaka
As can be seen in figure above, from the 1970s to the 2000s, Japan continued to invest more in social overhead capital compared to many other countries, before it plummeted suddenly in the beginning of 21st century and then stabilized. The decline in investments was because of severe financial constraints and an increase in social security payments.
With respect to regional allocation of social capital overhead investment, the investment amount per capita was higher in the largest metropolitan cities than in rural prefectures in the 1960s; however, the trend reversed after that period, except during the economic bubble years.
REFORM OF THE PLANNING SYSTEM
The Comprehensive National Land Development Act was amended in 2005 and was renamed as the National Spatial Planning Act. The revision points included i) a change from development-centric approaches to planning for a mature society for quality of life, ii) a system to forward
proposals from local governments and obtain feedback from citizens, and iii) a double-layered system to unite the National and Regional Plans for regional independence into a partnership between national and regional governments.
Under the new system, the 1st National Spatial Strategy (NSS) was established in 2008 with the Region Plans for Tohoku, Kyushu, and other regions launching the following year and the 2nd NSS was established in 2015 and subsequent Regional Plans in 2016.
PROMOTION OF UNDERDEVELOPED AREAS
Parliament members implemented laws for remote islands, mountain villages, and heavy-snow areas far from the metropolitan cities, which were under severe natural conditions, and faced issues of depopulation and declining vitality. Under these laws, various support measures were undertaken, including securing public works budgets, increasing government subsidies, and implementing human-related
30 Tokyo Development Learning Center Policy Paper Series 2
measures (e.g., promotion of tourism, industrial development, and maintenance of transportation services).
DECLINE IN REGIONAL INCOME INEQUALITY
As noted earlier, inter-regional inequalities in income in Japan have been much lower than many other developed countries, perhaps comparable to Nordic countries. High concentrations of population and economic activity with low territorial disparities has been a prominent characteristic in Japan since 1980’s. There are many reasons which are attributed, and sometimes speculated for Japan’s low regional income inequality. 1. Japan has traditionally been a highly
centralized country with a strong commitment to territorial cohesion. It is possible that the extremely high rate of urbanization lowers the rural-urban inequalities because of the lower relative weight of the rural population lowers the cost of policies aimed at improving service provision outside the cities and raising the standard of living of rural dwellers.
2. Data suggests that there is a labour market equilibrium in Japan that serves to limit wage disparities across areas.
3. Indicators such as health, safety, and jobs rank very high for Japan compared to other OECD countries explained by higher investments in these sectors, further
reducing the inter-regional inequality. 4. It is believed that the leading driver of
increased inequality in the developed world is the accumulation of wealth by those who are already wealthy, driven by a rate of return on capital that consistently exceeds the rate of GDP growth. Japan has a high income-tax rate for the rich (45%), and the inheritance tax rate recently was raised to 55%, which makes it difficult to accumulate capital over generations – a trend that is considered as a significant driver of inequality.
In Japan, geography of production has been controlled through strategies and policies for an equitable growth. However, the concept of providing good standard of living to the people, wherever they are, was never given any less priority. This has been achieved through strong public services and progressive tax and transfer policies applied everywhere, that capture the benefits of a strong economy and reinvest them to ensure equitable living standards for all. Japan has been successful in achieving ‘flattened’ standard of living, while allowing the concentration of production for high growth.
Looking forward, Japan’s declining, and aging population, raises the importance of allowing concentration in a few dynamic, high-amenity places that can be serviced efficiently, rather than trying to spread a dwindling population across the country.
31Case Study on Territorial Development in Japan
4. KEY MESSAGE ON TERRITORIAL PLANNING
Territorial development or planning is typically associated with the spatial integration or geographical scale of development. It could mean development of specific areas or territories, which could be urban, metropolitan, regional or rural jurisdiction. However, in a more technical sense, territorial development is an integrated multi-sector development, guided by a spatial vision of the desirable future and supported by strategic investments in physical infrastructure and environmental management. Learning from the good practices of territorial planning world-wide, three key points come forward that must be considered while making the plans.
1. Concentration: create generic capital for an uncertain future economyThe concept promotes putting in place the foundational capital that will be essential to productivity for any future economy. This focuses on building on existing agglomerations and facilitating comparative advantage, which is achieved by promoting cities with strong institutions and broad-purpose infrastructure. It includes developing quality institutions; fluid factor markets; broad-purpose infrastructure; and human capital. Dense and highly-educated work forces provide the support pillar.
2. Connectivity: connect markets nationally and internationallyThis refers to addressing “soft” connectivity constraints with the same effort as physical transport infrastructure, such as roads and railways. This means access to labor markets, information and services, and goods. Connecting markets promotes specialization of production across places, and production at scale, both of which are key to productivity. For economic growth, it is critical to connect cities with each other domestically, and with global markets externally. Investments in connectivity deserve a central place in industrial and social policy.
3. Convergence: decent living standards everywhereThis emphasizes the concept that people everywhere deserve decent living standards and opportunities, while firms and institutions may concentrate, and that reduces regional disparities. Therefore, instead of trying to flatten the geography of production, aim should be to ‘flatten’ the geography of living standards and human capital. This could be achieved by taking advantage of high urbanization and local connectivity, to deliver strong public services for all, and address human capital deficiencies.

This work is product of the staff of the World Bank Group with external contributions. The findings, interpretations, and conclusions expressed in this work do not necessarily reflect the views of the World Bank Group, its Board of Executive Directors, or the governments they represent. Nothing herein shall constitute or be considered to be a limitation upon or waive of the privileges and immunities of the World Bank Group, all of which are specifically reserved.
The Tokyo Development Learning Center (TDLC) program is a partnership of Japan and the World Bank Group. TDLC supports and facilitates strategic World Bank Group and client country collaboration with select Japanese cities, agencies and partners for joint research, knowledge exchange, capacity building and other activities that develop opportunities to link Japanese and global expertise with specific project-level engagements in developing countries to maximize development impact.
World Bank Group Social, Urban, Rural and Resilience Global PracticeTokyo Development Learning Center (TDLC) Program