Embed Size (px)
Citation preview
Tognum Investor PresentationNovember 2010
Dr. Ulrich DohleExecutive Vice President and CTO Technology and Operations
Frankfurt, November 18, 2010
Slide 2 | Tognum Investor Presentation | November 2010
Legal disclaimer
This presentation is for information purposes only and does not constitute an offer to sell or a solicitation for an offer to buy any securities. The shares of Tognum AG will not be registered under the U.S. Securities Act of 1933.
This presentation includes certain forward-looking statements. These forward-looking statements can be identified by the use of forward-looking terminology, including the words "believes", "estimates", "anticipates", "expects", "assumes", "predicts", "intends", "may", "will" or "should", and similar expressions. Such forward-looking statements involve risks and uncertainties because they relate to events and depend on circumstances that may or may not occur in the future. Such forward-looking statements do not represent any guarantees of future performance. Tognum's actual results of operations, including its financial condition and profitability as well as the development of the general economic conditions in which it operates, may differ materially from (and be more negative than) those made in or suggested by the forward-looking statements contained in this presentation.
This presentation also includes certain market and market share data. To our knowledge, there is no single, comprehensive source that reliably describes the overall market and its sub-markets or the competitive situation in the market breakdown presented herein. Unless indicated otherwise, all the statements herein concerning the market and competition are therefore based on our own estimates, some of which have in turn been derived from a variety of sources. It is possible that the actual market conditions and competition may differ from the situation described herein, or that other market participants may come up with different estimates of the market and competitive conditions.
Slide 3 | Tognum Investor Presentation | November 2010
Business model & outlook
Slide 4 | Tognum Investor Presentation | November 2010
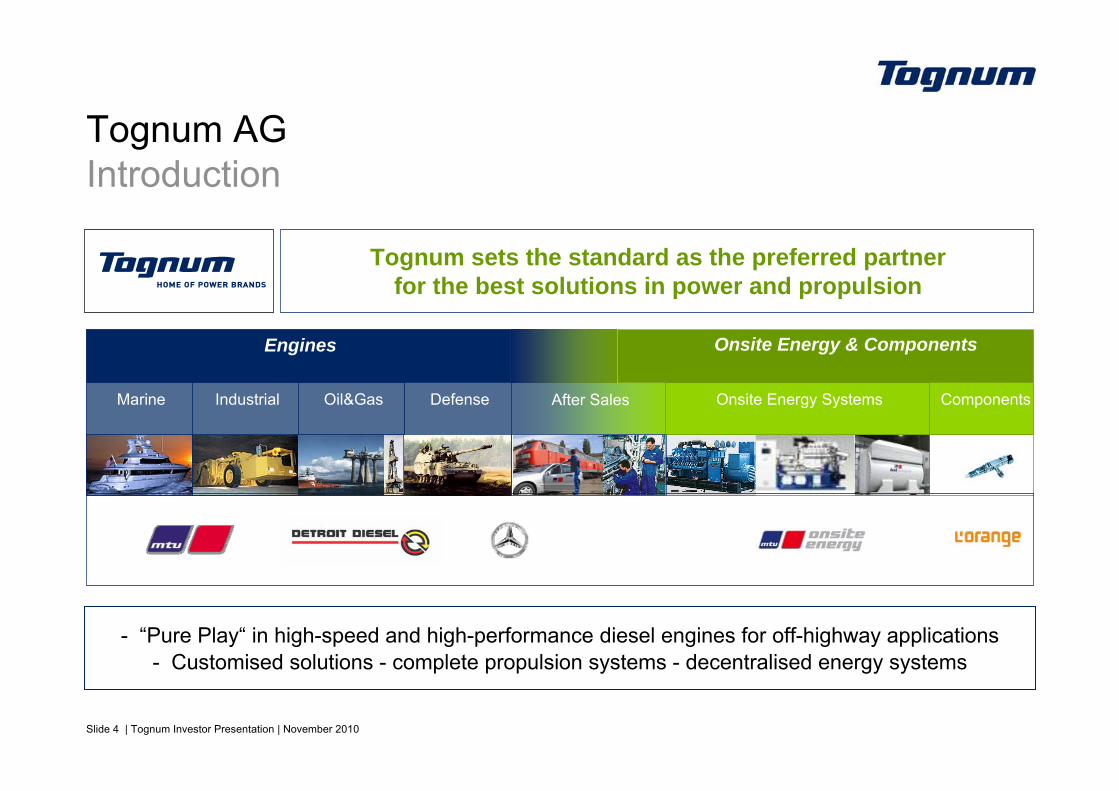
Tognum AGIntroduction
IndustrialMarine Oil&Gas After Sales Onsite Energy Systems
Engines Onsite Energy & Components
ComponentsDefense
Tognum sets the standard as the preferred partner for the best solutions in power and propulsion
- “Pure Play“ in high-speed and high-performance diesel engines for off-highway applications- Customised solutions - complete propulsion systems - decentralised energy systems
Slide 5 | Tognum Investor Presentation | November 2010
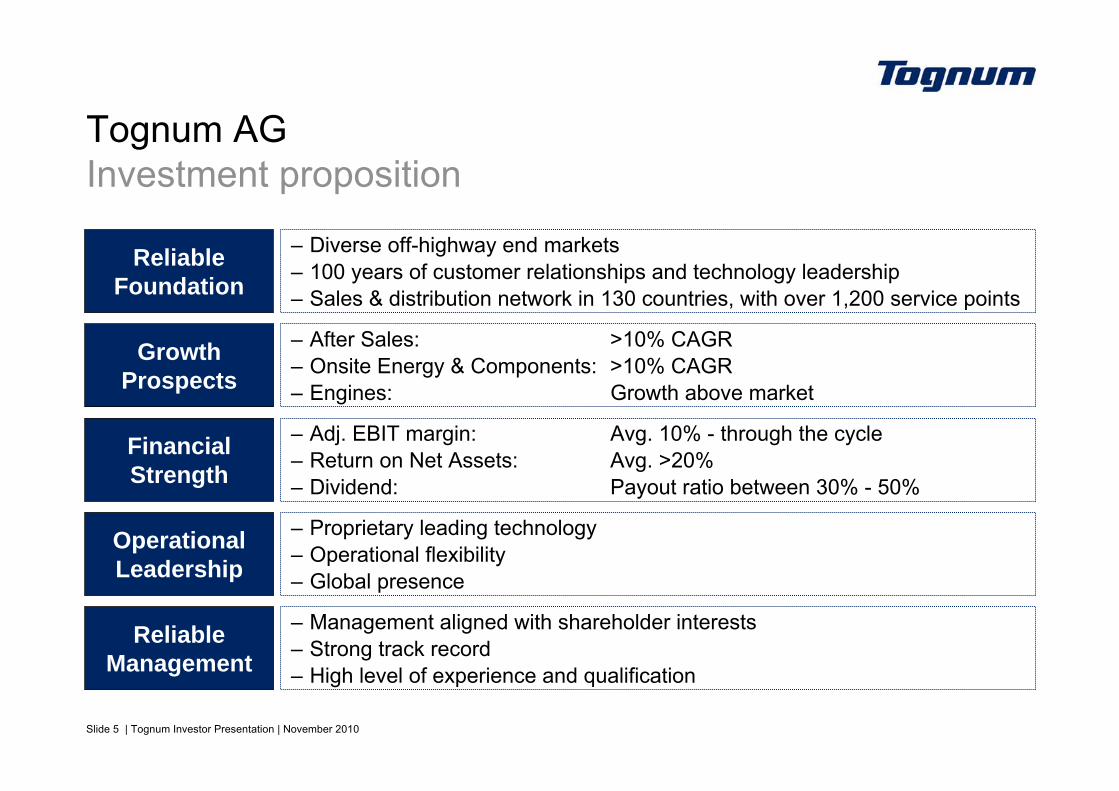
Tognum AG Investment proposition
Reliable Foundation
Growth Prospects
– Diverse off-highway end markets– 100 years of customer relationships and technology leadership– Sales & distribution network in 130 countries, with over 1,200 service points
Financial Strength
Operational Leadership
Reliable Management
– Management aligned with shareholder interests – Strong track record– High level of experience and qualification
– Proprietary leading technology– Operational flexibility– Global presence
– Adj. EBIT margin: Avg. 10% - through the cycle– Return on Net Assets: Avg. >20%– Dividend: Payout ratio between 30% - 50%
– After Sales: >10% CAGR– Onsite Energy & Components: >10% CAGR– Engines: Growth above market
Slide 6 | Tognum Investor Presentation | November 2010
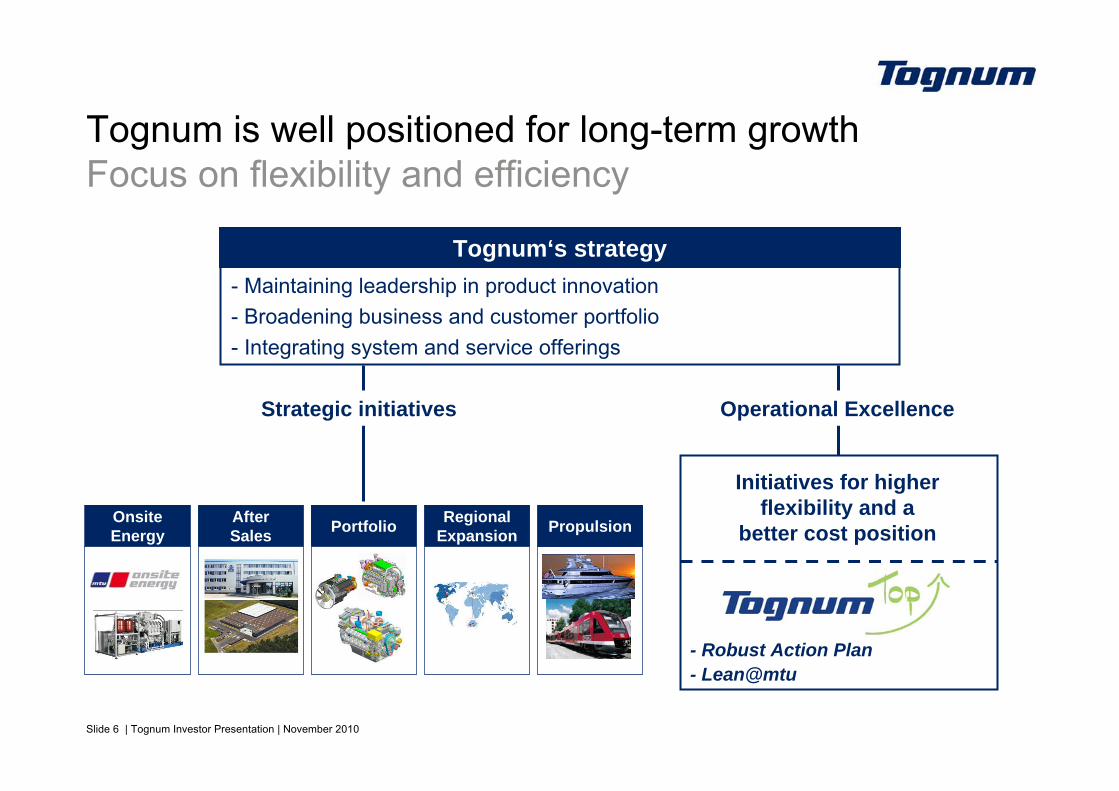
After Sales
Tognum is well positioned for long-term growthFocus on flexibility and efficiency
- Maintaining leadership in product innovation- Broadening business and customer portfolio- Integrating system and service offerings
Tognum‘s strategy
Operational Excellence
Portfolio
Strategic initiatives
Onsite Energy
Regional Expansion
- Robust Action Plan- Lean@mtu
Propulsion
Initiatives for higher flexibility and a
better cost position
Slide 7 | Tognum Investor Presentation | November 2010
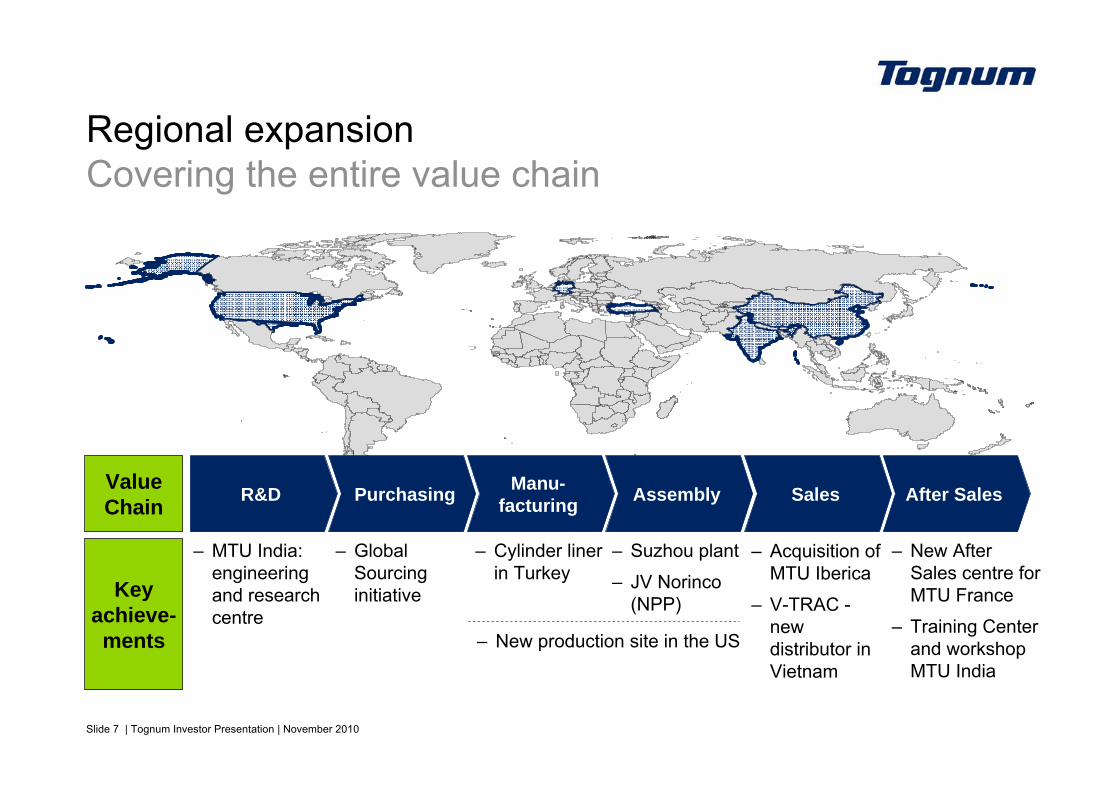
Regional expansionCovering the entire value chain
R&D Purchasing Manu-facturing Assembly Sales After Sales
– MTU India: engineering and research centre
– Global Sourcing initiative
– New production site in the US
– Acquisition of MTU Iberica
– V-TRAC -new distributor in Vietnam
– New After Sales centre for MTU France
– Training Center and workshop MTU India
– Cylinder liner in Turkey
– Suzhou plant
– JV Norinco(NPP)
ValueChain
Key achieve-ments
Slide 8 | Tognum Investor Presentation | November 2010
Intelligent R&D
Slide 9 | Tognum Investor Presentation | November 2010
Intelligent R&DManaging the emission challenge
► Efficient solutions to meet upcoming emission standards
► Tognum keeps key technology know-how in-house
► Focus to achieve optimised combustion process
► Developing new engine series (lower power range) and new engine generations (S 2000 / S 4000)
► Competitive advantage and optimum solutions in all our applications for our customer base
► Customer benefits through engines with superior fuel consumption and low total cost of ownership
Slide 10 | Tognum Investor Presentation | November 2010
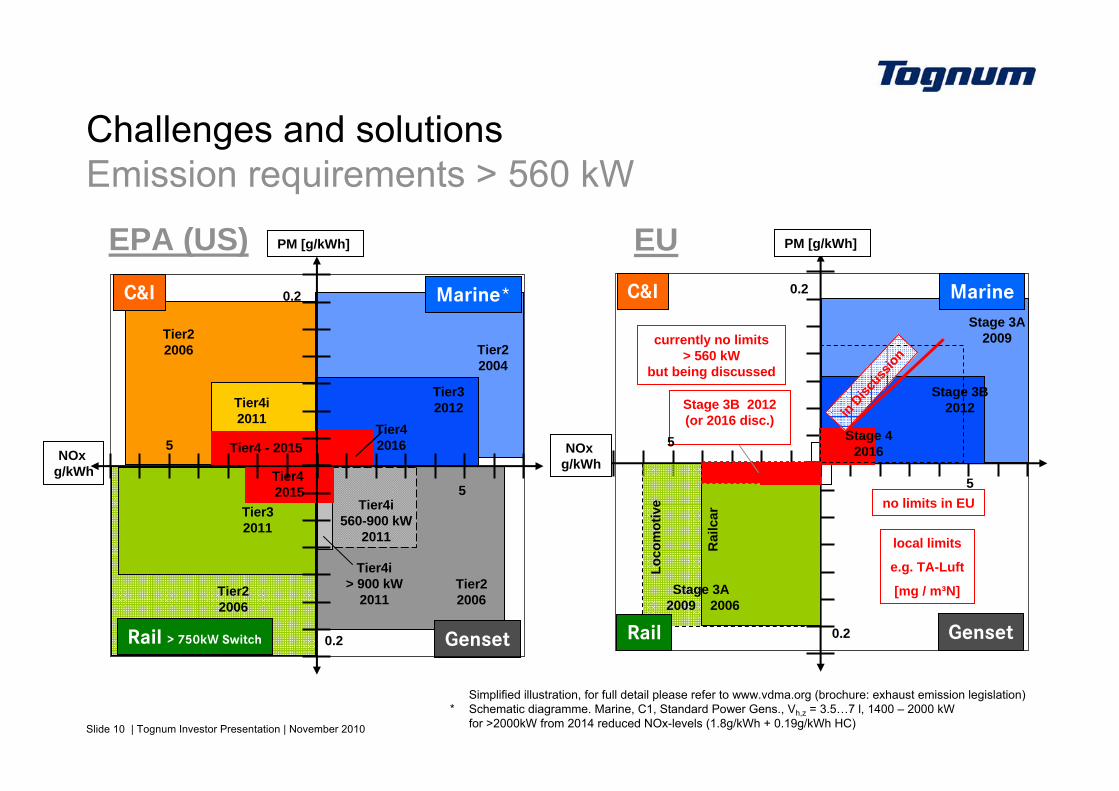
Simplified illustration, for full detail please refer to www.vdma.org (brochure: exhaust emission legislation)* Schematic diagramme. Marine, C1, Standard Power Gens., Vh,z = 3.5…7 l, 1400 – 2000 kW
for >2000kW from 2014 reduced NOx-levels (1.8g/kWh + 0.19g/kWh HC)
Challenges and solutions Emission requirements > 560 kW
C&I
RailLo
com
otiv
e
Rai
lcar
Marine
Genset
Stage 3A 2009 2006
Stage 3B 2012(or 2016 disc.)
EU
Stage 3A2009
Stage 3B2012in D
iscus
sion
currently no limits> 560 kW
but being discussed
no limits in EU
local limits
e.g. TA-Luft
[mg / m³N]
NOx g/kWh
PM [g/kWh]
5
5
0.2
0.2
Stage 42016
EPA (US)Marine*
Tier22004
Tier32012
Tier42016
NOx g/kWh
PM [g/kWh]
C&I
Tier22006
Tier4i2011
Tier4 - 20155
0.2
Genset
Tier22006
Tier4i560-900 kW
2011
Tier4i> 900 kW
2011
5
0.2Rail > 750kW Switch
Tier32011
Tier22006
Tier4 2015
Slide 11 | Tognum Investor Presentation | November 2010
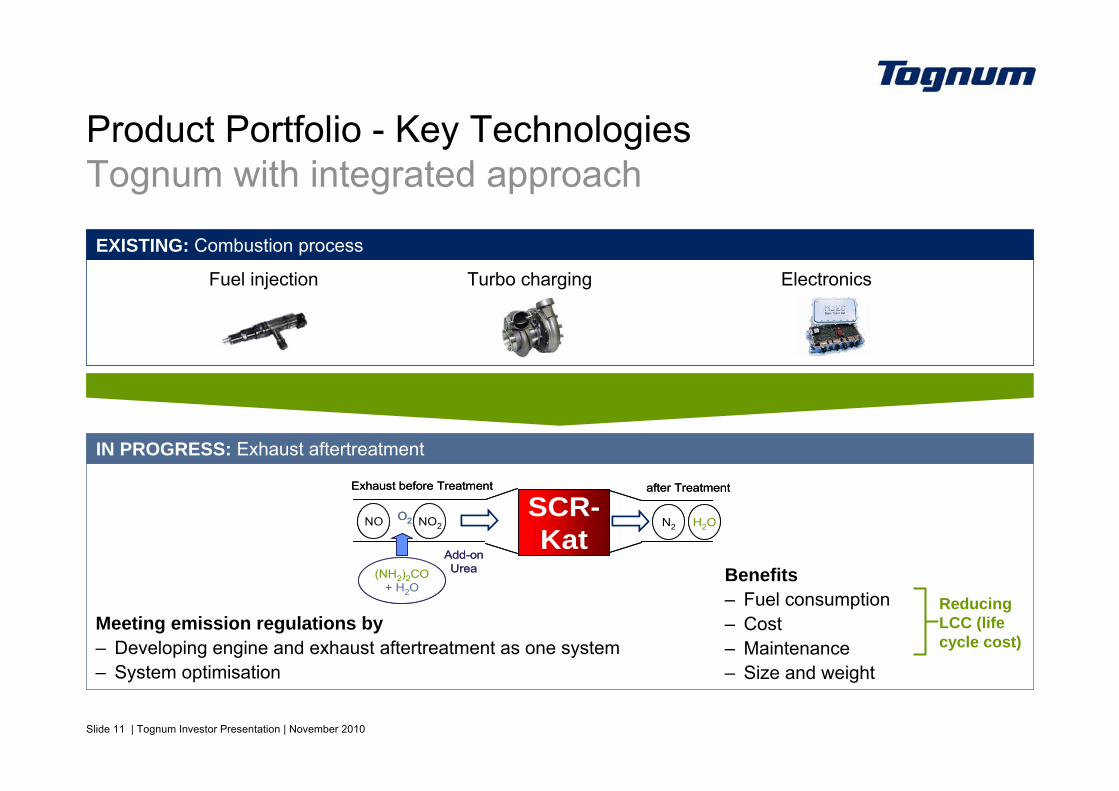
IN PROGRESS: Exhaust aftertreatment
Benefits– Fuel consumption– Cost– Maintenance– Size and weight
EXISTING: Combustion process
Fuel injection Turbo charging Electronics
Reducing LCC (life cycle cost)
NO2O2NO
Exhaust before Treatment
N2 H2O
after Treatment
SCR-Kat
(NH2)2CO+ H2O
Add-onUrea
NO2O2NO
Exhaust before Treatment
N2 H2O
after Treatment
SCR-Kat
(NH2)2CO+ H2O
Add-onUrea
Meeting emission regulations by – Developing engine and exhaust aftertreatment as one system– System optimisation
Product Portfolio - Key TechnologiesTognum with integrated approach
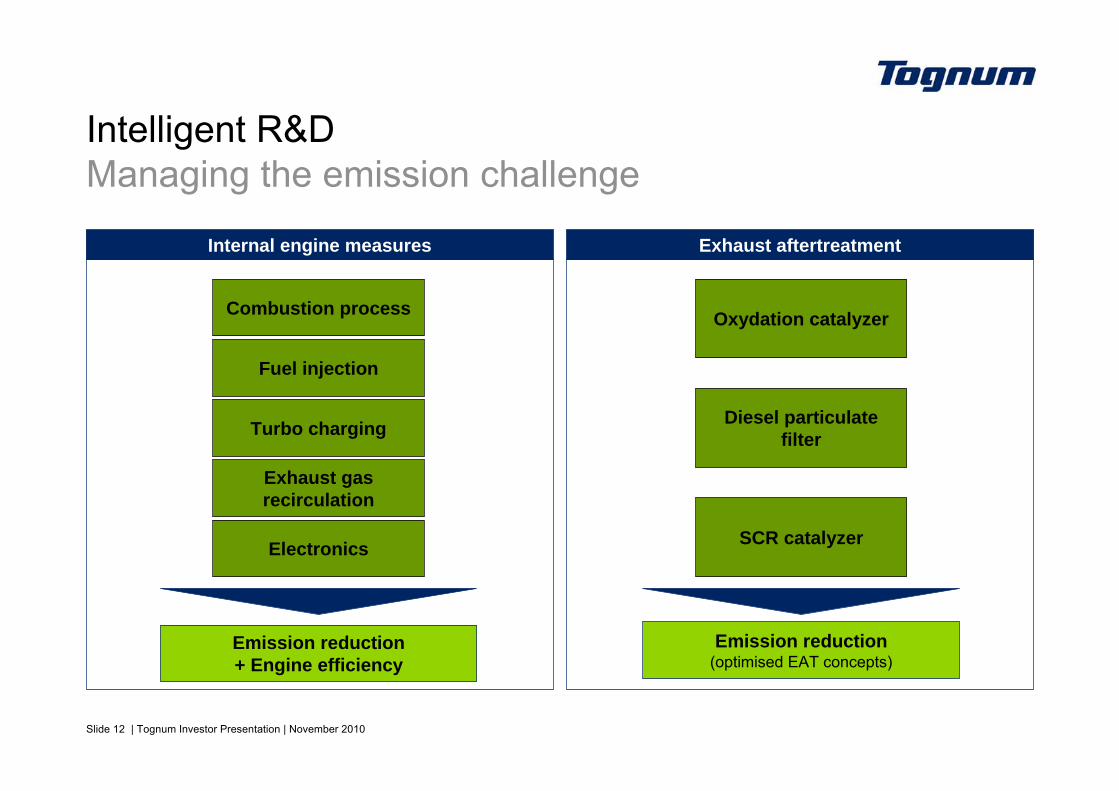
Slide 12 | Tognum Investor Presentation | November 2010
Intelligent R&DManaging the emission challenge
Internal engine measures
Combustion process
Exhaust gas recirculation
Turbo charging
Emission reduction+ Engine efficiency
Fuel injection
Electronics
Exhaust aftertreatment
Oxydation catalyzer
Diesel particulate filter
SCR catalyzer
Emission reduction(optimised EAT concepts)
Slide 13 | Tognum Investor Presentation | November 2010
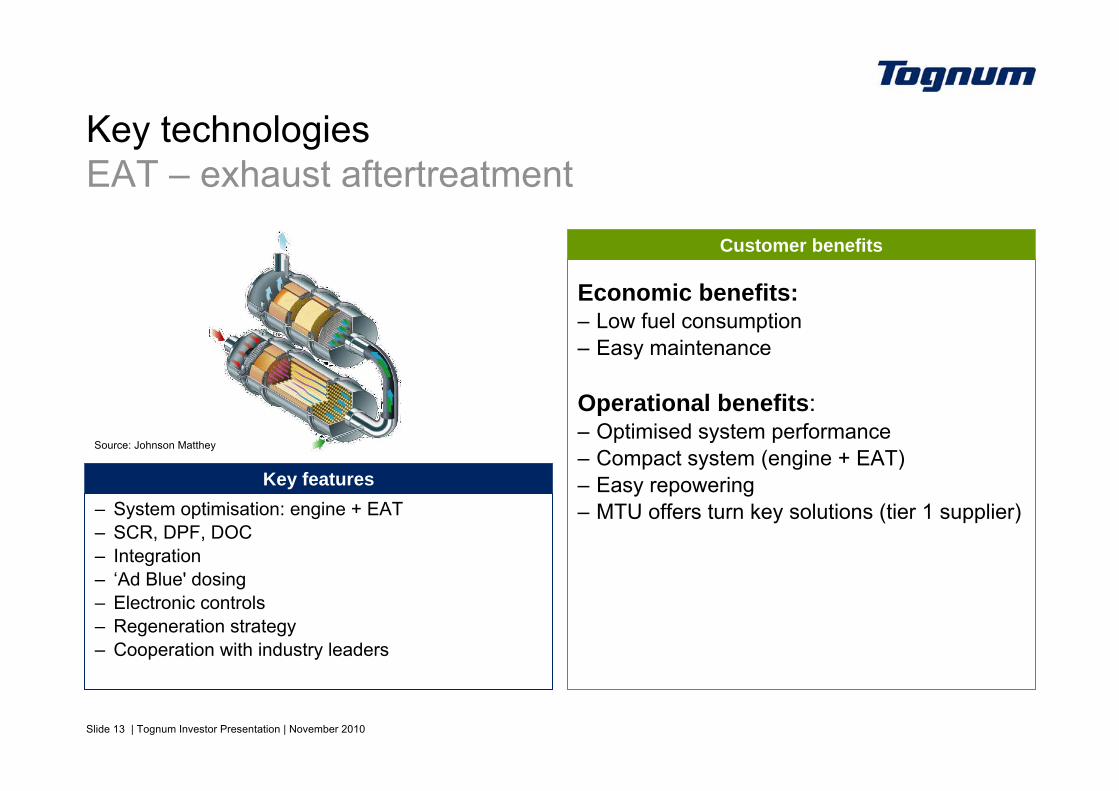
Key technologiesEAT – exhaust aftertreatment
Customer benefits
Key features– System optimisation: engine + EAT– SCR, DPF, DOC– Integration– ‘Ad Blue' dosing– Electronic controls– Regeneration strategy– Cooperation with industry leaders
Economic benefits:– Low fuel consumption– Easy maintenance
Operational benefits:– Optimised system performance– Compact system (engine + EAT)– Easy repowering– MTU offers turn key solutions (tier 1 supplier)
Source: Johnson Matthey
Slide 14 | Tognum Investor Presentation | November 2010
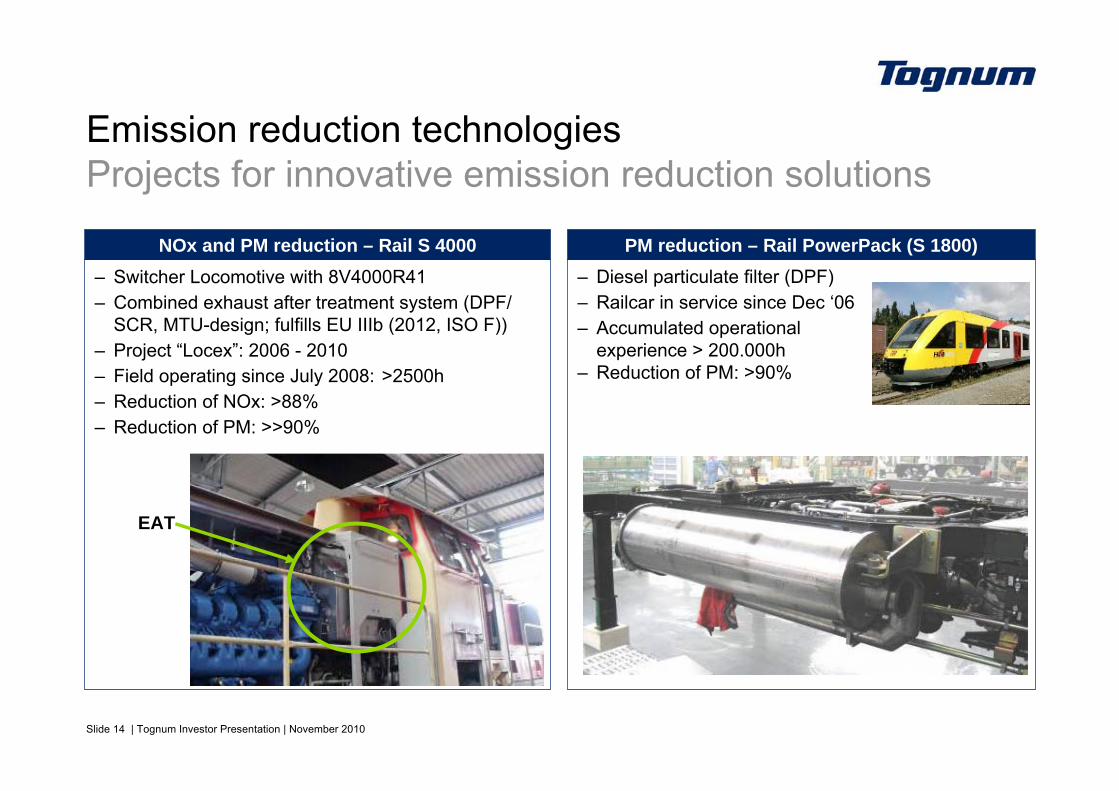
– Diesel particulate filter (DPF)– Railcar in service since Dec ‘06– Accumulated operational
experience > 200.000h– Reduction of PM: >90%
PM reduction – Rail PowerPack (S 1800)– Switcher Locomotive with 8V4000R41– Combined exhaust after treatment system (DPF/
SCR, MTU-design; fulfills EU IIIb (2012, ISO F))– Project “Locex”: 2006 - 2010– Field operating since July 2008: >2500h– Reduction of NOx: >88%– Reduction of PM: >>90%
NOx and PM reduction – Rail S 4000
Emission reduction technologiesProjects for innovative emission reduction solutions
EAT
Slide 15 | Tognum Investor Presentation | November 2010
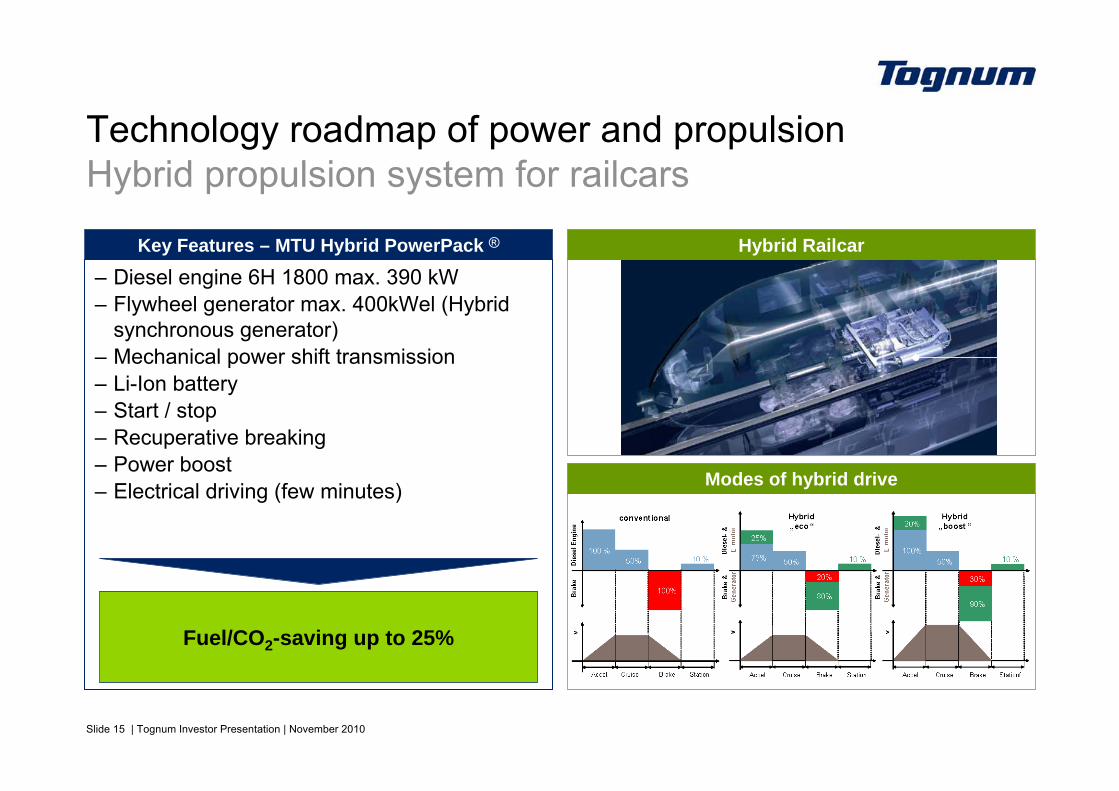
Technology roadmap of power and propulsionHybrid propulsion system for railcars
Key Features – MTU Hybrid PowerPack ®
– Diesel engine 6H 1800 max. 390 kW– Flywheel generator max. 400kWel (Hybrid
synchronous generator) – Mechanical power shift transmission– Li-Ion battery– Start / stop– Recuperative breaking– Power boost– Electrical driving (few minutes)
Fuel/CO2-saving up to 25%
Modes of hybrid drive
Hybrid Railcar
Slide 16 | Tognum Investor Presentation | November 2010
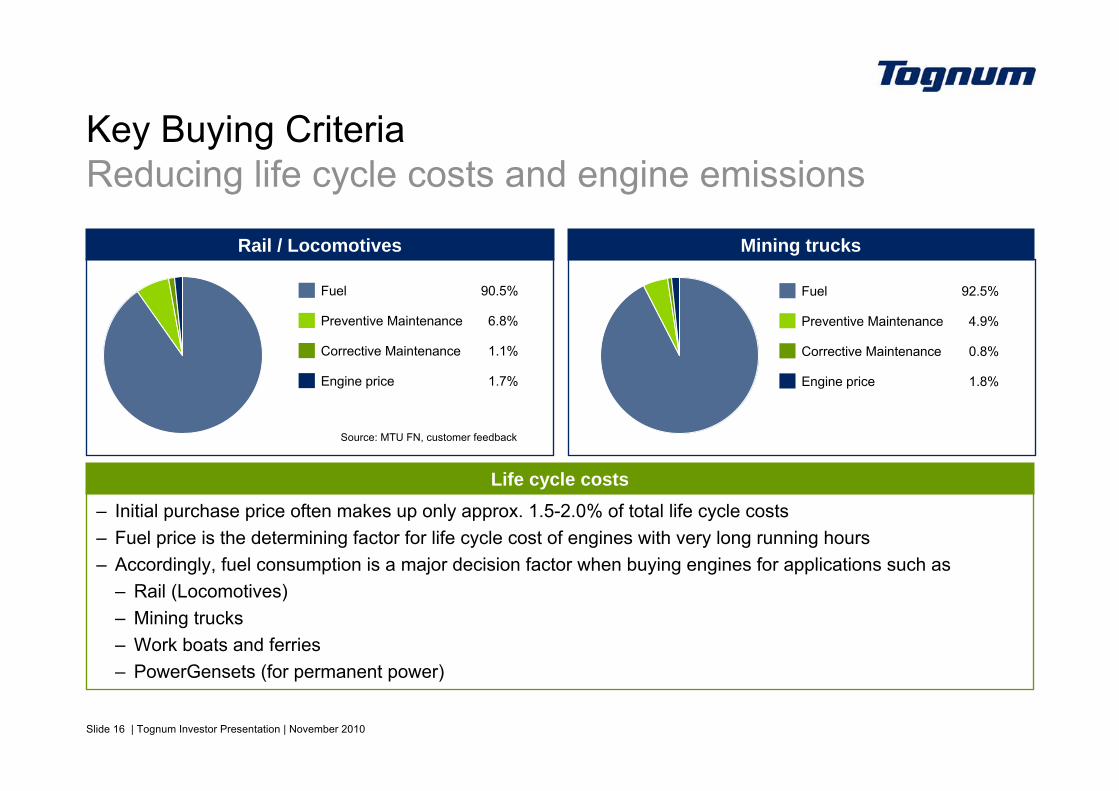
Rail / Locomotives Mining trucks
Life cycle costs
Key Buying CriteriaReducing life cycle costs and engine emissions
– Initial purchase price often makes up only approx. 1.5-2.0% of total life cycle costs– Fuel price is the determining factor for life cycle cost of engines with very long running hours – Accordingly, fuel consumption is a major decision factor when buying engines for applications such as
– Rail (Locomotives)– Mining trucks– Work boats and ferries– PowerGensets (for permanent power)
Fuel 90.5%
Preventive Maintenance 6.8%
Corrective Maintenance 1.1%
Engine price 1.7%
Fuel 92.5%
Preventive Maintenance 4.9%
Corrective Maintenance 0.8%
Engine price 1.8%
Source: MTU FN, customer feedback

Slide 17 | Tognum Investor Presentation | November 2010
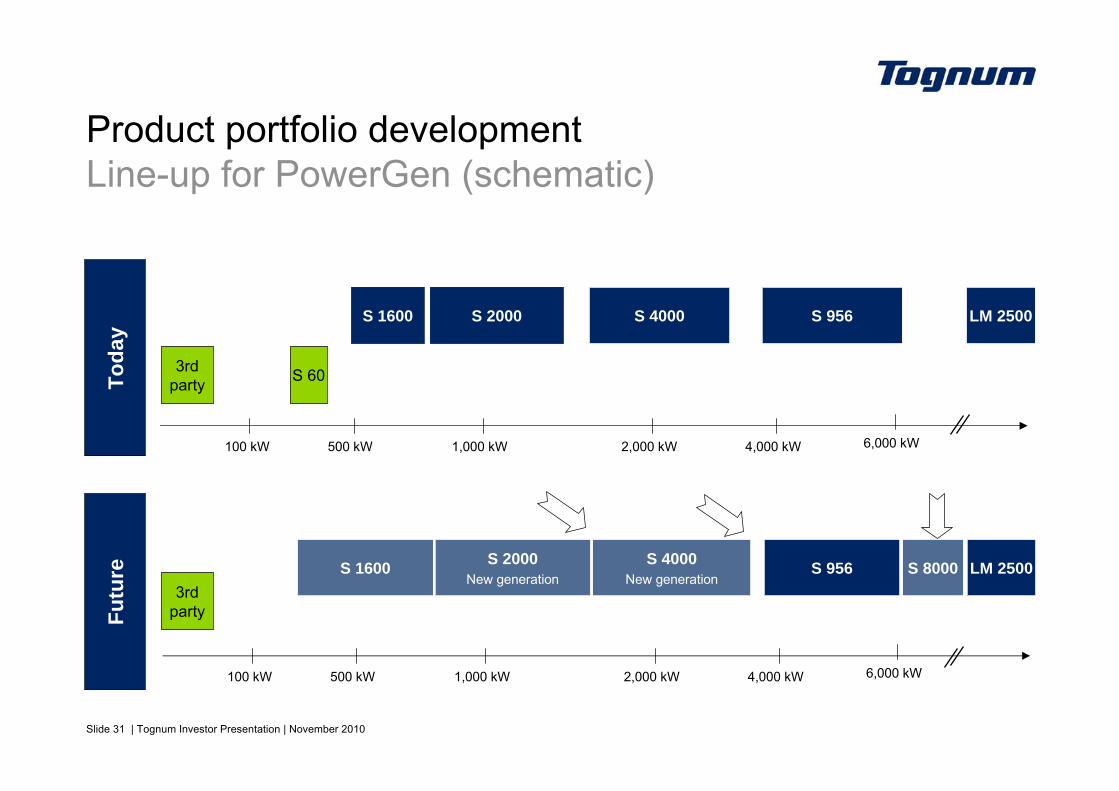
Product portfolio developmentLine-up for PowerGen (schematic)
Toda
y
S 4000S 2000
S 60
Futu
re S 4000New generation
S 2000New generation
S 1600
100 kW 500 kW 4,000 kW2,000 kW1,000 kW 6,000 kW
S 956
S 8000
100 kW 500 kW 4,000 kW2,000 kW1,000 kW 6,000 kW
S 956
S 1600
3rd party
3rd party
LM 2500
LM 2500
Slide 18 | Tognum Investor Presentation | November 2010
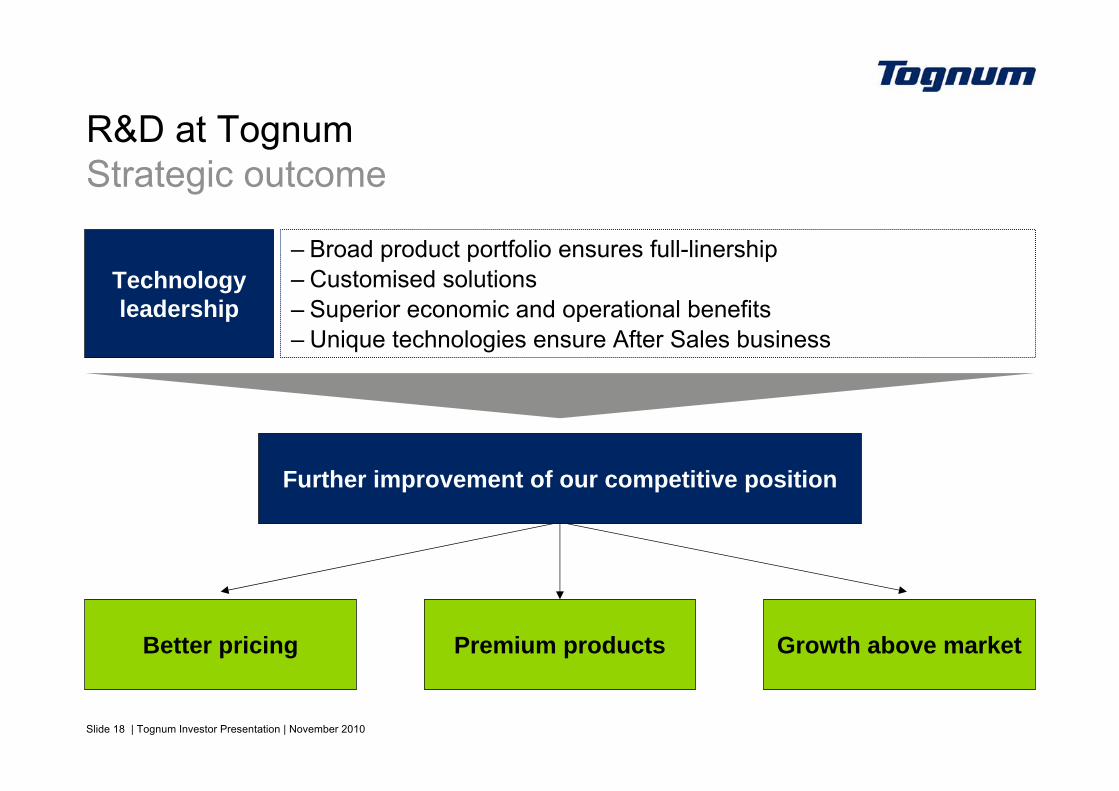
R&D at TognumStrategic outcome
Technology leadership
Further improvement of our competitive position
Growth above market
– Broad product portfolio ensures full-linership– Customised solutions – Superior economic and operational benefits – Unique technologies ensure After Sales business
Better pricing Premium products
Slide 19 | Tognum Investor Presentation | November 2010
Back-up Strategy, Production & Financials
Slide 20 | Tognum Investor Presentation | November 2010
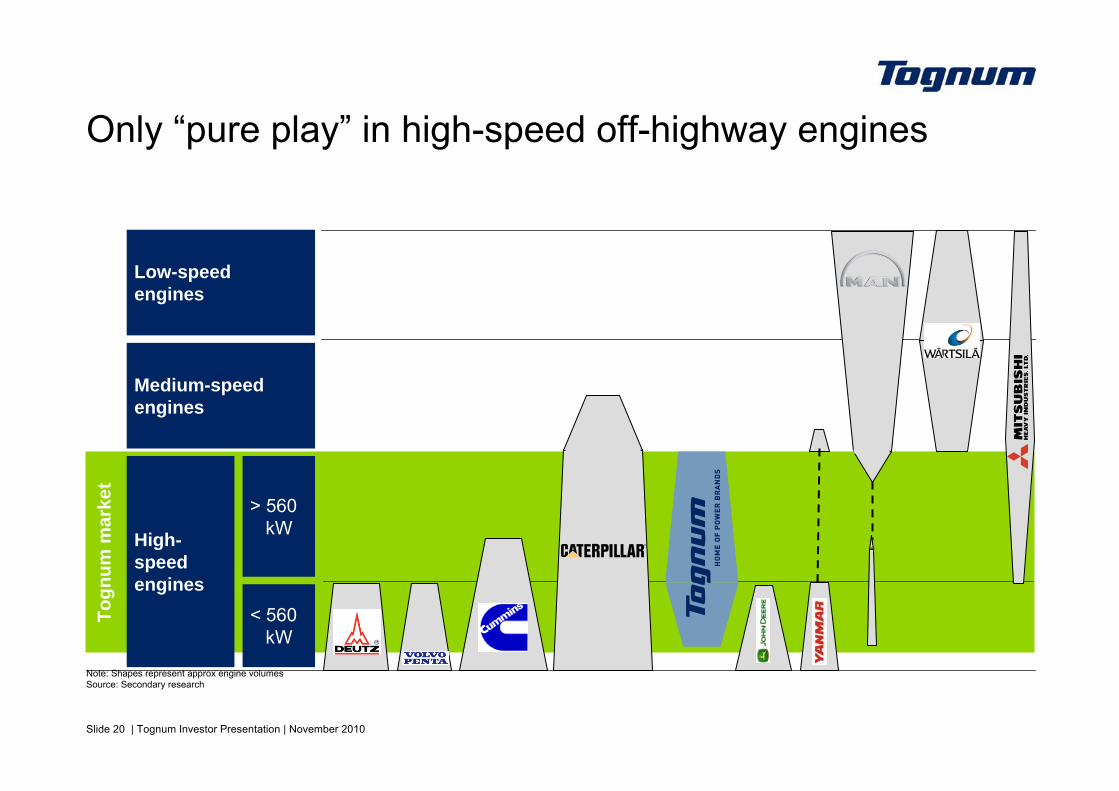
Only “pure play” in high-speed off-highway enginesTo
gnum
mar
ket
Low-speed engines
Medium-speed engines
> 560kW
< 560kW
High-speed engines
Note: Shapes represent approx engine volumesSource: Secondary research
Slide 21 | Tognum Investor Presentation | November 2010
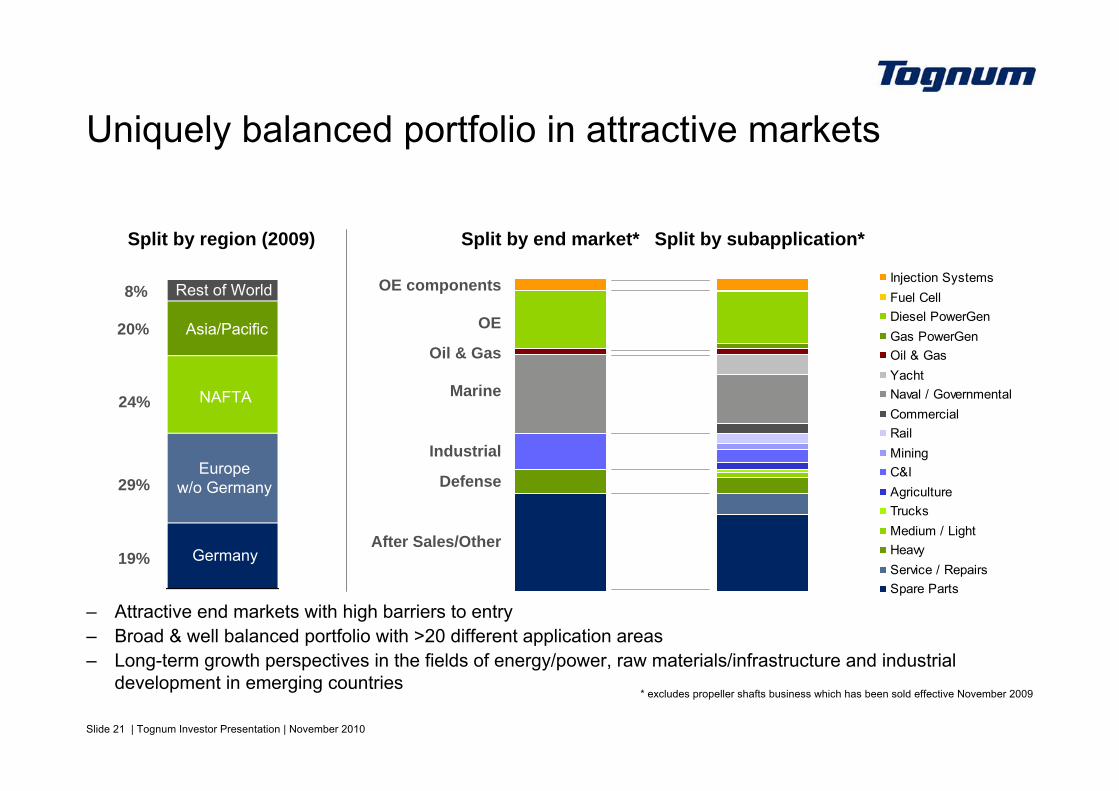
Injection SystemsFuel CellDiesel PowerGenGas PowerGenOil & GasYachtNaval / GovernmentalCommercialRailMiningC&IAgricultureTrucksMedium / LightHeavyService / RepairsSpare Parts
Uniquely balanced portfolio in attractive markets
Split by region (2009)
– Attractive end markets with high barriers to entry– Broad & well balanced portfolio with >20 different application areas– Long-term growth perspectives in the fields of energy/power, raw materials/infrastructure and industrial
development in emerging countries
29%
20%
24%
8%
19%
Rest of World
Europew/o Germany
Asia/Pacific
NAFTA
Germany
Split by end market* Split by subapplication*
OE components
OE
Oil & Gas
Marine
Industrial
Defense
After Sales/Other
* excludes propeller shafts business which has been sold effective November 2009
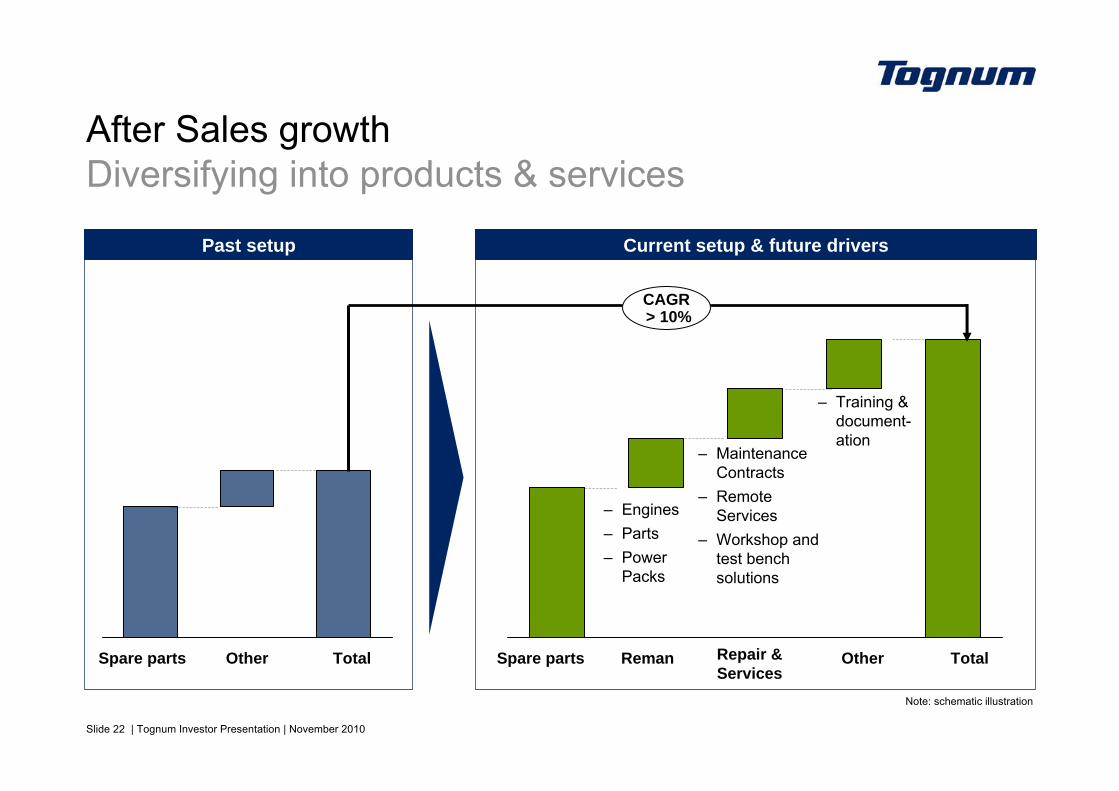
Slide 22 | Tognum Investor Presentation | November 2010
Current setup & future driversPast setup
TotalOtherRepair & Services
RemanSpare parts
– Maintenance Contracts
– Remote Services
– Workshop and test bench solutions
– Engines– Parts– Power
Packs
– Training & document-ation
TotalOtherSpare parts
CAGR> 10%
After Sales growthDiversifying into products & services
Note: schematic illustration
Slide 23 | Tognum Investor Presentation | November 2010
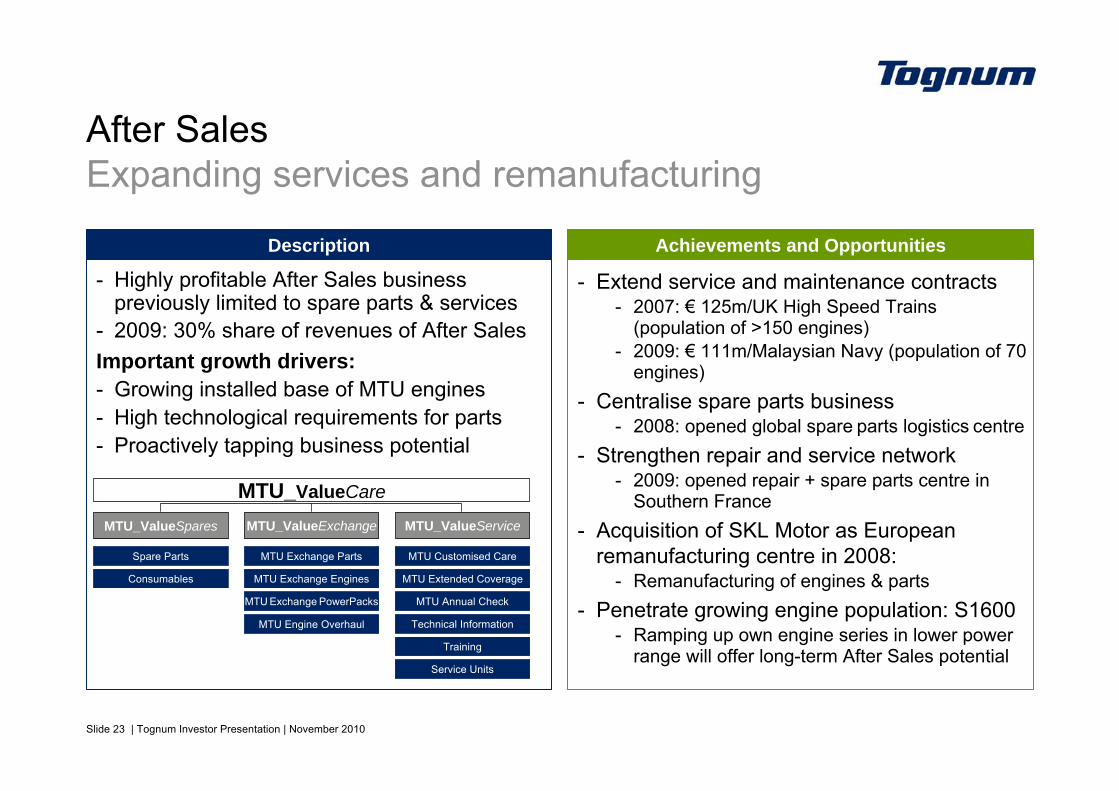
After SalesExpanding services and remanufacturing
- Highly profitable After Sales business previously limited to spare parts & services
- 2009: 30% share of revenues of After SalesImportant growth drivers:- Growing installed base of MTU engines- High technological requirements for parts- Proactively tapping business potential
Achievements and Opportunities
- Extend service and maintenance contracts- 2007: € 125m/UK High Speed Trains
(population of >150 engines)- 2009: € 111m/Malaysian Navy (population of 70
engines)- Centralise spare parts business
- 2008: opened global spare parts logistics centre- Strengthen repair and service network
- 2009: opened repair + spare parts centre in Southern France
- Acquisition of SKL Motor as European remanufacturing centre in 2008:
- Remanufacturing of engines & parts- Penetrate growing engine population: S1600
- Ramping up own engine series in lower power range will offer long-term After Sales potential
Description
MTU_ValueSpares MTU_ValueExchange MTU_ValueService
Spare Parts
Consumables
MTU Exchange Parts MTU Customised Care
MTU Exchange Engines
MTU Exchange PowerPacks
MTU Engine Overhaul
MTU Extended Coverage
MTU Annual Check
Technical Information
Training
Service Units
MTU_ValueCare
Slide 24 | Tognum Investor Presentation | November 2010
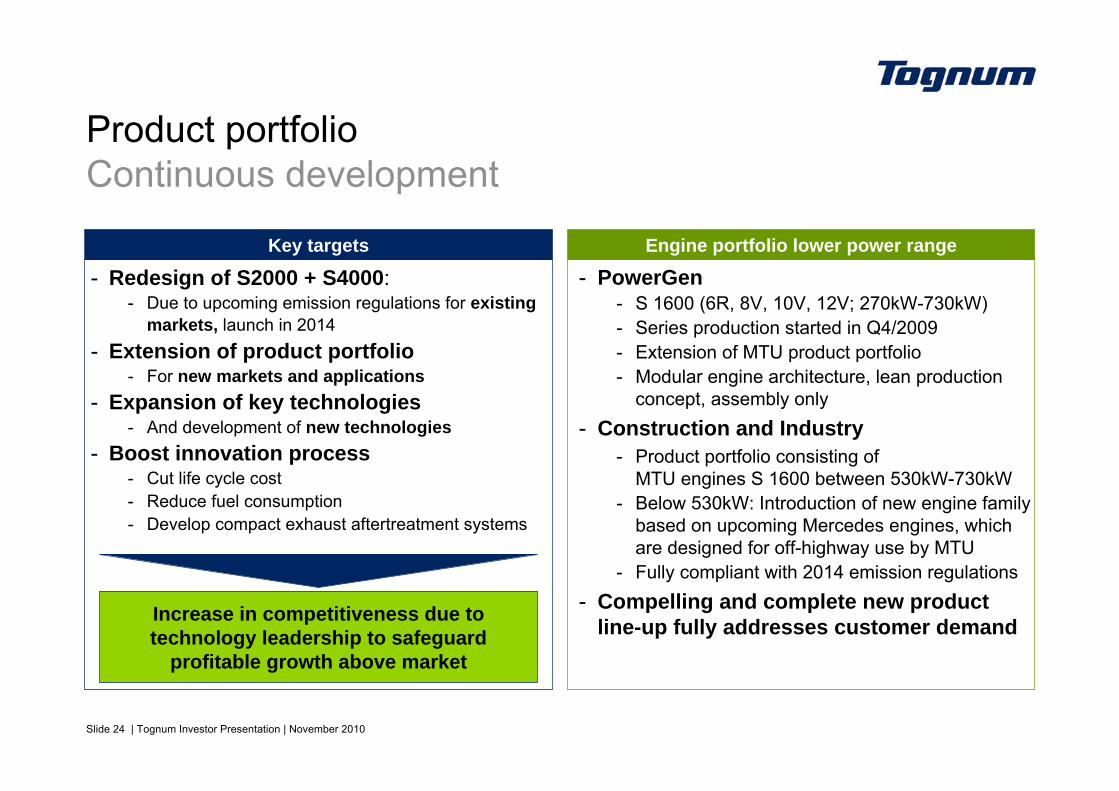
Product portfolioContinuous development
Engine portfolio lower power rangeKey targets
- Redesign of S2000 + S4000: - Due to upcoming emission regulations for existing
markets, launch in 2014- Extension of product portfolio
- For new markets and applications- Expansion of key technologies
- And development of new technologies- Boost innovation process
- Cut life cycle cost- Reduce fuel consumption- Develop compact exhaust aftertreatment systems
Increase in competitiveness due to technology leadership to safeguard
profitable growth above market
- PowerGen- S 1600 (6R, 8V, 10V, 12V; 270kW-730kW)- Series production started in Q4/2009- Extension of MTU product portfolio- Modular engine architecture, lean production
concept, assembly only- Construction and Industry
- Product portfolio consisting of MTU engines S 1600 between 530kW-730kW
- Below 530kW: Introduction of new engine family based on upcoming Mercedes engines, which are designed for off-highway use by MTU
- Fully compliant with 2014 emission regulations- Compelling and complete new product
line-up fully addresses customer demand
Slide 25 | Tognum Investor Presentation | November 2010
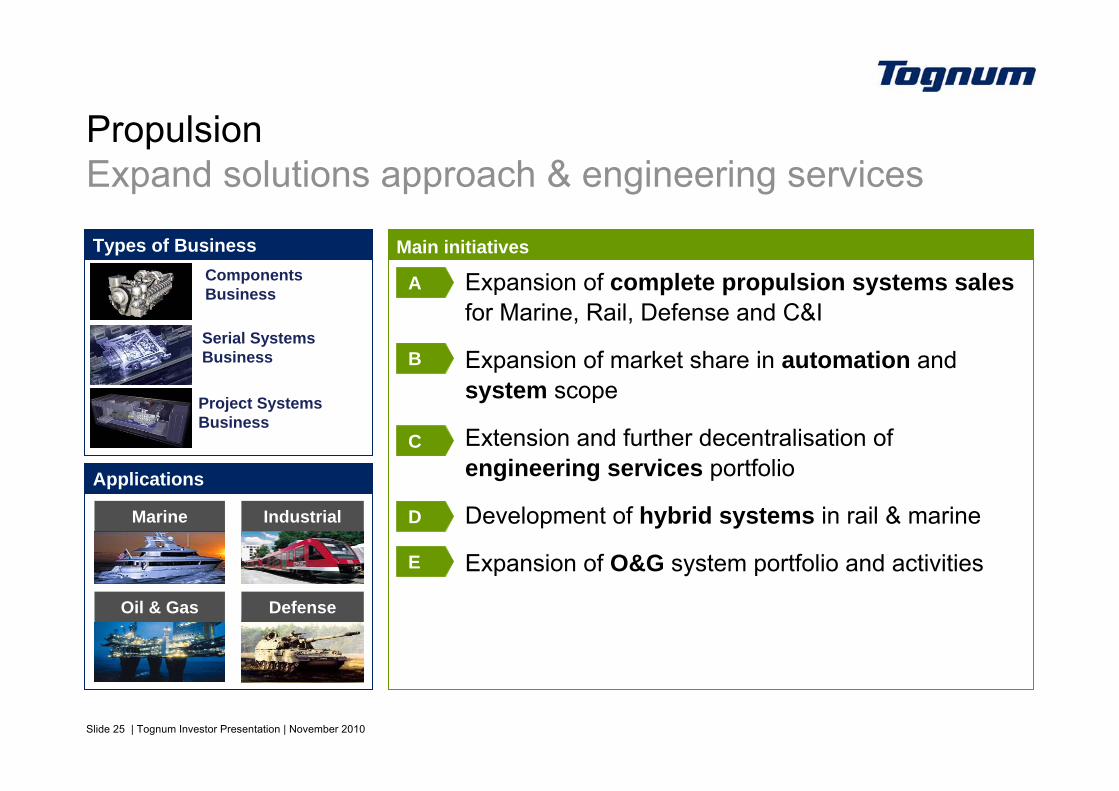
Expansion of complete propulsion systems salesfor Marine, Rail, Defense and C&I
Expansion of market share in automation and system scope
Extension and further decentralisation of engineering services portfolio
Development of hybrid systems in rail & marine
Expansion of O&G system portfolio and activities
PropulsionExpand solutions approach & engineering services
Types of Business Main initiatives
A
B
C
D
E
Components Business
Serial Systems Business
Project Systems Business
Applications
Marine Industrial
DefenseOil & Gas
Slide 26 | Tognum Investor Presentation | November 2010
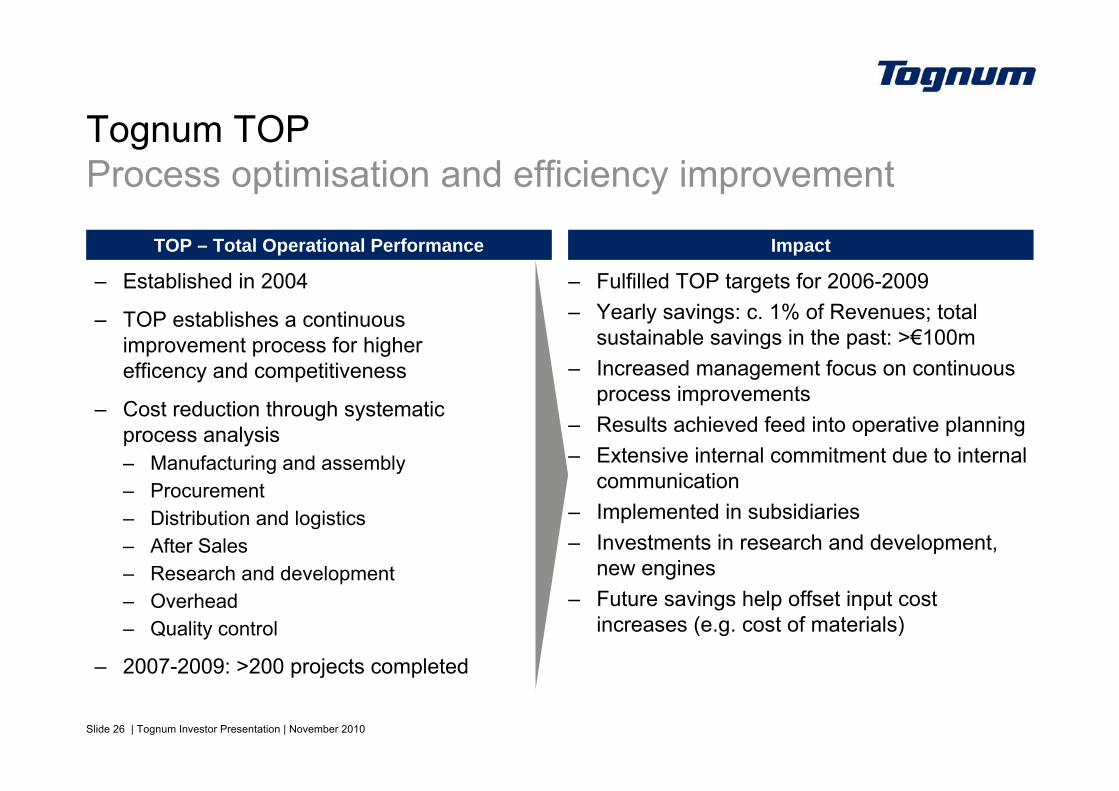
– Established in 2004
– TOP establishes a continuous improvement process for higher efficency and competitiveness
– Cost reduction through systematic process analysis – Manufacturing and assembly– Procurement– Distribution and logistics– After Sales– Research and development– Overhead– Quality control
– 2007-2009: >200 projects completed
– Fulfilled TOP targets for 2006-2009– Yearly savings: c. 1% of Revenues; total
sustainable savings in the past: >€100m– Increased management focus on continuous
process improvements – Results achieved feed into operative planning – Extensive internal commitment due to internal
communication– Implemented in subsidiaries– Investments in research and development,
new engines– Future savings help offset input cost
increases (e.g. cost of materials)
TOP – Total Operational Performance Impact
Tognum TOPProcess optimisation and efficiency improvement
Slide 27 | Tognum Investor Presentation | November 2010
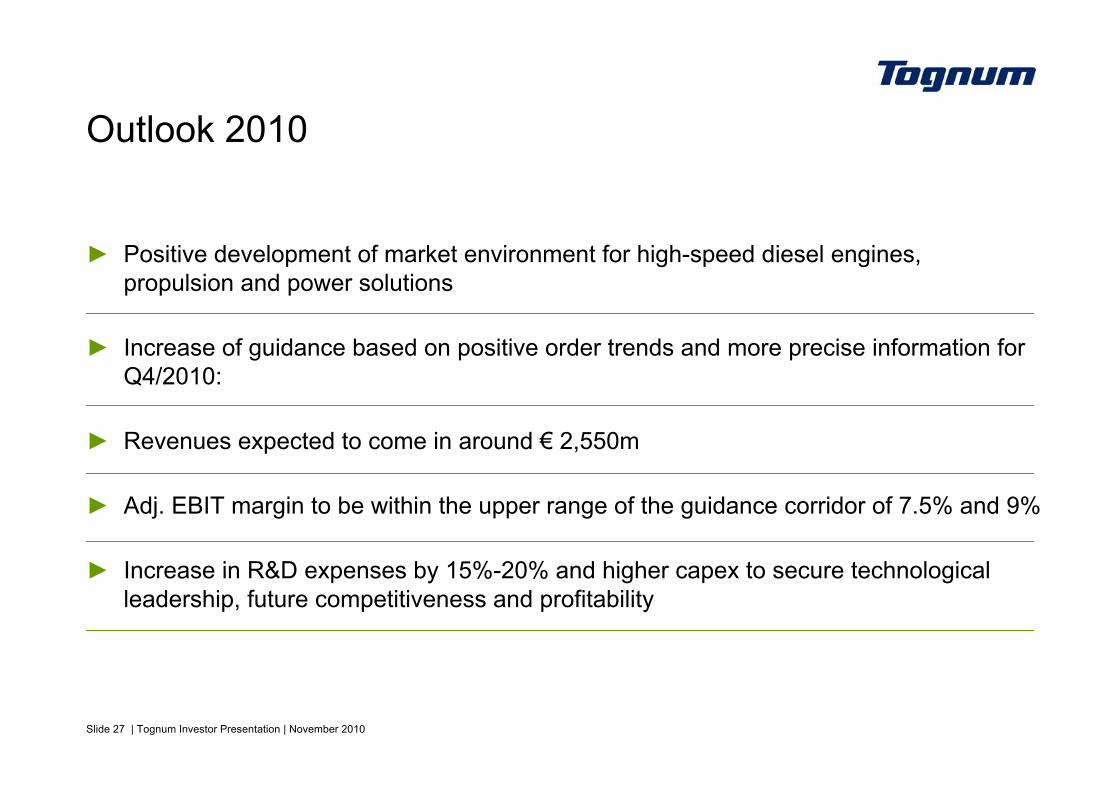
Outlook 2010
► Positive development of market environment for high-speed diesel engines, propulsion and power solutions
► Increase of guidance based on positive order trends and more precise information for Q4/2010:
► Revenues expected to come in around € 2,550m
► Adj. EBIT margin to be within the upper range of the guidance corridor of 7.5% and 9%
► Increase in R&D expenses by 15%-20% and higher capex to secure technological leadership, future competitiveness and profitability
Slide 28 | Tognum Investor Presentation | November 2010
Operational Set-upProduction and assembly concept
Flexibility in capacity adjustmentsFlexible engine & production concept
Core engine (S4000)
Gas
Marine
Mining Rail
Genset
Permanent workforce
Temporary workers
Plant capacity layout
Additional shifts
Outsourcing
Reduce temporaryemployment
Fewer shifts
Flexible work time model
Internal machinery
Slide 29 | Tognum Investor Presentation | November 2010
70.0%
75.0%
80.0%
85.0%
90.0%
95.0%
100.0%
Goldmine -USA
High A ltitude(1) - Chile
High A ltitude(2) - Chile
High A ltitude(3) - Chile
Other
Availability of trucks - Mining Fuel efficiency - Mining
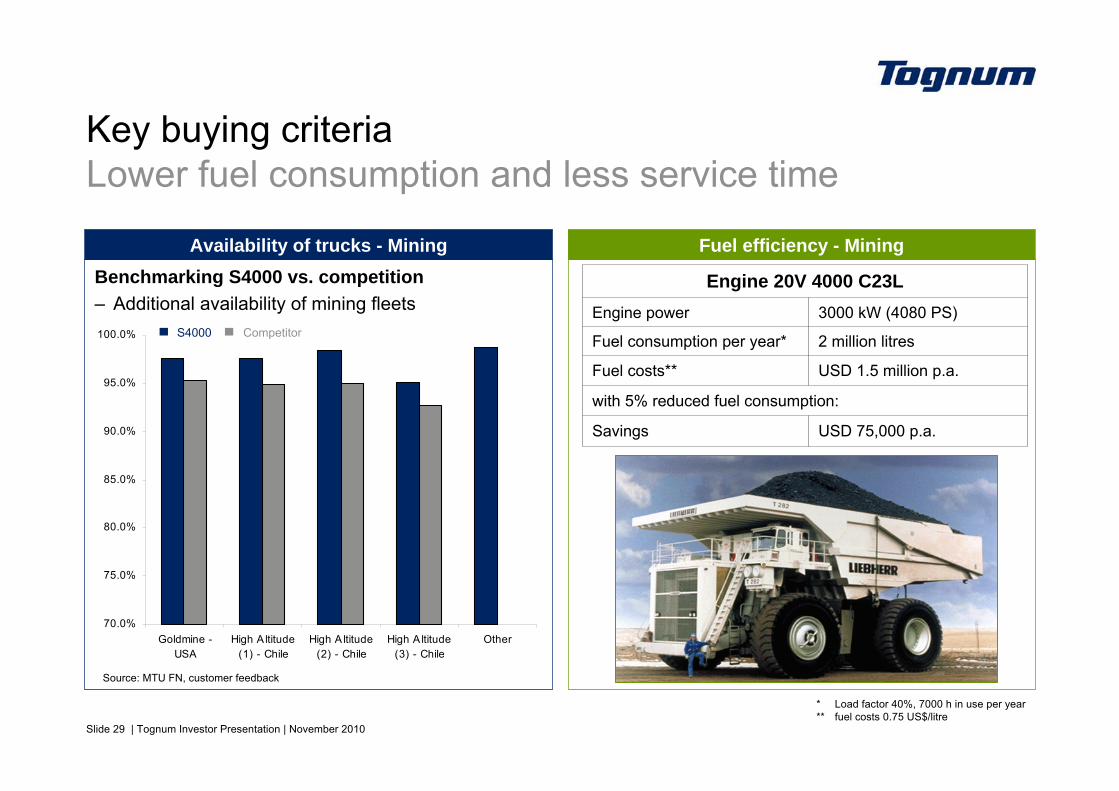
Key buying criteriaLower fuel consumption and less service time
Benchmarking S4000 vs. competition– Additional availability of mining fleets
Source: MTU FN, customer feedback
CompetitorS4000
USD 75,000 p.a.Savings
with 5% reduced fuel consumption:
USD 1.5 million p.a.Fuel costs**
2 million litresFuel consumption per year*
3000 kW (4080 PS)Engine power
Engine 20V 4000 C23L
* Load factor 40%, 7000 h in use per year** fuel costs 0.75 US$/litre
Slide 30 | Tognum Investor Presentation | November 2010
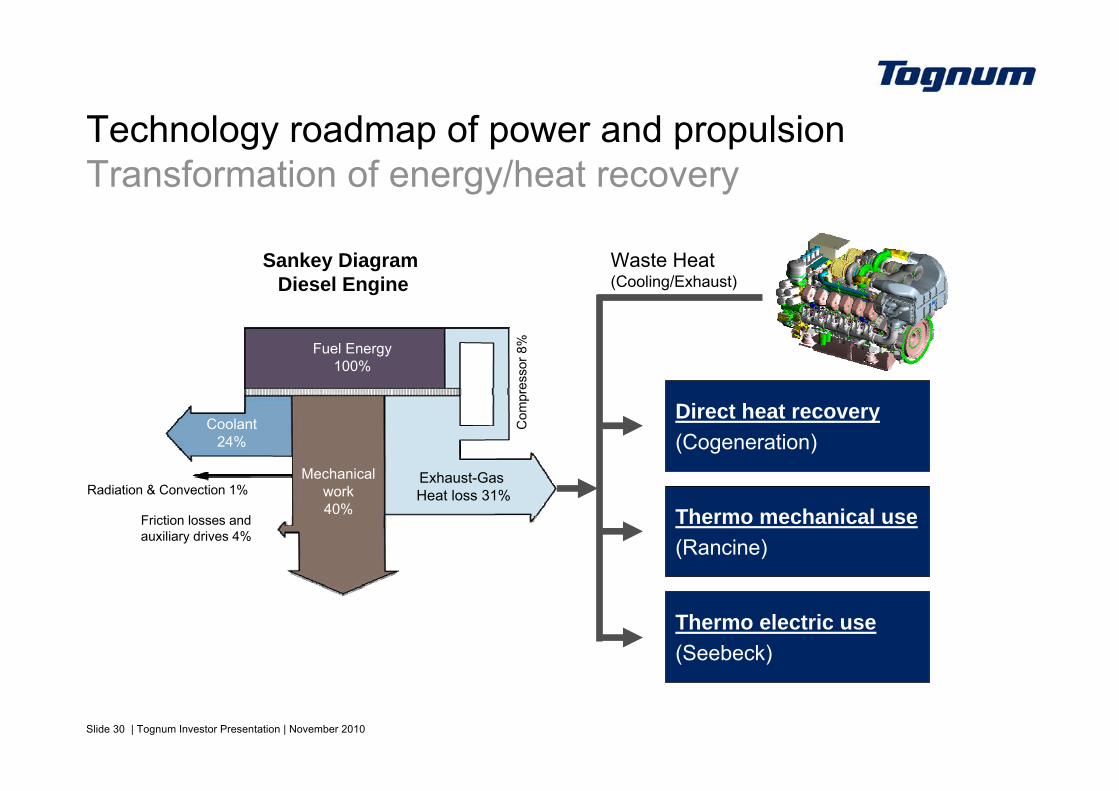
Technology roadmap of power and propulsionTransformation of energy/heat recovery
Sankey Diagram Diesel Engine
Radiation & Convection 1%
Com
pres
sor 8
%Friction losses and auxiliary drives 4%
Fuel Energy100%
Mechanicalwork40%
Coolant24%
Exhaust-Gas Heat loss 31%
Waste Heat(Cooling/Exhaust)
Thermo electric use(Seebeck)
Thermo mechanical use(Rancine)
Direct heat recovery(Cogeneration)
Slide 31 | Tognum Investor Presentation | November 2010
Product portfolio developmentLine-up for PowerGen (schematic)
Toda
y
S 4000S 2000
S 60
Futu
re S 4000New generation
S 2000New generation
S 1600
100 kW 500 kW 4,000 kW2,000 kW1,000 kW 6,000 kW
S 956
S 8000
100 kW 500 kW 4,000 kW2,000 kW1,000 kW 6,000 kW
S 956
S 1600
3rd party
3rd party
LM 2500
LM 2500
Slide 32 | Tognum Investor Presentation | November 2010
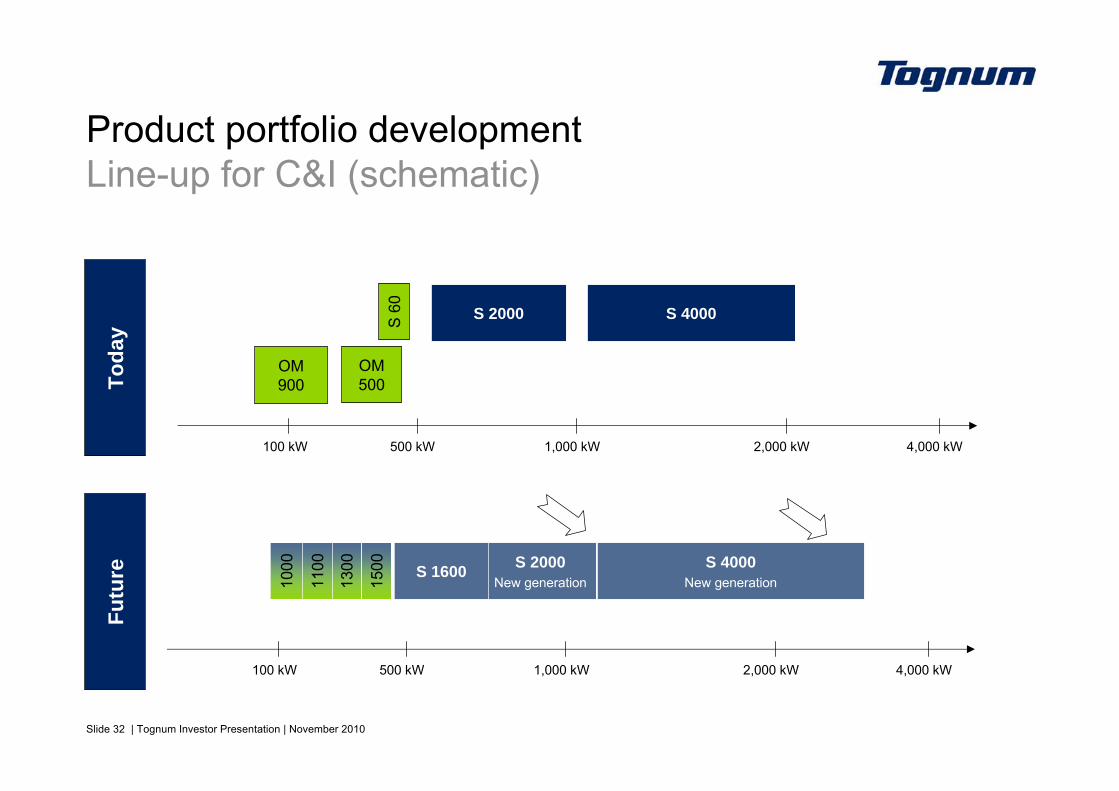
Product portfolio developmentLine-up for C&I (schematic)
Toda
y
OM900
OM500
S 4000S 2000S 60
100 kW 500 kW 4,000 kW2,000 kW1,000 kW
Futu
re S 4000New generation
S 2000New generation
S 1600
1000
1500
1300
1100
100 kW 500 kW 4,000 kW2,000 kW1,000 kW
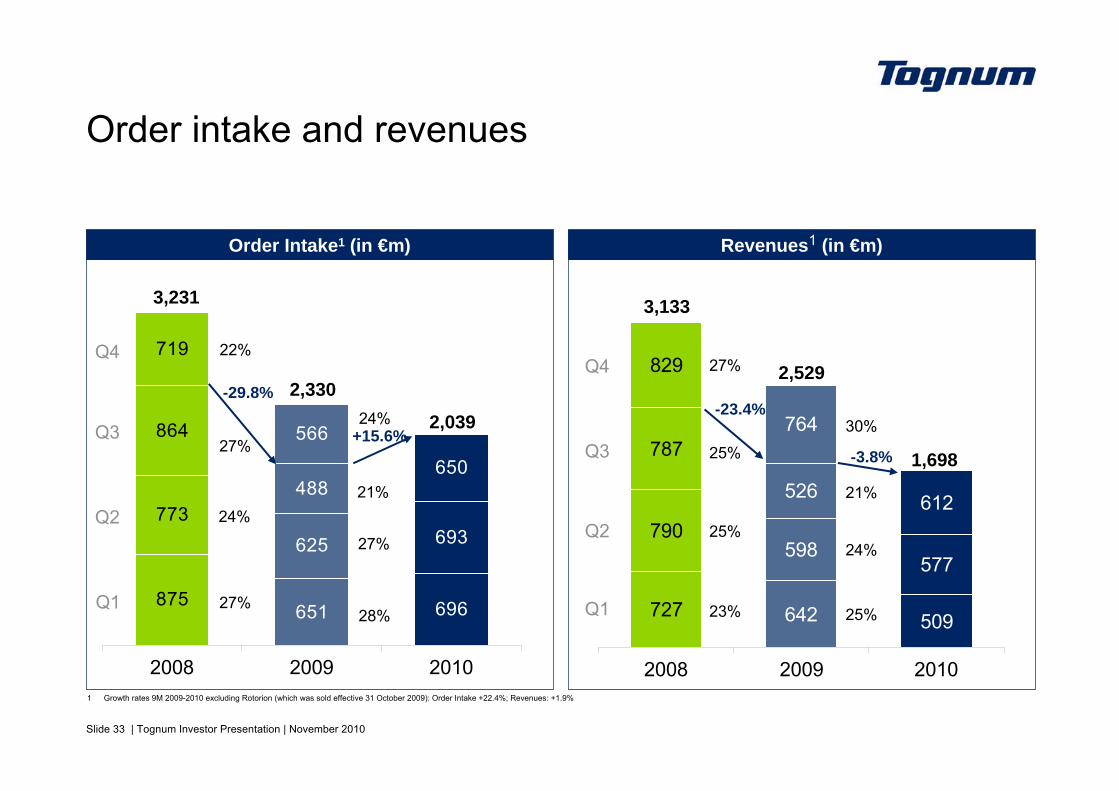
Slide 33 | Tognum Investor Presentation | November 2010
727
790
787
829
642 509
598577
526 612
764
2008 2009 2010
875
773
864
719
651 696
625 693
488650
566
2008 2009 2010
Revenues1 (in €m)
Order intake and revenues
Order Intake1 (in €m)
+15.6%
3,231
-3.8%
Q4
Q3
Q2
Q1
Q4
Q3
Q2
Q1
3,133
22%
27%
24%
27%
27%
25%
25%
23%
-23.4%-29.8% 2,330
2,529
24%
21%
27%
28%
30%
21%
24%
25%
2,039
1,698
1 Growth rates 9M 2009-2010 excluding Rotorion (which was sold effective 31 October 2009): Order Intake +22.4%; Revenues: +1.9%
Slide 34 | Tognum Investor Presentation | November 2010
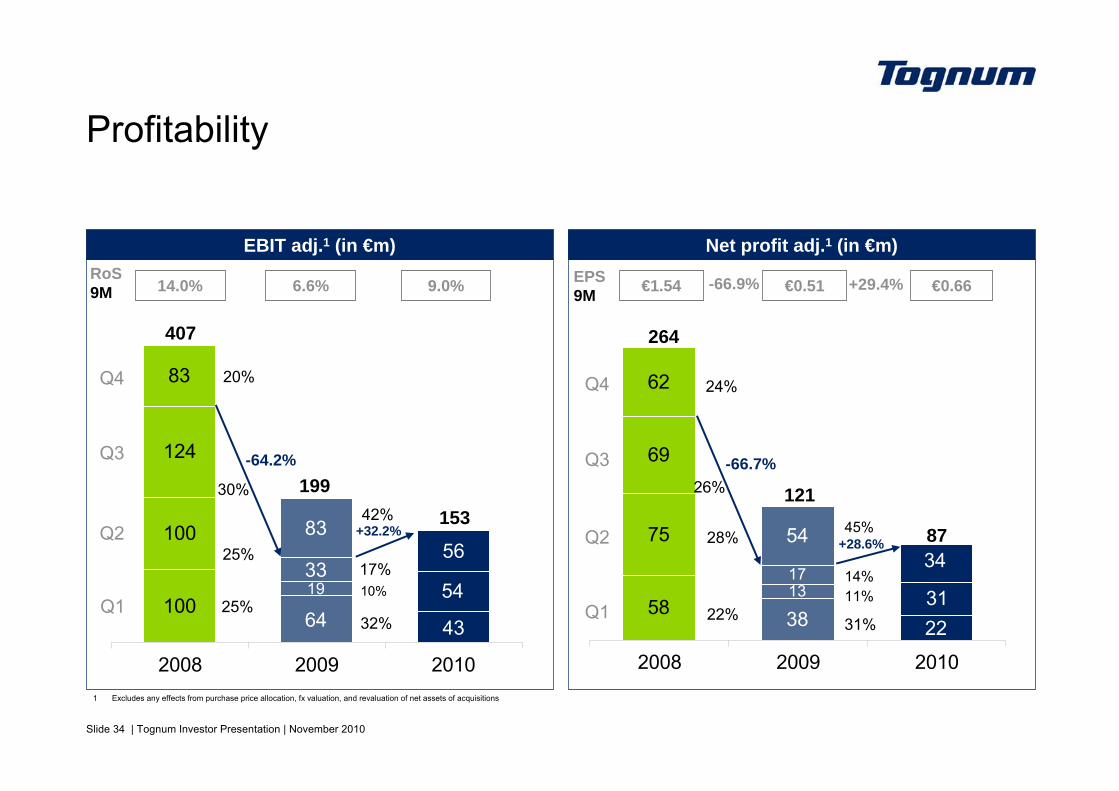
58
75
69
62
22383113
3417
54
2008 2009 2010
100
100
124
83
64 43
19 5433
5683
2008 2009 2010
Q3
EBIT adj.1 (in €m) Net profit adj.1 (in €m)
Profitability
1 Excludes any effects from purchase price allocation, fx valuation, and revaluation of net assets of acquisitions
-66.7%
RoS9M 6.6% 9.0% EPS
9M €0.51 €0.66
-64.2%
407 264
Q4
Q2
Q1
Q4
Q3
Q2
Q1
24%
26%
28%
22%
20%
30%
25%
25%
+29.4%14.0%
+32.2%+28.6%
€1.54 -66.9%
12119942%
10%17%
32%
14%11%
31%
1538745%
Slide 35 | Tognum Investor Presentation | November 2010
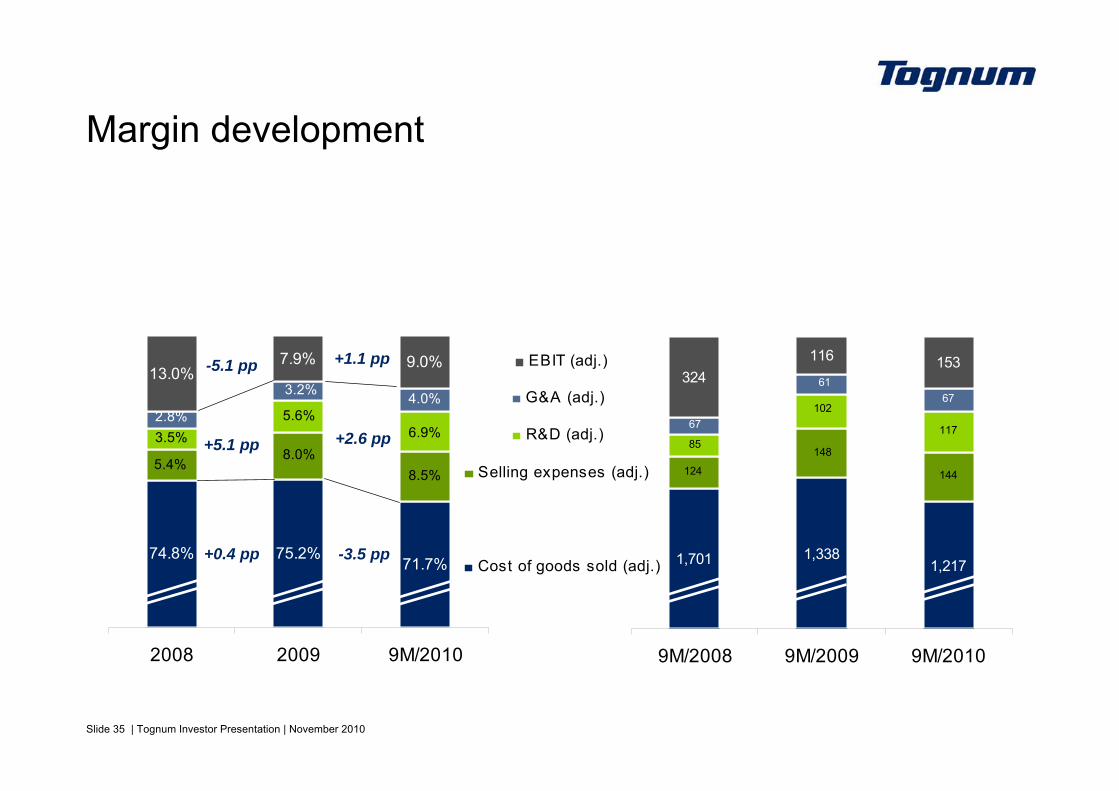
74.8% 75.2%71.7%
13.0%7.9% 9.0%
8.0%5.4%
8.5%
5.6%3.5% 6.9%2.8%
3.2% 4.0%
2008 2009 9M/2010
324116 153
1,2171,3381,701
148
124 144
102
8511767
6167
9M/2008 9M/2009 9M/2010
G&A (adj.)
Margin development
-3.5 pp
+2.6 pp
+1.1 pp
+0.4 pp
+5.1 pp
-5.1 pp
R&D (adj.)
Selling expenses (adj.)
EBIT (adj.)
Cost of goods sold (adj.)
Slide 36 | Tognum Investor Presentation | November 2010
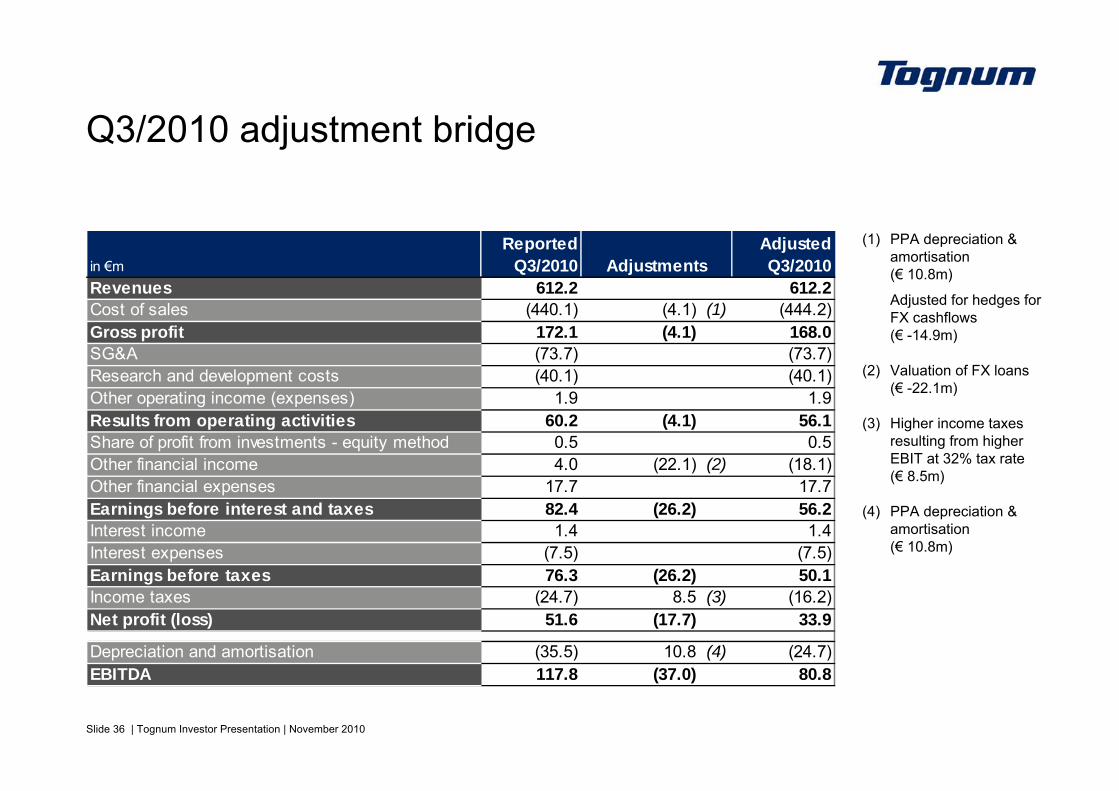
Q3/2010 adjustment bridge
(1) PPA depreciation & amortisation (€ 10.8m)
Adjusted for hedges for FX cashflows(€ -14.9m)
(2) Valuation of FX loans (€ -22.1m)
(3) Higher income taxes resulting from higher EBIT at 32% tax rate (€ 8.5m)
(4) PPA depreciation & amortisation (€ 10.8m)
in €mReported
Q3/2010Adjusted Q3/2010
Revenues 612.2 612.2Cost of sales (440.1) (4.1) (1) (444.2)Gross profit 172.1 (4.1) 168.0SG&A (73.7) (73.7)
(40.1) (40.1)1.9 1.9
60.2 (4.1) 56.10.5 0.5
Other financial income 4.0 (22.1) (2) (18.1)Other financial expenses 17.7 17.7
82.4 (26.2) 56.2Interest income 1.4 1.4Interest expenses (7.5) (7.5)Earnings before taxes 76.3 (26.2) 50.1Income taxes (24.7) 8.5 (3) (16.2)Net profit (loss) 51.6 (17.7) 33.9
Depreciation and amortisation (35.5) 10.8 (4) (24.7)EBITDA 117.8 (37.0) 80.8
Research and development costs
Results from operating activitiesShare of profit from investments - equity method
Other operating income (expenses)
Adjustments
Earnings before interest and taxes
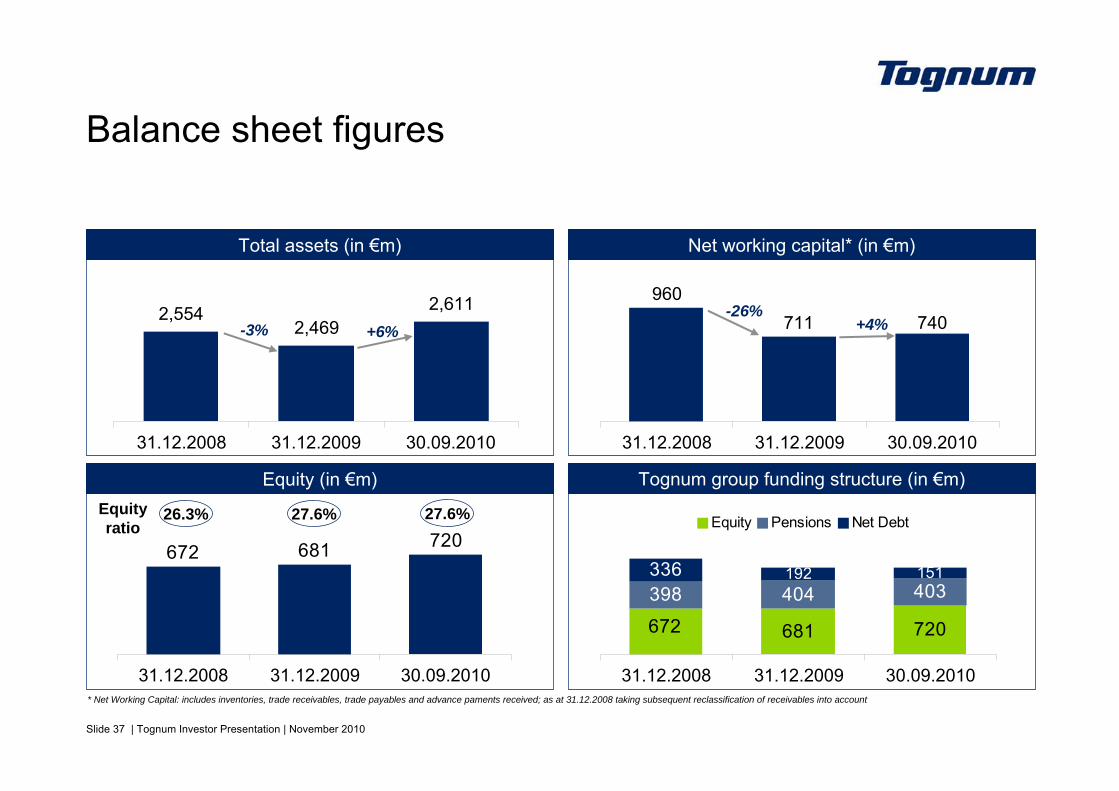
Slide 37 | Tognum Investor Presentation | November 2010
681 720
398 404 403336
672
151192
31.12.2008 31.12.2009 30.09.2010
Equity Pensions Net Debt720672 681
31.12.2008 31.12.2009 30.09.2010
740711960
31.12.2008 31.12.2009 30.09.2010
2,5542,469
2,611
31.12.2008 31.12.2009 30.09.2010
Total assets (in €m) Net working capital* (in €m)
Tognum group funding structure (in €m)Equity (in €m)
Balance sheet figures
Equityratio
-3% +4%+6%-26%
26.3% 27.6%
* Net Working Capital: includes inventories, trade receivables, trade payables and advance paments received; as at 31.12.2008 taking subsequent reclassification of receivables into account
27.6%
Slide 38 | Tognum Investor Presentation | November 2010
31.12.2008 31.12.2009 30.09.2010
(36.6)
(16.1)
(9.7) (12.5)(28.6)
(46.0)
(77.7)181.3
(150.8)
(192.2)
54.6
136.4
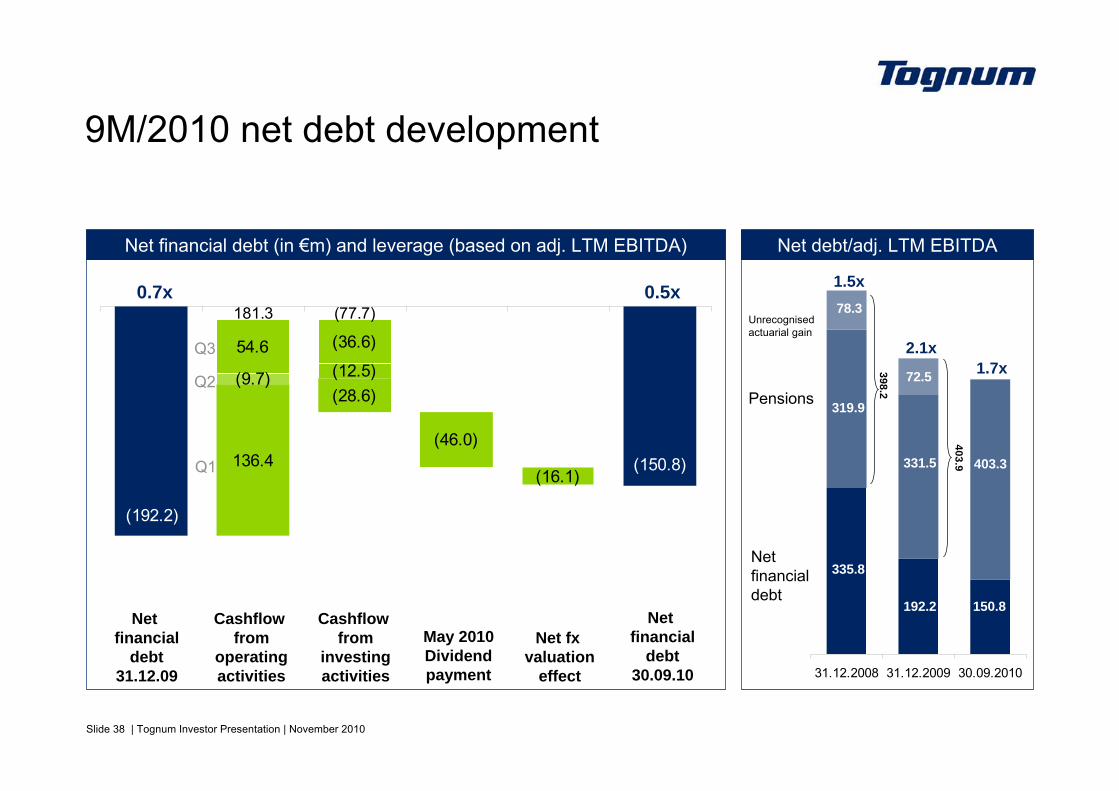
9M/2010 net debt development
Net financial debt (in €m) and leverage (based on adj. LTM EBITDA)
0.7x 0.5x
Q1
Net financial
debt31.12.09
Cashflow from
operatingactivities
Net financial
debt30.09.10
Cashflow from
investingactivities
Net fxvaluation
effect
Net debt/adj. LTM EBITDA
Pensions
Netfinancialdebt
1.5x
2.1x
Unrecognisedactuarial gain
335.8
192.2
319.9
331.5
78.3
398.2
72.5
403.9
150.8
403.3
1.7xQ2
May 2010Dividendpayment
Q3
Slide 39 | Tognum Investor Presentation | November 2010
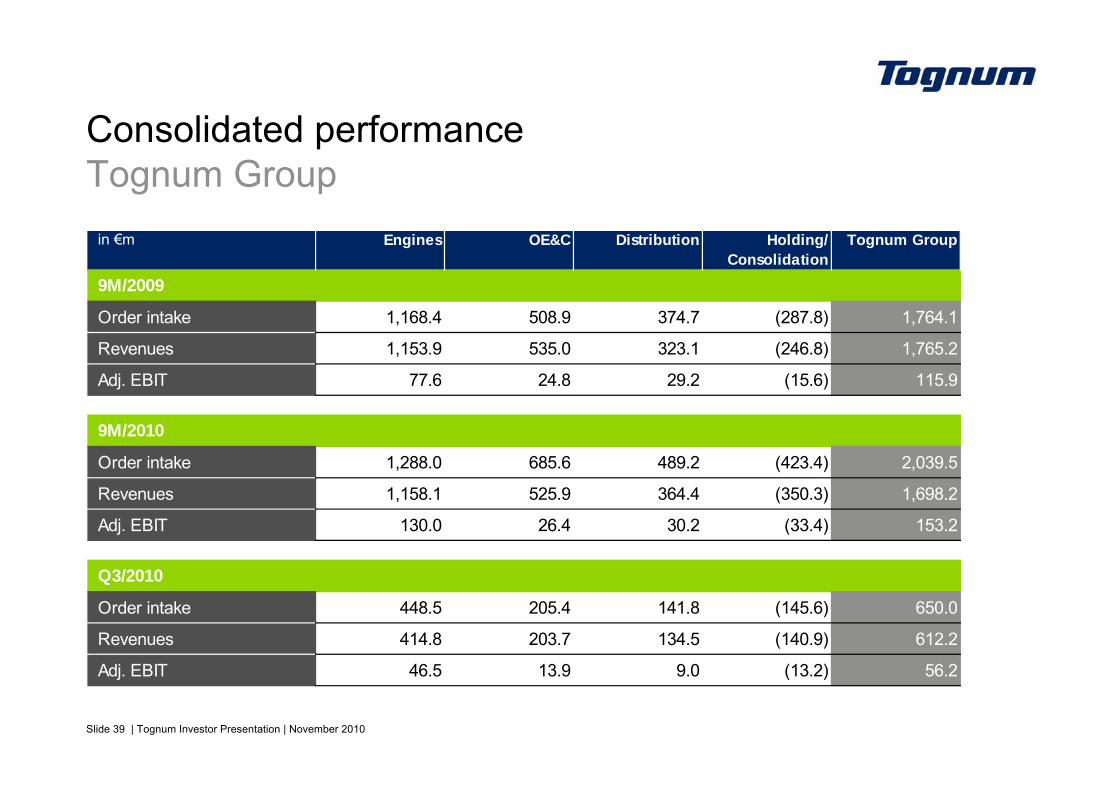
Consolidated performance Tognum Group
in €m Engines OE&C Distribution Holding/ Consolidation
Tognum Group
9M/2009
Order intake 1,168.4 508.9 374.7 (287.8) 1,764.1
Revenues 1,153.9 535.0 323.1 (246.8) 1,765.2
Adj. EBIT 77.6 24.8 29.2 (15.6) 115.9
9M/2010
Order intake 1,288.0 685.6 489.2 (423.4) 2,039.5
Revenues 1,158.1 525.9 364.4 (350.3) 1,698.2
Adj. EBIT 130.0 26.4 30.2 (33.4) 153.2
Q3/2010
Order intake 448.5 205.4 141.8 (145.6) 650.0
Revenues 414.8 203.7 134.5 (140.9) 612.2
Adj. EBIT 46.5 13.9 9.0 (13.2) 56.2
Slide 40 | Tognum Investor Presentation | November 2010
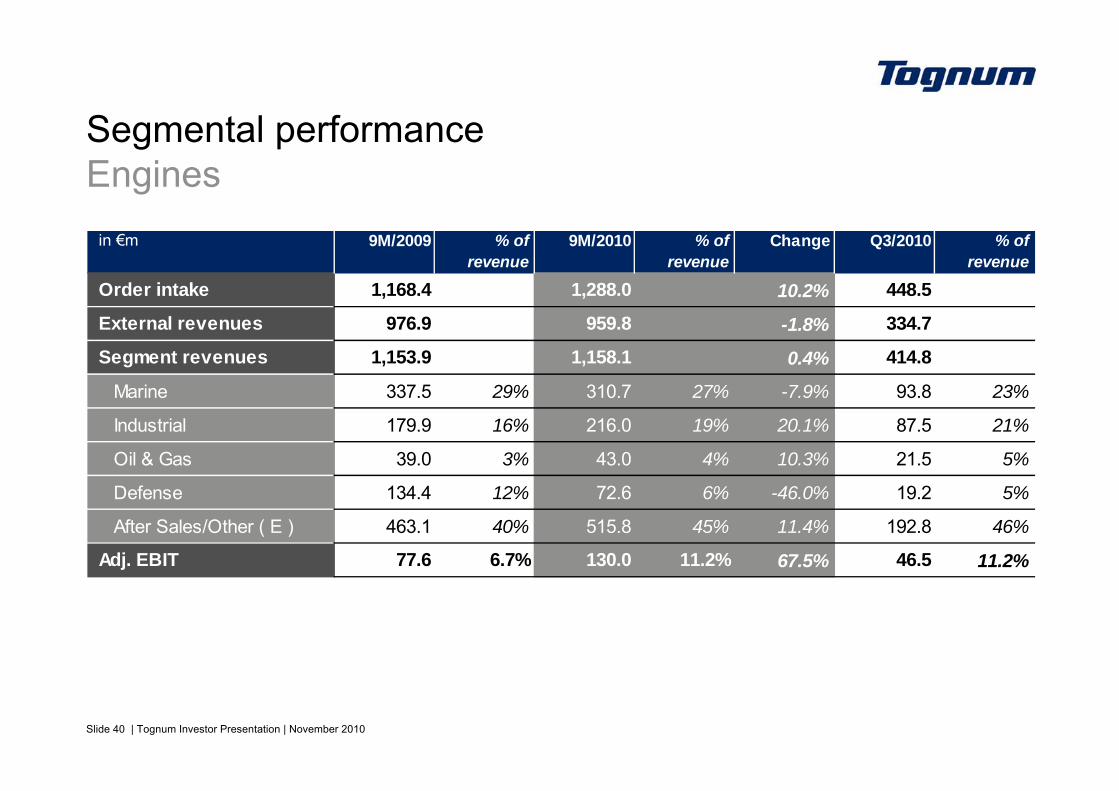
Segmental performanceEngines
in €m 9M/2009 % of revenue
9M/2010 % of revenue
Change Q3/2010 % of revenue
Order intake 1,168.4 1,288.0 10.2% 448.5
External revenues 976.9 959.8 -1.8% 334.7
Segment revenues 1,153.9 1,158.1 0.4% 414.8
Marine 337.5 29% 310.7 27% -7.9% 93.8 23%
Industrial 179.9 16% 216.0 19% 20.1% 87.5 21%
Oil & Gas 39.0 3% 43.0 4% 10.3% 21.5 5%
Defense 134.4 12% 72.6 6% -46.0% 19.2 5%
After Sales/Other ( E ) 463.1 40% 515.8 45% 11.4% 192.8 46%
Adj. EBIT 77.6 6.7% 130.0 11.2% 67.5% 46.5 11.2%
Slide 41 | Tognum Investor Presentation | November 2010
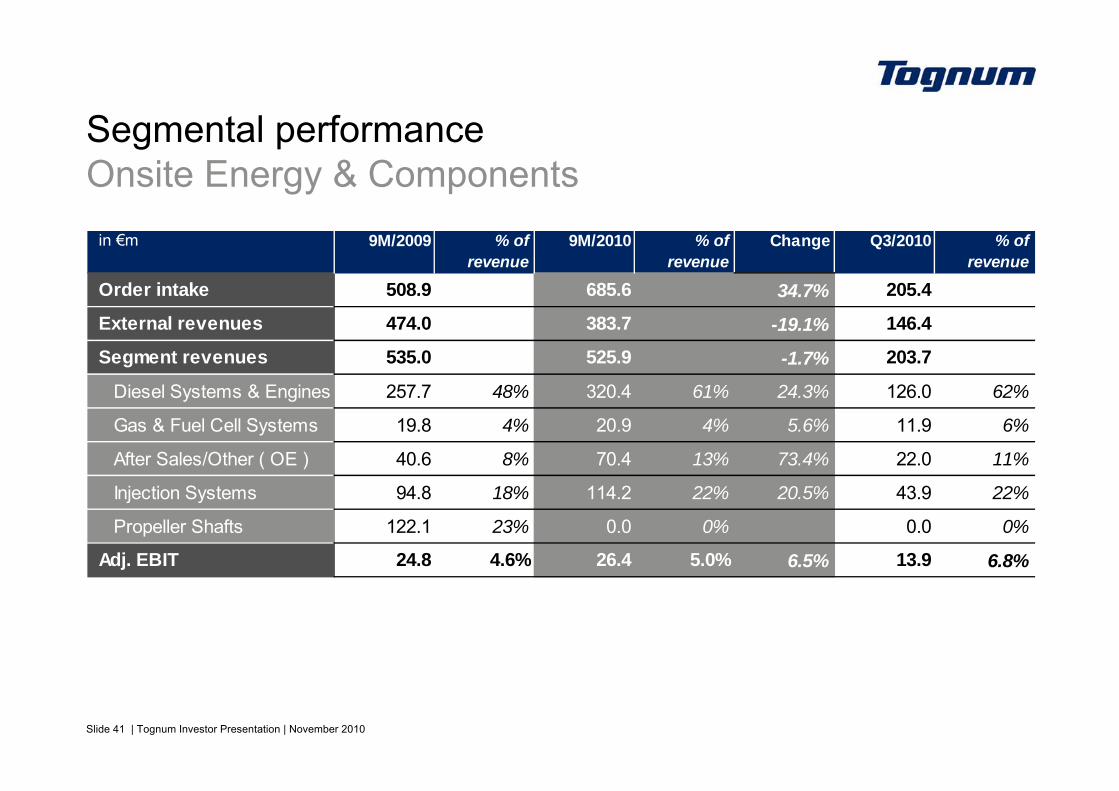
Segmental performance Onsite Energy & Components
in €m 9M/2009 % of revenue
9M/2010 % of revenue
Change Q3/2010 % of revenue
Order intake 508.9 685.6 34.7% 205.4
External revenues 474.0 383.7 -19.1% 146.4
Segment revenues 535.0 525.9 -1.7% 203.7
Diesel Systems & Engines 257.7 48% 320.4 61% 24.3% 126.0 62%
Gas & Fuel Cell Systems 19.8 4% 20.9 4% 5.6% 11.9 6%
After Sales/Other ( OE ) 40.6 8% 70.4 13% 73.4% 22.0 11%
Injection Systems 94.8 18% 114.2 22% 20.5% 43.9 22%
Propeller Shafts 122.1 23% 0.0 0% 0.0 0%
Adj. EBIT 24.8 4.6% 26.4 5.0% 6.5% 13.9 6.8%
Slide 42 | Tognum Investor Presentation | November 2010
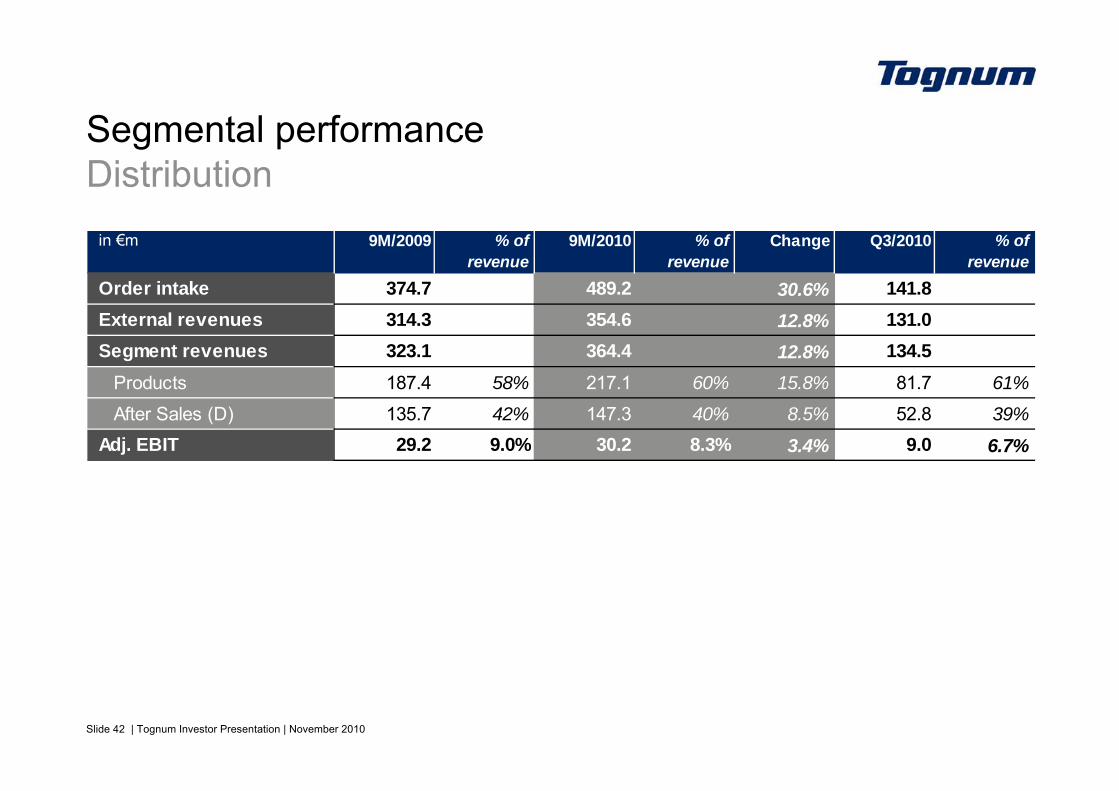
Segmental performance Distribution
in €m 9M/2009 % of revenue
9M/2010 % of revenue
Change Q3/2010 % of revenue
Order intake 374.7 489.2 30.6% 141.8External revenues 314.3 354.6 12.8% 131.0Segment revenues 323.1 364.4 12.8% 134.5
Products 187.4 58% 217.1 60% 15.8% 81.7 61%
After Sales (D) 135.7 42% 147.3 40% 8.5% 52.8 39%Adj. EBIT 29.2 9.0% 30.2 8.3% 3.4% 9.0 6.7%
Slide 43 | Tognum Investor Presentation | November 2010
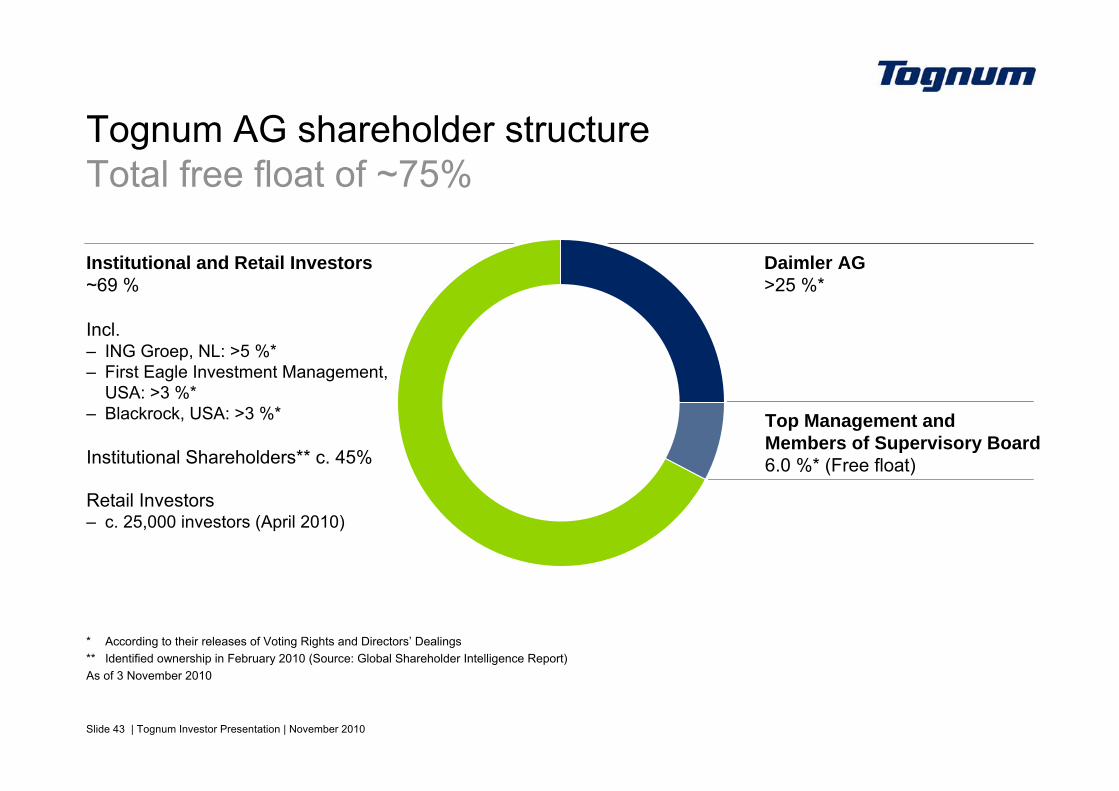
Tognum AG shareholder structureTotal free float of ~75%
Daimler AG>25 %*
Top Management and Members of Supervisory Board6.0 %* (Free float)
Institutional and Retail Investors~69 %
Incl.– ING Groep, NL: >5 %*– First Eagle Investment Management,
USA: >3 %*– Blackrock, USA: >3 %*
Institutional Shareholders** c. 45%
Retail Investors – c. 25,000 investors (April 2010)
* According to their releases of Voting Rights and Directors’ Dealings** Identified ownership in February 2010 (Source: Global Shareholder Intelligence Report)As of 3 November 2010
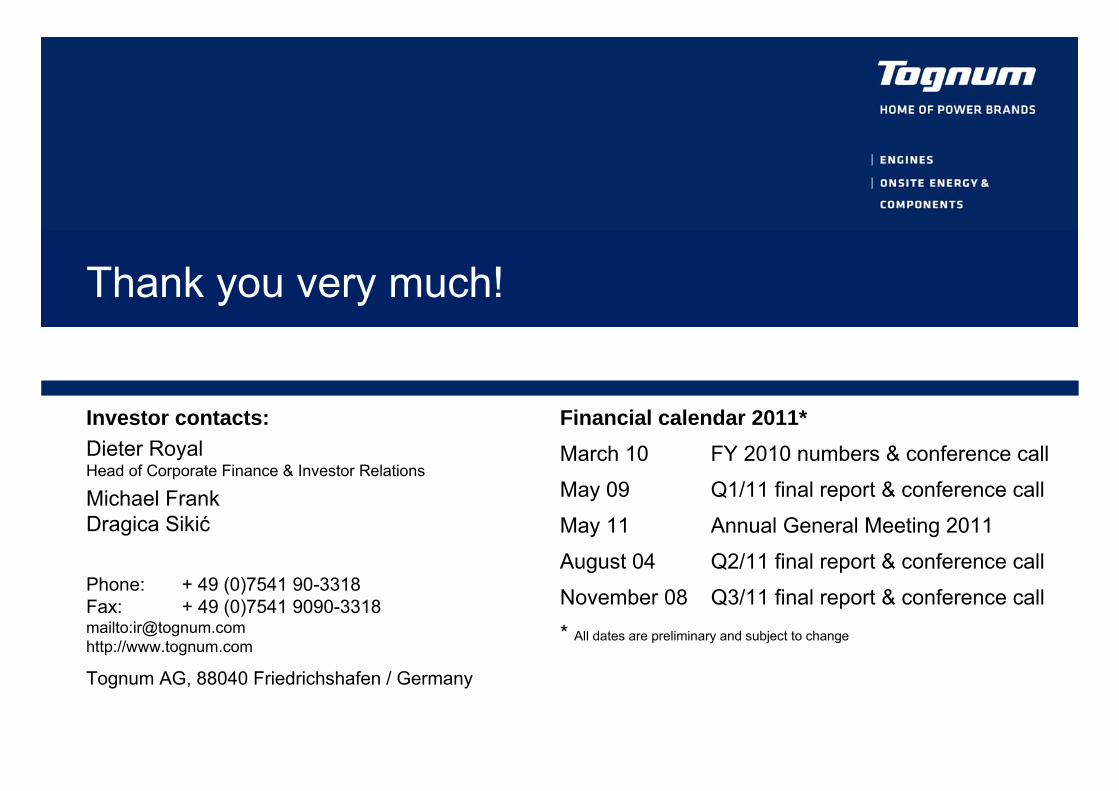
Investor contacts:Dieter RoyalHead of Corporate Finance & Investor Relations
Michael FrankDragica Sikić
Phone: + 49 (0)7541 90-3318Fax: + 49 (0)7541 9090-3318mailto:[email protected]://www.tognum.com
Tognum AG, 88040 Friedrichshafen / Germany
Thank you very much!
Financial calendar 2011*March 10 FY 2010 numbers & conference call
May 09 Q1/11 final report & conference call
May 11 Annual General Meeting 2011
August 04 Q2/11 final report & conference call
November 08 Q3/11 final report & conference call
* All dates are preliminary and subject to change