Embed Size (px)
Citation preview
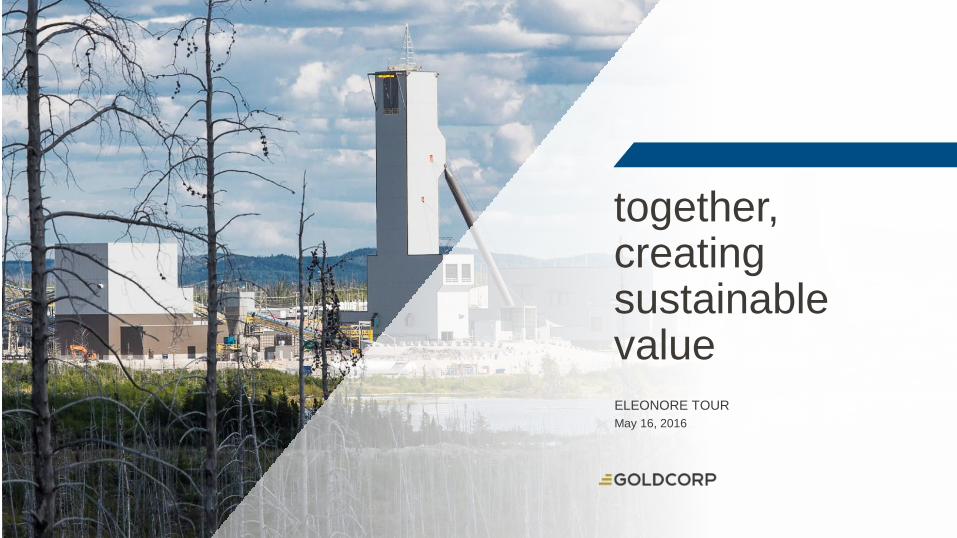
together, creating sustainable value
ELEONORE TOUR
May 16, 2016

2
TOGETHER, CREATING SUSTAINABLE VALUE | MAY 2016
This presentation contains “forward-looking statements”, within the meaning of Section 27A of the United States Securities Act of 1933, as amended, Section 21E of the United States Exchange Act of 1934,
as amended, or the United States Private Securities Litigation Reform Act of 1995 and “forward-looking information” under the provisions of applicable Canadian securities legislation, concerning the business,
operations and financial performance and condition of Goldcorp. Forward-looking statements include, but are not limited to, statements with respect to the future price of gold, silver, copper, lead and zinc, the
estimation of Mineral Reserves (as defined in slide 31) and Mineral Resources (as defined in slide 31) the realization of Mineral Reserve estimates, the timing and amount of estimated future production, costs of
production, targeted cost reductions, capital expenditures, free cash flow, costs and timing of the development of new deposits, success of exploration activities, permitting time lines, hedging practices, currency
exchange rate fluctuations, requirements for additional capital, government regulation of mining operations, environmental risks, unanticipated reclamation expenses, timing and possible outcome of pending
litigation, title disputes or claims and limitations on insurance coverage. Generally, these forward-looking statements can be identified by the use of words such as “plans”, “expects”, “is expected”, “budget”,
“scheduled”, “estimates”, “forecasts”, “intends”, “anticipates”, “believes” or variations of such words and phrases or statements that certain actions, events or results “may”, “could”, “would”, “might” or “will”, “occur”
or “be achieved” or the negative connotation thereof.
Forward-looking statements are necessarily based upon a number of factors that, if untrue, could cause the actual results, performances or achievements of Goldcorp to be materially different from future results,
performances or achievements expressed or implied by such statements. Such statements and information are based on numerous assumptions regarding present and future business strategies and the
environment in which Goldcorp will operate in the future, including the price of gold and other by-product metals, anticipated costs and ability to achieve goals. Certain important factors that could cause actual
results, performances or achievements to differ materially from those in the forward-looking statements include, among others, gold and other by-product metals price volatility, discrepancies between actual and
estimated production, mineral reserves and mineral resources and metallurgical recoveries, mining operational and development risks, litigation risks, regulatory restrictions (including environmental regulatory
restrictions and liability), changes in national and local government legislation, taxation, controls or regulations and/or change in the administration of laws, policies and practices, expropriation or nationalization of
property and political or economic developments in Canada, the United States and other jurisdictions in which the Company does or may carry on business in the future, delays, suspension and technical
challenges associated with capital projects, higher prices for fuel, steel, power, labour and other consumables, currency fluctuations, the speculative nature of gold exploration, the global economic climate,
dilution, share price volatility, competition, loss of key employees, additional funding requirements and defective title to mineral claims or property. Although Goldcorp believes its expectations are based upon
reasonable assumptions and has attempted to identify important factors that could cause actual actions, events or results to differ materially from those described in forward-looking statements, there may be other
factors that cause actions, events or results not to be as anticipated, estimated or intended.
Forward-looking statements are subject to known and unknown risks, uncertainties and other important factors that may cause the actual results, level of activity, performance or achievements of Goldcorp to be
materially different from those expressed or implied by such forward-looking statements, including but not limited to: risks related to international operations including economic and political instability in foreign
jurisdictions in which Goldcorp operates; risks related to current global financial conditions; risks related to joint venture operations; actual results of current exploration activities; actual results of current
reclamation activities; environmental risks; conclusions of economic evaluations; changes in project parameters as plans continue to be refined; future prices of gold and other by-product metals; possible
variations in ore reserves, grade or recovery rates; failure of plant, equipment or processes to operate as anticipated; risks related to the integration of acquisitions; accidents, labour disputes; delays in obtaining
governmental approvals or financing or in the completion of development or construction activities and other risks of the mining industry, as well as those factors discussed in the section entitled “Description of the
Business – Risk Factors” in Goldcorp’s most recent annual information form available on SEDAR at www.sedar.com and on EDGAR at www.sec.gov. Although Goldcorp has attempted to identify important factors
that could cause actual results to differ materially from those contained in forward-looking statements, there may be other factors that cause results not to be as anticipated, estimated or intended. There can be no
assurance that such statements will prove to be accurate, as actual results and future events could differ materially from those anticipated in such statements. Accordingly, readers should not place undue reliance
on forward-looking statements. Forward-looking statements are made as of the date hereof and, accordingly, are subject to change after such date. Except as otherwise indicated by Goldcorp, these statements do
not reflect the potential impact of any non-recurring or other special items or of any dispositions, monetizations, mergers, acquisitions, other business combinations or other transactions that may be announced or
that may occur after the date hereof. Forward-looking statements are provided for the purpose of providing information about management’s current expectations and plans and allowing investors and others to get
a better understanding of the Company’s operating environment. Goldcorp does not intend or undertake to publicly update any forward-looking statements that are included in this document, whether as a result of
new information, future events or otherwise, except in accordance with applicable securities laws.
Forward-Looking Statements
3
TOGETHER, CREATING SUSTAINABLE VALUE | MAY 2016
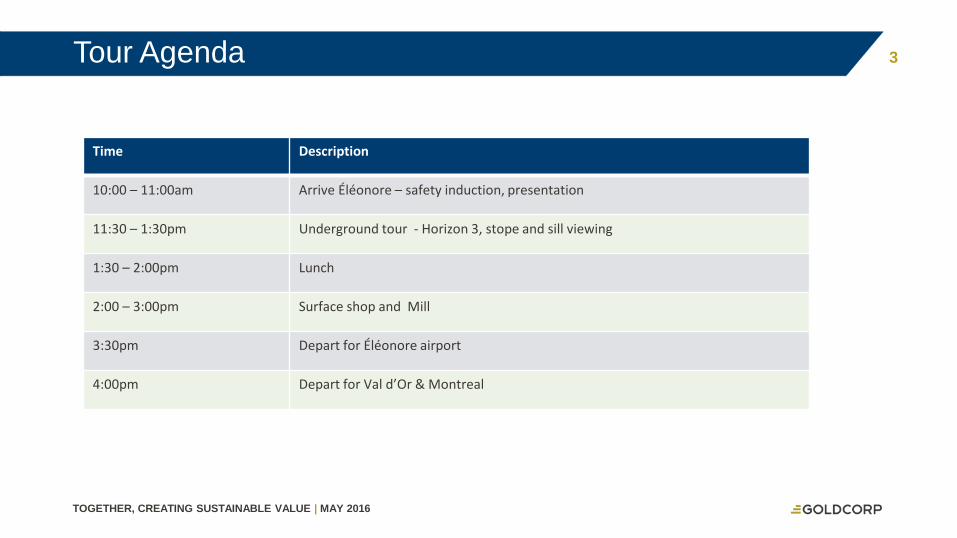
Tour Agenda
Time Description
10:00 – 11:00am Arrive Éléonore – safety induction, presentation
11:30 – 1:30pm Underground tour - Horizon 3, stope and sill viewing
1:30 – 2:00pm Lunch
2:00 – 3:00pm Surface shop and Mill
3:30pm Depart for Éléonore airport
4:00pm Depart for Val d’Or & Montreal
4
TOGETHER, CREATING SUSTAINABLE VALUE | MAY 2016
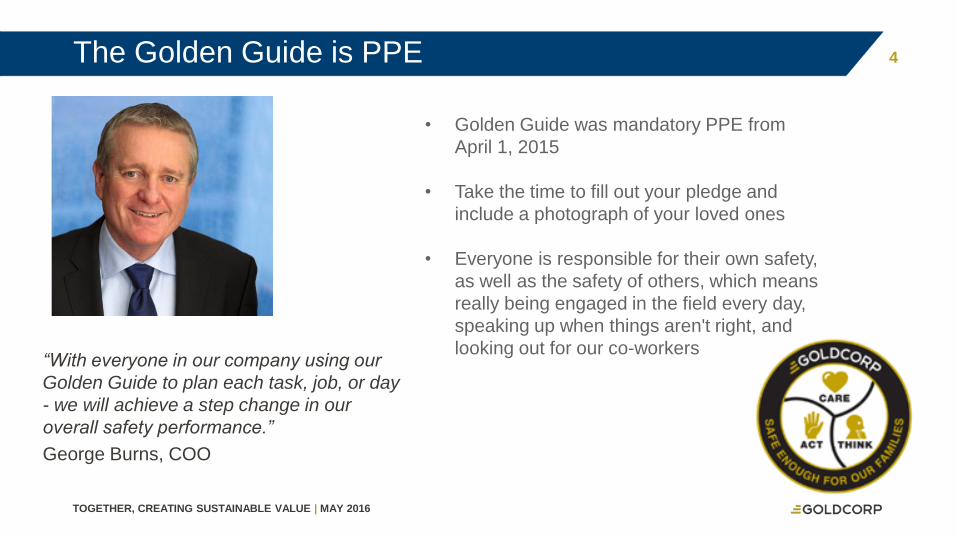
The Golden Guide is PPE
“With everyone in our company using our
Golden Guide to plan each task, job, or day
- we will achieve a step change in our
overall safety performance.”
George Burns, COO
• Golden Guide was mandatory PPE from
April 1, 2015
• Take the time to fill out your pledge and
include a photograph of your loved ones
• Everyone is responsible for their own safety,
as well as the safety of others, which means
really being engaged in the field every day,
speaking up when things aren't right, and
looking out for our co-workers
5
TOGETHER, CREATING SUSTAINABLE VALUE | MAY 2016
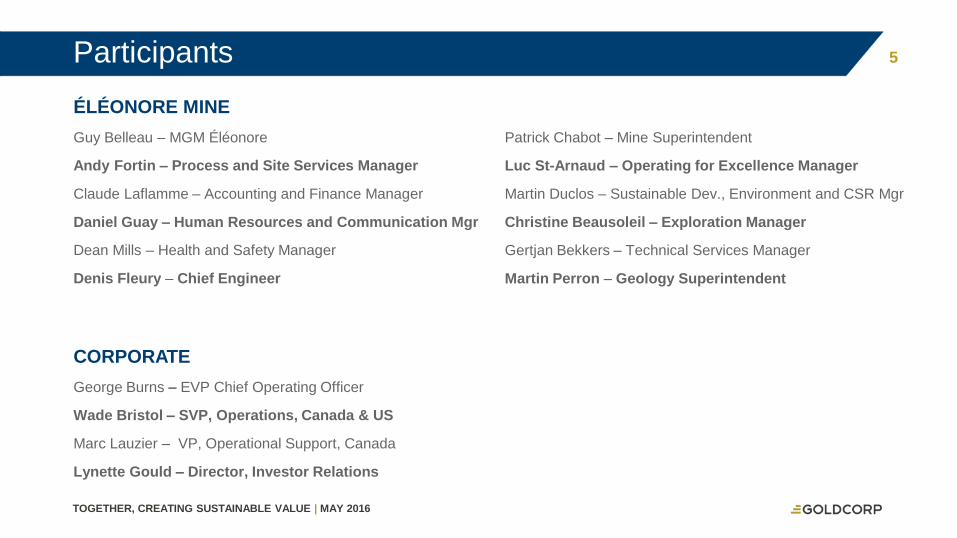
Participants
ÉLÉONORE MINE
Guy Belleau – MGM Éléonore
Andy Fortin – Process and Site Services Manager
Claude Laflamme – Accounting and Finance Manager
Daniel Guay – Human Resources and Communication Mgr
Dean Mills – Health and Safety Manager
Denis Fleury – Chief Engineer
Patrick Chabot – Mine Superintendent
Luc St-Arnaud – Operating for Excellence Manager
Martin Duclos – Sustainable Dev., Environment and CSR Mgr
Christine Beausoleil – Exploration Manager
Gertjan Bekkers – Technical Services Manager
Martin Perron – Geology Superintendent
CORPORATE
George Burns – EVP Chief Operating Officer
Wade Bristol – SVP, Operations, Canada & US
Marc Lauzier – VP, Operational Support, Canada
Lynette Gould – Director, Investor Relations
6
TOGETHER, CREATING SUSTAINABLE VALUE | MAY 2016
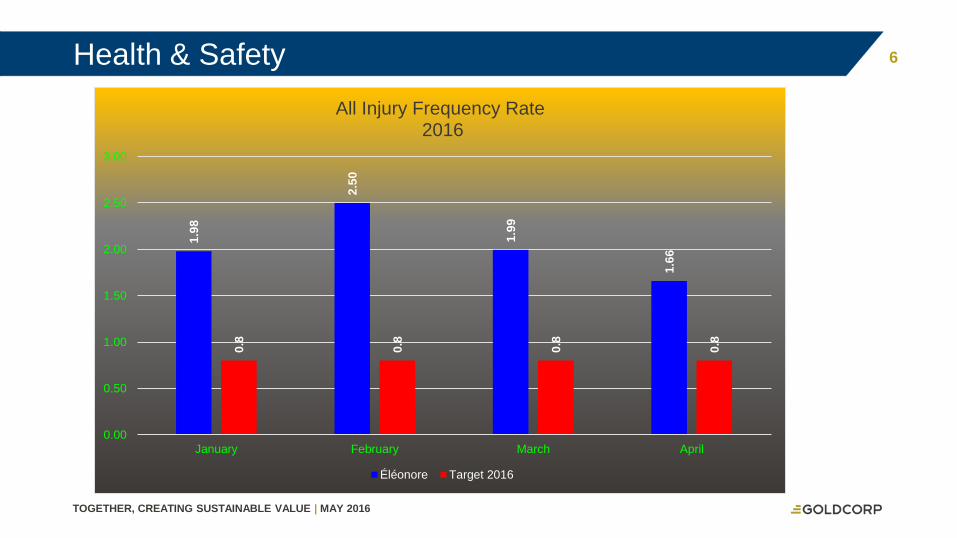
Health & Safety
1.9
8
2.5
0
1.9
9
1.6
6
0.8
0.8
0.8
0.8
0.00
0.50
1.00
1.50
2.00
2.50
3.00
January February March April
All Injury Frequency Rate2016
Éléonore Target 2016
7
TOGETHER, CREATING SUSTAINABLE VALUE | MAY 2016
Table of Contents
INAUGURATION
LOCATION / OVERVIEW
OPERATION RAMP-UP
EXPLORATION
OPERATING FOR EXCELLENCE
BUILDING PARTNERSHIPS
8
TOGETHER, CREATING SUSTAINABLE VALUE | MAY 2016
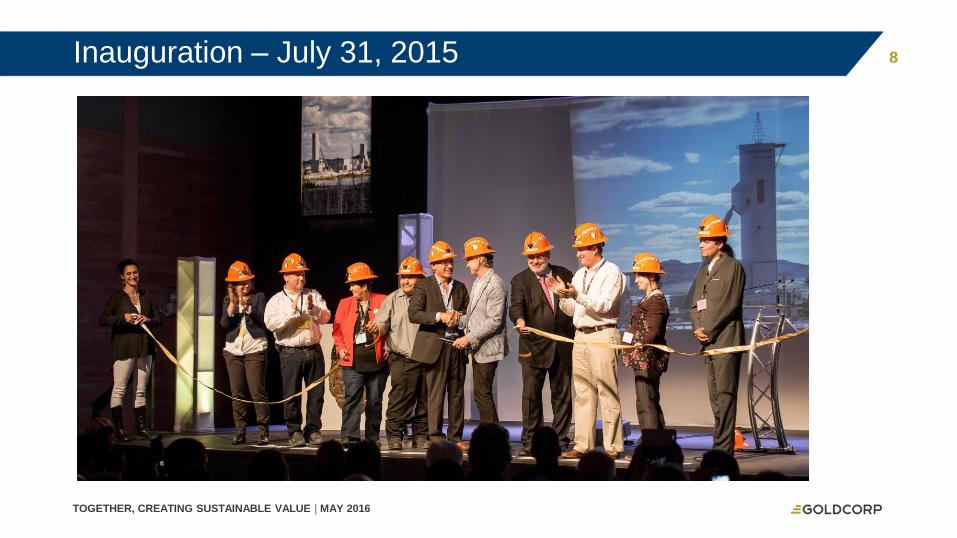
Inauguration – July 31, 2015
9
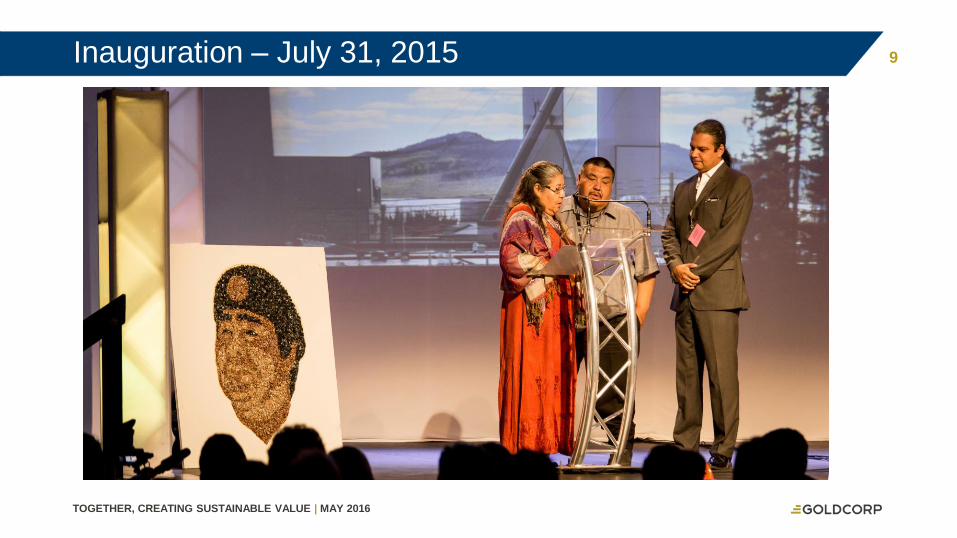
TOGETHER, CREATING SUSTAINABLE VALUE | MAY 2016
Inauguration – July 31, 2015
10
TOGETHER, CREATING SUSTAINABLE VALUE | MAY 2016
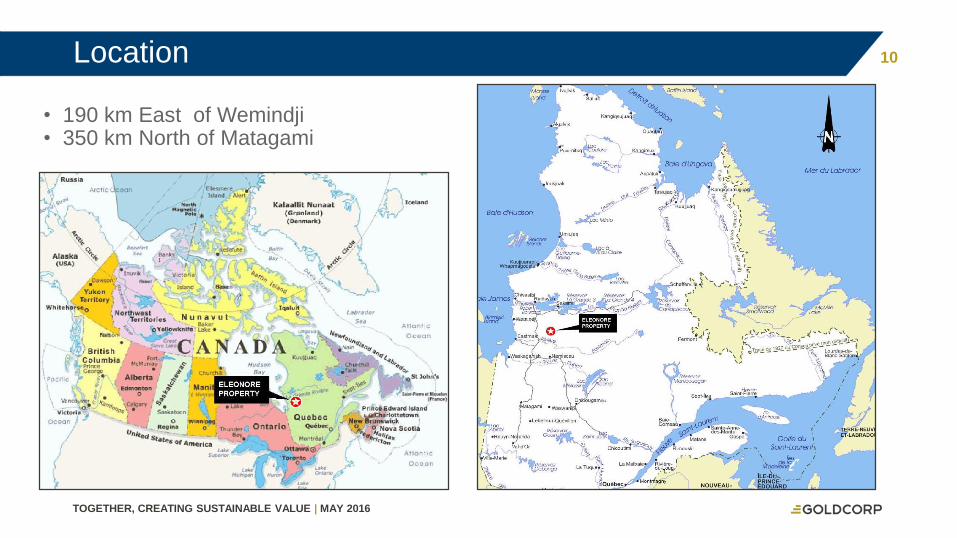
Location
• 190 km East of Wemindji• 350 km North of Matagami
11
TOGETHER, CREATING SUSTAINABLE VALUE | MAY 2016
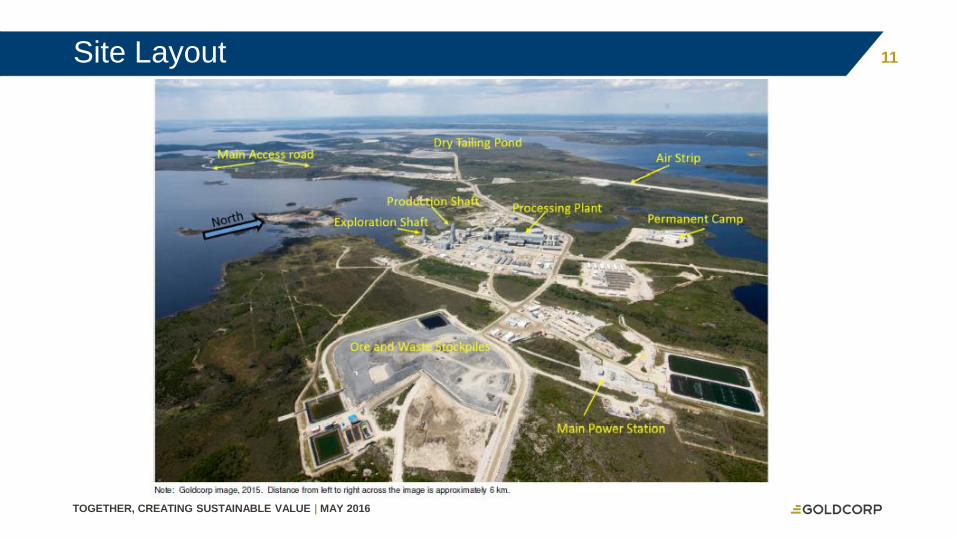
Site Layout
12
TOGETHER, CREATING SUSTAINABLE VALUE | MAY 2016
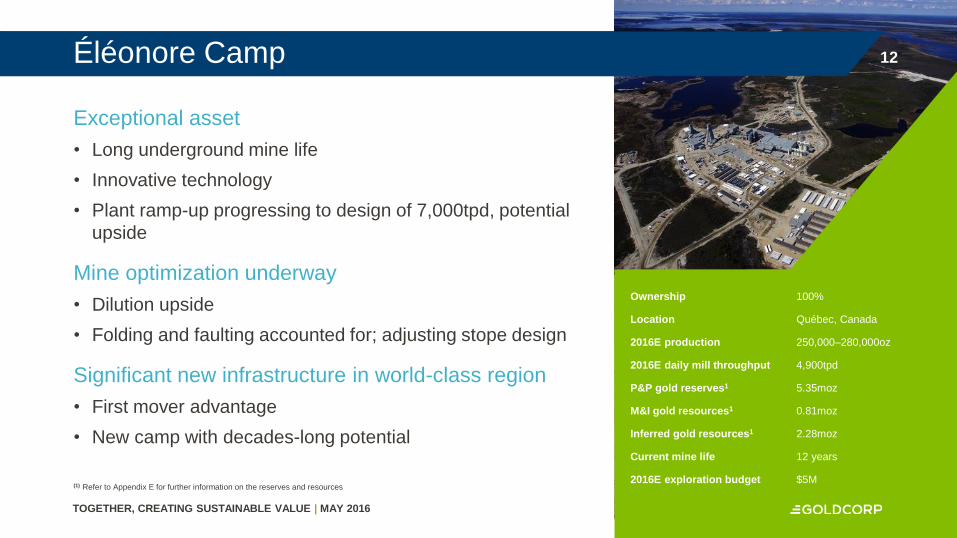
Click to edit Master title style 12
Exceptional asset
• Long underground mine life
• Innovative technology
• Plant ramp-up progressing to design of 7,000tpd, potential
upside
Mine optimization underway
• Dilution upside
• Folding and faulting accounted for; adjusting stope design
Significant new infrastructure in world-class region
• First mover advantage
• New camp with decades-long potential
12Éléonore Camp
Ownership 100%
Location Québec, Canada
2016E production 250,000–280,000oz
2016E daily mill throughput 4,900tpd
P&P gold reserves1 5.35moz
M&I gold resources1 0.81moz
Inferred gold resources1 2.28moz
Current mine life 12 years
2016E exploration budget $5M(1) Refer to Appendix E for further information on the reserves and resources
13
TOGETHER, CREATING SUSTAINABLE VALUE | MAY 2016
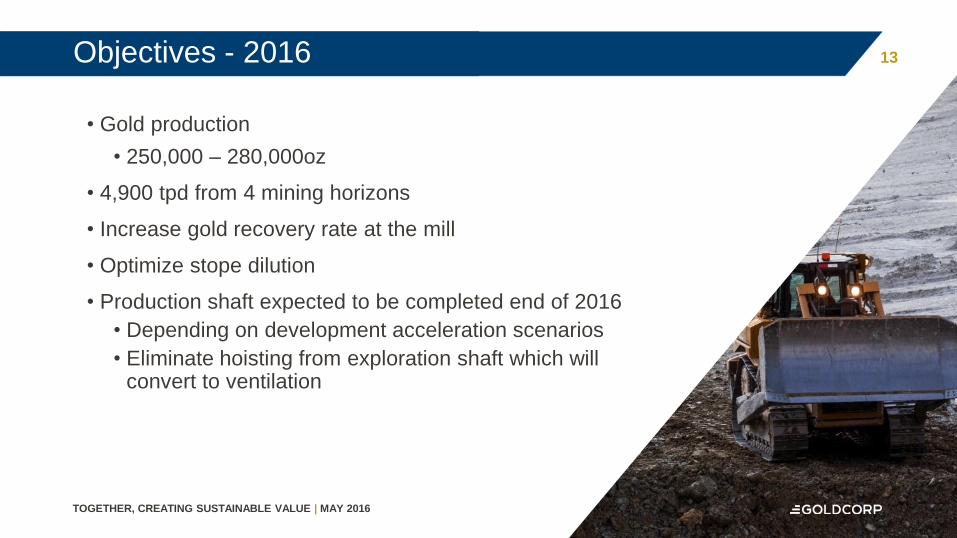
13Objectives - 2016
• Gold production
• 250,000 – 280,000oz
• 4,900 tpd from 4 mining horizons
• Increase gold recovery rate at the mill
• Optimize stope dilution
• Production shaft expected to be completed end of 2016
• Depending on development acceleration scenarios
• Eliminate hoisting from exploration shaft which will convert to ventilation
14
TOGETHER, CREATING SUSTAINABLE VALUE | MAY 2016
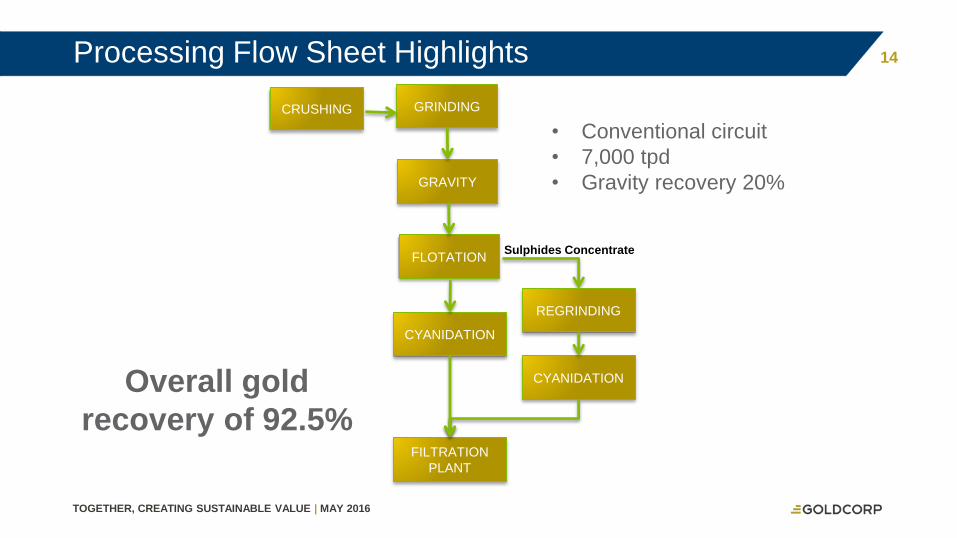
Processing Flow Sheet Highlights
CRUSHING GRINDING
GRAVITY
FLOTATION
CYANIDATION
CYANIDATION
FILTRATION
PLANT
Sulphides Concentrate
REGRINDING
Overall gold
recovery of 92.5%
• Conventional circuit
• 7,000 tpd
• Gravity recovery 20%
15
TOGETHER, CREATING SUSTAINABLE VALUE | MAY 2016
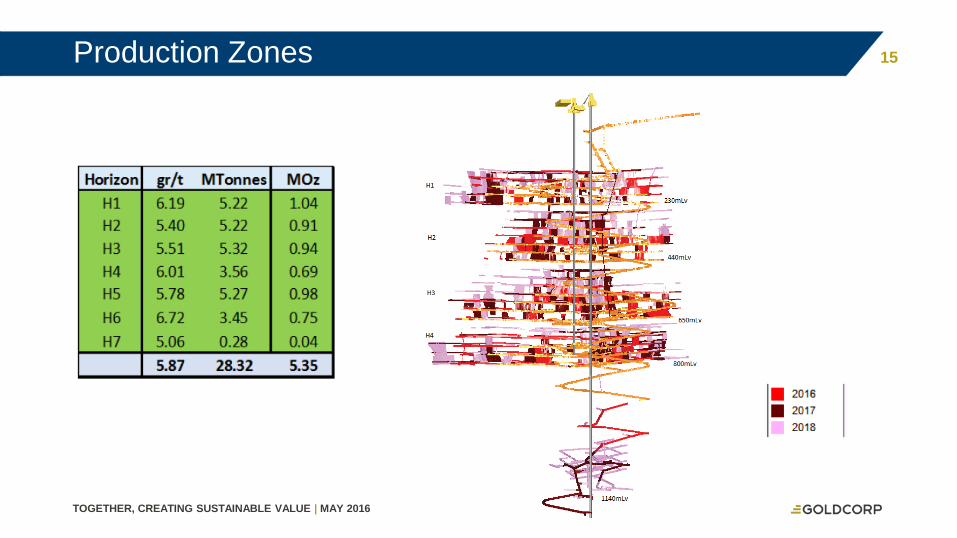
Production Zones
16
TOGETHER, CREATING SUSTAINABLE VALUE | MAY 2016
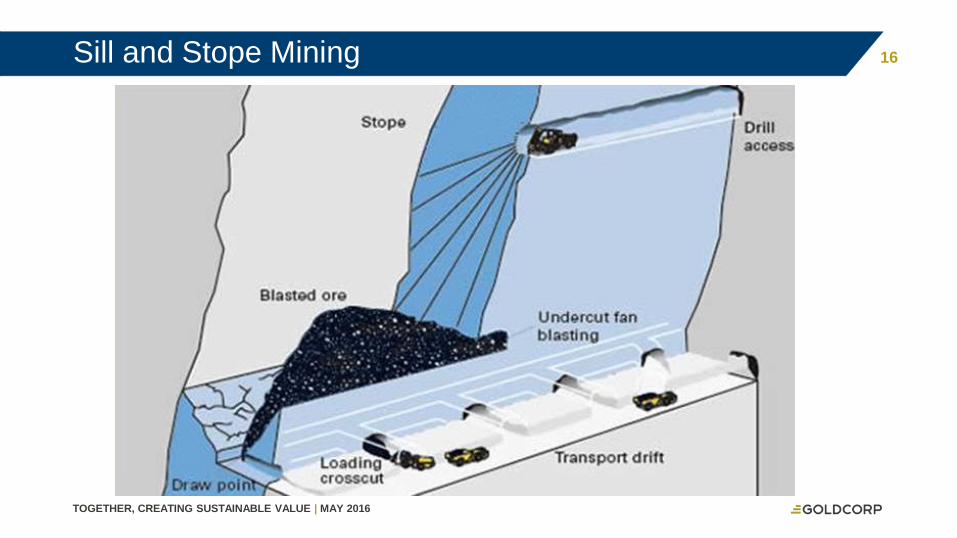
Sill and Stope Mining

17
TOGETHER, CREATING SUSTAINABLE VALUE | MAY 2016
Theoretical Representation of the Geological Complexity of the Resources
Indicated Shape
Stope limit
Updated Mine Shape
60% more tonnage
10% more ounces
25% less grade
Measured Shape (after development)
Modified Mine Shape
18
TOGETHER, CREATING SUSTAINABLE VALUE | MAY 2016
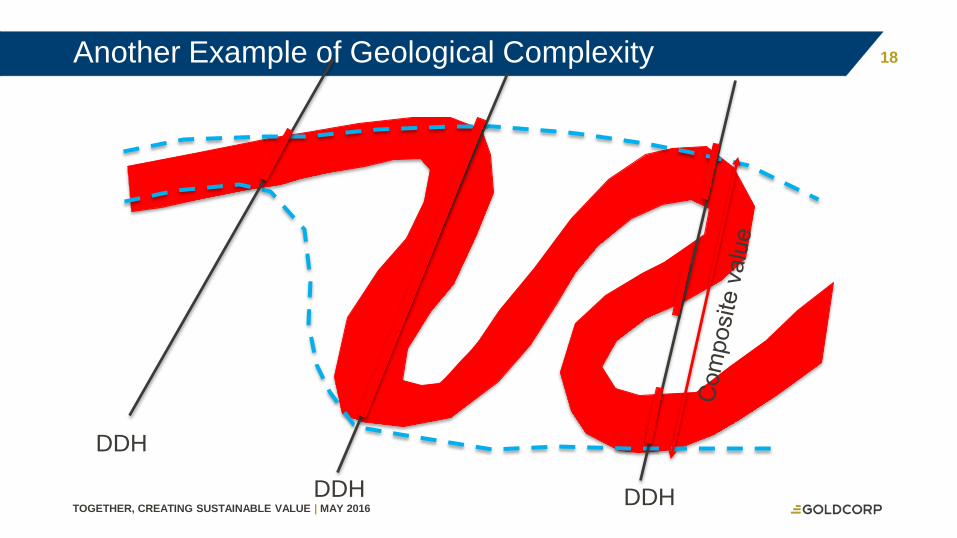
Another Example of Geological Complexity
DDH
DDH DDH
19
TOGETHER, CREATING SUSTAINABLE VALUE | MAY 2016
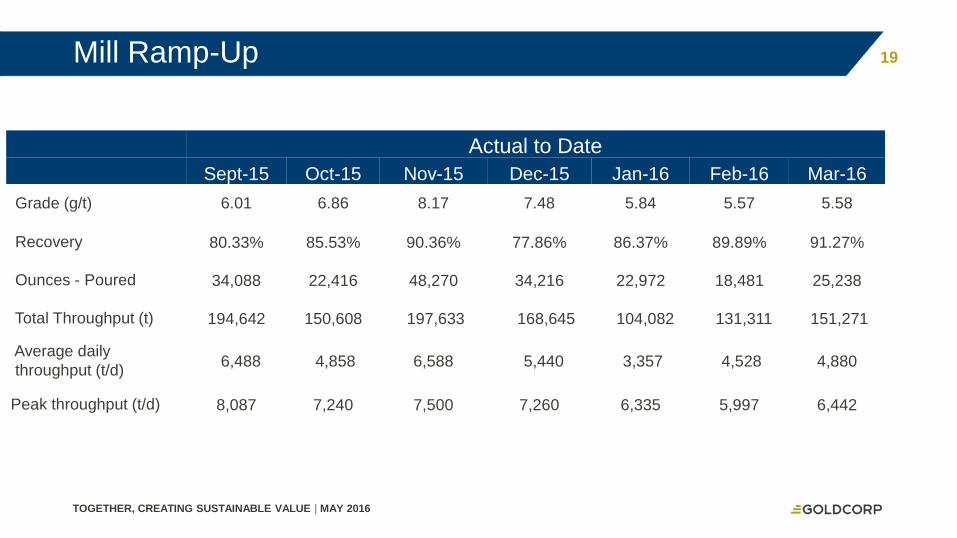
Mill Ramp-Up
Actual to Date
Sept-15 Oct-15 Nov-15 Dec-15 Jan-16 Feb-16 Mar-16
Grade (g/t) 6.01 6.86 8.17 7.48 5.84 5.57 5.58
Recovery 80.33% 85.53% 90.36% 77.86% 86.37% 89.89% 91.27%
Ounces - Poured 34,088 22,416 48,270 34,216 22,972 18,481 25,238
Total Throughput (t) 194,642 150,608 197,633 168,645 104,082 131,311 151,271
Average daily
throughput (t/d)6,488 4,858 6,588 5,440 3,357 4,528 4,880
Peak throughput (t/d) 8,087 7,240 7,500 7,260 6,335 5,997 6,442

20
TOGETHER, CREATING SUSTAINABLE VALUE | MAY 2016
Photos
21
TOGETHER, CREATING SUSTAINABLE VALUE | MAY 2016
Photos
22
TOGETHER, CREATING SUSTAINABLE VALUE | MAY 2016
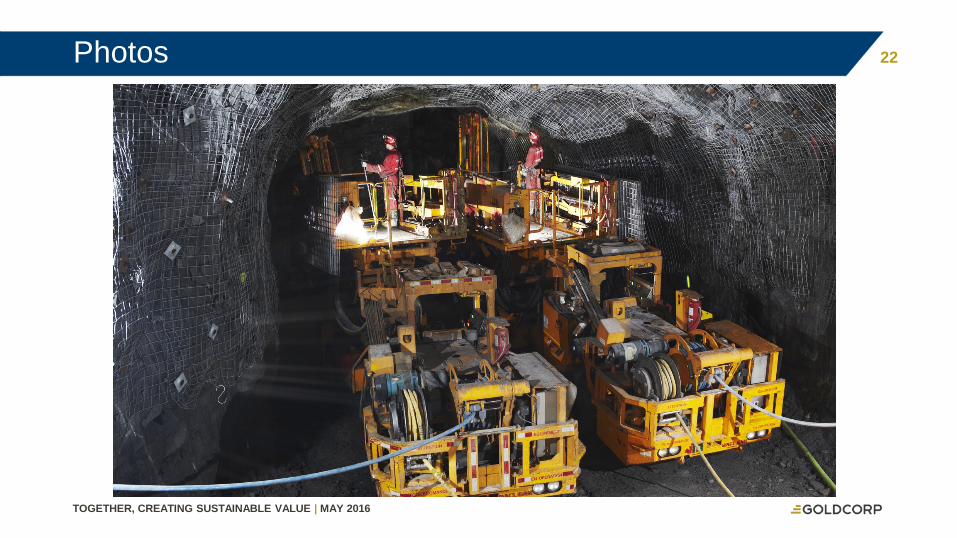
Photos
23
TOGETHER, CREATING SUSTAINABLE VALUE | MAY 2016
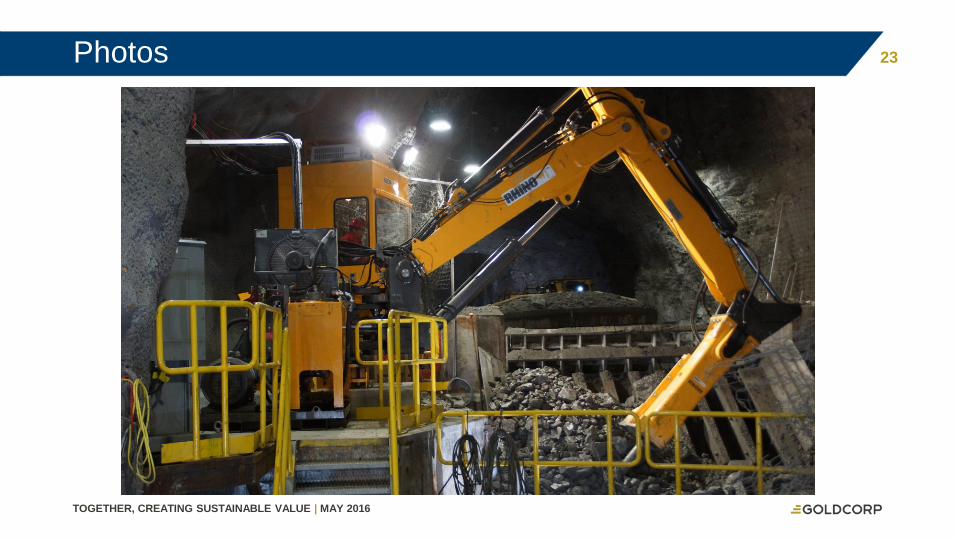
Photos
24
TOGETHER, CREATING SUSTAINABLE VALUE | MAY 2016
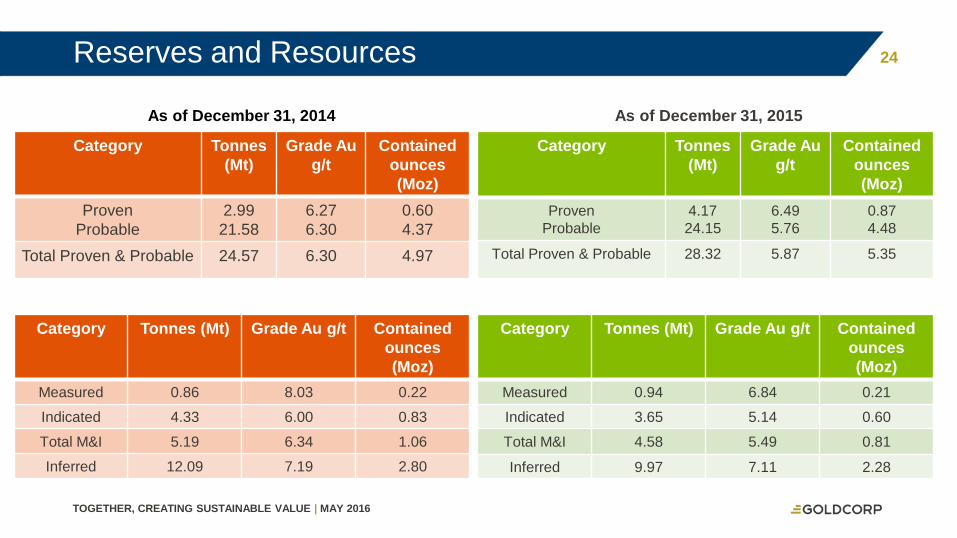
Reserves and Resources
Category Tonnes (Mt) Grade Au g/t Contained
ounces
(Moz)
Measured 0.94 6.84 0.21
Indicated 3.65 5.14 0.60
Total M&I 4.58 5.49 0.81
Inferred 9.97 7.11 2.28
Category Tonnes (Mt) Grade Au g/t Contained
ounces
(Moz)
Measured 0.86 8.03 0.22
Indicated 4.33 6.00 0.83
Total M&I 5.19 6.34 1.06
Inferred 12.09 7.19 2.80
Category Tonnes
(Mt)
Grade Au
g/t
Contained
ounces
(Moz)
Proven
Probable
4.17
24.15
6.49
5.76
0.87
4.48
Total Proven & Probable 28.32 5.87 5.35
Category Tonnes
(Mt)
Grade Au
g/t
Contained
ounces
(Moz)
Proven
Probable
2.99
21.58
6.27
6.30
0.60
4.37
Total Proven & Probable 24.57 6.30 4.97
As of December 31, 2015As of December 31, 2014
25
TOGETHER, CREATING SUSTAINABLE VALUE | MAY 2016
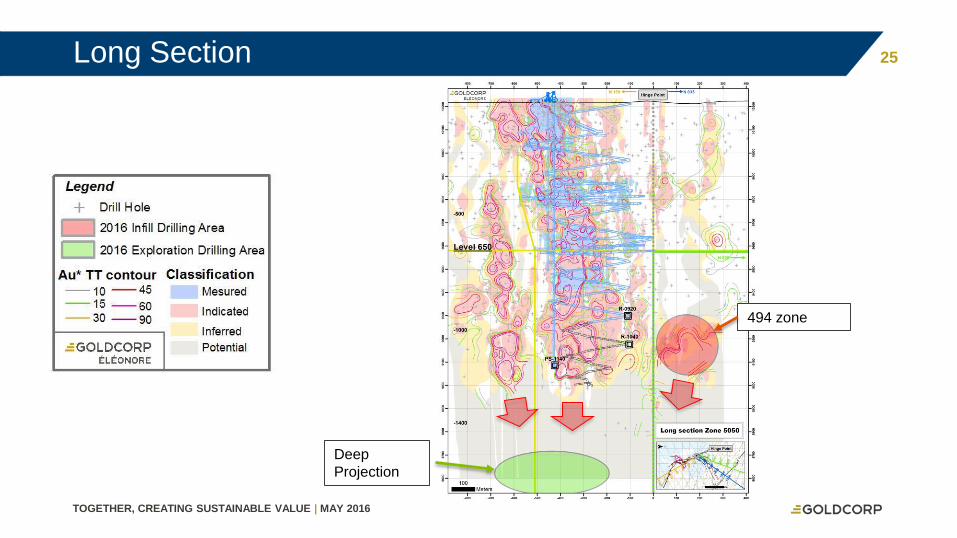
Long Section
494 zone
Deep
Projection
26
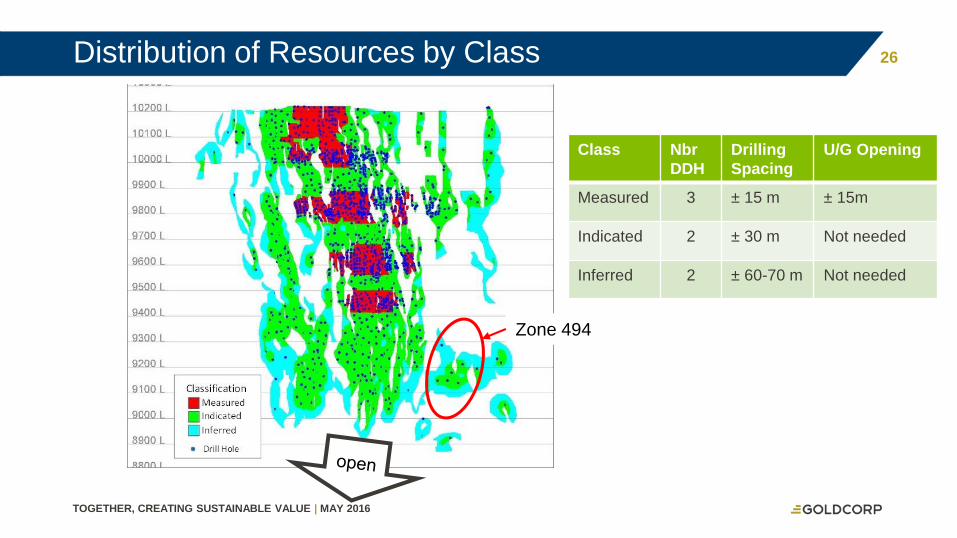
TOGETHER, CREATING SUSTAINABLE VALUE | MAY 2016
Distribution of Resources by Class
Zone 494
Class Nbr
DDH
Drilling
Spacing
U/G Opening
Measured 3 ± 15 m ± 15m
Indicated 2 ± 30 m Not needed
Inferred 2 ± 60-70 m Not needed
27
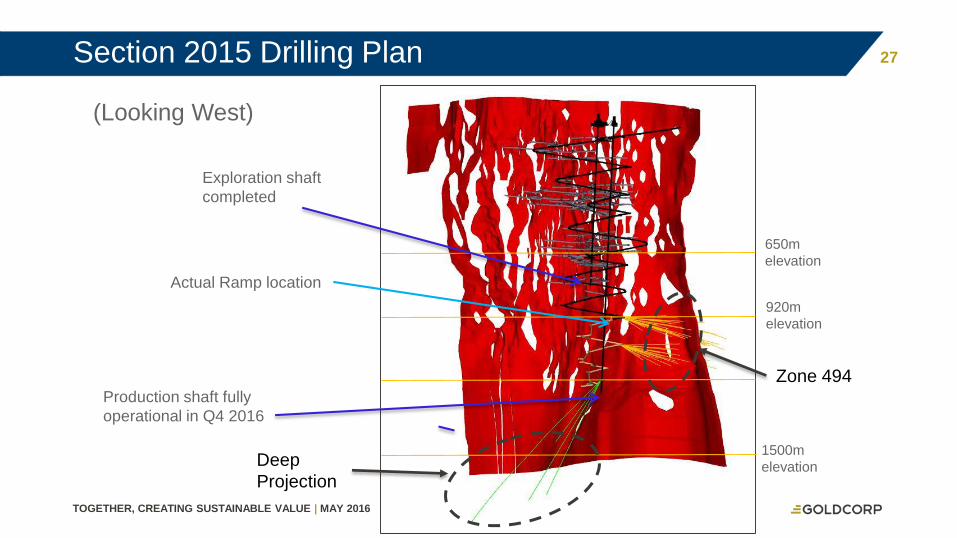
TOGETHER, CREATING SUSTAINABLE VALUE | MAY 2016
T E X T L I N E 2
650m
elevation
920m
elevation
Actual Ramp location
1500m
elevation
(Looking West)
Production shaft fully
operational in Q4 2016
Exploration shaft
completed
Section 2015 Drilling Plan
Zone 494
Deep
Projection
28
TOGETHER, CREATING SUSTAINABLE VALUE | MAY 2016
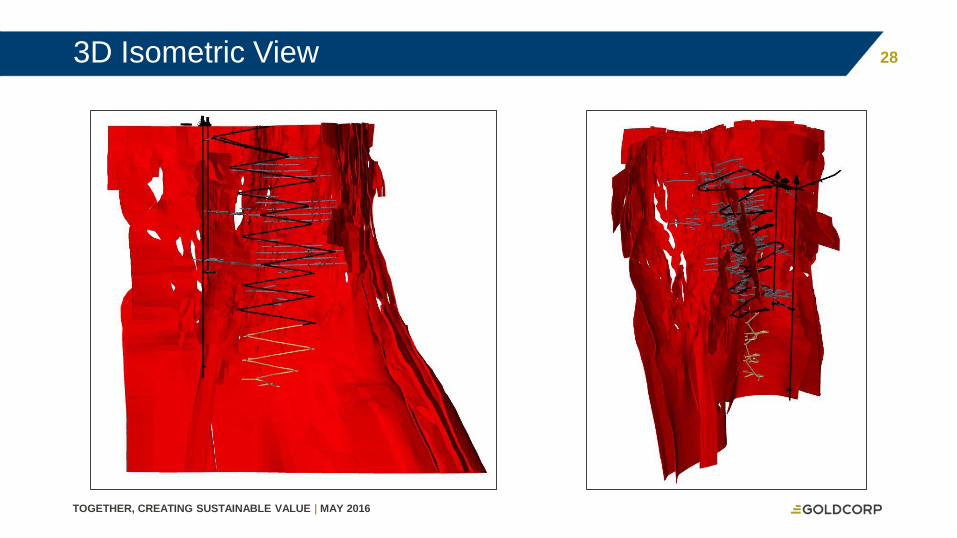
3D Isometric View
29
TOGETHER, CREATING SUSTAINABLE VALUE | MAY 2016
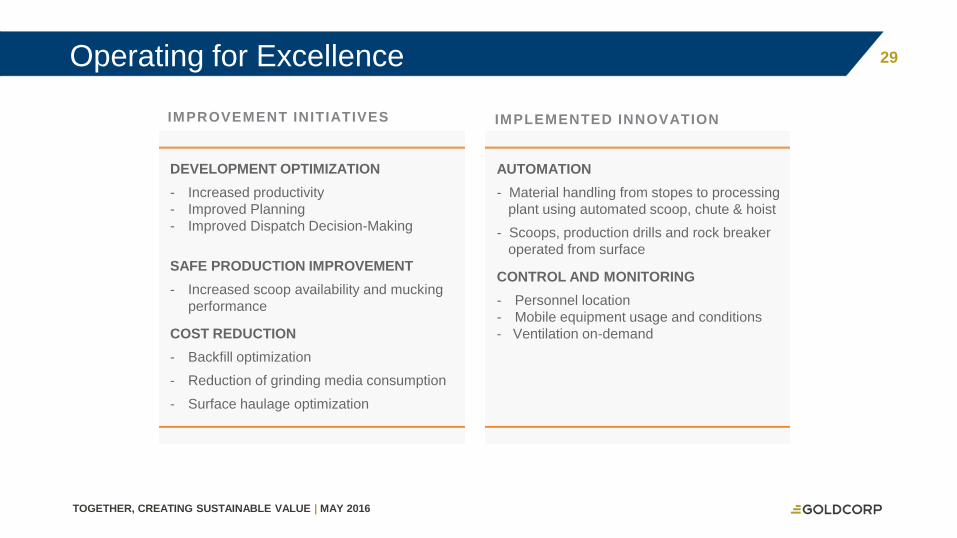
Operating for Excellence
DEVELOPMENT OPTIMIZATION
- Increased productivity
- Improved Planning
- Improved Dispatch Decision-Making
SAFE PRODUCTION IMPROVEMENT
- Increased scoop availability and mucking
performance
COST REDUCTION
- Backfill optimization
- Reduction of grinding media consumption
- Surface haulage optimization
IMPROVEMENT INITIATIVES IMPLEMENTED INNOVATION
AUTOMATION
- Material handling from stopes to processing
plant using automated scoop, chute & hoist
- Scoops, production drills and rock breaker
operated from surface
CONTROL AND MONITORING
- Personnel location
- Mobile equipment usage and conditions
- Ventilation on-demand
Operating for Excellence
30
TOGETHER, CREATING SUSTAINABLE VALUE | MAY 2016
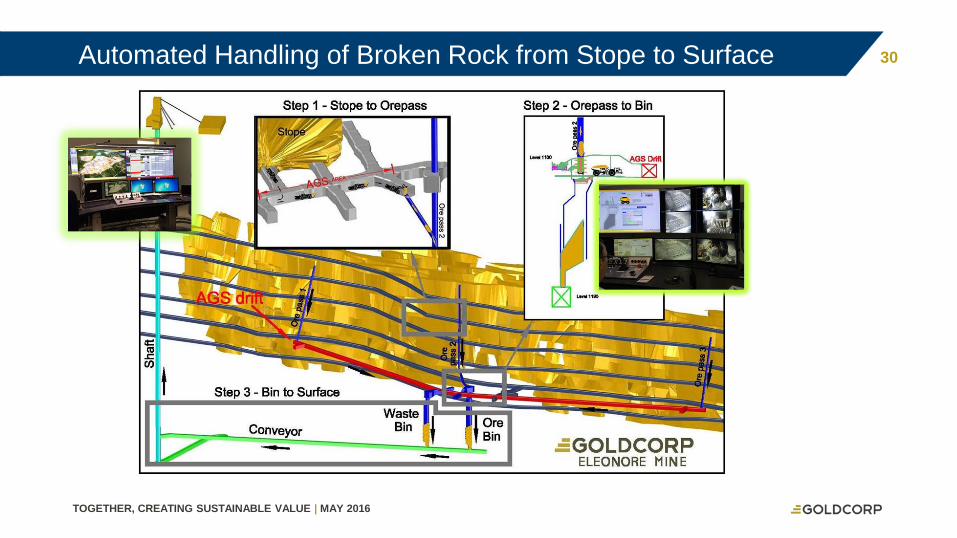
Automated Handling of Broken Rock from Stope to Surface
Automated Handling of Broken Rock from Stope to Surface
31
TOGETHER, CREATING SUSTAINABLE VALUE | MAY 2016
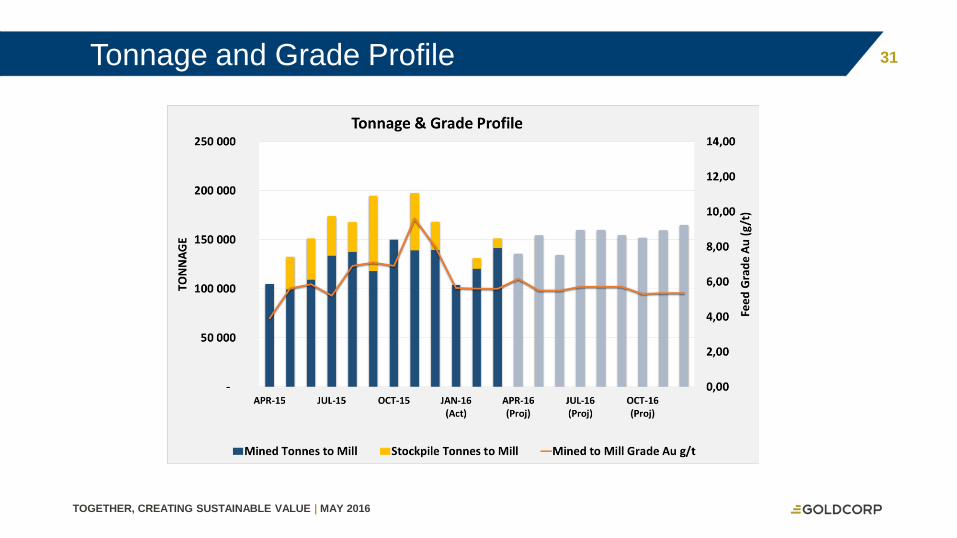
Tonnage and Grade Profile
Tonnage and Grade Profile
32
TOGETHER, CREATING SUSTAINABLE VALUE | MAY 2016
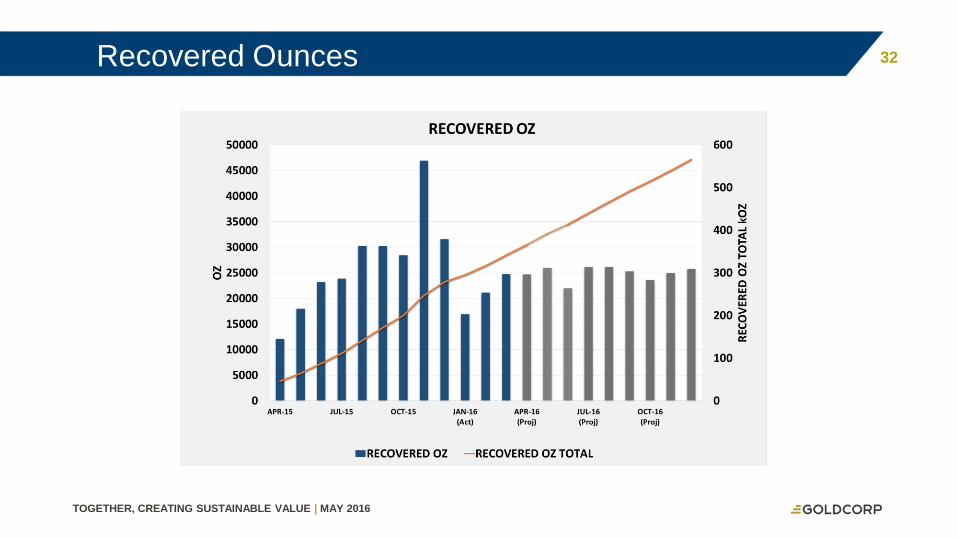
Recovered Ounces
Recovered Ounces
33
TOGETHER, CREATING SUSTAINABLE VALUE | MAY 2016
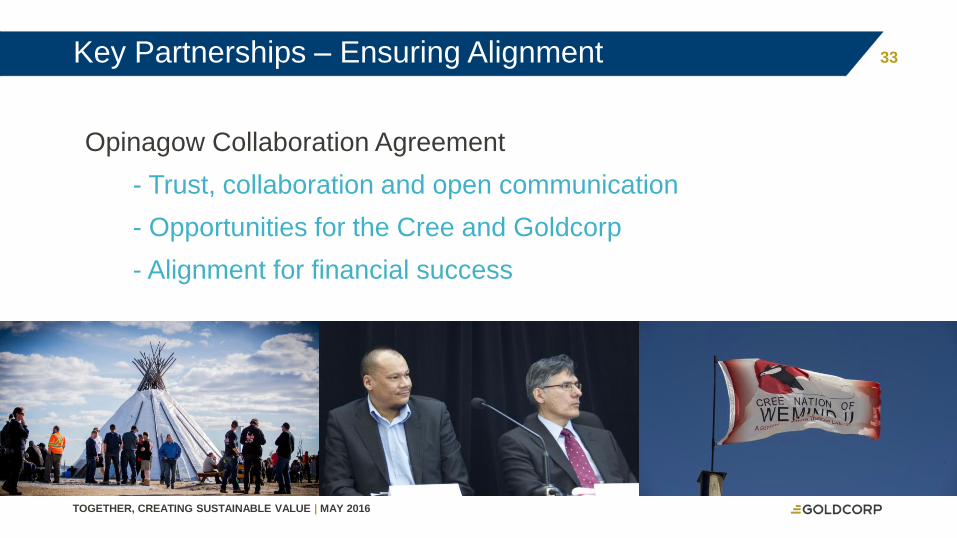
Key Partnerships – Ensuring Alignment
Opinagow Collaboration Agreement
- Trust, collaboration and open communication
- Opportunities for the Cree and Goldcorp
- Alignment for financial success
34
TOGETHER, CREATING SUSTAINABLE VALUE | MAY 2016
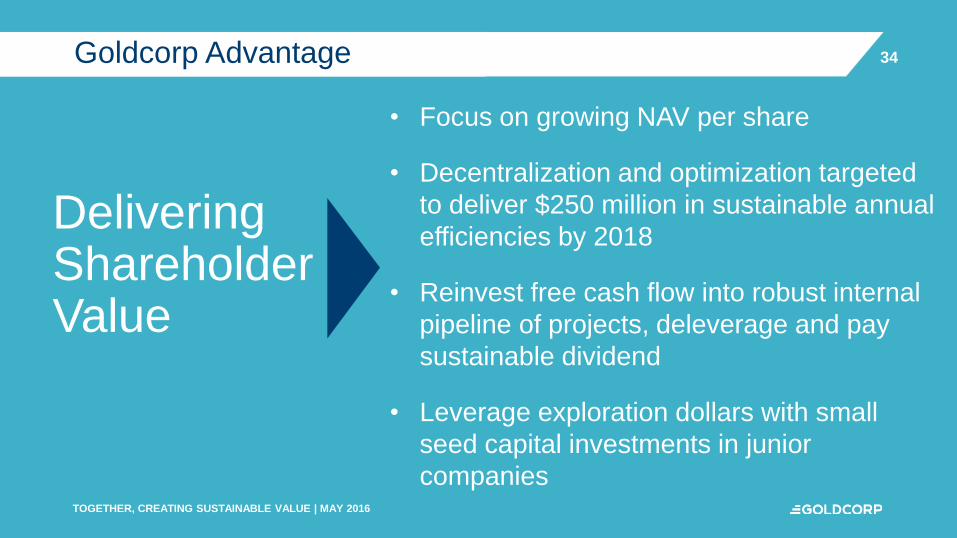
34Goldcorp Advantage
Delivering Shareholder Value
• Focus on growing NAV per share
• Decentralization and optimization targeted
to deliver $250 million in sustainable annual
efficiencies by 2018
• Reinvest free cash flow into robust internal
pipeline of projects, deleverage and pay
sustainable dividend
• Leverage exploration dollars with small
seed capital investments in junior
companies
35
TOGETHER, CREATING SUSTAINABLE VALUE | MAY 2016
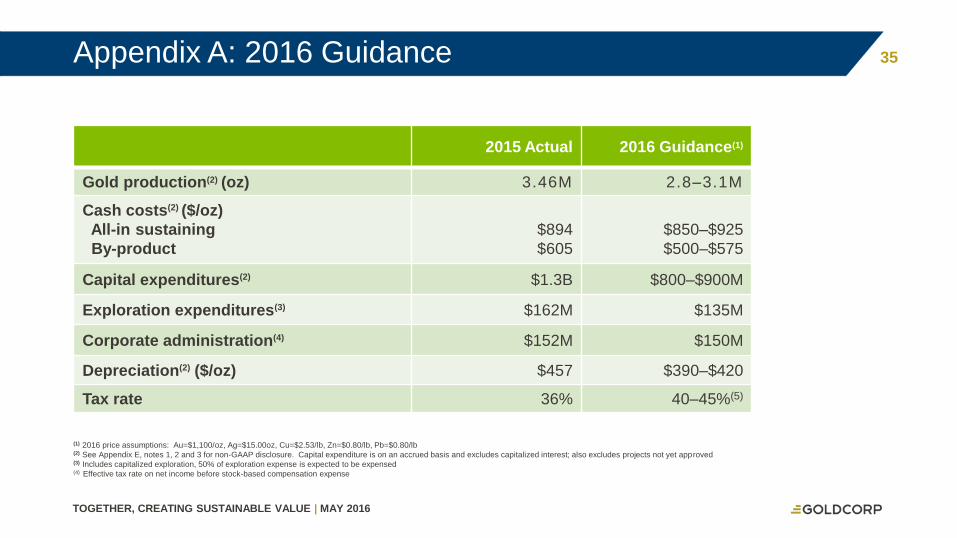
2015 Actual 2016 Guidance(1)
Gold production(2) (oz) 3.46M 2.8–3.1M
Cash costs(2) ($/oz)
All-in sustaining
By-product
$894
$605
$850–$925
$500–$575
Capital expenditures(2) $1.3B $800–$900M
Exploration expenditures(3) $162M $135M
Corporate administration(4) $152M $150M
Depreciation(2) ($/oz) $457 $390–$420
Tax rate 36% 40–45%(5)
(1) 2016 price assumptions: Au=$1,100/oz, Ag=$15.00oz, Cu=$2.53/lb, Zn=$0.80/lb, Pb=$0.80/lb(2) See Appendix E, notes 1, 2 and 3 for non-GAAP disclosure. Capital expenditure is on an accrued basis and excludes capitalized interest; also excludes projects not yet approved(3) Includes capitalized exploration, 50% of exploration expense is expected to be expensed(4) Effective tax rate on net income before stock-based compensation expense
Appendix A: 2016 Guidance
36
TOGETHER, CREATING SUSTAINABLE VALUE | MAY 2016
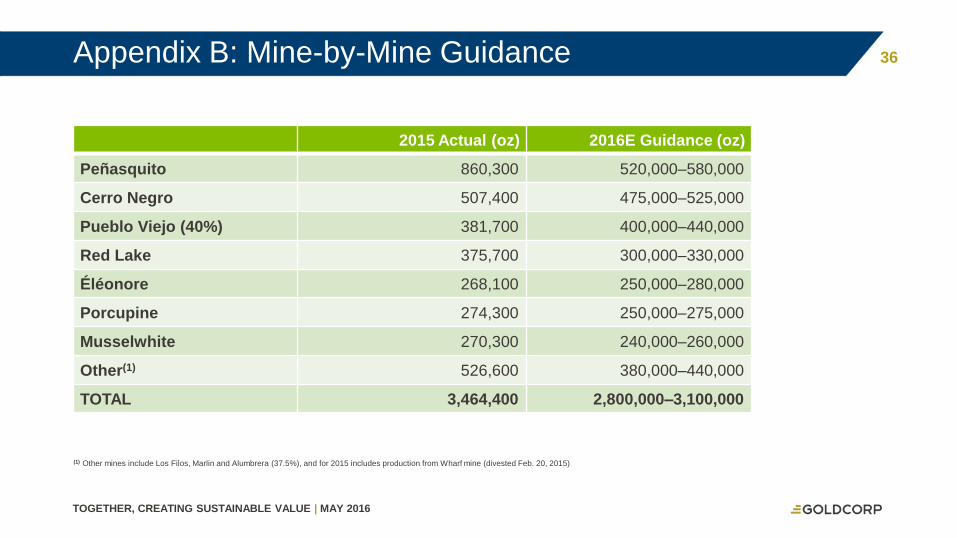
2015 Actual (oz) 2016E Guidance (oz)
Peñasquito 860,300 520,000–580,000
Cerro Negro 507,400 475,000–525,000
Pueblo Viejo (40%) 381,700 400,000–440,000
Red Lake 375,700 300,000–330,000
Éléonore 268,100 250,000–280,000
Porcupine 274,300 250,000–275,000
Musselwhite 270,300 240,000–260,000
Other(1) 526,600 380,000–440,000
TOTAL 3,464,400 2,800,000–3,100,000
(1) Other mines include Los Filos, Marlin and Alumbrera (37.5%), and for 2015 includes production from Wharf mine (divested Feb. 20, 2015)
Appendix B: Mine-by-Mine Guidance
37
TOGETHER, CREATING SUSTAINABLE VALUE | MAY 2016
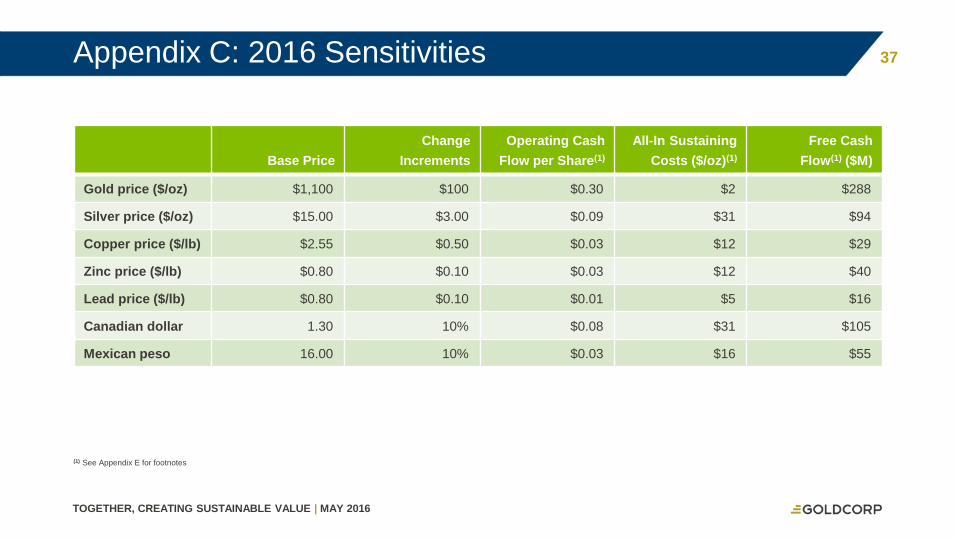
Base Price
Change
Increments
Operating Cash
Flow per Share(1)
All-In Sustaining
Costs ($/oz)(1)
Free Cash
Flow(1) ($M)
Gold price ($/oz) $1,100 $100 $0.30 $2 $288
Silver price ($/oz) $15.00 $3.00 $0.09 $31 $94
Copper price ($/lb) $2.55 $0.50 $0.03 $12 $29
Zinc price ($/lb) $0.80 $0.10 $0.03 $12 $40
Lead price ($/lb) $0.80 $0.10 $0.01 $5 $16
Canadian dollar 1.30 10% $0.08 $31 $105
Mexican peso 16.00 10% $0.03 $16 $55
(1) See Appendix E for footnotes
Appendix C: 2016 Sensitivities
38
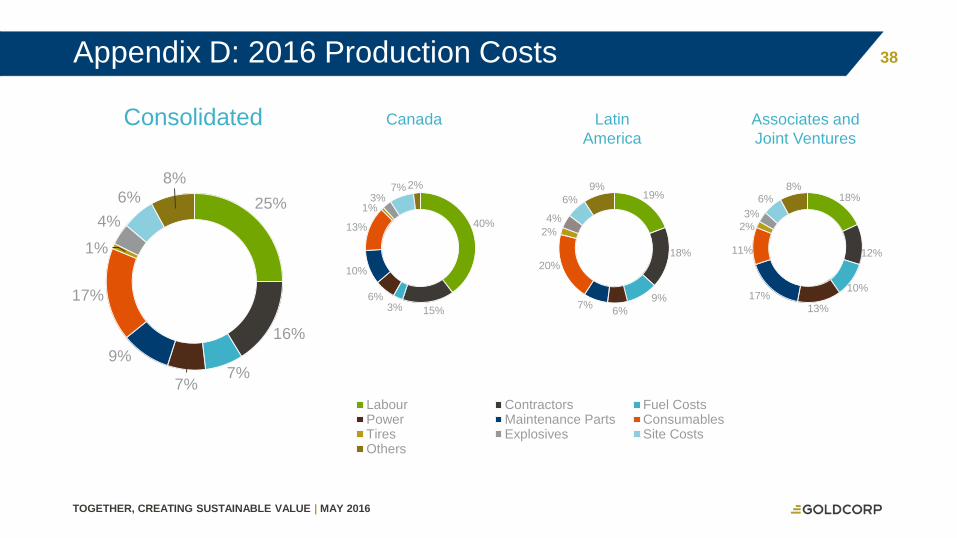
TOGETHER, CREATING SUSTAINABLE VALUE | MAY 2016
25%
16%
7%7%
9%
17%
1%
4%
6%
8%
Labour Contractors Fuel CostsPower Maintenance Parts ConsumablesTires Explosives Site CostsOthers
Latin
America
40%
15%3%6%
10%
13%
1%3%
7% 2%19%
18%
9%
6%7%
20%
2%
4%
6%
9%18%
12%
10%
13%
17%
11%
2%
3%
6%8%
Consolidated Canada Associates and
Joint Ventures
Appendix D: 2016 Production Costs
39
TOGETHER, CREATING SUSTAINABLE VALUE | MAY 2016
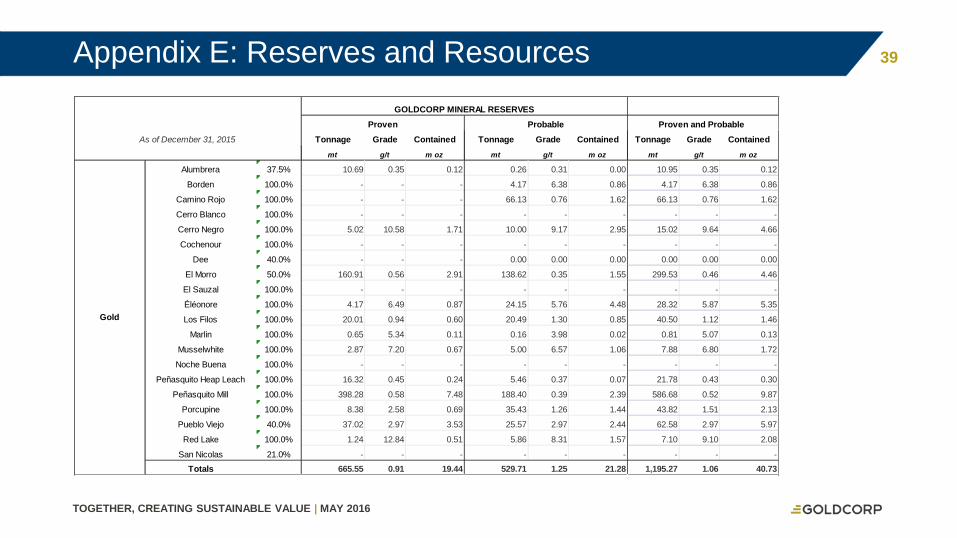
Tonnage Grade Contained Tonnage Grade Contained Tonnage Grade Contained
mt g/t m oz mt g/t m oz mt g/t m oz
Alumbrera 37.5% 10.69 0.35 0.12 0.26 0.31 0.00 10.95 0.35 0.12
Borden 100.0% - - - 4.17 6.38 0.86 4.17 6.38 0.86
Camino Rojo 100.0% - - - 66.13 0.76 1.62 66.13 0.76 1.62
Cerro Blanco 100.0% - - - - - - - - -
Cerro Negro 100.0% 5.02 10.58 1.71 10.00 9.17 2.95 15.02 9.64 4.66
Cochenour 100.0% - - - - - - - - -
Dee 40.0% - - - 0.00 0.00 0.00 0.00 0.00 0.00
El Morro 50.0% 160.91 0.56 2.91 138.62 0.35 1.55 299.53 0.46 4.46
El Sauzal 100.0% - - - - - - - - -
Éléonore 100.0% 4.17 6.49 0.87 24.15 5.76 4.48 28.32 5.87 5.35
Los Filos 100.0% 20.01 0.94 0.60 20.49 1.30 0.85 40.50 1.12 1.46
Marlin 100.0% 0.65 5.34 0.11 0.16 3.98 0.02 0.81 5.07 0.13
Musselwhite 100.0% 2.87 7.20 0.67 5.00 6.57 1.06 7.88 6.80 1.72
Noche Buena 100.0% - - - - - - - - -
Peñasquito Heap Leach 100.0% 16.32 0.45 0.24 5.46 0.37 0.07 21.78 0.43 0.30
Peñasquito Mill 100.0% 398.28 0.58 7.48 188.40 0.39 2.39 586.68 0.52 9.87
Porcupine 100.0% 8.38 2.58 0.69 35.43 1.26 1.44 43.82 1.51 2.13
Pueblo Viejo 40.0% 37.02 2.97 3.53 25.57 2.97 2.44 62.58 2.97 5.97
Red Lake 100.0% 1.24 12.84 0.51 5.86 8.31 1.57 7.10 9.10 2.08
San Nicolas 21.0% - - - - - - - - -
Totals 665.55 0.91 19.44 529.71 1.25 21.28 1,195.27 1.06 40.73
Proven and Probable
Gold
GOLDCORP MINERAL RESERVES
Proven Probable
As of December 31, 2015
Appendix E: Reserves and Resources
40
TOGETHER, CREATING SUSTAINABLE VALUE | MAY 2016
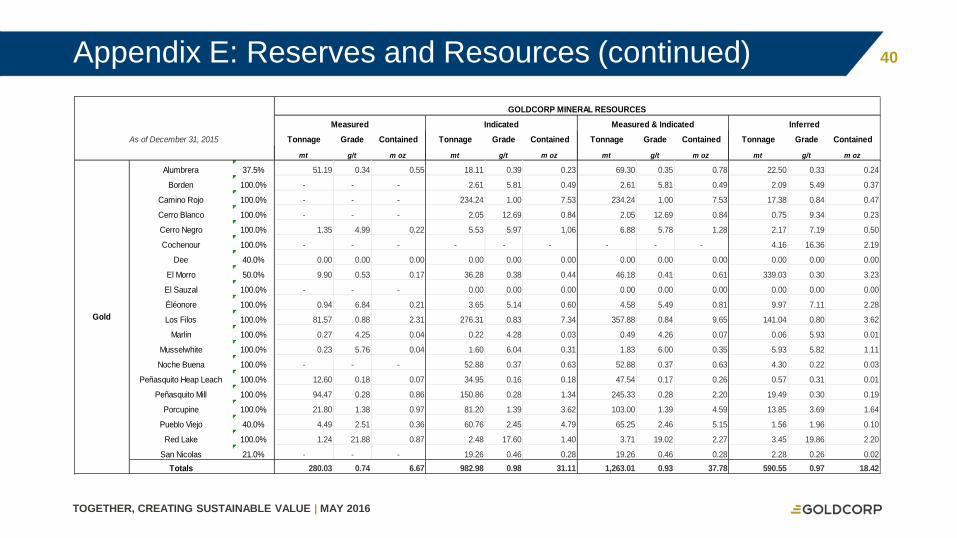
Tonnage Grade Contained Tonnage Grade Contained Tonnage Grade Contained Tonnage Grade Contained
mt g/t m oz mt g/t m oz mt g/t m oz mt g/t m oz
Alumbrera 37.5% 51.19 0.34 0.55 18.11 0.39 0.23 69.30 0.35 0.78 22.50 0.33 0.24
Borden 100.0% - - - 2.61 5.81 0.49 2.61 5.81 0.49 2.09 5.49 0.37
Camino Rojo 100.0% - - - 234.24 1.00 7.53 234.24 1.00 7.53 17.38 0.84 0.47
Cerro Blanco 100.0% - - - 2.05 12.69 0.84 2.05 12.69 0.84 0.75 9.34 0.23
Cerro Negro 100.0% 1.35 4.99 0.22 5.53 5.97 1.06 6.88 5.78 1.28 2.17 7.19 0.50
Cochenour 100.0% - - - - - - - - - 4.16 16.36 2.19
Dee 40.0% 0.00 0.00 0.00 0.00 0.00 0.00 0.00 0.00 0.00 0.00 0.00 0.00
El Morro 50.0% 9.90 0.53 0.17 36.28 0.38 0.44 46.18 0.41 0.61 339.03 0.30 3.23
El Sauzal 100.0% - - - 0.00 0.00 0.00 0.00 0.00 0.00 0.00 0.00 0.00
Éléonore 100.0% 0.94 6.84 0.21 3.65 5.14 0.60 4.58 5.49 0.81 9.97 7.11 2.28
Los Filos 100.0% 81.57 0.88 2.31 276.31 0.83 7.34 357.88 0.84 9.65 141.04 0.80 3.62
Marlin 100.0% 0.27 4.25 0.04 0.22 4.28 0.03 0.49 4.26 0.07 0.06 5.93 0.01
Musselwhite 100.0% 0.23 5.76 0.04 1.60 6.04 0.31 1.83 6.00 0.35 5.93 5.82 1.11
Noche Buena 100.0% - - - 52.88 0.37 0.63 52.88 0.37 0.63 4.30 0.22 0.03
Peñasquito Heap Leach 100.0% 12.60 0.18 0.07 34.95 0.16 0.18 47.54 0.17 0.26 0.57 0.31 0.01
Peñasquito Mill 100.0% 94.47 0.28 0.86 150.86 0.28 1.34 245.33 0.28 2.20 19.49 0.30 0.19
Porcupine 100.0% 21.80 1.38 0.97 81.20 1.39 3.62 103.00 1.39 4.59 13.85 3.69 1.64
Pueblo Viejo 40.0% 4.49 2.51 0.36 60.76 2.45 4.79 65.25 2.46 5.15 1.56 1.96 0.10
Red Lake 100.0% 1.24 21.88 0.87 2.48 17.60 1.40 3.71 19.02 2.27 3.45 19.86 2.20
San Nicolas 21.0% - - - 19.26 0.46 0.28 19.26 0.46 0.28 2.28 0.26 0.02
Totals 280.03 0.74 6.67 982.98 0.98 31.11 1,263.01 0.93 37.78 590.55 0.97 18.42
GOLDCORP MINERAL RESOURCES
Measured Indicated Measured & Indicated Inferred
Gold
As of December 31, 2015
Appendix E: Reserves and Resources (continued)
41
TOGETHER, CREATING SUSTAINABLE VALUE | MAY 2016
Scientific and technical information contained in this presentation was reviewed and approved by Gil Lawson, P.Eng., Vice-President, Geology and Mine Planning for Goldcorp, and a “qualified person”
as defined by National Instrument 43-101 – Standards of Disclosure for Mineral Projects (“NI 43-101”)
For additional information on the 2015 mineral reserves and mineral resources (“MRMR”), refer to the MRMR tables that can be found at www.goldcorp.com
Goldcorp December 31, 2015 Mineral Reserve and Mineral Resource Reporting Notes:
1 All Mineral Reserves or Ore Reserves have been estimated in accordance with the CIM Definition Standards or the JORC Code. The JORC Code has been accepted for current disclosure rules in
Canada under NI 43-101. Subject to note 4 below, all Mineral Reserves, Ore Reserves and Mineral Resources set out in the tables above have been reviewed and approved by Gil Lawson, P.Eng.,
Vice President of Geology and Mine Planning, Goldcorp, who is a qualified person as defined under National Instrument.
2 All Mineral Resources are reported exclusive of Mineral Reserves.
3 Mineral Resources which are not Mineral Reserves do not have demonstrated economic viability.
4 Mineral Reserves and Mineral Resources are reported as of December 31, 2015, with the following conditions or exceptions:
1 Reserves and Resources for Pueblo Viejo are as per information provided by Barrick Gold Corporation.
2 Reserves and Resources for Relincho and San Nicolas are as per information provided by Teck Resources Limited.
3 Reserves and Resources for Alumbrera are as per information provided by Glencore plc.
5 Mineral Reserves are estimated using appropriate recovery rates and US$ commodity prices of $1,100 per ounce of gold, $16.50 per ounce of silver, $2.75 per pound of copper, $0.90 per pound of
lead, and $0.95 per pound of zinc, unless otherwise noted below:
1 Alumbrera $1,095/oz gold, $2.54/lb copper
2 El Morro $1,200/oz gold
3 Pueblo Viejo $1,000/oz gold for the next five years, and a long-term gold price of $1,200/oz from 2021 onwards, $16.50/oz silver, $3.00/lb copper
4 Relincho $13.70/lb molybdenum, $2.80/lb copper
6 Mineral Resources are estimated using US$ commodity prices of $1,300 per ounce of gold, $19 per ounce of silver, $3.25 per pound of copper, $1.00 per pound of lead and $1.00 per pound of
zinc, unless otherwise noted below:
1 Alumbrera $1,100/oz gold, $2.95/lb copper
2 El Morro $1,200/oz gold, $2.75/lb copper
3 Pueblo Viejo $1,300/oz gold, $17.50/oz silver, $3.25/lb copper
4 Relincho $13.70/lb molybdenum, $2.80/lb copper
5 San Nicolas $1,275/oz gold, $22.50/oz silver, $2.75/lb copper, $1.00/lb zinc
Appendix E: Reserves and Resources (continued)
42
TOGETHER, CREATING SUSTAINABLE VALUE | MAY 2016
Cautionary Note Regarding Reserves and Resources:
Scientific and technical information contained in this news release was reviewed and approved by Gil Lawson, P.Eng., Vice-President, Geology and Mine Planning for
Goldcorp, and a “qualified person” as defined by Canadian Securities Administrators’ National Instrument 43-101 – Standards of Disclosure for Mineral Projects (“NI 43-
101”). All Mineral Reserves and Mineral Resources have been calculated in accordance with the standards of the Canadian Institute of Mining, Metallurgy and Petroleum
(“CIM”) and NI 43-101, or the AusIMM JORC equivalent. All Mineral Resources are reported exclusive of Mineral Reserves. Mineral Resources which are not Mineral
Reserves do not have demonstrated economic viability. Information of data verification performed on the mineral properties mentioned in this press release that are
considered to be material mineral properties to the Company are contained in Goldcorp’s most recent Annual Information Form and the current technical report for those
properties, all available at www.sedar.com.
Cautionary Note to United States investors concerning estimates of measured, indicated and inferred resources: This document has been prepared in accordance with the
requirements of the Canadian securities laws which differ from the requirements of United States securities laws and uses terms that are not recognized by the United
States Securities and Exchange Commission (“SEC”). The terms “Mineral Reserve”, “Proven Mineral Reserve” and “Probable Mineral Reserve” are Canadian mining terms
as defined in accordance with the CIM Definition Standards adopted by CIM Council on May 10, 2014 (the “CIM Definition Standards”) which were incorporated by reference
in NI 43-101. These definitions differ from the definitions in SEC Industry Guide 7 (“SEC Industry Guide 7”) under United States securities laws. Under SEC Industry Guide 7
standards, a “final” or “bankable” feasibility study is required to report reserves or cash flow analysis to designate reserves and the primary environmental analysis or report
must be filed with the appropriate governmental authority.
In addition, the terms “Mineral Resource”, “Measured Mineral Resource”, “Indicated Mineral Resource” and “Inferred Mineral Resource” are defined in and required to be
disclosed by NI 43-101; however, these terms are not defined terms under SEC Industry Guide 7 and are normally not permitted to be used in reports and registration
statements filed with the SEC. United States investors are cautioned not to assume that any part or all of mineral deposits in these categories will ever be converted into
reserves. “Inferred Mineral Resources” have a great amount of uncertainty as to their existence and their economic and legal feasibility. A significant amount of exploration
must be completed in order to determine whether an Inferred Mineral Resource may be upgraded to a higher category. Under Canadian regulations, estimates of Inferred
Mineral Resources may not form the basis of feasibility or pre-feasibility studies, except in rare cases. United States investors are cautioned not to assume that all or any
part of an Inferred Mineral Resource exists or is economically or legally mineable. Disclosure of “contained ounces” in a resource is permitted disclosure under Canadian
regulations if such disclosure includes the grade or quality and the quantity for each category of Mineral Resource and Mineral Reserve; however, the SEC normally only
permits issuers to report mineralization that does not constitute “reserves” by SEC standards as in place tonnage and grade without reference to unit measures.
Accordingly, information contained in this presentation containing descriptions of the Company’s mineral deposits may not be comparable to similar information made public
by United States companies subject to the reporting and disclosure requirements under the United States federal securities laws and the rules and regulations thereunder.
Appendix E: Reserves and Resources (continued)

43
TOGETHER, CREATING SUSTAINABLE VALUE | MAY 2016
Notes
44
TOGETHER, CREATING SUSTAINABLE VALUE | MAY 2016
Notes

45
TOGETHER, CREATING SUSTAINABLE VALUE | MAY 2016
Notes

46
TOGETHER, CREATING SUSTAINABLE VALUE | MAY 2016
Notes
47
TOGETHER, CREATING SUSTAINABLE VALUE | MAY 2016
Trading Symbols
NYSE: GG; TSE: G
Investor relations
1-800-567-6223