Embed Size (px)
Citation preview
Today’s Session is Brought to You by the
Letters R, D, A
Making APR Related to, and the Catalyst for, Improving Student
Outcomes

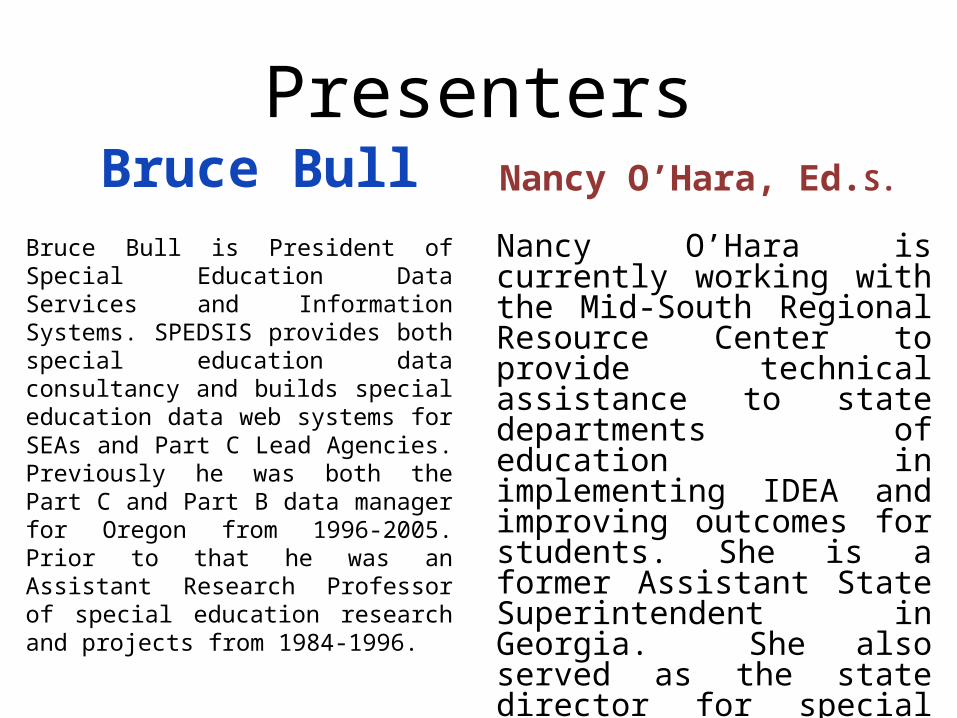
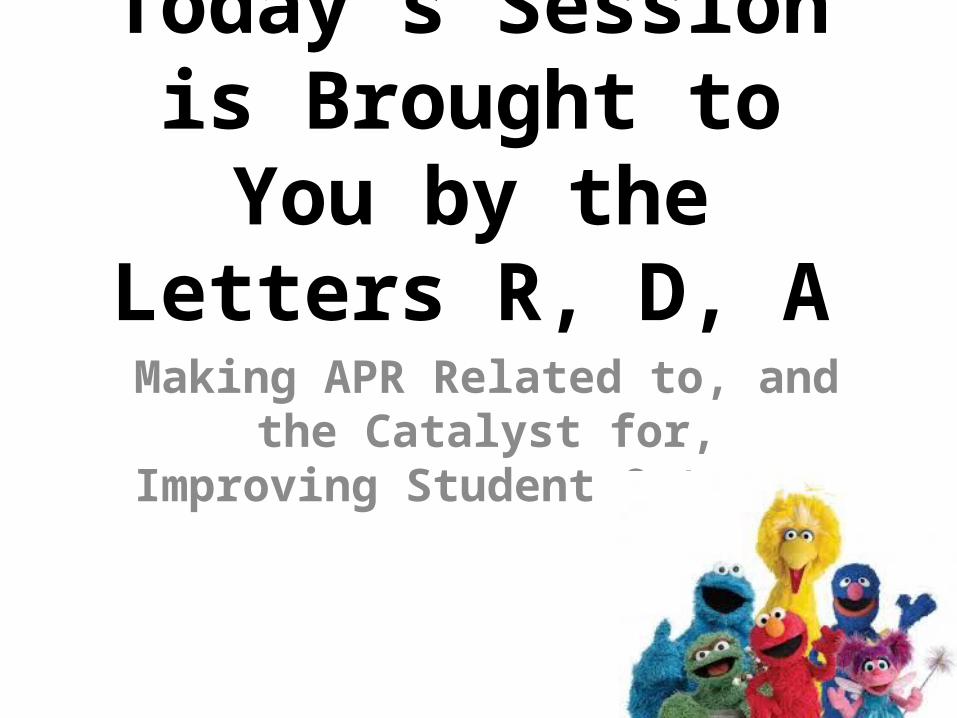
PresentersBruce Bull
Bruce Bull is President of Special Education Data Services and Information Systems. SPEDSIS provides both special education data consultancy and builds special education data web systems for SEAs and Part C Lead Agencies. Previously he was both the Part C and Part B data manager for Oregon from 1996-2005. Prior to that he was an Assistant Research Professor of special education research and projects from 1984-1996.
Nancy O’Hara, Ed.S.
Nancy O’Hara is currently working with the Mid-South Regional Resource Center to provide technical assistance to state departments of education in implementing IDEA and improving outcomes for students. She is a former Assistant State Superintendent in Georgia. She also served as the state director for special education as well as various other jobs in the state and in LEAs.

Jack

Jack


Session Overview• Revisit APR indicators
• Consider how LEA determinations (APR indicator data) are improvement catalysts
• Observe: data drill down, analyses, root cause and improvement strategy efforts
• Next steps
Impro
ving
Student
Results
Can you tell me how to get,how to get to
Improved Results
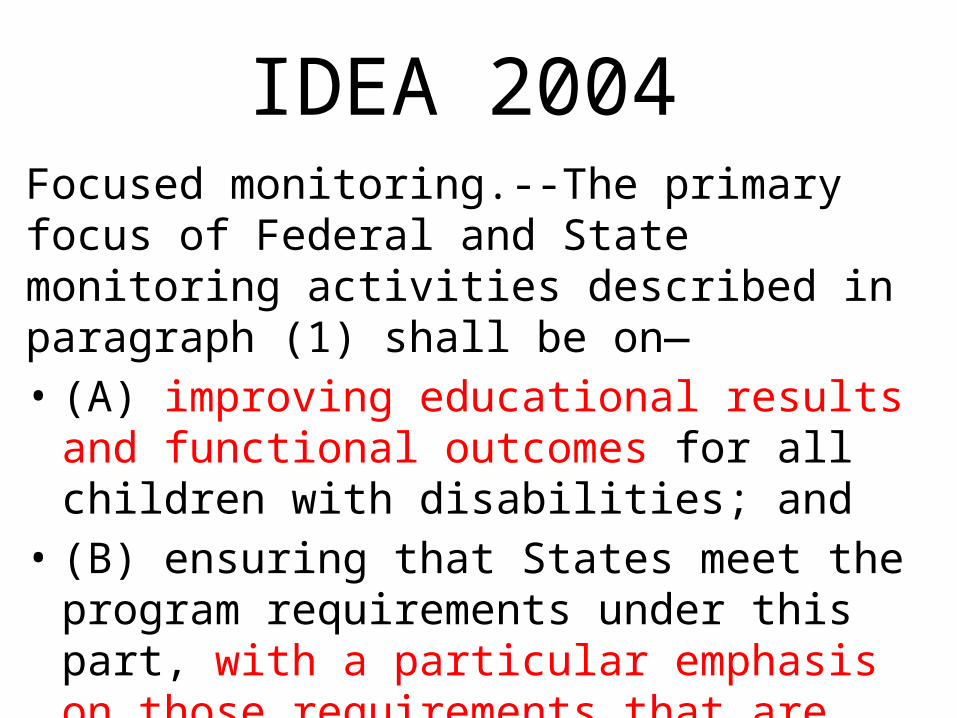
IDEA 2004Focused monitoring.--The primary focus of Federal and State monitoring activities described in paragraph (1) shall be on—• (A) improving educational results and functional
outcomes for all children with disabilities; and • (B) ensuring that States meet the program
requirements under this part, with a particular emphasis on those requirements that are most closely related to improving educational results for children with disabilities.
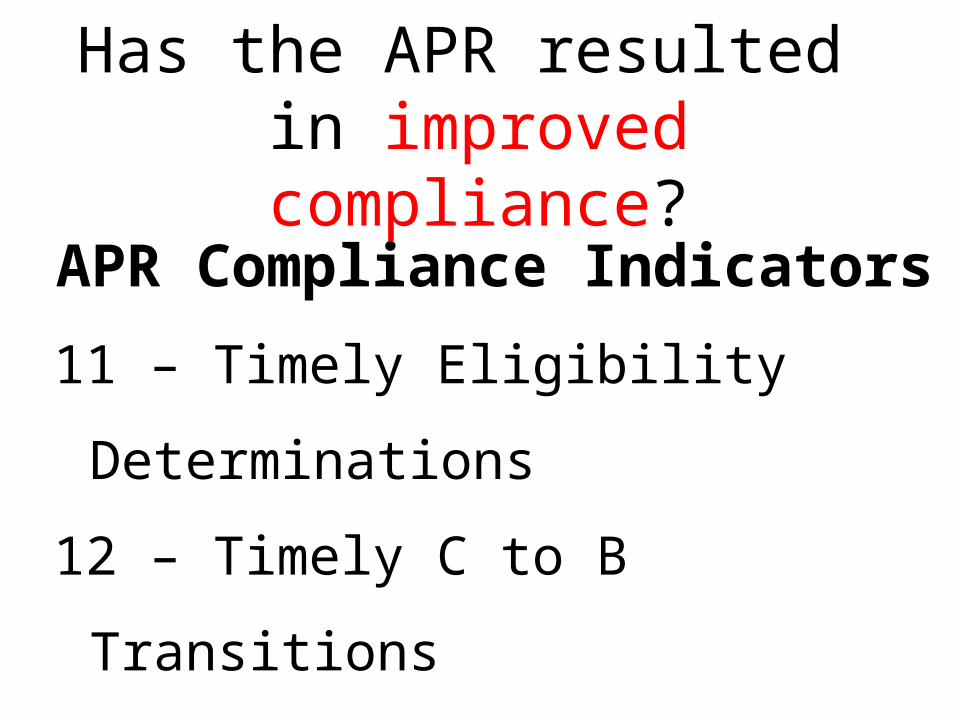
APR Compliance Indicators
11 – Timely Eligibility Determinations
12 – Timely C to B Transitions
13 – Improved Secondary Transition
15 – Timely Correction of Noncompliance
Has the APR resulted in improved compliance?
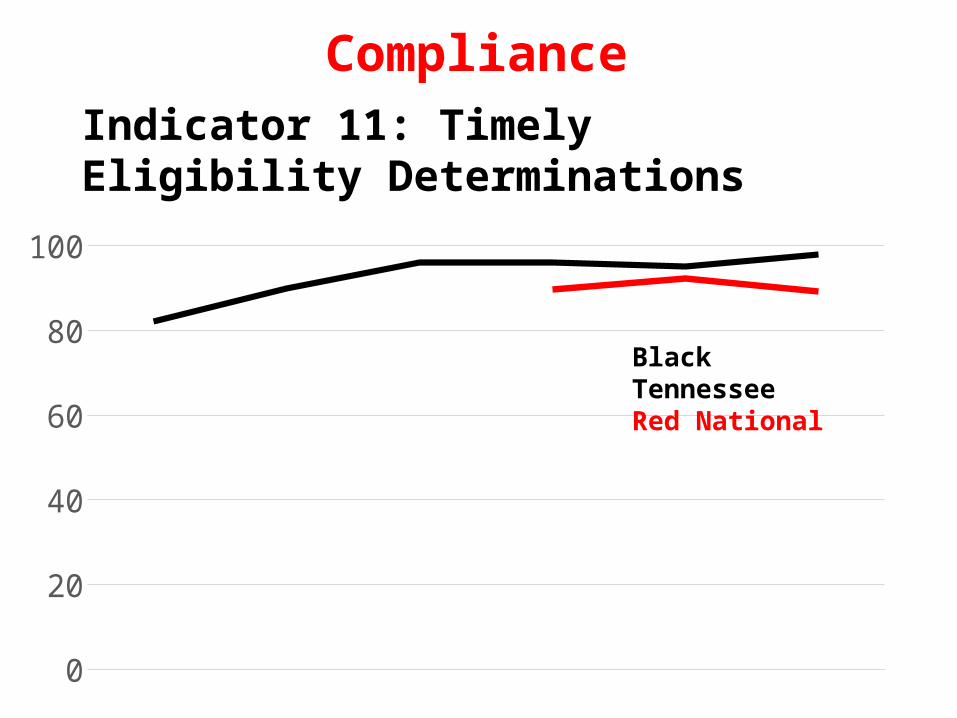
ComplianceIndicator 11: Timely Eligibility Determinations
2006 2007 2008 2009 2010 20110
102030405060708090
100
Black Tennessee Red National
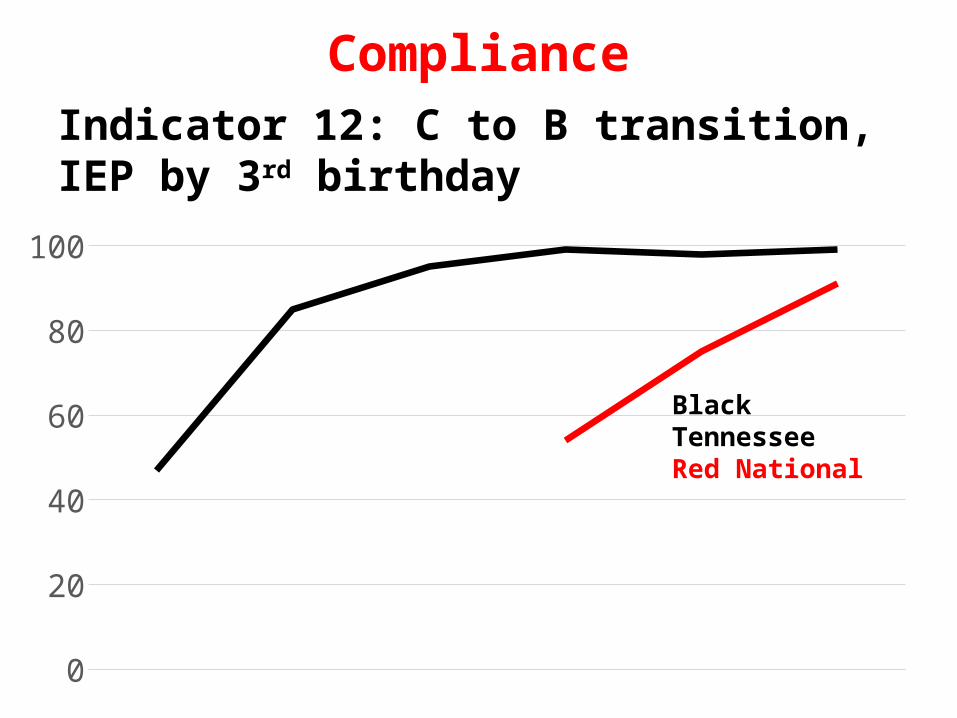
ComplianceIndicator 12: C to B transition, IEP by 3rd birthday
2006 2007 2008 2009 2010 20110
102030405060708090
100
Black Tennessee Red National
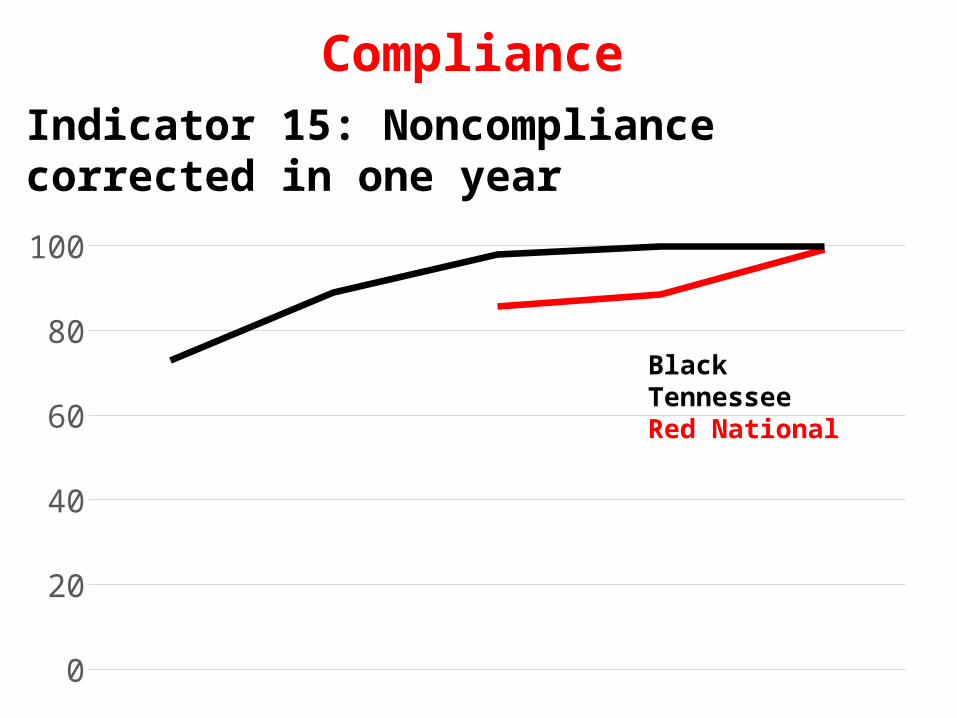
2007 2008 2009 2010 20110
102030405060708090
100
ComplianceIndicator 15: Noncompliance corrected in one year
Black Tennessee Red National
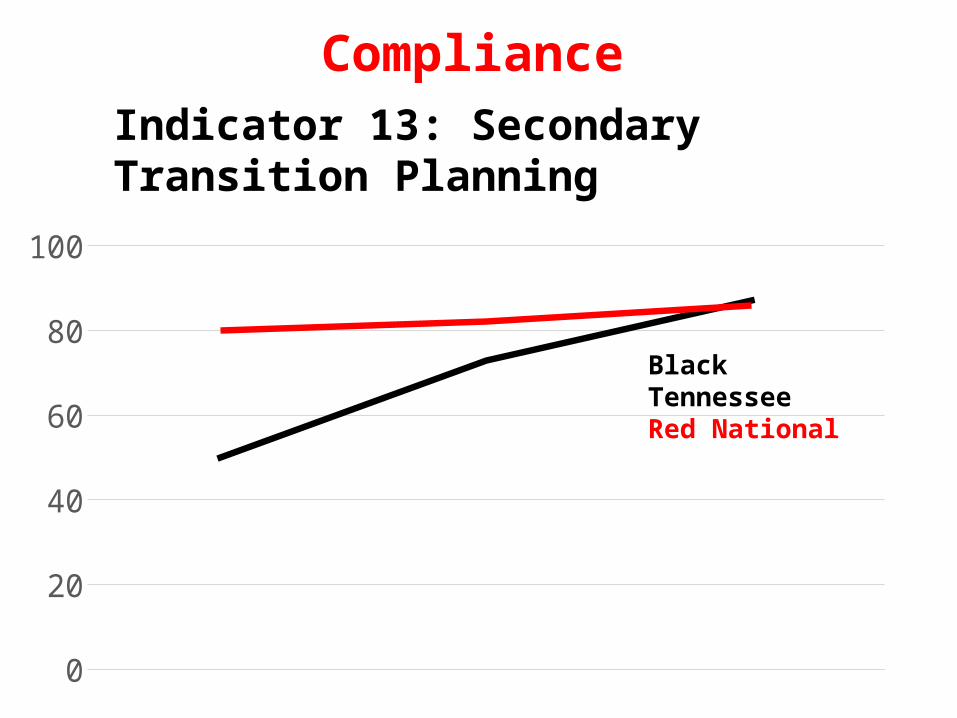
ComplianceIndicator 13: Secondary Transition Planning
2009 2010 20110
102030405060708090
100
Black Tennessee Red National
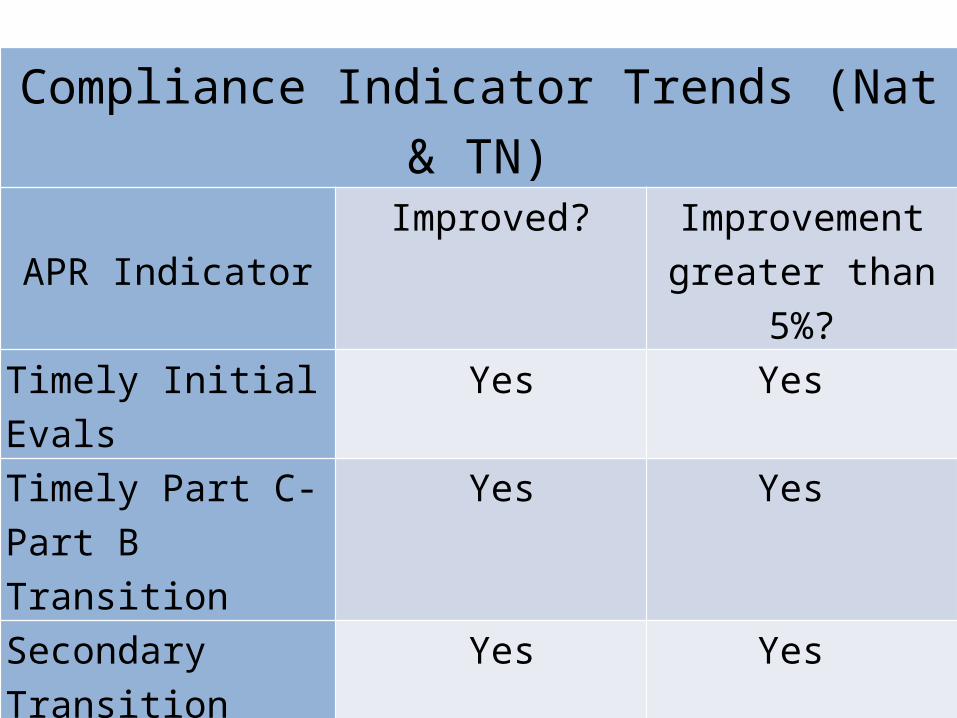
Compliance Indicator Trends (Nat & TN)
APR IndicatorImproved? Improvement
greater than 5%?
Timely Initial Evals Yes Yes
Timely Part C-Part B Transition
Yes Yes
Secondary Transition Planning
Yes Yes
Noncompliance Corrected in 1 Year
Yes Yes
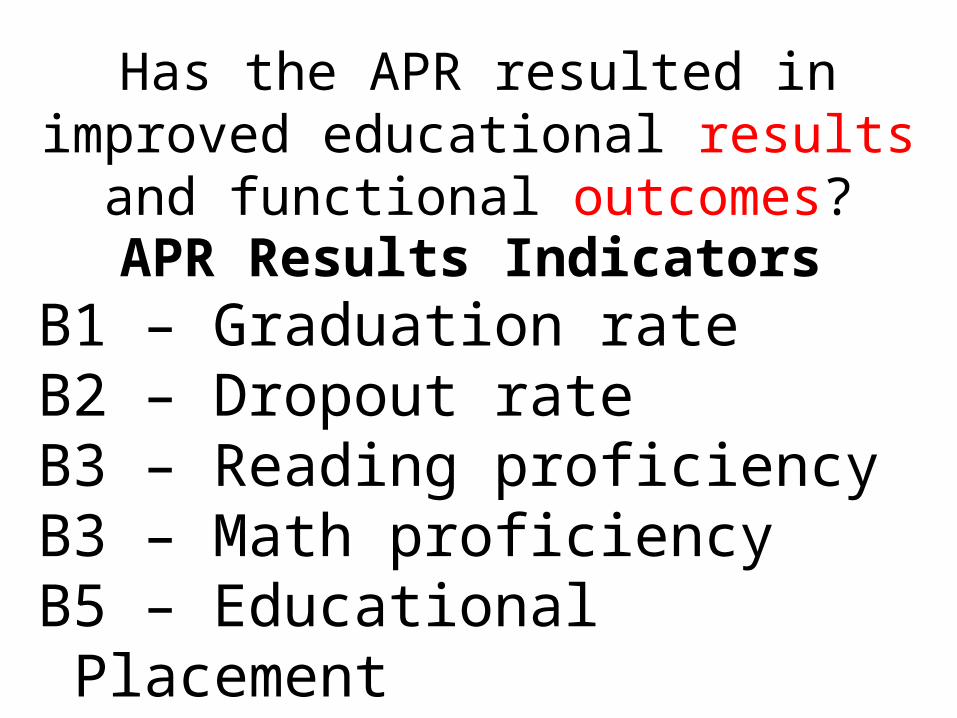
APR Results IndicatorsB1 – Graduation rateB2 – Dropout rateB3 – Reading proficiencyB3 – Math proficiencyB5 – Educational PlacementB14 – Post school outcomes
Has the APR resulted in improved educational results and functional
outcomes?

ResultsIndicator 1 and 2: Graduation and Dropout Rate
2006 2007 2008 2009 20100
102030405060708090
100 Red National Grad Rate = 63.6%
Red National Dropout Rate = 8.7%
Black Tennessee Grad and Dropout Rates

ResultsIndicator 3: Reading Proficiency
2006 2007 2008 2009 2010 20110
102030405060708090
100
Black Tennessee Red National
“Due to setting a new target, the 2009 data is baseline data.”

ResultsIndicator 3: Math Proficiency
2006 2007 2008 2009 2010 20110
102030405060708090
100
Proficiency
Black Tennessee Red National
“Due to setting a new target, the 2009 data is baseline data.”

ResultsIndicator 5: Education Environment
2006 2007 2008 2009 2010 20110
102030405060708090
100In General Educa-tion > 80% of School Day Na-tional Average = 59.8%
In General Education < 40% of School Day National Average = 13.2%
Black Tennessee Ed Environments

ResultsIndicator 14: Post School Outcomes
2009 2010 20110
102030405060708090
100
C
B
A
A = Enrolled in Higher EducationB = Higher Education + Competitively EmployedC = Higher Ed + Competitively Employed + Other Ed or Employment
Black Tennessee Red National
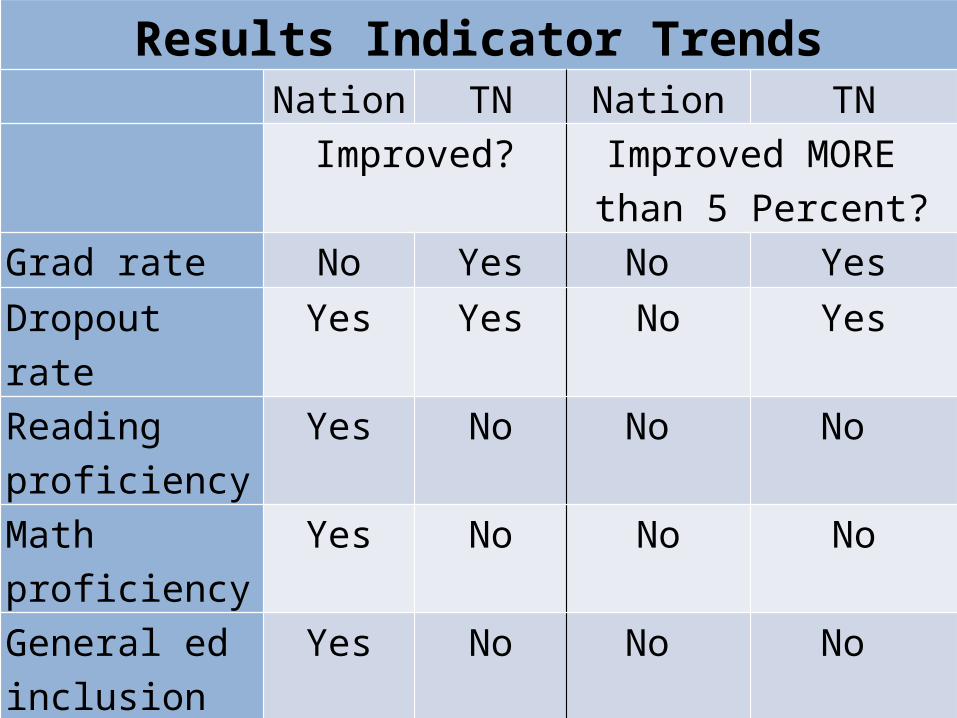
Results Indicator Trends Nation TN Nation TN
Improved? Improved MORE than 5 Percent?
Grad rate No Yes No YesDropout rate Yes Yes No YesReading proficiency
Yes No No No
Math proficiency
Yes No No No
General ed inclusion
Yes No No No
Post School Outcomes
Yes No No No
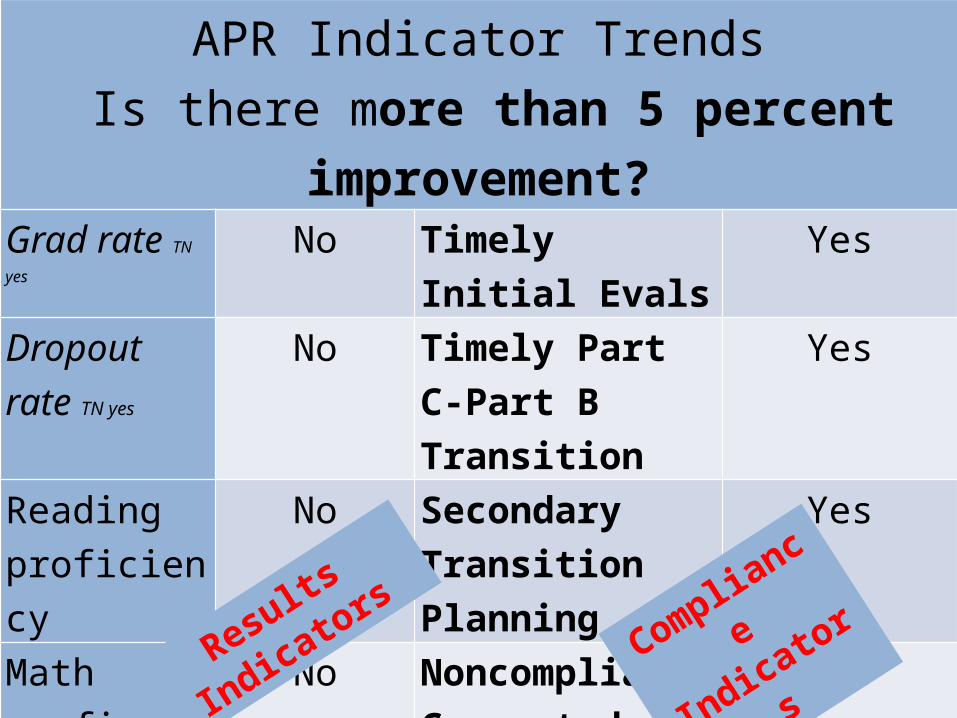
APR Indicator Trends Is there more than 5 percent improvement?
Grad rate TN yes No Timely Initial Evals YesDropout rate TN yes
No Timely Part C-Part B Transition
Yes
Reading proficiency
No Secondary Transition Planning
Yes
Math proficiency
No Noncompliance Corrected in 1 Year
Yes
General ed inclusion
No
Post School Outcomes
No
Results Indicators
Compliance
Indicators
Table talk about national and TN data.
5 minutes Facilitator Handout #1

Student Decision
B13 Transition Planning
B4 Addressing Behavior
B3 Statewide Assessment
Middle School Transition
B6 B7 Early Childhood Experiences
B4 Behavior
Cultural expectations
Pregnancy
B8 Family Dynamics
Demographics (gender, SES, disability, R/E)
Add More Add More
Dropout (partial) tree of
influence.
Activity: Graphically depict data and APR indicators relating to your topic.
10 minutesFacilitator Handout #2 (To be collected)
Break

Break Wisdom
What gets counted counts
You measure what you treasure
What gets measured gets done
Planning is important, yet not sufficient to get results
“What do you see in these data?”https://www.youtube.com/watch?v=j13Gd7MSs7o

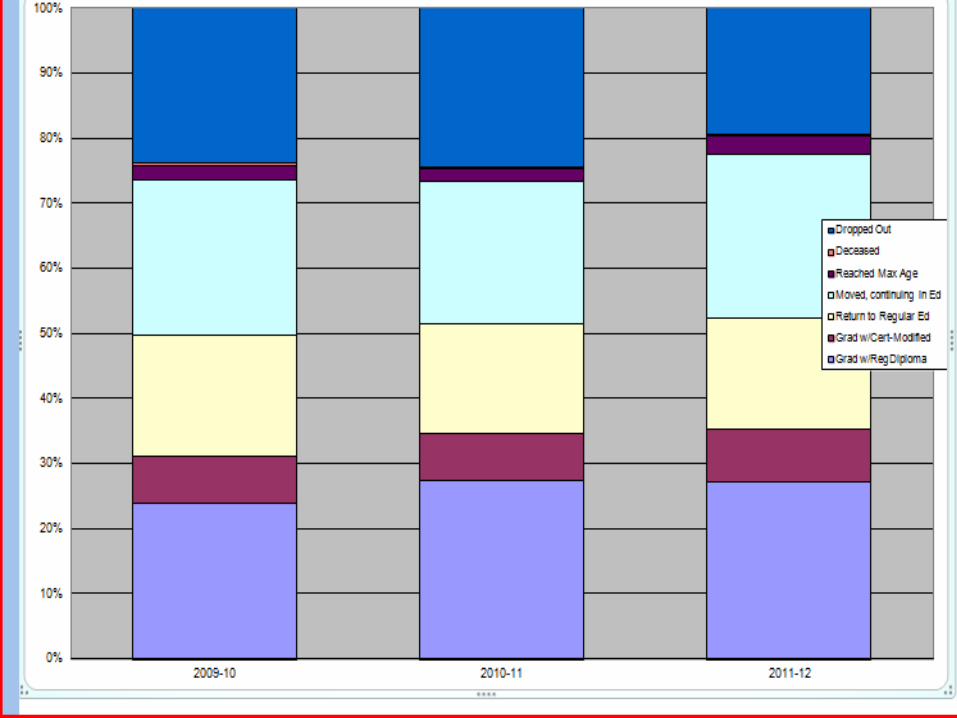
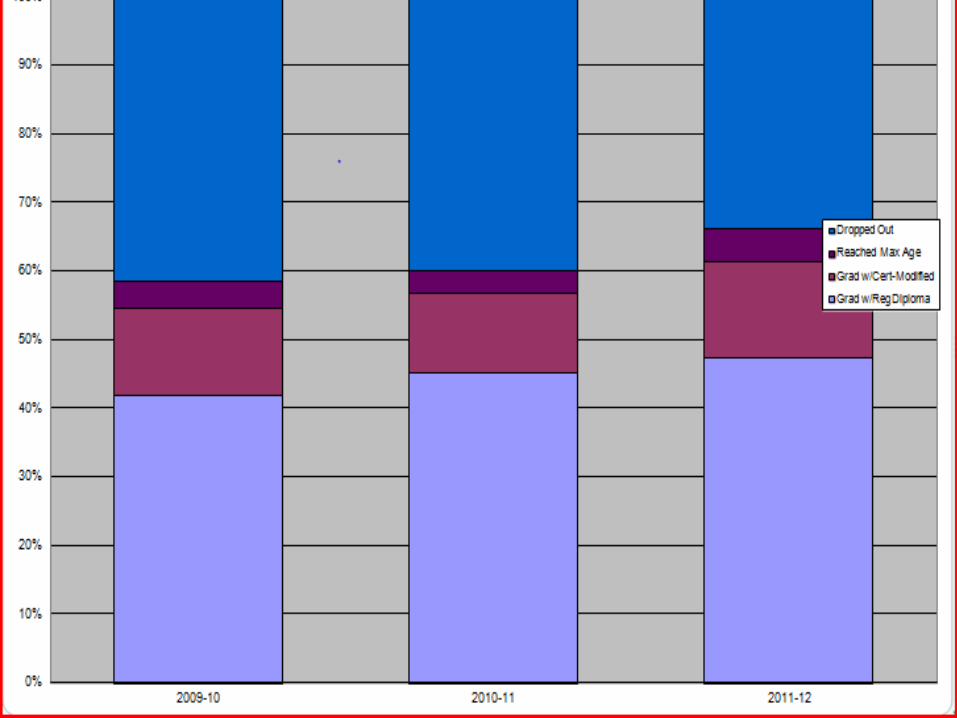
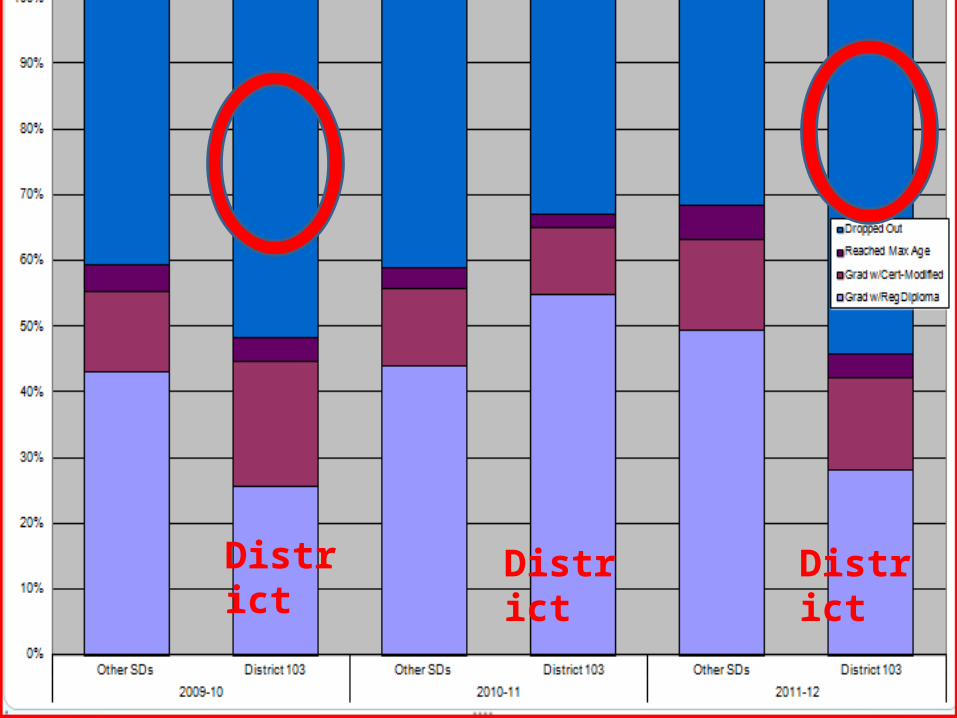
District DistrictDistrict
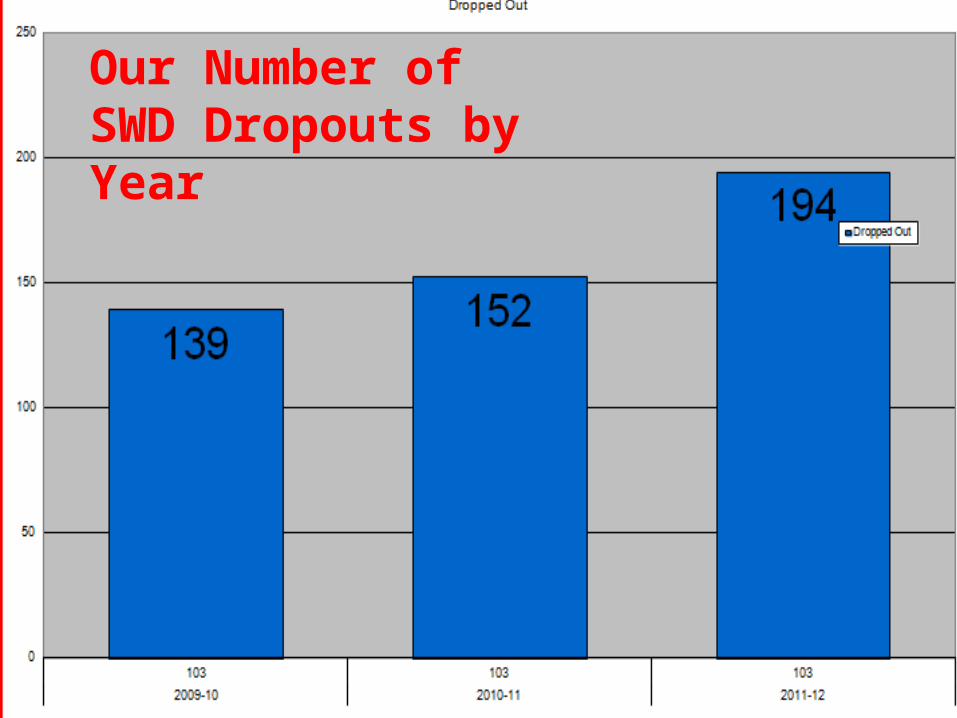
Our Number of SWD Dropouts by Year
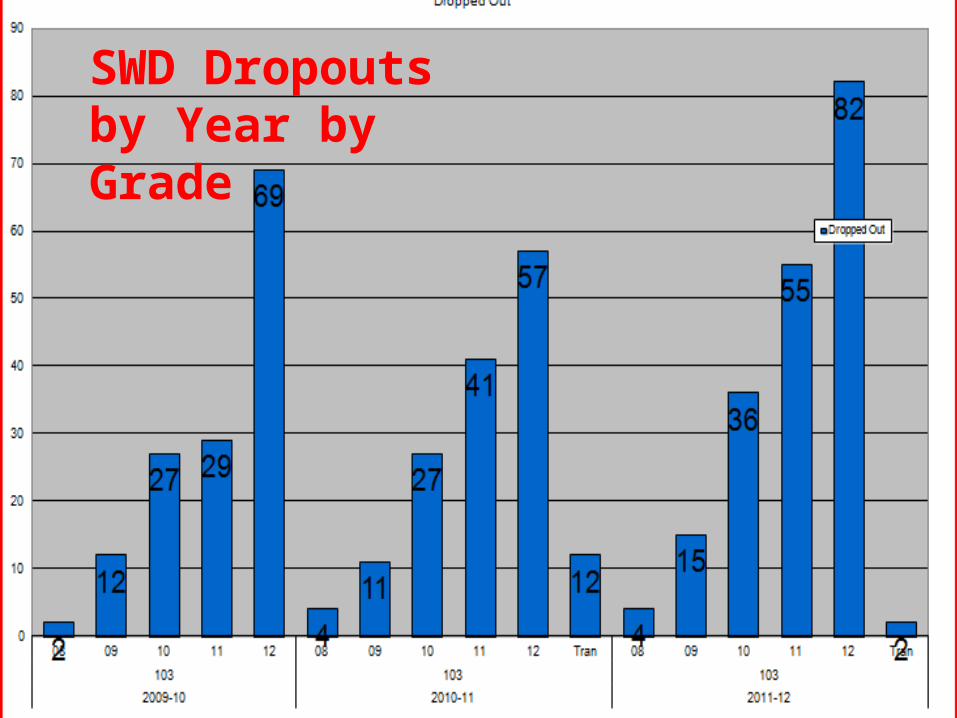
SWD Dropouts by Year by Grade
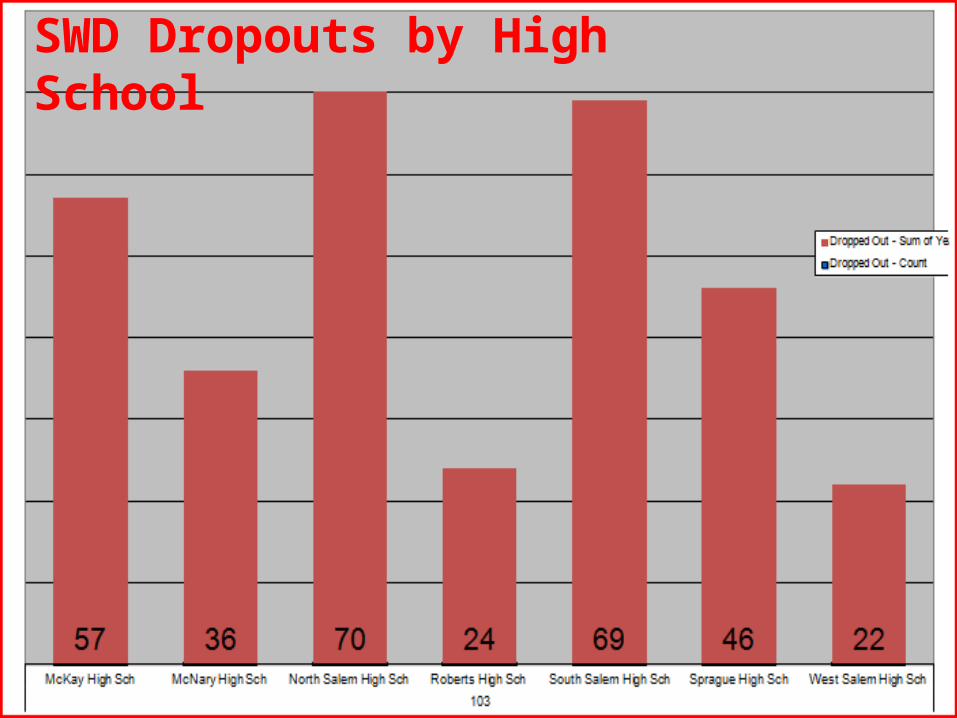
SWD Dropouts by High School
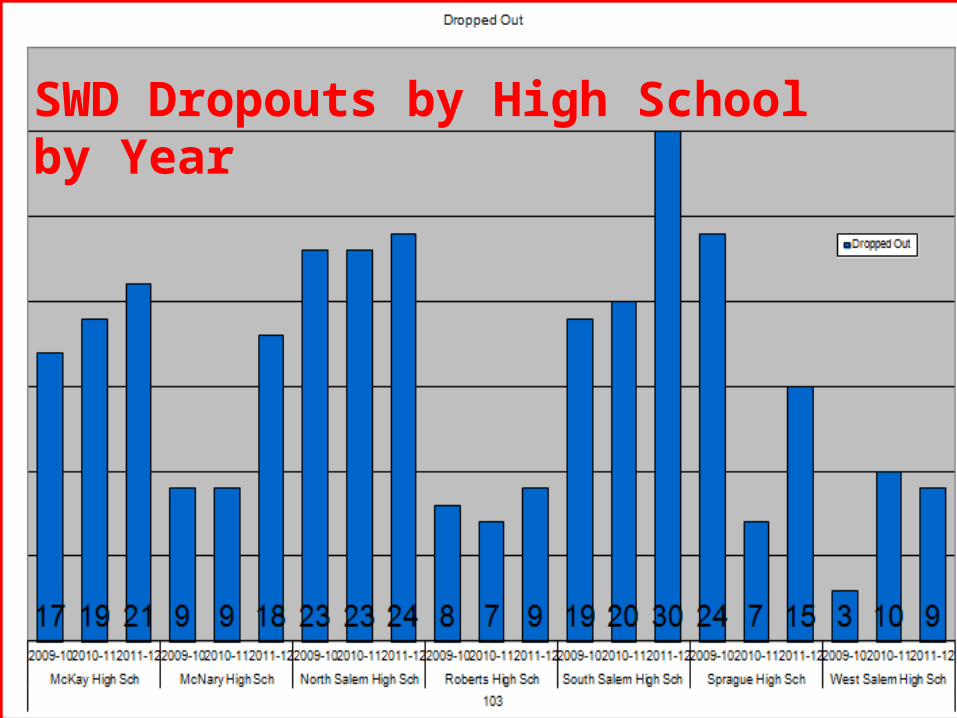
SWD Dropouts by High School by Year

SWD Dropouts by High School by R/E
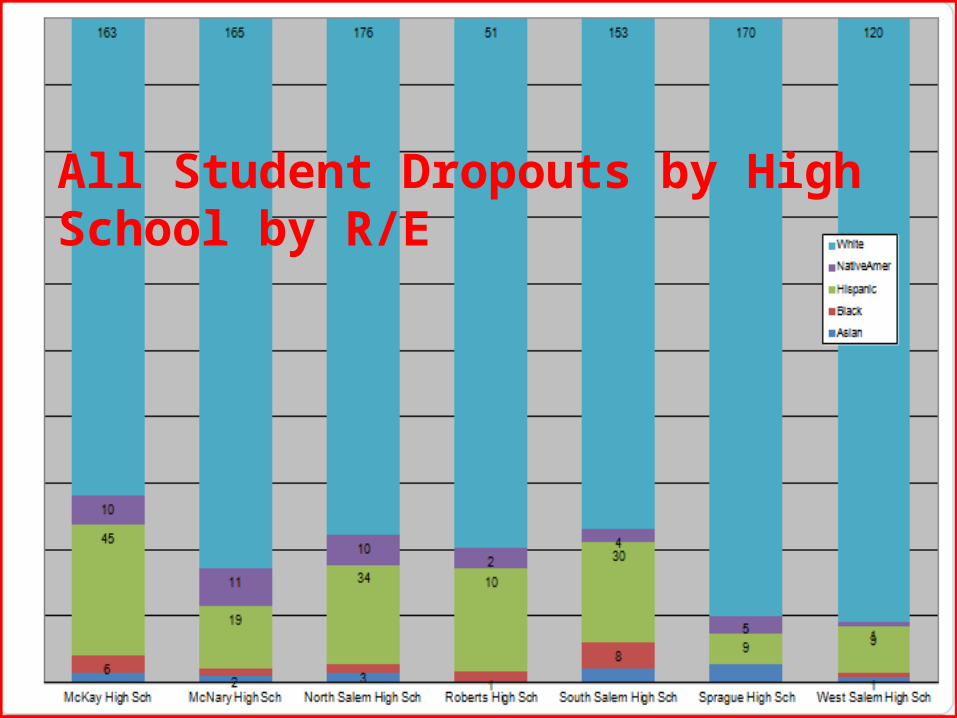
All Student Dropouts by High School by R/E
Activity: Distribute Drilling into the Data.
15 minutes, then report out
Facilitator Handout #3 (To be collected.)

Activity: Supports, tools, TA needed for data drilling.
10 minutes, 12 min report out.
Facilitator Handout #4 (To be collected.)
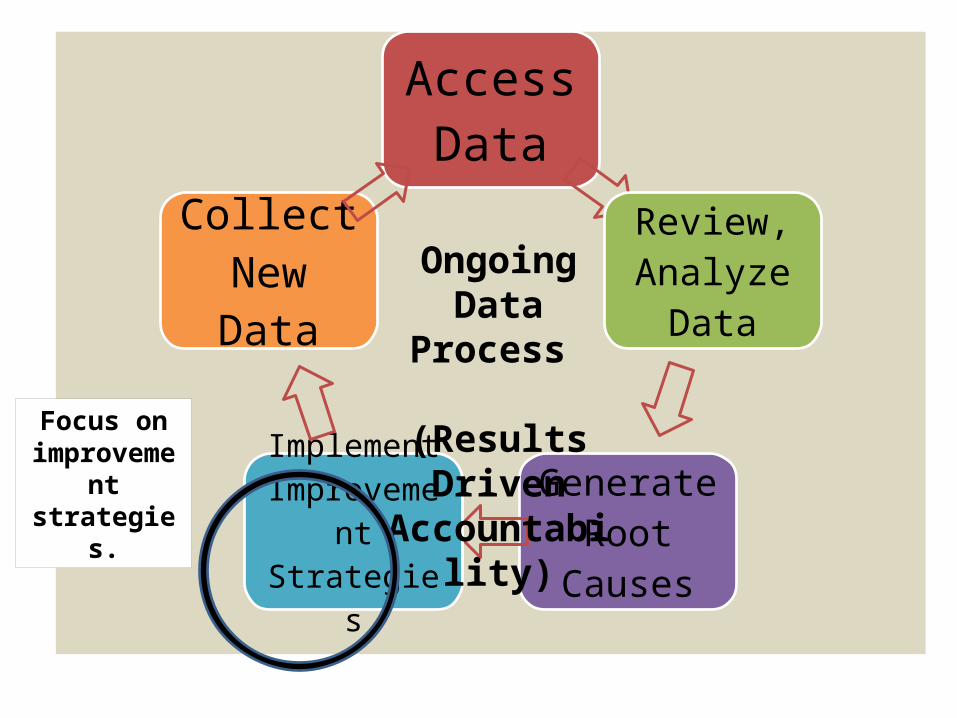
Access Data
Review, Analyze
Data
Generate Root
Causes
Implement Improvement
Strategies
Collect New Data
Ongoing Data Process
(Results Driven Accountability)Focus on
improvement strategies.
Adapted from Presentation by Michigan and Kansas, NASDSE 2013
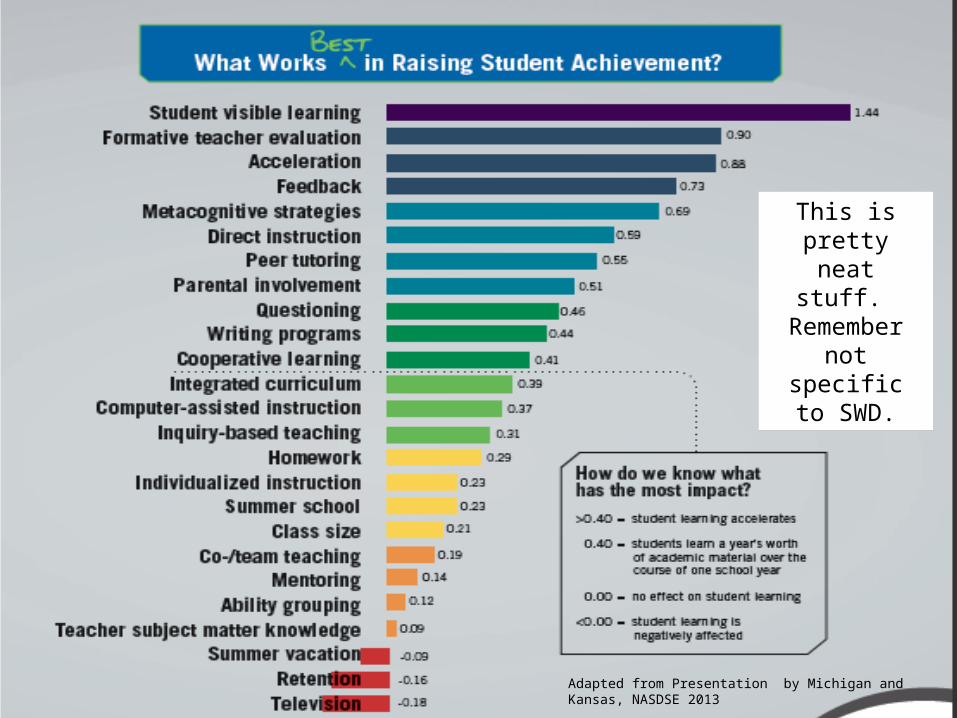
This is pretty neat stuff.
Remember not specific to SWD.
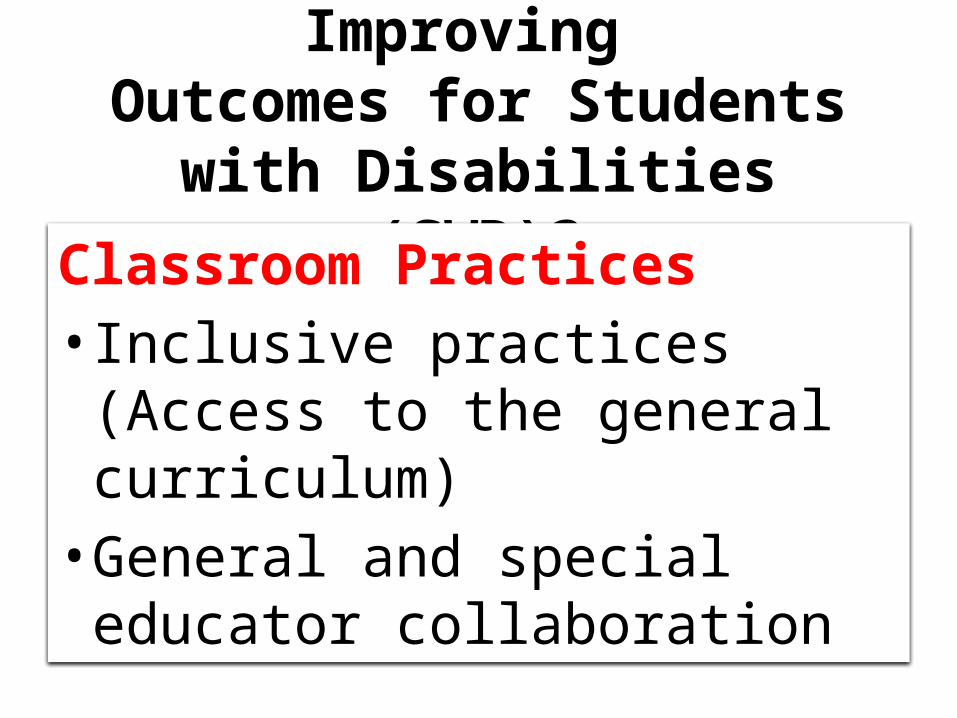
What Works for Improving Outcomes for Students with
Disabilities (SWD)?
Classroom Practices• Inclusive practices (Access to the
general curriculum)• General and special educator
collaboration
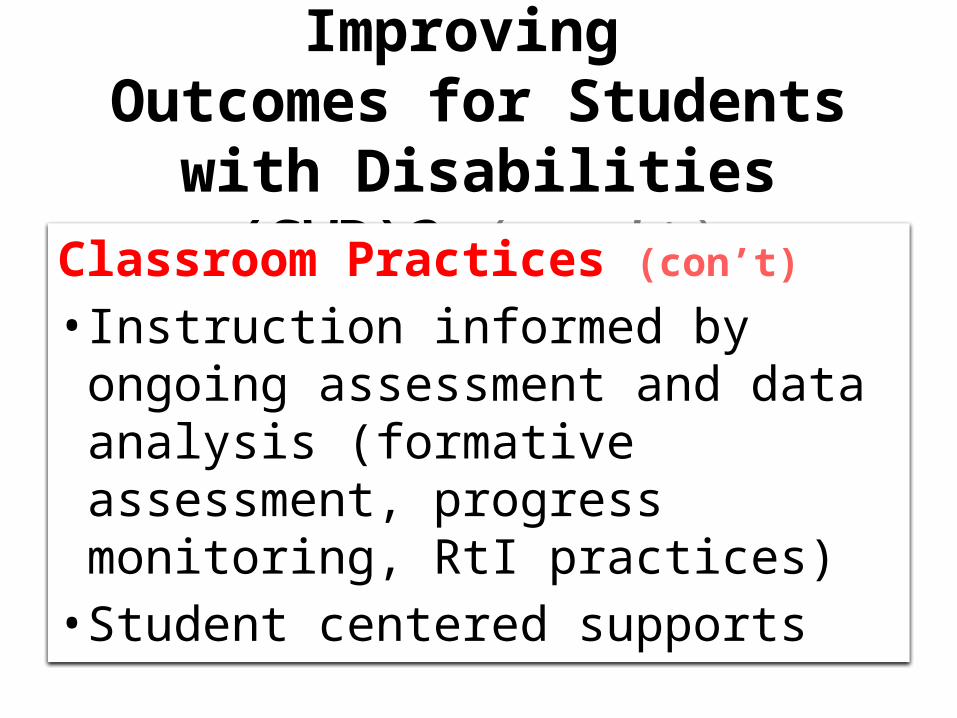
What Works for Improving Outcomes for Students with Disabilities (SWD)? (con’t)
Classroom Practices (con’t)
• Instruction informed by ongoing assessment and data analysis (formative assessment, progress monitoring, RtI practices) • Student centered supports
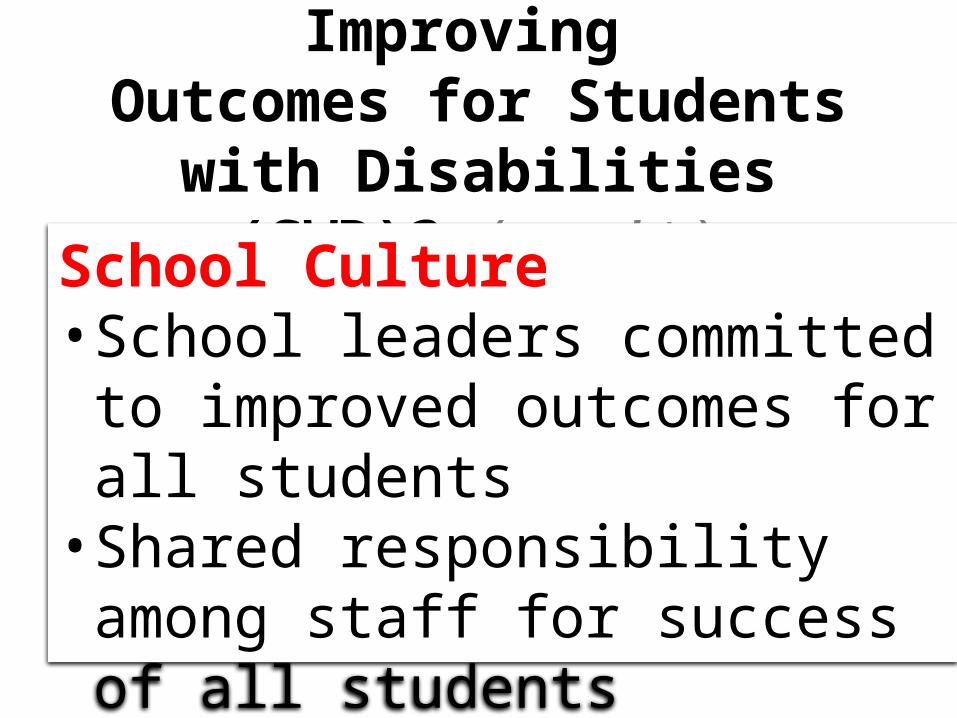
What Works for Improving Outcomes for Students with Disabilities (SWD)? (con’t)
School Culture• School leaders committed to
improved outcomes for all students• Shared responsibility among staff
for success of all students• Strong family engagement
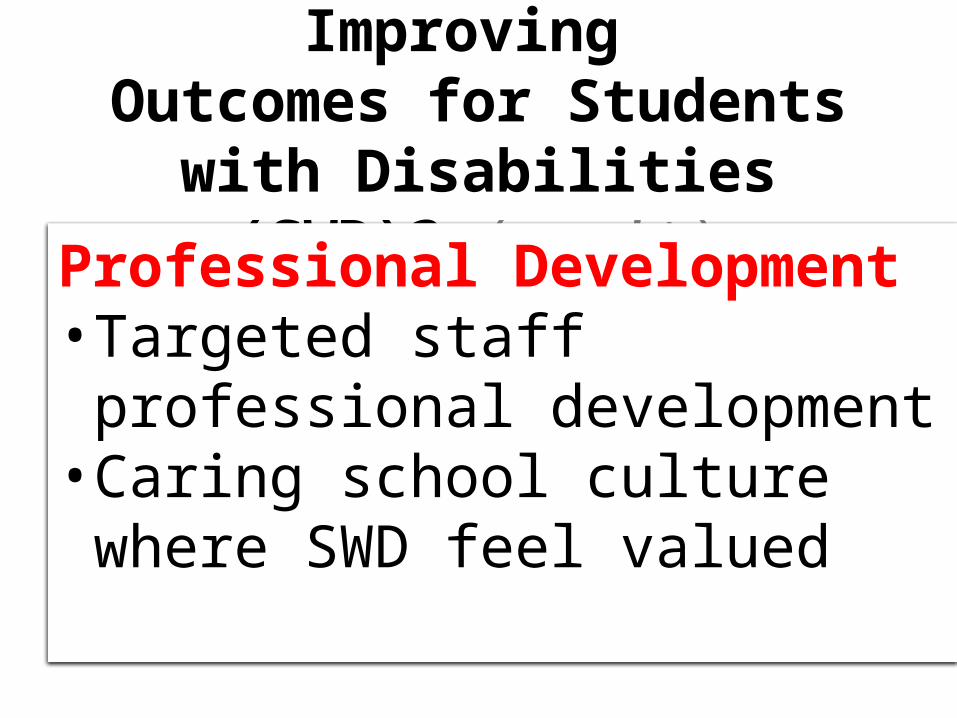
What Works for Improving Outcomes for Students with Disabilities (SWD)? (con’t)
Professional Development• Targeted staff professional
development• Caring school culture where SWD
feel valued

What Works for Improving School Outcomes, Including Subgroups such
as SWD?
Use of Data•Ongoing data analysis and review
across grades, teams, etc.•All faculty involved in reviewing,
analyzing and revising based on data
What Works for Improving School Outcomes, Including Subgroups such
as SWD?
Focused School Wide Goals•Aligning resources, fiscal,
material, personnel, professional development around the goal(s)
What Works for Improving School Outcomes, Including Subgroups such
as SWD? (con’t)Shared Instructional Practices• District aligned curriculum to support
standards based instruction• Ongoing assessment/monitoring,
common formative assessments• Identify specific instructional strategies
the district/school will adopt and implement with fidelity

What Works for Improving School Outcomes, Including Subgroups such
as SWD? (con’t)Pay attention to implementation• Fidelity to the program or strategy is
assessed and refined in every classroom/school• Aligned structures in place for
feedback and support (teams, grade level, dept, topic, etc)
What Works for Improving School Outcomes, Including Subgroups such
as SWD? (con’t)Monitor and Provide Feedback and
Support• Regularly measure•Monitor implementation, progress,
and routinely provide feedback• Learn from others (other schools,
other districts)
What Works for Improving School Outcomes, Including Subgroups such
as SWD? (con’t)Engage Families• Empower families to support
instruction to their children•Make families part of the decision
making team• Value and pay attention to family
feedback and input
Activity: Your next local steps towards results.
5 minutes
Facilitator Handout #5 (Not collected.)
Next Steps and ResourcesWe (presenters and TDOE) will find resources to help you:• Target indicators for improvement• Drill into the data• Consider root causes• Develop and implement
improvement efforts.
Your Next Steps and Resources
Use indicator data as a catalyst for improvement
Work with colleagues to consider root causes and select doable improvement efforts.
Next Steps and ResourcesAsk for assistance internally and externally
Share with others your successes and challenges. We can collectively share and improve.


“Eric’s Graduation Speech”
http://www.youtube.com/watch?v=gSactvpsla0&feature=youtu.be