Embed Size (px)
Citation preview
MODULE 1
Getting Started with RtI
MODULE 1
Getting Started with RtI
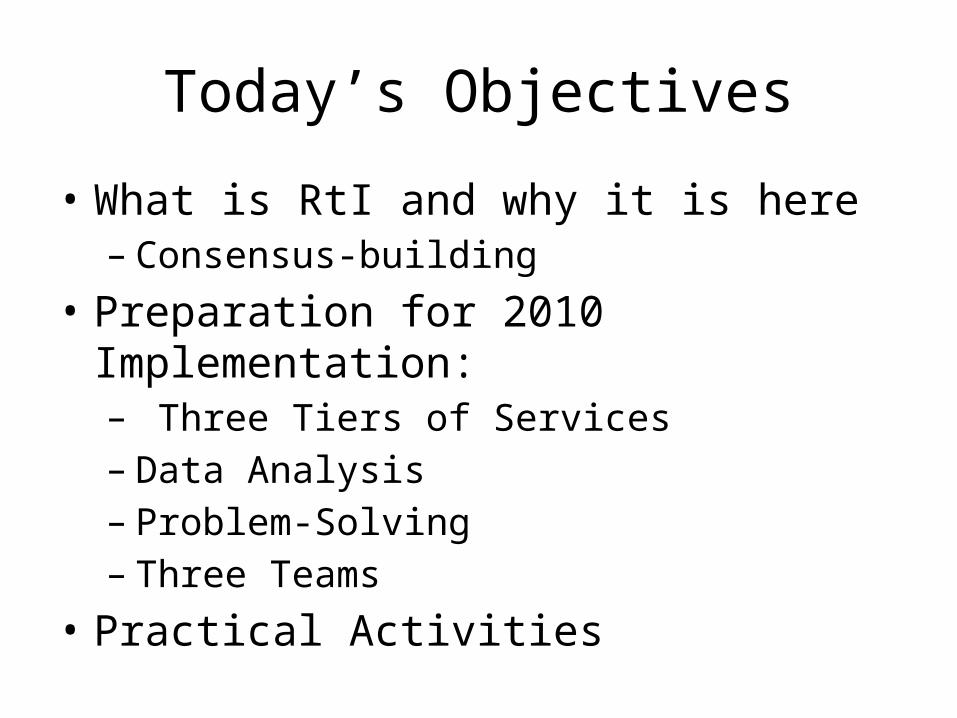
Today’s Objectives
• What is RtI and why it is here – Consensus-building
• Preparation for 2010 Implementation:– Three Tiers of Services– Data Analysis– Problem-Solving– Three Teams
• Practical Activities

PS/RtI: Definition
• RtI is the practice of :
(1) providing high-quality instruction/intervention matched to student needs and (2) using learning rate over time and level of performance (3) to make important educational decisions to guide instruction.
National Association of State Directors of Special Education, 2005.
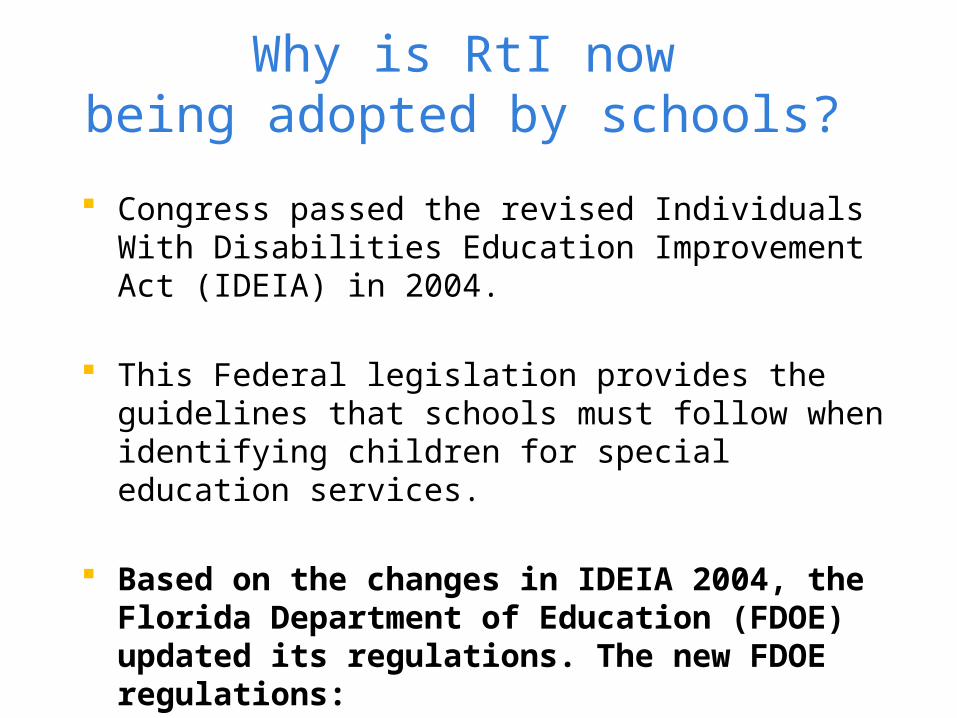
Why is RtI now being adopted by schools?
Congress passed the revised Individuals With Disabilities Education Improvement Act (IDEIA) in 2004.
This Federal legislation provides the guidelines that schools must follow when identifying children for special education services.
Based on the changes in IDEIA 2004, the Florida Department of Education (FDOE) updated its regulations. The new FDOE regulations:Explicitly ALLOW districts to use RtI to identify ESE
students.
Rationale for Using RtIRtI is a way to help all students obtain the appropriate
instruction and intervention to improve their academic process.
RtI allows students who struggle, but may not be eligible for ESE services, to receive support services that are based on their individual needs.
RtI is a preventative approach that aims to identify struggling students before they fall too far behind their peers.

Rationale, continued
RtI prevents inappropriate identification of students for special education services.
Racial disproportionality is reduced in programs
for students with learning disabilities, mental handicaps and emotional handicaps.
RtI is a means for those students who “fall between the cracks” to get the help they need.
Identify students early.
Ensure that students’ difficulties are not due to a lack of alignment between the instruction, curriculum, environment, and learner.
Modify instruction and implement evidenced-based interventions based on individual needs.
Make informed decisions about what resources are needed to ensure student success.
Goals of RtI in FloridaT i R – Thinking is Required
A Shift in Thinking
The central question is not:“What about the student is causing the performance
discrepancy?” but“What about the interaction of the instruction,
curriculum, environment, and learner should be altered so that students will learn?”
This shift alters everything!
Consensus SurveyActivity 1
• Complete survey individually – 5 minutes
• Share and discuss discrepancies within your small group – 5 minutes
• Whole group share and discussion – 10 minutes
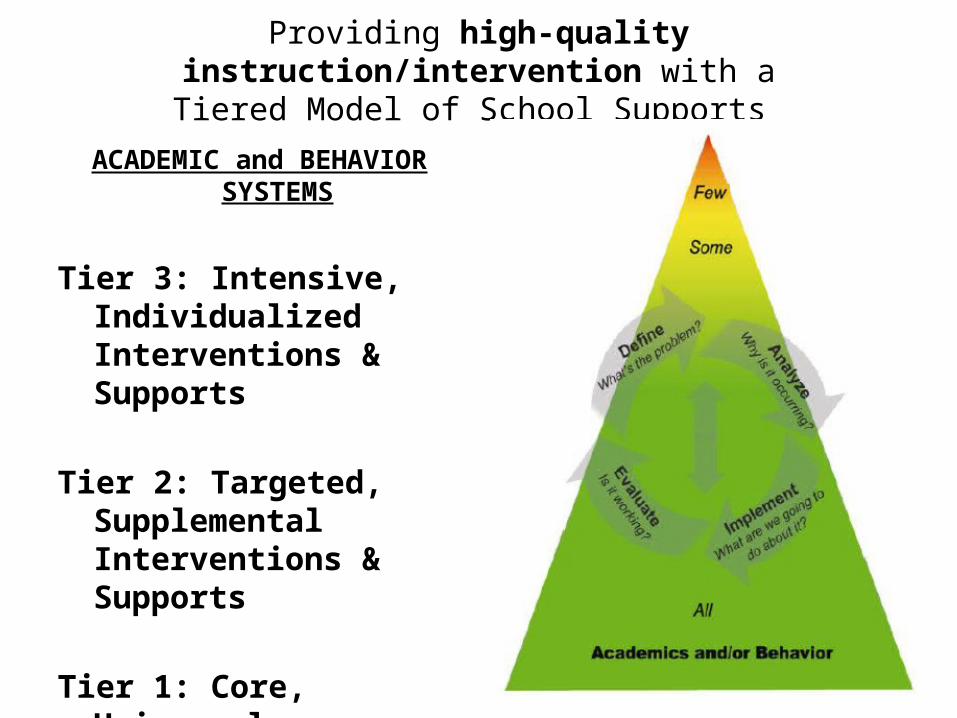
Providing high-quality instruction/intervention with aTiered Model of School Supports
ACADEMIC and BEHAVIOR SYSTEMS
Tier 3: Intensive, Individualized Interventions & Supports
Tier 2: Targeted, Supplemental Interventions & Supports
Tier 1: Core, Universal Instruction & Supports

What is the Problem?
Why is itoccurring?
Is it working?
What are we going to do about it?
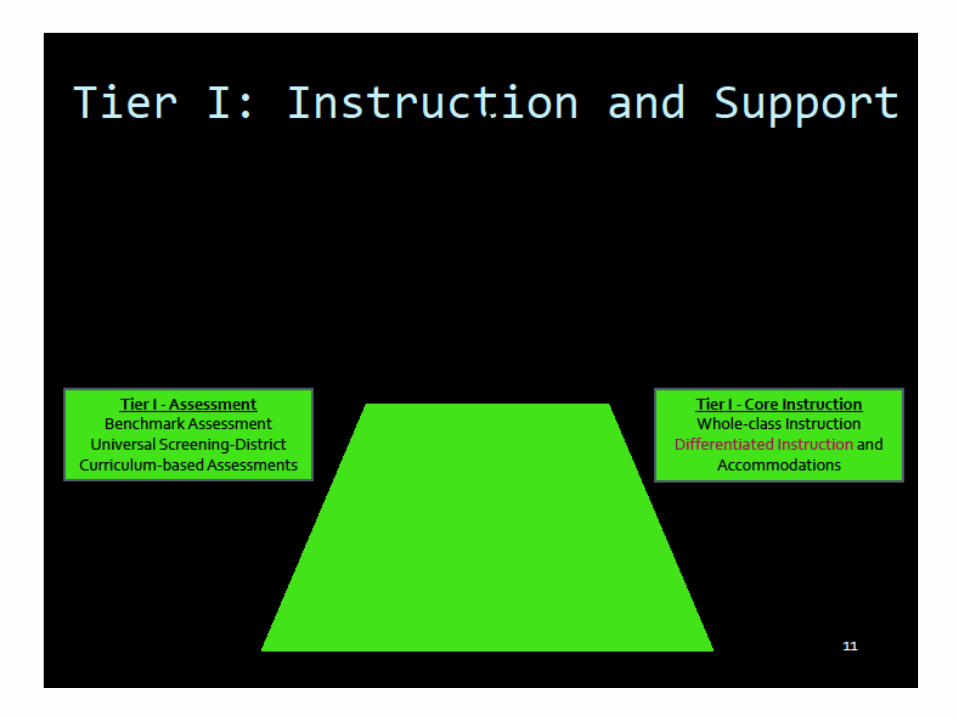
Tiers of Service Delivery
I
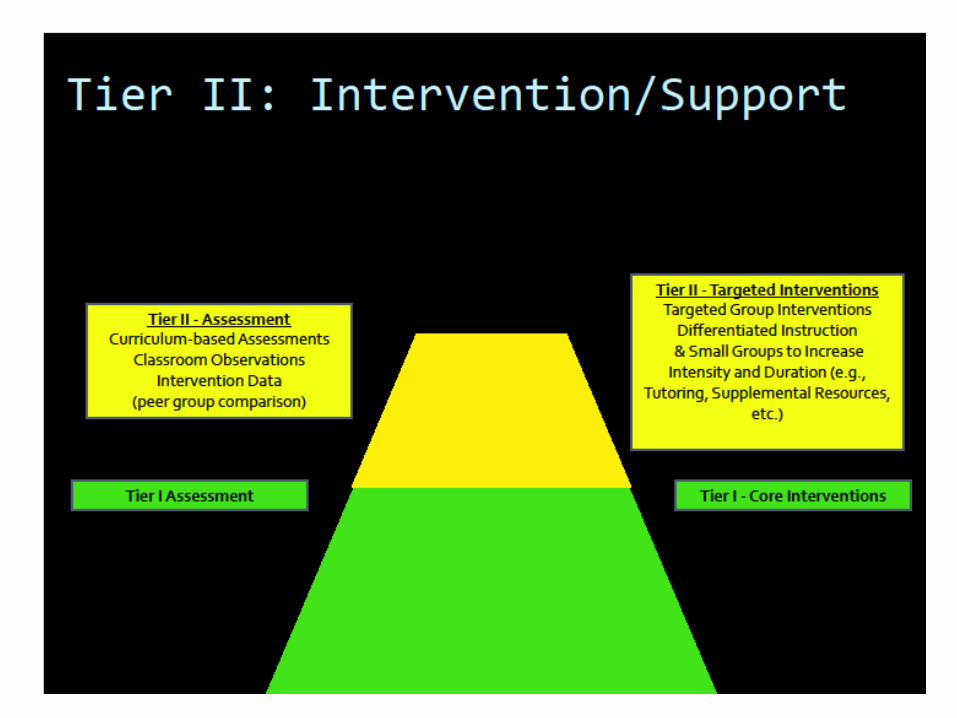
II
III
Problem Identification
Problem Analysis
Intervention Design
Responseto
Intervention

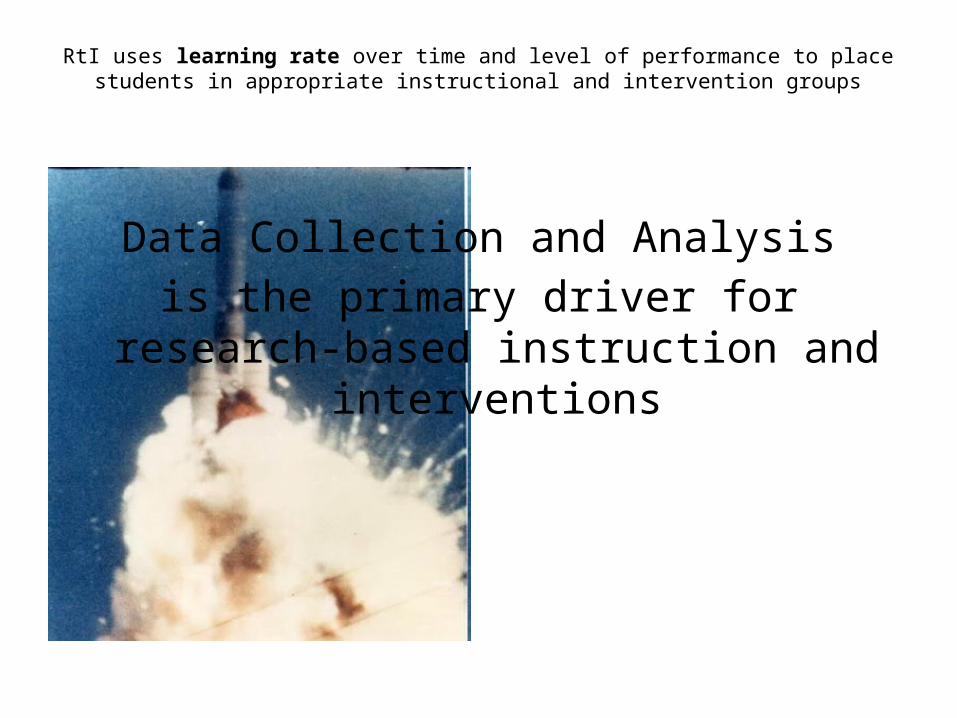
RtI uses learning rate over time and level of performance to place students in appropriate instructional and intervention groups
Data Collection and Analysisis the primary driver for research-based
instruction and interventions
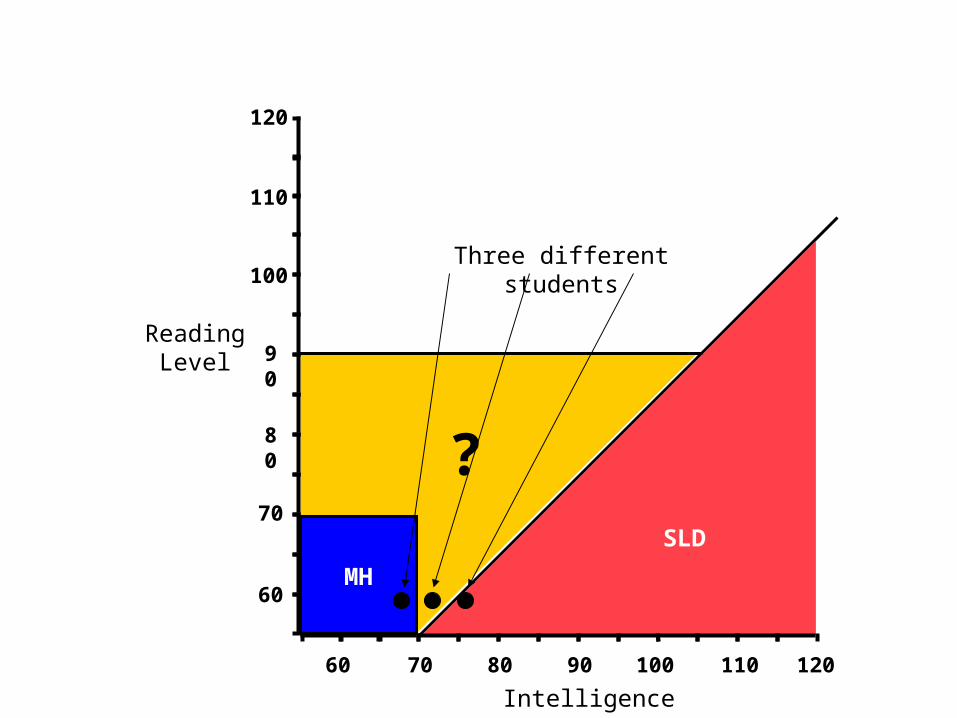
SLD
?
60 80 90 100 11070 120
Intelligence
60
70
90
80
100
110
120
ReadingLevel
MH
Three different students
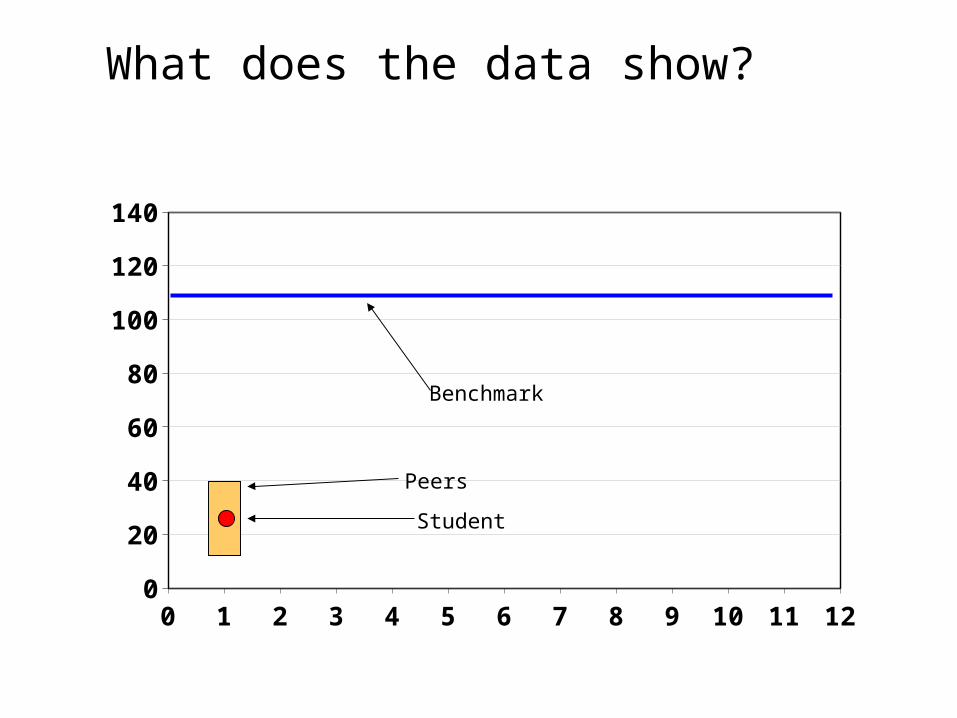
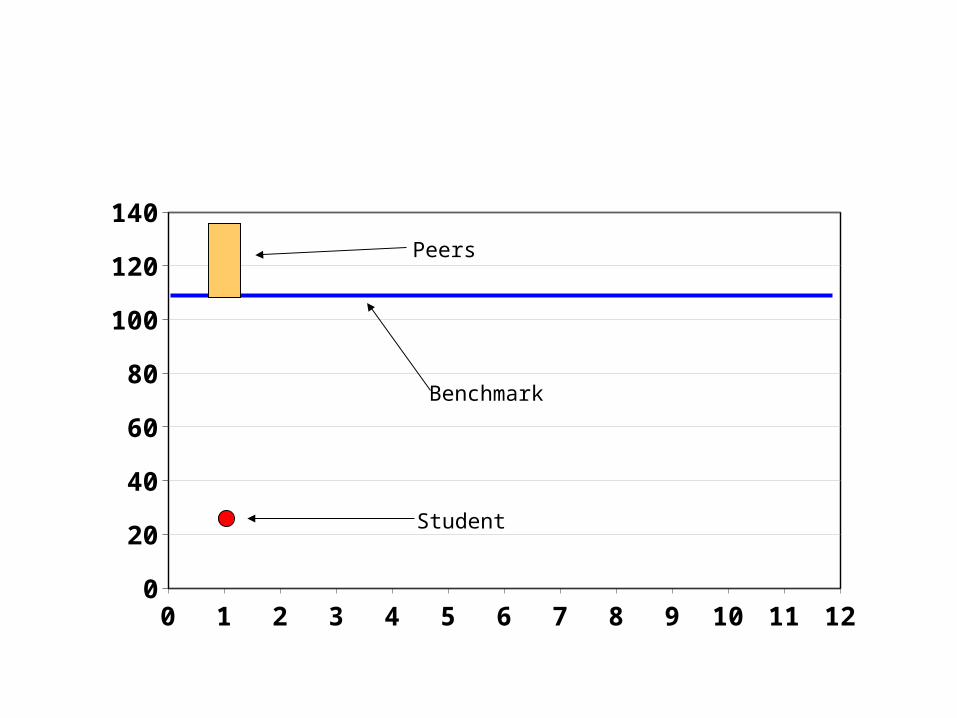
What does the data show?
0 1 2 3 4 5 6 7 8 9 10 11 120
20
40
60
80
100
120
140
Student
Benchmark
Peers

What does the data show?
0 1 2 3 4 5 6 7 8 9 10 11 120
20
40
60
80
100
120
140
Student
Benchmark
Peers
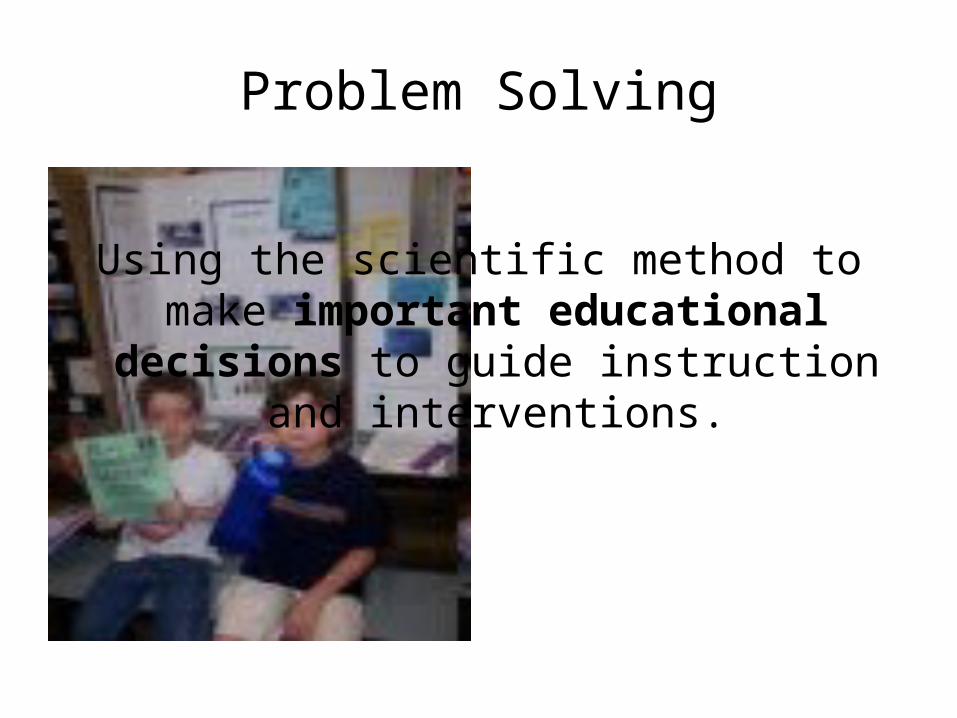
Problem Solving
Using the scientific method to make important educational decisions to guide instruction and
interventions.

Problem-Solving and the Tiers
Are 75-80% of students at benchmark?Is an individual student at significant gap?
• Tier 1 Services– Grade level, MESH team, Department, classroom
• Tier 2 Services– Intervention class, AYP sub-group, other at-risk
• Tier 3 Services– ASP pull-out, ESE push-in, at-risk

Problem Solving Process –Florida’s Model
EvaluateDid the plan work?
Problem AnalysisWhy is it occurring?
Problem IdentificationWhat is the problem?
Develop and Implement PlanWhat can we do about it?
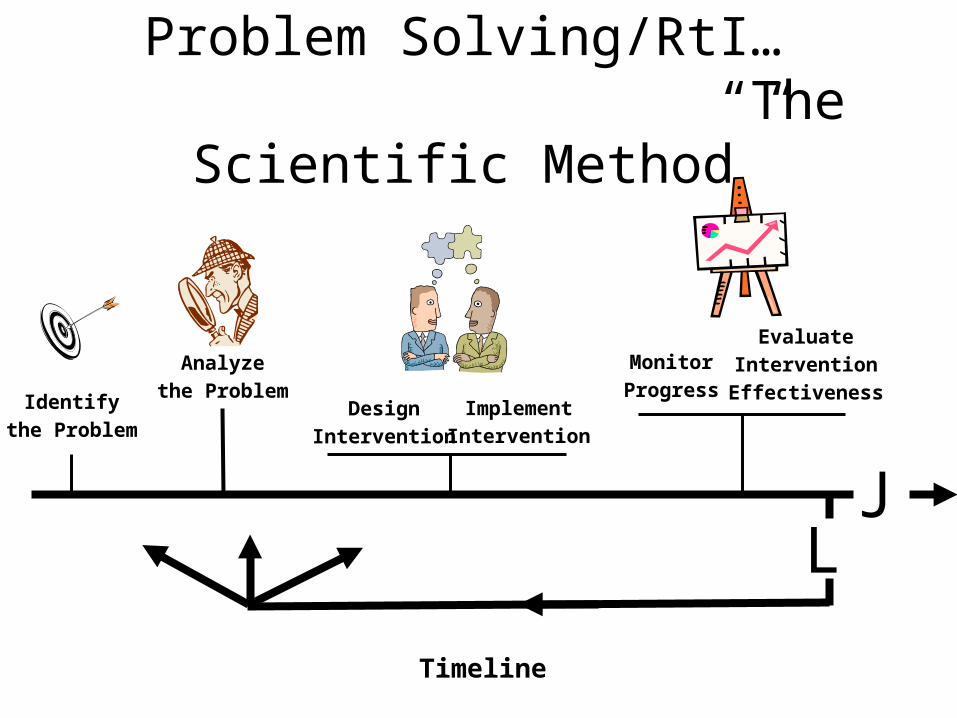
Problem Solving/RtI… “The Scientific Method”
Identifythe Problem
DesignIntervention
MonitorProgress
Analyzethe Problem
ImplementIntervention
EvaluateInterventionEffectiveness
Timeline
LJ
0 1 2 3 4 5 6 7 8 9 10 11 120
20
40
60
80
100
120
140
Student
Benchmark
Peers
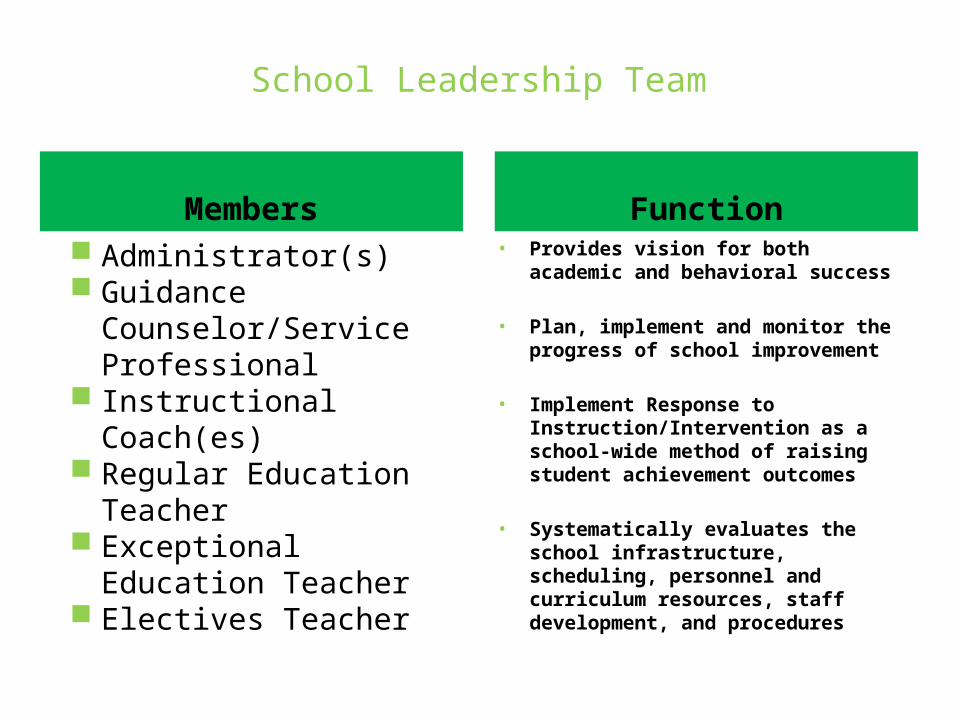
School Leadership Team
Members Administrator(s) Guidance
Counselor/Service Professional
Instructional Coach(es) Regular Education Teacher Exceptional Education
Teacher Electives Teacher
Function• Provides vision for both academic and
behavioral success
• Plan, implement and monitor the progress of school improvement
• Implement Response to Instruction/Intervention as a school-wide method of raising student achievement outcomes
• Systematically evaluates the school infrastructure, scheduling, personnel and curriculum resources, staff development, and procedures
School Leadership Team
• Reviews data to problem-solve Tier 1 academics and behavior
• Examines progress monitoring data across Tiers for fidelity and effectiveness
• Reviews scheduling and resources for innovation
• Maps curriculum to enhance interventions
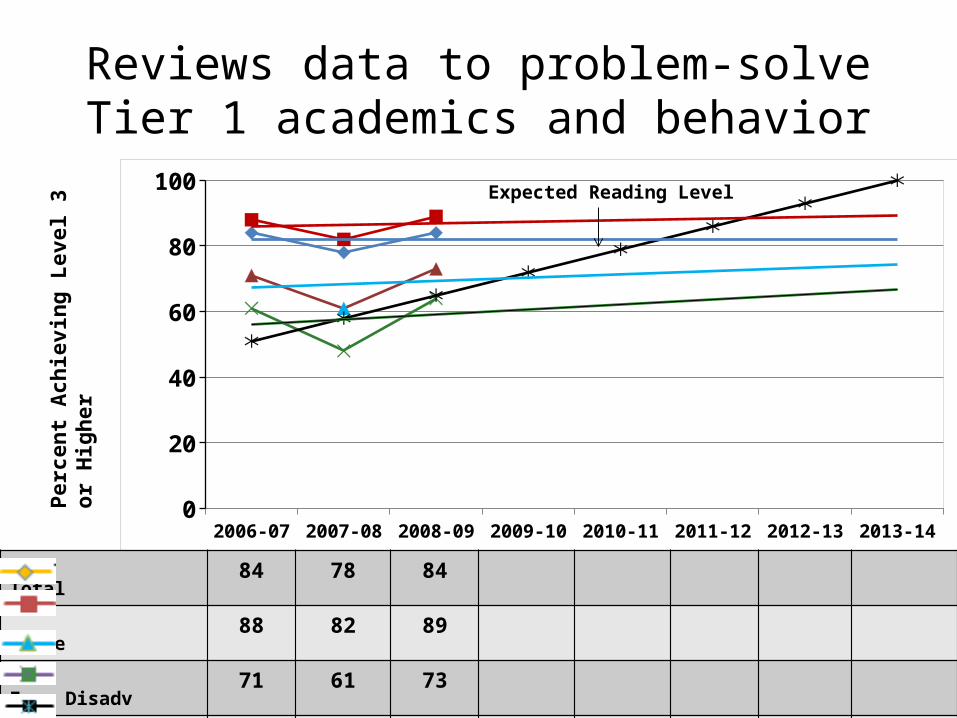
Reviews data to problem-solve Tier 1 academics and behavior
2006-07 2007-08 2008-09 2009-10 2010-11 2011-12 2012-13 2013-140
20
40
60
80
100
Total 84 78 84 White 88 82 89 Econ Disadv 71 61 73 Students w/ Disabilities
61 48 64
Expected Reading Level
51 58 65 72 79 86 93 100
Perc
ent A
chie
ving
Lev
el 3
or H
ighe
r Expected Reading Level
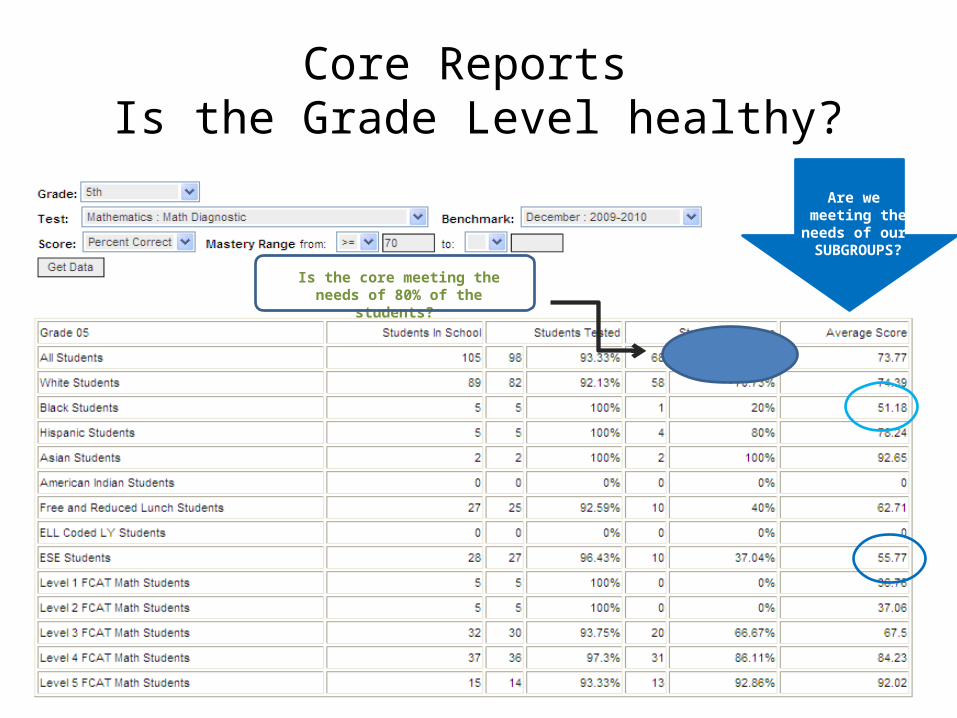
Core Reports Is the Grade Level healthy?
Is the core meeting the needs of 80% of the students?
Are we meeting the needs of our SUBGROUPS?
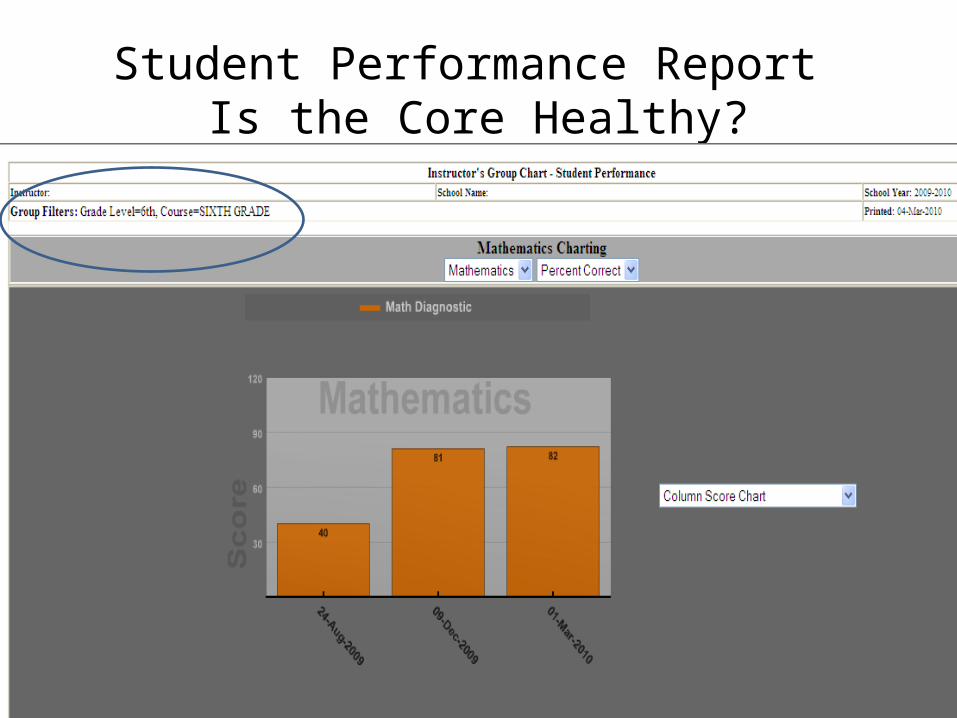
Student Performance Report Is the Core Healthy?

Student Performance ReportIs the Core Healthy?

Teacher Data TeamsSecondary
• Middle School – MESH team– All teachers through A3 input
• High School– MESH team– Grade-level cohort– Department– All teachers through A3 input
Tier 2 – System-driven or AYP-focused
• Intervention reading and math classes– FCAT vs. FAIR– Fluidity
• AYP Sub-groups focus– Targeted small group-focus– Who, when, where, what?
Tier 1 and 2 - Objective and Subjective Criteria
• Student scores <35% on latest FAIR• Student scores <35% on latest district Math or
Science assessments• Student receives three or more F’s on latest
report card• Classroom Teacher identifies student at-risk of
academic failure

Individual Problem Solving Team
• Formerly known as “CST”
• Tier 3 interventions – one-on-one– Who, what, when, where?
• ESE Referral– SLD, EBD, Language, Behavior