Embed Size (px)
Citation preview
Launch Vehicle Vibrations. First European Conference. 1 CNES Toulouse, Dec. 14-16, 99.
PYROSHOCK SIMULATION USING THE ALCATEL ETCA TEST FACILITY.
Enrico FILIPPIAlcatel ETCA s.a BP 4008 B-6000 Charleroi Belgium
Phone: +32 71 44 25 73, Fax: +32 71 44 22 00, E-mail: [email protected]
Hamien ATTOUOMAN, Prof. Calogero CONTIFaculté Polytechnique de Mons, Service de mécanique rationnelle,
Boulevard Dolez, 31 B-7000 Mons BelgiumPhone: +32 65 37 41 80, Fax: +32 65 37 43 00, E-mail: [email protected]
ABSTRACT.
Today’s Aerospace vehicles utilise numerouspyrotechnic devices to separate structuralsubsystems, deploy appendages and activate on-board operational subsystems. The firing of thesepyrotechnical charges generates severe impulsiveloads (so-called pyroshocks) that can causefailures in electronic components. There is a lackof computational techniques to predict the dynamicbehaviour of complex structures when subjected tohigh frequency shock waves as well as a lack ofdamage and failure criteria for electronicequipment and so the projects must rely on testingto validate the design.
Alcatel ETCA has developed a pyroshock testfacility dedicated to the testing of electronic units.The facility utilises a resonant test fixture assemblythat is excited by a detonating charge or amechanical impact. The test fixture assembly canbe a simple plate, a beam, a double plate assemblyor a more complex structure. The test itemattached to the fixture is subjected to the directshock wave and to the resonant response of the testfixture, which simulates the desired pyroshock. Thetest set up is checked and tuned versus the testspecification by using a dummy of the test item.When the desired pyroshock is achieved, thenominal tests are performed on the test item.
Part I of this presentation describes the maincharacteristics of the test facility: test fixtures,excitation techniques, data acquisition, and dataprocessing.
Part II presents some test results and details theeffects of variables upon the induced shockresponse spectra. The main variables are relatedto the design of the test fixture (type, size, material)and the characteristics of the excitation (amount ofexplosive, location of explosive, and so on).
1. BACKGROUND.
1.1. Pyrotechnics [3] [14b].
Current launchers, payloads and spacecrafts utilisepyrotechnic devices over the course of their missions forthe separation structural subsystems (e.g., booster,fairing or stage separation, clamp band release), therelease of deployable appendages (e.g., solar panels orantenna’s), and/or the activation of on-board operationalsubsystems (e.g., propellant valves).
Pyrotechnics are extensively applied because of theirhigh efficiency: high energy delivered per unit weight, small volume, long term storable energy, controllable initiation and output energies, little initiation external energy required,
and despite a number of disadvantages: single shot, cannot be functionally checked before flight, impulsive loads (pyroshocks), safety issues, limited engineering approaches, some unexplained failures.
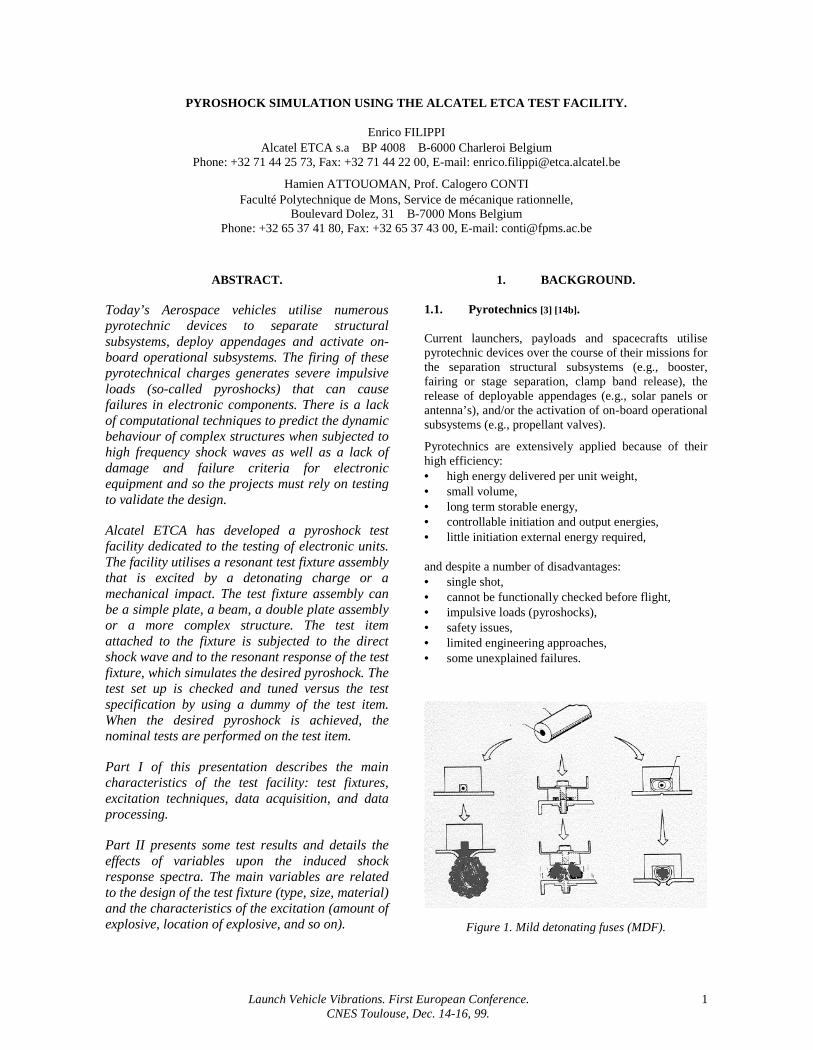
Figure 1. Mild detonating fuses (MDF).
Launch Vehicle Vibrations. First European Conference. 2 CNES Toulouse, Dec. 14-16, 99.
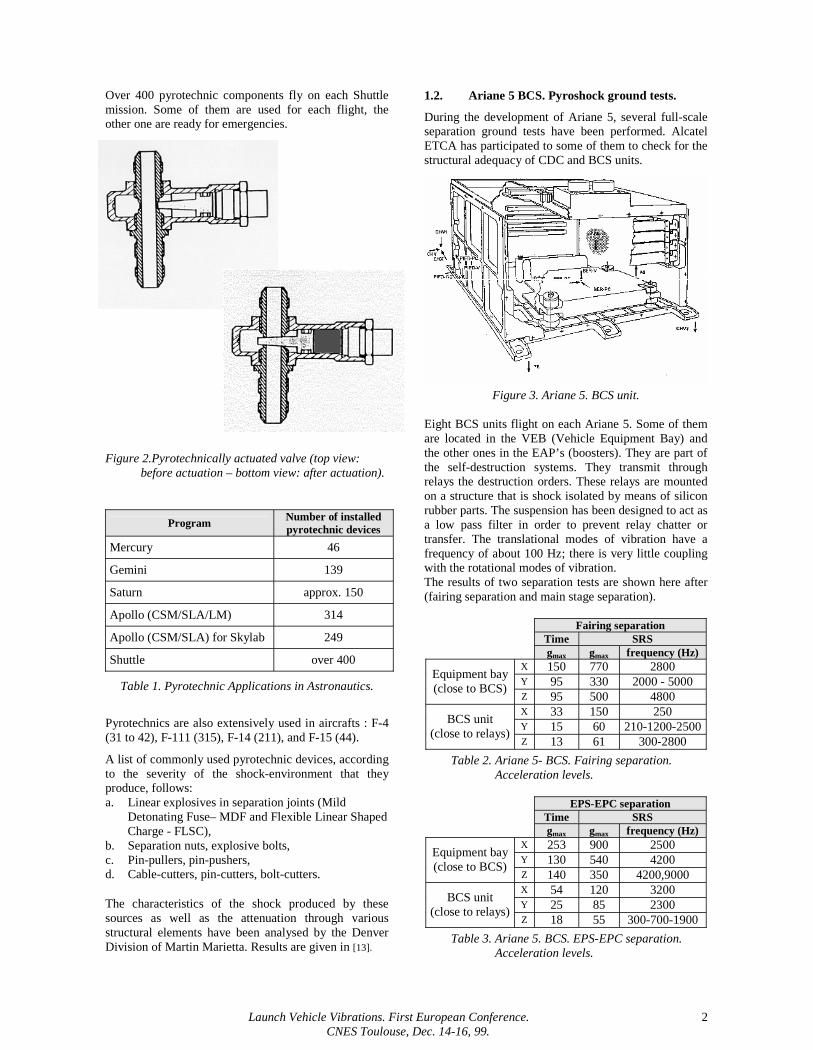
Over 400 pyrotechnic components fly on each Shuttlemission. Some of them are used for each flight, theother one are ready for emergencies.
Figure 2.Pyrotechnically actuated valve (top view:before actuation – bottom view: after actuation).
Program Number of installedpyrotechnic devices
Mercury 46
Gemini 139
Saturn approx. 150
Apollo (CSM/SLA/LM) 314
Apollo (CSM/SLA) for Skylab 249
Shuttle over 400
Table 1. Pyrotechnic Applications in Astronautics.
Pyrotechnics are also extensively used in aircrafts : F-4(31 to 42), F-111 (315), F-14 (211), and F-15 (44).
A list of commonly used pyrotechnic devices, accordingto the severity of the shock-environment that theyproduce, follows:a. Linear explosives in separation joints (Mild
Detonating Fuse– MDF and Flexible Linear ShapedCharge - FLSC),
b. Separation nuts, explosive bolts,c. Pin-pullers, pin-pushers,d. Cable-cutters, pin-cutters, bolt-cutters.
The characteristics of the shock produced by thesesources as well as the attenuation through variousstructural elements have been analysed by the DenverDivision of Martin Marietta. Results are given in [13].
1.2. Ariane 5 BCS. Pyroshock ground tests.
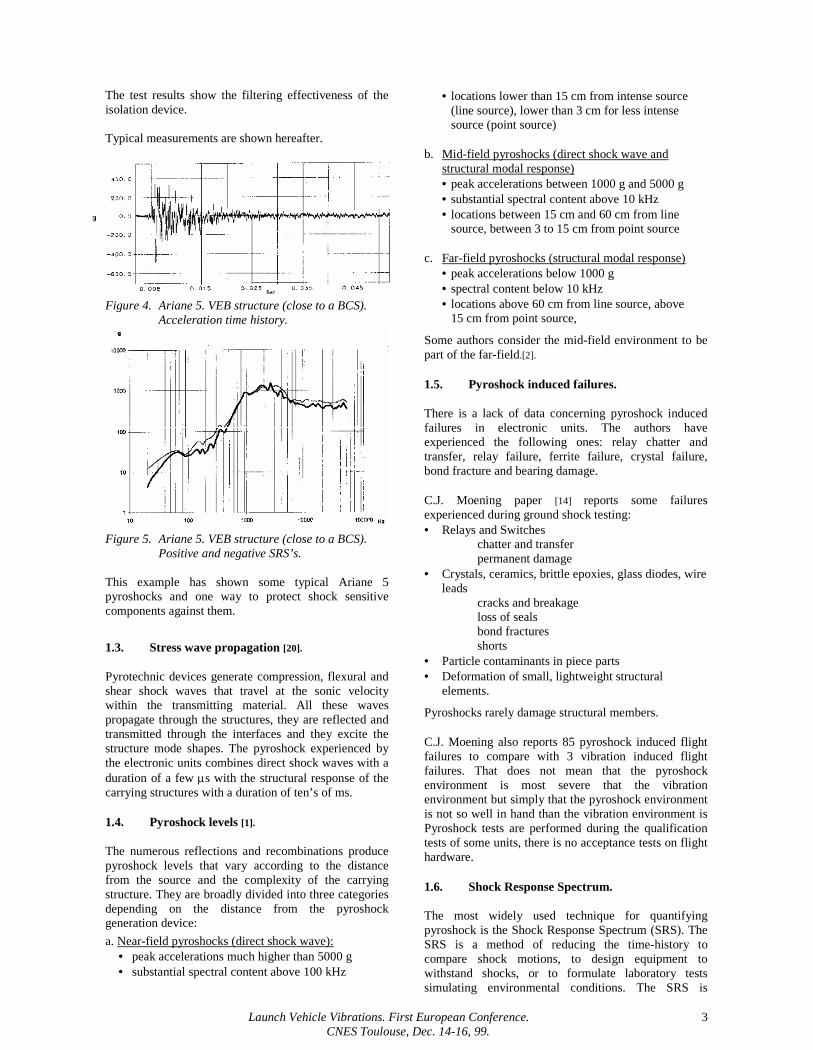
During the development of Ariane 5, several full-scaleseparation ground tests have been performed. AlcatelETCA has participated to some of them to check for thestructural adequacy of CDC and BCS units.
Figure 3. Ariane 5. BCS unit.
Eight BCS units flight on each Ariane 5. Some of themare located in the VEB (Vehicle Equipment Bay) andthe other ones in the EAP’s (boosters). They are part ofthe self-destruction systems. They transmit throughrelays the destruction orders. These relays are mountedon a structure that is shock isolated by means of siliconrubber parts. The suspension has been designed to act asa low pass filter in order to prevent relay chatter ortransfer. The translational modes of vibration have afrequency of about 100 Hz; there is very little couplingwith the rotational modes of vibration.The results of two separation tests are shown here after(fairing separation and main stage separation).
Fairing separationTime SRSgmax gmax frequency (Hz)
X 150 770 2800Y 95 330 2000 - 5000
Equipment bay(close to BCS)
Z 95 500 4800X 33 150 250Y 15 60 210-1200-2500
BCS unit(close to relays)
Z 13 61 300-2800
Table 2. Ariane 5- BCS. Fairing separation.Acceleration levels.
EPS-EPC separationTime SRSgmax gmax frequency (Hz)
X 253 900 2500Y 130 540 4200
Equipment bay(close to BCS)
Z 140 350 4200,9000X 54 120 3200Y 25 85 2300
BCS unit(close to relays)
Z 18 55 300-700-1900
Table 3. Ariane 5. BCS. EPS-EPC separation.Acceleration levels.
Launch Vehicle Vibrations. First European Conference. 3 CNES Toulouse, Dec. 14-16, 99.
The test results show the filtering effectiveness of theisolation device.
Typical measurements are shown hereafter.
Figure 4. Ariane 5. VEB structure (close to a BCS).Acceleration time history.
Figure 5. Ariane 5. VEB structure (close to a BCS).Positive and negative SRS’s.
This example has shown some typical Ariane 5pyroshocks and one way to protect shock sensitivecomponents against them.
1.3. Stress wave propagation [20].
Pyrotechnic devices generate compression, flexural andshear shock waves that travel at the sonic velocitywithin the transmitting material. All these wavespropagate through the structures, they are reflected andtransmitted through the interfaces and they excite thestructure mode shapes. The pyroshock experienced bythe electronic units combines direct shock waves with aduration of a few s with the structural response of thecarrying structures with a duration of ten’s of ms.
1.4. Pyroshock levels [1].
The numerous reflections and recombinations producepyroshock levels that vary according to the distancefrom the source and the complexity of the carryingstructure. They are broadly divided into three categoriesdepending on the distance from the pyroshockgeneration device:
a. Near-field pyroshocks (direct shock wave): peak accelerations much higher than 5000 g substantial spectral content above 100 kHz
locations lower than 15 cm from intense source(line source), lower than 3 cm for less intensesource (point source)
b. Mid-field pyroshocks (direct shock wave andstructural modal response) peak accelerations between 1000 g and 5000 g substantial spectral content above 10 kHz locations between 15 cm and 60 cm from line
source, between 3 to 15 cm from point source
c. Far-field pyroshocks (structural modal response) peak accelerations below 1000 g spectral content below 10 kHz locations above 60 cm from line source, above
15 cm from point source,
Some authors consider the mid-field environment to bepart of the far-field.[2].
1.5. Pyroshock induced failures.
There is a lack of data concerning pyroshock inducedfailures in electronic units. The authors haveexperienced the following ones: relay chatter andtransfer, relay failure, ferrite failure, crystal failure,bond fracture and bearing damage.
C.J. Moening paper [14] reports some failuresexperienced during ground shock testing: Relays and Switches
chatter and transferpermanent damage
Crystals, ceramics, brittle epoxies, glass diodes, wireleads
cracks and breakageloss of sealsbond fracturesshorts
Particle contaminants in piece parts Deformation of small, lightweight structural
elements.
Pyroshocks rarely damage structural members.
C.J. Moening also reports 85 pyroshock induced flightfailures to compare with 3 vibration induced flightfailures. That does not mean that the pyroshockenvironment is most severe that the vibrationenvironment but simply that the pyroshock environmentis not so well in hand than the vibration environment isPyroshock tests are performed during the qualificationtests of some units, there is no acceptance tests on flighthardware.
1.6. Shock Response Spectrum.
The most widely used technique for quantifyingpyroshock is the Shock Response Spectrum (SRS). TheSRS is a method of reducing the time-history tocompare shock motions, to design equipment towithstand shocks, or to formulate laboratory testssimulating environmental conditions. The SRS is
Launch Vehicle Vibrations. First European Conference. 4 CNES Toulouse, Dec. 14-16, 99.
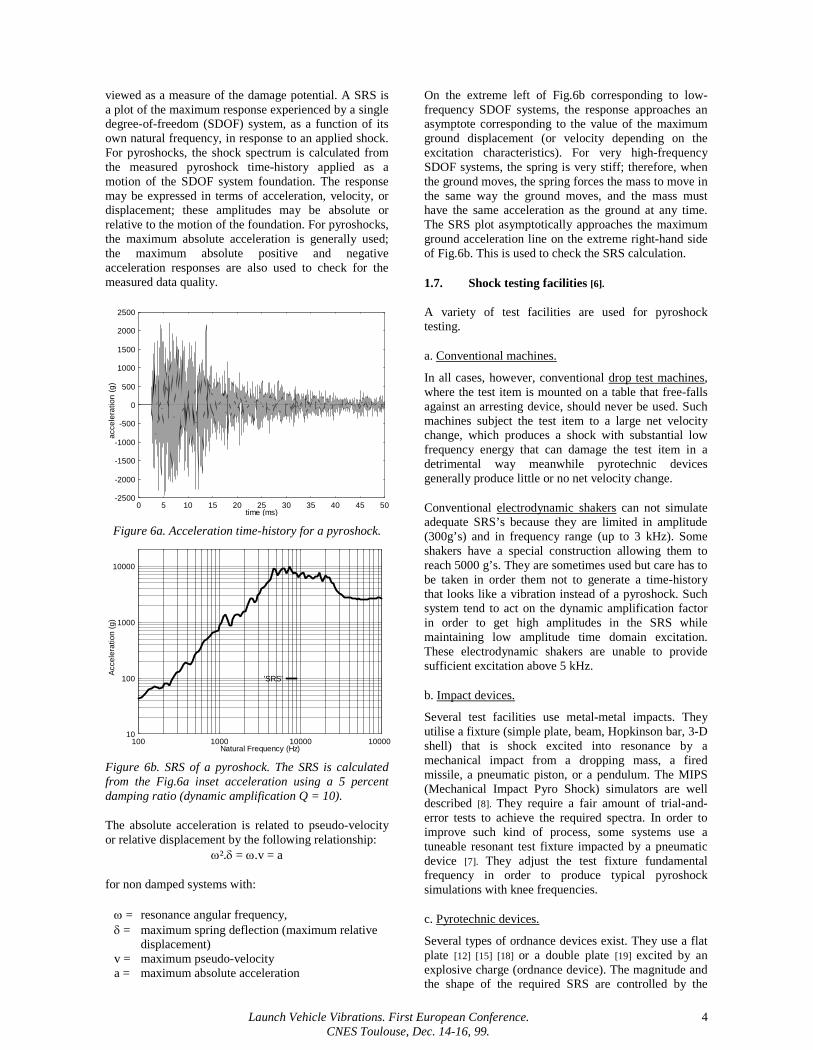
viewed as a measure of the damage potential. A SRS isa plot of the maximum response experienced by a singledegree-of-freedom (SDOF) system, as a function of itsown natural frequency, in response to an applied shock.For pyroshocks, the shock spectrum is calculated fromthe measured pyroshock time-history applied as amotion of the SDOF system foundation. The responsemay be expressed in terms of acceleration, velocity, ordisplacement; these amplitudes may be absolute orrelative to the motion of the foundation. For pyroshocks,the maximum absolute acceleration is generally used;the maximum absolute positive and negativeacceleration responses are also used to check for themeasured data quality.
-2500
-2000
-1500
-1000
-500
0
500
1000
1500
2000
2500
0 5 10 15 20 25 30 35 40 45 50
acce
lera
tion
(g)
time (ms)
'timehis'
Figure 6a. Acceleration time-history for a pyroshock.
10
100
1000
10000
100 1000 10000 100000
Acce
lera
tion
(g)
Natural Frequency (Hz)
'SRS'
Figure 6b. SRS of a pyroshock. The SRS is calculatedfrom the Fig.6a inset acceleration using a 5 percentdamping ratio (dynamic amplification Q = 10).
The absolute acceleration is related to pseudo-velocityor relative displacement by the following relationship:
². = .v = a
for non damped systems with:
= resonance angular frequency, = maximum spring deflection (maximum relative
displacement)v = maximum pseudo-velocitya = maximum absolute acceleration
On the extreme left of Fig.6b corresponding to low-frequency SDOF systems, the response approaches anasymptote corresponding to the value of the maximumground displacement (or velocity depending on theexcitation characteristics). For very high-frequencySDOF systems, the spring is very stiff; therefore, whenthe ground moves, the spring forces the mass to move inthe same way the ground moves, and the mass musthave the same acceleration as the ground at any time.The SRS plot asymptotically approaches the maximumground acceleration line on the extreme right-hand sideof Fig.6b. This is used to check the SRS calculation.
1.7. Shock testing facilities [6].
A variety of test facilities are used for pyroshocktesting.
a. Conventional machines.
In all cases, however, conventional drop test machines,where the test item is mounted on a table that free-fallsagainst an arresting device, should never be used. Suchmachines subject the test item to a large net velocitychange, which produces a shock with substantial lowfrequency energy that can damage the test item in adetrimental way meanwhile pyrotechnic devicesgenerally produce little or no net velocity change.
Conventional electrodynamic shakers can not simulateadequate SRS’s because they are limited in amplitude(300g’s) and in frequency range (up to 3 kHz). Someshakers have a special construction allowing them toreach 5000 g’s. They are sometimes used but care has tobe taken in order them not to generate a time-historythat looks like a vibration instead of a pyroshock. Suchsystem tend to act on the dynamic amplification factorin order to get high amplitudes in the SRS whilemaintaining low amplitude time domain excitation.These electrodynamic shakers are unable to providesufficient excitation above 5 kHz.
b. Impact devices.
Several test facilities use metal-metal impacts. Theyutilise a fixture (simple plate, beam, Hopkinson bar, 3-Dshell) that is shock excited into resonance by amechanical impact from a dropping mass, a firedmissile, a pneumatic piston, or a pendulum. The MIPS(Mechanical Impact Pyro Shock) simulators are welldescribed [8]. They require a fair amount of trial-and-error tests to achieve the required spectra. In order toimprove such kind of process, some systems use atuneable resonant test fixture impacted by a pneumaticdevice [7]. They adjust the test fixture fundamentalfrequency in order to produce typical pyroshocksimulations with knee frequencies.
c. Pyrotechnic devices.
Several types of ordnance devices exist. They use a flatplate [12] [15] [18] or a double plate [19] excited by anexplosive charge (ordnance device). The magnitude andthe shape of the required SRS are controlled by the
Launch Vehicle Vibrations. First European Conference. 5 CNES Toulouse, Dec. 14-16, 99.
size/location of the explosive material and the locationof the test item on the plate. The advantage of thistechnique is its ability to achieve high accelerations andhigh frequencies and to generate transient excitationalong all axes at the same time.
1.8. Pyroshock Test Specification.
The SRS is the most commonly used technique forpyroshock test description. Acceleration values arespecified from a low frequency limit of a few hundredsof Hertz to a high frequency limit of 25 kHz (launchers)or 10 kHz (spacecrafts). The amplitudes vary widelydepending on the test specification. There is arequirement for each of the three orthogonal axes.Common tolerances are 6dB for frequencies< 3000 Hz and +9dB/-6dB for frequencies > 3000 Hz.Sometimes they are tighter but in such a case they aremuch difficult or impossible to achieve especially in thein-plane directions.Some specifications require that the SRS positive andnegative curves must be close to each other (forexample 3 dB). Sometimes there are additionalrequirements on acceleration pulse decay and peakvelocity.
Some examples are given in Fig.7.
10
100
1000
10000
100 1000 10000
Acce
lera
tion
(g)
Natural Frequency (Hz)
'Ariane5''Astra''ATV'
'Lorala''S4'
'Loralb''S2'
'XMM'
Figure 7. Specified Pyroshock Spectra.Out-of-plane direction.
Some specified SRS’s have an increasing amplitudewith frequency; some others do not, they have a kneefrequency with a constant acceleration above thisfrequency.
2. ALCATEL ETCA PYROSHOCK TESTFACILITY DESCRIPTION.
2.1. Test facility description.
The facility utilises several resonant test fixtures that areexcited either by a detonating charge or a mechanicalimpact (dropping mass, air gun, pneumatically drivenpiston, or sledge hammer). The test fixture can be asimple plate, a double plate, or a more complex
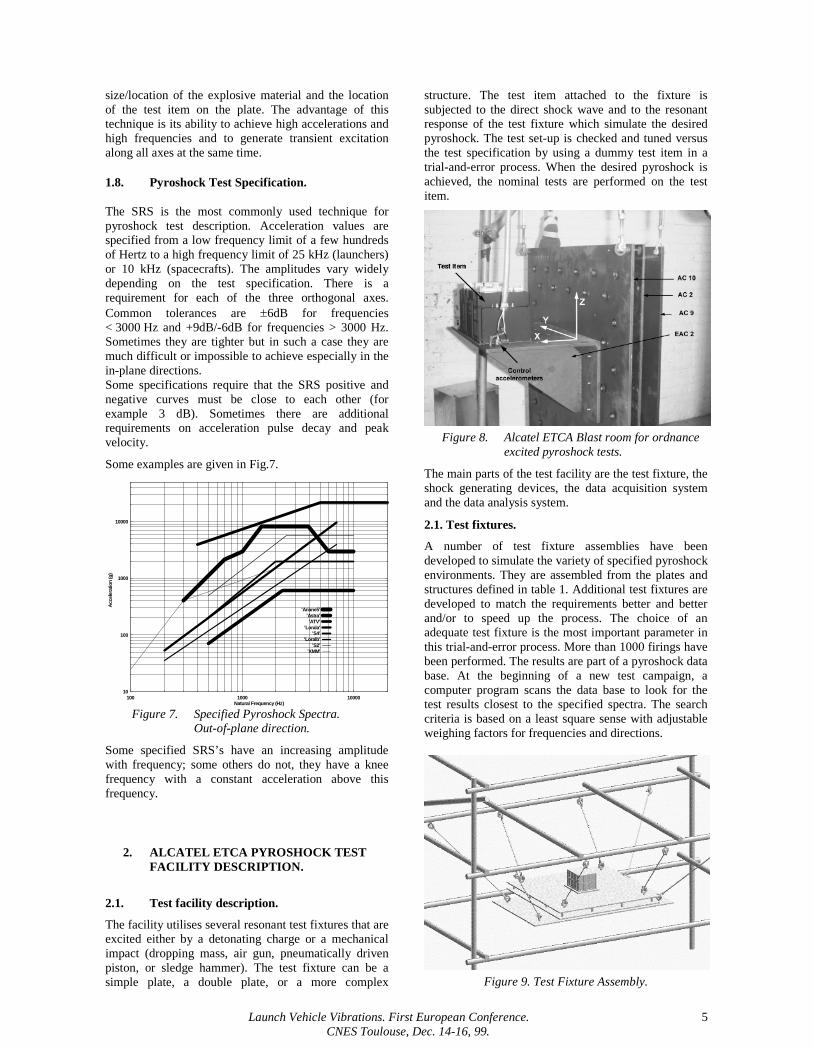
structure. The test item attached to the fixture issubjected to the direct shock wave and to the resonantresponse of the test fixture which simulate the desiredpyroshock. The test set-up is checked and tuned versusthe test specification by using a dummy test item in atrial-and-error process. When the desired pyroshock isachieved, the nominal tests are performed on the testitem.
Figure 8. Alcatel ETCA Blast room for ordnanceexcited pyroshock tests.
The main parts of the test facility are the test fixture, theshock generating devices, the data acquisition systemand the data analysis system.
2.1. Test fixtures.
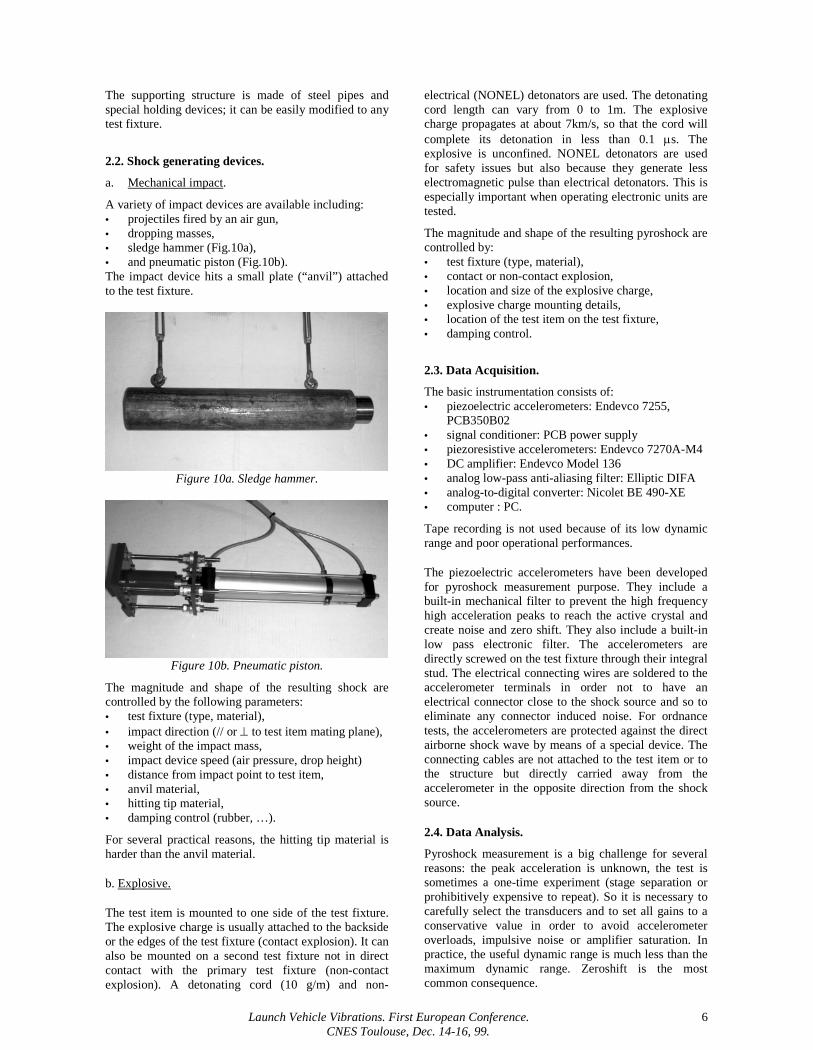
A number of test fixture assemblies have beendeveloped to simulate the variety of specified pyroshockenvironments. They are assembled from the plates andstructures defined in table 1. Additional test fixtures aredeveloped to match the requirements better and betterand/or to speed up the process. The choice of anadequate test fixture is the most important parameter inthis trial-and-error process. More than 1000 firings havebeen performed. The results are part of a pyroshock database. At the beginning of a new test campaign, acomputer program scans the data base to look for thetest results closest to the specified spectra. The searchcriteria is based on a least square sense with adjustableweighing factors for frequencies and directions.
Figure 9. Test Fixture Assembly.
Launch Vehicle Vibrations. First European Conference. 6 CNES Toulouse, Dec. 14-16, 99.
The supporting structure is made of steel pipes andspecial holding devices; it can be easily modified to anytest fixture.
2.2. Shock generating devices.
a. Mechanical impact.
A variety of impact devices are available including: projectiles fired by an air gun, dropping masses, sledge hammer (Fig.10a), and pneumatic piston (Fig.10b).The impact device hits a small plate (“anvil”) attachedto the test fixture.
Figure 10a. Sledge hammer.
Figure 10b. Pneumatic piston.
The magnitude and shape of the resulting shock arecontrolled by the following parameters: test fixture (type, material), impact direction (// or to test item mating plane), weight of the impact mass, impact device speed (air pressure, drop height) distance from impact point to test item, anvil material, hitting tip material, damping control (rubber, …).
For several practical reasons, the hitting tip material isharder than the anvil material.
b. Explosive.
The test item is mounted to one side of the test fixture.The explosive charge is usually attached to the backsideor the edges of the test fixture (contact explosion). It canalso be mounted on a second test fixture not in directcontact with the primary test fixture (non-contactexplosion). A detonating cord (10 g/m) and non-
electrical (NONEL) detonators are used. The detonatingcord length can vary from 0 to 1m. The explosivecharge propagates at about 7km/s, so that the cord willcomplete its detonation in less than 0.1 s. Theexplosive is unconfined. NONEL detonators are usedfor safety issues but also because they generate lesselectromagnetic pulse than electrical detonators. This isespecially important when operating electronic units aretested.
The magnitude and shape of the resulting pyroshock arecontrolled by: test fixture (type, material), contact or non-contact explosion, location and size of the explosive charge, explosive charge mounting details, location of the test item on the test fixture, damping control.
2.3. Data Acquisition.
The basic instrumentation consists of: piezoelectric accelerometers: Endevco 7255,
PCB350B02 signal conditioner: PCB power supply piezoresistive accelerometers: Endevco 7270A-M4 DC amplifier: Endevco Model 136 analog low-pass anti-aliasing filter: Elliptic DIFA analog-to-digital converter: Nicolet BE 490-XE computer : PC.
Tape recording is not used because of its low dynamicrange and poor operational performances.
The piezoelectric accelerometers have been developedfor pyroshock measurement purpose. They include abuilt-in mechanical filter to prevent the high frequencyhigh acceleration peaks to reach the active crystal andcreate noise and zero shift. They also include a built-inlow pass electronic filter. The accelerometers aredirectly screwed on the test fixture through their integralstud. The electrical connecting wires are soldered to theaccelerometer terminals in order not to have anelectrical connector close to the shock source and so toeliminate any connector induced noise. For ordnancetests, the accelerometers are protected against the directairborne shock wave by means of a special device. Theconnecting cables are not attached to the test item or tothe structure but directly carried away from theaccelerometer in the opposite direction from the shocksource.
2.4. Data Analysis.
Pyroshock measurement is a big challenge for severalreasons: the peak acceleration is unknown, the test issometimes a one-time experiment (stage separation orprohibitively expensive to repeat). So it is necessary tocarefully select the transducers and to set all gains to aconservative value in order to avoid accelerometeroverloads, impulsive noise or amplifier saturation. Inpractice, the useful dynamic range is much less than themaximum dynamic range. Zeroshift is the mostcommon consequence.
Launch Vehicle Vibrations. First European Conference. 7 CNES Toulouse, Dec. 14-16, 99.
Figure 11: Acceleration signal with zeroshift.
In a pyroshock testing facility, the expected peakacceleration value is known from the previous trials aswell as frequency content . So the dynamic range can beadjusted to improve the signal to noise ratio as much aspossible. This information is also used to check foraccelerometer selection. Nevertheless, once theaccelerations have been acquired, the data must beexamined to insure its quality. At least three steps arenecessary for the data validation: visual inspection of the time history velocity/displacement validation, positive versus negative SRS validation.
a. Visual inspection of the time history signals.
Common anomalies are described in [10]. They includezeroshift, asymmetry between positive and negativevalues, spikes, drop out, saturation and so on. The datahas to be visually checked for that.
b. Velocity and displacement computation.
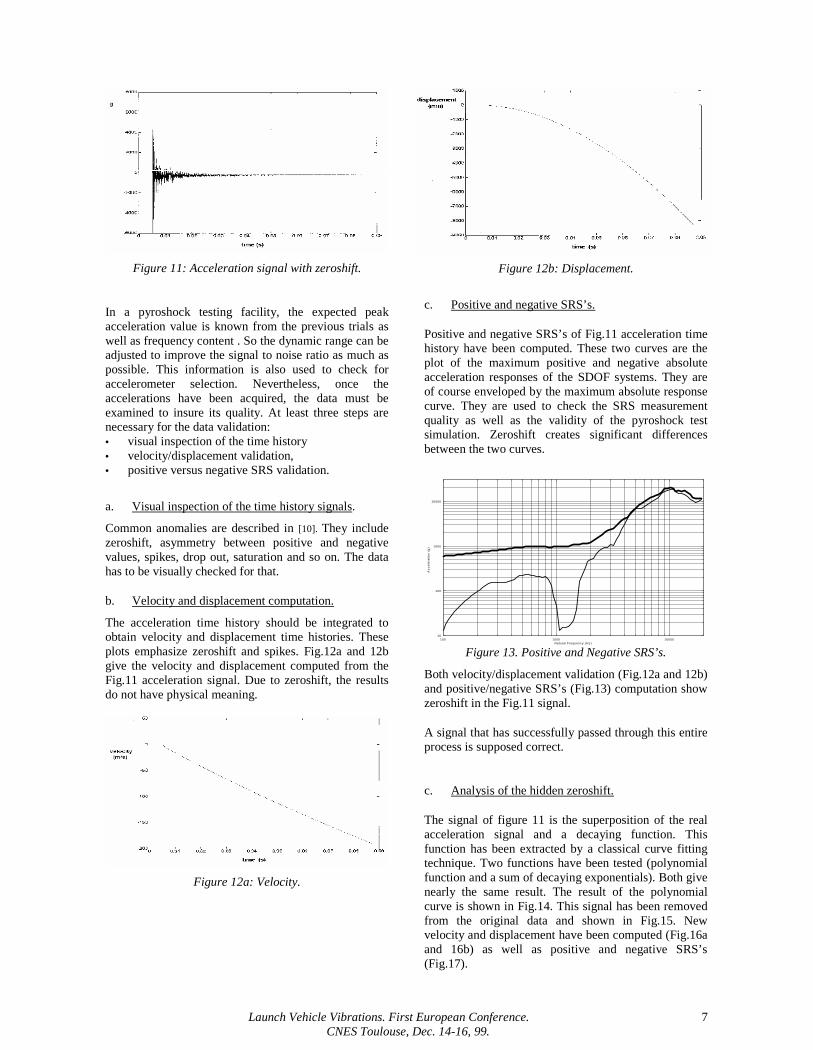
The acceleration time history should be integrated toobtain velocity and displacement time histories. Theseplots emphasize zeroshift and spikes. Fig.12a and 12bgive the velocity and displacement computed from theFig.11 acceleration signal. Due to zeroshift, the resultsdo not have physical meaning.
Figure 12a: Velocity.
Figure 12b: Displacement.
c. Positive and negative SRS’s.
Positive and negative SRS’s of Fig.11 acceleration timehistory have been computed. These two curves are theplot of the maximum positive and negative absoluteacceleration responses of the SDOF systems. They areof course enveloped by the maximum absolute responsecurve. They are used to check the SRS measurementquality as well as the validity of the pyroshock testsimulation. Zeroshift creates significant differencesbetween the two curves.
10
100
1000
10000
100 1000 10000
Acc
eler
atio
n (g
)
Natural F requenc y (Hz )
828y P os it if 2 828 Negatif 2
Figure 13. Positive and Negative SRS’s.
Both velocity/displacement validation (Fig.12a and 12b)and positive/negative SRS’s (Fig.13) computation showzeroshift in the Fig.11 signal.
A signal that has successfully passed through this entireprocess is supposed correct.
c. Analysis of the hidden zeroshift.
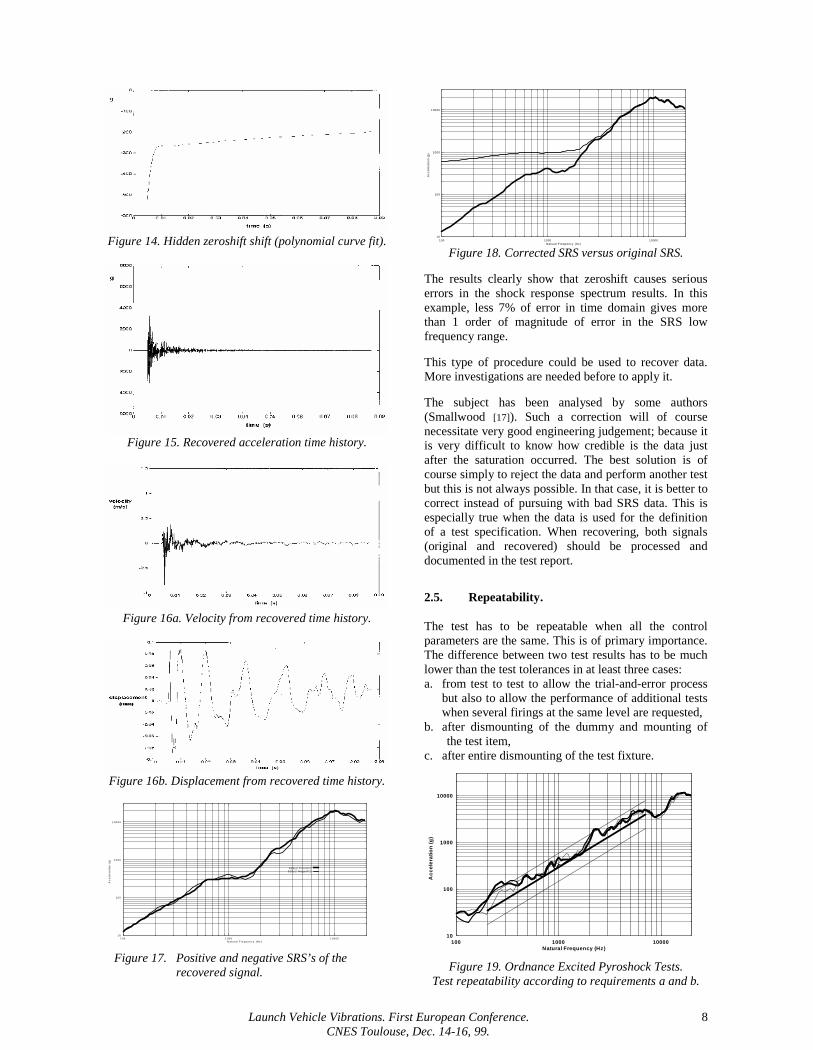
The signal of figure 11 is the superposition of the realacceleration signal and a decaying function. Thisfunction has been extracted by a classical curve fittingtechnique. Two functions have been tested (polynomialfunction and a sum of decaying exponentials). Both givenearly the same result. The result of the polynomialcurve is shown in Fig.14. This signal has been removedfrom the original data and shown in Fig.15. Newvelocity and displacement have been computed (Fig.16aand 16b) as well as positive and negative SRS’s(Fig.17).
Launch Vehicle Vibrations. First European Conference. 8 CNES Toulouse, Dec. 14-16, 99.
Figure 14. Hidden zeroshift shift (polynomial curve fit).
Figure 15. Recovered acceleration time history.
Figure 16a. Velocity from recovered time history.
Figure 16b. Displacement from recovered time history.
1 0
1 0 0
1 0 0 0
1 0 0 0 0
1 0 0 1 0 0 0 1 0 0 0 0
Ac
ce
lera
tio
n (
g)
N a tu ra l F re q u e n c y (H z )
8 2 8 y 2 P o s it i f 28 2 8 y 2 N e g a t if 2
Figure 17. Positive and negative SRS’s of therecovered signal.
10
100
1000
10000
100 1000 10000
Acc
eler
atio
n (g
)
Natural F requenc y (Hz )
'828y 2_m .s rc ''828y _m .s rc '
Figure 18. Corrected SRS versus original SRS.
The results clearly show that zeroshift causes seriouserrors in the shock response spectrum results. In thisexample, less 7% of error in time domain gives morethan 1 order of magnitude of error in the SRS lowfrequency range.
This type of procedure could be used to recover data.More investigations are needed before to apply it.
The subject has been analysed by some authors(Smallwood [17]). Such a correction will of coursenecessitate very good engineering judgement; because itis very difficult to know how credible is the data justafter the saturation occurred. The best solution is ofcourse simply to reject the data and perform another testbut this is not always possible. In that case, it is better tocorrect instead of pursuing with bad SRS data. This isespecially true when the data is used for the definitionof a test specification. When recovering, both signals(original and recovered) should be processed anddocumented in the test report.
2.5. Repeatability.
The test has to be repeatable when all the controlparameters are the same. This is of primary importance.The difference between two test results has to be muchlower than the test tolerances in at least three cases:a. from test to test to allow the trial-and-error process
but also to allow the performance of additional testswhen several firings at the same level are requested,
b. after dismounting of the dummy and mounting ofthe test item,
c. after entire dismounting of the test fixture.
10
100
1000
10000
100 1000 10000
Acc
eler
atio
n (g
)
Natural Frequency (Hz)
'ALENIA.src''ALENIAlo.src'
'ALENIAup.src''z874.src''z876.src''z877.src'
Figure 19. Ordnance Excited Pyroshock Tests.Test repeatability according to requirements a and b.
Launch Vehicle Vibrations. First European Conference. 9 CNES Toulouse, Dec. 14-16, 99.
Requirement (a) and (b) are almost always achieved.Requirement (c) is often achieved but, in some cases,additional adjustments are needed.
The test repeatability is much better with steel testfixtures than with aluminium structures.
3. EFFECT OF SOME PARAMETERS.
For mechanical impact, the main parameters affectingthe shock amplitude, shape and direction have beenpreviously described. Detailed information is given in[4] and [9].
In ordnance tests, the main parameters are the type oftest fixture assembly, the location and size of theexplosive charge, the explosive charge mounting details,the location of the test item on the test fixture and thedamping control. Hereafter, three of them are discussed.
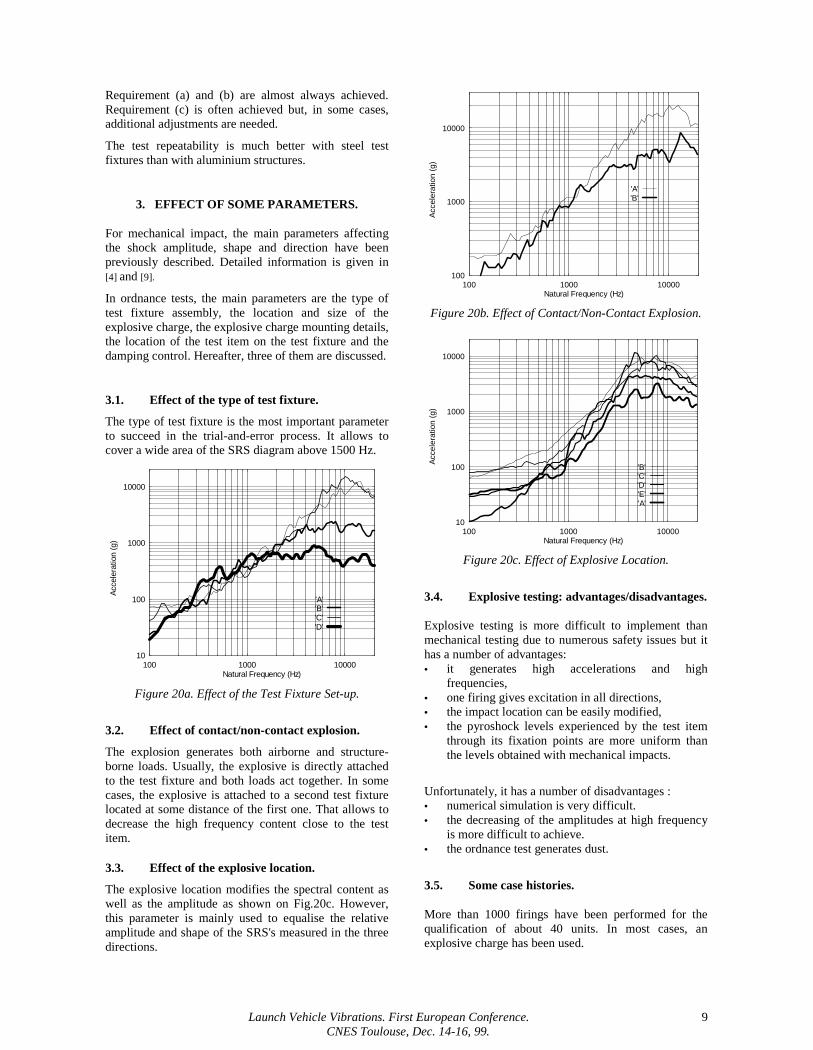
3.1. Effect of the type of test fixture.
The type of test fixture is the most important parameterto succeed in the trial-and-error process. It allows tocover a wide area of the SRS diagram above 1500 Hz.
10
100
1000
10000
100 1000 10000
Acce
lera
tion
(g)
Natural Frequency (Hz)
'A''B''C''D'
Figure 20a. Effect of the Test Fixture Set-up.
3.2. Effect of contact/non-contact explosion.
The explosion generates both airborne and structure-borne loads. Usually, the explosive is directly attachedto the test fixture and both loads act together. In somecases, the explosive is attached to a second test fixturelocated at some distance of the first one. That allows todecrease the high frequency content close to the testitem.
3.3. Effect of the explosive location.
The explosive location modifies the spectral content aswell as the amplitude as shown on Fig.20c. However,this parameter is mainly used to equalise the relativeamplitude and shape of the SRS's measured in the threedirections.
100
1000
10000
100 1000 10000
Acce
lera
tion
(g)
Natural Frequency (Hz)
'A''B'
Figure 20b. Effect of Contact/Non-Contact Explosion.
10
100
1000
10000
100 1000 10000
Acce
lera
tion
(g)
Natural Frequency (Hz)
'B''C''D''E''A'
Figure 20c. Effect of Explosive Location.
3.4. Explosive testing: advantages/disadvantages.
Explosive testing is more difficult to implement thanmechanical testing due to numerous safety issues but ithas a number of advantages: it generates high accelerations and high
frequencies, one firing gives excitation in all directions, the impact location can be easily modified, the pyroshock levels experienced by the test item
through its fixation points are more uniform thanthe levels obtained with mechanical impacts.
Unfortunately, it has a number of disadvantages : numerical simulation is very difficult. the decreasing of the amplitudes at high frequency
is more difficult to achieve. the ordnance test generates dust.
3.5. Some case histories.
More than 1000 firings have been performed for thequalification of about 40 units. In most cases, anexplosive charge has been used.
Launch Vehicle Vibrations. First European Conference. 10 CNES Toulouse, Dec. 14-16, 99.
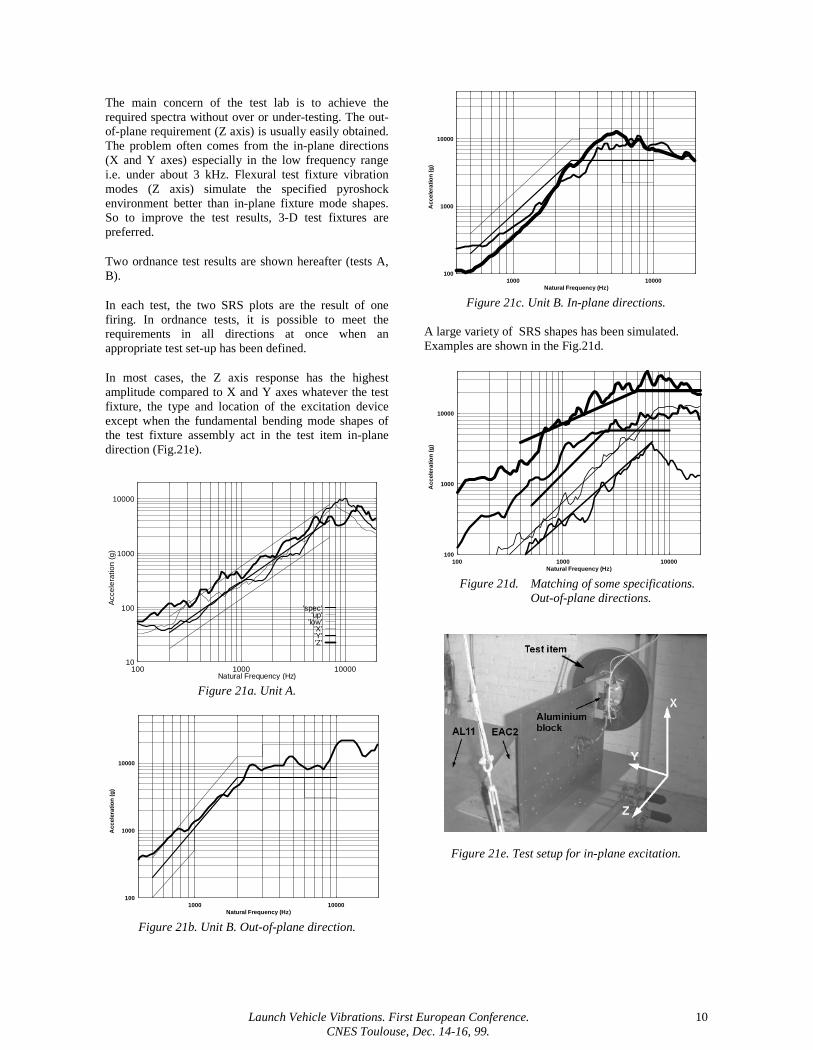
The main concern of the test lab is to achieve therequired spectra without over or under-testing. The out-of-plane requirement (Z axis) is usually easily obtained.The problem often comes from the in-plane directions(X and Y axes) especially in the low frequency rangei.e. under about 3 kHz. Flexural test fixture vibrationmodes (Z axis) simulate the specified pyroshockenvironment better than in-plane fixture mode shapes.So to improve the test results, 3-D test fixtures arepreferred.
Two ordnance test results are shown hereafter (tests A,B).
In each test, the two SRS plots are the result of onefiring. In ordnance tests, it is possible to meet therequirements in all directions at once when anappropriate test set-up has been defined.
In most cases, the Z axis response has the highestamplitude compared to X and Y axes whatever the testfixture, the type and location of the excitation deviceexcept when the fundamental bending mode shapes ofthe test fixture assembly act in the test item in-planedirection (Fig.21e).
10
100
1000
10000
100 1000 10000
Acc
eler
atio
n (g
)
Natural Frequency (Hz)
'spec''up'
'low''X''Y''Z'
Figure 21a. Unit A.
100
1000
10000
1000 10000
Acc
eler
atio
n (g
)
Natural Frequency (Hz)
'sUPSz.src''sUPSzup.src''sUPSzlo.src'
'824Z.src'
Figure 21b. Unit B. Out-of-plane direction.
100
1000
10000
1000 10000
Acc
eler
atio
n (g
)
Natural Frequency (Hz)
'sUPSxy.src''sUPSxyup.src''sUPSxylo.src'
'824x.src''824y.src'
Figure 21c. Unit B. In-plane directions.
A large variety of SRS shapes has been simulated.Examples are shown in the Fig.21d.
100
1000
10000
100 1000 10000
Acc
eler
atio
n (g
)
Natural Frequency (Hz)
'z1025o.src''atv.src'
'563z.src''s2.src'
'748Z.src''loralb.src''723z2.src''lorala.src'
Figure 21d. Matching of some specifications.Out-of-plane directions.
Figure 21e. Test setup for in-plane excitation.
Launch Vehicle Vibrations. First European Conference. 11 CNES Toulouse, Dec. 14-16, 99.
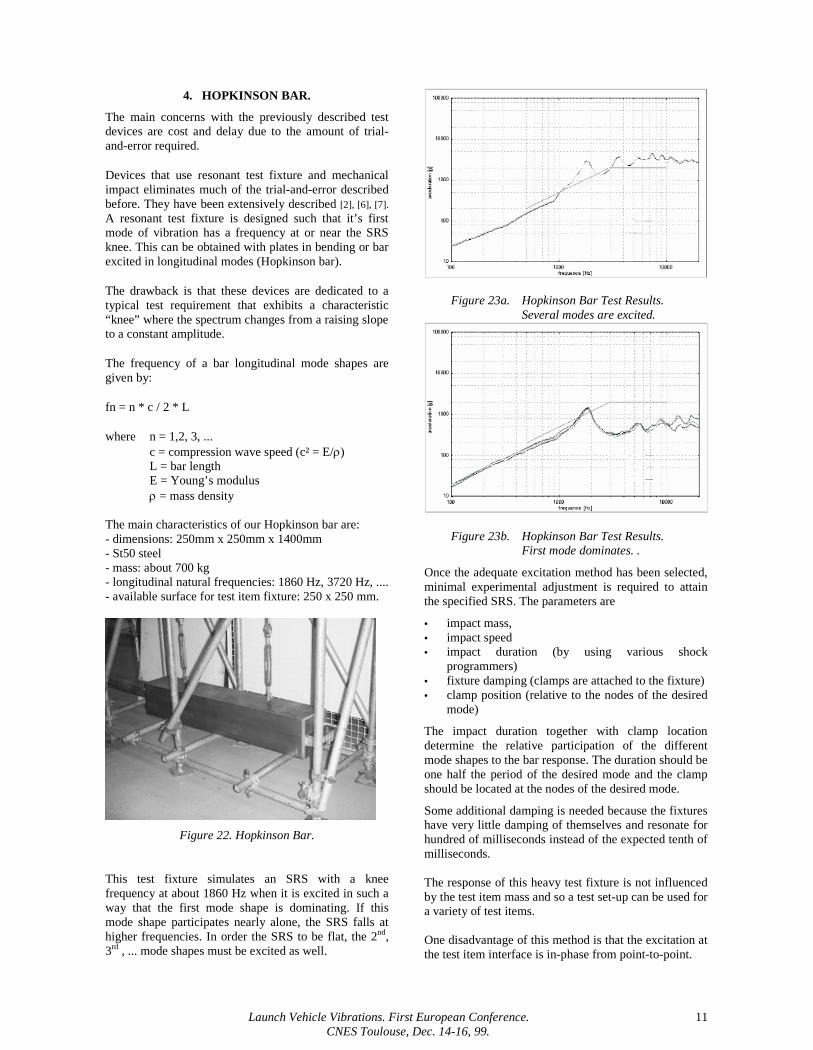
4. HOPKINSON BAR.
The main concerns with the previously described testdevices are cost and delay due to the amount of trial-and-error required.
Devices that use resonant test fixture and mechanicalimpact eliminates much of the trial-and-error describedbefore. They have been extensively described [2], [6], [7].
A resonant test fixture is designed such that it’s firstmode of vibration has a frequency at or near the SRSknee. This can be obtained with plates in bending or barexcited in longitudinal modes (Hopkinson bar).
The drawback is that these devices are dedicated to atypical test requirement that exhibits a characteristic“knee” where the spectrum changes from a raising slopeto a constant amplitude.
The frequency of a bar longitudinal mode shapes aregiven by:
fn = n * c / 2 * L
where n = 1,2, 3, ...c = compression wave speed (c² = E/)L = bar lengthE = Young’s modulus = mass density
The main characteristics of our Hopkinson bar are:- dimensions: 250mm x 250mm x 1400mm- St50 steel- mass: about 700 kg- longitudinal natural frequencies: 1860 Hz, 3720 Hz, ....- available surface for test item fixture: 250 x 250 mm.
Figure 22. Hopkinson Bar.
This test fixture simulates an SRS with a kneefrequency at about 1860 Hz when it is excited in such away that the first mode shape is dominating. If thismode shape participates nearly alone, the SRS falls athigher frequencies. In order the SRS to be flat, the 2nd,3rd , ... mode shapes must be excited as well.
Figure 23a. Hopkinson Bar Test Results.Several modes are excited.
Figure 23b. Hopkinson Bar Test Results.First mode dominates. .
Once the adequate excitation method has been selected,minimal experimental adjustment is required to attainthe specified SRS. The parameters are
impact mass, impact speed impact duration (by using various shock
programmers) fixture damping (clamps are attached to the fixture) clamp position (relative to the nodes of the desired
mode)
The impact duration together with clamp locationdetermine the relative participation of the differentmode shapes to the bar response. The duration should beone half the period of the desired mode and the clampshould be located at the nodes of the desired mode.
Some additional damping is needed because the fixtureshave very little damping of themselves and resonate forhundred of milliseconds instead of the expected tenth ofmilliseconds.
The response of this heavy test fixture is not influencedby the test item mass and so a test set-up can be used fora variety of test items.
One disadvantage of this method is that the excitation atthe test item interface is in-phase from point-to-point.
Launch Vehicle Vibrations. First European Conference. 12 CNES Toulouse, Dec. 14-16, 99.
For practical reasons, the test item is attached to anintermediate fixture such as a square plate. A steel plategives better results than an aluminium plate (the input isless altered).
Several excitation techniques have been tried (air gun,pneumatically driven piston, sledge hammers). The bestresults have obtained with a heavy sledge hammer.
9. CONCLUSION.
The Alcatel ETCA pyroshock test facility provides aversatile capability for shock testing of electronic unitsaccording to a wide range of test specifications to bemet in the three directions. The test facility has alreadybeen used successfully for the qualification of about40 units.
Achieving the desired Shock Response Spectrum in thedirection normal to the test item mating plane does notrequire too much trial-and-error because of theaccumulated experience and data base (more than1000 firings).
In the directions parallel to the test item mating plane,the requirements are much more difficult to achievewhen the acceleration is flat above a knee frequency andthe amplitude requirement is the same in all directions.
The Hopkinson bar concept should help to performmuch cheaper tests but its “damage potential” has stillto be demonstrated. As a first step, it will dedicated tothe evaluation of small shock sensitive components(relays, magnetic components, ceramics, glues).
REFERENCES
[1] Anon, “Pyroshock Test Criteria’, NASA-STD-XXXX, draft, August 15, 1997.
[2] Anon, “Pyroshock Testing Techniques”, IES-RP-DTE 32-1, draft document.
[3] L.J. Bement, M.L. Schimmel, “A Manual forPyrotechnic Design, Development and Qualification”,NASA Technical Memorandum 110172, June 1995.
[4] F. Cambier, C. Conti, P. Dehombreux, E. Filippi,“Laboratory Tests to Reproduce Severe ShockEnvironments”, BSMEE Conference, February 19th, 98.
[5] A. Chu, “Zeroshift of Piezoelectric Accelerometersin Pyroshock Measurements”. Endevco Corporation,Technical Paper 290.
[6] N.T. Davie and V.I. Bateman, “Pyroshock Testing”,Chapter 26, Part II in Shock and Vibration Handbook,4th ed., Mc Graw-Hill, NY, 1996.
[7] N.T. Davie and V.I. Bateman, “PyroshockSimulation for Satellite Components Using a TunableResonant Fixture – Phase 2”, Sandia Report SAND93-2294, April 1997.
[8] T.J. Dwyer, D.S. Moul, “Pyro Shock Simulation:Experience with the MIPS Simulator”.
[9] E. Filippi, F. Cambier, C. Conti, “Development ofthe Alcatel ETCA Test Facility”, European Conferenceon Spacecraft Structure, Materials and MechanicalTesting, Braunschweig, Nov.4-6, 1998.
[10] H. Himelblau, A.G. Piersol, J.H. Wise, and M.R.Grundvig, “Handbook for Dynamic Data Acquisitionand Analysis. Appendix A: Pyroshock Data Acquisitionand Analysis”, IES-RP-DTEO12.1., Inst. Envir. Sc., MtProspect, IL, Mar.1994.
[11] H. Himelblau, J.E. Manning, A.G. Piersol, S.Rubin, “Guidelines for Dynamic EnvironmentalCriteria”. Final Draft, November 1997.
[12] P. Lieberman, “Pyrotechnic Plate Analysis andTest Results”.
[13] J.S. Milne, “General Environmental VerificationSpecification for STS & ELV Payloads, Subsystems,and Components”, NASA Goddard SPace Flight Center,GEVS-SE, Rev. A, June 1996.
[14] CJ Moening,“Pyrotechnic Shock Flight Failures” in[14b] Pyrotechnic Shock, A Tutorial, Institute ofEnvironmental Sciences, 31st ATM, Apr.-May 1985.
[15] D.R. Powers, “Development of a PyrotechnicShock Test Facility”. SVB, N° 44, Part 3 , 1974, pp. 73-82.
[16] D.O. Smallwood, “An Improved RecursiveFormula for Calculating Shock Response Spectra”,Vibration Bull., N° 51, Pt2, pp 211-217, May 1981.
[17] D.O. Smallwood, J.S. Cap, “Salvaging PyrotechnicData with Minor Overloads and Offsets”, Proceedings,Institute of Environmental Sciences, 1998.
[18] J.L. Smith, “Effects of Variables UponPyrotechnically Induced Shock Response Spectra”.NASA Technical Paper 2603, 1986.
[19] C.L. Thomas, “Pyrotechnic Shock SimulationUsing the Response Plate Approach”. Shock andVibration Bulletin, Vol. 43, June 1973, pp 119-126.
[20] V.M. Valentekovich, “Stress Wave Propagation inSteel Plates as Induced by Pyrotechnic Shock”. Proc.64th Shock and Vibration Symposium, pp 92-112(1993).