Embed Size (px)
Citation preview

Today’s webinar will begin in a few moments.
Find information about upcoming

2
Tips for viewing this webinar

3
www.naco.org/webinars
Webinar recording and evaluation survey

4
Question & Answer instructions

Today’s webinar will begin in a few moments.
Find information about upcoming
6
Today’s Speakers
Rick West
Public Works
Director/County
Engineer
Otter Tail County, Minn.
Rosemarie Anderson
Transportation
Specialist, Local and
Rural Roads Manager
Federal Highway
Administration, Office of
Safety
Matthew Enders
Local Programs
Technical Services
Manager
Washington State DOT

Local Road Safety Plan Overview
NACo Saving Lives through Local Road Safety
Planning Webinar
June 30, 2016
Local Road Safety Plans
• Plan
– Strategy
– Blueprint
– Approach
– Design
– Proposal
8

Local Road Safety Plans
• An LRSP is a coordinated plan that provides a
comprehensive framework for reducing highway
fatalities and serious injuries on local roads within a
specific jurisdiction.
• An LRSP is flexible and utilizes the 4 E’s as
appropriate to establish and gain support for an
agency’s local safety goals, objectives, and key
emphasis areas.
9
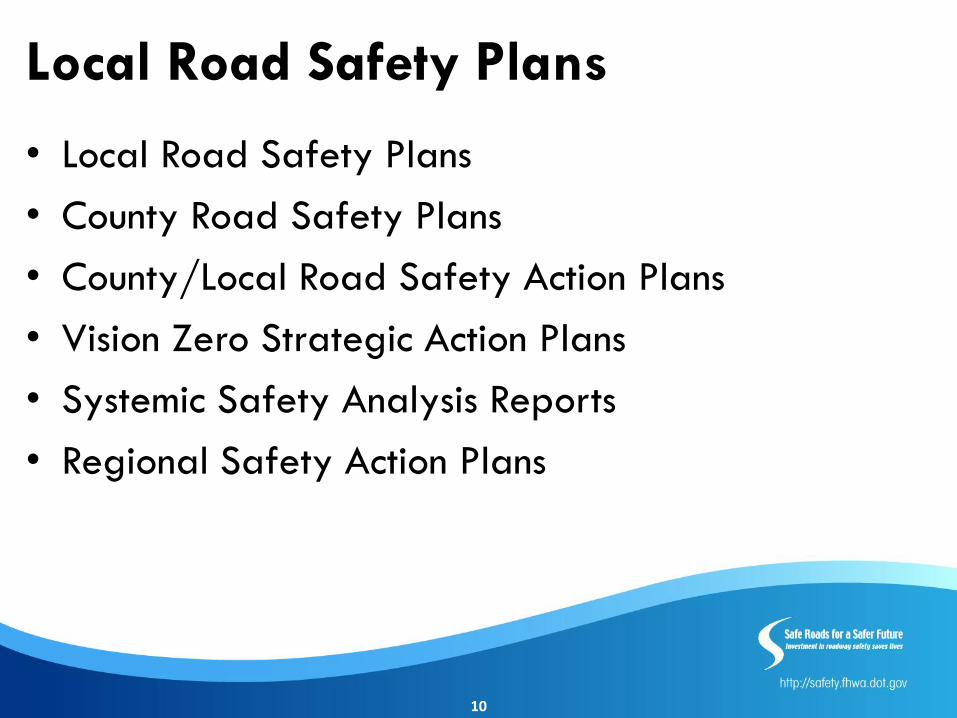
Local Road Safety Plans
• Local Road Safety Plans
• County Road Safety Plans
• County/Local Road Safety Action Plans
• Vision Zero Strategic Action Plans
• Systemic Safety Analysis Reports
• Regional Safety Action Plans
10
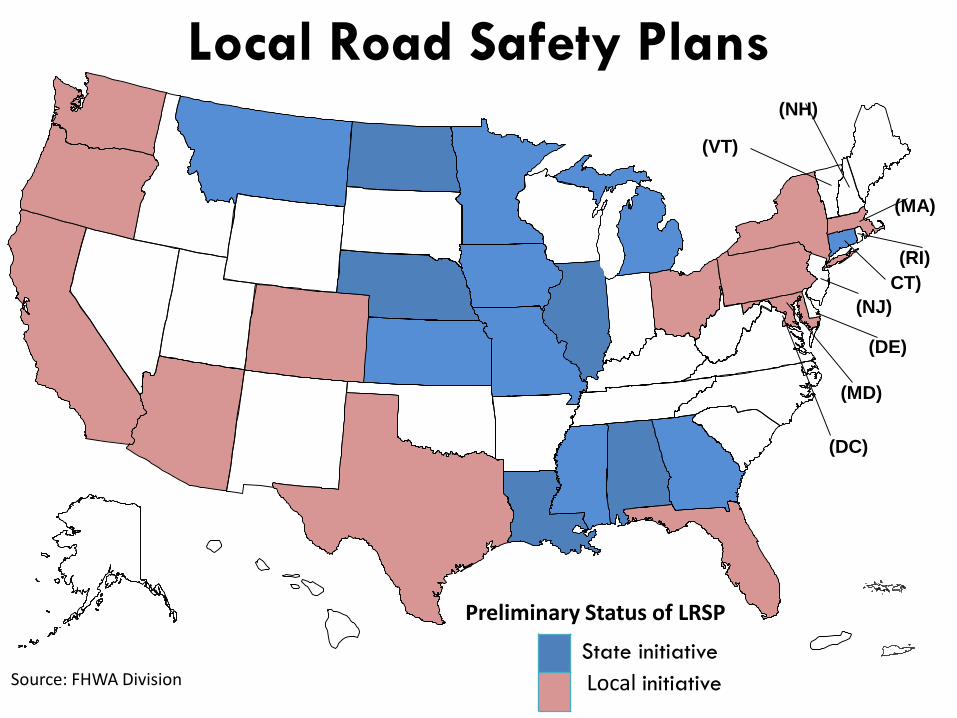
(NH)
(VT)
(MA)
CT)
(RI)
(MD)
(DE)
(NJ)
(DC)
State initiative
Local initiative
Local Road Safety Plans
Preliminary Status of LRSP
Source: FHWA Division

Local Road Safety Plans
State/Regional Initiated Plans
• Larger Documents
• Less Flexibility
• Contractor/MPO/RPO Developed
• Longer development period
• Cost Higher
• HSIP/PL Funds
• More Inclusive – Large Working group – 4 Es
• Funds set aside for implementation
Local Initiated Plans
• Concise Documents
• More Flexible
• Continuous Update
• Local Agency Developed
• Assistance from LTAP or State
• Lower Cost
• Depends on local expertise and knowledge of the area
• State/Local Funds
• Tool to get funds for implementation
12

Local Road Safety PlansWhy develop a LRSP?
Benefits from developing an LRSP may include:
• Safety Awareness
• Establish partnerships
• Collaboration
• Leverage Safety Funds
• Informed Safety Priorities
• Complements the State SHSP
A SHSP can assist local practitioners but a locally-focused
plan(LRSP) is often needed to address the unique conditions on
local and rural roads.
13

Local Road Safety Plans
“I feel I know my most hazardous locations and this generally
confirms it. It also identified a stretch of roadway that is an
issue that I was unaware of. Every day is a learning
experience.”
14

Local Road Safety Plans
• Why Coordinate LRSPs with State SHSP?
15

Local Road Safety Plan
From SHSP Guidance:
Strategic Direction and Coordination
• The SHSP shall:
– Provide strategic direction for:
• other State plans, i.e., HSIP, HSP, CVSP
• local and tribal plans
– Consider the results of other State, regional or
local highway safety planning processes

Local Road Safety Plans
Factors influencing the development and
implementation of LRSP:
• Having a champion
• Developing a clear vision and mission
• Assembling collaborative partners
• Allocating appropriate resources
• Establishing open communication
The Focus is Results!

Local Road Safety Plans
Steps in the LRSP Development Process
• Step 1: Establish Leadership
• Step 2: Analyze the Safety Data
• Step 3: Determine Emphasis Areas
• Step 4: Identify Strategies
• Step 5: Prioritize and Incorporate Strategies
• Step 6: Evaluate and Update the LRSP

Common Issues, Opportunities and Challenges
• Personnel
• Funding
• Limited Data
Local Road Safety Plans

Local Road Safety Plans
• Ultimate Goal – Reducing Fatalities and Serious
Injuries on the Local Road System
– In 2014, 32,675 people died and 2.3 million people
were injured in motor vehicle traffic crashes in the
United States
– Of those fatal crashes…
• 55% occurred on local roads
20

Local Road Safety Plans
21
1.46 1.41 1.39 1.47 1.39
0.88 0.85 0.85 0.86 0.85
0.00
0.50
1.00
1.50
2.00
2009 2010 2011 2012 2013
Local Non-Local National

22

Local Road Safety Plans
From HSIP Guidance:
• HSIP projects must be consistent with SHSP
• Projects must be data-based or supported
• HSIP funds used to – maximize projects with the greatest potential to reduce
fatalities and serious injuries
– Support safety performance targets
– Implement proven effective strategies
• Cost effectiveness of projects to be considered during project selection and prioritization
23
Local Road Safety Plans
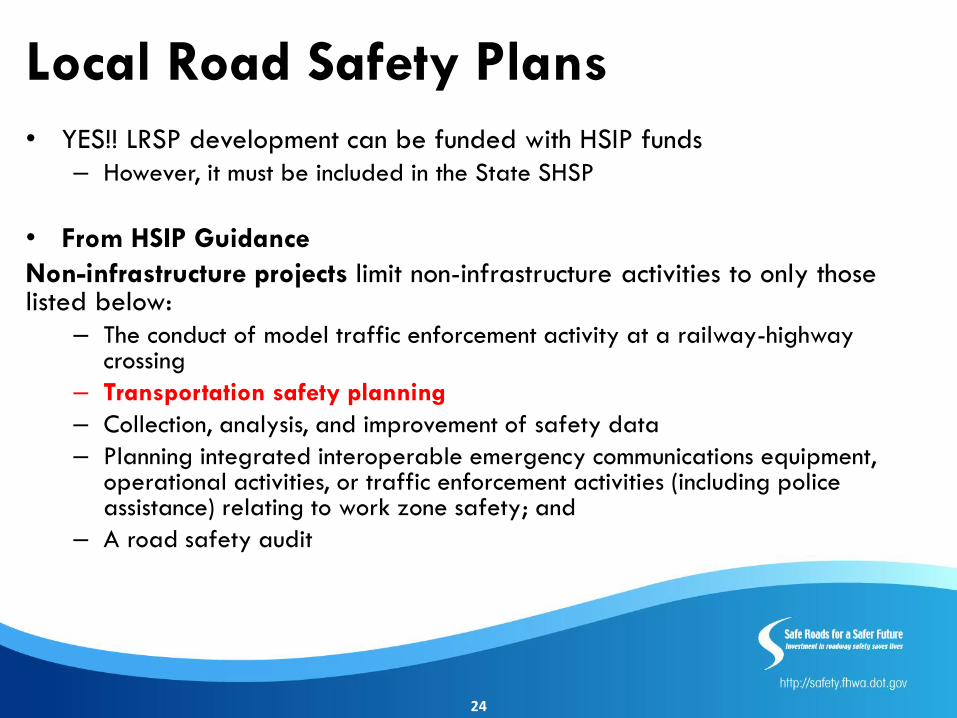
• YES!! LRSP development can be funded with HSIP funds
– However, it must be included in the State SHSP
• From HSIP Guidance
Non-infrastructure projects limit non-infrastructure activities to only those listed below:
– The conduct of model traffic enforcement activity at a railway-highway crossing
– Transportation safety planning
– Collection, analysis, and improvement of safety data
– Planning integrated interoperable emergency communications equipment, operational activities, or traffic enforcement activities (including police assistance) relating to work zone safety; and
– A road safety audit
24

Local Road Safety PlansDeveloping Safety Plans Manual Includes:
• Template for Kickoff Meeting Agenda
• Sample Emphasis Areas
• Emphasis Area Table
• Template for LRSP
• Resources for assistance
http://safety.fhwa.dot.gov/local_rural/training/fhwasa12017/
http://safety.fhwa.dot.gov/local_rural/training/p2p/
Local & Rural Roads Safety Peer
Assistance Program

Local Road Safety PlansExperiences with Development and
Implementation
“Saving Lives thru Local Road Safety Plans”
NACo/FHWA Webinar
2:00 pm EDT, June 30, 2016
Richard (Rick) West, PE
Public Works Director/County Engineer
Otter Tail County, MN

Large rural county in West Central MN
Land Area – 2232 square miles
Population – 58,000
1048 Lakes
Summer Population – 150,000
62 Townships
22 Cities
Otter Tail County, MN

1070 miles of County Highways (all paved)
2427 miles of Township Roads
142 Bridges
One third of County system has 11 foot lanes and 2 foot gravel shoulders.
707 Horizontal Curves
Otter Tail County Highway System
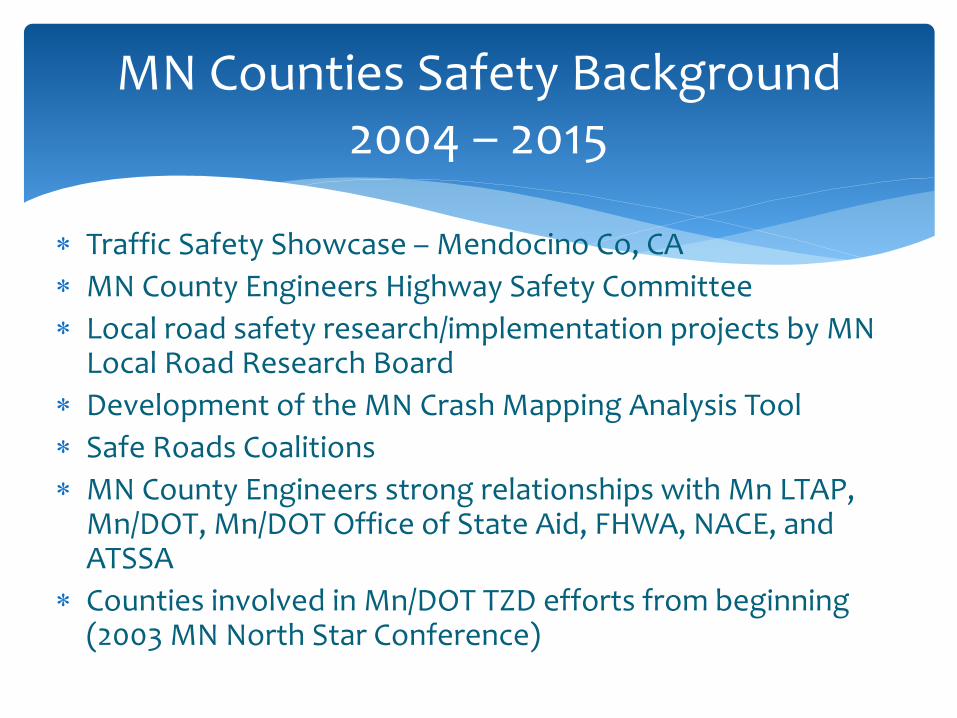
Traffic Safety Showcase – Mendocino Co, CA
MN County Engineers Highway Safety Committee
Local road safety research/implementation projects by MN Local Road Research Board
Development of the MN Crash Mapping Analysis Tool
Safe Roads Coalitions
MN County Engineers strong relationships with Mn LTAP, Mn/DOT, Mn/DOT Office of State Aid, FHWA, NACE, and ATSSA
Counties involved in Mn/DOT TZD efforts from beginning (2003 MN North Star Conference)
MN Counties Safety Background2004 – 2015
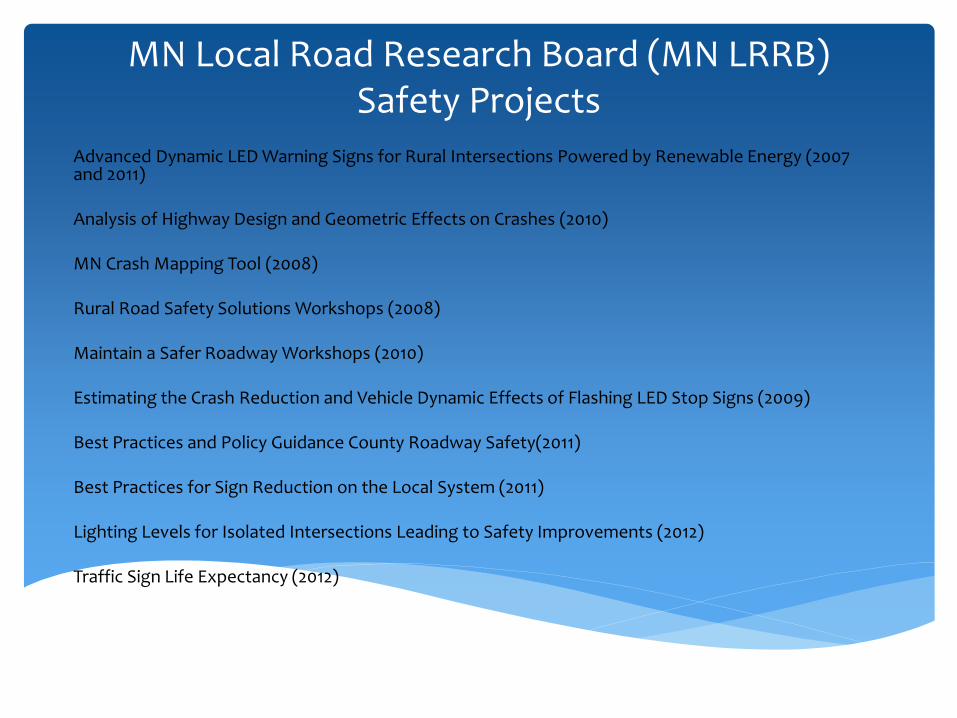
MN Local Road Research Board (MN LRRB) Safety Projects
Advanced Dynamic LED Warning Signs for Rural Intersections Powered by Renewable Energy (2007 and 2011)
Analysis of Highway Design and Geometric Effects on Crashes (2010)
MN Crash Mapping Tool (2008)
Rural Road Safety Solutions Workshops (2008)
Maintain a Safer Roadway Workshops (2010)
Estimating the Crash Reduction and Vehicle Dynamic Effects of Flashing LED Stop Signs (2009)
Best Practices and Policy Guidance County Roadway Safety(2011)
Best Practices for Sign Reduction on the Local System (2011)
Lighting Levels for Isolated Intersections Leading to Safety Improvements (2012)
Traffic Sign Life Expectancy (2012)

In order to assist cities and counties in gaining a better understanding of crash characteristics on their systems, Minnesota Local Road Research Board and Minnesota County Engineers Association (MCEA) have made the MnCMAT tool available
Map–based computer application that provides 10 years of crash data for every roadway in Minnesota
Individual crashes are spatially located by reference point along all roadways
Up to 67 pieces of information are provided for each crash, including route, location (reference point), date/day/time, severity, vehicle actions, crash causation, weather, road characteristics, and driver condition
Analysts can select specific intersections or roadway segments for study. An overview of the entire county, city, MnDOT district or tribal government can also be generated.
Minnesota Crash Mapping Analysis Tool (MnCMAT)

The recommended analytical process for conducting a safety/crash study is to compare Actual conditions at a specific location (intersection or segment of highway) compared to Expectedconditions (based on documenting the average characteristics for a large system of similar facilities).
MnCMAT supports this analytical process by providing both the data for individual locations and for larger systems –individual or multiple counties.
For more information about MnCMAT, consult the website: http://www.dot.state.mn.us/stateaid/sa_crashmapping.html
Minnesota Crash Mapping Analysis Tool (MnCMAT)

Greater Minnesota Crash Data Overview5 Year Crashes
165,739
5,770
State System
76,992 – 46%
2,362 – 41%
CSAH/CR
39,073 – 24%
2,242 – 39%
Rural
24,474 – 63%
1,860 – 83%
Urban
14,599 – 37%
382 – 17%
All Way Stop
438 – 6%
6 – 4%
Run Off Road
8,367 – 66%
790 – 67%
On Curve
3,550 – 42%
399 – 51%
Example
All – %
Severe – %
Right Angle – 1,359 (48%), 41 (59%)
Head On – 70 (3%), 7 (10%)
Left Turn – 283 (10%), 4 (6%)
Rear End – 368 (13%), 4 (6%)
Thru-Stop
2,810 – 38%
70 – 44%
Right Angle – 651 (30%), 20 (56%)
Rear End – 753 (34%), 5 (14%)
Left Turn – 361 (17%), 4 (11%)
Head On – 70 (3%), 2 (6%)
Signalized
2,189 – 29%
36 – 22%
Inters-Related
5,938 – 30%
535 – 30%
Source: MnCMAT Crash Data, 2004-2008
Severe is fatal and serious injury crashes (K+A).
City, Twnshp, Other
49,674 – 30%
1,166 – 20%
Inters-Related
7,448 – 51%
160 – 42%
Not Inters-Related
5,271 – 36%
199 – 52%
Run Off Road – 1,283 (24%), 74 (37%)
Head On – 361 (7%), 27 (14%)
Rear End – 1,315 (25%), 21 (11%)
Right Angle – 529 (10%), 18 (9%)
Animal
4,407 – 18%
74 – 4%
Not Inters-Related
12,627 – 63%
1,185 – 66%
Head On, SS Opp
821 – 7%
129 – 11%
On Curve
284 – 35%
47 – 36%
Unknown/Other
1,880 – 13%
23 – 6%
Unknown/Other
1,502 – 7%
66 – 4%
Other/Unknown
2,011 – 27%
48 – 30%
Right Angle – 968 (35%), 145 (55%)
Run Off Road – 360 (13%), 23 (9%)
Left Turn – 183 (7%), 11 (4%)
Rear End – 287 (11%), 8 (3%)
Thru-Stop
2,735 – 46%
263 – 49%
Run Off Road – 1,047 (38%), 93 (38%)
Right Angle – 297 (11%), 50 (20%)
Head On – 119 (4%), 26 (11%)
Left Turn – 186 (7%), 20 (8%)
Other/Unknown
2,755 – 47%
248 – 46%
Not Animal
20,067 – 82%
1,786 – 96%
All Way Stop
199 – 3%
19 – 4%
Signalized
249 – 4%
5 – 1%
-ATP’s 1, 2, 3, 4, 6, 7, and 8 – NO Metro

MN HSIP Funding Splits – State vs Local
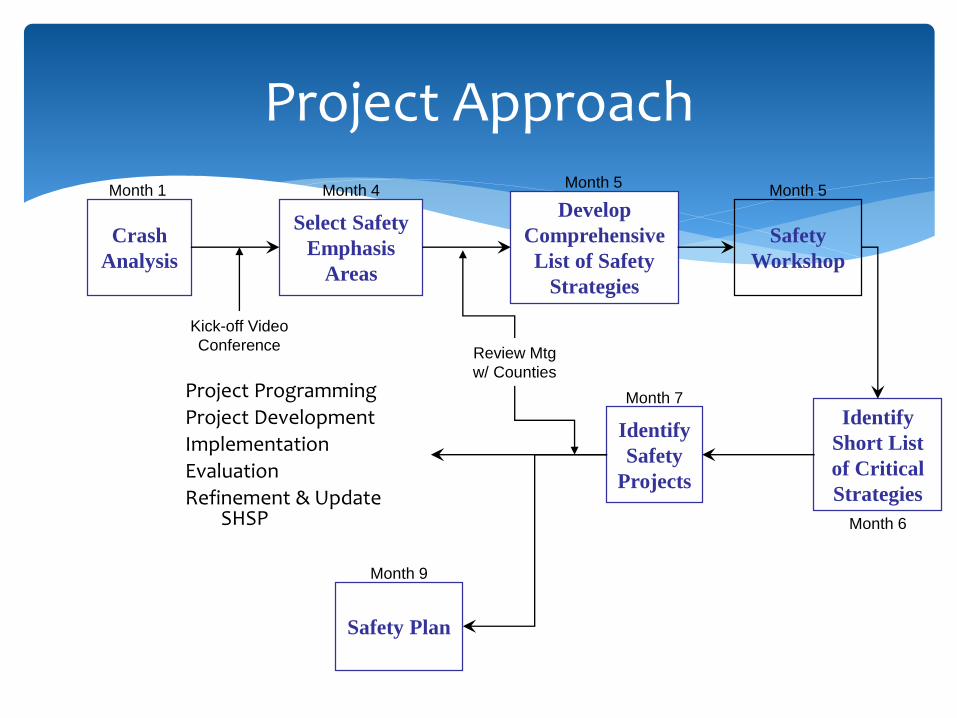
Project Approach
Crash
Analysis
Select Safety
Emphasis
Areas
Identify
Short List
of Critical
Strategies
Identify
Safety
Projects
Safety
Workshop
Develop
Comprehensive
List of Safety
Strategies
Project Programming
Project Development
Implementation
Evaluation
Refinement & Update SHSP
Safety Plan
Month 1 Month 5Month 5
Month 4
Month 7
Month 9
Month 6
Review Mtg
w/ Counties
Kick-off Video
Conference

Plan Contents
Description of Safety Emphasis Areas.
Identification of high priority, low cost Safety
Strategies.
Documentation of at-risk locations on roadway
segments, horizontal curves, and intersections
based on crash data.
Development of $7,200,000. of suggested safety
projects.
Cost of plan development - $40,000.

“Local Road Safety Plans provide practitioners with a detailed, data
based, prioritized, county-wide safety plan to guide and support
future safety investments.”
Rick West, Otter Tail County Public Works Director/County Engineer

Risk Factors
Intersections (244)
Geometry – Inter. Skew Geometry – Roadway (on or
near curve) Commercial Development in
Quadrants Distance to Previous STOP ADT Ratio R/R Crossing on Min. Appr. Crash History
Curves (707)
Curve Radius
Traffic Volumes
Intersection in Curve
Visual Trap
Crash Experience

Risk Factors
Segments
ADT Range
Access Density
Road Departure Density
Critical Radius Curve Density
Edge Risk (Shoulder width/inslope/clear zone)

Summary of Results from Prioritized Segments
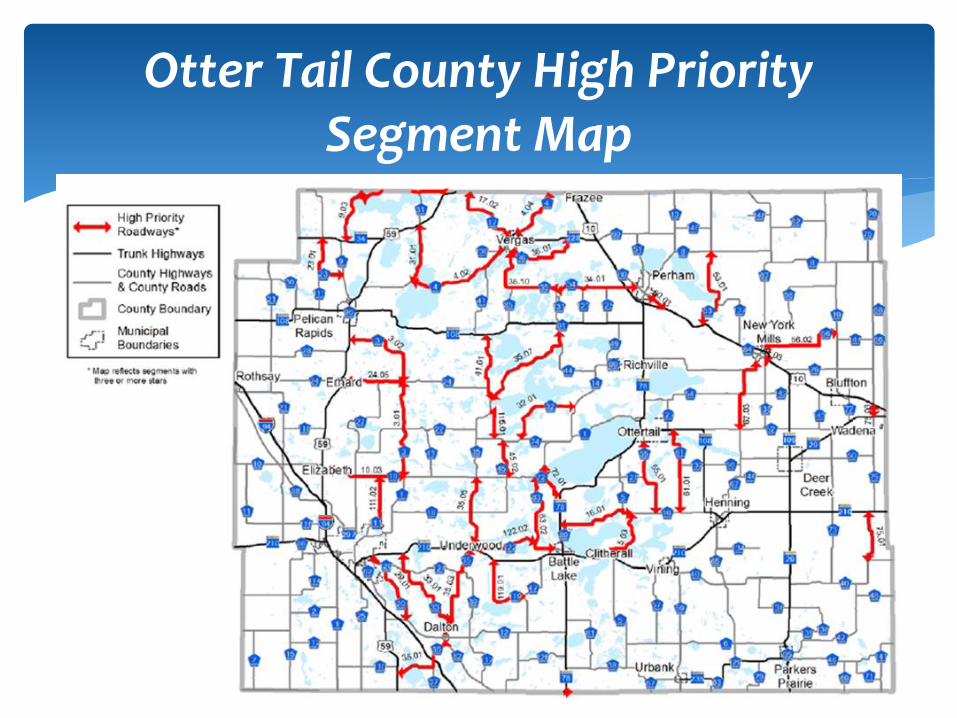
Otter Tail County High Priority Segment Map

Otter Tail County Segment Project Summary


Sample Segment
Project Form

Safety Strategy Location/Quantity Cost
Lane Marking and Curve Enhancements Joint contract with 12 counties to install 1,670 miles of 6-inch
edge lines, 46 miles of Rumble StripEs and 2,267 chevron
signs (distributed among 325 horizontal curves)
$1,600,000
Intersection Lighting Joint contract with six counties to install overhead street
lighting at 30 intersections
$360,000
Intersection Signs and Marking Upgrade Install/upgrade TH junction signs, stop ahead markings and
stop bars at 91 Intersections (Otter Tail County Only)
$158,000
CSAH Shoulder Paving/Rumble StripEs Install 5.3 miles of four-foot paved shoulder with a one-foot
rumble and a six-inch stripe imbedded within the rumble
(Otter Tail County Only)
$293,000
Total Funding $2,411,000
Examples of HSIP Projects 2009 - 2011

2014 HSIP Projects
Priority Focus Area Locations Cost Federal Local Work Type
1 Lane Departure 13 $348,580.00 $313,722.00 $34,858.00 Enhanced Edge Line Markings - Phase I
2 Lane Departure 19 $349,835.00 $314,851.50 $34,983.50 Enhanced Edge Line Markings - Phase II
3 Intersection Improvements 44 $104,750.00 $94,275.00 $10,475.00 Enhaned Signage and Marking
4 Lane Departure 25 $82,500.00 $74,250.00 $8,250.00 Chevron Installation on Curves
5 Lane Departure 42 $283,052.00 $254,746.80 $28,305.20 Shoulder Paving and Rumble Strips on Curves - Phase IA
6 Lane Departure 59 $344,064.00 $309,657.60 $34,406.40 Shoulder Paving and Rumble Strips on Curves - Phase IB
7 Intersection Improvements 21 $203,000.00 $182,700.00 $20,300.00 Lighting
8 Lane Departure 78 $332,450.00 $299,205.00 $33,245.00 Shoulder Paving and Rumble Strips on Curves - Phase IIA
9 Lane Departure 48 $322,065.00 $289,858.50 $32,206.50 Shoulder Paving and Rumble Strips on Curves - Phase IIB
10 Lane Departure 42 $264,964.00 $238,467.60 $26,496.40 Shoulder Paving and Rumble Strips on Curves - Phase IIC
11 Lane Departure 50 $314,661.00 $283,194.90 $31,466.10 Shoulder Paving and Rumble Strips on Curves - Phase IID
441 $2,949,921.00 $2,654,928.90 $294,992.10
Otter Tail County Projects - Summary
HSIP 2014 - 2016
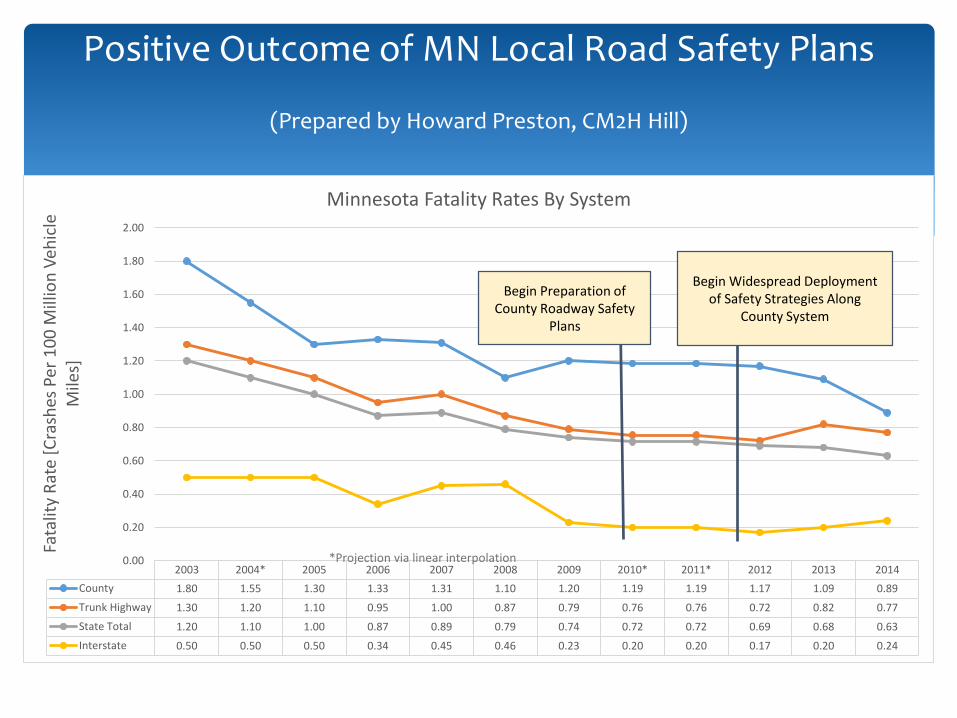
Positive Outcome of MN Local Road Safety Plans
(Prepared by Howard Preston, CM2H Hill)
2003 2004* 2005 2006 2007 2008 2009 2010* 2011* 2012 2013 2014
County 1.80 1.55 1.30 1.33 1.31 1.10 1.20 1.19 1.19 1.17 1.09 0.89
Trunk Highway 1.30 1.20 1.10 0.95 1.00 0.87 0.79 0.76 0.76 0.72 0.82 0.77
State Total 1.20 1.10 1.00 0.87 0.89 0.79 0.74 0.72 0.72 0.69 0.68 0.63
Interstate 0.50 0.50 0.50 0.34 0.45 0.46 0.23 0.20 0.20 0.17 0.20 0.24
0.00
0.20
0.40
0.60
0.80
1.00
1.20
1.40
1.60
1.80
2.00
Fata
lity
Rat
e [C
rash
es P
er 1
00
Mill
ion
Veh
icle
M
iles]
Minnesota Fatality Rates By System
Begin Preparation of County Roadway Safety
Plans
Begin Widespread Deployment of Safety Strategies Along
County System
*Projection via linear interpolation

6 inch edge line installed on entire system.
Increased resources for annual sign replacements and annual pavement marking contract.
Safety Edge on all paving projects.
Paving of shoulders (inside and outside) with rumble stripes/strips on all curves on surfacing projects.
Increased resources for brushing/clearing sight lines.
Increased resources for gravel shoulder maintenance.
Highway Safety Culture Change in Otter Tail County

Provides information to educate the County Board and the public.
Provides data sheets for HSIP funding applications.
Provides practitioners with a detailed, prioritized county-wide, safety plan to guide and support future safety investments.
The benefits far out weigh the challenges.
Caused a highway safety culture change in Otter Tail County.
Summary

County Board is very supportive of safety program.
Federal, State and local Highway Safety Champions are very important to the successful development and implementation of the plan.
The need for public outreach and education cannot be overstated.
MN Local Road Safety Plans – Phase 2 is in the development stage.
Summary

“There is no silver bullet in reference to highway safety. It is about doing many small things to the best of our abilities and doing
them consistently.”
Quote from the MN County Engineers who attended the 2004 FHWA Safety Showcase in Mendocino Co., CA

Thank youRichard WestOtter Tail County Public Works Director/County Engineer
Phone: 218-998-8473
Email: [email protected]
Address: 505 S. Court St., Suite 1
Fergus Falls, MN 56537

Matthew Enders, P.E.Washington State DOT
Local Programs DivisionJune 30, 2016

Funding split with state DOT Data driven, using fatalities &
serious injuries
Based on priority 1 infrastructure emphasis areas in the SHSP (run-off-the-road, intersections)
70% local, 30% state
Funding split of 70% for local agencies Based on same data-driven
process as state/local
State30%
County30%
City40%

Projects must address fatal/serious crashes in a risk-based, low-cost & widespread approach
• $4.8 million, run-off-road focus
• Top 10 counties for fatal/serious per mile & per MVM traveled
• Varied funding levels based on fatal/serious crashes per mile
2009 HRRRP
• $45.7 million, run-off-road & intersection focus
• All 39 counties
• Varied funding levels based on fatal/serious crashes per mile
2010 County Safety

0
200
400
600
800
1000
1200
2008 2009 2010 2011 2012 2013 2014 2015
Fatal/Serious Crashes
State
County
City
Misc

$26.5 million
All 39 counties eligible
Varied funding levels based on fatal/serious crash frequency
Risk-based, low-cost & widespread approach
Must develop a local road safety plan

To assist counties in determining safety priorities
Crash types, locations, countermeasures
To create a more sustainable safety program
To better advocate for county projects
46% of counties said they previously had a data driven safety plan

Share LRSP Requirements
Data driven, ID key factors, prioritize network, ID countermeasures, prioritize projects
No new data collection
Share Resources
Summary/comparison data, workshops, Systemic Safety Project Selection Tool (FHWA) & training, technical assistance
Connect to HSIP Funds
92% of counties said workshops were helpful for developing a LRSP

2008-2012 %2008-
2012%
2008-
2012% 2012 2011 2010 2009 2008 2008-2012 %
2008-
2012%
2008-
2012% 2012 2011 2010 2009 2008
Overall Numbers
Total # of Collisions 12,447 3,246 39 9 2 12 7 9 513,944 70,278 932 173 173 181 208 197
# of Fatal Collisions 2,190 17.6% 682 21.0% 9 23.1% 1 1 3 3 1 2,190 0.4% 682 1.0% 9 1.0% 1 1 3 3 1
# of Serious Injury Collisions 10,257 82.4% 2,564 79.0% 30 76.9% 8 1 9 4 8 10,257 2.0% 2,564 3.6% 30 3.2% 8 1 9 4 8
# of Alcohol-Related Collisions 3,268 26.3% 1,078 33.2% 17 43.6% 6 0 5 4 2 38,860 7.6% 8,700 12.4% 165 17.7% 32 32 35 40 26
Total # of Fatalities 2,375 732 9 1 1 3 3 1 2,375 732 9 1 1 3 3 1
Total # of Injuries 17,770 4,503 54 12 1 13 11 17 235,108 35,239 478 83 90 109 106 90
By Collision Type
Hit Fixed Object 3,439 27.6% 1,340 41.3% 24 61.5% 6 1 7 3 7 99,255 19.3% 28,374 40.4% 588 63.1% 114 120 113 129 112
Overturn 1,281 10.3% 424 13.1% 3 7.7% 0 0 1 2 0 14,764 2.9% 4,893 7.0% 63 6.8% 10 9 12 18 14
Angle (T) 1,369 11.0% 324 10.0% 3 7.7% 1 0 1 0 1 79,814 15.5% 9,440 13.4% 60 6.4% 12 11 12 12 13
Hit Pedestrian 1,667 13.4% 208 6.4% 3 7.7% 1 1 1 0 0 8,927 1.7% 740 1.1% 9 1.0% 1 3 2 2 1
Head On 642 5.2% 182 5.6% 2 5.1% 0 0 0 1 1 2,896 0.6% 858 1.2% 14 1.5% 1 1 3 4 5
By Roadway Surface
Dry 9,085 73.0% 2,372 73.1% 29 74.4% 7 2 10 3 7 333,394 64.9% 43,160 61.4% 528 56.7% 96 91 110 132 99
Wet 2,644 21.2% 655 20.2% 9 23.1% 2 0 2 3 2 135,756 26.4% 17,955 25.5% 261 28.0% 57 51 60 41 52
By Light Condition
Daylight 7,169 57.6% 1,753 54.0% 24 61.5% 5 1 9 4 5 334,748 65.1% 40,604 57.8% 522 56.0% 91 94 101 119 117
Dark - No Street Lights 2,014 16.2% 941 29.0% 11 28.2% 3 1 2 1 4 43,360 8.4% 15,673 22.3% 292 31.3% 66 56 56 60 54
By Junction Relationship
Non-Intersection (Not Related) 6,705 53.9% 2,117 65.2% 31 79.5% 7 2 11 4 7 230,934 44.9% 38,222 54.4% 670 71.9% 130 133 133 146 128
Intersection-Related 4,107 33.0% 711 21.9% 3 7.7% 1 0 0 1 1 207,667 40.4% 22,056 31.4% 117 12.6% 29 16 18 21 33
By Roadway Curvature
Horizontal Curve 3,353 26.9% 1,282 39.5% 24 61.5% 4 1 9 4 6 77,321 15.0% 19,729 28.1% 489 52.5% 89 96 90 118 96
Straight & Level 6,588 52.9% 1,397 43.0% 8 20.5% 4 1 1 1 1 322,235 62.7% 36,635 52.1% 250 26.8% 45 42 53 50 60
Straight & Grade 2,165 17.4% 441 13.6% 6 15.4% 1 0 2 1 2 95,899 18.7% 10,665 15.2% 140 15.0% 25 29 23 29 34
Vertical Curve 352 2.8% 132 4.1% 3 7.7% 1 0 1 1 0 10,912 2.1% 2,655 3.8% 61 6.5% 13 9 15 17 7
Hit Fixed Object Crashes Only - By Fixed Object Hit
Tree / Stump (Stationary) 642 18.7% 334 24.9% 6 25.0% 2 0 1 3 0 9,828 9.9% 3,779 13.3% 61 10.4% 9 19 13 16 4
Ran Over Embankment 299 8.7% 136 10.1% 3 12.5% 1 0 2 0 0 4,085 4.1% 1,948 6.9% 66 11.2% 12 11 17 16 10
Earth Bank 249 7.2% 103 7.7% 3 12.5% 0 0 1 0 2 5,398 5.4% 2,160 7.6% 64 10.9% 10 12 11 15 16
Fence 214 6.2% 105 7.8% 3 12.5% 1 0 0 0 2 8,003 8.1% 3,146 11.1% 51 8.7% 8 6 12 11 14
By Contributing Circumstance
Exceeding Safe / Stated Speed 3,682 20.6% 1,236 25.5% 22 33.8% 3 0 7 5 7 117,420 18.7% 20,090 22.4% 307 25.7% 51 45 57 74 80
Under Influence of Alcohol / Drugs 3,178 17.7% 1,016 20.9% 13 20.0% 6 0 3 3 1 36,519 5.8% 7,936 8.9% 145 12.2% 25 29 32 35 24
Over Centerline 1,606 9.0% 619 12.8% 6 9.2% 2 0 4 0 0 21,156 3.4% 8,292 9.3% 146 12.2% 36 45 47 9 9
Operating Defective Equipment 382 2.1% 101 2.1% 5 7.7% 0 0 0 1 4 13,110 2.1% 2,239 2.5% 48 4.0% 11 9 9 7 12
Inattention / Distraction 1,587 8.9% 402 8.3% 4 6.2% 0 0 2 0 2 86,025 13.7% 12,716 14.2% 171 14.3% 28 37 31 42 33
Improper Passing 272 1.5% 93 1.9% 4 6.2% 2 0 0 1 1 5,991 1.0% 1,492 1.7% 17 1.4% 6 2 2 4 3
By Vehicle Type
Passenger Car 8,235 43.0% 1,797 40.1% 18 38.3% 4 0 6 5 3 499,063 52.7% 53,374 49.4% 551 46.0% 101 108 106 120 116
Light Truck / SUV 7,126 37.2% 1,735 38.7% 13 27.7% 5 2 2 2 2 372,041 39.3% 46,614 43.2% 537 44.8% 96 101 98 122 120
Motorcycle 2,459 12.8% 703 15.7% 12 25.5% 2 0 5 1 4 11,819 1.2% 2,320 2.1% 40 3.3% 8 2 10 9 11
By Speed Limit
25 MPH 2,137 12.3% 369 8.8% 6 13.6% 1 1 1 2 1 135,462 16.8% 11,933 12.2% 156 14.5% 25 36 40 29 26
30 MPH 2,192 12.6% 136 3.2% 4 9.1% 1 0 0 0 3 142,121 17.6% 4,875 5.0% 37 3.4% 6 5 4 12 10
35 MPH 4,350 25.1% 1,519 36.3% 21 47.7% 6 1 9 2 3 224,655 27.8% 42,732 43.7% 679 63.2% 133 132 128 145 141
40 MPH 1,312 7.6% 474 11.3% 8 18.2% 2 0 1 3 2 49,421 6.1% 10,122 10.4% 141 13.1% 23 12 22 38 46
45 MPH 1,063 6.1% 444 10.6% 1 2.3% 1 0 0 0 0 34,008 4.2% 8,328 8.5% 17 1.6% 9 5 0 3 0
50 MPH 1,944 11.2% 1,057 25.2% 4 9.1% 0 0 1 1 2 40,596 5.0% 16,905 17.3% 38 3.5% 4 6 11 7 10
Cowlitz County All Public Roads Cowlitz County2008-2012 Cowlitz
County Data
Fatal/Serious Injury Crashes Only Total Crashes
All Counties All CountiesAll Public Roads

Shared Resources
• Summary Data
• Systemic Safety Project Selection Tool
• State SHSP
• FHWA Systemic Safety website/resources
•CMF Clearinghouse
Most Commonly Used Resources (Survey)
• Summary Data
• Road Log Data
• Systemic Safety Project Selection Tool
•Crash Rates
• State SHSP

31 of 39 counties completed a LRSPTotal $515,000 $775,000 $1,222,990 $1,904,165 $883,640 $2,895,000 $1,032,200 $2,904,588 $1,394,000
Priori ty 1
Shoulders , s lopes ,
clear zone, guardra i l Safety Plan Shoulders , s lopes Guardra i l , s lopes
Data
col lection Guardra i l
Truck ramp,
s igning Signing Slopes , shoulders
Funding $315,000 $200,000 $270,000 $553,723 $102,500 $570,000 $544,200 $37,927 $300,850
100% Yes No Yes Yes Yes Yes Yes Yes Yes
Priori ty 2 Data col lection
Curve
Improvements Guardra i l
Guardra i l , shoulders ,
fixed objects
Data
col lection Guardra i l Guardra i l , s igning Signing Slopes , shoulders
Funding $200,000 $575,000 $188,990 $1,350,442 $30,000 $120,000 $292,700 $30,705 $104,500
100% Yes No Yes Yes Yes Yes Yes Yes Yes
Priori ty 3 CLRS Guardra i l Guardra i l
Guardra i l , s igning,
s ight dis tance Signing Slopes , shoulders
Funding $35,000 $139,490 $590,000 $52,700 $69,897 $60,000
100% Yes Yes Yes Yes Yes Yes
Priori ty 4 Radar Speed Signs Bridge ra i l Guardra i l Guardra i l , s igning Signing Slopes , shoulders
Funding $50,000 $170,250 $530,000 $142,600 $73,318 $337,700
100% Yes Yes Yes Yes Yes Yes
Priori ty 5 Guardra i l Bridge ra i l Del ineation HFST Data col lection
Funding $359,000 $107,750 $260,000 $74,326 $15,000
100% Yes Yes Yes Yes Yes
Priori ty 6 Shoulders , s lopes , a l ignment Bridge ra i l Signing Signing Guardra i l
Funding $320,000 $124,250 $110,000 $51,201 $475,200
100% Yes Yes Yes Yes Yes
Priori ty 7 Bridge ra i l Guardra i l HFST Guardra i l
Funding $84,000 $275,000 $60,876 $90,750
100% Yes Yes Yes Yes
Priori ty 8 Bridge ra i l Intersection reconstruct Guardra i l Data col lection
Funding $79,000 $355,000 $1,051,337 $10,000
100% Yes Yes Yes Yes
Priori ty 9 Bridge ra i l Intersection grade/al ignment HFST
Funding $46,400 $85,000 $233,074
100% Yes Yes Yes
Priori ty 10 Guardra i l
Funding $726,818
100% Yes
Priori ty 11 HFST
Funding $460,109
100% Yes
Priori ty 12 Data col lection
Funding $35,000
100% Yes
100% of counties said this effort was useful for identifying safety priorities
(38% very useful, 62% somewhat useful)

4
6
6
10
12
14
14
18
18
19
20
Vertical Curves
Surface Type
Embankment Slope
Fixed Objects/Clear Zone
Pavement/Lane Width
Functional Class
Shoulder Width
Speed Limit
Horizontal Curves
ADT
Crashes/Severity/Rate
Avg. = 6 Risk Factors
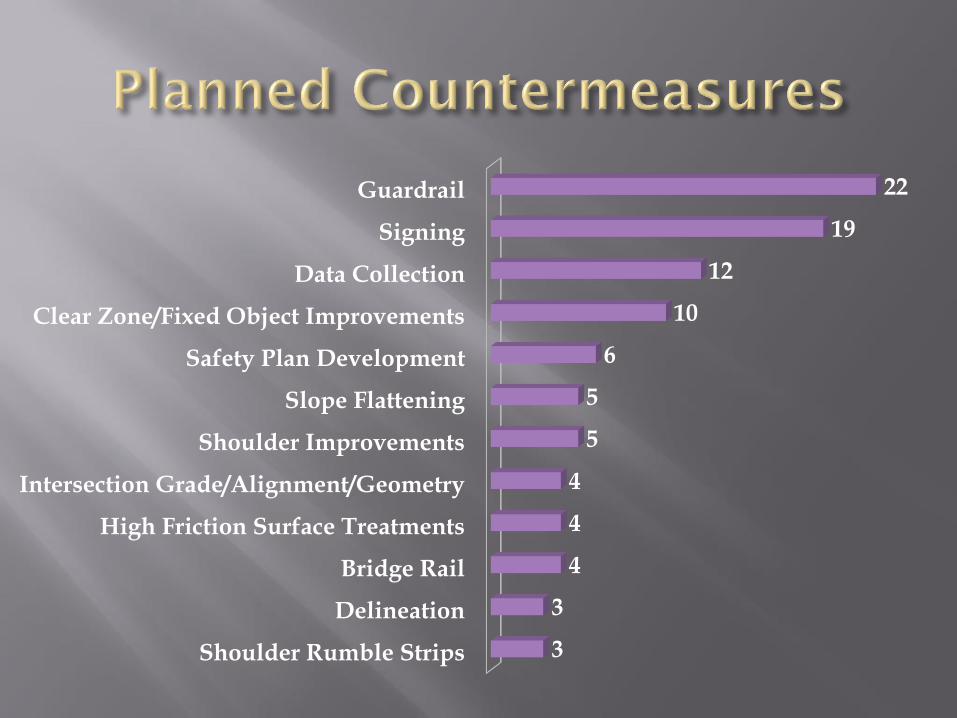
Shoulder Rumble Strips
Delineation
Bridge Rail
High Friction Surface Treatments
Intersection Grade/Alignment/Geometry
Shoulder Improvements
Slope Flattening
Safety Plan Development
Clear Zone/Fixed Object Improvements
Data Collection
Signing
Guardrail
3
3
4
4
4
5
5
6
10
12
19
22

Easy to use prioritized list of projects
Allowed for selection of both county priorities and HSIP priorities (maximize benefits)
Will repeat process with counties
Counties may use/build on existing plans
Will provide an example LRSP
Will update/expand summary/comparison data
100% of counties would submit again if a LRSP was required

69
Question & Answer session

70
Transportation Safety Webinars
www.naco.org/webinars