Embed Size (px)
Citation preview

9THE TO'AGA CERAMICS
T. L. HUNT AND C. L. ERKELENS
CsAmi HAvE PLAYED a ciitical role in under-stdig prehistory in Samoa and West
Polynesia. They are usually well peserved,archaeologically visible, and carry a large amount ofinfoimation on variation in style (temporal andspatial), technology, function, and raw material.While ceramics have proven useful for makingculture-iistorical inferences about Samoa and theregion, ftey also present several interesting problemsto be resolved in theirown righlt First, what is thenature of ceramic variability (temporal and spatial)in Samoa? Second, what kinds ofchange (stylistic,techoogicalimaterial, and functional) occuned overthe duation ofceramic prodution in Samoa? Andthird, why did ceramics disapear in Samoa after anappoximate thousand-year sequence ofproduction?In this chapter we describe the ceramic assemblagefrom the To'aga excavations and begin to addresshese questions through analyses ofceramic claycomposition, technology, function, and style.
THE ASSEMBLAGE
The 1986 excavations on Ofu and neighboringTa'u produced a total of 147 sherds (32 sherds fromTo'aga), and were analyzed and reported in Hunt andKirch (1988:169-71). [be 1987 field season added1464 sherds to the To'aga assemblage. These sherdswere described by Kirch et al. (1990:7-8) and arefurther analyzed here. Excavations in 1989 providedan additional 938 sherds to the previous total. In
sum, hre seasons of fieldwoik atTo'aga (AS-13-1)have yielded a total ceramic assemblage of 2434sherds.
The To'aga ceramic assemblage is significant inseveral respects. The sherds come from a deep,well-stratified site dated with several radiocarbondeterminatons (see chapters 5 and 6). The assem-blage spans the full duration known for ceramicproduction in Samoa, and consists of quantities ofthe pottery distinguished as "Ihickware" and"'thinware" (see Green 1974; Holmer 1980, Clarkand Herdrich 1988). Pottery from To'aga, Samoa'seastemnmost ceramic-bearing site, dates to the firtmillennium B.C. Finally, the To'aga assemblage isamong the largest excavated in Samoa-only theSU-SA-3 (Green 1974) assemblage from Vpolu islarger-and thus provides an adequate sample toassess several dimensions of variability.
The entire ceramic assemblage has been cata-loged, with individual sherds enumerated. In themost general terms, the assemblage can be dividedinto broad classes ofthickware and thinware sherds.This division ofwares is based on sherd thickness,temper size, and paste texture. Such distinctions arequalitative (and somewhat impresionistic), how-ever, and do not accurately reflect the range ofvariability present in the assemblage,-hence theneed for detailed analysis. Vessel parts include onlydirect rims (no necks) and body serds, indicative ofa single class ofvessel forms comprising open,round-based bowls. While occurring in only minor

124 The Tolaga Site
frupencies, classes ofdecoration include red-slipped, carved paddle-imprsed, incised, and rmsherds with notched, impesd, or crenelated lips.Frequencies of sherds by these broad classes instratigraphc context are sunmarized in tables 9.1-2.
Detailed analysis ofceramics is extremely laborintesive. Observations and measurements onindividual sherds can require as much as five to tenminutes eacL This problem requires selecting arepresentative sample from the larger assemblage.In the case ofTo'aga, we chose excavation units withlargersamples. Also, pottery was selected fromexcavation units to span the full temporal sequencerepresented at To'aga. This stagy enabled us toassess change across the fu sequence of potterymanufacture atToaga.
Sherd samples were drawn from the main arealexcavation of 1987 (units 1 and 4-9, see Kirch et al.1990 and chapters) and from units 27 and 28excavated in 1990. The total sample selected forintensive analysis is 737 sherds.
The main areal excavation of 1987 (units l and4-9) contained a large number of sherds (n=527)within a well-dated, statified context The primaryceramic-bearing occupation layers are dated (Beta-25033, 25034) to an averaged coneted range of306-138 B.C. at one stard deviation (see chapter 6and Kirch et al. 1990). Units 27 and 28, excavatedin 1989, were selected because they provided largesamples from early contexts (see chapters 5 and 6).
Based on radiocarbon dates and statigraphiccorrelations, the sheris for intensive analysis can bedivided into early, middle, and late periods forcomparative prposes. The early ceramics, fromlayer III in units 1, 5-7, 9, and 28, range fromapproximately 1250-500 B.C. Middle period ceram-ics, from layer I (B andC) in units 1,4-7, 9, 27, and28, range from about 500 B.C. to the beginning of theChuistian era. The late period sample, from layer II(A) in units 4-9 and 27, dates from the time of Christand may span the first 200-300 years A.D. These arenot "ceramic periods" or "hases," but simplyrepresen a three-pan division devised to analyzechange in the sample.
Thepol for intensive analysis was designedto assess variability in raw materials, technology,style, and fuction. In addition to recoding prove-nience (by unit, stratum, and level) and catalognumber for each sherd, the following analytic
protocol was used and observations or measurementscoded for analysis (using SPSS- PC+; Nonrsis1986):1) Exterior surface Etment:
0. eroded ("missing data")1. plain (untextred)2. wiped (striations present)3. puddled4. slipped5. carved paddle impressed6. residue obscuring ("missing data")
2) terior surface Ltatment:(same criteria as above)
3) Orientation ofinclusions ("preference') relative tovessel walls:1. indeterminate (i.e. no definitive long axis togais)
2. random orientation3. paalel4. perpendicular
4) Interior anvil casts:0. indeterminate ("missing data")1. present2. absent
5) Exterior paddle marks casts:0. indeterminate ("missing data")1. present2. absent
6) Exterior hardness (Mohs scale)7) Interior hardness (Mohs scale)8) Exterior surface color (Munsell):
0. erded ("missing data")1. 75R (& value & chroma for all modes)2. SR 6. 7.5YR3. IOR 7. 10YR4.2.5YR 8.2.5Y5.5YR 9.5Y
9) Interior surface color (Munsell):(recorded same as above)
10) Oxidation/reduction pattern (using patterntemplate)
11) Organic residue:0. absent1. interior2. exterior3. both surfaces
12) Weight of sherd (grams)
Ceramics 125
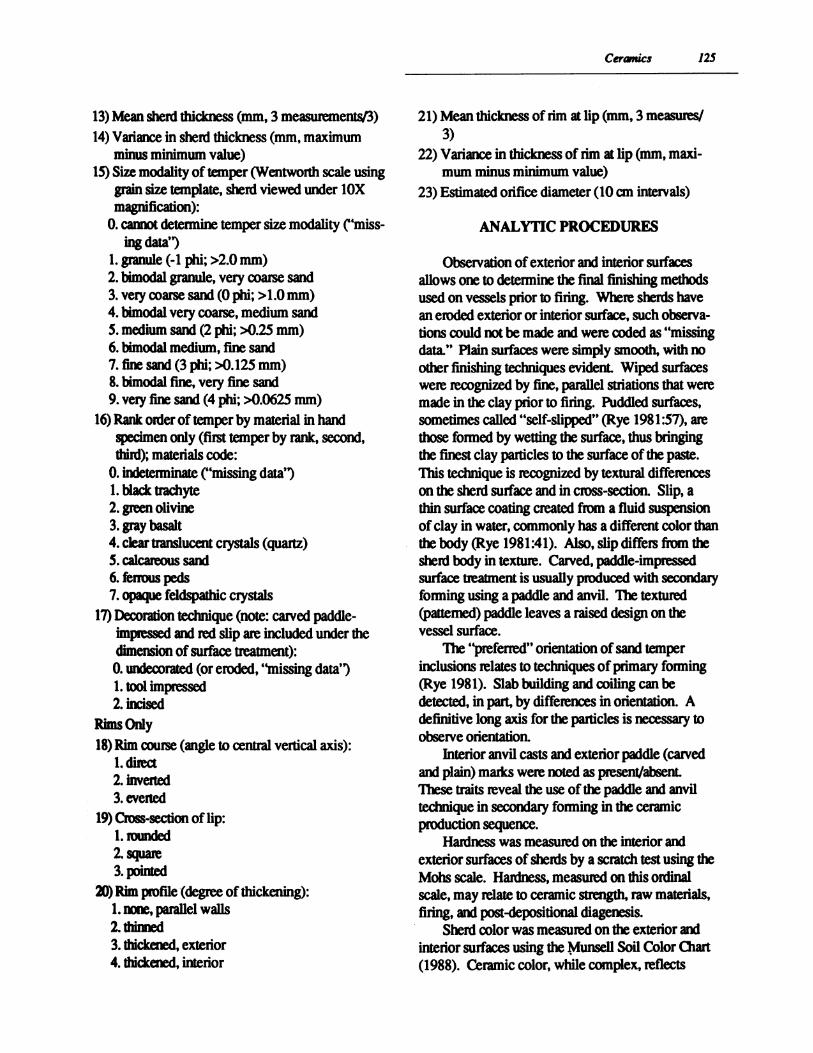
13) Mean sherd thickness (mm, 3 measuements/3)14) Variance in sherd thickness (mm, maximum
minus minimum value)15) Size modality of temper (Wentworth scale using
grain size template, sherd viewed under lOXmagnification):
0. canrKot determine temper size modality ("miss-ing data")
1. granule (-1 phi; >2.0 mm)2. bimodal granule, very coase sand3. very coae sand (0 phi; >1.0mm)4. bimodal very coarse, medium sand5. medium sand (2 phi; >0.25 mm)6. bimodal medium, fine sand7. fine sand (3 phi; >0.125 mm)8. bimodal fine, very fine sand9. very fine sand (4 phi; >0.0625 mm)
16) Rank order of temper by material in handspecimen only (fist temper by rank, second,tIrd); materials code:
0. indeterminate ("missing data")1. black tachyte2. green olivine3. gray basalt4. clear tanslucent crystals (quartz)5. calcaous sand6. ferous peds7. opaque feldspathic crystals
17) Decoration technique (note: carved paddle-impressed and red slip are included under thedimension of surface treatment):0. undecorated (or eroded, "'missing data")1. tool impressed2. incised
Rims Only18) Rim course (angle to central vertical axis):
1.direc2. inverted3. evented
19) Cross-section of lip:1.onded2. square3. poned
>2) Rim profile (degree of thickening):1. noe, parallel walls2.tined3. thickened, exterior4. thiickted,inteior
21) Mean thickness of rim at lip (mm, 3 measures/3)
22) Variance in thickness of rim at lip (mm, maxi-mum minus minimum value)
23) Estimated orifice diameter (10 cm intervals)
ANALYTIC PROCEDURES
Observation of exterior and interior surfacesallows one to determine the final finishing metxhdsused on vessels prior to firing. Where sherds havean eroded exterior or interior surface, such observa-tions could not be made and were coded as "missingdata." Plain surfaces were simply smooth, with noother finishing techniques evident. Wiped surfaceswere recognized by fine, parallel striations that weremade in the clay pror to firing. Puddled surfaces,sometimes called "self-slipped" (Rye 1981:57), arethose formed by wetting the surface, thus bringingthe finest clay particles to the surface ofthe paste.This technique is recognized by textural differenceson the sherd surface and in cross-section. Slip, athin surface coating created from a fluid suspensionof clay in water, commonly has a different color thanthe body (Rye 1981:41). Also, slip diffesfromthesherd body in texture. Carved, paddle-impressedsurface treatment is usually produced with secondaryforming using a paddle and anvil. The textured(patterned) paddle leaves a raised design on thevessel surface.
The "preferred" orientation of sand temperinclusions relates to techniques ofprimary forming(Rye 1981). Slab building and coiling can bedetected, in part, by differences in orientation. Adefinitive long axis for the particles is necessary toobserve orientation.
Interior anvil casts and exterior paddle (carvedand plain) maiks were noted as present/absentThese traits reveal the use of the paddle and anviltechnique in secondary forming in the ceramicproduction sequence.
Hardness was measured on the interior andexterior surfaces of sherds by a scratch test using theMohs scale. Hardness, measured on this ordinalscale, may relate to ceramic strength, raw materials,firing, and post-depositional diagenesis.
Sherd color was measured on the exterior andinterior surfaces using the Munsell Soil Color Chart(1988). Ceramic color, while complex, reflects

126 The Tolaga Site
Table 9.1Ceramics from the 1987 Excavation Units
TemporalThin Thick Red Other Analytic
Unit Layer n (%) n (%) Rims Slip Sherds Period Total
1 IIB 2 (3) 66 (97) 10 Middle 68IIC 0 (0) 0 (0) 1 Middle 1III 2 (67) 1 (33) 0 Early 3
4 IIA 0 (0) 7 (100) 0 Late 7IIB 4 (44) 5 (56) 0 Middle 9
5 IIA 4 (14) 24 (86) 0 Late 28IIB 12 (27) 32 (73) 4 Middle 44III 8 (100) 0 (0) 3 Early 8
6 IIA 2 (8) 22 (92) 3 Late 24IIB 2 (13) 13 (87) 0 Middle 15IIC 17 (74) 6 (26) 0 Middle 23III 4 (80) 1 (20) 2 Early 5
7 IIA 1 (13) 7 (87) 1 Late 8IIB 5 (71) 2 (29) 0 Middle 7IIC 5 (83) 1 (17) 0 Middle 6III 4 (80) 1 (20) .1 Early 5
8 IIA 0 (0) 27 (100) 0 Late 27
9 IIA 2 (3) 67 (97) 0 Late 69IIB 2 (9) 20 (91) 11 Incised (1) Middle 22III 1 (33) 2 (67) 0 Early 3
10 IIA 1 (25) 3 (75) 0 Late 4IIB 1 (50) 0 (0) 0 1 Middle 1
11 IIA 3 (38) 5 (62) 2 Late 8IIB 8 (8) 90 (92) 11 Middle 98IIC 1 (50) 1 (50) 0 Middle 2
12 III 20 (100) 0 3 Notched rim (1) Early 20
14 IIA 7 (4) 175 (96) 10 Late 182IIB 10 (11) 85 (89) 0 Middle 95
Totals* 128 (15) 663 (85) (62) 791
* Rims, slipped, and decorated sherds included with thick/thin sherd counts; eroded sherds not included in total.

Ceramics 127
Table 9.2Ceramics from the 1989 Excavation Units
TemporalThin Thick Red Other Analytic
Unit Layer n (%) n (%) Rims Slip Sherds Period Total
9 (90)22 (73)13 (87)2 (50)
9 (100)3 (100)18 (60)
1
320
0
0
2
2
1
MiddleEarlyEarlyEarly
LateIncised (1) Middle
Early
1030154
93
30
20 IIIA 4 (7)IIIB 12 (9)IIIC 10 (22)
21 IIA 1 (25)IIB 2 (12)
23 IIIA 8 (13)IIIB 32 (35)IIIC 17 (28)
53 (93)120 (91)36 (78)
3 (75)14 (88)
54 (87)60 (65)44 (72)
4103
10 Impressed (6)
0
0
4103
211
Decorated (4)
24 IB 1 (33)
27 IIIIAIIIB
0 (0)5 (8)
3 (30)
28 IIA 0 (0)IIB 7 (30)IIC 51 (50)
29 II
IIIA0 (0)
7 (78)
30 II 2 (6)IIIA 11 (28)
Totals* 198
1 (100)16 (70)52 (50)
12 (100)2 (22)
32 (94)28 (72)
0
213 9 Impressed (1)
0
1
1
6
674 (68)
15 IIIIIAIIIBIIID
16 I
IIIII
1 (10)8 (27)2 (13)2 (50)
0 (0)0 (0)
12 (40)
EarlyEarlyEarly
MiddleMiddle
EarlyEarlyEarly
5713246
416
629261
0 12 (67)
5 (100)57 (92)7 (70)
0
31
Middle
LateMiddleEarly
3
5
6210
LateMiddleMiddle
MiddleEarly
1
23103
129
3439
872
MiddleEarly
* Rims, slipped, and decorated sherds included within thick/thin sherd counts; eroded sherds not includedin total.

128 The To'aga Site
vaniability in raw material, pyrotechnology, and use.
The oxidation/reduction pattern was recordedfor sherd cross-sections using an inductively derivedpattern template (e.g., Rye 1981:116). Thesepatterns are indicators of the atmosphere andtemperature of firing (Rye 1981:115-18).
The presence or absence of organic (carbon-aceous) residue was recorded. Residues supplyimportant clues of ceramic function.
Variation in sherd thickness has proven signifi-cant in Samoan pottery studies. Sherd thickness isestimated as a mean value from three measurementson different parts of the sherd. This mean value is amore reliable measure of sherd thickness than a
single measurement (Barry 1978). Three thicknessmeasures also provide a range expressing the
variance in sherd thickness. Variance measures the
uniformity or evenness of sherd thickness.Temper was examined in terms of its rank by raw
material as estimated from hand specimens only.Also, the size modality of the sand temper grainswas recorded using a template produced with sandsamples ofvarying phi sizes on the Wentworth scale.Sherds were viewed under lOX magnification.Dickinson's study of sand temper petrography offersa much more detailed and reliable (some materialsare difficult to determine in hand specimen alone)analysis of a selection of sherds from the To'agaassemblage (see chapter 10).
For sherds with one or more intact surfaces,decoration technique was recorded as tool-im-pressed, incised, or undecorated (plain). Carved
paddle-impressed and red slip, while decorativetechniques, are included under the dimension ofsurface treatment.
Rim sherds were identified in terms of theircourse relative to the central vertical axis of the pot(e.g., direct, everted). The cross-section of the lip(form) and the profile of the rim, or the degree ofthickening, were also classified. Finally, the thick-ness of each rim was measured, and orifice diam-eters were estimated.
Of the 737 sherds sampled for intensive analy-sis, 583 sherds retained both interior and exteriorsurfaces enabling measurement or observation ofthe characteristics listed above. The results ofintensive macroscopic analysis are summarized anddiscussed below. These results, together withcompositional results (below and chapter 10),provide the basis for reconstructing aspects ofceramic raw material use, production technology,style, and function.
RESULTS OF MACROSCOPIC ANALYSIS
Many of the results used for intensive analysisare summarized in tables 9.3-13. Specific character-istics that relate to material use, forming techniques,pyrotechnology, style, and function are discussedbelow.
The analysis of sand temper composition andgrain size modality (see table 9.4) revealed thefollowing: temper ranges in size from grainsmeasuring approximately 2.5 - 4 mm (i.e., granules
Table 9.3Frequency of Body and Rim sherds
Cum.Sherd Frequency Percent Percent
Body 683 92.7 92.7Rim 54 7.3 100.0
Total 737 100.0
(Valid cases = 737; Missing cases = 0)

Ceramics 129
Table 9.4Frequency of Sherds by Temper Size Mode(s)
Cum.Temper Size Modes Frequency Percent Percent
granule 30 4.1 4.1granule, very coarse 189 25.6 29.7very coarse 140 19.0 48.7very coarse, medium 114 15.5 64.2medium 81 11.0 75.2medium, fine 91 12.3 87.5fine 92 12.5 100.0
Total 737 100.0
(Valid cases = 737; Missing cases = 0)
< -1 phi) in many sherds, to particles visible onlyunder magnification (i.e., fine to very fine sand, > 3phi). No attempt was made to observe modes offiner (e.g., silt) particles.
Most of the sherds in the sample assemblage(86%) had a mixture of sands and contained morethan one temper compositional class. Thicker sherdstended to have coarser temper and thinner sherdstended to have finer temper. Temper size correlatesto temper composition (x2 = 237.21, df= 9, p >.0001) in that well-rounded, calcareous sand grainsame smaller than the very coarse (often angular) sandclass (O phi). Grain size and temper composition arealso associated with sherd thickness. Calcareoussadtemper occurs most often in thinware (73% ofthis temper occurs in thinware). Yet, thinwarecannot be described as predominantly calcareoussand tempered because only 26% of the thinware hasa ped anceof calcareous sand temper. On theoterhand the largest tempers, grains of glassy blacktm~hyte, dull grey basaltic, rounded olivine, palep feldspars, clear crystalline, and red ferrous,
rounded grains were resented in the smallest sizeclasses as well.
Color variability was assessed by plotting valuesinascateplot to check fortrends or groupingtendenies. Bivariate plots for a three dimensionalcassification were achieved by plotting Munsell hueagainst value-chroma (figures 9.1-3; e.g., see Bishopet aL 1988). These plots reveal that color variability
in the To'aga ceramics is comparable for all hreetime periods and for both thick- and thinwares.Sherds range from red (lOR) to yellow-red (lOYR)and cover an array ofvalue and chroma Themajority of the assemblage is reddish brown or grayin color. Early ceramics include red-slipped sherds(10R 5/6 and 2.5 YR 5/6) distinctive in colorationfrom the west of the assemblage.
Although analysis showed that interior andexterior surface colors have similar distribution, theconrelation on individual sherds was poor (Pearson'sr = 0.143, p > 0.001). Oxidation/reduction patterns(table 95) play some part in this correlation, since24% of the sherds have interior surfaces that werenot fully oxidized as compared with only 3% for theexterior surfaces. As a result, more sherds haveinterior surfaces that are darker than their exteriorsurfaces. Most of the sherds (68%), however, werefully oxidized during firing.
Following analysis, the entire assemblage wasinspected to ceck for further variation in color (orother unrecorded differences in temper, etc.). Fivesherds, from units 15129/30 were anomalous in color.These sherds (5 YR 6/6 and 7.5 YR 6/3) are de-scribed respectively as reddish yellow and lightbrown in the Munsell system. The former group ofthickware sherds (5 YR 6/6) is similar in color to thepredominate color of the sberds from Upolu Islanddesignated "Falemoa Tan" by Holmer (1980:114).
Sherd hardness, measured on the Mohs scale,

I I I I I I I I I I I
63
VALUE AND CHROMA
Figure 9.1 Plot of exterior sherd color (hue with value and chroma) for the late period (note to figures 9.1-3: numberof cases in each position is shown in sequential order by 1-9; A-; 10-35 cases; and *, more than 36 cases).
6-
4.5-
3-
I I I I I I I I I I I
I 227
I 336
I 445
I 554
I 663
VALUE AND CHROMA
Figure 9.2 Plot of exterior sherd color (hue with value and chroma) for the middle period (seenote to fig. 9.1).
130 The Tolaga Site
6-
HUK
4.5-
C 1
1 3 1
E 7B C 1 1
*815
3-
2727 36
HU
5 * 22 1 1
2 K 1 B
0 Q* 4J 3 1
1 1 *1 4
I I I I I I I I I I I
I I 9 9 I I
I 145
I 154
I
I

Ceramics 131
I I I I I I I I I I I
I 445
I 554
I 663
VALUE AND CHROMA
Figure 9.3 Plot of exterior sherd color (hue with value and chroma) for the early period (see note to fig. 9.1).
ranged from 2.0 to 8.0 (tables 9.6-7). This is aremaikable range ofhardness, but reflects thedifficulty ofmeasuring paste hardness with a scratchtest in sherds with abunant temper (which isconsistently hard). Ceramic tiles manufactured fromcolluvial clay samples and fired in an open fire (forappoximately fifteen minutes), or in the mufflefurnace (5000C for fifteen minutes) were uniformly3 in hardness. There is a strong correlation(r = 0.8467, p > .0001) between the interior andexterior hardness of individual sherds.
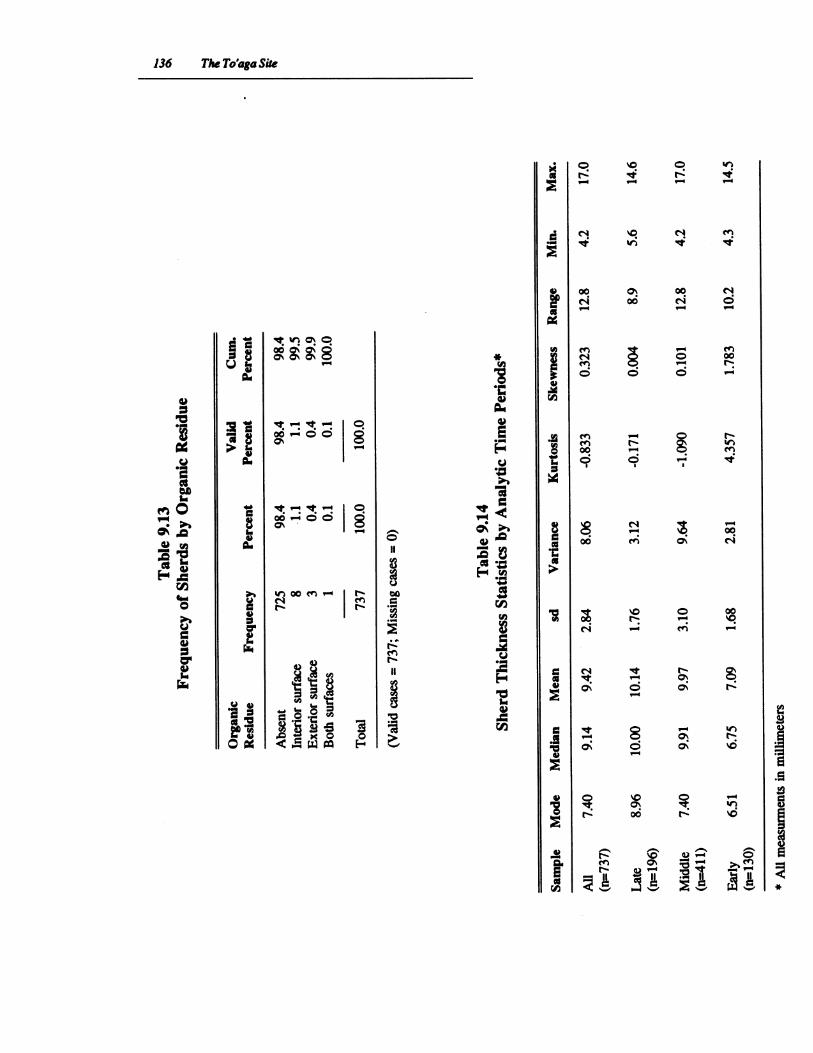
The sample analyzed (n = 737) had 583 sherdswhich retained both surfaces (i.e., non-eroded),allowing the measurement ofmean thickness foreach sherd. Results show that sherds range from4.20mm to 16.97 mm in thickness. The total samplemean sherd thickness is 9.42 mm (a = 2.84), how-ever the distribution is not normal, but has hree
modes (figure 9.4). The late portion of the sample(n = 196) with 140 measurable sherds, ranges from5.60mm to 14.55 mm in thickness. late sample
mean sherd thickness is 10.14 mm (a = 1.77) (figure9.5). The middle period sample (n = 41 1) with 323measurable sherds, ranges from 4.20mm to 16.97mm in mean sherd thickness. The sample meanthickness is 9.97 mm (a = 3.10) (figure 9.6). Theearly ceramics (n = 130) had 120 measurable sherds
with a mean thickness of 7.09mm (a = 1.68). Thesesherds range in thickness from 4.30mm to 14.52mm in a somewhat normally distributed range ofmeasurements (kurtosis 4.357, skewness 1.783), butskewed toward the timner sherds (figure 9.7).Differences in sherd thickness are summanzed bytemporal-analytic periods in table 9.14.
Rims for the entire To'aga assemblage wereanalyzed and identified to class (see protocol).These forms are illustrated in figure 9.8. One largereconstructed sherd provided a measurable portionof a rim (9% of the estimated total) so that the
diameter is reconstructed as 48 cm. About 89% ofthe rims are oriented 900 to a central vertical axis ofthe vessel. Other rims have angles approximating800. All rim courses are direct, with the majority(80%) having a squared lip cross section. Theremaining rims (20%) are rounded in cross section.
The only decorated rims are from early contexts,comprising approximately 7% of the total. The lipsof these decorated rims are impressed with narrowtools forming U-shaped notches, repeating parallellines perpendicular to the rim, or in one case, obliqueto the rim. A rim with a crenelated lip was alsorecovered.
Other decorated sherds are small in number.Only 30 slipped sherds and 1 1 other decorated
6-
HUB
4.5-
1 X 11 1
1 1
2 IR 1D 1 1
R7 2
3-
I 227
I I336
* * * * * * * * * * -lF

132 The To'aga Site
Table 9.5Frequency of Sherds by
"Preferred" Orientation of InclusionsRelative to Vessel Walls
Inclusion Cum.Orientation Frequency Percent Percent
Indeterminate 199 27.0 27.0Random 458 62.1 89.1Parallel 80 10.9 100.0
Total 737 100.0
(Valid cases = 737; Missing cases = 0)
Table 9.6Frequency of Sherds by Oxidation-Reduction
Pattern in Cross-Section
Valid Cum.Pattern Frequency Percent Percent Percent
Fully oxidized 380 51.6 67.9 67.9Core oxidized 10 1.4 1.8 69.6Ext. oxidized 68 9.2 12.1 81.8it. surf. reduced 55 7.5 9.8 91.6Fully reducd 9 1.2 1.6 93.2Ext. surf. reduced 14 1.9 2.5 95.7Surfs. rediced 2 .3 .4 96.1Ext. reduced 7 .9 1.3 97.3Ext.surf.reduced 15 2.0 2.7 100.0int. reduced 177 24.0 Missing
Total 737 100.0 100.0
(Valid cases = 560; Missing cases = 177)

Ceramics 133
Table 9.7Frequency of Sherds by
Exterior Hardness (Mohs Scale)
Exterior Valid Cum.Hardness Frequency Percent Percent Percent
2 31 4.2 5.0 5.03 113 15.3 18.1 23.14 109 14.8 17.5 40.65 154 20.9 24.7 65.36 145 19.7 23.3 88.67 53 7.2 8.5 97.18 18 2.4 2.9 100.0Eroded 114 15.5 Missing
Total 737 100.0 100.0
(Valid cases = 623; Missing cases = 114)
Table 9.8Frequency of Sherds by
Interior Hardness (Mohs Scale)
Interior Valid Cum.Hardness Frequency Percent Percent Percent
2 24 3.3 3.8 3.83 110 14.9 17.2 21.04 122 16.6 19.1 40.15 141 19.1 22.1 62.26 158 21.4 24.8 87.07 52 7.1 8.2 95.18 31 4.2 4.8 100.0Eroded 99 13.4 Missing
Total 737 100.0 100.0
(Valid cases = 638; Missing cases = 99)
134 The To'aga Site
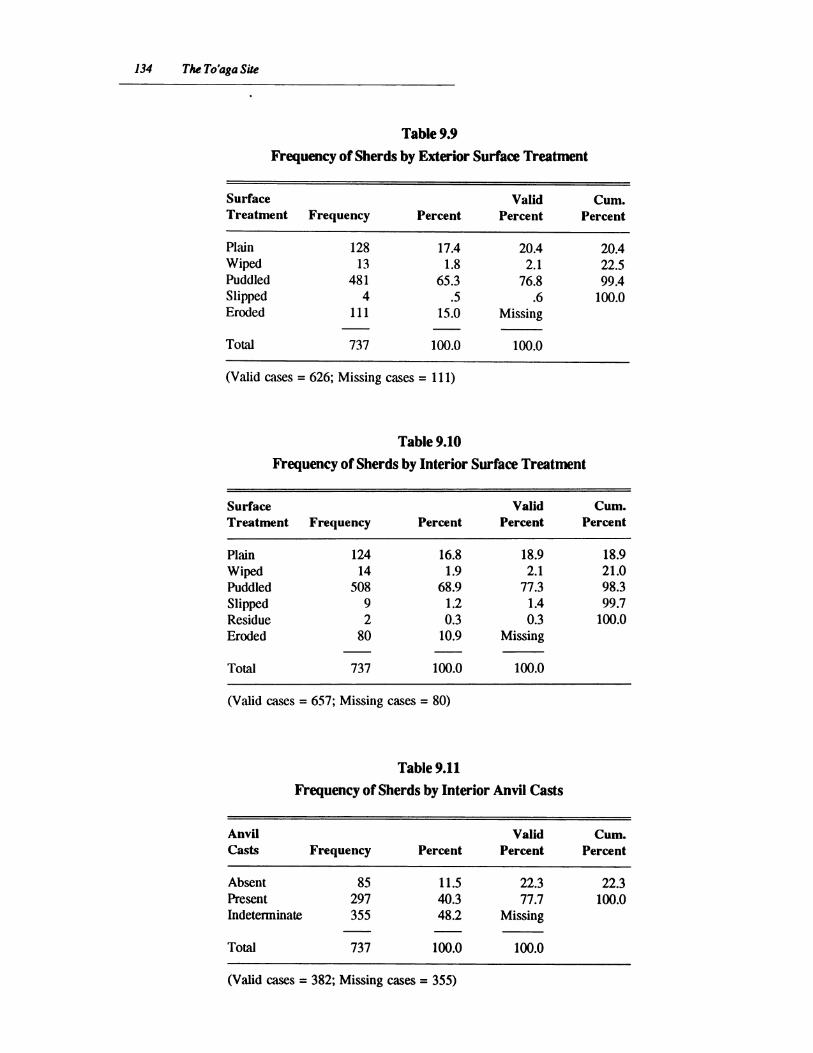
Table 9.9Frequency of Sherds by Exterior Surface Treatment
Surface Valid Cum.Treatment Frequency Percent Percent Percent
Plain 128 17.4 20.4 20.4Wiped 13 1.8 2.1 22.5Puddled 481 65.3 76.8 99.4Slipped 4 .5 .6 100.0Eroded 111 15.0 Missing
Total 737 100.0 100.0
(Valid cases = 626; Missing cases = 111)
Table 9.10Frequency of Sherds by Interior Surface Treatment
Surface Valid Cum.Treatment Frequency Percent Percent Percent
Plain 124 16.8 18.9 18.9Wiped 14 1.9 2.1 21.0Puddled 508 68.9 77.3 98.3Slipped 9 1.2 1.4 99.7Residue 2 0.3 0.3 100.0Eroded 80 10.9 Missing
Total 737 100.0 100.0
(Valid cases = 657; Missing cases = 80)
Table 9.11Frequency of Sherds by Interior Anvil Casts
Anvil Valid Cum.Casts Frequency Percent Percent Percent
Absent 85 11.5 22.3 22.3Present 297 40.3 77.7 100.0Indeterminate 355 48.2 Missing
Total 737 100.0 100.0
(Valid cases = 382; Missing cases = 355)

Cerenics 135
Table 9.12Frequency of Sherds by Exterior Paddle Marks
Paddle Valid Cum.Marks Frequency Percent Percent Percent
Absent 54 7.3 16.1 16.1Present 282 38.3 83.9 100.0Indeterminate 401 54.4 Missing
Total 737 100.0 100.0
(Valid cases = 336; Missing cases = 401)
courht
4 5 6 7 8 9 10 11 12 13 14 15 16
thickness (mm)
Thickiess and temper size histogram for the Toaga ceramic assemblage (n = 538). Temperclasses are indited by tew variable shading of the histam bars.
_~ granule, v. coarse
_~ v. coarse, medium
medium, fine
a= fine, v. fine
25
20 -
15 -
10 --
5 -
09A
Figur 9.4
136 The To'aga Site
00 -401Noo: o! oqfio ;00"()o
Ch _ 8._o
co
§t1 ,
0
2**IC
00
.2~~~~~~C
si
m_m
11 3e ~~~~FO r
oa W.0 U~~~~~~)
*r0
ml w
N
d
W
U,
I(A
*
W
0
U
NN
0~asNes
xo o _-
O t.-
0 x~
a, .0 T-s
0%. 000* e
0
600(%.-0N
x
006
6
0
6
E~u
EI"
U
a,to
09
v
0
C'C*aato
" ;Ob
co
0 I% 00
0
0% 0 0%
0%.
ON
8o

count
4 5 6 7 8 9 10 1 1 12 13 14 15 16
thickness (mm)
Figure 9.5 Thickness histogram for late period ceramics (n = 196).
sherds were recovered. The color of the slip is red(10R 5/6 and 2.5 YR 4/6). This slip occurred onboth the interior and exterior of the sherds and wasfound on both rim and body sherds. Three bodyherds from the assemblage are decorated. Two
sherds have incised lines, although both are smallmaking the overall patterns indistinct. The third is abody sherd with parallel-ribbed, carved paddle
essions on the exterior surface of the vessel.This sherd was from an early context (unit 20, layerIB), and compares to other paddle-impressed
sherds known from Westem Samoa (Green andDavidson 1969:pl. 17).
All sherds recovered during excavations were
examined for residue in the field, (i.e., prior to anycleaning). Ten sherds with substantial quantities ofcarbonized residue were discovered; seven withresidue on the interior and exterior, and three on the
interior alone. This residue has yet to be identifiedbut is probably the result of cooking starchy foods(see Hillet al. 1985).
CERAMIC COMPOSITIONAL
MICROANALYSIS
Analysis ofmacroscopic ceramic traits supportsmany research objectives, especially those examinedhere. Documenting raw material vanability requiresadditional work, especially with respect to temperand clay of the ceramic fabric. The temper compo-nent has been analyzed and discussed by Dicdinson(chapter 10). Here we present the compositionalmicroanalysis of thee clay samples and the clayportion of the ceramics from To'aga. These resultsallow us to address questions of clay variability (as a
part of technology) and the potential for ceramicexchange in Samoa.
A sample of twenty-nine sherds was chosen fortheir visual differences in thickness, temper, andpaste in hand section. Also, this variety of sherdscame from excavation contexts that could be inferredto be of different ages (table 9.1). Age differences
Ceramics 137
25
20
15
10
5
0

count
4 5 6 7 8 9 10 1 1 12 13 14 15 16
thickness (inm)
Figure 9.6 Thickness histogram for middle period ceramics (n =411).
correspond to the analytic divisions made for thelarger sample (i.e., early, middle, and late). Thesherd samples were also analyzed by Dickinson(chapter 10) for their sand temper petrography.Examination of the To'aga ceramics by both sandtemper petrography and elemental analysis takesadvantage of the strengths of each approach (Hunt1988).
In addition to the shends, three clay sampleswere collected from colluvium near the base of thecliff at To'aga on transects 1, 5, and 9. These clayswere fired in a furnace (at 500(C) for fifteen minutesto produce ceramic tiles resembling sherds. One ofthese clay samples (from Transect 9) was preparedin the laboratory as a fired ceramic tile (sherd). Itwas also analyzed by Dickinson (chapter 10) tocompare "self-tempered" sherd petrography.
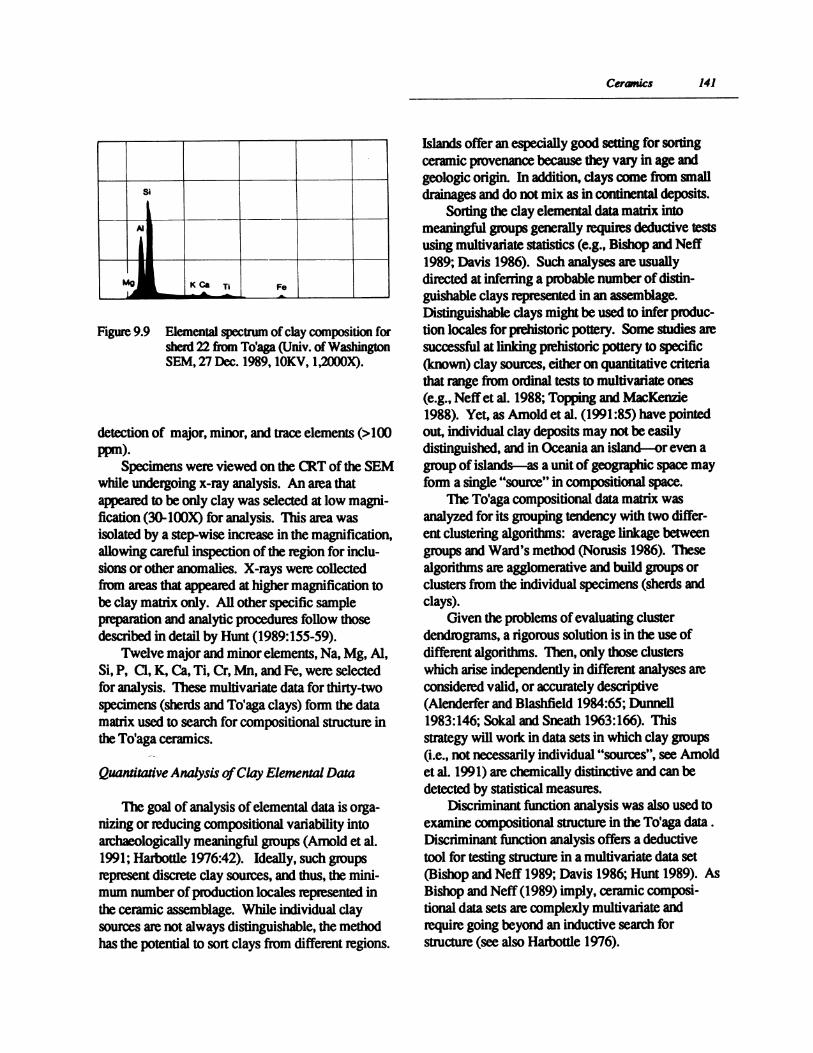
The elemental microanalysis was accomplishedusing an energy-dispersive spectrometer (EDS)integrated with a scanning electron microscope
(SEM). SEM/EDS microanalysis is described in thischapter, and these results are integrated with thosefrom the petrographic analysis. The distinct advan-tage of the SEM/EDS is in the selectivity affordedby the microscope component of the instrunent.Using the SEM in conjunction with an x-ray ana-lyzer, it is possible to characterize the clay matrixalone, or individual inclusions, slips, and residues(e.g., Hunt 1989). Analyses described here wereconducted by one of us (TLH) on a JEOL modelJSM-840A SEM fitted with a Tracor Northemenergy-dispersive x-ray detector housed at theUniversity of Washington.
Selective elemental microanalysis of pottery ispossible by the coupling of an x-ray analyzer withthe SEM. In the simplest terms, dte SEM provides asource of electrons of appropriate energy thatimpinge on a sample and cause the emission of x-
rays. The x-rays emitted have energies and relativeabundances that reflect the elemental composition of
138 The To'aga Site
30
25
20
15
10
5
0

Cereaics 139
count
4 5 6 7 8 9 10 1 1 12 13 14 15 16thickness (inm)
Figure 9.7 Thickness histogram for early period ceramics (n = 130).
the sample. The characteristic x-rays are deted bya lithium-drifted silicon Si(Li) crystal that-togetherwith electic amplifiers and signal processors-collects and electrically sorts all the energies fromthe x-rays emitted. Under nonnal operating condi-tions, elements with atomic numbers above 10 (Na =11), and below 100 (Es = 99) are deteable.
The conversion of x-ray emissions into acompositional spectrum (figure 9.9) and potentialquantitative data is achieved through a series ofelectic components described in some detail byPostek et al. (1980) and Goldstein et al. (1981:222-24). Qualitative and quantitative analysis of the x-ray spectrum for the composition of a particularsample is complex, yet well understood (Goldstein etal. 1981:275-392). As in other recent studies, (e.g.,Dunnell and Hunt 1990, Graves et al. 1990, Hunt1989), quantitative analysis ofTo'aga ceramic claysused the ZAF conection method (see Goldstein et al.1981:308). The final values calculated are quantities
ofelements (by weight and atomic percents) presenton the cross-section surface of the sample at thepoint/area impinged by the electr beam. Agoodness of fit between those elements quantifiedand stand intensities is evaluated by a chi-squaretest This test provides an objective criterion toevaluate the goodness of fit for the peak-fittingalgorithms used in each particular application(Goldsteinet al. 1981:411-12). The analystcanjudge the success or failure of x-ray collection forgoodness of fit for a particular specimen on statisti-cal criteria for each spectrum and quantitativeanalysis generated. All these features are availablethrough the Tracor Northem software used.
Minimum elemental detection limits for energy-dispersive microanalysis are below 0.1% under idealsettings, and typically less than 19%, with a relativeprecision of 1-5% throughout the elemental rangedetected (Hunt 1989). Rice (1987:375) notes thegeneral concentration range for x-ray analyses as
20
15
10
5
0

140 The Tolaga Site
I.If--w.
-L J~~~~~~~~o 3E
i -f- F;,
I
_- ~~~~~~to ' _ K~~~~~~~~~~~
A~~~~~~1-'O 8X~~~~~~~~~~~~~~~I
Ceramics 141
Figure 9.9 Elemental spectrum of clay composition forsherd 22 firn To'aga (Univ. of WashingtonSEM, 27 Dec. 1989, 1OKV, l200X).
detection of major, minor, and trace elements (>100ppm)
Specimens were viewed on the CRT of the SEMwhile undergoing x-ray analysis. An area thatappeared to be only day was selected at low magni-fication (30-1OX) for analysis. This area was
isolated by a step-wise increase in the magnification,allowing careful inspection of the region for inclu-sions or other anomalies. X-rays were collectedfrom areas that appeared at higher magnification tobe clay matrix only. All other specific sample
ation and analytic procedures follow hose
described in detail by Hunt (1989:155-59).Twelve major and minor elements, Na, Mg, Al,
Si, P, Cl, K, Ca, Ti, Cr, Mn, and Fe, were selectedfor analysis. These multivariate data for thirty-twospecimens (sherds and To'aga clays) form the datamatrix used to search for compositional structure inthe Toaga ceramics.
Quantitative Analysis ofClay Elemental Data
The goal of analysis of elemental data is orga-nizing or reducing compositional variability intoarchaeologically meaningful groups (Armold et al.1991; Harbottle 1976:42). Ideally, such groups
represent discrete clay sources, and thus, the mini-
mum number ofproduction locales represented inthe ceramic assemblage. While individual claysources are not always distinguishable, the methodhas the potential to sort clays from different regions.
Islands offer an especially good setting for sortingceramic provenance because they vary in age andgeologic orgin. In addition, clays come from smalldrainages and do not mix as in continental deposits.
Sorting the clay elemental data matrix intomeaningful groups generally requires deductive testsusing multivanate statistics (e.g., Bishop and Neff1989; Davis 1986). Such analyses are usuallydirected at infernng a probable number of distin-guishable clays represented in an assemblage.Distinguishable clays might be used to infer produc-tion locales for prehistoric pottery. Some studies aresuccessful at linking prehistoric pottery to specific(known) clay sources, either on quantitative criteriathat range from ordinal tests to multivariate ones(e.g., Neff et al. 1988; Topping and MacKenzie1988). Yet, as Arnold et al. (1991:85) have pointedout, individual clay deposits may not be easilydistinguished, and in Oceania an island-or even agroup of islands-as a unit of geographic space mayform a single "source" in compositional space.
The To'aga compositional data matrix wasanalyzed for its grouping tendency with two differ-ent clustering algorithms: average linkage betweengroups and Ward's method (Norusis 1986). Thesealgorithms are agglomeradve and build groups orclusters from the individual specimens (sherds andclays).
Given the problems of evaluating clusterdendrograms, a rigorous solution is in the use ofdifferent algorithms. Then, only those clusterswhich arise independently in different analyses areconsidered valid, or accurately descriptive(Alenderfer and Blashfield 1984:65; Dunnell1983:146; Sokal and Sneath 1963:166). Thisstrategy will work in data sets in which clay groups(i.e., not necessarily individual "sources", see Arnoldet al. 1991) are chemically distinctive and can bedetected by statistical measures.
Discriminant function analysis was also used toexamine compositional stnrcture in the To'aga data.Discriminant function analysis offers a deductivetool for testing structure in a multivanate data set(Bishop and Neff 1989; Davis 1986; Hunt 1989). AsBishop and Neff (1989) imply, ceramic composi-tional data sets are complexly multivariate andrequire going beyond an inductive search forstructure (see also Harbottle 1976).

142 The To'aga Site
Compositional Results
Results of these clustering procedures wereplotted as dendrograms (figures 9.10-11). Fromthese dendrograms, comparable clusters of sherds(and clay sample tiles) occurring in both solutionscan be deduced. Comparison of the Ward andaverage linkage between group cluster dendrogramsreveals four identical clusters. Table 9.15 providessummary data and results for the sample.
Cluster assignments from the two solutions (1-4,and two cases unassigned) were analyzed and plottedagainst first and second discriminant functions. Theplot (figure 9.12) of discriminant function scoresillustrates the distribution of the groups in multidi-mensional space.
Cluster 4 includes seven sherds of both thick-and thinware as well as the three clay samplescollected from To'aga colluvium. This matchsuggests that local colluvial clay from To'aga wasused in some pottery manufacture. The remainingthree (1-3) clusters represent clay compositionalgroups as yet unmatched to samples from Ofu, orelsewhere. These unmatched clays are similar incomposition to those of the local colluvial claysample, and may come from other unknown sources/source areas on Ofu, elsewhere in Manu'a, orbeyond. A determination of local versus exoticprovenance for the unmatched sherds would bepremature; additional sampling of clays is necessary.Sherds from other islands in Samoa should also betested for their compositional similarity to those of
Rescaled Distance Cluster Combine
C A S ELabel Seq
20220525092123061526270824071417161319291811123003040201103231
20225
259
21236
1526278
247
141716131928181112293421
103130
0 5 10 15 20 25I i i i il
Figure 9.10 Dendrogram of Ofu pottery and clay samples using the Average Linkage (between groups) method.
I
I I I I I
I
I
I

Ceramics 143
Rescaled Distance Cluster Combine
C A S ELabel Seq
20220525092429181319141716212306152627080710323103040211123001
20225
259
242818131914171621236
15262787
103130342
1112291
0 5 10 15 20 25i I i iI
Figure 9.11 Denrgm ofOfu pottery and clay samples using Ward's method.
the To'aga assemblage.The association of clay compositional groups
with thickware, thinware, red-slipped ware, thepaddle-impressed sherd, and the three colluvial claysamples from To'aga (table 9.15) shows that thick-and thinware cannot be separated compositionally.All compositional groups are represented in thick-and thinware. Discrhminant function analysis, usingware as the grouping variable, confirmed thisobservation. Scatterplots revealed little separationalong the first and second discriminant functions(figure 9.13). The red-slipped pottery (n = 2) fallsinto groups 2 and 3, although a larger sample isneeded to assess compositional variation in thisclass. The To'aga colluvial clays (in group 4) matchsherds of thickware, thinware, and the carved
paddle-impressed sherd.Compansons of ware with temper groups (table
9.15) identified by Dickinson (chapter 10) reveal thatall four temper groups are represented in thickware.The profuse basaltic temper is found only inthickware, for this sample. Thinware contains sparsebasaltic (temper group 2), feldspathic (temper group3), and mixed (temper group 4) tempers (see chapter10). The two red-slipped sherds in the sample havesparse basaltic temper. The paddle-impressed sherdand the analyzed "self-tempered" clay sample (fromTransect 9 colluvium) have the mixed (temper group4) temper, including calcareous sand. Calcareoussand in the colluvium suggests saltational transportof grains from the coast over the previously shorterdistance to the colluvial deposits where mixing could
I I

144 The To'aga Site
Table 9.15Sherds and Ofu Clays Selected forSEM/EDS Clay Elemental and Sand
Temper Petrographic Analyses
Specimen Temper ClayNo. Provenience Class Group Cluster Period
1 Unit6 IIa Thick 1 4 Late2 Unit 6 IIa Thick 1 4 Late3 Unit 6 Ila Thick 1 4 Late4 Unit6 IIa Thick 1 4 Late5 Unit 6 Ilb Thick 1 1 Middle6 Unit 6 Ilb Thick 2 3 Middle7 Unit 6 lIb Thick 2 4? Middle8 Unit 6 HIb Thick 4 4 Middle9 Unit 6 IIb Thick 3? 1 Middle10 Unit 6 Ilc Thick 2 4 Early11 Unit 6 IIc Thick 4 4 Early12 Unit 6 IIc Thick 4 4 Early13 Unit 20 Ilb Thick 2 2 Middle14 Unit 20 HIb Thick 1 2 Middle15 Unit 20 Ilb Thick 3 3 Middle16 Unit 20 IIIa Thin 2 2 Early17 Unit 20 I11a Thick 3 2 Early18 Unit 20 I11a Thick 3 2 Early19 Unit 20 1I1b Thin' 2 2 Early20 Unit 20 IlIb Thin 2 1 Early21 Unit 20 T11b Thin2 2 3 Early22 Unit 20 IIIa Thick 2 1 Early23 Unit 20 IIIa Thick 2 3 Early24 Unit 20 IHIb Thin3 4 4? Early25 Unit 20 Tub Thin 4 1 Early26 Unit 20 IlIc Thin 4 3 Early27 Unit 20 IHIc Thick 2 3 Early28 Unit 20 HlIc Thin 2 - Early29 Unit 24 II Thick4 2 2 Early?30 Transect 9 Clay - 4 -----
31 Transect 5 Clay 4 4 -----
32 Transect 1 Clay - 4
1 Square rim with an impressed lip2 Red-slipped3 Carved paddle-impressed (parallel rib motif)4 "Thickware" with red-slipped exterior

Ceramics 145
4.0
.0
-4.0 +
xX x
-6.0 -4.0 -2.0 .0 2.0 4.0 6.0
Figure 9.12 First and second discriminant functionscores for analysis based on cluster (1-4)as grouping variable; * indicates groupcenter, # indicates unclassified as tocluster.
-6. 0 -4.0 -2.0 .0 2.0 4.0 6.0
Profuse basaltic temper (Dickinson's group 1) isassociated with cluster 4 (that includes the three"self-tempered" colluvial clays) more than expectedby chance alone (expected = 1.7, observed = 4).Furthermore, temper groups 1, 2, and 4 occur withclay compositionally indistinct from the To'agacolluvium samples. All temper groups are associ-ated with clay group 1. It is also noteworthy ta theoverall association is otherwise somewhat welldispersed. This observation suggests that in many ofthe specimens, temper and clay composition varyindependently.
Compositional groups tabulated by their analytictime penods show a pattern of decline. Composi-tional variation reflected by temper groups reveals asimilar pattern of decline. The early time period(1250-500 B.C.) ceramics fall into all fourclaycompositional groups, reflecting the greatest varietyofclay (source) use. One of the clay sources in useduring the early period is the local colluvial clayfrom To'aga, and it is in both thick- and thinware.The middle period (500 B.C.- A.D. 0) may show adecline to time clay groups, and does not include thecolluvial clay from To'aga. The late (A.D. 0-300?)ceramics are only represented by the To'aga colluvialclay in thickware samples. A decline in composi-tional variability reflects the general simplificationand homogenization of the total To'aga assemblagewith time. This potential trend, however, couldsimply result from the smaller samples in the middleand late time periods. Additional samples must beanalyzed to test a hypothesis of change in thecompositional variability in the To'aga sequence.
CONCLUSIONS
Figure 9.13 First and second discriminant functionscores for analysis based on time period(early [1], middle [2], and late [3]) asgrouping variable; * indicates groupcenter.
occur natualy. Temper with calcareous sand couldalso represent purposefil mixing on the part ofancient potters.
The association of clay compositional groups
with temper groups (table 9.15) defined byDickinson reveals some maiked correspondence.
Ceramics provide a critical source of informa-tion for building chronologies and inferring culturalrelatedness because they vary in style. Recentadvances in physico-chemical and archaeologicalanalyses (Rice 1987) open the door to many newquestions in ceramic studies. In this study, wefocused on ceramics in terms of material composi-tion and provenance, production technology, style,and function. The To'aga ceramic assemblage isparticularly valuable for this kind of detailed study.The assemblage is large and comes from a stratifiedsite where a long chronology of pottery productioncan be delineated. In the discussion that follows, we
x xx
1 41 *13 11 2 2 44 4
3 3 4 *4 43*2 *
2 22 4
4.0
.0
-4.0
x I I xx x
3
33323 3 31332*3 1 3
2 * 333 *3 2
1
x XY. I I I I V..AA-

146 The Tolaga Site
offer some partial answers to the questions posed atthe beginning of this chapter.
Ceramic Provenance and Production Technology
The day microanalytic and sand temper petro-
graphic results provide a basis for several conclu-sions and new hypotheses conceming ceramicprovenance and production technology. Thickware,thinware, and a carved paddle-impressed sherd fromTo'aga can be inferred to be of local production,using colluvial "self-tempered" clay source(s) fromLeolo Ridge on Ofu. Such clay(s) could be gatherednear the base ofthe cliff at To'aga, immediatelyadjacent to the prehistoric occupation. Processing ofsuch clay appears to have been minimal. Thecolluvial source(s) accounts for the greatest amountof pottery in the EDS/petrographic sample.
One class of pottery, the red-slipped (thinwareand one thick, red-slipped sherd), does not match thelocal clays as presently known. The red-slippedpottery in the EDS/petro-graphic sample alsocontains only sparse basaltic temper (group 2).These distinctions may suggest an exotic provenancefor red-slipped ware that arrived on Of throughinter-island exchange. This hypothesis requires a
larger sample to test further.In sum, the available compositional evidence
suggests at least four hypotheses that may beconfirmed or falsified with additional research:
1) The decline in compositional groups
(both temper and clay groups) merely reflectssample size differences for the time periods (cf.Grayson 1984, 1989; Kintigh 1989). This is, ina sense, the null hypothesis suggesting thatwith larger samples, the association of timeperiod and clay or temper group will becomemore even (random in the statistical sense).
2) Local colluvial clay(s) provided a sourcefor most pottery production at To'aga. Suchclay(s) underwent little, if any, processing bypotters. In most cases the colluvial clays couldbe described as "self-tempered."
3) Red-slipped pottery does not conform tothe clay compositional data known for To'aga(clays and pottery). This ware, and others ofsimilar clay-temper composition may be exoticto Ofu, and represent inter-island exchange.
4) The To'aga ceramic sequence is marked
by a decline in the diversity of clays used inproduction (which in this case is not a productof sample size effects). This decline reflectschange in the use or availability of the claysources. Such a trend might also denote adecline in exchange, including that from otherislands (see Hunt 1989; Kirch 1988, 1990).
Reconstruction of production technology issupported by the macroscopic ceramic analysisoutlined above. Vessel form (bowls) and theobservation ofsome laminar fracturing in the sherdspoint to slab-building as the primary formingtechnique. The analysis of orientation angle wasdesigned to provide evidence for primary forming(table 9.5). However, due to the absence of grainswith a definitive long-axis, and perhaps the difficultyof determining "random," "indeterminate," or"preferred orientation," the vestige of possible slab-building is not reflected in attempts to analyzeparticle orientation.
Secondary forming is indicated by paddleimpressions (visible on 17% of the sherds) and anvilmarks (present on 23% of the sheeds). Two sherdsshow the unmistakable impression of a finger usedfor the same purpose.
The majority of the surface treatment is puddling(77%), a finishing technique using water and wipingto bring the finest clay particles to the surface of thepaste. Wiping was also evident, occurring com-monly on the rim sherds (tables 9.9-10).
Approximately 25% of the sherds in the sampledisplay a pattern of incomplete oxidation adjacent tothe interior surface in contrast to4% with incompleteoxidation at the exterior surface. Only 2% of thesherds show little or no oxidation present About67% of the sherds are completely oxidized. Basedon this, and other evidence described (hardness andcomparison of experimentally fired-clay tiles), wesuggest that pottery was fired in open conditions oftemperatures reaching approximately 500-600( C.The fact that interior surfaces were darker (lessoxidized), suggests that bowls were placed up-side-down for firing. This technique is similar to somedocumented edtnographically in Melanesia, wherepottery is still made in many locations (e.g., Irwin1985; May and Tuckson 1982).
Explaining the abandonment of pottery produc-tion in Samoa remains unresolved. Our To'agaanalyses show that diversity of material use may
Ceramics 147
have declined over the period of ceramic production.It could be hypothesized that changes in raw materi-als, for example the use of"self-tempered" colluvialclays, resulted in a ceramic product ofmarginalquality. This hypothesis requires additional study(e.g. see Feathers 1990).
Styk
The To'aga assemblage is simple in form andcarries very little decoration. Vessel parts present(direct rims and body sherds only) indicate tat onlyforms ofunr cted orifice (bowls) were produced.There is no evidence in the To'aga assemblage ofglobular pots, jars, plates, or other complex vesselforms. Decorative attributes are restricted to im-pressing and notching on the lip, red-slip, carvedpaddle impression, and incision. Such a short rosterdeparts dramatically from assemblages ofcompa-rable age from Mulifanua, 'Upolu, and from assem-blages in Tonga and Fiji.
Style can be defined for analytic purposes inarchaeology as traits ta are free to vary indepen-dent of function (Dunnell 1978). This definitionemphasizes style as governed by stochastic pro-cesses, and distributional frequencies that behaveaccordingly. In this perspective, thickness might betreated as a "stylistic" tait. Sherd thickness hasreceived much attention in previous attempts tounderstand diachronic change in Samoan ceramics(Claik and Herdrich 1988; Green 1974; Hunt andKirch 1988; Jennings and Holmer 1980, Kirch et al.1990). The changing (declining) frequencies ofthinware, in particular, might be a reflection ofhomology ("style"), and its independence fromfunctional constraints. The frequency distributions(see tables 9.1-2) of thinware (defined as <7.5 mm)and thickware (>75 mm) from To'aga allow thefollowing conclusions:
1) Thickware is present in the earliest deposits, andits abundance over time is relatively stable.
2) Thinware is never dominant in the assemblagebut occurs in roughly equal percentages tothickware in the earliest deposits.
3) The presence of thinware declines in real andrelative values over time but persists perhaps aslong as pottery production itself.
4) Pottery declines in abundance early in theChIstian era and then its production disappears
entirely.The evidence firm Western Samoa is similar in
many, but not all, rspects. In spite of early dates forTo'aga (i.e., contemporaneous with the MulifanuaLapita site), no dentate-stamped Lapita pottery isknown for this site, or elsewhere in Manu'a. Thisabsence may be paralleled in the cases from Tikopia(Kirch and Yen 1982) and Anuta (Kirch andRosendahl 1973) where assemblages of pottery dateto early times, yet do not share the degree of decora-tion known elsewhere in the southwestern Pacific.Perhaps this reflects isolation from a largerintensland network that shared ideas of designs, orpots themselves. Manu'a may have simply been farenough away to incur such isolation from otherislands of Samoa, Tonga, and Fiji.
Green (1974) proposed a sequence ofceramicchange for Samoa. His chronological analysis fromUpolu was based on a short occupation sequence,with radiocarbon dates ranging from 1840 ± 100 B.P.(GaK-1441) in the lowest cultural layer (V) to 1800± 80 B.P. (GaK-1341) in the layer (IV) above (Green1974:115). These dates overlap at one standarddeviation. When calibrated and averaged together,these two dates yield a calibrated age range at onestandard deviation of A.D. 1 17-254 (Stuiver andReimer 1986). Based on his analysis of over 7400sherds, Green (1974:130) concluded that, "thin andthick ware sherds occur in association in both layers"and that over time the end is for thickware topredominate but not totally replace thinware(1974:248). Inspection of Holmer's (1980:116)data, and his comparison to other Western Samoanassemblages, reveals a similar trend for thin- andthickware frequencies.
Function
Vessel function in the To'aga assemblage issuggested by fonn and the presence of residues. rhesingle vessel form (bowls) might have servedfunctions of storage, cooking, and serving dishes.Carbonaceous residues suggest cooking, at least in asmall number ofthe vessels. Microanalysis forconcentrations ofphosphorus (P) was performed onthree sherds in an experimental effort (Dunnell andHunt 1990). These and other test case results werevaried, and revealed that functional inferences basedon P concentrations in pottery are unreliable

148 The Tolaga Site
(Dunnell and Hunt 1990).The ceramics from To'aga are among the best
studied in the Samoan Ilands. Addressing difficultissues beyond questions of chronology and culturalaffinities demand detailed studies as we haveattempted here. With regard to the questions posedat the start of this chapter, our study contributes toanswers that will necessarily come from severalstudies ofcomparable detail and scope conductedwith assemblages from throughout Samoa and thelarger region.
REFERENCES CITED
Aldenderfer, M. S., and R. K. Blashfield 1984.Cluster Analysis. Beverly Hills: Sage Publica-tions.
Arnold, D. E., H. Neff, and R. L. Bishop 1991.Compositional analysis and "sources" ofpottery: An ehnoarchaeological approach.American Anthropologist 93:70-90.
Barry, B. A. 1978. Errors in Practical Measurementin Science, Engineering, and Technology. NewYork: John Wiley & Sons.
Bishop, R. L., and H. Neff 1989. Compositional dataanalysis in archaeology. ArchaeologicalChemistry IV:57-86.
Bishop, R L., V. Canouts, S. P. DeAtley, A.Qoyawayma, and C. W. Aikins 1988. Theformation ofceramic analytic groups: Hopipottery production and exchange, A.C. 1300-1600. Journal ofFieldArchaeology 15:317-37.
Clark, J., and D. Herdrich 1988. The Eastern Tutuilaarchaeological project 1986, final reportPrepared for the government of AmericanSamoa, Office of Historic Preservation, Deptof Parks and Recreation. Pago Pago, AmericanSamoa.
Davis, J. C. 1986. Statistics and Data Analysis inGeology. Second Edition, New York: JohnWiley & Sons.
Dunnell,R C. 1978. Style and function: A funda-mental dichotomy. American Antiquity 43:192-202.1983. Aspects of the spatial structure of theMayo Site (15-JO- 14), Johnson County,Kentucky. IN R. C. Dunnell and D. K.Grayson, eds., Lulu Linear Punctated: Essaysin Honor ofGeorge Irving Quimby, pp. 109-
165. Anthropological Papers No. 72, Museumof Anthropology, University of Michigan, AnnArbor.
Dunnell, R C., and T. L. Hunt 1990. Elementalcomposition and inference of ceramic vesselfunction. CurrentAnthropology 31(3):330-36.
Feathers, J. K 1990. Explaining the evolution ofprehistoric ceramics in southeastern Missouri.Ph.D. dissertation, University of Washington,Anm Arbor: University Microfilms.
Goldstein, J. I., D. E. Newbury, P. Echlin, D. C. Joy,C. Fiori, and E. Lifshin 1981. Scanning Elec-tron Microscopy and X-ray Microanalysis.New York: Plenum Press.
Graves, M., T. L. Hunt, and D. Moore 1990. Ce-ramic production in Mariana Islands: Explain-ing change and diversity in prehistoric interac-tion and exchange. Asian Perspectives 29:211-33.
Grayson, D. K 1984. Quantitative Zooarchaeology:Topics in the Analysis ofArchaeologicalFaunas. New York: Academic Press.1989. Sample size and relative abundance inarchaeological analysis: Illustrations from spiralfractures and seriation. IN R. D. Leonard andG. T. Jones, eds., pp.79-84,Quandfying Diver-sity in Archaeology. Cambridge: CambridgeUniversity Press.
Green, R. C. 1974. Excavation of the prehistoricoccupation of SU-SA-3. IN R. C. Green and J.Davidson, eds., Archaeology in WesternSamoa, Vol. II, pp. 108-154. Bulletin of theAuckland Institute and Museum No. 7.
Gren, R. C., and J. Davidson, eds., 1969 Archaeol-ogy in Western Samoa, Vol. I. Bulleting of theAuckland Institute and Museum No. 6.
Harbottle, G. 1976. Activation analysis in archaeol-ogy. Radiochemistry 3:33-72.
Hill, H. E., J. Evans, and M. Card 1985. Organicresidues on 3000-year-old potsherds fromNatunuku, Fiji. New Zealand Journal ofArchaeology 7:125-28.
Holmer, R 1980. Samoan ceramic analysis. IN J.Jennings and R. Holmer, eds., ArchaeologicalExcavations in Western Samoa, pp. 104-116.Pacific Anthrpological Records 32. Bernice P.Bishop Museum, Honolulu.
Hunt, T. L. 1988. Lapita ceramic technological andcompositional studies: A critical review. IN P.

Ceramics 149
V. Kirch and T. L. Hunt, eds., Archaeology ofthe Lapita Cultural Complex: A CriticalReview. pp. 48-59. Thomas Burke MemorialWashington State Museum Research ReportNo. 5. Seattle.
. 1989. Lapita Ceramic Exchange in the MussauIslands, Papua New Guinea. Ph.D. dissertation,University of Washington, Ann Arbor: Univer-sity Microfilms.
Hunt, T. L., and P. V. Kirch 1988. An archaeologicalsurvey of the Manu'a Islands, American Samoa.Journal of the Polynesian Society 97(2):153-83.
Irwin, G. J. 1985. The Emergence ofMailu. TerraAustalis, No. 10, Department of Prehistory,Research School ofPacific Studies. Canberra:Australian National University.
Jennings, J., and R. Holmer 1980. ArchaeologicalExcavations in Western Samoa. Pacific Andt-pological Records 32. Bernice P. BishopMuseum, Honolulu.
Kintigh, K. W. 1989. Sample size, significance, andmeasures of diversity. INR D. Leonard and G.T. Jones, eds., Quantifying Diversity in Archae-ology, pp. 25-36. Cambridge: CambridgeUniversity Press.
Kirch, P. V. 1988. Long-distance exchange andisland colonization. Norwegian ArchaeologicalReview 21:103-117.
. 1990. Specialization and exchange in the LapitaComplex of Oceania (1600-500 B.C.). AsianPerspectives 29:117-33.
Kirch, P. V., and P. Rosendahl 1973. Archaeologicalinvestigation of Anuta. IN D. E. Yen and J.Gordon, eds., Anuta: A Polynesian Outlier inthe Solonon Islands, pp. 25-108. PacificAnthropological Records No. 21 Honolulu:Bernice P. Bishop Museum
Kirch, P. V., and D. E. Yen 1982. Tikopia: ThePrehistory and Ecology ofa PolynesianOutlier. Bishop Museum Bulletin 238, Hono-lulu.
Kirch, P. V., T. L. Hunt, L. Nagaoka, and J. Tyler1990. An ancestral Polynesian occupation siteat To'aga, OfN Island, Ameuican Samoa.Archaeology in Oceania 25(1):1-15.
May, P., and M. Tuckson 1982. The TraditionalPottery ofPapua New Guinea. Sydney: BayBooks.
Neff, H., Bishop, R. L., and Arnold, D. E. 1988.Reconstructing ceramic production fromceramic compositional data: A Guatemalanexample. Journal ofFieldArchaeology 15:339-48.
Norusis, M. J. 1986. SPSS/PC+for the IBM PC/XT/AT. Chicago: SPSS Inc.
Postek, M. T., K. S. Howard, A. H. Johnson, andKL. McMichael 1980. Scanning ElectronMicroscopy: A Student's Handbook. LaddResearch Industries, Inc.
Rice, P. M. 1987. Pottery Analysis: A Sourcebook.Chicago: University of Chicago Press.
Rye, 0. S. 1981. Pottery Technology: Principles andReconstruction. Washington, D.C.: Taraxacum.
Sokal, R. R., and H. A. Sneath 1963. Principles ofNumerical Taxonomy. San Francisco: W. H.Freeman.
Stuiver, M., and P. Reimer 1986. A computerprogram for radiocarbon age calibration.Radiocarbon 28:1022-1030.
Topping, P. G., and A. B. MacKenzie 1988. A test ofthe use of neutron activation analysis for claysource characterization. Archaeometry 30:92-101.