Embed Size (px)
Citation preview

To Whom It May Concern: We certify under penalty of law that this document was prepared under our direction or supervision in accordance with a system designed to assure that qualified personnel properly gather and evaluate the information submitted. Based on our inquiry of the person or persons who manage the system, or those persons directly responsible for gathering the information, the information submitted is, to the best of our knowledge and belief, true, accurate, and complete. We are aware that there are significant penalties for submitting false information, including the possibility of fine and imprisonment for knowing violations.
James Scanlin, Alameda Countywide Clean Water Program
Tom Dalziel, Contra Costa Clean Water Program
Kevin Cullen, Fairfield-Suisun Urban Runoff Management Program
Matt Fabry, San Mateo Countywide Water Pollution Prevention Program
Adam Olivieri, Santa Clara Valley Urban Runoff Pollution Prevention Program
Lance Barnett, Vallejo Sanitation and Flood Control District
BASMAA
Regional Monitoring Coalition Creek Status and Long‐Term Trends Monitoring Plan
Prepared for:
The Bay Area Stormwater Management Agencies Association (BASMAA)
Prepared by:
EOA, Inc. on behalf of the Santa Clara Urban Runoff Pollution Prevention Program and the San Mateo Countywide Water Pollution Prevention Program Armand Ruby Consulting on behalf of the Contra Costa Clean Water Program
November 28, 2011
RMC Creek Status and Trends Monitoring Plan
ii
PREFACE AND ACKNOWLEDGEMENTS
This BASMAA Regional Monitoring Coalition (RMC) Creek Status and Trends Monitoring Plan is intended to provide a road map for monitoring activities conducted toward compliance with Provision C.8.c (Stauts Monitoring) and C.8.e (Long Term Monitoring) of the Municipal Regional Permit (MRP) adopted by the San Francisco Bay Regional Water Quality Control Board on October 14, 2009. The monitoring plan was developed under the oversight of a technical committee that consisted of:
Arleen Feng – Alameda Countywide Clean Water Program Chris Sommers (EOA, Inc) - Santa Clara Valley Urban Runoff Pollution Prevention Program Jamison Crosby - Contra Costa Clean Water Program Jon Konnan and Lucy Buchan (EOA, Inc.) - San Mateo Countywide Water Pollution Prevention
Program Kevin Cullen – Fairfield-Suisun Urban Runoff Management Program Janet O’hara and Kevin Lunde – San Francisco Bay Regional Water Quality Control Board

iii
TABLE OF CONTENTS 1.0 INTRODUCTION ........................................................................................................................................... 1
1.1 STUDY AREA ......................................................................................................................................................... 1 1.2 MONITORING QUESTIONS AND GENERAL APPROACH ..................................................................................................... 1
2.0 MONITORING DESIGN ................................................................................................................................ 3
2.1 CONDITION ASSESSMENT & PROBABILISTIC DESIGN ...................................................................................................... 4 2.2 STRESSOR ASSESSMENT ........................................................................................................................................... 6 2.3 ADDITIONAL MRP PROVISION C.8.C MONITORING ...................................................................................................... 8 2.4 TRENDS ASSESSMENT.............................................................................................................................................. 9
3.0 REPORTING & ASSOCIATED PRODUCTS ....................................................................................................... 11
3.1 ELECTRONIC DATA SUBMITTAL ................................................................................................................................ 11 3.2 URBAN CREEK MONITORING REPORTS ..................................................................................................................... 11 3.3 ASSOCIATED PRODUCTS ........................................................................................................................................ 12
4.0 SCHEDULE .................................................................................................................................................. 12
5.0 REFERENCES ............................................................................................................................................... 14
APPENDIX A. MUNICIPAL REGIONAL PERMIT PROVISIONS .............................................................................. A‐1
APPENDIX B. SAMPLE SIZE POWER ANALYSIS ................................................................................................. A‐2
APPENDIX C. EXAMPLE REPORT FIGURES ........................................................................................................ A‐3

iv
Acronyms ACCWP Alameda County Clean Water Program BASMAA Bay Area Stormwater Management Agency Association CCCWP Contra Costa Clean Water Program CEDEN California Environmental Data Exchange Network CRAM California Rapid Assessment Method FSURMP Fairfield Suisun Urban Runoff Management Program GRTS Generalized Random Tesselated Stratified MRP Municipal Regional Permit NAWQA National Water Quality Assessment NPDES National Pollution Discharge Elimination System PSA Perennial Stream Assessment QAPP Quality Assurance Project Plan RMC Regional Monitoring Coalition RMP Regional Monitoring Program RWQCB Regional Water Quality Control Board SCVURPPP Santa Clara Valley Urban Runoff Pollution Prevention Program SFEI San Francisco Estuary Institute SMCWPPP San Mateo County Water Pollution Prevention Program SOP Standard Operating Protocol SPoT Stream Pollution Trend Monitoring Program SWAMP Surface Water Ambient Monitoring Program
1
1.0 Introduction
In early 2010, several members of the Bay Area Stormwater Agencies Association (BASMAA) joined together to form the Regional Monitoring Coalition (RMC), to coordinate and oversee water quality monitoring required by the Municipal Regional National Pollutant Discharge Elimination System (NPDES) Stormwater Permit (MRP)1. The RMC includes the following participants:
Clean Water Program of Alameda County (ACCWP)
Contra Costa Clean Water Program (CCCWP)
San Mateo County Wide Water Pollution Prevention Program (SMCWPPP)
Santa Clara Valley Urban Runoff Pollution Prevention Program (SCVURPPP)
Fairfield‐Suisun Urban Runoff Management Program (FSURMP)
City of Vallejo and Vallejo Sanitation and Flood Control District (Vallejo) This plan describes the implementation activities associated with monitoring requirements included in MRP provisions C.8.c (Creek Status) and C.8.e (Creek Long‐Term Trends). Requirements associated with these provisions are included for reference in Appendix A (RWQCB 2009). The remainder of this section describes the RMC monitoring area and core management questions addressed by monitoring described in this plan. Section 2.0 provides a more detailed description of the planned monitoring approaches and management questions to be addressed. Section 3.0 discusses how results will be analyzed and reported, and briefly describes other documents associated with this Plan. Section 4.0 describes the planned schedule to complete RMC creek status and trends monitoring and Section 5.0 includes all references cited in this plan.
1.1 Study Area
Status and trends monitoring is being conducted in flowing water bodies (i.e., creeks, streams and rivers) interspersed among 3,407 square miles of land in the San Francisco Bay Area (i.e., the RMC area). The water bodies to be monitored by the RMC include all perennial and non‐perennial creeks and rivers that run through urban and non‐urban areas within the portions of the five participating counties that fall within the San Francisco Bay Water Board boundary, and the eastern portion of Contra Costa County that drains to the Central Valley region (Figure 1).
1.2 Monitoring Questions and General Approach
To date, San Francisco Bay Area Stormwater Programs have implemented monitoring designs that target creek reaches of interest to address site‐specific management questions. Because the representativeness of targeted data is unknown, the overall condition of all creek reaches in the Bay Area also remains unknown. The RMC has agreed to address this issue by augmenting targeted monitoring designs with a probabilistic creek status design that integrates many elements of the individualized monitoring programs that currently exist in the region.
1 The San Francisco Bay Regional Water Quality Control Board (SFRWQCB) issued the five‐year MRP to 76 cities, counties and flood control
districts (i.e., Permittees) in the Bay Area on October 14, 2009 (SFRWQCB 2009). The BASMAA programs supporting MRP Regional Projects include all MRP Permittees as well as the cities of Antioch, Brentwood, and Oakley which are not named as Permittees under the MRP but have voluntarily elected to participate in MRP‐related regional activities

2
The probabilistic and targeted creek status monitoring designs described in subsequent sections of this Plan comply with the MRP C.8.c2 and C.8.e provisions by addressing the core monitoring questions listed below. These monitoring designs allow each individual RMC participating program to assess stream ecosystem conditions within its Program area (County boundary) while contributing data to answer regional management questions about water quality and beneficial use condition in Bay Area creeks.
1. What is the condition of aquatic life in creeks in the San Francisco Bay Area; are water quality objectives met and are beneficial uses supported?
2. What are the major stressors to aquatic life? 3. What are the long‐term trends in water quality in creeks over time?
Figure 1: BASMAA Regional Monitoring Coalition (RMC) area and geographical extent of creeks.
2 The MRP states that Provision C.8.c status monitoring is intended to answer the following questions: “Are water quality objectives, both numeric and narrative, being met in local receiving waters, including creeks, rivers and tributaries?”; “Are conditions in local receiving waters supportive of or likely to be supportive of beneficial uses?”. The management questions described in this plan are intended to answer these questions.

3
2.0 Monitoring Design
This section describes the full scope of monitoring that will be conducted by MRP Permittees in compliance with MRP provisions C.8.c and C.8.e. Table 1 lists each chemical, biological and physical indicator that will be included as part of the RMC creek status and trends program, and the associated monitoring designs and reporting formats. With the exception of reporting (see Section 3.0), the monitoring attributes listed in Table 1 are further described in this section.
Table 1. Summary of creek status indicators, associated monitoring designs and scales of reporting.
Biological Response and Stressor Indicators
Monitoring Design Reporting
Regional Ambient
(Probabilistic)
Local (Targeted)
Regional Local
Bioassessment & Physical Habitat Assessment
X
X
Chlorine X
X
Nutrients X
X
Water Toxicity X X
Sediment Toxicity X X
Sediment Chemistry X X
General Water Quality X X
Temperature X X
Bacteria X X
Stream Survey X X
The various elements shown in Table 1 are organized into four categories in the sections that follow:
Condition Assessment and Description of the Probabilistic Monitoring Design: describes parameters that will be sampled to address the first core management question and the probabilistic monitoring design used to select sampling locations.
Stressor Assessment: describes the parameters that will be sampled to address the second core RMC management question and assess the extent and magnitude of chemical and physical stress on aquatic life in Bay Area creeks.
Additional MRP Provision C.8.c Monitoring: describes two parameters, pathogen indicators and stream surveys, that will be sampled or conducted to understand their relative concentrations and overall physical/ecological conditions, respectively.
Trends Assessment: describes the RMC plan to detect meaningful change in the concentrations of stream contaminants and their effects in large watersheds at time scales appropriate to management decision‐making by coordinating with the Statewide SWAMP Stream Pollution Trend Monitoring (SPoT) Program (SWRCB 2008).
4
2.1 Condition Assessment & Probabilistic Design
RMC participants will conduct a condition assessment to address the first core monitoring question (What is the condition of aquatic life use in creeks in the San Francisco Bay Area?) using two biological response indicators: benthic macroinvertebrates and algae. This question is addressed using a probabilistic monitoring design to establish a statistically representative understanding of the relative condition of aquatic life in wadable creeks in the RMC area. While the RMC area does not cover the entire San Francisco Bay Area, the monitoring question is stated in this manner in anticipation that the RMC monitoring area may be expanded in the future as additional stormwater programs become RMC participants. As currently designed, the ambient monitoring in the RMC area will provide information about the condition of aquatic life in the majority creeks in the San Francisco Bay Area.
The probabilistic survey is also designed to address the more specific management questions listed below. The results of condition assessment monitoring (i.e., bioassessments) will be compared to indicator thresholds (e.g., B‐IBI or biological objective scores) in order to estimate the extent and magnitude of aquatic life condition within the entire RMC area, and between counties (as data allow). Over time, comparisons will also be made between urban and non‐urban areas within the RMC area and within each county. To achieve such comparisons, the ambient design is stratified by general land use category (urban vs. non‐urban) and by county. This stratification allows the monitoring to address the following questions:
a. What is the condition of aquatic life in creeks within the RMC area? b. What is the condition of aquatic life in creeks within RMC participant counties? c. To what extent does the condition of aquatic life in urban and non‐urban creeks differ in the
RMC area? d. To what extent does the condition of aquatic life in urban and non‐urban creeks differ in each of
the RMC participating counties? The regional probabilistic design was developed using the Generalized Random Tessellation Stratified (GRTS) approach developed by the United States Environmental Protection Agency (USEPA) and Oregon State University (Stevens and Olson 2004). GRTS offers multiple benefits for coordinating amongst monitoring entities including the ability to develop a spatially balanced design that produces statistically representative data with known confidence intervals. The GRTS approach has been implemented recently in California by several agencies including the statewide Perennial Streams Assessment (PSA) conducted by the California’s Surface Water Ambient Monitoring Program (SWAMP) and the Southern California Stormwater Monitoring Coalition’s (SMC) regional monitoring program conducted by municipal stormwater programs in Southern California. For the purpose of developing the RMC’s probabilistic design, the RMC area is considered to represent the “sample universe”. 2.1.1 Site Selection
Sample sites were selected and attributed using the GRTS approach that utilized geographic information system (GIS) data layers, including a creek network, county and RWQCB boundaries, and urban and non‐urban land uses. These data layers provided the necessary information to form the RMC “sample frame”. The National Hydrography Dataset (1:100,000) was selected as the creek network data layer to provide consistency with both the Statewide PSA and the SMC and the opportunity for future data coordination with these programs. The RMC sample frame was classified by county and land use (i.e., urban and non‐urban) to allow for comparisons between these strata. Urban areas were delineated by
5
joining the urban area and city boundaries defined by the U.S. Census (2000). Non‐urban areas were defined as the remainder of the areas within the sample universe (RMC area).
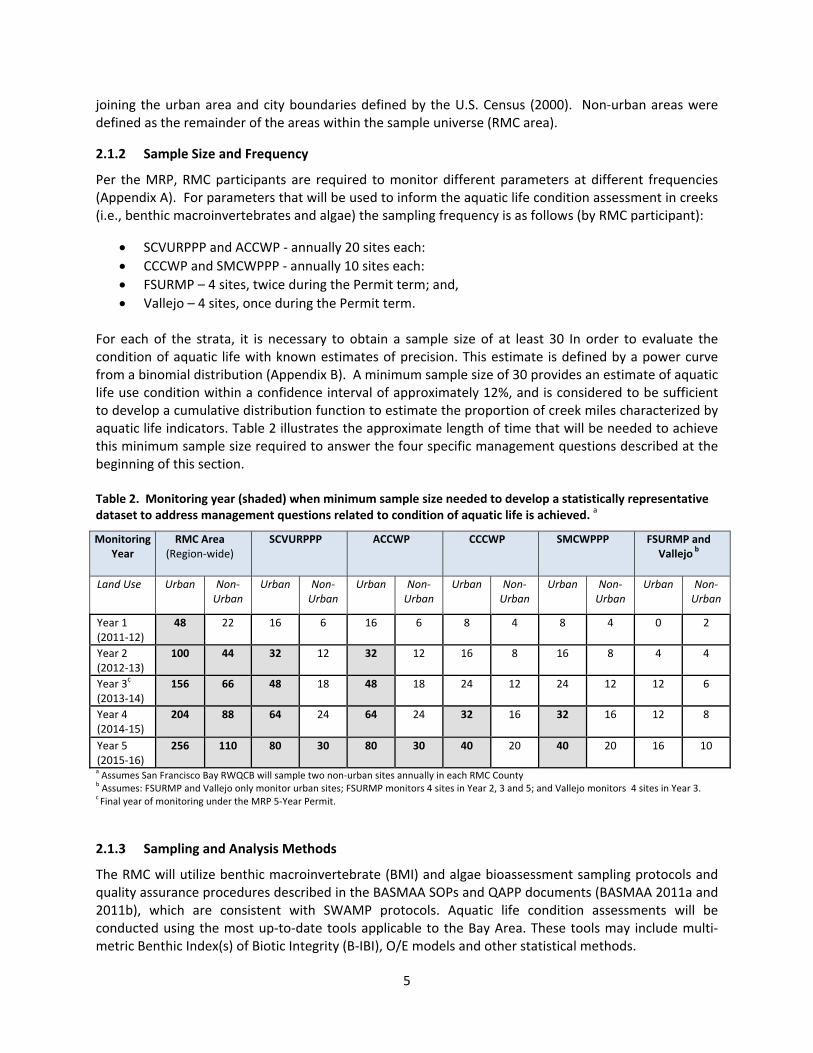
2.1.2 Sample Size and Frequency
Per the MRP, RMC participants are required to monitor different parameters at different frequencies (Appendix A). For parameters that will be used to inform the aquatic life condition assessment in creeks (i.e., benthic macroinvertebrates and algae) the sampling frequency is as follows (by RMC participant):
SCVURPPP and ACCWP ‐ annually 20 sites each:
CCCWP and SMCWPPP ‐ annually 10 sites each:
FSURMP – 4 sites, twice during the Permit term; and,
Vallejo – 4 sites, once during the Permit term.
For each of the strata, it is necessary to obtain a sample size of at least 30 In order to evaluate the condition of aquatic life with known estimates of precision. This estimate is defined by a power curve from a binomial distribution (Appendix B). A minimum sample size of 30 provides an estimate of aquatic life use condition within a confidence interval of approximately 12%, and is considered to be sufficient to develop a cumulative distribution function to estimate the proportion of creek miles characterized by aquatic life indicators. Table 2 illustrates the approximate length of time that will be needed to achieve this minimum sample size required to answer the four specific management questions described at the beginning of this section. Table 2. Monitoring year (shaded) when minimum sample size needed to develop a statistically representative dataset to address management questions related to condition of aquatic life is achieved. a
Monitoring Year
RMC Area (Region‐wide)
SCVURPPP ACCWP CCCWP SMCWPPP FSURMP and Vallejo b
Land Use Urban Non‐Urban
Urban Non‐Urban
Urban Non‐Urban
Urban Non‐Urban
Urban Non‐Urban
Urban Non‐Urban
Year 1 (2011‐12)
48 22 16 6 16 6 8 4 8 4 0 2
Year 2 (2012‐13)
100 44 32 12 32 12 16 8 16 8 4 4
Year 3c
(2013‐14) 156 66 48 18 48 18 24 12 24 12 12 6
Year 4 (2014‐15)
204 88 64 24 64 24 32 16 32 16 12 8
Year 5 (2015‐16)
256 110 80 30 80 30 40 20 40 20 16 10
a Assumes San Francisco Bay RWQCB will sample two non‐urban sites annually in each RMC County b Assumes: FSURMP and Vallejo only monitor urban sites; FSURMP monitors 4 sites in Year 2, 3 and 5; and Vallejo monitors 4 sites in Year 3.
c Final year of monitoring under the MRP 5‐Year Permit.
2.1.3 Sampling and Analysis Methods
The RMC will utilize benthic macroinvertebrate (BMI) and algae bioassessment sampling protocols and quality assurance procedures described in the BASMAA SOPs and QAPP documents (BASMAA 2011a and 2011b), which are consistent with SWAMP protocols. Aquatic life condition assessments will be conducted using the most up‐to‐date tools applicable to the Bay Area. These tools may include multi‐metric Benthic Index(s) of Biotic Integrity (B‐IBI), O/E models and other statistical methods.

6
2.2 Stressor Assessment
Stressor assessments described in this section address the second core RMC management question: (What are the major stressors to aquatic life?). Indicators listed in Table 3 will be used by the RMC to assess the extent and magnitude of chemical and physical stress on aquatic life in Bay Area creeks.
Table 3. Stressor indicators and parameters measured for the stressor assessment.
Stressor Indicator Monitoring Design Type
Measured Parameters
In‐stream Physical Habitat (PHAB)
Probabilistic Multiple, including average substrate size and wetted width, habitat type, epifaunal substrate, sediment deposition, and channel alteration.
General Water Quality Targeted Grab samples and continuous water quality monitoring of dissolved oxygen, temperature, conductivity and pH
Nutrients Probabilistic Grab samples of total phosphorus, dissolved orthophosphate, total nitrogen, nitrate, ammonia, silica, chloride, dissolved organic carbon, and suspended sediment concentrations
Chlorine Probabilistic Grab samples of free and total chlorine
Temperature Targeted Continuous temperature monitoring at 60‐minute intervals during the spring, summer and fall.
Water toxicity Probabilistic Selenastrum growth; Ceriodaphinia and Pimephales with lethal and sublethal endpoints; Hyallella azteca with lethal endpoint
Sediment toxicity Probabilistic Hyallella azteca with lethal endpoint
Sediment chemistry Probabilistic Copper, nickel, mercury, zinc, lead, chromium, cadmium, arsenic, PCBs, PAHs, DDT, chlordane, dieldrin, pyrethroid pesticides, grain size and total organic carbon
2.2.1 Site Selection
RMC participants will measure physical habitat, nutrients, chlorine, water and sediment toxicity, and sediment chemistry annually at a subset (Table 4) of the bioassessment sites selected and monitored via the probabilistic monitoring design. Due to the relatively small number of sites sampled annually for these parameters, analyses will be limited in scope until representative sample sizes are achieved. Stressor indicators sampled at sites selected using a probabilistic monitoring design will address the following management questions: a. What are ranges of physical habitat, nutrients, chlorine, water toxicity, sediment toxicity,
sediment chemistry in the RMC area? b. Are there correlations between physical habitat, nutrients, chlorine, water toxicity, sediment
toxicity, or sediment chemistry and aquatic life condition?
Stressor indicators that will be monitored at targeted sites selected by RMC participating programs include continuous general water quality (temperature, pH, conductivity and dissolved oxygen) using a multi‐parameter probe for 15‐minute intervals, and continuous temperature using a digital temperature logger for 60‐minute intervals. Targeted monitoring of such parameters will address the following management questions: c. What is the range of general water quality measurements at targeted sites of interest? d. Do general water quality measurements indicate potential impacts to aquatic life?

7
As such, useful targeted sites may include those in urban stream locations where fisheries concerns such as migration or juvenile habitat are important. 2.2.2 Sample Size and Frequency
The MRP (see Appendix A) requires RMC participants to conduct creek status monitoring at specified frequencies. Table 4 lists the annual sampling frequency by RMC participants for parameters that will be used to inform the stressor assessments.
Table 4. Annual sampling frequency for parameters used to inform the stressor assessment.
Stressor Indicator Season SCVURPPP ACCWP CCCWP SMCWPPP FSURMPa Vallejob
Physical Habitat Spring 20 20 10 10 4 4
General Water Quality (Grab) Spring 20 20 10 10 4 4
Nutrients Spring 20 20 10 10 4 4
Chlorine
Spring 20 20 10 10 2 2
Dry Season 3 3 2 2 1 1
Water Toxicity Dry Season 3 3 2 2 1 1
Storm Event 3 3 2 2 1 1
Sediment Toxicity Dry Season 3 3 2 2 1 1
Sediment Chemistry Dry Season 3 3 2 2 1 1
General Water Quality (Continuous)
Dry Season 3 3 2 2 1 1
Temperature (Continuous) Dry Season 8 8 4 4 1 1
a Sites to be sampled twice during the Permit term. b Sites to be sampled once during the Permit term.
2.2.3 Sampling and Analysis Methods
The RMC will utilize sampling protocols and quality assurance procedures described in the BASMAA SOPs and QAPP (BASMAA 2011a and 2011b). All protocols and procedures are consistent with SWAMP. Stressor indicator data will be analyzed in order to develop a better understanding of the potential for a stressor to impact aquatic life in Bay Area creeks, both at the individual site and at broader scales where feasible. Tools that may be used to assess stressor impact at the site and regional scale include relative risk indices (Van Sickle et al. 2006) and population attributable risk indices (Van Sickle and Paulsen 2008), as well as comparisons to water quality objectives. Relative risk indices measure the site effect of a given stressor indicator on a condition (response) indicator (in this case BMIs and algae), while population attributable risk indices measure the relative effects of aquatic stressors at the county or regional scales. Examples of relative and attributable risk outputs are illustrated in Appendix C. Water quality objective exceedances will trigger follow‐up stressor/source identification monitoring projects (no more than ten during the 2009 – 2014 permit term, two of which must be toxicity follow‐ups, unless monitoring results do not indicate the presence of toxicity).

8
2.3 Additional MRP Provision C.8.c Monitoring
Two additional parameters, pathogen indicators and stream surveys, will be sampled or conducted, respectively, at sites selected using a targeted design (pathogens) or either a targeted or probabilistic design (stream surveys). Pathogen indicators will be collected and analyzed to address the following management question:
1) What are the pathogen indicator concentrations at creek sites where water contact recreation may occur?
Stream surveys will be conducted to assess the overall physical and/or ecological conditions of creek reach and specific point impacts within each reach. Additional information on protocols that may be used to conduct stream surveys is provided in Section 2.3.3. Stream surveys conducted using the Unified Stream Assessment protocol (Center for Watershed Protection 2005) will be based on a targeted monitoring design. Stream surveys using the CRAM protocol (Collins et al. 2008) may be based on a probabilistic or targeted monitoring design.
2.3.1 Site Selection
Participating RMC programs will choose their targeted sites to collect pathogen indicators and conduct stream surveys based on program or water body specific management questions. For pathogen indicators, it is recommended that participating programs choose monitoring sites at high priority creek locations where full body contact recreation (e.g., swimming) has been known to occur. Recommended locations for stream surveys include creek reaches where there is a potential for restoration, stressor identification projects may occur, or initial information is needed on the physical habitat quality and water quality impacts in a creek reach of interest.
2.3.2 Sample Size and Frequency
Pathogen indicators will be sampled and stream surveys conducted at a frequency consistent with the MRP (Table 5).
Table 5. Annual number of pathogen indicator monitoring sites and stream survey miles required by the MRP.
Indicators SCVURPPP ACCWP CCCWP SMCWPPP FSURMP & Vallejo
E.coli and Fecal Coliform (sites) 5 5 5 5 3a
Stream Survey (miles) 9 9 6 6 3
a Sites to be sampled twice during the Permit term.
2.3.3 Sampling and Analysis Methods
Fecal coliform and E. coli will be sampled using methods described in the BASMAA SOPs (BASMAA 2011a). Stream surveys may be conducted using the Unified Stream Assessment protocol (Center for Watershed Protection 2005) or an equivalent method such as the California Rapid Assessment Method (Collins et al. 2008). Both of these methods are briefly described below.
The USA protocol assesses overall creek reach conditions and specific point impacts within each reach. To assess conditions within a creek reach a continuous upstream walk is conducted, during which time information is collected about stream corridor conditions, such as average bank stability, in‐stream and
9
riparian habitat, and floodplain connectivity. Parameters are scored on a continuous scale and summarized as a weighted average to reflect overall in‐stream condition, overall buffer and floodplain condition, and overall reach condition. In addition to assessing reach‐wide conditions, notable impacts occurring within each reach are recorded on separate forms. Eight categories of impacts are included in the USA: 1) severe stream erosion, 2) impacted stream buffers, 3) utilities, 4) trash and debris, 5) stream crossings, 6) channel modifications, 7) stormwater outfalls, and 8) a catch‐all category for miscellaneous features. To assess sites with potential recreational uses, a ninth assessment form was developed by EOA (2008). CRAM (Collins et al. 2008) is a cost‐effective, standard ambient monitoring and assessment tool that can be used to assess ecological condition on a variety of scales, ranging from individual wetlands to watersheds and larger regions. CRAM enables practitioners, working together in the field for one half day or less, to assess the overall health of a wetland by choosing the best‐fit set of narrative descriptions of observable conditions ranging from the worst commonly observed to the best achievable for the type of wetland being assessed. CRAM yields an overall score for each assessed area based on the component scores for the attributes and their metrics. The overall score for a wetland indicates how it is doing relative to the best achievable conditions for that wetland type in the state. CRAM also provides guidelines for identifying stressors that might account for low scores.
2.4 Trends Assessment
The RMC plans to use the monitoring conducted by the Statewide SWAMP Stream Pollution Trend Monitoring (SPoT) Program (SWRCB 2008) to comply with MRP provision C.8.e that requires ACCWP, CCCWP, SCVURPPP, and SMCWPPP to sample one location annually to monitor long‐term trends. The goal of the SPoT Program is to detect meaningful change in the concentrations of stream contaminants and their effects in large watersheds at time scales appropriate to management decision‐making, and more specifically to:
Determine long‐term trends in stream pollutant concentrations and their biological effects statewide;
Relate water quality indicators to land‐use characteristics and to the effectiveness of agency management efforts; and,
Establish a network of sites throughout the state to serve as a backbone for collaboration with local, regional, and federal monitoring programs.
The five management questions SPoT is designed to address are:
1. Which contaminants are detected in depositional stream sediments, and in which large
California watersheds are they detected? 2. In which large California watersheds is sediment toxicity observed? 3. What is the relationship between pollutant concentrations and watershed land use
characteristics? 4. What is the relationship between pollutant concentrations and the level of management
activity?
5. What is the direction and magnitude of change in pollutant concentrations and toxicity over multi‐year time periods?

10
If for some reason the SPoT program is unable to fulfill the long‐term trend monitoring requirements described in the MRP, RMC participants will begin conducting monitoring in compliance with these requirements. 2.4.1 Site Selection
To detect long‐term trends, 100 monitoring sites (statewide) were selected by the SPoT Program at points where contaminants released throughout large watersheds are likely to accumulate. These sites are similar to the “integrator” sites used in the United States Geological Survey’s National Water Quality Assessment (NAWQA) program. Sites were originally selected based on hydrology, land use, and the needs of partner programs. The sites were then visited for reconnaissance to find a 100‐m reach within which there are at least five to ten depositional areas from which fine‐grained sediment can be collected. To select adequate reaches, the actual sampling location can be moved 1 km or more upstream or (usually) downstream of the original target sites. Table 5 describes locations on water bodies in the RMC area where the SPoT Program has recently and plans to continue, to monitor. Please note that the FSURMP and Vallejo do not have long‐term monitoring requirements and therefore associated long‐term monitoring requirements are not listed in Table 6.
Table 6. Long‐term monitoring locations monitored by the SWAMP’s statewide Stream Pollution Trend Monitoring (SPoT) Program.
RMC Participant Water Body Suggested Location
SCVURPPP Guadalupe River or USGS Gaging Station 11169025
Coyote Creek Montague
ACCWP Alameda Creek or East of Alvarado Boulevard
Lower San Leandro Creek Empire Road
CCCWP Kirker Creek or Floodway
Walnut Creek Concord Avenue
SMCWPPP San Mateo Creek Gateway Park
2.4.2 Sample Frequency
Long‐term monitoring will be conducted through SPoT annually during base flow or near‐base flow conditions following annual peak flows. The intent is to collect depositional sediment that has been recently transported from watershed surfaces, but is not subject to extreme variation due to storm events. In the RMC area, this time period is late spring to early summer. 2.4.3 Sampling and Analysis Methods
Under the SPoT Program, sediment samples are collected and analyzed according to the Standard Operating Procedures (SOPs) described in the SPoT specific Quality Assurance Program Plan (SWAMP 2010). If RMC participants should undertake long‐term trends monitoring in compliance with the MRP, standard operating and quality control procedures described in BASMAA (2011a and 2011b) will be followed. These procedures are consistent with SWAMP’s.
Regardless of the lead monitoring program, natural variability in sediment pollutant concentrations is expected and will be addressed by compositing sediment from five to ten depositional areas in the 100‐
11
m reach that comprises each site. Sampling will focus on recent sediment deposits in active areas of the streambed and avoid banks, benches, and other areas where sediment may have been deposited more than one year previously. Sediment will be sampled to a depth of up to 5 cm if the entire 5 cm core is homogeneous and appears to have been deposited within the same hydrologic cycle of seasonal high water receding to annual base flow. Surficial sediment as shallow as 1 cm may need to be collected if there is clear layering indicating deposition over multiple annual cycles.
3.0 Reporting & Associated Products
This section describes the reporting products and formats that will be developed by RMC participants and submitted to the San Francisco Bay RWQCB in compliance with MRP provision C.8.g.
3.1 Electronic Data Submittal All monitoring data (targeted and probabilistic) collected October 1 to September 30 will be submitted annually to the Water Board and to the CEDEN data node at SFEI by each RMC participant no later than
January 15 of the following year. Data will be submitted as an Electronic Status Monitoring Data Report to the Water Board in a standardized format comparable with the SWAMP database. Water quality exceedences will be highlighted in this report. The first electronic data submittal of monitoring data to the Regional Board will occur by January 15, 2013.
3.2 Urban Creek Monitoring Reports Annually, creek status and trends monitoring results will be analyzed and synthesized into one regional report and a series of local assessment reports specific to each RMC participant’s monitoring. Reports will summarize monitoring conducted during the foregoing October 1 to September 30 period and will be submitted to the Water Board by March 15 following this period. The initial RMC reports will be submitted by March 15, 2013.
No later than March 15, 2014, RMC participants shall also prepare and submit local and regional integrated monitoring reports3 that summarize all data collected during the term of the MRP.
All monitoring reports shall include the standard content as described below:
The purpose of the monitoring and brief description of the study area and study design rationale;
Quality Assurance/Quality Control summaries for sample collection and analytical methods, including a discussion of any limitations of the data;
Brief descriptions of sampling protocols and analytical methods;
Sample location description, including water body name and segment and latitude and longitude coordinates;
Sample ID, collection date (and time if relevant), media (e.g., water, filtered water, bed sediment, tissue);
Concentrations detected, measurement units and detection limits.
Results will be discussed relative to prior conditions, beneficial uses, and applicable water quality standards as described in Table 8.1 of the MRP (see Appendix A), the Basin Plan (RWQCB), the Ocean
3 Urban Creek Monitoring Reports due March 14, 2014 will be included as part of the Integrated Report.
12
Plan (SWRCB 2005), the California Toxics Rule (Federal Register 1997), or other applicable water quality control plans. Where appropriate, hypotheses should be developed to investigate potential pollutant sources, trends, and BMP effectiveness. Reports will identify and prioritize water quality problems, sources of water quality problems, describe follow‐up actions and any additional management actions needed to address water quality problems, and evaluate the effectiveness of existing control measures. 3.2.1 Regional Urban Creeks Monitoring Report
The Regional San Francisco Bay Urban Creeks Monitoring Report will include an assessment of the following condition and stressor indicators (see Table 1): benthic macroinvertebrates, algae, nutrients, chlorine, water toxicity, sediment toxicity, and sediment chemistry. Results for each indicator will be presented by their respective evaluation methods (see Chapter 2) across the four spatial scales indicated in the management questions, e.g., RMC area, RMC area by urban/non‐urban land use, RMC participant county, and RMC participant county by urban/non‐urban land use. Results of the relative risk analyses for these stressor indicators will also be presented in the regional report (see Appendix C for examples). Monitoring results will be presented in a variety of formats including text, tables, graphs, and maps (see Appendix C for examples) to address the management questions related to the condition and stressor assessments.
3.2.2 Local Urban Creeks Monitoring Reports
At a minimum, the local reports produced by each RMC participant will include an assessment of all monitoring data collected via a targeted design. Targeted parameters (listed in Table 1) include general water quality (continuous), temperature (continuous), pathogen indicators, and stream surveys. Results for stressor indicators sampled using a targeted monitoring design will be summarized in tables and graphs highlighting the number of samples exceeding applicable water quality standards as described in Table 8.1 of the MRP (see Appendix A). Results of the relative risk analyses will be presented for targeted stressor indicators as graphs (see Appendix C). Long‐term trend data will be summarized, as feasible4, with any apparent trends in stormwater or receiving water quality.
3.3 Associated Products
In parallel to the development of this plan, three other “sister” products were also developed:
RMC Creek Status and Trends Quality Assurance Project Plan (QAPP) (BASMAA 2011a);
Standard Operating Procedures (SOPs) for field monitoring, site reconnaissance and reporting (BASMAA 2011b); and
Creek Status and Trends Information Management System Work Plan (BASMAA 2011c).
4.0 Schedule
The creek status monitoring discussed in previous chapters will be conducted according to the schedule shown in Table 7. Note that Table 7 illustrates the monitoring schedule for a five‐year timeframe (2011 to 2016) although the MRP term ends in 2014. The five‐year timeframe is shown in order to establish a longer‐term schedule that can be implemented to produce data necessary to answer the management questions set forth in this plan.
4 Depending on the timing of its availability from the SPoT Program.

RMC Creek Status and Trends Monitoring Plan
13
Table 7. RMC Creek Status and Long-Term Trends Monitoring Schedule
Jun
Jul
Aug
Sept
Oct
Nov
Dec
Jan
Feb
Mar
Apr
Ma y
Jun
Jul
Aug
Sept
Oct
Nov
Dec
Jan
Feb
Mar
Apr
Ma y
Jun
Jul
Aug
Sept
Oct
Nov
Dec
Jan
Feb
Mar
Apr
Ma y
Jun
Jul
Aug
Sept
Oct
Nov
Dec
Jan
Feb
Mar
Apr
Ma y
Jun
Jul
Aug
Sept
Oct
Nov
Dec
Jan
Feb
Mar
Apr
Ma y
Jun
Jul
Aug
Sept
Oct
Nov
Dec
Regional Ambient Creek
Sample Draw • • • • • •Ambient Creek Site
Evaluation • • • • • • • • • • • •
Storm Event Sampling • • • • • • • • • • • • • • • • • • • • • • • • • • • • • • • • • • •
Dry Season Sampling • • • • • • • • • • • • • • • • • • • • • • • • •
Spring Season Sampling • • • • • • • • • • • • • • •
Dry Season Sampling • • • • • • • • • • • • • • •
Laboratory Analysis • • • • • • • • • • • • • • • • • • • • • • • • • • • • • • • • • • • • • • • • • • • • • • • • • • • • • • • • • • • • • • •Information
Management • • • • • • • • • • • • • • • • • • • • • • • • • • • • • • • • • • • • • • • • • • • • • • • • • • • • • • • • • • • • • • •
Data Analysis • • • • • • • • • • • • • • • • • • • • • • • • • • • • • • • • • • • • • • •
Electronic Data
Submittal • • • •Monitoring Progress
Report • • •Regional Urban Creeks
Monitoring Report
Submittal• • • •
Local Creeks Monitoring
Report Submittal • • • •
Long‐Term Trends Monitoring
Analysis and Information Management
Reporting
Creek Status (Condition and Stressor Assessments)
2016Task
2011 2012 2013 2014 2015

RMC Creek Status and Trends Monitoring Plan
14
5.0 References
Bay Area Stormwater Agencies Association (BASMAA) 2011a. Creek Status Monitoring Program. Quality Assurance Project Plan. BASMAA Regional Monitoring Coalition. DRAFT.
Bay Area Stormwater Agencies Association (BASMAA) 2011b. Creek Status Monitoring Program. Standard Operating Procedures. BASMAA Regional Monitoring Coalition. DRAFT.
Bay Area Stormwater Agencies Association (BASMAA) 2011c. Creek Status and Trends Information Management System Work Plan. BASMAA Regional Monitoring Coalition. DRAFT.
Center for Watershed Protection 2005. Manual 10 Unified Stream Assessment: A User’s Manual. 102 pp plus appendices.
Collins, J.N., E.D. Stein, M. Sutula, R. Clark, A.E. Fetscher, L. Grenier, C. Grosso, and A. Wiskind. 2008. California Rapid Assessment method (CRAM) for Wetlands, V. 5.0.2. 157 pp.
EOA, Inc. 2008. The Unified Stream Assessment: Potential Uses for Stormwater Programs, San Francisco Bay Area Examples. 25 pp.
Federal Register. 1997. Water Quality Standards; Establishment of Numeric Criteria for Priority Toxic Pollutants for the State of California. Volume 62, Number 150: 42159‐42208.
Regional Water Quality Control Board (RWQCB). 2007. San Francisco Bay Basin (Region 2) Water Quality Control Plan. Oakland, CA.
Regional Water Quality Control Board (RWQCB). 2009. California Regional Water Quality Control Board San Francisco Bay Region Municipal Regional Stormwater NPDES Permit Order R2‐2009‐0074 NPDES Permit No. CAS612008 October 14, 2009. 279 pp.
State Water Resources Control Board (SWRCB). 2008. SWAMP Statewide Stream Pollutant Trend Monitoring at Integrator Sites. Monitoring Plan.
State Water Resources Control Board (SWRCB). 2010. SWAMP Statewide Stream Pollutant Trend Monitoring at Integrator Sites. Quality Assurance Project Plan.
Stevens, D.L. Jr., and A.R. Olsen. 2004. Spatially balanced sampling of natural resources. Journal of the American Statistical Association 99(465): 262‐278.
Van Sickle, J. Stoddard, J.L., Paulsen, S.G., Olsen A.R. 2006. Using relative risk of aquatic stressors at a regional scale. Environmental Management 38: 1020‐1030.
Van Sickle, John and Steven G. Paulsen. 2008. Assessing the attributable risks, relative risks, and regional extents of aquatic stressors. Journal of North American Benthological Society 27(4): 920‐931.

A‐1
Appendix A. Municipal Regional Permit Provisions

Municipal Regional Stormwater Permit NPDES No. CAS612008 Order No. R2-2009-0074 Provision C.8.
Provision C.8. Page 64 Date: October 14, 2009
C.8. Water Quality Monitoring
C.8.a. Compliance Options i. Regional Collaboration – All Permittees shall comply with the monitoring
requirements in C.8, however, Permittees may choose to comply with any requirement of this Provision through a collaborative effort to conduct or cause to be conducted the required monitoring in their jurisdictions. Where all or a majority of the Permittees collaborate to conduct water quality monitoring, this shall be considered a regional monitoring collaborative.
Where an existing collaborative body has initiated plans, before the adoption of this Permit, to conduct monitoring that would fulfill a requirement(s) of this Provision, but the monitoring would not meet this Provision’s due date(s) by a year or less, the Permittees may request the Executive Officer adjust the due date(s) to synchronize with such efforts.
The types, quantities, and quality of data required within Provision C.8 establish the minimum level-of-effort that a regional monitoring collaborative must achieve. Provided these data types, quantities, and quality are obtained, a regional monitoring collaborative may develop its own sampling design. For Pollutants of Concern and Long-Term monitoring required under C.8.e, an alternative approach may be pursued by Permittees provided that: either similar data types, data quality, data quantity are collected with an equivalent level of effort described under C.8.e; or an equivalent level of monitoring effort is employed to answer the management information needs stated under C.8.e.
ii. Implementation Schedule – Monitoring conducted through a regional monitoring collaborative shall commence data collection by October 2011. All other Permittee monitoring efforts shall commence data collection by October 2010. By July 1, 2010, each Permittee shall provide documentation to the Water Board, such as a written agreement, letter, or similar document that confirms whether the Permittee will conduct monitoring individually or through a regional monitoring collaborative.19
iii. Permittee Responsibilities – A Permittee may comply with the requirements in Provision C.8 by performing the following:
(1) Contributing to its stormwater countywide program, as determined appropriate by the Permittee members, so that the stormwater countywide Program conducts monitoring on behalf of its members;
(2) Contributing to a regional collaborative effort;
19 This documentation will allow the Water Board to know when monitoring will commence for each Permittee.
Permittees who commit to monitoring individually may join the regional monitoring collaborative at any time. Any Permittee who discontinues monitoring through the regional collaborative must commence complying with all requirements of Provision C.8 immediately.
Municipal Regional Stormwater Permit NPDES No. CAS612008 Order No. R2-2009-0074 Provision C.8.
Provision C.8. Page 65 Date: October 14, 2009
(3) Fulfilling monitoring requirements within its own jurisdictional boundaries; or
(4) A combination of the previous options, so that all requirements are fulfilled.
iv. Third-party Monitoring – Permittees may choose to fulfill requirements of Provision C.8 using data collected by citizen monitors or other third-party organizations, provided the data are demonstrated to meet the data quality objectives described in Provision C.8.h. Where an existing third-party organization has initiated plans to conduct monitoring that would fulfill a requirement(s) of this Provision, but the monitoring would not meet this Provision’s due date(s) by a year or less, the Permittees may request that the Executive Officer adjust the due date(s) to synchronize with such efforts.
C.8.b. San Francisco Estuary Receiving Water Monitoring With limited exceptions, urban runoff from the Permittees’ jurisdictions ultimately discharges to the San Francisco Estuary. Monitoring of the Estuary is intended to answer questions20 such as:
• Are chemical concentrations in the Estuary potentially at levels of concern and are associated impacts likely?
• What are the concentrations and masses of contaminants in the Estuary and its segments?
• What are the sources, pathways, loadings, and processes leading to contaminant related impacts in the Estuary?
• Have the concentrations, masses, and associated impacts of contaminants in the Estuary increased or decreased?
• What are the projected concentrations, masses, and associated impacts of contaminants in the Estuary?
Permittees shall participate in implementing an Estuary receiving water monitoring program, at a minimum equivalent to the San Francisco Estuary Regional Monitoring Program for Trace Substances (RMP), by contributing their fair-share financially on an annual basis.
C.8.c. Status Monitoring/Rotating Watersheds i. Status Monitoring is intended to answer these questions: Are water quality
objectives, both numeric and narrative, being met in local receiving waters,
20 These are the management questions approved by the Regional Monitoring Program’s Steering Committee on
May 9, 2008, and stated at http://www.sfei/rmp/rmp_steering_meetings/rmp_steering_meeting_5_09_08/Item%2010a%20Attachment%201%20%20Draft%20RMP%20Management%20Questions%2005-02-08%20Annotated.pdf. While the stated objectives may change over time, the intent of this provision is for Permittees to continue contributing financially and as stakeholders in such a program as the RMP, which monitors the quality of San Francisco Bay.
Municipal Regional Stormwater Permit NPDES No. CAS612008 Order No. R2-2009-0074 Provision C.8.
Provision C.8. Page 66 Date: October 14, 2009
including creeks, rivers and tributaries? Are conditions in local receiving waters supportive of or likely to be supportive of beneficial uses?
ii. Parameters and Methods – Permittees shall conduct Status Monitoring using the parameters, methods, occurrences, durations, and minimum number of sampling sites as described in Table 8.1. Spring sampling shall be conducted during the April - June timeframe; dry weather sampling shall be conducted during the July - September timeframe. Minor variations of the parameters and methods may be allowed with Executive Officer concurrence.
iii. Frequency – Permittees shall complete the Status Monitoring in Table 8.1 at the following frequencies:
• Alameda Permittees – annually
• Contra Costa Permittees – annually
• Fairfield-Suisun Permittees – twice during the Permit term
• San Mateo Permittees – annually
• Santa Clara Permittees – annually
• Vallejo Permittees – once during the Permit term
Municipal Regional Stormwater Permit NPDES No. CAS612008 Order No. R2-2009-0074 Provision C.8.
Provision C.8. Page 67 Date: October 14, 2009
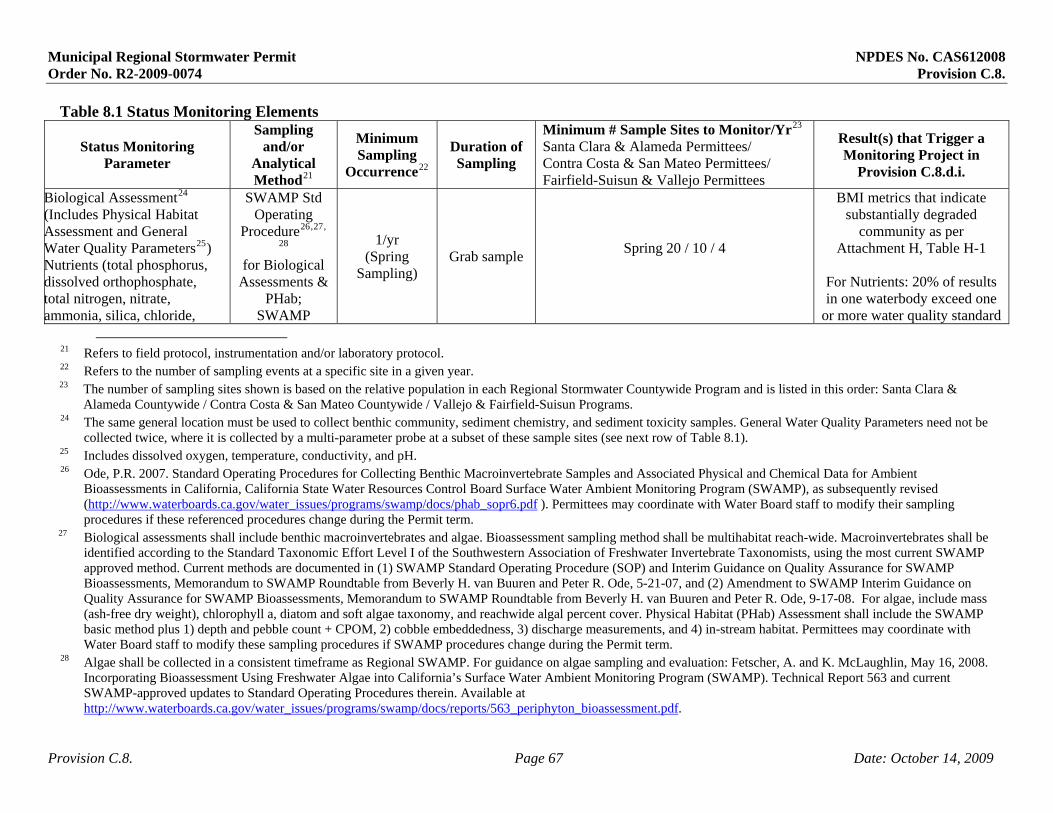
Table 8.1 Status Monitoring Elements
Status Monitoring Parameter
Sampling and/or
Analytical Method21
Minimum Sampling
Occurrence22
Duration of Sampling
Minimum # Sample Sites to Monitor/Yr23 Santa Clara & Alameda Permittees/ Contra Costa & San Mateo Permittees/ Fairfield-Suisun & Vallejo Permittees
Result(s) that Trigger a Monitoring Project in
Provision C.8.d.i.
Biological Assessment24 (Includes Physical Habitat Assessment and General Water Quality Parameters25) Nutrients (total phosphorus, dissolved orthophosphate, total nitrogen, nitrate, ammonia, silica, chloride,
SWAMP Std Operating
Procedure26,27,
28
for Biological Assessments &
PHab; SWAMP
1/yr (Spring
Sampling) Grab sample
Spring 20 / 10 / 4
BMI metrics that indicate substantially degraded
community as per Attachment H, Table H-1
For Nutrients: 20% of results in one waterbody exceed one
or more water quality standard
21 Refers to field protocol, instrumentation and/or laboratory protocol. 22 Refers to the number of sampling events at a specific site in a given year. 23 The number of sampling sites shown is based on the relative population in each Regional Stormwater Countywide Program and is listed in this order: Santa Clara &
Alameda Countywide / Contra Costa & San Mateo Countywide / Vallejo & Fairfield-Suisun Programs. 24 The same general location must be used to collect benthic community, sediment chemistry, and sediment toxicity samples. General Water Quality Parameters need not be
collected twice, where it is collected by a multi-parameter probe at a subset of these sample sites (see next row of Table 8.1). 25 Includes dissolved oxygen, temperature, conductivity, and pH. 26 Ode, P.R. 2007. Standard Operating Procedures for Collecting Benthic Macroinvertebrate Samples and Associated Physical and Chemical Data for Ambient
Bioassessments in California, California State Water Resources Control Board Surface Water Ambient Monitoring Program (SWAMP), as subsequently revised (http://www.waterboards.ca.gov/water_issues/programs/swamp/docs/phab_sopr6.pdf ). Permittees may coordinate with Water Board staff to modify their sampling procedures if these referenced procedures change during the Permit term.
27 Biological assessments shall include benthic macroinvertebrates and algae. Bioassessment sampling method shall be multihabitat reach-wide. Macroinvertebrates shall be identified according to the Standard Taxonomic Effort Level I of the Southwestern Association of Freshwater Invertebrate Taxonomists, using the most current SWAMP approved method. Current methods are documented in (1) SWAMP Standard Operating Procedure (SOP) and Interim Guidance on Quality Assurance for SWAMP Bioassessments, Memorandum to SWAMP Roundtable from Beverly H. van Buuren and Peter R. Ode, 5-21-07, and (2) Amendment to SWAMP Interim Guidance on Quality Assurance for SWAMP Bioassessments, Memorandum to SWAMP Roundtable from Beverly H. van Buuren and Peter R. Ode, 9-17-08. For algae, include mass (ash-free dry weight), chlorophyll a, diatom and soft algae taxonomy, and reachwide algal percent cover. Physical Habitat (PHab) Assessment shall include the SWAMP basic method plus 1) depth and pebble count + CPOM, 2) cobble embeddedness, 3) discharge measurements, and 4) in-stream habitat. Permittees may coordinate with Water Board staff to modify these sampling procedures if SWAMP procedures change during the Permit term.
28 Algae shall be collected in a consistent timeframe as Regional SWAMP. For guidance on algae sampling and evaluation: Fetscher, A. and K. McLaughlin, May 16, 2008. Incorporating Bioassessment Using Freshwater Algae into California’s Surface Water Ambient Monitoring Program (SWAMP). Technical Report 563 and current SWAMP-approved updates to Standard Operating Procedures therein. Available at http://www.waterboards.ca.gov/water_issues/programs/swamp/docs/reports/563_periphyton_bioassessment.pdf.

Municipal Regional Stormwater Permit NPDES No. CAS612008 Order No. R2-2009-0074 Provision C.8.
Provision C.8. Page 68 Date: October 14, 2009
Status Monitoring Parameter
Sampling and/or
Analytical Method21
Minimum Sampling
Occurrence22
Duration of Sampling
Minimum # Sample Sites to Monitor/Yr23 Santa Clara & Alameda Permittees/ Contra Costa & San Mateo Permittees/ Fairfield-Suisun & Vallejo Permittees
Result(s) that Trigger a Monitoring Project in
Provision C.8.d.i.
dissolved organic carbon, suspended sediment concentration)
comparable methods for
Nutrients
or established threshold
General Water Quality29Multi-
Parameter Probe
2/yr (Concurrent
with bioassessment & during the Aug. - Sept. timeframe)
15-minute intervals for 1-
2 weeks 3 / 2 / 1
20% of results in one waterbody exceed one or more
water quality standard or established threshold
Chlorine (Free and Total)
USEPA Std. Method 4500
Cl F30
2/yr Spring & Dry Seasons
Grab sample Sp 2 ring 20 / 10 /
Dry 3 / 2 / 1
After immediate resampling, concentrations remain > 0.08
mg/L
Temperature Digital
Temperature Logger
60-minute intervals
60-minute intervals April through Sept.
8 / 4 / 1 20% of results in one
waterbody exceed applicable temperature threshold31
Toxicity – Water Column32
Applicable SWAMP
Comparable Method
2/yr (1/Dry Season
& 1 Storm Event)
Grab or composite
sample 3 / 2 / 1
If toxicity results < 50% of control results, repeat sample. If 2nd sample yields < 50% of
control results, proceed to C.8.d.i.
29 Includes dissolved oxygen, temperature, conductivity, and pH. 30 The method of analysis shall achieve a method detection limit at least as low as that achieved by the Amperometric Titration Method (4500-Cl from Standard
Methods for Examination of Water and Wastewater, Edition 20). 31 If temperatures exceed applicable threshold (e.g., Maximum Weekly Average Temperature, Sullivan K., Martin, D.J., Cardwell, R.D., Toll, J.E., Duke, S. 2000. An
Analysis of the Effects of Temperature on Salmonids of the Pacific Northwest with Implications for Selecting Temperature Criteria, Sustainable Ecosystem Institute) or spike with no obvious natural explanation observed.
32 US EPA three species toxicity tests: Selenastrum growth and Ceriodaphnia and Pimephales with lethal and sublethal endpoints. Also Hyalella azteca with lethal endpoint.

Municipal Regional Stormwater Permit NPDES No. CAS612008 Order No. R2-2009-0074 Provision C.8.
Provision C.8. Page 69 Date: October 14, 2009
Status Monitoring Parameter
Sampling and/or
Analytical Method21
Minimum Sampling
Occurrence22
Duration of Sampling
Minimum # Sample Sites to Monitor/Yr23 Santa Clara & Alameda Permittees/ Contra Costa & San Mateo Permittees/ Fairfield-Suisun & Vallejo Permittees
Result(s) that Trigger a Monitoring Project in
Provision C.8.d.i.
Toxicity– Bedded Sediment,
Fine-grained33
Applicable SWAMP
Comparable Method
1/yr
Grab sample 3 / 2 / 1
At fine-grained depositional area at bottom of watershed
See Attachment H, Table H-1
Pollutants – Bedded Sediment,34 fine-
grained
Applicable SWAMP
Comparable Method
inc. grain size
1/yr
Grab sample 3 / 2 / 1
At fine-grained depositional area at bottom of watershed
See Attachment H, Table H-1
Pathogen Indicators35
U.S. EPA protocol36
1/yr (During
Summer)
Follow U.S. EPA protocol
5 / 5 / * *Fairfield-Suisun & Vallejo Permittees: 3
sites twice in permit term Exceedance of USEPA criteria
Stream Survey (stream walk & mapping)37
USA38 or equivalent
1 waterbody/yr
N/A 9 / 6 / 3 stream miles/year
N/A
33 Bedded sediments should be fine-grain from depositional areas. Grain size and TOC must be reported. Coordinate with TMDL Provision requirements as applicable. 34 Bedded sediments should be fine-grain from depositional areas. Grain size and TOC must be reported. Analytes shall include all of those reported in MacDonald et al. 2000
(including copper, nickel, mercury, PCBs, DDT, chlordane, dieldrin) as well as pyrethroids (see Table 8.4 for list of pyrethroids). Coordinate with TMDL Provision requirements as applicable. MacDonald, D.D., G.G. Ingersoll, and T.A. Berger. 2000. Development and Evaluation of Consensus-based Sediment Quality Guidelines for Freshwater Ecosystems. Archives of Environ. Contamination and Toxicology 39(1):20–31.
35 Includes fecal coliform and E. Coli. 36 Rather than collecting samples over five separate days, Permittees may use Example #2, pg. 54, of USEPA’s Implementation Guidance for Ambient Water Quality Criteria
for Bacteria, March 2004 Final. 37 The Stream Surveys need not be repeated on a watershed if a Stream Survey was completed on that waterbody within the
previous five years. The number of stream miles to be surveyed in any given year may be less than that shown in Table 8-1 in order to avoid repeating surveys at areas surveyed during the previous five years.
38 Center for Watershed Protection, Manual 10: Unified Stream Assessment: A User's Manual, February 2005.

Municipal Regional Stormwater Permit NPDES No. CAS612008 Order No. R2-2009-0074 Provision C.8.
Provision C.8. Page 70 Date: October 14, 2009
iv. Locations – For each sampling year (per C.8.c.iii.), Permittees shall select at least one waterbody to sample from the applicable list below. Locations shall be selected so that sampling is sufficient to characterize segments of the waterbody(s). For example, Permittees required to collect a larger number of samples should sample two or more waterbodies, so that each sampling effort represents a reasonable segment length and/or type. Samples shall be collected in reaches that receive urban stormwater discharges, except in possible infrequent instances where non-urban-impacted stream samples are needed for comparison39. Waterbody selection shall be based on factors such as watershed area, land use, likelihood of urban runoff impacts, and existing monitoring data.
Table 8.2 Status Monitoring Locations – Waterbodies SCVURPPP ACCWP CCCWP SMCWPPP FSUMRP VALLEJO Coyote Creek and tributaries
Arroyo Valle (below Livermore or lower)
Kirker Creek San Pedro Creek and tributaries
Laurel Creek
Chabot Creek
Guadalupe River andtributaries
Arroyo Mocho Mt. Diablo Creek
Pilarcitos Creek Ledgewood Creek
Austin Creek & tributaries
San Tomas Creek and tributaries
Tassajara Creek Walnut Creek and tributaries
Colma Creek
Calabazas Creek Alamo Creek Rodeo Creek San Bruno Creek and tributaries
Permanente Creek and tributaries
Arroyo de la Laguna
Pinole Creek Millbrae Creek and tributaries
Stevens Creek and tributaries
Alameda Creek (at Fremont or below)
San Pablo Creek
Mills Creek and tributaries
Matadero Creek and tributaries
San Lorenzo Creek & tribs
Alhambra Creek
Easton Creek and tributaries
Adobe Creek San Leandro Creek & tribs
Wildcat Creek Sanchez Creek and tributaries
Lower Penitencia Creek and tributaries
Oakland, Berkeley, or Albany Creeks
Burlingame Creek and tributaries
Barron Creek San Mateo Creek (below dam only)
San Francisquito Creek & tributaries
Borel Creek & tributaries
Laurel Creek & tribs Belmont Creek & tribs Pulgas Creek & tribs
Cordilleras & tributaries
Redwood Creek & tribs Atherton Creek & tribs
San Francisquito Creek and tributaries
39 Sampling efforts shall focus on stream reaches with urban stormwater system discharges. Sampling upstream of
urban outfalls is not precluded where needed to meet sampling plan objectives.
Municipal Regional Stormwater Permit NPDES No. CAS612008 Order No. R2-2009-0074 Provision C.8.
Provision C.8. Page 71 Date: October 14, 2009
v. Status Monitoring Results – When Status Monitoring produces results such as those described in the final column of Table 8.1, Permittees shall conduct Monitoring Project(s) as described in C.8.d.i.
C.8.d. Monitoring Projects – Permittees shall conduct the Monitoring Projects listed below.
i. Stressor/Source Identification – When Status results trigger a follow-up action as indicated in Table 8.1, Permittees shall take the following actions, as also required by Provision C.1. If the trigger stressor or source is already known, proceed directly to step 2. The first follow-up action shall be initiated as soon as possible, and no later than the second fiscal year after the sampling event that triggered the Monitoring Project.
(1) Conduct a site specific study (or non-site specific if the problem is wide-spread) in a stepwise process to identify and isolate the cause(s) of the trigger stressor/source. This study should follow guidance for Toxicity Reduction Evaluations (TRE)40 or Toxicity Identification Evaluations (TIE).41 A TRE, as adapted for urban stormwater data, allows Permittees to use other sources of information (such as industrial facility stormwater monitoring reports) in attempting to determine the trigger cause, potentially eliminating the need for a TIE. If a TRE does not result in identification of the stressor/source, Permittees shall conduct a TIE.
(2) Identify and evaluate the effectiveness of options for controlling the cause(s) of the trigger stressor/source.
(3) Implement one or more controls.
(4) Confirm the reduction of the cause(s) of trigger stressor/source.
(5) Stressor/Source Identification Project Cap: Permittees who conduct this monitoring through a regional collaborative shall be required to initiate no more than ten Stressor/Source Identification projects during the Permit term in total, and at least two must be toxicity follow-ups, unless monitoring results do not indicate the presence of toxicity. If conducted through a stormwater countywide program, the Santa Clara and Alameda
40 USEPA. August 1999. Toxicity Reduction Evaluation Guidance for Municipal Wastewater Treatment Plants.
EPA/833B-99/002. Office of Wastewater Management, Washington, D.C. 41 Select TIE methods from the following references after conferring with SWAMP personnel: For sediment:
(1) Ho KT, Burgess R., Mount D, Norberg-King T, Hockett, RS. 2007. Sediment toxicity identification evaluation: interstitial and whole methods for freshwater and marine sediments. USEPA, Atlantic Ecology Division/Mid-Continental Ecology Division, Office of Research and Development, Narragansett, RI, or (2) Anderson, BS, Hunt, JW, Phillips, BM, Tjeerdema, RS. 2007. Navigating the TMDL Process: Sediment Toxicity. Final Report- 02-WSM-2. Water Environment Research Federation. 181 pp. For water column: (1) USEPA. 1991. Methods for aquatic toxicity identification evaluations. Phase I Toxicity Characterization Procedures. EPA 600/6-91/003. Office of Research and Development, Washington, DC., (2) USEPA. 1993. Methods for aquatic toxicity identification evaluations. Phase II Toxicity Identification Procedures for Samples Exhibiting Acute and Chronic Toxicity. EPA 600/R-92/080. Office of Research and Development, Washington, DC., or (3) USEPA. 1996. Marine Toxicity Identification Evaluation (TIE), Phase I Guidance Document. EPA/600/R-95/054. Office of Research and Development, Washington, DC.

Municipal Regional Stormwater Permit NPDES No. CAS612008 Order No. R2-2009-0074 Provision C.8.
Provision C.8. Page 72 Date: October 14, 2009
Permittees each shall be required to initiate no more than five (two for toxicity); the Contra Costa and San Mateo Permittees each shall be required to initiate no more than three (one for toxicity); and the Fairfield-Suisun and Vallejo Permittees each shall be required to initiate no more than one Stressor/Source Identification project(s) during the Permit term.
(6) As long as Permittees have complied with the procedures set forth above, they do not have to repeat the same procedure for continuing or recurring exceedances of the same receiving water limitations unless directed to do so by the Water Board.
ii. BMP Effectiveness Investigation – Investigate the effectiveness of one BMP for stormwater treatment or hydrograph modification control. Permittees who do this project through a regional collaborative are required to initiate no more than one BMP Effectiveness Investigation during the Permit term. If conducted through a stormwater countywide program, the Santa Clara, Alameda, Contra Costa, and San Mateo Permittees shall be required to initiate one BMP Effectiveness Investigation each, and the Fairfield-Suisun and Vallejo Permittees shall be exempt from this requirement. The BMP(s) used to fulfill requirements of C.3.b.iii., C.11.e. and C.12.e. may be used to fulfill this requirement, provided the BMP Effectiveness Investigation includes the range of pollutants generally found in urban runoff. The BMP Effectiveness Investigation will not trigger a Stressor/Source Identification Project. Data from this Monitoring Project need not be SWAMP-comparable.
iii. Geomorphic Project – This monitoring is intended to answer the questions: How and where can our creeks be restored or protected to cost-effectively reduce the impacts of pollutants, increased flow rates, and increased flow durations of urban runoff?
Permittees shall select a waterbody/reach, preferably one that contains significant fish and wildlife resources, and conduct one of the following projects within each county, except that only one such project must be completed within the collective Fairfield-Suisun and Vallejo Permittees’ jurisdictions:
(1) Gather geomorphic data to support the efforts of a local watershed partnership42 to improve creek conditions; or
(2) Inventory locations for potential retrofit projects in which decentralized, landscape-based stormwater retention units can be installed; or
(3) Conduct a geomorphic study which will help in development of regional curves which help estimate equilibrium channel conditions for different-sized drainages. Select a waterbody/reach that is not undergoing changing land use. Collect and report the following data:
• Formally surveyed channel dimensions (profile), planform, and cross-sections. Cross-sections shall include the topmost floodplain terrace and
42 A list of local watershed partnerships may be obtained from Water Board staff.

Municipal Regional Stormwater Permit NPDES No. CAS612008 Order No. R2-2009-0074 Provision C.8.
Provision C.8. Page 73 Date: October 14, 2009
be marked by a permanent, protruding (not flush with ground) monument.
• Contributing drainage area.
• Best available information on bankfull discharges and width and depth of channel formed by bankfull discharges.
• Best available information on average annual rainfall in the study area.
Permittees shall complete the selected geomorphic project so that project results are reported in the Integrated Monitoring Report (see Provision C.8.g.v).
C.8.e. Pollutants of Concern and Long-Term Trends Monitoring Pollutants of Concern (POC) monitoring is intended to assess inputs of Pollutants of Concern to the Bay from local tributaries and urban runoff, assess progress toward achieving wasteload allocations (WLAs) for TMDLs and help resolve uncertainties associated with loading estimates for these pollutants. In particular, there are four priority management information needs toward which POC monitoring must be directed: 1) identifying which Bay tributaries (including stormwater conveyances) contribute most to Bay impairment from pollutants of concern; 2) quantifying annual loads or concentrations of pollutants of concern from tributaries to the Bay; 3) quantifying the decadal-scale loading or concentration trends of pollutants of concern from small tributaries to the Bay; and 4) quantifying the projected impacts of management actions (including control measures) on tributaries and identifying where these management actions should be implemented to have the greatest beneficial impact. Permittees shall implement the following POC monitoring components or pursue an alternative approach that addresses each of the aforementioned management information needs. An alternative approach may be pursued by Permittees provided that: either similar data types, data quality, data quantity are collected with an equivalent level of effort described; or an equivalent level of monitoring effort is employed to answer the management information needs. Long-Term monitoring is intended to assess long-term trends in pollutant concentrations and toxicity in receiving waters and sediment, in order to evaluate if stormwater discharges are causing or contributing to toxic impacts on aquatic life. Permittees shall implement the following Long-Term monitoring components or, following approval by the Executive Officer, an equivalent monitoring program.
i. Pollutants of Concern Loads Monitoring Locations – Permittees shall conduct Pollutants of Concern monitoring at stations listed below. Permittees may install these stations in two phases providing at least half of the stations are monitored in the water year beginning October 2010, and all the stations are monitored in the water year beginning October 2012. Upon approval by the Executive Officer, Permittees may use alternate POC monitoring locations.

Municipal Regional Stormwater Permit NPDES No. CAS612008 Order No. R2-2009-0074 Provision C.8.
Provision C.8. Page 74 Date: October 14, 2009
(1) Castro Valley Creek S3 at USGS gauging station in Castro Valley
(2) Guadalupe River
(3) Zone 4 Line A at Chabot Road in Hayward
(4) Rheem Creek at Giant Road in Richmond
(5) Walnut Creek at a downstream location
(6) Calabazas Creek at Lakeside Drive in Sunnyvale, at border with Santa Clara
(7) San Mateo Creek at downstream location
(8) Laurel Creek at Laurie Meadows park, off Casanova Drive in City of San Mateo.
ii. Long-Term Monitoring Locations – Permittees shall conduct Long-Term monitoring at stations listed below. After conferring with the Regional SWAMP program, and upon approval by the Executive Officer, Permittees may use alternate Long-Term monitoring locations.
Table 8.3. Long-Term Monitoring Locations
Stormwater Countywide Program Waterbody Suggested Location
Alameda Creek OR East of Alvarado Blvd* Alameda Permittees
Lower San Leandro Creek Empire Road* Kirker Creek OR Floodway*
Contra Costa Permittees Walnut Creek Concord Avenue*
Guadalupe River OR USGS Gaging Station 11169025* Santa Clara Permittees
Coyote Creek Montague* San Mateo Permittees San Mateo Creek Gateway Park*
* SWAMP is scheduled to collect sediment toxicity and sediment chemistry samples annually at these stations during the month of June.
iii. Parameters and Frequencies – Permittees shall conduct Pollutants of Concern sampling pursuant to Table 8.4, Categories 1 and 2. In Table 8.4, Category 1 pollutants are those for which the Water Board has active water quality attainment strategies (WQAS), such as TMDL or site-specific objective projects. Category 2 pollutants are those for which WQAS are in development. The lower monitoring frequency for Category 2 pollutants is sufficient to develop preliminary loading estimates for these pollutants.
Permittees shall conduct Long-Term monitoring pursuant to Table 8.4, Category 3. SWAMP has scheduled collection of Category 3 data at the Long-Term monitoring locations stated in C.8.e.ii. As stated in Provision C.8.a.iv., Permittees may use SWAMP data to fulfill Category 3 sampling requirements.
iv. Protocols – At a minimum, sampling and analysis protocols shall be consistent with 40 CFR 122.21(g)(7)(ii).
Municipal Regional Stormwater Permit NPDES No. CAS612008 Order No. R2-2009-0074 Provision C.8.
Provision C.8. Page 75 Date: October 14, 2009
v. Methods – Methyl mercury samples shall be grab samples collected during storm events that produce rainfall of at least 0.10 inch, shall be frozen immediately upon collection, and shall be kept frozen during transport to the laboratory. All other Category 1 and 2 samples shall be wet weather flow-weighted composite samples, collected during storm events that produce rainfall of at least 0.10 inch. Sampled storms should be separated by 21 days of dry weather, but, at a minimum, sampled storms must have 72 hours of antecedent dry weather. Samples must include the first rise in the hydrograph. Category 3 monitoring data shall be SWAMP-comparable.
Table 8.4 Pollutants of Concern Loads & Long-Term Monitoring Elements
Category/Parameter Sampling Years
Minimum Sampling
Occurrence
Sampling Interval
Category 1 • Total and Dissolved Copper • Total Mercury43 • Methyl Mercury • Total PCBs44 • Suspended Sediments (SSC) • Total Organic Carbon • Toxicity – Water Column • Nitrate as N • Hardness
Annually
Average of 4 wet weather events per year For methyl mercury only: average of 2 wet & 2 dry weather events per year
Flow-weighted composite For methyl mercury only: grab samples collected during the first rise in the hydrograph of a storm event.
Category 2 • Total and Dissolved Selenium • Total PBDEs (Polybrominated Diphenyl
Ethers) • Total PAHs (Poly-Aromatic Hydrocarbons) • Chlordane • DDTs (Dichloro-Diphenyl-Trichloroethane) • Dieldrin • Nitrate as N • Pyrethroids - bifenthrin, cyfluthrin, beta-
cyfluthrin, cypermethrin, deltamethrin, esfenvalerate, lambda-cyhalothrin, permethrin, and tralomethrin
• Carboryl and fipronil • Total and Dissolved Phosphorus
Oct. 2010 -2011 water year and Oct. 2012 -2013 water year
2 times per year Flow-weighted composite
Category 3 Toxicity – Bedded Sediment, fine-grained45
Biennially, Coordinate
Once per year, during April-June,
Grab sample
43 The monitoring type and frequency shown for mercury is not sufficient to determine progress toward achieving
TMDL load allocations. Progress toward achieving load allocations will be accomplished by assessing loads avoided resulting from treatment, source control, and pollution prevention actions.
44 The monitoring type and frequency shown for PCBs is not sufficient to determine progress toward achieving TMDL load allocations. Progress toward achieving load allocations will be accomplished by assessing loads avoided resulting from treatment, source control, and pollution prevention actions.

Municipal Regional Stormwater Permit NPDES No. CAS612008 Order No. R2-2009-0074 Provision C.8.
Provision C.8. Page 76 Date: October 14, 2009
Category/Parameter Sampling Years
Minimum Sampling
Occurrence
Sampling Interval
Pollutants – Bedded Sediment, fine-grained with SWAMP
coordinate with SWAMP
vi. Sediment Delivery Estimate/Budget – The objective of this monitoring is to develop a strong estimate of the amount of sediment entering the Bay from local tributaries and urban drainages. By July 1, 2011, Permittees shall develop a design for a robust sediment delivery estimate/sediment budget in local tributaries and urban drainages. Permittees shall implement the study by July 1, 2012.
vii. Emerging Pollutants – Permittees shall develop a work plan and schedule for initial loading estimates and source analyses for emerging pollutants: endocrine-disrupting compounds, PFOS/PFAS (Perfluorooctane Sulfonates (PFOS), Perfluoroalkyl sulfonates (PFAS); these perfluorocompounds are related to Teflon products), and NP/NPEs (nonylphenols/nonylphenol esters —estrogen-like compounds). This work plan, which is to be implemented in the next Permit term, shall be submitted with the Integrated Monitoring Report (see Provision C.8.g.).
C.8.f. Citizen Monitoring and Participation i. Permittees shall encourage Citizen Monitoring.
ii. In developing Monitoring Projects and evaluating Status & Trends data, Permittees shall make reasonable efforts to seek out citizen and stakeholder information and comment regarding waterbody function and quality.
iii. Permittees shall demonstrate annually that they have encouraged citizen and stakeholder observations and reporting of waterbody conditions. Permittees shall report on these outreach efforts in the annual Urban Creeks Monitoring Report.
C.8.g. Reporting i. Water Quality Standard Exceedence – When data collected pursuant to
C.8.a.-C.8.f. indicate that stormwater runoff or dry weather discharges are or may be causing or contributing to exceedance(s) of applicable water quality standards, including narrative standards, a discussion of possible pollutant sources shall be included in the Urban Creeks Monitoring Report. When data collected pursuant to C.8.a.-C.8.f. indicate that discharges are causing or contributing to an exceedance of an applicable water quality standard, Permittees shall notify the Water Board within no more than 30 days of such a determination and submit a follow-up report in accordance with Provision C.1 requirements. The preceding reporting requirements shall not apply to
45 If Ceriodaphnia, Hyalella azteca, or Pimephales survival or Selenastrum growth is < 50% of control results, repeat
wet weather sample. If 2nd sample yields < 50% of control results, proceed to C.8.d.i.

Municipal Regional Stormwater Permit NPDES No. CAS612008 Order No. R2-2009-0074 Provision C.8.
Provision C.8. Page 77 Date: October 14, 2009
continuing or recurring exceedances of water quality standards previously reported to the Water Board or to exceedances of pollutants that are to be addressed pursuant to Provisions C.8 through C.14 of this Order in accordance with Provision C.1.
ii. Status Monitoring Electronic Reporting – Permittees shall submit an Electronic Status Monitoring Data Report no later than January 15 of each year, reporting on all data collected during the foregoing October 1–September 30 period. Electronic Status Monitoring Data Reports shall be in a format compatible with the SWAMP database.46 Water Quality Objective exceedances shall be highlighted in the Report.
iii. Urban Creeks Monitoring Report – Permittees shall submit a comprehensive Urban Creeks Monitoring Report no later than March 15 of each year, reporting on all data collected during the foregoing October 1–September 30 period, with the initial report due March 15, 2012, unless the Permittees choose to monitor through a regional collaborative, in which case the due date is March 15, 2013. Each Urban Creeks Monitoring Report shall contain summaries of Status, Long-Term, Monitoring Projects, and Pollutants of Concern Monitoring including, as appropriate, the following:
(1) Maps and descriptions of all monitoring locations;
(2) Data tables and graphical data summaries; Constituents that exceed applicable water quality standards shall be highlighted;
(3) For all data, a statement of the data quality;
(4) An analysis of the data, which shall include the following:
• Calculations of biological metrics and physical habitat endpoints.
• Comparison of biological metrics to:
• Each other
• Any applicable, available reference site(s)
• Any applicable, available index of biotic integrity
• Physical habitat endpoints.
• Identification and analysis of any long-term trends in stormwater or receiving water quality.
(5) A discussion of the data for each monitoring program component, which shall:
• Discuss monitoring data relative to prior conditions, beneficial uses and applicable water quality standards as described in the Basin Plan, the Ocean Plan, or the California Toxics Rule or other applicable water quality control plans.
46 See http://mpsl.mlml.calstate.edu/swdataformats.htm. Permittees shall maintain an information management
system that will support electronic transfer of data to the Regional Data Center of the California Environmental Data Exchange Network (CEDEN), located within the San Francisco Estuary Institute.
Municipal Regional Stormwater Permit NPDES No. CAS612008 Order No. R2-2009-0074 Provision C.8.
Provision C.8. Page 78 Date: October 14, 2009
• Where appropriate, develop hypotheses to investigate regarding pollutant sources, trends, and BMP effectiveness.
• Identify and prioritize water quality problems.
• Identify potential sources of water quality problems.
• Describe follow-up actions.
• Evaluate the effectiveness of existing control measures.
• Identify management actions needed to address water quality problems.
iv. Monitoring Project Reports – Permittees shall report on the status of each ongoing Monitoring Project in each annual Urban Creeks Monitoring Report. In addition, Permittees shall submit stand-alone summary reports within six months of completing BMP Effectiveness and Geomorphic Projects; these reports shall include: a description of the project; map(s) of project locations; data tables and summaries; and discussion of results.
v. Integrated Monitoring Report – No later than March 15, 2014, Permittees shall prepare and submit an Integrated Monitoring Report through the regional collaborative monitoring effort on behalf of all participating Permittees, or on a countywide basis on behalf of participating Permittees, so that all monitoring conducted during the Permit term is reported.47 This report shall be in lieu of the Annual Urban Creeks Monitoring Report due on March 15, 2014.
The report shall include, but not be limited to, a comprehensive analysis of all data collected pursuant to Provision C.8., and may include other pertinent studies. For Pollutants of Concern, the report shall include methods, data, calculations, load estimates, and source estimates for each Pollutant of Concern Monitoring parameter. The report shall include a budget summary for each monitoring requirement and recommendations for future monitoring. This report will be part of the next Report of Waste Discharge for the reissuance of this Permit.
vi. Standard Report Content –All monitoring reports shall include the following:
• The purpose of the monitoring and briefly describe the study design rationale.
• Quality Assurance/Quality Control summaries for sample collection and analytical methods, including a discussion of any limitations of the data.
• Brief descriptions of sampling protocols and analytical methods.
• Sample location description, including waterbody name and segment and latitude and longitude coordinates.
• Sample ID, collection date (and time if relevant), media (e.g., water, filtered water, bed sediment, tissue).
• Concentrations detected, measurement units, and detection limits.
47 Permittees who do not participate in the Regional Monitoring Group or in a stormwater countywide program
must submit an individual Integrated Receiving Water Impacts Report.

Municipal Regional Stormwater Permit NPDES No. CAS612008 Order No. R2-2009-0074 Provision C.8.
Provision C.8. Page 79 Date: October 14, 2009
• Assessment, analysis, and interpretation of the data for each monitoring program component.
• Pollutant load and concentration at each mass emissions station.
• A listing of volunteer and other non-Permittee entities whose data are included in the report.
• Assessment of compliance with applicable water quality standards.
• A signed certification statement.
vii. Data Accessibility – Permittees shall make electronic reports available through a regional data center, and optionally through their web sites. Permittees shall notify stakeholders and members of the general public about the availability of electronic and paper monitoring reports through notices distributed through appropriate means, such as an electronic mailing list.
C.8.h. Monitoring Protocols and Data Quality Where applicable, monitoring data must be SWAMP comparable. Minimum data quality shall be consistent with the latest version of the SWAMP Quality Assurance Project Plan (QAPP)48 for applicable parameters, including data quality objectives, field and laboratory blanks, field duplicates, laboratory spikes, and clean techniques, using the most recent Standard Operating Procedures. A Regional Monitoring Collaborative may adapt the SWAMP QAPP for use in conducting monitoring in the San Francisco Bay Region, and may use such QAPP if acceptable to the Executive Officer.
48 The current SWAMP QAPP at the time of Permit issuance is dated September 1, 2008, and is available at
http://www.waterboards.ca.gov/water_issues/programs/swamp/docs/qapp/swamp_qapp_master090108a.pdf.
Municipal Regional Stormwater Permit NPDES No. CAS612008 Order No. R2-2009-0074 Attachment H
Attachment H Page H-1 Date: October 14, 2009
ATTACHMENT H
Provision C.8. Status and Long-Term Monitoring
Follow-up Analysis and Actions

Municipal Regional Stormwater Permit NPDES No. CAS612008 Order No. R2-2009-0074 Attachment H
Attachment H Page H-2 Date: October 14, 2009
Status and Long-Term Monitoring Follow-up Analysis and Actions for Biological Assessment,
Bedded Sediment Toxicity, and Bedded Sediment Pollutants When results from Biological Assessment, Bedded Sediment Toxicity, and/or Bedded Sediment Pollutants monitoring indicate impacts at a monitoring location, Permittees shall evaluate the extent and cause(s) of impacts to determine the potential role of urban runoff as indicated in Table H-1.
Table H-1. Sediment Triad Approach to Determining Follow-Up Actions
Chemistry Results161
Toxicity Results162
Bioassessment Results163 Action
No chemicals exceed Threshold Effect Concentrations (TEC), mean Probable Effects Concentrations (PEC) quotient < 0.5 and pyrethroids < 1.0 Toxicity Unit (TU)164
No Toxicity
No indications of alterations
No action necessary
No chemicals exceed TECs, mean PEC quotient < 0.5 and pyrethroids< 1.0 TU
Toxicity No indications of alterations
(1) Take confirmatory sample for toxicity. (2) If toxicity repeated, attempt to identify
cause and spatial extent. (3) Where impacts are under Permittee’s
control, take management actions to minimize upstream sources causing toxicity; initiate no later than the second fiscal year following the sampling event.
161 TEC and PEC are found in MacDonald, D.D., G.G. Ingersoll, and T.A. Berger. 2000. Development and
Evaluation of Consensus-based Sediment Quality Guidelines for Freshwater Ecosystems. Archives of Environ. Contamination and Toxicology 39(1):20–31.
162 Toxicity is exhibited when Hyallela survival statistically different than and < 20 percent of control. 163 Alterations are exhibited if metrics indicate substantially degraded community. 164 Toxicity Units (TU) are calculated as follows: TU = Actual concentration (organic carbon normalized) ÷
Reported H. azteca LC50 concentration (organic concentration normalized). Weston, D.P., R.W. Holmes, J. You, and M.J. Lydy, 2005. Aquatic Toxicity Due to Residential Use of Pyrethroid Insecticides. Environ. Science and Technology 39(24):9778–9784.

Municipal Regional Stormwater Permit NPDES No. CAS612008 Order No. R2-2009-0074 Attachment H
Attachment H Page H-3 Date: October 14, 2009
Chemistry Results161
Toxicity Results162
Bioassessment Results163 Action
No chemicals exceed TECs, mean PEC quotient < 0.5 and pyrethroids< 1.0 TU
No Toxicity
Indications of alterations
Identify the most probable cause(s) of the alterations in biological community. Where impacts are under Permittee’s control, take management actions to minimize the impacts causing physical habitat disturbance; initiate no later than the second fiscal year following the sampling event.
No chemicals exceed TECs, mean PEC quotient < 0.5 and pyrethroids< 1.0 TU
Toxicity Indications of
alterations
(1) Identify cause(s) of impacts and spatial extent.
(2) Where impacts are under Permittee’s control, take management actions to minimize impacts; initiate no later than the second fiscal year following the sampling event.
3 or more chemicals exceed PECs, the mean PEC quotient is > 0.5, or pyrethroids > 1.0 TU
No Toxicity
Indications of alterations
(1) Identify cause of impacts. (2) Where impacts are under Permittee’s
control, take management actions to minimize the impacts caused by urban runoff; initiate no later than the second fiscal year following the sampling event.
3 or more chemicals exceed PECs, the mean PEC quotient is > 0.5, or pyrethroids > 1.0 TU
Toxicity No indications of alterations
(1) Take confirmatory sample for toxicity. (2) If toxicity repeated, attempt to identify
cause and spatial extent. (3) Where impacts are under Permittee’s
control, take management actions to minimize upstream sources; initiate no later than the second fiscal year following the sampling event.
3 or more chemicals exceed PECs, the mean PEC quotient is > 0.5, or pyrethroids > 1.0 TU
No Toxicity
No Indications of alterations
If PEC exceedance is Hg or PCBs, address under TMDLs
3 or more chemicals exceed PECs, the mean PEC quotient is > 0.5, or pyrethroids > 1.0 TU
Toxicity Indications of
alterations
(1) Identify cause(s) of impacts and spatial extent.
(2) Where impacts are under Permittee’s control, take management actions to address impacts.

Municipal Regional Stormwater Permit NPDES No. CAS612008 Order No. R2-2009-0074 Attachment I
Attachment I Page I-1 Date: October 14, 2009
ATTACHMENT I
Provision C.8. Standard Monitoring Provisions

Municipal Regional Stormwater Permit NPDES No. CAS612008 Order No. R2-2009-0074 Attachment I
Attachment I Page I-2 Date: October 14, 2009
All monitoring activities shall meet the following requirements: 1. Samples and measurements taken for the purpose of monitoring shall be representative of the
monitored activity. [40 CFR 122.41(j)(1)]
2. Permittees shall retain records of all monitoring information, including all calibration and maintenance of monitoring instrumentation, and copies of all reports required by this Order for a period of at least five (5) years from the date of the sample, measurement, report, or application. This period may be extended by request of the Water Board or USEPA at any time and shall be extended during the course of any unresolved litigation regarding this discharge. [40 CFR 122.41(j)(2), CWC section 13383(a)]
3. Records of monitoring information shall include [40 CFR 122.41(j)(3)]:
a. The date, exact place, and time of sampling or measurements;
b. The individual(s) who performed the sampling or measurements;
c. The date(s) analyses were performed;
d. The individual(s) who performed the analyses;
e. The analytical techniques or methods used; and,
f. The results of such analyses.
4. The CWA provides that any person who falsifies, tampers with, or knowingly renders inaccurate any monitoring device or method required to be maintained under this Order shall, upon conviction, be punished by a fine of not more than $10,000, or by imprisonment for not more than two years, or both. If a conviction of a person is for a violation committed after a first conviction of such person under this paragraph, punishment is a fine of not more than $20,000 per day of violation, or by imprisonment of not more than four years, or both. [40 CFR 122.41(j)(5)]
5. Calculations for all limitations which require averaging of measurements shall utilize an arithmetic mean unless otherwise specified in the monitoring Provisions. [40 CFR 122.41(l)(4)(iii)]
6. All chemical, bacteriological, and toxicity analyses shall be conducted at a laboratory certified for such analyses by the California Department of Health Services or a laboratory approved by the Executive Officer.
7. For priority toxic pollutants that are identified in the California Toxics Rule (CTR) (65 Fed. Reg. 31682), the Permittees shall instruct its laboratories to establish calibration standards that are equivalent to or lower than the Minimum Levels (MLs) published in Appendix 4 of the Policy for Implementation of Toxics Standards for Inland Surface Waters, Enclosed Bays, and Estuaries of California (SIP). If a Permittee can demonstrate that a particular ML is not attainable, in accordance with procedures set forth in 40 CFR 136, the lowest quantifiable concentration of the lowest calibration standard analyzed by a specific analytical procedure (assuming that all the method specified sample weights, volumes, and processing steps have been followed) may be used instead of the ML listed in Appendix 4 of the SIP. The Permittee must submit documentation from the laboratory to the Water Board for approval prior to raising the ML for any priority toxic pollutant.
8. The Clean Water Act provides that any person who knowingly makes any false statement, representation, or certification in any record or other document submitted or required to be maintained under this permit, including monitoring reports or reports of compliance or non-

Municipal Regional Stormwater Permit NPDES No. CAS612008 Order No. R2-2009-0074 Attachment I
Attachment I Page I-3 Date: October 14, 2009
compliance shall, upon conviction, be punished by a fine of not more than $10,000 per violation, or by imprisonment for not more than six months per violation, or by both. [40 CFR 122.41(k)(2)]
9. If the discharger monitors any pollutant more frequently than required by the Permit, unless otherwise specified in the Order, the results of this monitoring shall be included in the calculation and reporting of the data submitted in the reports requested by the Water Board. [40 CFR 122.41(l)(4)(ii)]

A‐2
Appendix B. Sample Size Power Analysis
Power curve from a binomial distribution estimating sample size and associated confidence intervals (SMC 2007). A sample size of 30 provides an estimate of spatial extent +/‐ 12% which is considered sufficient for decision‐making in the RMC area.

A‐3
Appendix C. Example Report Figures
Condition Assessment:
Example bar chart depicting creek kilometers in different condition categories across the specified RMC participant areas. Note: RMC bar charts will include error bars and a bar for the entire RMC illustrating region‐wide creek kilometers in each condition category.
Example pie chart graph (companion to the bar chart above) depicting the % of stream length that falls into each of the aquatic life condition categories. Unknown category represents percentage of sites not sampled due to property owner denial, accessibility, etc.
0
100
200
300
400
500
600
A B C D E F
Stream
Length (km
)
RMC Program
Reference
Altered
Very Altered
Reference27%
Altered37%
Very Altered23%
Unknown13%

A‐4
Example cumulative distribution functions (CDFs) of variables measured using the RMC ambient sample design (e.g., B‐IBI scores & algal metrics) and targeted data.
Stressor Assessment:
Example horizontal bar graphs depicting the percentages of urban and non‐urban creek kilometers in the RMC area that exceed threshold values for stressor indicators (modified SWAMP 2011).
Urban Non‐Urban
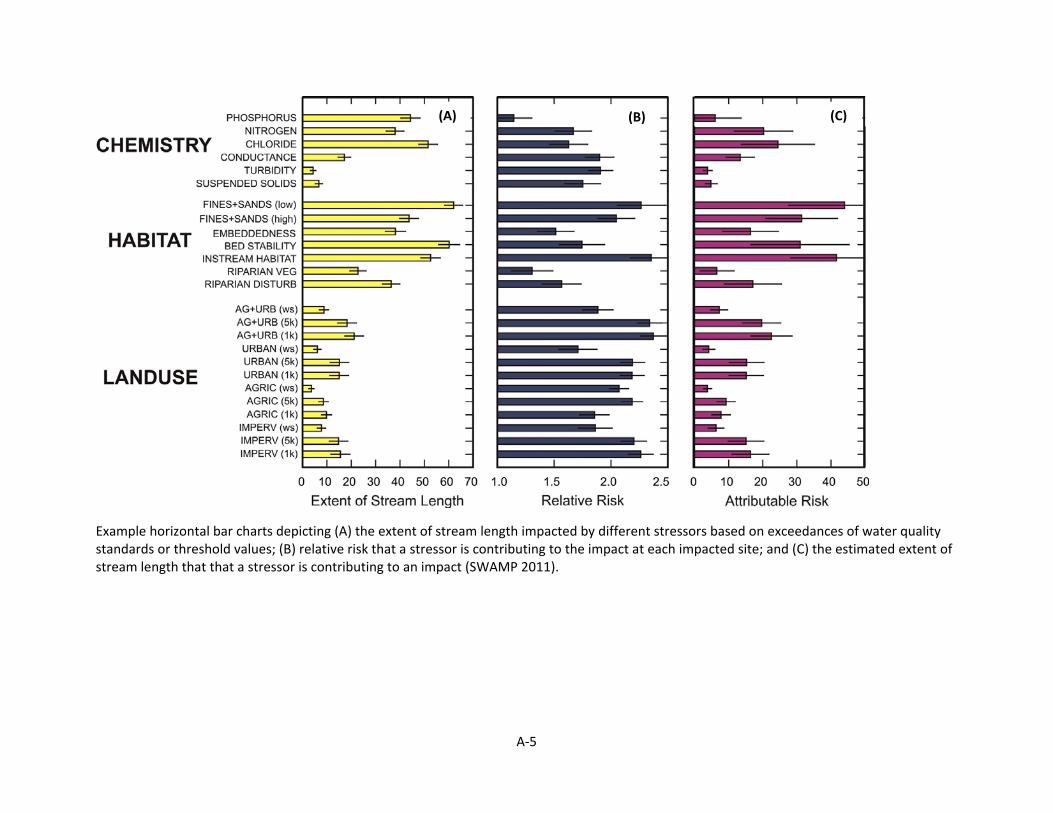
A‐5
Example horizontal bar charts depicting (A) the extent of stream length impacted by different stressors based on exceedances of water quality standards or threshold values; (B) relative risk that a stressor is contributing to the impact at each impacted site; and (C) the estimated extent of stream length that that a stressor is contributing to an impact (SWAMP 2011).
(A) (B) (C)