Embed Size (px)
Citation preview

Tess Penne, Tine Hufkens, Tim Goedemé and Bérénice Storms
JRC Working Papers on
Taxation and Structural
Reforms No 08/2018
To what extent do welfare states compensate for the cost of children? A hypothetical household approach to policy evaluations.
November 2018

This publication is a Technical report by the Joint Research Centre (JRC), the European Commission’s science and
knowledge service. I t aims to provide evidence-based scientific support to the European policy-making process.
The scientific output expressed does not imply a policy posit ion of the European C ommission. Neither the
European Commission nor any person acting on behalf of the Commission is responsible for the use which might
be made of this publication.
JRC Science Hub
https://ec.europa.eu/jrc
JRC114168
ISSN 1831-9408
Sevilla, Spain: European C ommission, 2018
© European Union, 2018
Reproduction is authorised provided the source is acknowledged.
How to c ite: Penne, T ., Hufkens , T ., Goedemé, T . and Storms, B. (2018), "To what extent do welfare s tates
compensate for the cost of children? A hypothetical household approach to policy evaluations."; JRC Working
Papers on Taxation and Structural Reforms No 08/2018, European Commission, Joint Research Centre, Seville ,
JRC114168.
A ll images © European Union 2018
To what extent do welfare states compensate for the cost of children? A hypothetical household
approach to policy evaluations.
Tess Penne a, Tine Hufkens a,b, Tim Goedemé a and Bérénice
Storms a
a Herman Deleeck Centre for Social Policy – University of Antwerp b Joint Research Centre, European Commission (JRC), Seville, Spain
Acknowledgement: The authors are grateful to Gerlinde Verbist and Zachary Parolin
for their valuable comments and suggestions. We would also like to thank participants of
the 24th FISS conference in Sigtuna and the 15th ESPAnet conference in Lisbon for their
feedback to earlier versions of this paper. The ImPRovE reference budgets were
developed in the ImPRovE project which was financially supported by the European
Union’s Seventh Framework Programme (FP7/2012–2016) under grant agreement n◦
290613 (project title: ImPRovE, http://improve-research.eu). The development of the
reference budgets was coordinated by the Herman Deleeck Centre for Social Policy at the
University of Antwerp, in collaboration with national teams who developed the reference
budgets for Athens (Eleni Kanavitsa, Alexandros Karakitsios and Manos Matsaganis),
Barcelona (Elena Carillo Alvarez and Irene Cussó Parcerisas), Budapest (Anikó Bernát,
Marianna Kopasz, Bori Simonovits, and Péter Szivós), Helsinki (Lauri Mäkinen and Veli-
Matti Ritakallio), and Milan (Marco Arlotti and Yuri Kazepov). The Hypothetical Household
Tool (HHoT) has been jointly developed by the University of Essex and the University of
Antwerp as an application of the EUROMOD software. The results presented in this paper
are based on EUROMOD version H1.0+. EUROMOD is maintained, developed, and
managed by the Institute for Social and Economic Research (ISER) at the University of
Essex, in collaboration with national teams from the EU member states. We are indebted
to the many people who have contributed to the development of EUROMOD. The process
of extending and updating EUROMOD is financially supported by the European Union
Programme for Employment and Social Innovation Easi (2014-2020). Tess Penne
acknowledges financial support from the Research Foundation – Flanders. The results
and their interpretation are the authors’ responsibility.
The information and views set out in this report are those of the authors and do not
necessarily reflect the official opinion of the Commission. The Commission does not
guarantee the accuracy of the data included in this study. Neither the Commission nor
any person acting on the Commission’s behalf may be held responsible for the use which
may be made of the information contained therein.
Table of contents
Abstract ....................................................................................................4
1 Introduction ..........................................................................................5
2 WHY WELFARE STATES SHOULD (PARTLY) COMPENSATE FOR THE COST OF A CHILD
..........................................................................................................6
3 IDENTIFYING THE COST OF A CHILD: DIFFERENT APPROACHES .........................7
4 DATA AND METHODS ...............................................................................8
4.1 The estimation of the cost of children: reference budgets .............................9
4.2 The estimation of cash benefits for families with children: HHoT................... 10
5 THE GENEROSITY OF WELFARE STATES TO FAMILIES WITH CHILDREN .............. 11
5.1 Government social expenditure on families with children ............................ 11
5.2 The cost of children and the impact of publicly provided services.................. 12
5.3 The level and determinants of child cash benefit packages.......................... 15
5.4 A new indicator of welfare state generosity............................................. 16
6 DISCUSSION & CONCLUSIONS................................................................. 18
References ............................................................................................... 21
Annex 1. Government social expenditure on families with children, 2013 and latest available.................................................................................................. 26
Annex 2. Categories of essential goods and services included in the reference budgets for families with children (ImPRovE budgets, 2014) ............................................ 26
Annex 3. Child cost compensation indicator for different household types ................. 28
Abstract
In order to alleviate child poverty, contemporary European welfare states have shifted
their focus increasingly towards child-centred investment strategies. However, studies
assessing the generosity of welfare states to families with children focus mainly on the
role of cash benefit packages, or on government expenditure, disregarding the act ual
costs families face when accessing essential goods and services. This paper takes a
hypothetical household approach to family policy evaluations and aims at contributing to
existing studies by: (1) empirically assessing the needs and costs of children across
welfare states by making use of cross-nationally comparable reference budgets, while
taking into account publicly-provided or subsidized services, (2) simulating the taxes and
cash benefits that households with children receive through the tax-benefit system, by
making use of the new Hypothetical Household Tool (HHoT), and, (3) combining both
types of information in order to compare the essential out-of-pocket costs of children
between 6 and 18 years old with the simulated cash benefit packages. The paper focuses
on six European welfare states: Belgium, Finland, Greece, Hungary, Italy and Spain. We
propose a new indicator that can be used to assess welfare state generosity to families
with children: the child cost compensation indicator. The indicator allows cross-country
comparison on the role of taxes and social benefits in the EU. By making use of this
indicator, we show that, even though with important cross-national variation, the out-of-
pocket cost of children is generally compensated to a small extent through cash policies.
Although support for families is higher at the lower end of the income distribution, for
households living on a low gross wage, the income of a family with children is less
adequate compared to a similar childless family, and is in many cases insufficient to
participate adequately in society.
Key words: welfare state generosity, cost of children, in-kind benefits, reference
budgets, hypothetical household simulations
Corresponding author:
Tess Penne
Herman Deleeck Centre for Social Policy (CSB), University of Antwerp
Email: [email protected]

1 Introduction
In most European welfare states families with children are at higher risk of poverty
compared to childless families (Eurostat, 2016). Their vulnerability can be explained by,
on the one hand, the need to provide care and financial resources, and, on the other hand, a potential loss of income due to reduced labour activity of the parents. In order to support families with children and facilitate parents’ labour market participation, all contemporary welfare states implement a wide variety of child-specific policies. These policies aim in the first place at horizontal equity, minimizing the loss of welfare
compared to childless families. However, in most welfare states, family policies are also (increasingly) used as a tool for reducing child poverty through vertical redistribution (Daly & Ferragina, 2017; Ferrarini et al., 2012; Verbist & Van Lancker, 2016). Over the past decades, welfare state efforts to support families with children have increased and diversified, and, within the spirit of the so-called social investment turn, family policies
became more service-oriented focusing on maternal employment and childhood development (Daly & Ferragina, 2017; Morel et al., 2012). Nonetheless, studies on welfare state generosity towards families with children often focus one-sidedly on cash benefits. This study seeks to address this gap by proposing a new indicator which assesses to which extent welfare states compensate for the essential costs of children,
including taxes, benefits and the impact of publicly provided services. The paper looks at differences in child cost compensation across the income distribution, with a specific focus on how it affects the adequacy of low wages for single earner families.
Even though there is a growing body of literature on policies supporting families with children, we contend that important gaps remain in our understanding of the extent to which welfare states support families with children as compared to childless families and how this varies across European countries. First, studies on welfare state generosity towards families with children, are either one-sidedly focused on cash policies (e.g.
Bradbury, et al., 2017; Chen & Corak, 2008; Immervoll, et al., 2000; Van Lancker & Van Mechelen, 2015) or on early childhood education and child care services (e.g. Bonoli & Reber, 2010; Kamerman, 2000; Van Lancker, 2013). Second, studies that endeavour to take into account benefits in cash as well as benefits in kind, generally focus on the level of public spending or on aggregated indicators such as child care coverage (e.g. Adema, 2012; Bäckman & Ferrarini, 2010; Gauthier, 2002; Maldonado & Nieuwenhuis, 2015).
This allows for important comparisons across time and space but neglects how government efforts impact on different types of households. Few studies have tried to assess the distributive impact of both cash and in kind transfers to families with children (e.g. Förster & Verbist, 2012). However, usually these studies suffer from a lack of adequate empirical underpinning regarding the needs-based costs that families face,
neglecting thereby important differences across households and countries in the subsidization and provision of essential goods and services. Studies that partly take into account out-of-pocket costs focus mainly on the support for families with small children through pre-school institutions (e.g. Immervoll & Barber, 2006; Thévenon, 2011; Van Mechelen & Bradshaw, 2013).
This paper aims to contribute to the literature in several ways: (1) We start from a ‘needs-based approach’ for estimating the cost of children in an empirical way. More in particular, we make use of cross-nationally comparable reference budgets, i.e. priced
baskets of goods and services that illustrate what households need at the minimum in order to participate adequately in society (Storms et al., 2014). Hence, our approach differs from the pioneering study by Bradshaw and Finch (2002), who calculate the cost of some child-centred services but refrain from taking into account the total needs-based cost of a child. (2) We make use of the new Hypothetical Household Tool (HHoT) in the
tax and social benefit microsimulation model EUROMOD, which assesses in a comparable way, and across the income distribution, how welfare states distribute cash resources to families with children, for a broad range of hypothetical situations. (3) We focus on policies for families with children from 6 till 18 years, an age group that is often neglected, even though the cost of a child generally increases with age (Storms &
Bogaerts, 2012; Thévenon, 2009). By starting from a needs-based assessment of the cost of older children, we get more insight into the impact of largely publicly-subsidized services such as primary and secondary education and health care that are crucial for
the development of children. In sum, we compare the cash resources that families with children receive through the welfare state with the out-of-pocket costs they face, while taking into account government subsidies that reduce the cost to access essential goods and services. We focus on policy intentions rather than social outcomes, disregarding – for instance – benefit non-take up or tax non-compliance as well as cross-country
differences in the distribution of households and labour market characteristics. This has the advantage that we are able to show the institutional architecture of welfare state generosity, making abstraction of the socio-demographic composition of each population. However, for better understanding patterns in child poverty, our analysis should be complemented with an outcome-based approach using survey data (e.g. Verbist & Van Lancker, 2016).
More specifically, we propose a new indicator to assess welfare state generosity towards families with children: the child cost compensation indicator. We illustrate the indicator
for families with children of which one parent is working full time and earning a low (close to minimum) wage, an average wage and a higher wage. The indicator allows comparing the generosity of different EU welfare states. Family policy packages are compared across six welfare states: Belgium, Finland, Greece, Hungary, Italy and Spain. These countries cover well the variation in family policies that can be found in Europe:
(1) Finland, a ‘Nordic’ welfare state with generous service-oriented family policies focusing on dual earner support (Bradshaw & Finch, 2002; De Henau et al., 2006; Fagnani & Math, 2008), (2) Belgium, also characterised by generous family policies but often classified as a ‘Continental’ welfare state with a stronger emphasis on cash benefits and on the male bread winner model (Michoń, 2008; Thévenon, 2011), (3) Hungary, an Eastern European welfare state with a limited provision of services, but relatively high
spending on cash family benefits (Cerami, 2006; Michoń, 2008; Thévenon, 2011), and, finally, (4) Greece, Italy and Spain, Southern EU welfare states, with the state taking a rather subsidiary role (‘familialism’) relying mainly on tax policy measures, but with some internal heterogeneity, as we will show below (De Henau et al., 2006; Karamessini, 2008; Matsaganis et al., 2005).
In what follows, we start with a theoretical consideration on the cost of a child, including both a normative and a methodological angle. Subsequently, we explain how we derived
the cost of children from cross-nationally comparable reference budgets and we describe the use of the Hypothetical Household Tool (HHoT) in EUROMOD. The results are subdivided into four sections. Firstly, we start with comparing the public social expenditures of the six countries. Secondly, we discuss the essential costs of children in primary and secondary education, paying particular attention to heavily subsidized services such as education, health care and (public) transport. Thirdly, we identify the
child cash benefit packages that exist in each country under study. Finally, we bring all this information together into a new indicator of welfare state generosity to families with children: the child cost compensation indicator. We conclude with a brief discussion of the main findings of this study and suggestions for future research.
2 Why welfare states should (partly) compensate for the cost of a child
Childrearing costs money. This means that, with an equal level of income, families with
children will be able to consume less per capita compared to childless families. On the other hand, children yield private benefits. One can assume that parents decide to have children when these benefits are expected to be larger than the private costs (Bradbury, 2008; Pollak & Wales, 1979; Wolf et al., 2011). Hence, why should the cost of a child be compensated? As a first criticism of this reasoning, children are not merely the result of
well-informed and rational decision making, and more importantly, parental benefits are not per se relevant for the well-being of the child (Bradbury, 1994). Besides this, there

are two socio-economic arguments for policy makers to (at least partly) compensate for the cost of childrearing, in other words to redistribute horizontally. Firstly, while parents bear the costs, children yield public benefits for society as a whole. As future adults they
will participate in the labour market and pay taxes (including pension contributions), in such a way that their contributions to society can easily exceed the costs (Folbre, 2008; Wolf et al., 2011). In other words, they can be seen as a public good of which the cost must (at least partly) be borne by society. Secondly, from a social investment perspective, families are a key component of society where human capital is transferred and developed (Esping-Andersen, 2008).
Both of these arguments are amplified when focusing on families with children living on a low income, which brings in an argument of vertical equity. Firstly, seeing children as a
public good, it has been widely acknowledged that child poverty induces large public costs since it negatively affects opportunities in future adulthood, both privately and for society as a whole (Corak, 2006). Secondly, looking at children as a social investment, low income families have less financial and social capital to invest in their children compared to higher income groups, which reproduces and enlarges inequalities (Esping-
Andersen, 2008; Woessmann, 2004). Thirdly, from the child’s perspective vertical redistribution is required to generate more equal opportunities for children with different socio-economic backgrounds to develop and flourish. In short, it can be defended from an ethical, economic and societal point of view to (partly) compensate the costs of children, with a particular focus on children living in low income families. The question to
which extent the costs should be compensated depends on the normative point of view one takes.
In practice, welfare states often combine vertical and horizontal redistribution towards
families with children. According to Verbist and Van Lancker (2016), child benefit systems show a strong correlation between vertical and horizontal equity objectives: countries that succeed in minimizing the welfare loss of childrearing tend to succeed in a larger child poverty reduction as well. This is related to the fact that children are overrepresented in low income families, which implies that child benefits, for instance,
tend to lead by default also to vertical redistribution. Several other studies have shown that family policies contribute significantly to the reduction of poverty among children (e.g. Brady & Burroway, 2012; Corak et al., 2005; Salanauskaite & Verbist, 2013; Van Mechelen & Bradshaw, 2013; Whiteford & Adema, 2007). Besides direct cash and tax benefits which contribute to income maintenance for families with children, publicly
provided goods and services can alleviate poverty through reducing the essential costs of children and facilitating parents’ labour market participation (Bäckman & Ferrarini, 2010; Förster & Verbist, 2012; Maldonado & Nieuwenhuis, 2015). However, another set of studies warns for child-centred services to be ineffective in tackling child poverty as long as these services are not accessible for all social groups in society (e.g. UNICEF, 2008; Van Lancker, 2013; Vandenbroucke & Vleminckx, 2011). Broadly speaking, scholars
agree that good performances are generally found in countries with a balanced and generous system with mutually reinforcing family support measures, combing a universal system with a targeted approach to low income families (Bäckman & Ferrarini, 2010; Van Lancker & Van Mechelen, 2015; Whiteford & Adema, 2007).
3 Identifying the cost of a child: different approaches
In this paper, we propose a needs-based measure of the cost of a child in order to
assess the extent of child cost compensation for households at different levels of gross earnings. In the literature, there are different approaches to define and measure the cost of a child. The cost of children is generally defined as the marginal cost households face when a child is added to the household. Besides the direct cost, parents experience
also an indirect opportunity cost caused by the loss of adult time and reduced labour market participation (Bradbury, 2008; Koulovatianos et al., 2009). In this paper, we do not take into account the opportunity cost, which implies that the result underestimates to some extent the real cost of a child. Even when only focusing on the direct costs, the
measurement remains a disputed question (Browning, 1992; Deaton & Muellbauer, 1986; Gray, 2007; Thévenon, 2009). For instance, one can either choose to identify only child-specific costs such as toys or education costs or add a share of collective household
costs (Oldfield & Bradshaw, 2011). The latter implies a judgement on which proportion of shared goods should be attributed to children and to which extent economies of scale play a role. Moreover, the cost of children depends on many factors such as the age, gender and rank of children (e.g. Sarlo, 2013; Thévenon, 2009), the household income (e.g. Percival & Harding, 2007), the health situation (e.g. Grupp-Phelan, Lozano, &
Fishman, 2001; Guevara et al., 2001), intra-household bargaining dynamics (e.g. Bargain & Donni, 2012) and the institutional context (e.g. Oldfield & Bradshaw, 2011; Sarlo, 2013). Finally, the presence of children itself may have an independent impact on household income, preferences and expenditure patterns (Pollak & Wales, 1979).
For the purpose of evaluating the generosity of tax-benefit policies, and measuring poverty across household types, researchers and policy makers adhere often to a rather arbitrarily chosen equivalence scale. Equivalence scales measure relative needs between households of different sizes and composition (Buhmann et al., 1988; Nelson, 1993).
The modified OECD scale, which is widely used in European studies, assigns a weight of 1 to the first adult household member, 0.5 for each additional adult member, and 0.3 for each child below the age of 14 years (OECD, 2013). According to this scale, in order to attain a similar living standard, a single parent with one child should be able to spend 30% more than a single adult. However, household needs vary in more complex ways
than suggested by the modified OECD equivalence scale and depend for instance on tenure status, health situation and the accessibility of services (Aaberge et al., 2010; Goedemé et al., 2017; Paulus et al., 2010). Moreover, economies of scale vary across the income distribution as well as between countries (Atkinson, 1992; Brandolini, 2007; Förster, 2005).
In contrast, there has been a substantial amount of research trying to assess the cost of a child in a more empirical way. Broadly speaking, two methods stand out: the indirect and the direct method. The indirect method relies on actual household expenditure
patterns. For welfare economists, the cost of children is usually defined as the additional expenditure needed for a family with children to be as well off as it would be without children. In order to compare the welfare of families with and without children they compare the level of food expenses (or other basic goods), the consumption of adult-specific goods such as alcohol, or, in a more general approach, the parents’ utility
function (Bargain & Donni, 2012; Deaton & Muellbauer, 1986; Gorman, 1976; Percival & Harding, 2007; Tsakloglou, 1991). On the other hand, the direct method is concerned with the ‘needs question’ (Browning, 1992): what goods and services do children minimally need to satisfy their basic needs, and how much does it cost for households? This normative perspective is the dominant approach in reference budgets research1 (Mac Mahon et al., 2012; Sarlo, 2013; Saunders, 1999; Storms & Bogaerts, 2012).
Following this approach, the cost of children is often computed by subtracting the reference budget of a family without children from the budget of a family with children. The difference reflects the child-specific costs as well as the cost of shared household items that can be attributed to children (e.g. Oldfield & Bradshaw, 2011; Storms & Bogaerts, 2012). Obviously, the identified cost of the child depends on the targeted living standard for which the reference budgets were developed.
4 Data and methods
In this paper, we apply the direct method to derive what children cost at the minimum in
order to participate adequately in society. We do so by making use of reference budgets for a range of household types in six European welfare states. The added value of this
approach is twofold. Firstly, as explained elsewhere, reference budgets start from a
1 Reference budgets and budget standards are equivalent terms.
theoretically and empirically justified list of needs, and subsequently identify the cost of essential goods and services to fulfil these needs (cf. Goedemé et al., 2015b). This approach has clear advantages compared to relying on data about actual expenditure
patterns, as these are driven jointly by budget constraints and household needs (Oldfield & Bradshaw, 2011). Secondly, reference budgets take into account the cost-reducing benefits of publicly-provided or subsidized goods and services (Gazeley & Newell, 2000; Nelson, 1993). In what follows we provide further details on the reference budgets that we use. Subsequently we explain how we estimate social and fiscal cash benefits for households with children as compared to households without children.
4.1 The estimation of the cost of children: reference budgets
In this paper, we look at the cost of children from what we call a ‘needs-based approach’. With this approach, the cost of children is estimated starting from a normative and empirical assessment of the cost of goods and services that can be
considered necessities. The outcome consists of so-called ‘reference budgets’ (RBs). We start from the first attempt to create cross-nationally comparable reference budgets that illustrate which goods and services hypothetical households need at the minimum to participate adequately in society (Goedemé et al., 2015b).
More in particular, the RBs have been developed for six European cities (Antwerp, Athens, Barcelona, Budapest, Helsinki, Milan) on the basis of a common theoretical and methodological framework (Goedemé et al., 2015b). In order to participate adequately in society, ten ‘intermediate needs’ are identified (cf. Doyal & Gough, 1991): adequate
food, clothing, housing, personal care and health care, safety in childhood, mobility, rest and leisure and maintaining social relations2 (see Annex 2 for a more detailed list of included cost components). Based on a variety of information sources including (inter)national guidelines, scientific literature, focus group discussions, survey data and some common assumptions, national teams translate the intermediate needs into
detailed lists of goods and services which are adapted to the local context (Goedemé et al., 2015a, 2015b). All items were priced during the first half of 2014 in well-spread and acceptable retailers following a common procedure. Importantly, we collected out-of-pocket costs for households in terms of the disposable income that is required (net income after income taxes and social contributions). In other words, prices include VAT, and take account of reimbursements that people can receive, in particular in the case of
health care. The cost of a dwelling was estimated at the 30th percentile of the housing cost distribution of dwellings that met some minimum quality criteria (Van den Bosch et al., 2016)3. Given that the budgets were developed for large cities, the cost of a car was not included.
As expected, the resources one needs at the minimum differ largely across households depending on the socio-economic context and the characteristics of the household members. Therefore, the RBs are developed for a limited number of well-defined
household types. In this paper, we make use of the household types available for the ImPRovE reference budgets (Goedemé et al., 2015b): a single person or couple without children; a single person or couple with one child; a single person or couple with two children. The adults are assumed to be at working age. The children are assumed to be 6-11 years old (boy) or 12-17 years old (girl)4. The cost of childcare is not included due to the large variation in care instruments and their formal and informal use within
2 It should be noted that some needs are not fully covered by the reference budgets presented in
this paper, notably security and life-long learning. 3 Due to data limitations, the reference costs of housing are estimated for the year 2012 and refer
to a broader region than the capital city. Prices are adjusted to 2014 using specific price indices for ‘actual rentals’ and ‘electricity, gas and other fuels’ (Goedemé et al., 2015b; Van den Bosch et al.,
2016). 4 In Helsinki researchers have built further on results from previous work and assumed a boy of 4
years old rather than a girl of 14 years old.

countries, which depends largely on the family’s living situation such as the age of children, labour market opportunities, cultural and social norms and the availability of private and public childcare provisions (Janta, 2014).
Furthermore, we also assume that all household members are well-informed, self-reliant, in good health and make use of public services if they have access to them. Of course, these assumptions do not represent the real-life situation of households but should be
seen as a reference bottom line. When people are not self-reliant, do not have the necessary budget competences or information, do not have access to public services or are not in a good health, they will need more resources to participate adequately in society (Goedemé et al., 2015b). Obviously, it is impossible to estimate the exact cost of accessing essential goods and services. To some extent what ‘adequate social
participation’ implies in terms of essential goods and services, as well as their lifespan and price, remains elusive, as it depends so much on the concrete situation at hand and in practice ‘adequacy’ is gradual (Goedemé et al., 2015a). Therefore, one should be careful with paying too much attention to small differences in the level of the reference budgets between the cities, and rather focus on the main trends.
In 2014, the total reference budgets range from 524 EUR5 to 1206 EUR per month for a single person household and from 1352 EUR to 2578 EUR per month for a couple with two children, renting a dwelling at the private market in Budapest respectively Helsinki
(for a more detailed review, see Goedemé et al., 2015b). In all cities except for Athens, the budget for outright owners is on average 27% lower compared to private tenants. It should be noted that the representativeness of the results differs across countries. For instance, in Hungary more than 70% of the population are outright owners, while less than 5% rents a dwelling on the private market. In Belgium, on the other hand, only
30% of the population owns a house without paying mortgage, while the proportion of private tenants is nearly 20% (authors’ calculations on EU-SILC 2014). Also, the cost of adequate social participation is calculated for specific cities, and cannot readily be extrapolated to the rest of the country. Nonetheless, in what follows we assume that this does not affect the ranking of countries.
By subtracting the budget of a family without children from the budget of a family with children, the cost of children of different ages can be calculated, taking into account both child-specific costs and shared household costs. Moreover, comparing different
household types while adhering to similar ‘preferences’ (e.g. in terms of a healthy lifestyle, diet, use of public transport, types of products bought) allows us to identify economies of scale. By looking at the effective cost for private households to access essential goods and services, welfare state generosity in terms of benefits in kind is automatically taken into account.
4.2 The estimation of cash benefits for families with children: HHoT
In order to simulate taxes and benefits that apply to a specific gross wage, we make use of the Hypothetical Household Tool (HHoT). HHoT is a new instrument that is part of the European tax-benefit microsimulation model EUROMOD (cf. Sutherland & Figari, 2013).
The flexibility of the tool allows the user to specify a large variation of hypothetical households for which the net income, given a pre-specified gross income, can be simulated (Hufkens et al., 2016). The characteristics of the hypothetical households are exactly the same as those used for constructing the reference budgets, including the reference housing costs for tenants and outright owners. We specify the gross income
for single and couple households in the case of (1) earning 40% of a single average wage, (2) earning a single average wage or (3) earning 150% of a single average wage. Wages are extracted from the OECD’s online database (OECD, 2016). For the countries under study, 40% of the average wage represents a low wage, approximating the
5 For Budapest, the exchange rate is 300 HUF to the euro.
minimum wage6. While keeping the gross wage constant, we subtract the net income of a family without children from the net income of a similar family with children. This allows us to identify the total cash (dis)advantage provided by the state related to
having children, the so-called net ‘‘child-contingent’’ payments (see Figari et al., 2011). We call this the child cash benefit package.
In each country, the child cash benefit package is simulated for the year 2014 and
consists of several income components, including gross income, personal income taxes and social contributions for employees, family benefits, social assistance top-ups and housing benefits. In Greece, Italy and Spain there are no national social assistance benefit schemes, but both in Italy and Spain eligible households can be covered by regional social assistance. Only for Spain, this regional information is included in
EUROMOD and, in this paper, social assistance is simulated for Catalonia. Housing allowances are, for our specific household types in the year 2014, only simulated in Hungary7 where home maintenance support is allocated to households with an income under a certain threshold, who pay housing costs equal to 20% or more of the total monthly income. The total disposable income of the household refers to the sum of all
income components, subtracting taxes and social contributions. It is important to stress that the cash components covered are limited to those simulated in EUROMOD. Therefore, study allowances and tax deductions for the use of services (e.g. the use of childcare), are not included8.
5 The generosity of welfare states to families with children
In this section we take a hypothetical household approach in order to assess the
generosity of six different welfare states to single earner families with children. We start with a brief comparison of the level of public social spending in order to reveal overall cross-national differences in government efforts. Secondly, we discuss the essential costs of children in primary and secondary school as derived from reference budget
research. Thirdly, more insight is given into the level and determinants of the simulated child cash benefit packages in the six welfare states. Finally, at the end of this section, we propose an indicator that can contribute to assess welfare state generosity to families with children: the child cost compensation indicator.
5.1 Government social expenditure on families with children
A frequently used indicator in studies assessing the generosity of welfare states towards families is the level of public social expenditures going to families with children (see Annex 1). If we look at the spending on families9 as a proportion of the total public social expenditure, the Hungarian government spends the highest share on families (about 12%). If we include spending on primary to tertiary education, the Finnish government devotes the highest share of total spending to families (about 25%), followed closely by
Belgium and Hungary, while in the South of Europe much less is spent on families with
6 In Belgium the minimum wage is about 40% of the average wage, in Greece and Hungary about
35% and in Spain about 20% of the average wage. In Italy and Finland there is no statutory
minimum wage. (Eurofound, 2016; OECD, 2016) 7 In the other countries, for the year under study housing allowances are not simulated because of
a lack of information in Euromod due to the complexity (FI), the regional housing benefit systems (IT & ES) or the specific targeting and limited scope of the allowance (BE, EL). 8 Adding these to the child benefit package can make an important difference. For instance, in
Belgium a study allowance amounts to between 155 and 572 euro a year for a family with one
child in primary respectively secondary education. The tax deduction for the use of childcare is
around 500 euro a year for a single earner family working on a minimum wage (authors’ calculations with MOTYFF, 2015 (Vandelannoote et al., 2014). 9 Public spending on families with children includes spending on family benefits and allowances,
parental leave benefits, childcare and early childhood education (OECD Social expenditure
database, 2013).
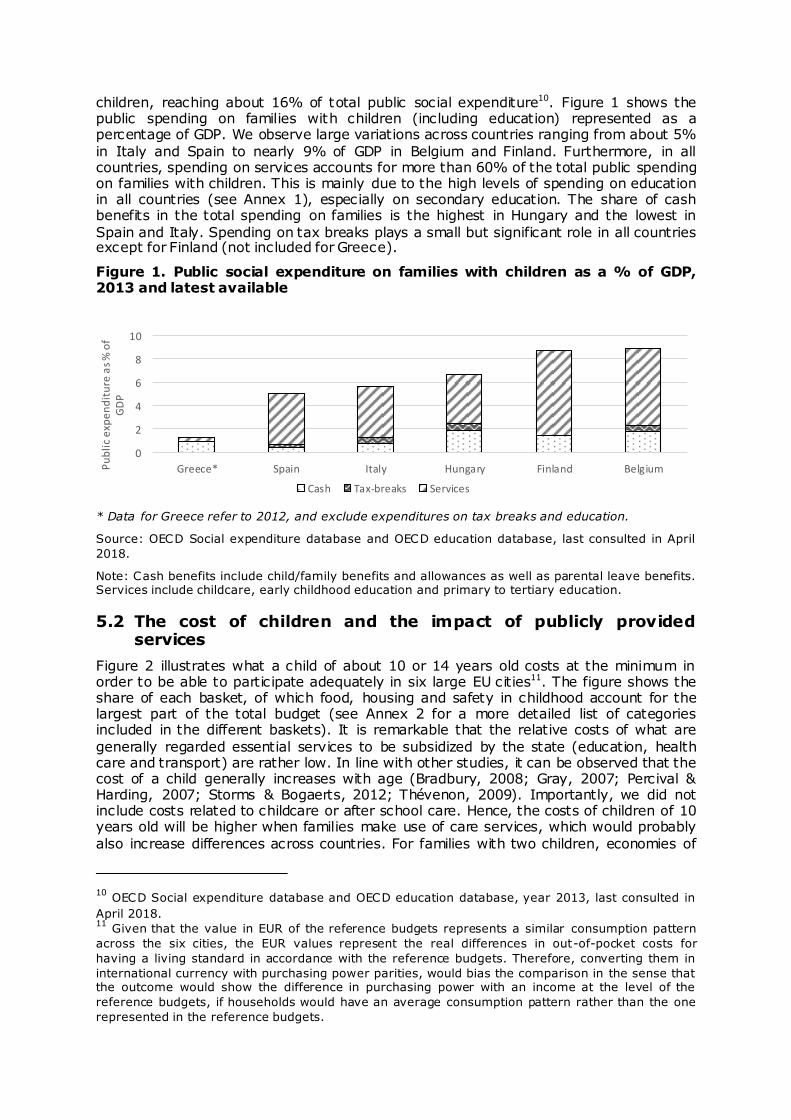
children, reaching about 16% of total public social expenditure10. Figure 1 shows the public spending on families with children (including education) represented as a percentage of GDP. We observe large variations across countries ranging from about 5%
in Italy and Spain to nearly 9% of GDP in Belgium and Finland. Furthermore, in all countries, spending on services accounts for more than 60% of the total public spending on families with children. This is mainly due to the high levels of spending on education in all countries (see Annex 1), especially on secondary education. The share of cash benefits in the total spending on families is the highest in Hungary and the lowest in
Spain and Italy. Spending on tax breaks plays a small but significant role in all countries except for Finland (not included for Greece).
Figure 1. Public social expenditure on families with children as a % of GDP, 2013 and latest available
* Data for Greece refer to 2012, and exclude expenditures on tax breaks and education.
Source: OECD Social expenditure database and OECD education database, last consulted in April
2018.
Note: Cash benefits include child/family benefits and allowances as well as parental leave benefits. Services include childcare, early childhood education and primary to tertiary education.
5.2 The cost of children and the impact of publicly provided services
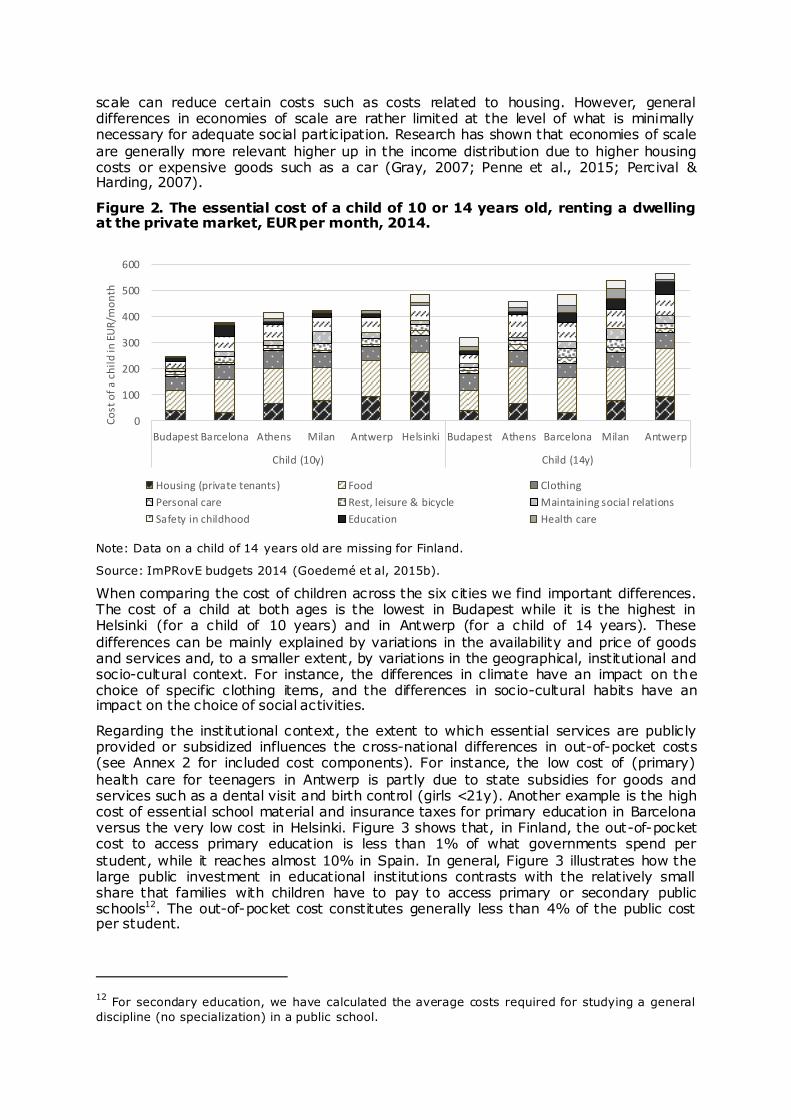
Figure 2 illustrates what a child of about 10 or 14 years old costs at the minimum in order to be able to participate adequately in six large EU cities11. The figure shows the share of each basket, of which food, housing and safety in childhood account for the largest part of the total budget (see Annex 2 for a more detailed list of categories included in the different baskets). It is remarkable that the relative costs of what are
generally regarded essential services to be subsidized by the state (education, health care and transport) are rather low. In line with other studies, it can be observed that the cost of a child generally increases with age (Bradbury, 2008; Gray, 2007; Percival & Harding, 2007; Storms & Bogaerts, 2012; Thévenon, 2009). Importantly, we did not include costs related to childcare or after school care. Hence, the costs of children of 10 years old will be higher when families make use of care services, which would probably
also increase differences across countries. For families with two children, economies of
10 OECD Social expenditure database and OECD education database, year 2013, last consulted in
April 2018. 11 Given that the value in EUR of the reference budgets represents a similar consumption pattern
across the six cities, the EUR values represent the real differences in out-of-pocket costs for
having a living standard in accordance with the reference budgets. Therefore, converting them in
international currency with purchasing power parities, would bias the comparison in the sense that the outcome would show the difference in purchasing power with an income at the level of the
reference budgets, if households would have an average consumption pattern rather than the one
represented in the reference budgets.
0
2
4
6
8
10
Greece* Spain Italy Hungary Finland BelgiumPu
bli
c e
xpe
nd
itu
re a
s %
of
GD
P
Cash Tax-breaks Services
scale can reduce certain costs such as costs related to housing. However, general differences in economies of scale are rather limited at the level of what is minimally necessary for adequate social participation. Research has shown that economies of scale
are generally more relevant higher up in the income distribution due to higher housing costs or expensive goods such as a car (Gray, 2007; Penne et al., 2015; Percival & Harding, 2007).
Figure 2. The essential cost of a child of 10 or 14 years old, renting a dwelling at the private market, EUR per month, 2014.
Note: Data on a child of 14 years old are missing for Finland.
Source: ImPRovE budgets 2014 (Goedemé et al, 2015b).
When comparing the cost of children across the six cities we find important differences. The cost of a child at both ages is the lowest in Budapest while it is the highest in Helsinki (for a child of 10 years) and in Antwerp (for a child of 14 years). These
differences can be mainly explained by variations in the availability and price of goods and services and, to a smaller extent, by variations in the geographical, institutional and socio-cultural context. For instance, the differences in climate have an impact on the choice of specific clothing items, and the differences in socio-cultural habits have an impact on the choice of social activities.
Regarding the institutional context, the extent to which essential services are publicly provided or subsidized influences the cross-national differences in out-of-pocket costs (see Annex 2 for included cost components). For instance, the low cost of (primary)
health care for teenagers in Antwerp is partly due to state subsidies for goods and services such as a dental visit and birth control (girls <21y). Another example is the high cost of essential school material and insurance taxes for primary education in Barcelona versus the very low cost in Helsinki. Figure 3 shows that, in Finland, the out-of-pocket cost to access primary education is less than 1% of what governments spend per
student, while it reaches almost 10% in Spain. In general, Figure 3 illustrates how the large public investment in educational institutions contrasts with the relatively small share that families with children have to pay to access primary or secondary public schools12. The out-of-pocket cost constitutes generally less than 4% of the public cost per student.
12 For secondary education, we have calculated the average costs required for studying a general
discipline (no specialization) in a public school.
0
100
200
300
400
500
600
Budapest Barcelona Athens Milan Antwerp Helsinki Budapest Athens Barcelona Milan Antwerp
Child (10y) Child (14y)
Co
st o
f a
ch
ild
in E
UR
/mo
nth
Housing (private tenants) Food Clothing
Personal care Rest, leisure & bicycle Maintaining social relations
Safety in childhood Education Health care

Figure 3. The minimum out-of-pocket cost of education expressed as % of the total public expenditure on education per student, for a child in primary and secondary education, year 2013-2014.
Notes: Data on a child of 14 years old are missing for Finland. Data on spending on education are lacking for Greece.
Source: OECD education database & ImPRovE budgets 2014 (Goedemé et al, 2015b)
The total monthly cost to access education, health care and public transport services
varies between 17 EUR (for a child of 10 years old in Budapest) and 110 EUR (for a child of 14 years old in Milan). In most countries there exist various means-tested cost reductions for low income families. However, due to their conditional and fragmented character –causing high information costs and therefore high levels of non-take-up (Hernanz et al., 2004)- we do not take these into account. Figure 4 shows how the cost
of services for children compares to the average wage. As a percentage of the average wage, costs are the lowest in Antwerp while they are relatively high in Barcelona, Athens and Budapest. Looking at price level indices, the overall cross-national variation in out-of-pocket costs of these three public services is higher than average price variation of private goods and services13.
Figure 4. The minimum out-of-pocket cost of three public services for a child of 10 and 14 years old, expressed as % of the average gross wage, 2014
Source: ImPRovE budgets 2014 (Goedemé et al, 2015b) & OECD average wages (OECD, 2016).
13 Based on own calculations comparing the cross-country variation in the out-of-pocket costs of
health care and education with the average price differences based on price level indices for final
consumption expenditure by private households (retrieved from Eurostat, 2014)
0
2
4
6
8
10
12
Helsinki Antwerp Milan Budapest Barcelona
Ou
t-o
f-p
ock
et
cost
as
% o
f p
ub
lic
exp
en
dit
ure
pe
r
stu
de
nt
primary education secondary education
0
2
4
6
8
Antwerp Milan Helsinki Budapest Barcelona Athens Antwerp Athens Milan Barcelona Budapest
child (10y) child (14y)
Ou
t-o
f-p
ock
et
cost
as
% o
f a
vera
ge g
ross
wa
ge
Education Health care Public transport
5.3 The level and determinants of child cash benefit packages
As explained above, the child cash benefit package corresponds to the specific cash advantages for families with children compared to similar families without children. In other words, this reflects the implicit equivalence scale of a child in the tax-benefit system (see e.g. Van de Ven et al., 2017). In all countries, the level of this child cash benefit package is conditioned by different factors such as the household composition
and the gross income. Since we assume that the family members are healthy and able-bodied, in what follows we will not consider the variations according to health or disability status.
Figure 5. The child cash benefit package at 40%, 100% and 150% of the average gross wage, for a child (10y), living in a single parent family, renting a dwelling at the private market, expressed in PPS per month, 2014.
Source: own calculations using HHoT/EUROMOD 2014. Purchasing power parities for final
household consumption expenditure extracted from the Eurostat on-line database.
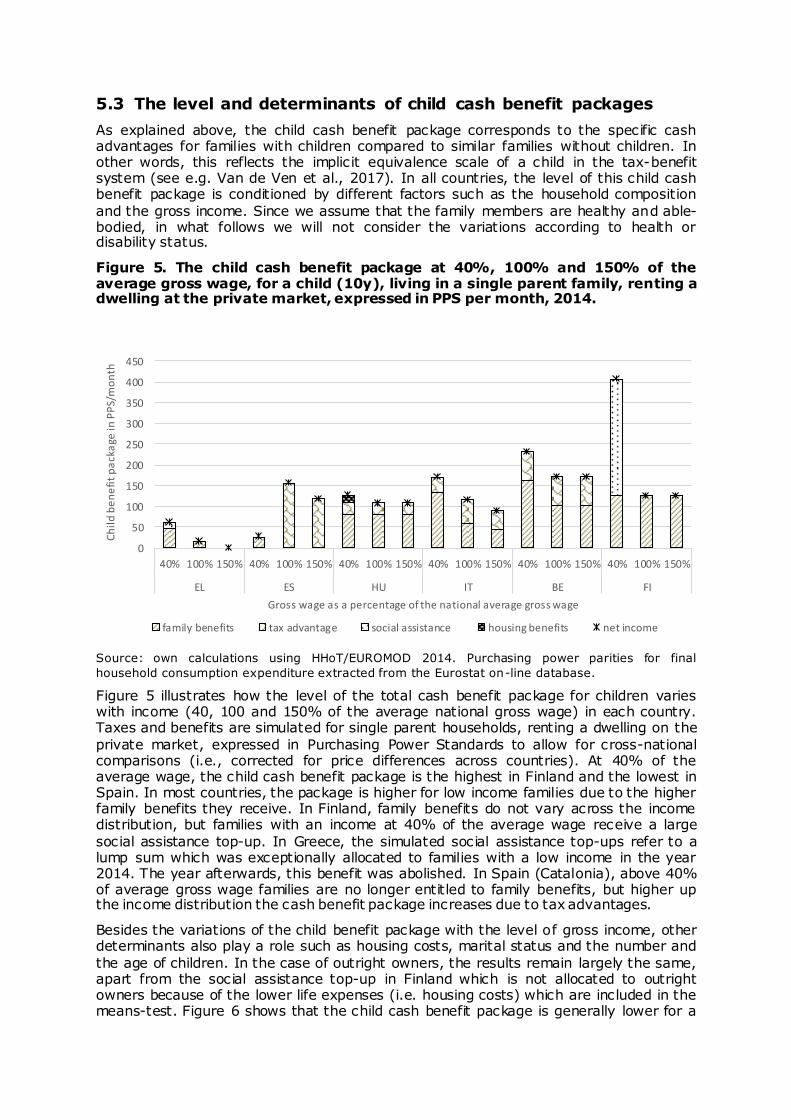
Figure 5 illustrates how the level of the total cash benefit package for children varies with income (40, 100 and 150% of the average national gross wage) in each country. Taxes and benefits are simulated for single parent households, renting a dwelling on the
private market, expressed in Purchasing Power Standards to allow for cross-national comparisons (i.e., corrected for price differences across countries). At 40% of the average wage, the child cash benefit package is the highest in Finland and the lowest in Spain. In most countries, the package is higher for low income families due to the higher family benefits they receive. In Finland, family benefits do not vary across the income distribution, but families with an income at 40% of the average wage receive a large
social assistance top-up. In Greece, the simulated social assistance top-ups refer to a lump sum which was exceptionally allocated to families with a low income in the year 2014. The year afterwards, this benefit was abolished. In Spain (Catalonia), above 40% of average gross wage families are no longer entitled to family benefits, but higher up the income distribution the cash benefit package increases due to tax advantages.
Besides the variations of the child benefit package with the level of gross income, other determinants also play a role such as housing costs, marital status and the number and
the age of children. In the case of outright owners, the results remain largely the same, apart from the social assistance top-up in Finland which is not allocated to outright owners because of the lower life expenses (i.e. housing costs) which are included in the means-test. Figure 6 shows that the child cash benefit package is generally lower for a
0
50
100
150
200
250
300
350
400
450
40% 100% 150% 40% 100% 150% 40% 100% 150% 40% 100% 150% 40% 100% 150% 40% 100% 150%
EL ES HU IT BE FI
Ch
ild
be
ne
fit
pa
cka
ge in
PP
S/m
on
th
Gross wage as a percentage of the national average gross wage
family benefits tax advantage social assistance housing benefits net income
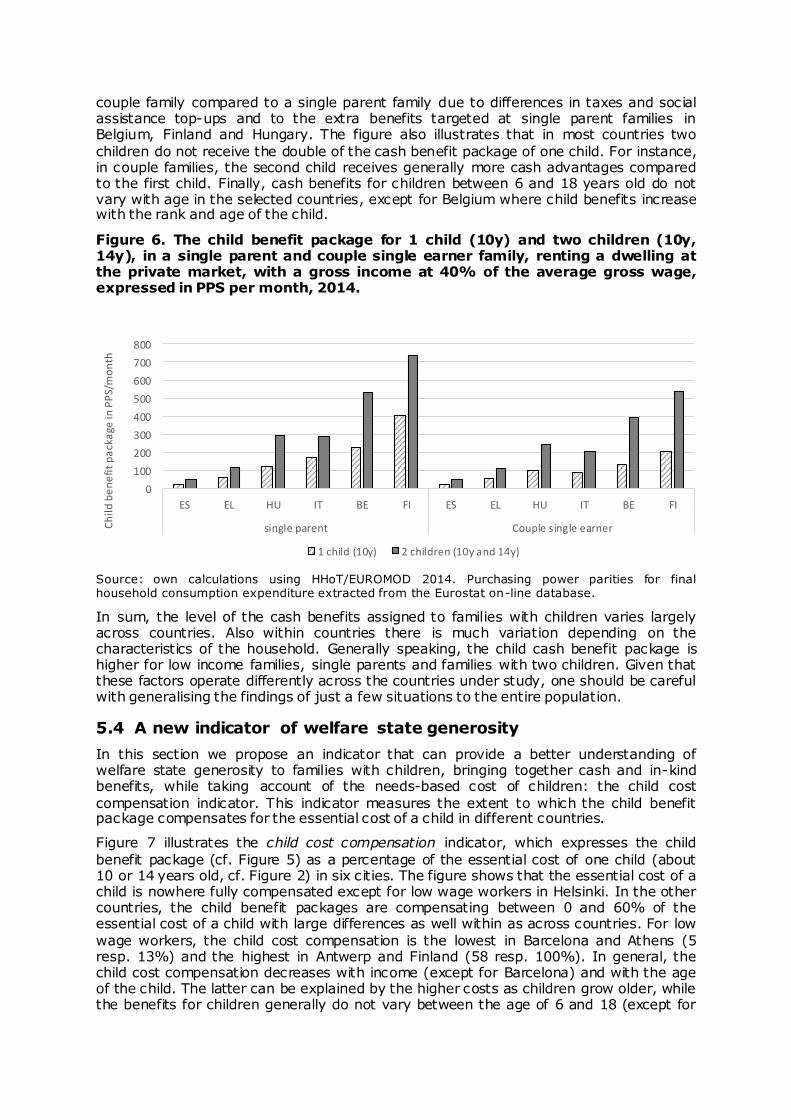
couple family compared to a single parent family due to differences in taxes and social assistance top-ups and to the extra benefits targeted at single parent families in Belgium, Finland and Hungary. The figure also illustrates that in most countries two
children do not receive the double of the cash benefit package of one child. For instance, in couple families, the second child receives generally more cash advantages compared to the first child. Finally, cash benefits for children between 6 and 18 years old do not vary with age in the selected countries, except for Belgium where child benefits increase with the rank and age of the child.
Figure 6. The child benefit package for 1 child (10y) and two children (10y, 14y), in a single parent and couple single earner family, renting a dwelling at the private market, with a gross income at 40% of the average gross wage, expressed in PPS per month, 2014.
Source: own calculations using HHoT/EUROMOD 2014. Purchasing power parities for final household consumption expenditure extracted from the Eurostat on-line database.
In sum, the level of the cash benefits assigned to families with children varies largely across countries. Also within countries there is much variation depending on the characteristics of the household. Generally speaking, the child cash benefit package is higher for low income families, single parents and families with two children. Given that these factors operate differently across the countries under study, one should be careful with generalising the findings of just a few situations to the entire population.
5.4 A new indicator of welfare state generosity
In this section we propose an indicator that can provide a better understanding of welfare state generosity to families with children, bringing together cash and in-kind benefits, while taking account of the needs-based cost of children: the child cost
compensation indicator. This indicator measures the extent to which the child benefit package compensates for the essential cost of a child in different countries.
Figure 7 illustrates the child cost compensation indicator, which expresses the child
benefit package (cf. Figure 5) as a percentage of the essential cost of one child (about 10 or 14 years old, cf. Figure 2) in six cities. The figure shows that the essential cost of a child is nowhere fully compensated except for low wage workers in Helsinki. In the other countries, the child benefit packages are compensating between 0 and 60% of the essential cost of a child with large differences as well within as across countries. For low
wage workers, the child cost compensation is the lowest in Barcelona and Athens (5 resp. 13%) and the highest in Antwerp and Finland (58 resp. 100%). In general, the child cost compensation decreases with income (except for Barcelona) and with the age of the child. The latter can be explained by the higher costs as children grow older, while the benefits for children generally do not vary between the age of 6 and 18 (except for
0
100
200
300
400
500
600
700
800
ES EL HU IT BE FI ES EL HU IT BE FI
single parent Couple single earnerCh
ild
be
ne
fit
pa
cka
ge in
PP
S/m
on
th
1 child (10y) 2 children (10y and 14y)
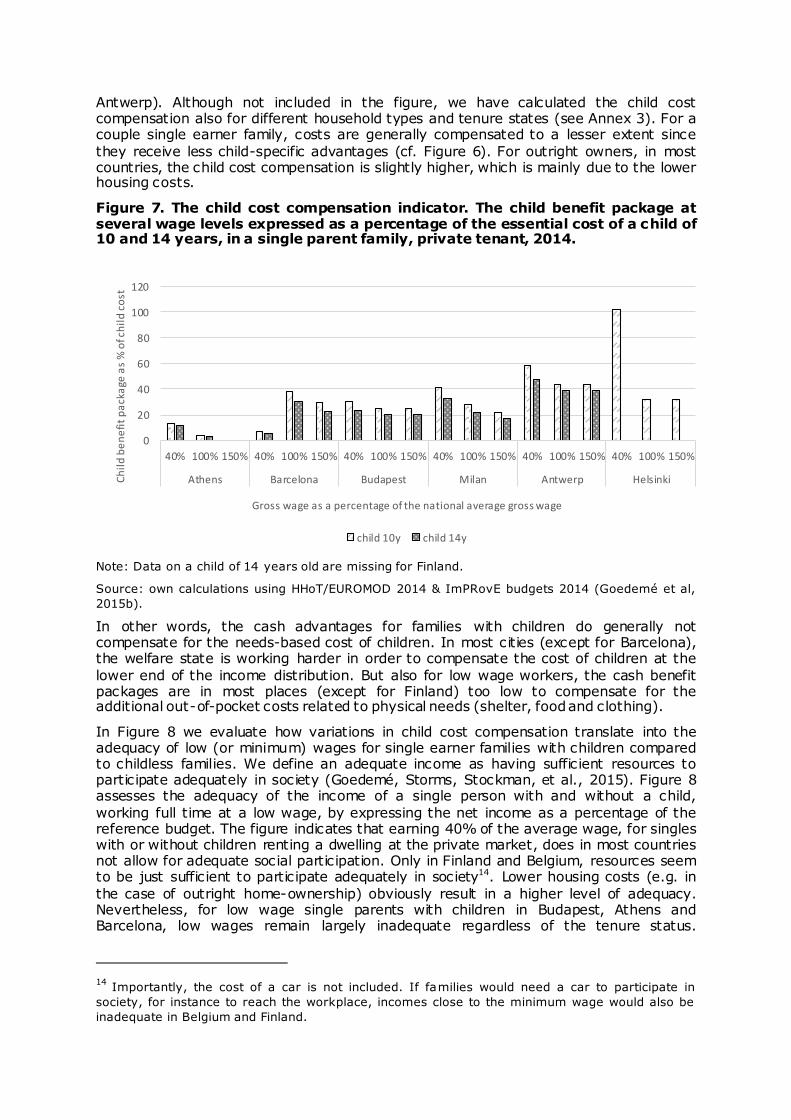
Antwerp). Although not included in the figure, we have calculated the child cost compensation also for different household types and tenure states (see Annex 3). For a couple single earner family, costs are generally compensated to a lesser extent since
they receive less child-specific advantages (cf. Figure 6). For outright owners, in most countries, the child cost compensation is slightly higher, which is mainly due to the lower housing costs.
Figure 7. The child cost compensation indicator. The child benefit package at several wage levels expressed as a percentage of the essential cost of a child of 10 and 14 years, in a single parent family, private tenant, 2014.
Note: Data on a child of 14 years old are missing for Finland.
Source: own calculations using HHoT/EUROMOD 2014 & ImPRovE budgets 2014 (Goedemé et al,
2015b).
In other words, the cash advantages for families with children do generally not compensate for the needs-based cost of children. In most cities (except for Barcelona), the welfare state is working harder in order to compensate the cost of children at the
lower end of the income distribution. But also for low wage workers, the cash benefit packages are in most places (except for Finland) too low to compensate for the additional out-of-pocket costs related to physical needs (shelter, food and clothing).
In Figure 8 we evaluate how variations in child cost compensation translate into the adequacy of low (or minimum) wages for single earner families with children compared to childless families. We define an adequate income as having sufficient resources to participate adequately in society (Goedemé, Storms, Stockman, et al., 2015). Figure 8 assesses the adequacy of the income of a single person with and without a child,
working full time at a low wage, by expressing the net income as a percentage of the reference budget. The figure indicates that earning 40% of the average wage, for singles with or without children renting a dwelling at the private market, does in most countries not allow for adequate social participation. Only in Finland and Belgium, resources seem to be just sufficient to participate adequately in society14. Lower housing costs (e.g. in
the case of outright home-ownership) obviously result in a higher level of adequacy. Nevertheless, for low wage single parents with children in Budapest, Athens and Barcelona, low wages remain largely inadequate regardless of the tenure status.
14 Importantly, the cost of a car is not included. If families would need a car to participate in
society, for instance to reach the workplace, incomes close to the minimum wage would also be
inadequate in Belgium and Finland.
0
20
40
60
80
100
120
40% 100% 150% 40% 100% 150% 40% 100% 150% 40% 100% 150% 40% 100% 150% 40% 100% 150%
Athens Barcelona Budapest Milan Antwerp HelsinkiCh
ild
be
ne
fit
pa
cka
ge a
s %
of c
hil
d c
ost
Gross wage as a percentage of the national average gross wage
child 10y child 14y

Importantly, we observe that the net incomes of families with children are everywhere (except for private tenants in Finland) less adequate compared to families without children. This warrants further in-depth political debate about reducing the cost of
children or increasing the cash advantages towards families with children, especially for families living on a very low income.
Figure 8. The adequacy of the net income of a single without and with a child
(10y), working full time at 40% of the average wage, private tenants vs. outright owners, 2014.
Source: own calculations using HHoT/EUROMOD 2014 & ImPRovE budgets 2014 (Goedemé et al, 2015b).
6 Discussion & conclusions
In this paper we have assessed the generosity of six welfare states to families with
children compared to similar families without children. We argue that purely cash-based evaluations of the generosity of welfare states miss an important dimension, which cannot be adequately assessed by looking at government expenditures only. Hypothetical household simulations of both essential out-of-pocket costs and tax-benefits can (partly) fill this gap. Reference budgets offer a tool to estimate the
minimum cost of allowing children to participate adequately in society, including the out-of-pocket cost for publicly provided or subsidized services. The Hypothetical Household Tool in EUROMOD allows to estimate how tax-benefit rules affect the net income of a family when children are added to the household, keeping everything else constant. We have proposed a new indicator that, by combining these two sources of information, can contribute to a better understanding of welfare state generosity to families with children.
The child cost compensation indicator informs us that, in most of the selected cities, the essential cost of a child is compensated to a rather small extent, generally less than
60%. Only for low wage workers paying private rent in Finland, child costs are fully compensated. Although there are large cross-national variations, it is clear that a single earner family with and without a child is generally not equally well off in terms of the disposable income that is needed for adequate social participation, while assuming the same labour supply and gross wage. This raises the question about how this compares to
reasonable horizontal equity objectives. Secondly, although family policies work stronger at the lower end of the income distribution (except for Barcelona) the income of low wage single earners with children is in many cases, especially concerning private tenants, insufficient to participate adequately in society. Furthermore, we find that the generosity of the child benefit package differs across household types. The child cost
020406080
100120140160180200
Bu
dap
est
Ath
en
s
Ba
rce
lon
a
Mila
n
He
lsin
ki
Ant
we
rp
Bu
dap
est
Ath
en
s
Mila
n
Ba
rce
lon
a
He
lsin
ki
Ant
we
rp
private tenant outright ownerNet
in
com
e a
s %
of r
efer
ence
bu
dge
t
single single+10y
compensation is higher for single parent families and families with younger children as compared to couples with children and families with older children. Hence, we argue that the essential cost of teenagers, which is often neglected in current studies on family
policies, is important to take into account when analysing welfare state generosity and child poverty.
The results of the paper are not necessarily contradicting previous cross-national
comparisons of welfare state generosity towards families with children. Yet, they refine our insights into two main issues: (1) the conjunction of cash and in-kind benefits in supporting families with children, and, (2) the ranking of welfare states based on high or low roads in supporting families with children. Firstly, in line with previous studies (e.g. Förster & Verbist, 2012; Vandenbroucke & Vleminckx, 2011), we see no conflict between
cash and in-kind benefits, although they are not always going hand in hand either. In Antwerp and Helsinki, generous family benefits are accompanied by a generous provision or subsidization of child-specific services, while in Barcelona and Athens, families with children receive not only lower cash support, but families seem to face also relatively higher costs in order to access essential services. In contrast, Milan and Budapest assign
relatively generous family-specific cash support to low wage earners but combine this with a relatively high cost of publicly provided services.
Secondly, on the one hand, our findings support welfare state ranking based on the
public spending on families with children: Belgium and Finland taking a high support-road to compensate families with children, while Spain and Greece show rather limited support. In Barcelona and Athens, the low child cost compensation reflects the ‘South European familialism hypothesis’ (Karamessini, 2008). Moreover, by relying more on tax breaks, low income families in Barcelona benefit less from the child-specific advantages
compared to high income families (where the child cost compensation is significantly higher). In contrast to the ranking in some previous studies (e.g. Thévenon, 2011, De Henau, 2006, Bradshaw & Finch, 2002), Milan shows a relatively high child cost compensation, especially for low wage earners. Compared to the rather low levels of public spending, the Italian government seems to focus on supporting families with
children at the lower end of the income distribution through cash benefits. However, incomes of low-wage workers renting a dwelling at the private market remain inadequate, and families with children are still less well-off compared to childless families in terms of fulfilling their needs for adequate social participation and in terms of being at-risk-of-poverty (Eurostat, 2016).
Our approach has several limitations. The most important limitation is that we can only estimate the cost of children and welfare state generosity for a limited number of hypothetical situations, focusing solely on working –single earner– families. These
situations cannot be taken to be representative for the population in the various countries under study. For instance, renting a dwelling at the private market, is much more common in some countries (e.g. Belgium) than in others (e.g. Hungary). Another limitation of our study is that we estimated the cost of children in particular cities. We are well aware that in some countries significant regional price variations (in particular
related to housing), as well as regional policies do exist. The tax-benefit simulations do not take account of all local policies (e.g. local taxes), implying there is some mismatch between the calculated cost of children and the estimated generosity of the welfare state. Moreover, when focusing on the value of education, health care, and public transport we only take into account the minimum out-of-pocket cost, while disregarding other important differences across regions in the quality and availability of the services.
Despite these limitations, the hypothetical household approach has the advantage of clarity: it is a pure institutional approach in the sense that we compare how the same
hypothetical households would fare in the six cities. The results are not blurred by different compositions of the population in each of these countries, or different rates of take-up and compliance. Obviously, an assessment based on representative survey data would offer a very valuable complement to our study, but implies the necessity t o estimate the cost of children for a much broader range of situations. We are convinced

that the indicator proposed in this paper offer an added value in understanding how generous different welfare states are towards families with children by going beyond cash benefits and trying to take better into account welfare state efforts in providing and
subsidizing essential goods and services, a perspective that has received too little attention, in spite of its (growing) importance.

References
Aaberge, R., Bhuller, M., Langørgen, A., & Mogstad, M. (2010). The distributional impact of public services when needs differ. Journal of Public Economics, 94(9), 549-562.
Adema, W. (2012). Setting the scene: The mix of family policy objectives and packages across the OECD. Children and Youth Services Review, 34(3), 487-498.
Atkinson, A. B. (1992). Measuring poverty and differences in family composition. Economica, 59(233), 1-16.
Bäckman, O., & Ferrarini, T. (2010). Combating child poverty? A multilevel assessment of family policy institutions and child poverty in 21 old and new welfare states. Journal of Social Policy, 39(02), 275-296.
Bargain, O., & Donni, O. (2012). Expenditure on children: A Rothbarth-type method consistent with scale economies and parents' bargaining. European Economic Review, 56(4), 792-813.
Bonoli, G., & Reber, F. (2010). The political economy of childcare in OECD countries: Explaining cross‐national variation in spending and coverage rates. European Journal of Political Research, 49(1), 97-118.
Bradbury, B. (1994). Measuring the cost of children. Australian Economic Papers, 33(62), 120-138.
Bradbury, B. (2008). Time and the cost of children. Review of income and wealth, 54(3), 305-323.
Bradbury, B., Jäntti, M., & Lindahl, L. (2017). Labour income, social transfers and child poverty. LIS Working Paper Series, No. 707. Luxembourg: Luxembourg Income Study (LIS).
Bradshaw, J., & Finch, N. (2002). A comparison of child benefit packages in 22 countries (pp. 248): Norwich, UK Department for work and pensions.
Brady, D., & Burroway, R. (2012). Targeting, universalism, and single-mother poverty: A multilevel analysis across 18 affluent democracies. Demography, 49(2), 719-746.
Brandolini, A. (2007). Measurement of income distribution in supranational entities: The case of the European Union. In S. P. Jenkins & J. Micklewright (Eds.), Inequality and Poverty Re-Examined (pp. 62-83). Oxford: Oxford University Press.
Browning, M. (1992). Children and household economic behavior. Journal of Economic Literature, 30(3), 1434-1475.
Buhmann, B., Rainwater, L., Schmaus, G., & Smeeding, T. M. (1988). Equivalence Scales, Well‐Being, Inequality, and Poverty: Sensitivity Estimates across Ten Countries
Using the Luxembourg Income Study (LIS) Database. Review of Income and Wealth, 34(2), 115-142.
Cerami, A. (2006). Social Policy in Central and Eastern Europe. The Emergence of a New European Welfare Regime. Berlin: Lit Verlag.
Chen, W.-H., & Corak, M. (2008). Child poverty and changes in child poverty. Demography, 45(3), 537-553.
Corak, M. (2006). Do poor children become poor adults? Lessons for public policy from a cross country comparison of generational earnings mobility. Research on Economic Inequality, 13(1), 143-188.
Corak, M., Lietz, C., & Sutherland, H. (2005). The impact of tax and transfer systems on children in the European Union. EUROMOD Working Paper Series, No. EM4/05.
Daly, M., & Ferragina, E. (2017). Family policy in high-income countries: Five decades of development. Journal of European Social Policy, 0(0), 1-16.
De Henau, J., Meulders, D., & O'dorchai, S. (2006). The childcare triad? Indicators assessing three fields of child policies for working mothers in the EU-15. Journal of Comparative Policy Analysis, 8(2), 129-148.
Deaton, A. S., & Muellbauer, J. (1986). On measuring child costs: With applications to poor countries. The Journal of Political Economy, 94(4), 720-744.
Doyal, L., & Gough, I. (1991). A theory of human need. Houndmills: Palgrave Macmillan.
Esping-Andersen, G. (2008). Childhood investments and skill formation. International Tax and Public Finance, 15(1), 19-44.
Eurofound. (2016). European observatory of working life: Statutory minimum wages in the EU 2016. Last consulted in October 2017. from Eurofound https://www.eurofound.europa.eu/observatories/eurwork/articles/working-conditions-industrial-relations/statutory-minimum-wages-in-the-eu-2016
Eurostat. (2016). 20 November: Universal Children's Day. One in four children at risk of poverty or social exclusion in the EU. Eurostat Newsrelease. 225/2016 - 16 November 2016: Eurostat Press Office.
Fagnani, J., & Math, A. (2008). Policy packages for families with children in 11 European countries: Multiple approaches. In A. Leira & C. Saraceno (Eds.), Childhood: Changing Contexts (Comparative Social Research, Volume 25) (pp. 55-78). Bingley (UK): Emerald Group Publishing Limited.
Ferrarini, T., Nelson, K., & Höög, H. (2012). The fiscalization of child benefits in OECD countries. Gini Discussion Paper, No. 49. Amsterdam: AIOS Institute for Advanced Labour Studies.
Figari, F., Paulus, A., & Sutherland, H. (2011). Measuring the size and impact of public cash support for children in cross-national perspective. Social Science Computer Review, 29(1), 85-102.
Folbre, N. (2008). Valuing children: Rethinking the economics of the family. Cambridge,MA Harvard University Press.
Förster, M. (2005). The European social space revisited: comparing poverty in the enlarged European Union. Journal of Comparative Policy Analysis, 7(1), 29-48.
Förster, M., & Verbist, G. (2012). Money or kindergarten? Distributive effects of cash versus in-kind family transfers for young children. OECD Social, Employment and Migration Working Papers, No. 135. Paris: OECD Publishing.
Gauthier, A. H. (2002). Family policies in industrialized countries: is there convergence? Population, 57(3), 457-484.
Gazeley, I., & Newell, A. (2000). Rowntree revisited: poverty in Britain, 1900. Explorations in Economic History, 37(2), 174-188.
Goedemé, T., Penne, T., Hufkens, T., Karakitsios, A., Simonovits, B., Carillo Alvarez, E., . . . Storms, B. (2017). What Does It Mean To Live on the Poverty Threshold? Lessons From Reference Budgets. CSB Working Paper Series, No. 17/07. Antwerp: Herman Deleeck Centre for Social Policy, University of Antwerp.
Goedemé, T., Storms, B., Penne, T., & Van den Bosch, K. (Eds.). (2015a). Pilot project for the developement of a common methodology on reference budgets in Europe. The
development of a methodology for comparable reference budgets in Europe - Final report of the pilot project. Brussels: European Commission.
Goedemé, T., Storms, B., Stockman, S., Penne, T., & Van den Bosch, K. (2015b).
Towards cross-country comparable reference budgets in Europe: First results of a concerted effort. European Journal of Social Security, 17(1), 3-30.
Gorman, W. M. (1976). Tricks with utility functions. Essays in economic analysis, 211-243.
Gray, M. (2007). Costs of children and equivalence scales: A review of methodological issues and Australian estimates Research commissioned by the Ministerial Taskforce on Child Support. Canberra: Department of Families, Communities and Indigenous Affairs.
Grupp-Phelan, J., Lozano, P., & Fishman, P. (2001). Health care utilization and cost in children with asthma and selected comorbidities. Journal of Asthma, 38(4), 363-373.
Guevara, J., Lozano, P., Wickizer, T., Mell, L., & Gephart, H. (2001). Utilization and cost of health care services for children with attention-deficit/hyperactivity disorder. Pediatrics, 108(1), 71-78.
Hernanz, V., Malherbet, F., & Pellizzari, M. (2004). Take-Up of welfare benefits in OECD countries: A review of the evidence. OECD Social, Employment and Migration Working Papers No. 17. Paris: OECD.
Hufkens, T., Leventi, C., Rastrigina, O., Manios, K., Van Mechelen, N., Verbist, G., . . . Goedemé, T. (2016). HHoT: a new flexible Hypothetical Household Tool for tax-benefit simulations in EUROMOD (Deliverable 22.2). Leuven: HIVA, FP7 InGRID project.
Immervoll, H., & Barber, D. (2006). Can parents afford to work? Childcare costs, tax-benefit policies and work incentives. IZA Discussion Papers, No. 1932.
Immervoll, H., Sutherland, H., & de Vos, K. (2000). Child poverty and child benefits in the European Union. EUROMOD Working Paper Series, No. EM 1/00.
Janta, B. (2014). Caring for children in Europe. How childcare, parental leave and flexible working arrangements interact in Europe RR-554-DG Employment, European Platform for Investing in Children (EPIC) (pp. 24). Brussels: RAND Europe.
Kamerman, S. B. (2000). Early childhood education and care: an overview of developments in the OECD countries. International Journal of Educational Research, 33(1), 7-29.
Karamessini, M. (2008). Continuity and change in the southern European social model. International Labour Review, 147(1), 43-70.
Koulovatianos, C., Schrder, C., & Schmidt, U. (2009). Nonmarket household time and the cost of children. Journal of Business & Economic Statistics, 27(1), 42-51.
Mac Mahon, D. C. B., Weld, G., Thornton, R., & Collins, M. (2012). The Cost Of A Child: A consensual budget standards study examining the direct cost of a child across childhood. Dublin: The Vincentian Partnership for Social Justice.
Maldonado, L. C., & Nieuwenhuis, R. (2015). Family policies and single parent poverty in 18 OECD countries, 1978–2008. Community, Work & Family, 18(4), 395-415.
Matsaganis, M., O'donoghue, C., Levy, H., Coromaldi, M., Mercader-Prats, M., Rodrigues, C. F., . . . Tsakloglou, P. (2005). Child poverty and family transfers in Southern Europe IZA Discussion paper series, No. 1509. Bonn: Institute for the Study of Labor.
Michoń, P. (2008). Familisation and defamilisation policy in 22 European countries. Poznan University of Economics Review, 8(1).
Morel, N., Palier, B., & Palme, J. (2012). Towards a social investment welfare state?: ideas, policies and challenges. Bristol: Policy Press.
Nelson, J. A. (1993). Household equivalence scales: Theory versus policy? Journal of Labor Economics, 11(3), 471-493.
OECD. (2013). OECD framework for statistics on the distribution of household income, consumption and wealth. OECD Publishing. Paris.
OECD. (2016). OECD. Stat: Average annual wages. Last consulted in April 2017. https://stats.oecd.org/Index.aspx?DataSetCode=AV_AN_WAGE
Oldfield, N., & Bradshaw, J. (2011). The costs of a child in a low-income household. Journal of Poverty and Social Justice, 19(2), 131-143.
Paulus, A., Sutherland, H., & Tsakloglou, P. (2010). The distributional impact of in‐kind
public benefits in European countries. Journal of Policy Analysis and Management, 29(2), 243-266.
Penne, T., Cussó Parcerisas, I., Mäkinen, L., Storms, B., & Goedemé, T. (2016). Can reference budgets be used as a poverty line? ImPRovE Working Paper, No. 16/05. Antwerp: Herman Deleeck Centre for Social Policy, University of Antwerp.
Percival, R., & Harding, A. (2007). The estimated costs of children in Australian families in 2005–06. Costs of children: research commissioned by the Ministerial Taskforce on Child Support, 55.
Pollak, R. A., & Wales, T. J. (1979). Welfare comparisons and equivalence scales. The American Economic Review, 216-221.
Salanauskaite, L., & Verbist, G. (2013). Is the neighbour’s grass greener? Comparing family support in Lithuania and four other New Member States. Journal of European Social Policy, 23(3), 315-331.
Sarlo, C. A. (2013). The cost of raising children. Vancouver: Fraser Institute.
Saunders, P. (1999). Budget standards and the costs of children. Family Matters(53), 62.
Storms, B., & Bogaerts, K. (2012). Le dindon de la farce: enquête sur l'efficacité des prestations financières pour les enfants à charge. Revue belge de sécurité sociale/Belgique. Ministère de la prévoyance sociale.-Bruxelles, 54(4), 599-645.
Storms, B., Goedemé, T., Van den Bosch, K., Penne, T., Schuerman, N., & Stockman, S. (2014). Pilot project for the development of a common methodology on reference budgets in Europe: Review of current state of play on reference budget practices at national, regional, and local level (pp. 150). Brussels: European Commision.
Sutherland, H., & Figari, F. (2013). EUROMOD: the European Union tax-benefit microsimulation model. International Journal of Microsimulation, 6(1), 4-26.
Thévenon, O. (2009). Assessing the costs of children: a challenge for policy. In M. T. Letablier, A. Luci, A. Math, & O. Thévenon (Eds.), The costs of raising children and the effectiveness of policies to support parenthood in European countries: a Literature Review (pp. 17-34). Brussels: European Commission.
Thévenon, O. (2011). Family policies in OECD countries: A comparative analysis. Population and Development Review, 37(1), 57-87.
Tsakloglou, P. (1991). Estimation and comparison of two simple models of equivalence scales for the cost of children. The Economic Journal, 101(405), 343-357.
UNICEF. (2008). The child care transition: A league table of early childhood education and care in economically advanced countries. Innocenti Report Card (Vol. 8, pp. 40).
Van de Ven, J., Hérault, N., & Azpitarte, F. (2017). Identifying tax implicit equivalence scales. The Journal of Economic Inequality, 1-19.
Van den Bosch, K., Goedemé, T., Schuerman, N., & Storms, B. (2016). Reference housing costs for adequate dwellings in ten European capitals. Critical Housing Analysis, 3(1), 1-9. doi:10.13060/23362839.2016.2.1.248
Van Lancker, W. (2013). Putting the child-centred investment strategy to the test: Evidence for EU27. European Journal of Social Security, 15(1), 4-27.
Van Lancker, W., & Van Mechelen, N. (2015). Universalism under siege? Exploring the association between targeting, child benefits and child poverty across 26 countries. Social Science Research, 50, 60-75.
Van Mechelen, N., & Bradshaw, J. (2013). Child poverty as a government priority: Child benefit packages for working families, 1992–2009. In I. Marx & K. Nelson (Eds.), Minimum income protection in flux (pp. 81-107). UK: Palgrave Macmillan.
Vandelannoote, D., Frans, D., & Hufkens, T. (2014). Technische nota: MOTYFF als opvolger van STASIM, P.7. Retrieved from http://www.flemosi.be/easycms/OverMOTYFF website:
Vandenbroucke, F., & Vleminckx, K. (2011). Disappointing poverty trends: is the social investment state to blame? Journal of European Social Policy, 21(5), 450-471. doi:10.1177/0958928711418857
Verbist, G., & Van Lancker, W. (2016). Horizontal and vertical equity objectives of child benefit systems: an empirical assessment for European countries. Social Indicators Research, 128(3), 1299-1318.
Whiteford, P., & Adema, W. (2007). What Works Best in Reducing Child Poverty: A Benefit or Work Strategy? OECD Social, employment and Migration Working Papers, no. 51. Paris: OECD.
Woessmann, L. (2004). How equal are educational opportunities? Family background
and student achievement in Europe and the US. CESifo Working Paper, No. 1162. Munich: Center for Economic Studies and Ifo Institute (CESifo).
Wolf, D. A., Lee, R. D., Miller, T., Donehower, G., & Genest, A. (2011). Fiscal
externalities of becoming a parent. Population and Development Review, 37(2), 241-266.
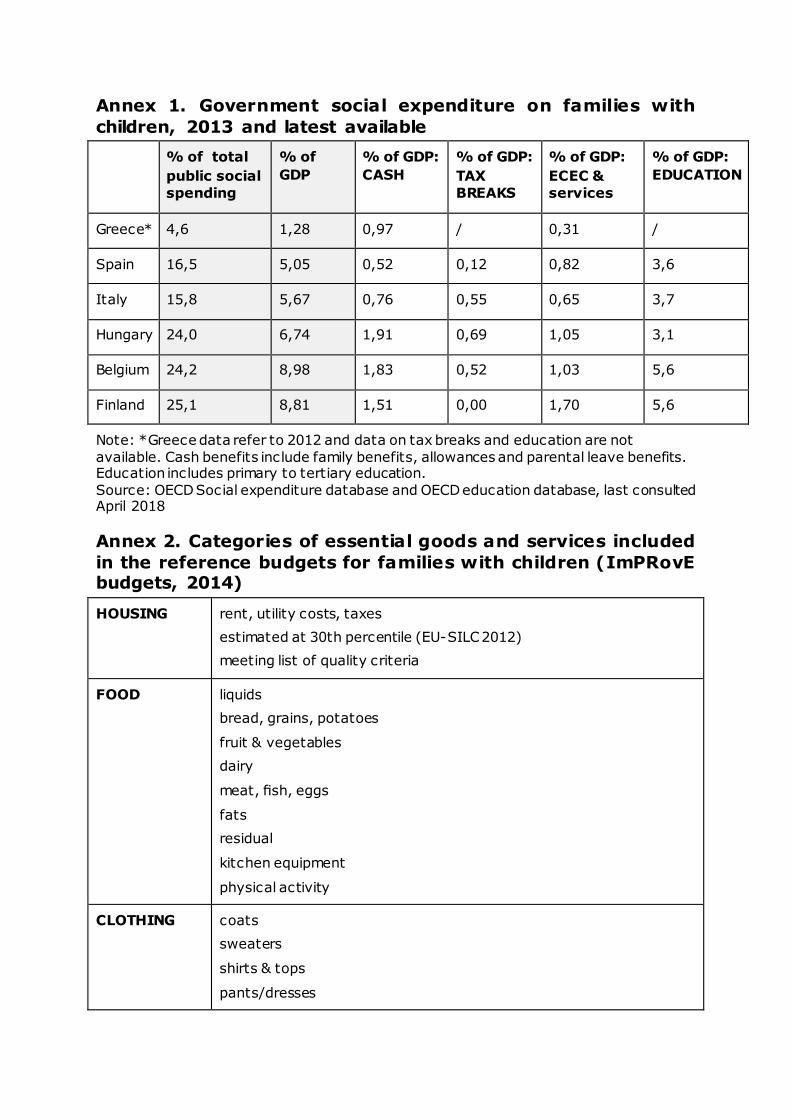
Annex 1. Government social expenditure on families with
children, 2013 and latest available
% of total
public social
spending
% of
GDP
% of GDP:
CASH
% of GDP:
TAX
BREAKS
% of GDP:
ECEC &
services
% of GDP:
EDUCATION
Greece* 4,6 1,28 0,97 / 0,31 /
Spain 16,5 5,05 0,52 0,12 0,82 3,6
Italy 15,8 5,67 0,76 0,55 0,65 3,7
Hungary 24,0 6,74 1,91 0,69 1,05 3,1
Belgium 24,2 8,98 1,83 0,52 1,03 5,6
Finland 25,1 8,81 1,51 0,00 1,70 5,6
Note: *Greece data refer to 2012 and data on tax breaks and education are not
available. Cash benefits include family benefits, allowances and parental leave benefits. Education includes primary to tertiary education.
Source: OECD Social expenditure database and OECD education database, last consulted April 2018
Annex 2. Categories of essential goods and services included
in the reference budgets for families with children (ImPRovE budgets, 2014)
HOUSING rent, utility costs, taxes
estimated at 30th percentile (EU-SILC 2012)
meeting list of quality criteria
FOOD liquids
bread, grains, potatoes
fruit & vegetables
dairy
meat, fish, eggs
fats
residual
kitchen equipment
physical activity
CLOTHING coats
sweaters
shirts & tops
pants/dresses
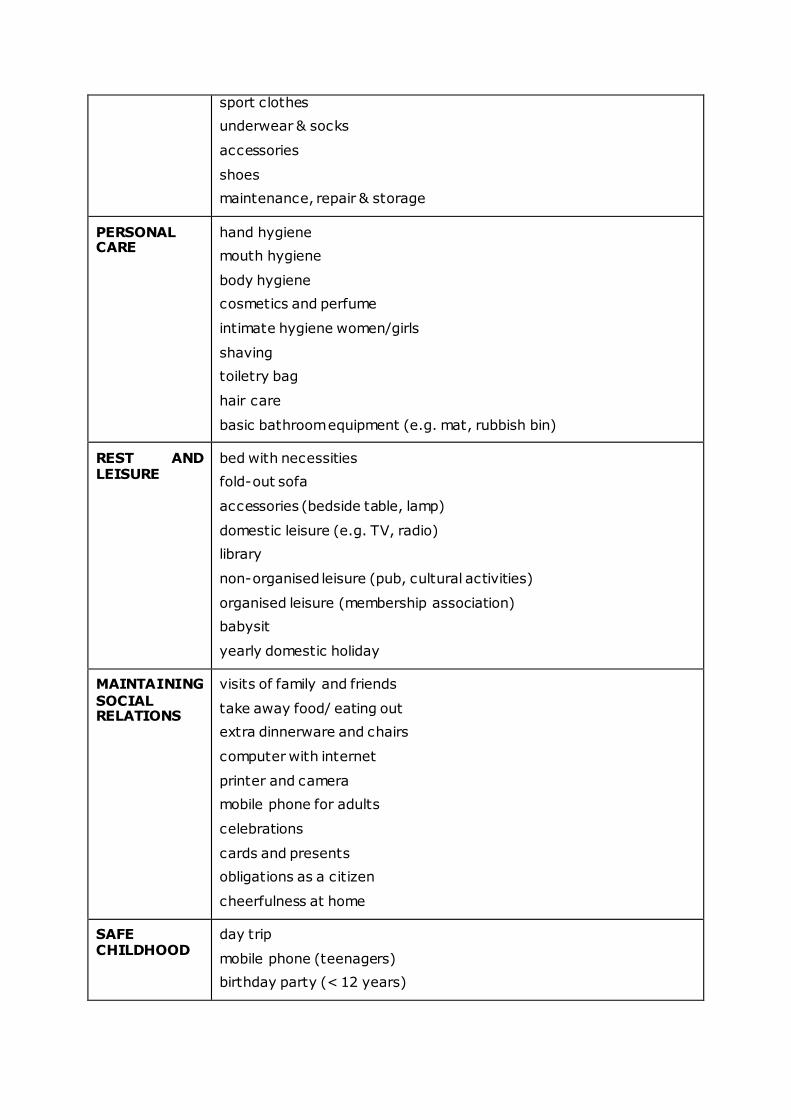
sport clothes
underwear & socks
accessories
shoes
maintenance, repair & storage
PERSONAL CARE
hand hygiene
mouth hygiene
body hygiene
cosmetics and perfume
intimate hygiene women/girls
shaving
toiletry bag
hair care
basic bathroom equipment (e.g. mat, rubbish bin)
REST AND LEISURE
bed with necessities
fold-out sofa
accessories (bedside table, lamp)
domestic leisure (e.g. TV, radio)
library
non-organised leisure (pub, cultural activities)
organised leisure (membership association)
babysit
yearly domestic holiday
MAINTAINING
SOCIAL RELATIONS
visits of family and friends
take away food/ eating out
extra dinnerware and chairs
computer with internet
printer and camera
mobile phone for adults
celebrations
cards and presents
obligations as a citizen
cheerfulness at home
SAFE CHILDHOOD
day trip
mobile phone (teenagers)
birthday party (< 12 years)
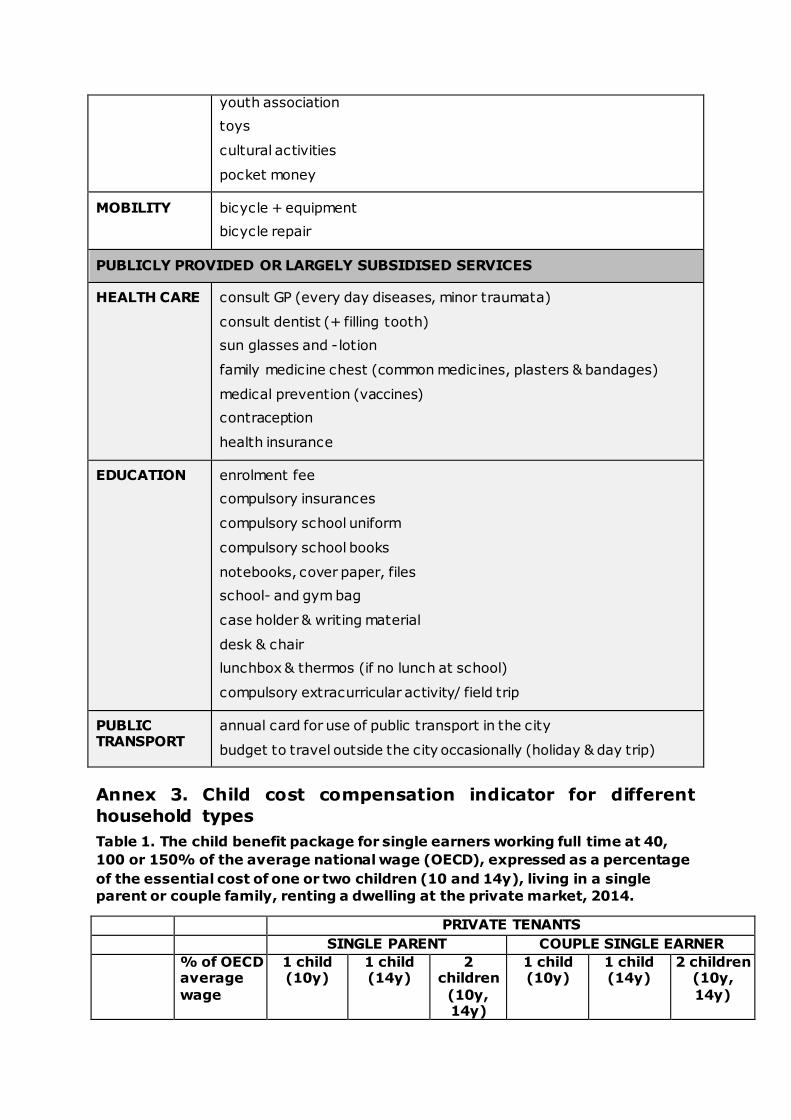
youth association
toys
cultural activities
pocket money
MOBILITY bicycle + equipment
bicycle repair
PUBLICLY PROVIDED OR LARGELY SUBSIDISED SERVICES
HEALTH CARE consult GP (every day diseases, minor traumata)
consult dentist (+ filling tooth)
sun glasses and -lotion
family medicine chest (common medicines, plasters & bandages)
medical prevention (vaccines)
contraception
health insurance
EDUCATION enrolment fee
compulsory insurances
compulsory school uniform
compulsory school books
notebooks, cover paper, files
school- and gym bag
case holder & writing material
desk & chair
lunchbox & thermos (if no lunch at school)
compulsory extracurricular activity/ field trip
PUBLIC TRANSPORT
annual card for use of public transport in the city
budget to travel outside the city occasionally (holiday & day trip)
Annex 3. Child cost compensation indicator for different
household types
Table 1. The child benefit package for single earners working full time at 40,
100 or 150% of the average national wage (OECD), expressed as a percentage
of the essential cost of one or two children (10 and 14y), living in a single
parent or couple family, renting a dwelling at the private market, 2014.
PRIVATE TENANTS
SINGLE PARENT COUPLE SINGLE EARNER
% of OECD average
wage
1 child (10y)
1 child (14y)
2 children
(10y, 14y)
1 child (10y)
1 child (14y)
2 children (10y,
14y)

Athens 40% 0,13 0,12 0,12 0,11 0,10 0,11
100% 0,03 0,03 0,06 0,06 0,06 0,06
150% 0,00 0,00 0,03 0,03 0,03 0,03
Barcelona 40% 0,06 0,05 0,06 0,06 0,05 0,06
100% 0,38 0,30 0,22 0,10 0,08 0,10
150% 0,29 0,23 0,18 0,10 0,08 0,10
Budapest 40% 0,30 0,23 0,30 0,24 0,19 0,24
100% 0,25 0,20 0,21 0,21 0,16 0,20
150% 0,25 0,20 0,21 0,21 0,16 0,18
Milan 40% 0,41 0,32 0,33 0,21 0,17 0,24
100% 0,28 0,22 0,31 0,28 0,22 0,31
150% 0,22 0,17 0,20 0,22 0,17 0,20
Helsinki* 40% 1,02 - 1,09 0,52 - 0,79
100% 0,32 - 0,39 0,22 - 0,27
150% 0,32 - 0,39 0,22 - 0,27
Antwerp 40% 0,58 0,47 0,58 0,34 0,33 0,43
100% 0,43 0,39 0,50 0,34 0,32 0,46
150% 0,43 0,39 0,50 0,34 0,32 0,46
*In Helsinki the second child is 4 years instead of 14 years old Source: own calculations using HHoT/EUROMOD 2014 & ImPRovE budgets 2014 (Goedemé et al, 2015b).
Table 2. The child benefit package for single earners working full time at 40,
100 or 150% of the average national wage (OECD), expressed as a percentage
of the essential cost of one or two children (10 and 14y), living in a single
parent or couple family, owning a house without paying mortgage, 2014.
OUTRIGHT OWNERS
SINGLE PARENT COUPLE SINGLE EARNER
% of OECD average wage
1 child (10y)
1 child (14y)
2 children
(10y, 14y)
1 child (10y)
1 child (14y)
2 children (10y, 14y)
Athens 40% 0,22 0,20 0,15 0,09 0,08 0,09
100% 0,03 0,02 0,05 0,03 0,02 0,05
150% 0,00 0,00 0,03 0,00 0,00 0,03
Barcelona 40% 0,06 0,05 0,06 0,06 0,05 0,06
100% 0,31 0,24 0,18 0,10 0,08 0,09
150% 0,29 0,22 0,18 0,10 0,08 0,09
Budapest 40% 0,32 0,24 0,30 0,27 0,21 0,28
100% 0,27 0,21 0,22 0,25 0,19 0,22
150% 0,27 0,21 0,22 0,25 0,19 0,20
Milan 40% 0,53 0,40 0,39 0,53 0,40 0,39
100% 0,31 0,24 0,33 0,31 0,24 0,33
150% 0,24 0,19 0,22 0,24 0,19 0,22
Helsinki* 40% 0,38 - 0,66 0,38 - 0,66

100% 0,38 - 0,42 0,38 - 0,42
150% 0,38 - 0,42 0,38 - 0,42
Antwerp 40% 0,67 0,53 0,65 0,67 0,53 0,65
100% 0,50 0,44 0,56 0,50 0,44 0,56
150% 0,50 0,44 0,56 0,50 0,44 0,56
*In Helsinki the second child is 4 years instead of 14 years old
Source: own calculations using HHoT/EUROMOD 2014 & ImPRovE budgets 2014 (Goedemé et al, 2015b).

XX-N
A-x
xxxx-E
N-N