Embed Size (px)
Citation preview
TO UNCOVERING OPPORTUNITY
TO UNCOVERING OPPORTUNITY
www.TradingTips.com
THE
METHOD“Men, it has been well said, think in herds; it will be seen that they go mad in herds, while they only recover their senses slowly, and one by one,” noted Charles Mackay in Extraordinary Popular Delusions and the Madness of Crowds.
Granted, that was written in 1841. But it’s still true to this day.
Or, as once noted by French psychologist Gustave Le Bon:
Le Bon developed a theory called Contagion that assumes that crowds exert a hypnotic influence over their members. People find themselves in a situation where they are anonymous and can abandon personal responsibility. They get sucked up in the contagious emotions of the crowd and can be driven toward irrational, often violent action that most isolated individuals would not attempt. The main flaw in this theory is that crowd behavior is not necessarily irrational.
The crowd is always intellectually inferior to the isolated individual, but that, from the point of view of feelings and of the acts these feelings provoke, the crowd may, according to circumstances, be better or worse than the individual. All depends on the nature of the suggestion to which the crowd is exposed.”
www.TradingTips.com
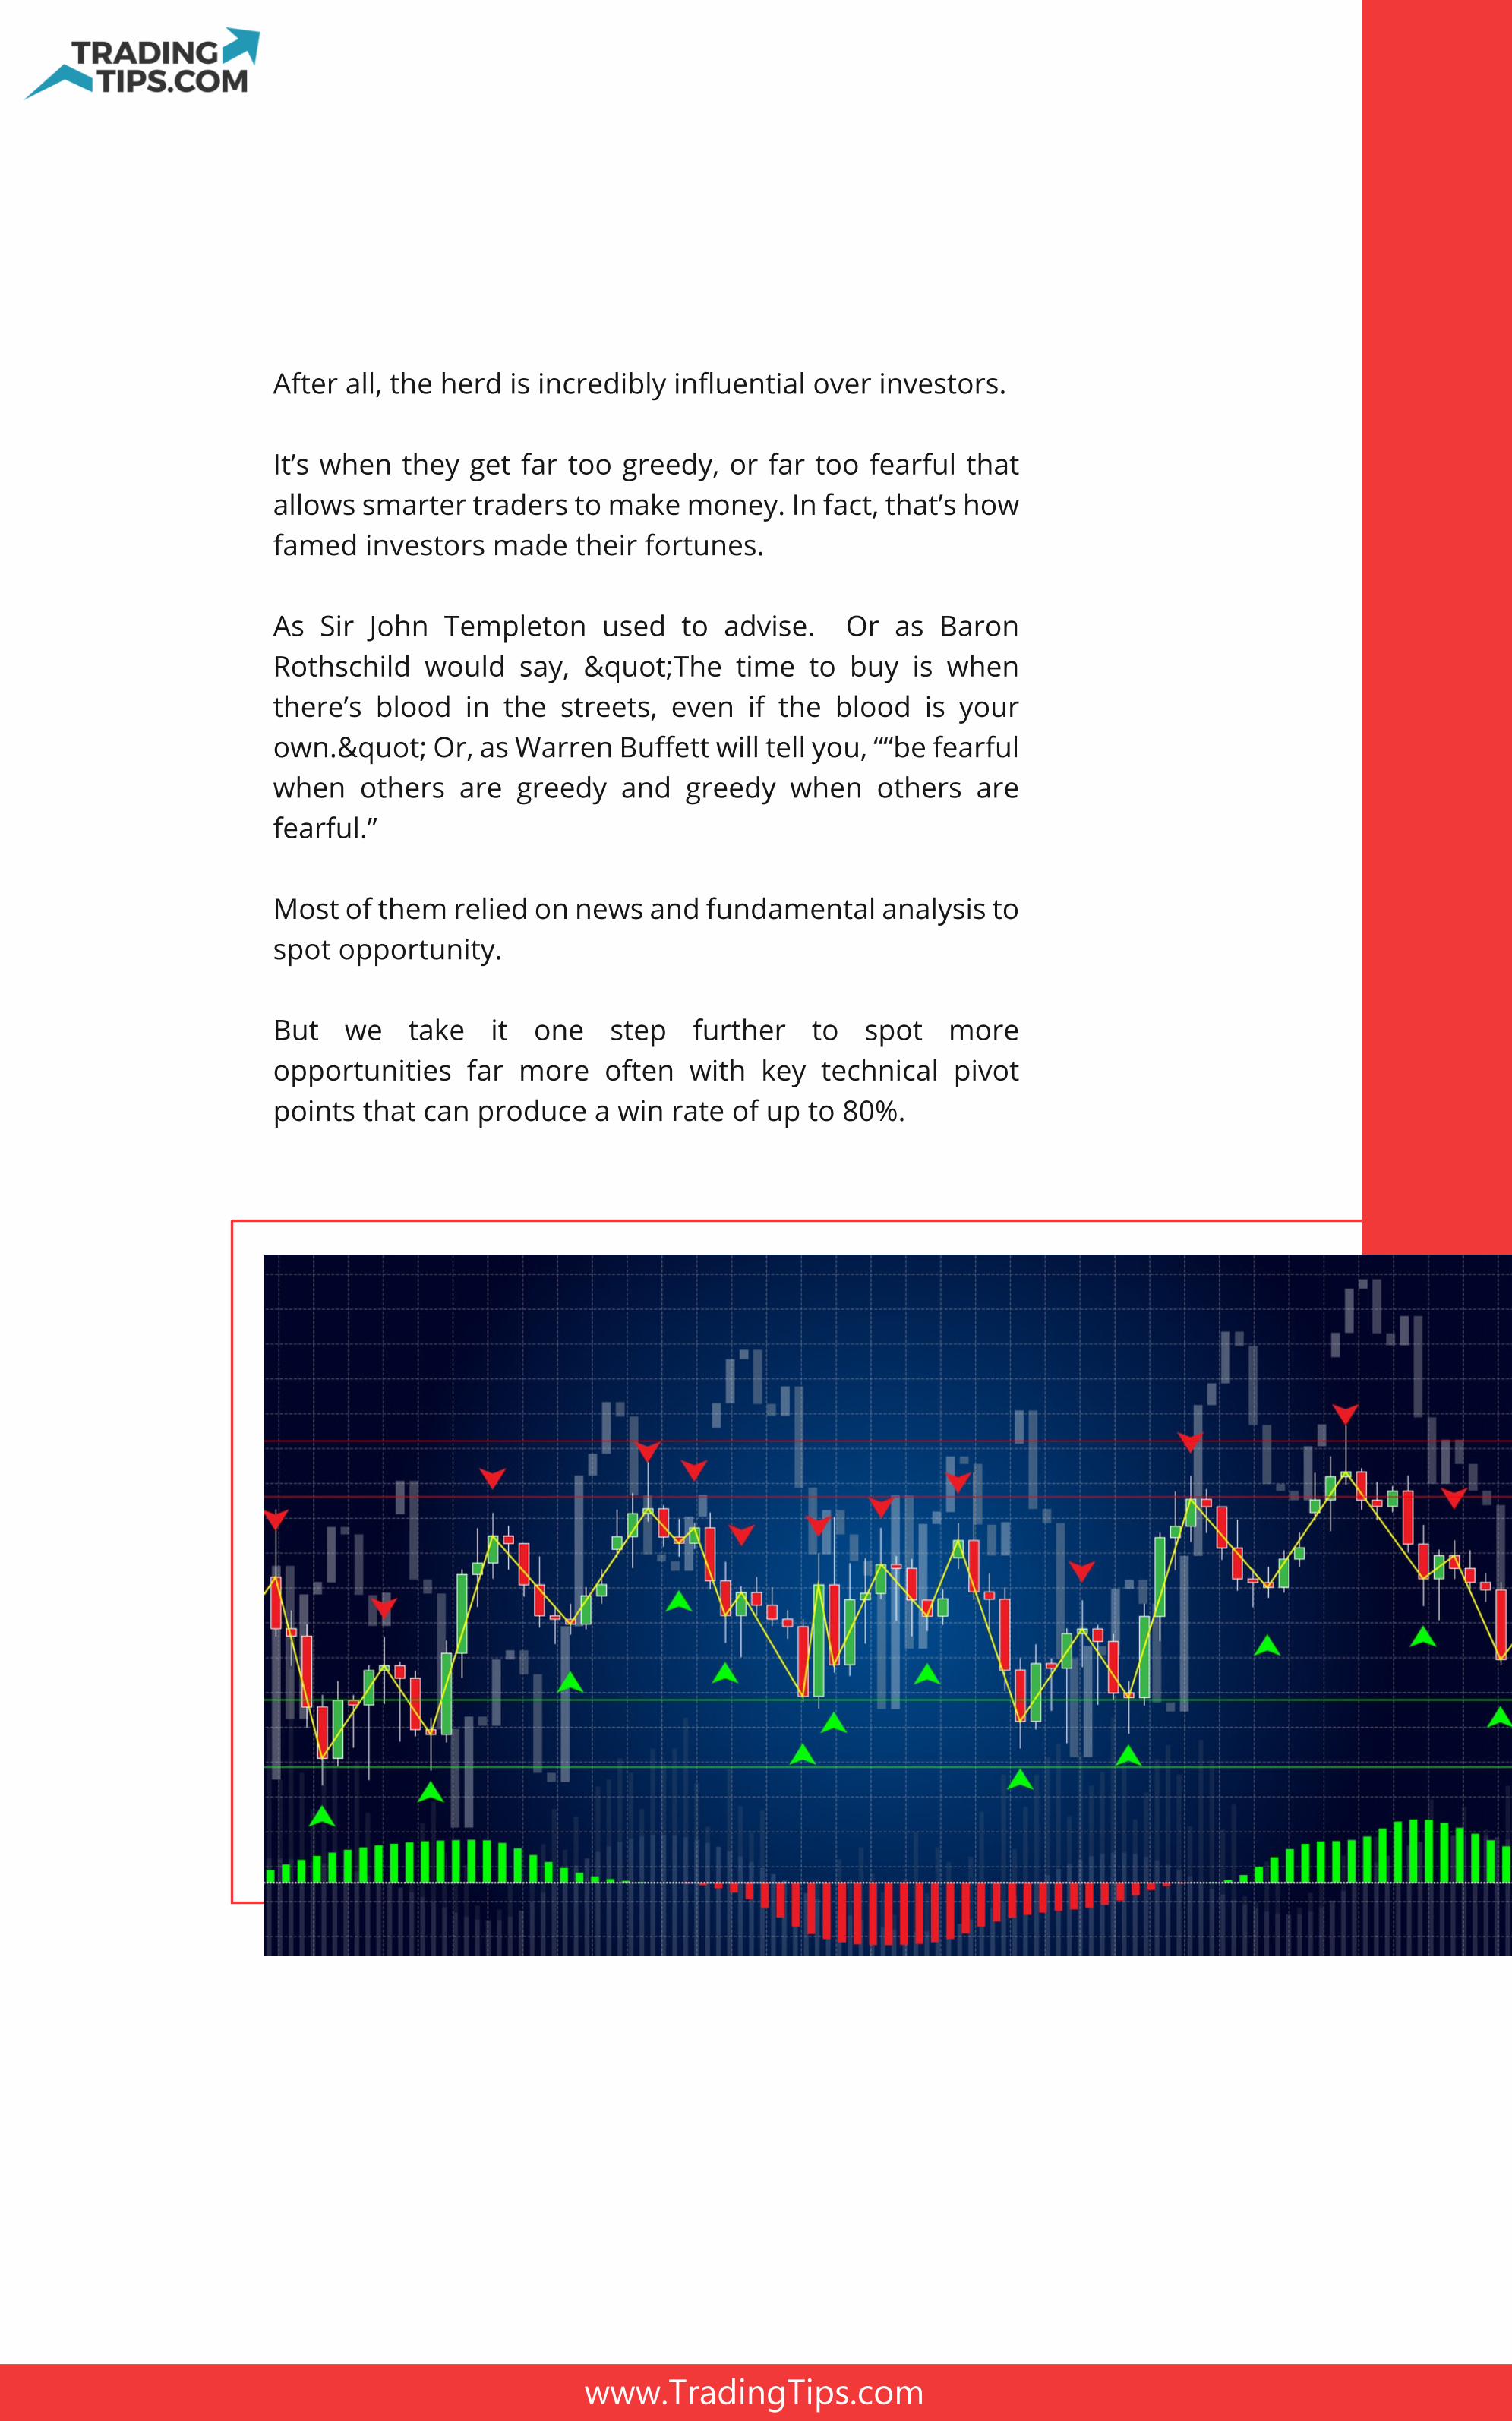
After all, the herd is incredibly influential over investors.
It’s when they get far too greedy, or far too fearful that allows smarter traders to make money. In fact, that’s how famed investors made their fortunes.
As Sir John Templeton used to advise. Or as Baron Rothschild would say, "The time to buy is when there’s blood in the streets, even if the blood is your own." Or, as Warren Buffett will tell you, ““be fearful when others are greedy and greedy when others are fearful.”
Most of them relied on news and fundamental analysis to spot opportunity.
But we take it one step further to spot more opportunities far more often with key technical pivot points that can produce a win rate of up to 80%.
www.TradingTips.com
Imagine you just jumped off a tall bridge attached to a bungee cord.
When the cord is pulled too far, what happens? It begins to bounce back. Well, that very same thing happens with stocks every day. And if you can spot it, you can make a fortune.
All you need to use are five key technical indicators:
Bollinger Bands (2,20) Full Stochastics Williams’ %R (W%R) Relative Strength (RSI) Moving Average Convergence Divergence (MACD)
When all agree with one another in oversold or overbought territory, we’ll typically see a pivot in the other direction in stocks, indices, and ETFs.
The Bollinger Bands are typically placed two standard deviations above and below a moving average. For example, we like to use 2,20, which is two standard deviations above and below the 20-day moving average.
The idea here is simple. When a stock touches or breaks below the lower band, it can be considered oversold. When a stock touches or breaks above the upper band, the stock in question can be considered overbought.
Look at Advanced Micro Devices (AMD) for example.
Look at what happens about 80% of the time at the lower or upper Bollinger Band. When either is challenged, the stock tends to pivot not long after.
Then again, we never want to rely on a single indicator, so we begin to look for confirmation before taking a position.
CAN SPOT SUCH OPPORTUNITIESCAN SPOT SUCH OPPORTUNITIESHERE’S HOW ANY INVESTOR
BOLLINGER BANDS (2,20)
WE CAN NOW ADD RELATIVE STRENGTH (RSI)
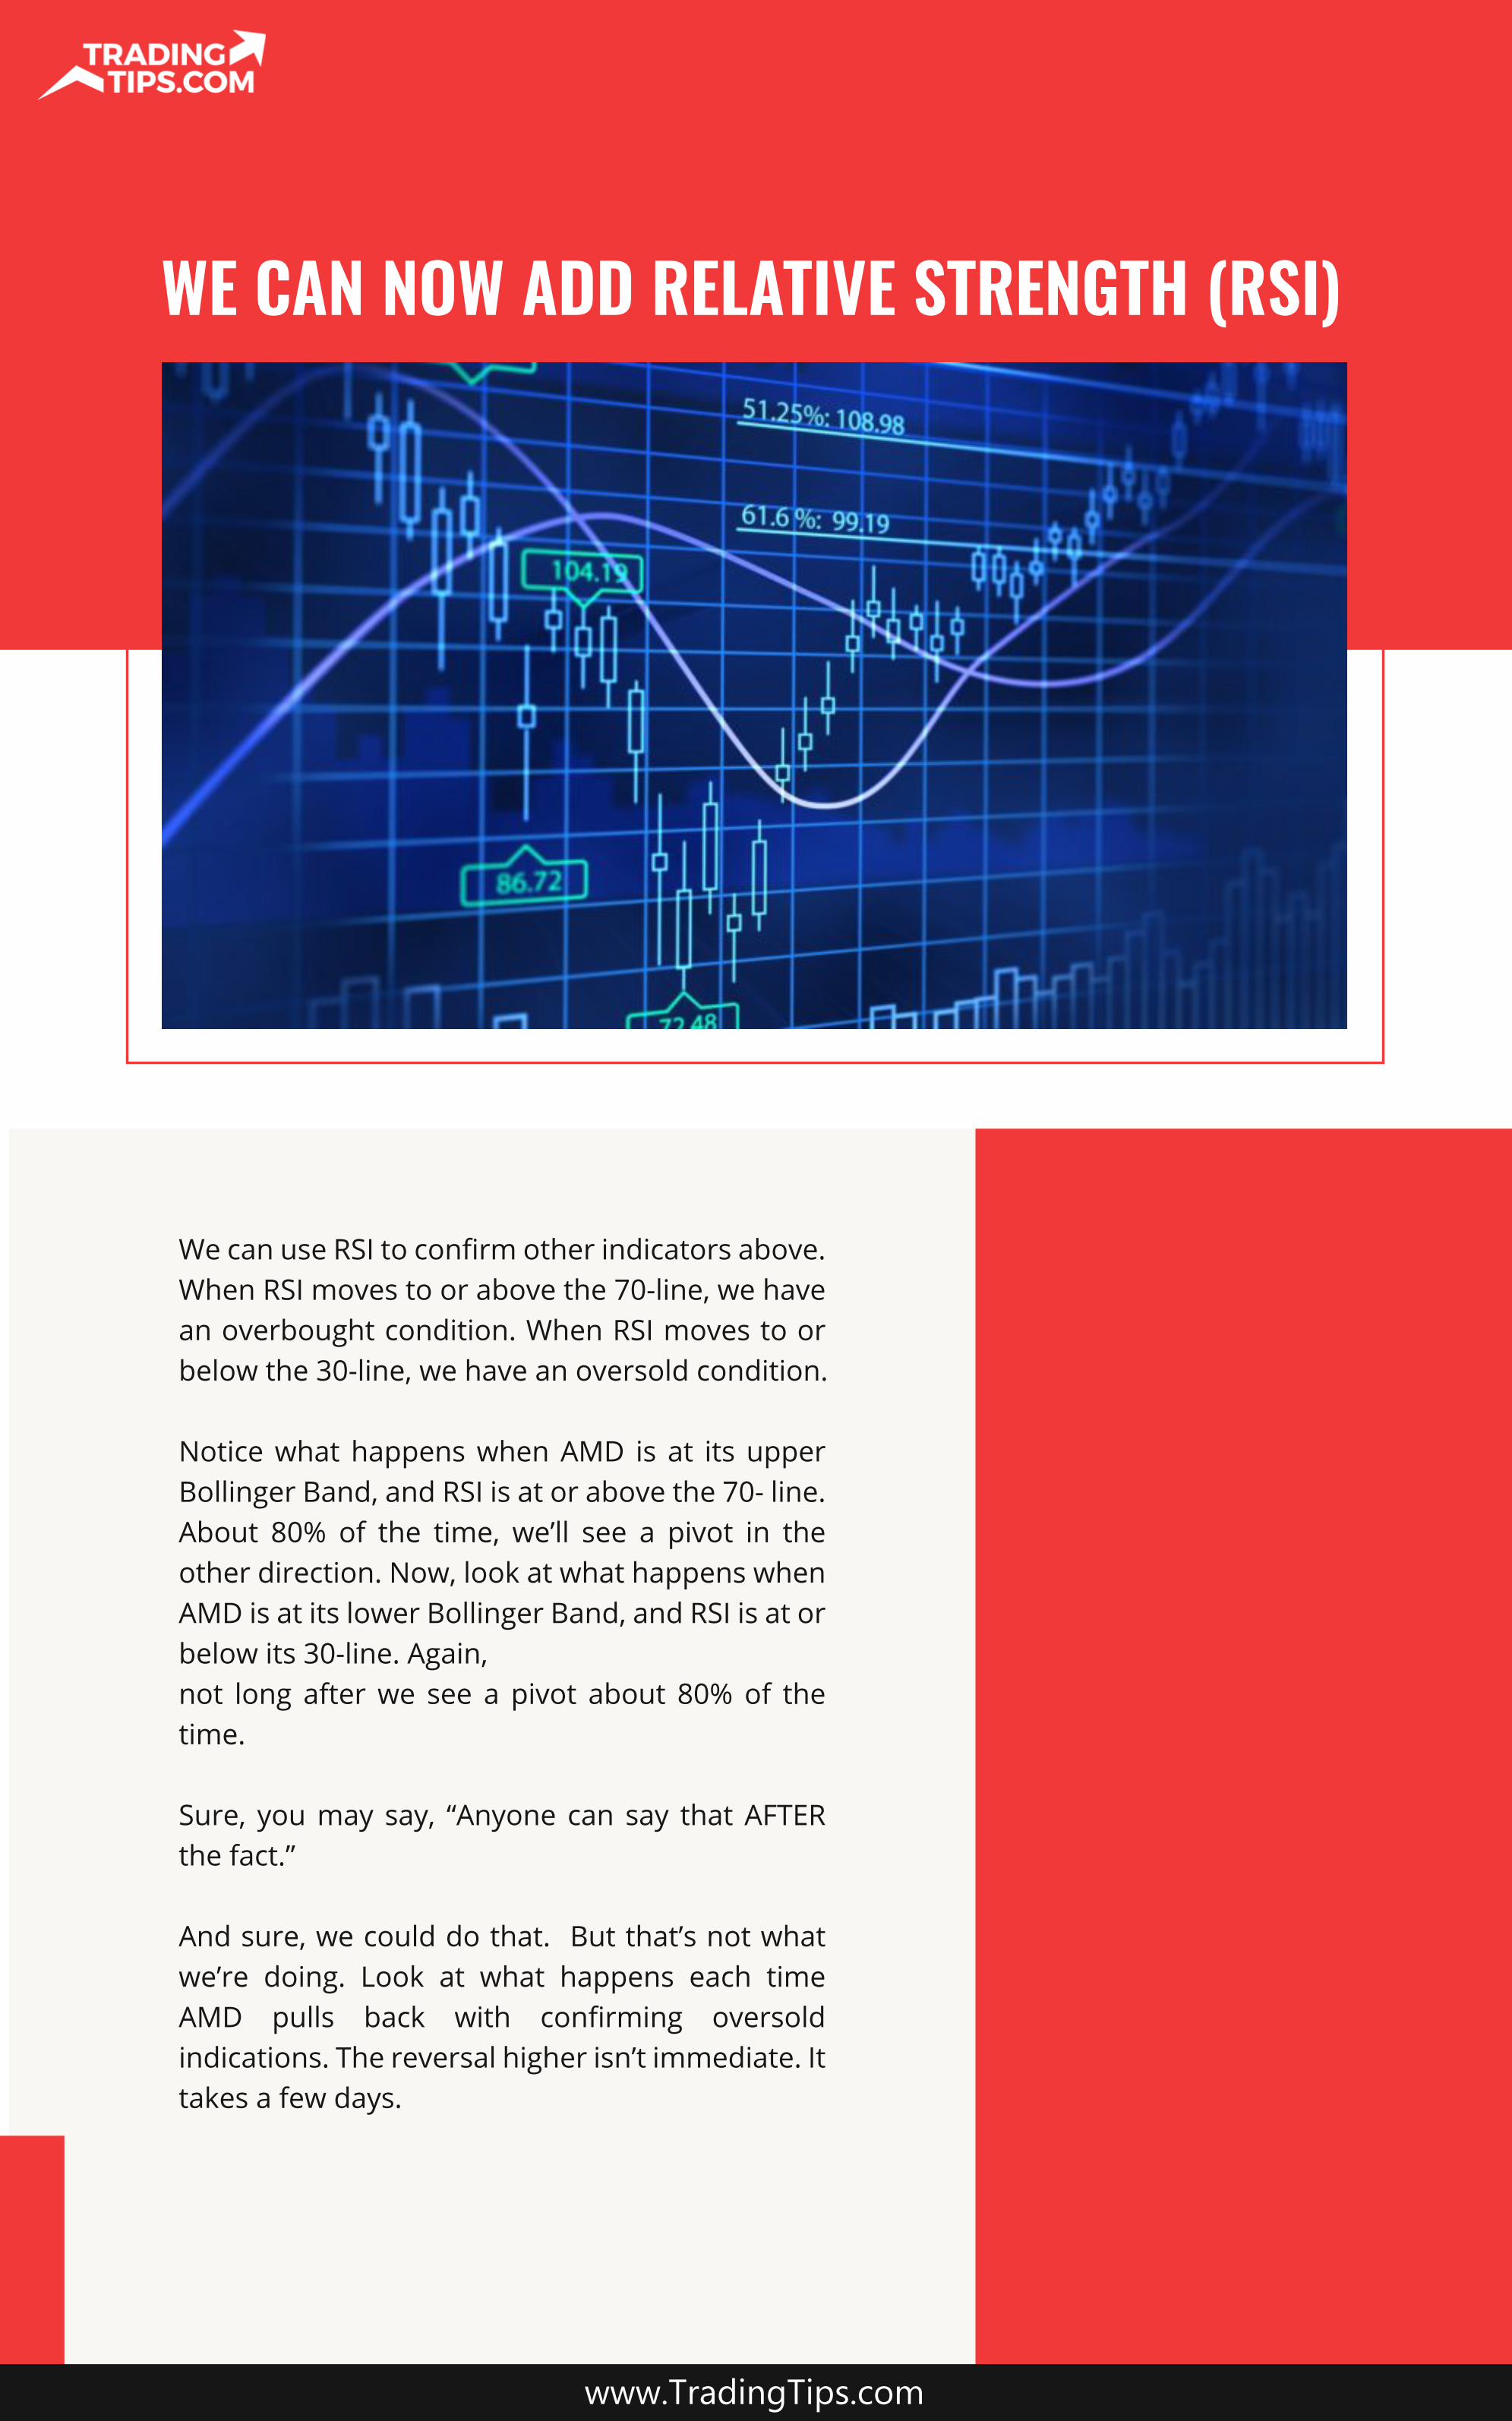
We can use RSI to confirm other indicators above. When RSI moves to or above the 70-line, we have an overbought condition. When RSI moves to or below the 30-line, we have an oversold condition.
Notice what happens when AMD is at its upper Bollinger Band, and RSI is at or above the 70- line. About 80% of the time, we’ll see a pivot in the other direction. Now, look at what happens when AMD is at its lower Bollinger Band, and RSI is at or below its 30-line. Again,not long after we see a pivot about 80% of the time.
Sure, you may say, “Anyone can say that AFTER the fact.”
And sure, we could do that. But that’s not what we’re doing. Look at what happens each time AMD pulls back with confirming oversold indications. The reversal higher isn’t immediate. It takes a few days.
www.TradingTips.com
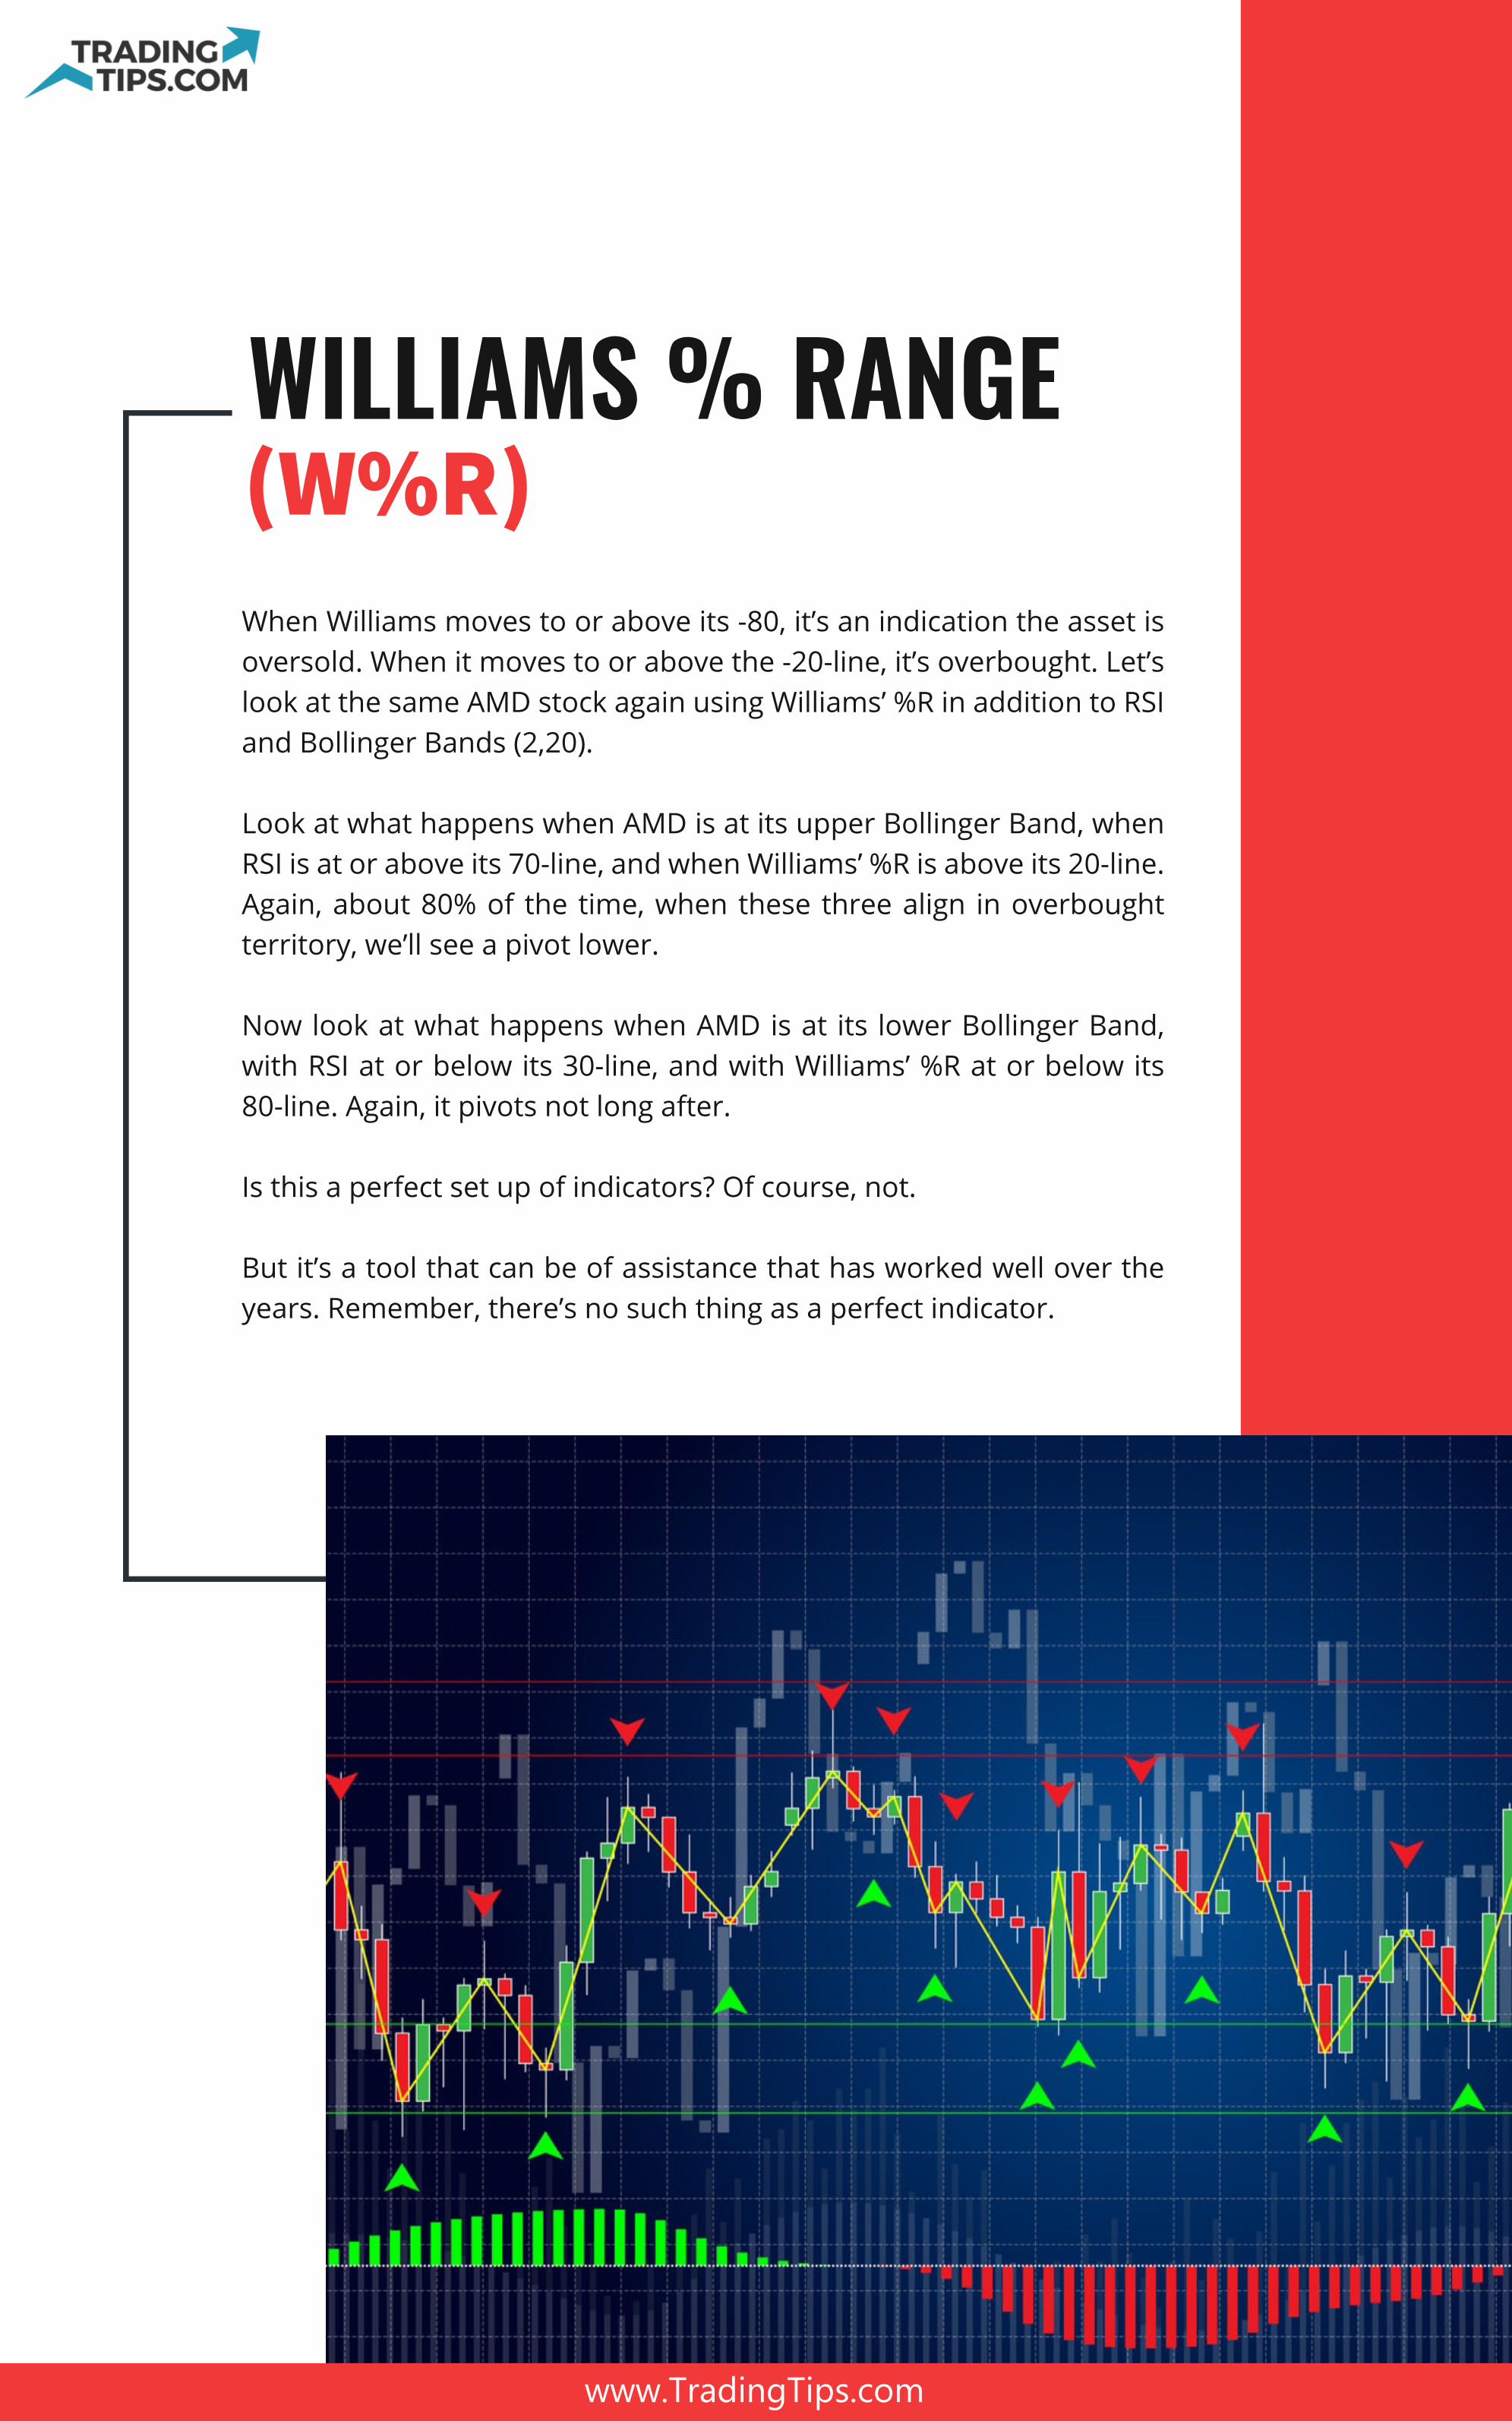
WILLIAMS % RANGE (W%R) When Williams moves to or above its -80, it’s an indication the asset is oversold. When it moves to or above the -20-line, it’s overbought. Let’s look at the same AMD stock again using Williams’ %R in addition to RSI and Bollinger Bands (2,20).
Look at what happens when AMD is at its upper Bollinger Band, when RSI is at or above its 70-line, and when Williams’ %R is above its 20-line. Again, about 80% of the time, when these three align in overbought territory, we’ll see a pivot lower.
Now look at what happens when AMD is at its lower Bollinger Band, with RSI at or below its 30-line, and with Williams’ %R at or below its 80-line. Again, it pivots not long after.
Is this a perfect set up of indicators? Of course, not.
But it’s a tool that can be of assistance that has worked well over the years. Remember, there’s no such thing as a perfect indicator.
www.TradingTips.com
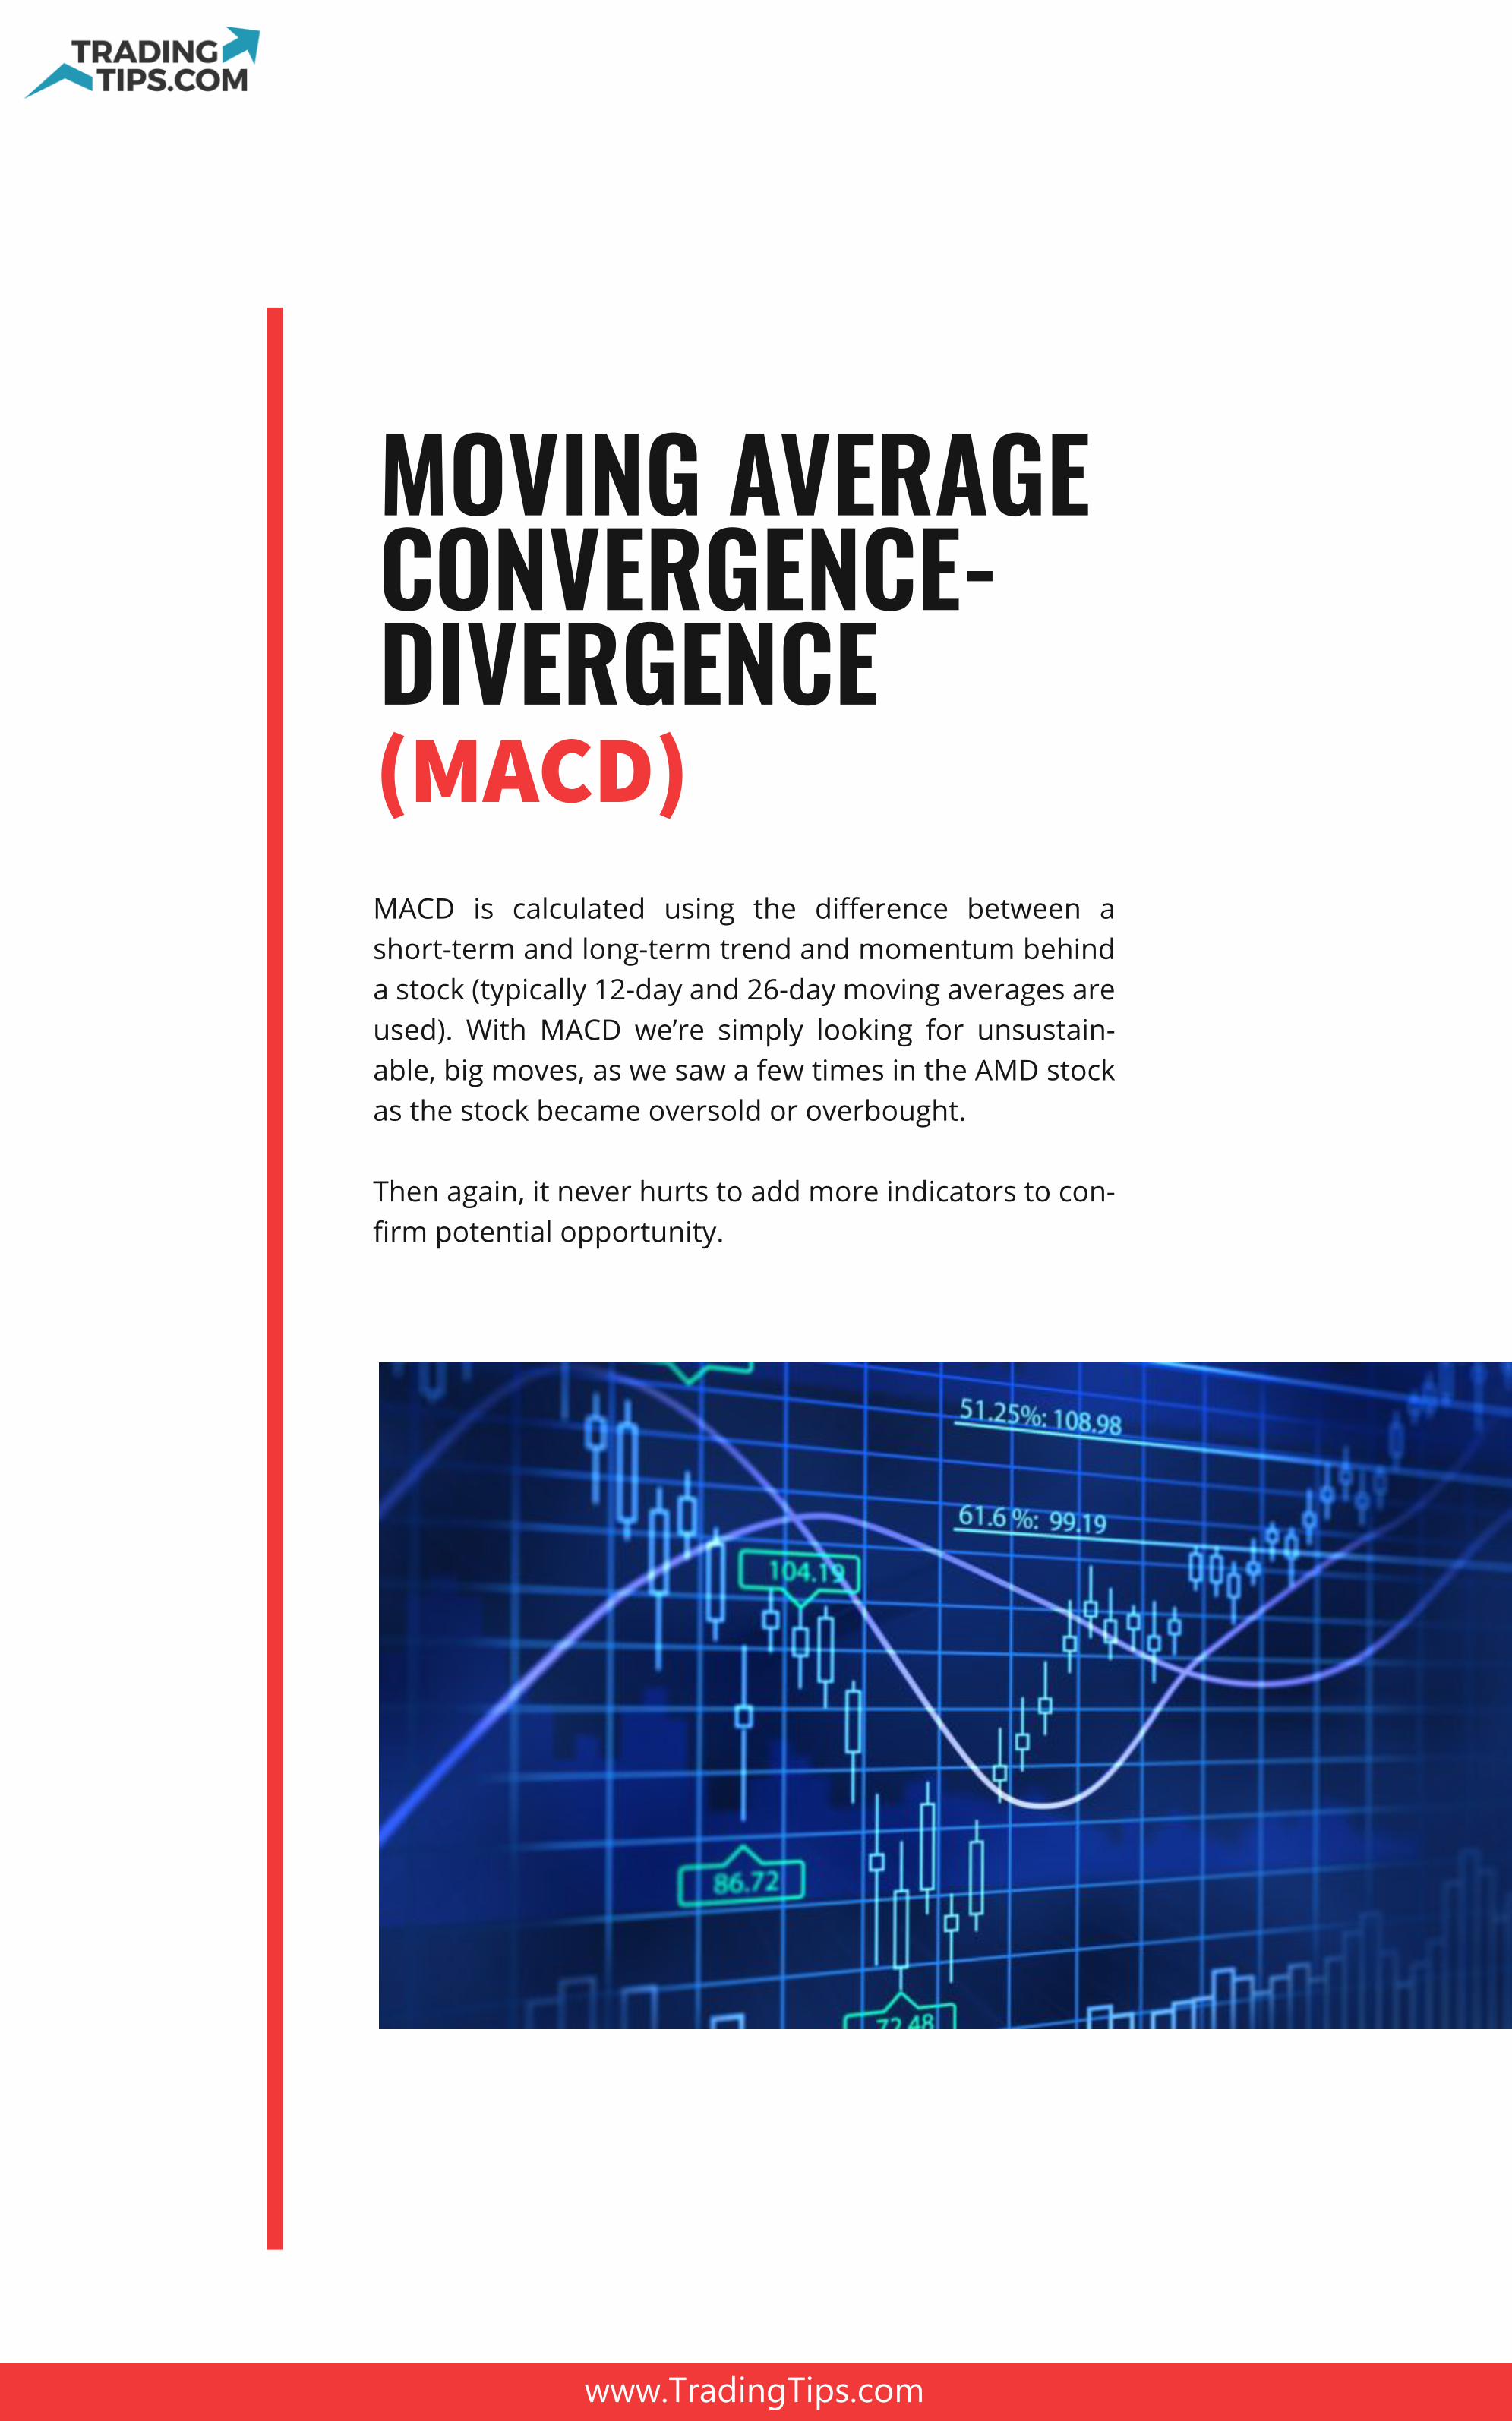
MOVING AVERAGE CONVERGENCE-DIVERGENCE (MACD)MACD is calculated using the difference between a short-term and long-term trend and momentum behind a stock (typically 12-day and 26-day moving averages are used). With MACD we’re simply looking for unsustain-able, big moves, as we saw a few times in the AMD stock as the stock became oversold or overbought.
Then again, it never hurts to add more indicators to con-firm potential opportunity.
www.TradingTips.com
www.TradingTips.com
FULL
Full Stochastics uses the features of Slow and Fast Stochastics.
It combines %K, or the slow stochastic that looks at current value. It also combines, %D, which is equal to a three-period moving average of %K. We use them to compare a closing price of a stock to a range of prices over a set period of time. With this indicator, notice that when Full STO drops to or below its 20-line, a bottom begins to form in the stock. When FullSTO pushes to or above its 80-line, we have an overbought condition.
With Full, we’re essentially confirming what the other indicators have told us.
In this chart, we can see that when Full, RSI, Bollinger Bands, and Williams’ %R align, we see a pivot from either oversold or overbought conditions.
Again, is this a perfect set up of indicators? Of course, not.
But these are confirming technical tools that can be of assistance that has worked well over the years. Such tools can help us determine if the herd has gotten far too fearful, or far too greedy. When either is determined to be true, that’s where real fortunes can be made.
STOCHASTICS