Embed Size (px)
Citation preview
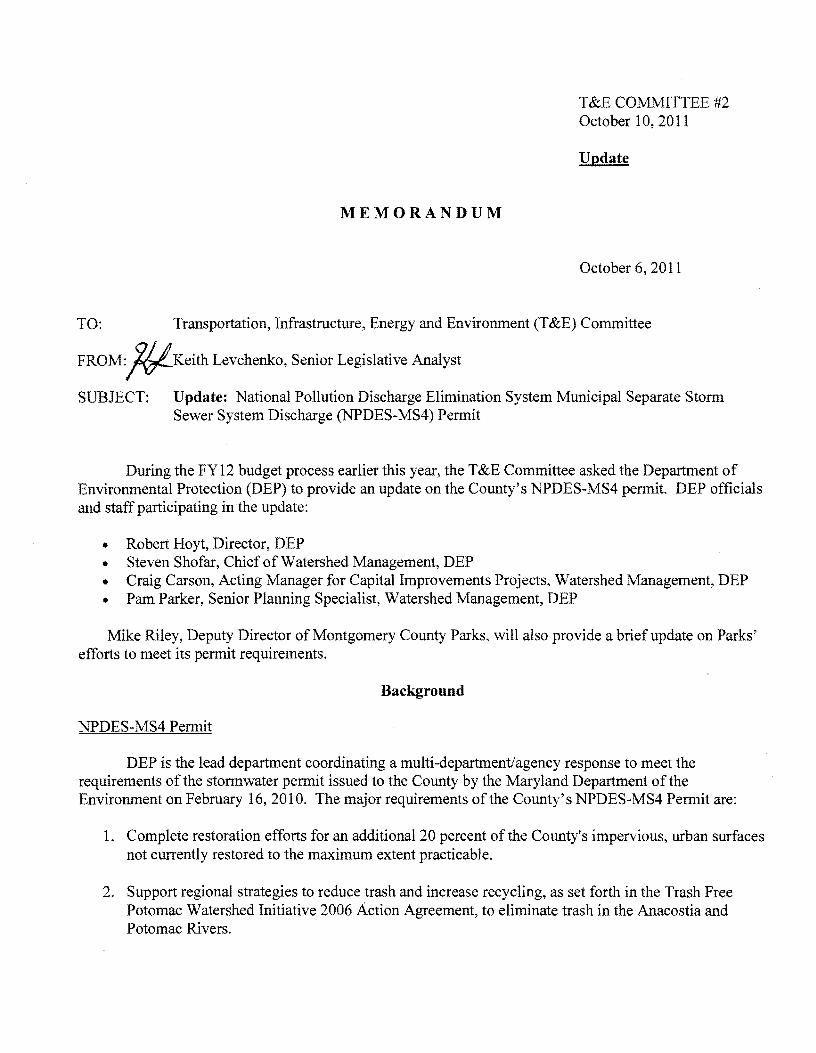
T ampE COMMITTEE 2 October 102011
Update
MEMORANDUM
October 6 2011
TO Transportation Infrastructure Energy and Environment (T ampE) Committee
FROM~Keith Levchenko Senior Legislative Analyst
SUBJECT Update National Pollution Discharge Elimination System Municipal Separate Storm Sewer System Discharge (NPDES-MS4) Permit
During the FY12 budget process earlier this year the T ampE Committee asked the Department of Environmental Protection (DEP) to provide an update on the Countys NPDES-MS4 permit DEP officials and staff participating inthe update
bull Robert Hoyt Director DEP bull Steven Shofar Chief of Watershed Management DEP bull Craig Carson Acting Manager for Capital Improvements Projects Watershed Management DEP bull Pam Parker Senior Planning Specialist Watershed Management DEP
Mike Riley Deputy Director of Montgomery County Parks will also provide a brief update on Parks efforts to meet its permit requirements
Background
NPDES-MS4 Permit
DEP is the lead department coordinating a multi-departmentagency response to meet the requirements of the stormwater permit issued to the County by the Maryland Department of the Environment on February 162010 The major requirements of the Countys NPDES-MS4 Permit are
1 Complete restoration efforts for an additional 20 percent of the Countys impervious urban surfaces not currently restored to the maximum extent practicable
2 Support regional strategies to reduce trash and increase recycling as set forth in the Trash Free Potomac Watershed Initiative 2006 Action Agreement to eliminate trash in the Anacostia and Potomac Rivers
3 Implement TMDL limits to restore impaired waterways in the County by developing and implementing plans to reduce nonpoint source pollutant loads (eg from stormwater) Ensure antishydegradation measures for high quality waters (Tier II waters) within the County including appropriate reviews prior to approval of capital projects watersewer plan amendments and any development with the potential to affect water quality and downstream water quality
4 Establish long-term schedules for identifying sources of pollution and water quality improvement opportunities for all watersheds in the County
5 Use environmental-site designlow-impact development as a method to capture stormwater by improving the Countys stormwater management ordinancesregulations and modifying the Countys planning and zoning codes as needed Environmental Site Design (ESD) as outlined in Chapter 5 of the Maryland Stormwater Management Act is required to be implemented to the maximum extent practicable
6 All new construction in the County must follow the State stormwater controls as defined in the Stormwater Management Act of 2007 Chapter 5 of the Stormwater Management Act on Environmental Site Design requires developers to maintain after development as nearly as possible the predevelopment runoff characteristics to the maximum extent practicable
7 Detect and eliminate illegal non-stormwater discharges into the storm drain
8 Involve and engage the public in the process of stormwater control
The County submitted its draft implementation plan to the Maryland Department of the Environment (MDE) on February 162011 (the report plus Appendix C attached beginning on copyA) Work with MDE is ongoing to finalize the Draft Plan However the County has been ramping up expenditures in the Water Quality Protection Fund (Operating Budget and CIP) for the past couple of years based on the previous draft and final permit requirements
Overall as noted in the draft implementation plan on copy27 DEP estimates costs at about $305 million through 2015 and nearly $19 billion in costs through 2030
Water Quality Protection Fund
The Water Quality Protection Fund and charge were created in 2001 via Council legislation (Bill 28-00) For the past 10 years the Water Quality Protection Fund has covered the costs for the Countys inspection maintenance and rehab of thousands of stormwater management facilities DEP is gearing up its implementation of the new NPDES permit approved last year and the Water Quality Protection Fund -ill be the primary source of funding (for both current revenue and bond financing) for this work as well
DEP is considering a number of changes to Chapter 19-35 of the County Code to modify the Water Quality Protection Charge This is not surprising given the major cost commitment of the NPDES-MS4 permit the fact that the County now has the benefit of 10 years of experience with the Water Quality Protection Charge and the availability of improved technologies to implement the charge The intent of these changes will be to make the charge more equitable and broader based and ensure that there are sufficient resources to meet the NPDES-MS4 permit requirements
-2shy
FY12 Budget Actions
As part of the FY 12 budget the Council approved a number of significant actions related to the Water Quality Protection Charge which is the primary funding source for the Countys compliance with the NPDES-MS4 permit These actions included
bull Shifting Department of Transportation (DOT) costs for storm drain maintenance to the Water Quality Protection Fund The movement of storm drain maintenance costs (first recommended by the County Executive) to the Water Quality Protection Fund was the single biggest increase to the Fund for FY12 ($2050070 and 30 workyears) This transfer recognizes that inlet cleaning is a specific MS4 permit requirement as is the mapping of the storm drain system in the County
bull Use of Water Quality Protection Fund for M-NCPPC Costs A total of nearly $19 million of FY12 expenses in the Parks budget and Planning Board staffbudget is now charged to the Water Quality Protection Fund This action was first recommended by the Councils Planning Housing and Economic Development (PHED) Committee and later endorsed by the T ampE Committee and approved by the Council
bull To accommodate the above impacts on the Fund the MS4 permit requirements noted earlier and other increases such as additional stormwater management facilities being added to the maintenance program the annual Water Quality Protection Charge rate per equivalent residential unit (ERU)l was increased from $49 for FYll to $7050 for FY12 Substantial increases in the charge are expected over the next several years under the current charge structure to meet the permit requirements (Note as mentioned earlier DEP is considering a number of changes in the Water Quality Protection Fund law including modifications to the charge)
Attachment KMLflevchenkodepnpdes permittampe committee ms4 implementation 10 10 l1doc
I The Council is required to set the rate per ERU for this charge each year by resolution The ERU is the amount each property owner of a single-family detached home pays per year for each property owned Townhouse owners pay 13 of an ERU Condominiums amp apartments are accessed based on actual imperviousness which is then converted to an ERU number Associated non-residential properties (ie properties that drain into facilities that also serve residential properties) are also charged in a similar manner to condominiums and apartments Federal State and municipal facilities do not currently pay the County charge Commercial properties that DO NOT drain into residential facilities also do not currently pay the charge
Properties in the City of Rockville and Takoma Park are not subject to the charge since those jurisdictions have their own charge The charge is paid by Gaithersburg residents but the revenue received is passed back (minus an administrative fee) to the City of Gaithersburg which spends the revenue on stormwater management-related projects in the City
-3shy
(o~ERl cOt Department of Environmental
~ -~ gtlt
bull 17 16 bull ~ IrH~YL~
Protection
MONTGOMERY COUNTY COORDINATED IMPLEMENTATION
STRATEGY
PREPARED FOR
MO TGOM ERY COUNTY
DEPA RTMENT OF ENVIRO NMENTAL PROTECTION
255 Rockville Pike Suite i 20
DRAFT February 1620 I I
Montgomery County Countywide Coordinated Implementation Strategy DRAFT
Prepared for
Montgomery County Department of Environmental Protection 255 Rockville Pike Suite 120 Rockville MD 20850
Prepared by
Biohabitats Inc 2081 Clipper Park Road Baltimore MD 21211
In collaboration with
Versar 9200 Rumsey Rd Columbia IViD 21045-1934
Horsley Witten Group 90 Route 6A Sandwich MA 02563
Capuco Consulting Services 914 Bay Ridge Road Suite 206 Annapolis MD 21403
February 2011
Chesapeake Stormwater Network 117 Ingleside Avenue Baltimore MD 21228
RESOLVE 1255 23rd Street NW Suite 875 Washington DC 20037
reg
Montgomery County Coordinated Implementation Strategy - DRAFT
TABLE OF CONTENTS
TABLE OF CONTENTS i
ACRONYMS ii
1 PURPOSE 1
Project Overview 1
Chesapeake Bay Total Maximum Daily Load (TMDL) 1
Montgomery County TMDLs 2
Montgomery County MS4 Permit Background 4
Implementation Plans and Pre-assessments 4
Trash Free Potomac 6
Public Outreach and Stewardship 7
2 EXISTING CONDITIONS 8
MS4 Permit Coverage 10
Impervious Surfaces 11
Implementation Plan Guidance Document 12
Impervious Cover Accounting and Tracking 12
Pollutant Load Tracking 14
3 WATERSHED IMPLEMENTATION PLANS AND RESTORATION POTENTIAL 17
4 COORDINATED IMPLEMENTATION STRATEGy 23
Summary of Individual Implementation Plans 28
Public Outreach and Stewardship 30
Trash Reduction 31
Adaptive Management Monitoring and Reporting 33
Organization Needs to Implement Strategy 34
5 REFERENCES 36
APPENDICES 38
021611
Montgomery County Coordinated Implementation Strategy - DRAFT
ACRONYMS
BMPs - best management practices
DA - drainage area
DEP - Department of Environmental
Protection
DF - discount factor
DU - dwelling unit
EPA - Environmental Protection Agency
ESD - environmental site design
GIS - geographic information systems
HOA - homeowners association
IA - impervious area
IC - impervious cover
LDR -low density residential
LID -low impact development
MDE - Maryland Department of the
Environment
MEP - maximum extent practicable
MDP - Maryland Department of Planning
MNCPPC - Maryland National Capital Parks
and Planning Commission
MPN - most probable number
MPR - maximum practicable reductions
MS4 - municipal separate storm sewer
system
NPDES - National Pollutant Discharge
Elimination System
RR - runoff reduction
SPA - Special Protection Area
TFPI - Trash Free Potomac Watershed
Initiative
TMDLs -total maximum daily loads
TN - total nitrogen
TP - total phosphorus
TSS - total suspended sediment
USACE - Army Corps of Engineers
WLAs - waste load allocations
WQPC - water quality protection charge
WRAP - watershed restoration action plan
WTM - watershed treatment model
021611 ii
Montgomery County Coordinated Implementation Strategy - DRAFT
1 PURPOSE
Project Overview
Montgomery Countys Department of Environmental Protection (DEP) watershed restoration
programs are restoring stream valleys improving water quality and addressing historical
damage caused by urban stormwater pollution Watershed restoration is a regulatory
requirement of the Countys National Pollutant Discharge Elimination System (NPDES)
Municipal Separate Storm Sewer System (MS4) Permit
This Countywide Coordinated Implementation Strategy (the Strategy) document presents the
restoration strategies that are needed to meet the watershed-specific restoration goals and
water quality standards as specified in the current MS4 permit Specifically the Strategy will
provide the planning basis for the County to
1 Meet Total Maximum Daily Load (TMDL) Wasteload Allocations (WLAs) approved by EPA
2 Provide additional stormwater runoff management on impervious acres equal to 20 of the impervious area for which runoff is not currently managed to the maximum extent practicable (MEP)
3 Meet commitments in the Trash Free Potomac Watershed Initiative 2006 Action Agreement which include support for regional strategies and collaborations aimed at reducing trash increasing recycling and increasing education and awareness of trash issues throughout the Potomac Watershed
4 Educate and involve residents businesses and stakeholder groups in achieving measurable water quality improvements
5 Establish a reporting framework that will be used for annual reporting as required in the Countys IIPDES MS4 Permit
6 Identify necessary organizational infrastructure changes needed to implement the Strategy
Chesapeake Bay Total Maximum Daily load (TMDl)
The Chesapeake Bay Total Maximum Daily Load (TMDL) established by the US Environmental
Protection Agency (EPA) sets pollution limits for nitrogen phosphorus and sediment in the
Chesapeake Bay Watershed This TMDL required under the Clean Water Act is in response to
021611
Montgomery County Coordinated Implementation Strategy - DRAFT
the slow progress by states within the watershed to limit their pollutants to levels which meet
water quality standards in the Bay and its tidal tributaries Total limits set in the Bay TMDL for
the states of Delaware Maryland New York Pennsylvania Virginia West Virginia and the
District of Columbia are 1859 million pounds of nitrogen 125 million pounds of phosphorus
and 645 billion pounds of sediment per year - a 25 percent reduction in nitrogen 24 percent
reduction in phosphorus and 20 percent reduction in sediment (USEPA December 2010) The
TMDL also sets rigorous accountability measures for state compliance Although an
implementation plan for the bay TMDL has not been completed the goals for Urban MS4s (18
nitrogen 34 phosphorus and 37 sediment) are compared to the reductions provided by
implementation of the Strategy
Montgomery County TMDLs
The County has a number of watersheds where EPA-approved TMDLs have established
pollutant loading limits for waterbodies These loading limits represent the maximum amount
of a pollutant that the waterbody can receive and still meet water quality standards and an
allocation of that load among the various sources of that pollutant (eg point sources or
nonpoint sources) MS4 permit jurisdictions like Montgomery County are considered point
sources and are given a waste load allocation (WLA)
Pollutant loads from point and non point sources must be reduced by implementing a variety of
measures One condition of the Countys MS4 Permit is to make progress toward
implementation of TMDL load reduction allocations in the Countys watersheds In addition to
TMDLs all of the watersheds in the County also have listed impairments Table 11 below lists
TMDLs and Impairments per watershed
021611
Montgomery County Coordinated Implementation Strategy - DRAFT
Table 11 Summary of TMDLs
Watershed Grouping
Approved TMDLs (Approval Date)
Bacteria (2007) Sediment (2007) Nutrients (2008)
Trash (20lQl Bacteria (2007)
Bacteria (2007)
DraftTMDLs
PCBs (2010)
Sediment (2010)
Sediment (2010)
Impairments (First Listed)
Heptaclor Epoxide (2002) Biological (2006)
Phosphorus (1996) TSS(1996)
Biological (2002)
Biological (2006)
Seneca Creek Sediment (2010) Biological (2006) (Mainstem)
Seneca Creek (Clopper Lake)
P osphorus and Sediment
~ ~
Lower Fecal Bacteria (2009) Nutrients (2010) Phosphorus (1996) Monocacy Sediment (2009) Biological (2002)
Phosphorus (1996) TSS (1996)
Biological (2006) PCBs in Fish Tissue (2008)
Phosphorus (1996) TSS (1996)
Biological (2006) PCBs in Fish Tissue (2008)
Biological
Sources httpwwwmdestatemdusprogramsWaterTMDLCurrentStatusPagesProgramsWaterPrograms TIVI DLSu m itta Isindexas px httpwwwmdemarylandgovprogramsWaterQualityFinancingSaterQualityFinanceHomePagesW
aterhb1141map wg montgomerycoaspx
MDE 2008 Integrated Report (combined 303(d) List and 30Sb Report)
TIVIDL was approved after Task Order tt7 was issued and is therefore not included in the detailed
pollutant load modeling associated with the Strategy
Patuxent (Tridelphia)
Patuxent
~middotmiddotIlmiddot- t- I ~ t I 4
bull 1 ~ bull t - - shy -l=~ _~l i-
(Rocky Gorge)
021611
Montgomery County Coordinated Implementation Strategy - DRAFT
Montgomery County MS4 Permit Background
On February 16 2010 Maryland Department of the Environment (MOE) issued Montgomery
County a new MS4 permit This S-year permit complies with the Environmental Protection
Agencys NPDES regulations that require large urban jurisdictions to control pollution from
stormwater runoff to the maximum extent practicable The EPAs latest estimates are that 10
percent of Marylands nitrogen load comes from urban and suburban stormwater runoff
(USEPA May 2010) The County MS4 Permit requires development of implementation plans to
meet WLAs through watershed restoration and other programmatic measures
Major new provisions of the permit include
bull Requiring restoration of an additional 20 percent of impervious surfaces not currently
receiving adequate treatment
bull Developing and implementing measurable strategies to reduce trash as part of the
Countys commitment to a trash-free Potomac River
bull Reducing pollutant loadings to comply with pollution limits necessary to meet water
quality standards for impaired waters (TMDLs)
The plans and strategies outlined in this document establish the steps Montgomery County is
taking to fulfill the requirements associated with this MS4 Permit
Implementation Plans and Pre-assessments
There are two major watersheds located within Montgomery County the Potomac River
watershed which covers approximately 88 of the County and the Patuxent River watershed
which covers approximately 12 of the County In terms of the Countys MS4 Permit area the
area proportion is 96 in the Potomac and 4 in the Patuxent River watersheds The County is
further divided into eight subwatersheds based on the eight digit United States Geologic Survey
(USGS) Hydrologic Unit Code (HUC) as shown in Figure 11 Seven of the eight subwatersheds
have restoration implementation plans that have been developed for this project effort The
eighth watershed Upper Potomac Direct does not have an implementation plan because a
watershed assessment has not yet been completed for the watershed as noted below
For more information about a specific watershed and the associated plans see the DEP website
(wwwmontgomerycountymdgovstormwaterpermit) The seven watersheds that have
implementation plans are
bull Anacostia
021611
Montgomery County Coordinated Implementation Strategy - DRAFT
bull Cabin John Creek
bull Lower Monocacy
bull Lower Potomac Direct (Muddy Branch and Watts Branch)
bull Patuxent
bull Rock Creek
bull Seneca Creek (Great Seneca including Clopper Lake)
lEGeND
_ Stal N nfU 1 P r
M3or ~til~hd5
D Atgt~
o COIIlln Jchl
D La frloocKJ
o Law Pctamox Quo
Dpsa~ll l Rod ~(~
Figure 11 Map of Watersheds
The goals of the implementation plans are to
bull Identify feasible best management practices (BMPs)
bull Quantify the area they treat and the amount of pollutants they can remove from
stormwater runoff before entering into the Countys streams rivers and lakes
021611
Montgomery County Coordinated Implementation Strategy - DRAFT
bull Determine the restoration potential for each watershed or subwatershed and evaluate
the ability to meet applicable TMDLs
bull Provide a schedule and cost estimate for meeting the WLAs set by the TMDL
In addition to the seven implementation plans there are three watershed pre-assessments that
have been completed for watersheds that have not been previously assessed The preshy
assessments will be used by the County to develop watershed assessments and associated
implementation plans which will be completed this permit cycle They include
bull Seneca Creek Little Seneca and Dry Seneca
bull Lower Potomac Direct including Rock Run and Little Falls but excluding Muddy Branch
and Watts Branch
bull Upper Potomac Direct including Little Monocacy amp Broad Run
The seven implementation plans (Table 12) provided the input data for the development of
this Strategy
Table 12 Watershed Groupings and Plans
Pre-Assessment
x x
x x
lower Potomac Direct (East of Seneca Creek not described in any other grouping)
Muddy Branch and Watts Branch x All other subwatersheds x
Patuxent (TriadelphiaBrighton Dam and Rocky
Gorge)
x
Great Seneca (including Clopper Lake)
Dry Seneca and Little Seneca
lower Monocacy
Upper Potomac Direct (West of Seneca Creek not described in any other grouping)
Trash Free Potomac
The Alice Ferguson Foundation founded the Trash Free Potomac Watershed Initiative (TFPWI)
in 2005 to reduce trash and increase awareness of trash issues in the watershed TFPWI actions
021611
Montgomery County Coordinated Implementation Strategy - DRAFT
include the Potomac River Watershed Trash Treaty Annual Potomac River Watershed Trash
Summit Annual Potomac River Watershed Cleanup market-based approaches such as the
Trash Free Potomac Facility Program and a Regional Anti-Litter Campaign (Alice Ferguson
Foundation 2011) The MS4 permit requires Montgomery County to meet the commitments of
Potomac River Watershed Treaty The permit specifically requires that Montgomery County
1 Support and implement regional strategies to reduce trash
2 Develop a work plan to implement a public outreach and education campaign
3 Establish baseline conditions of trash being discharged and develop a reduction strategy
and work plan for the Montgomery County portion of the Anacostia Watershed
4 Implement approved control measures in accordance with the trash reduction work
plan
5 Conduct public participation in development of trash reduction strategy
6 Submit progress annually
Public Outreach and Stewardship
The Countys MS4 Permit requires significant opportunities for public participation in achieving
TMDls watershed restoration and trash management The permit specifically requires the
County to prepare a work plan to implement a public outreach and education campaign The
County recognizes that a successful strategy will require a significant increase in effective and
coordinated public outreach and public stewardship The implementation plans and this
Strategy describe how DEP plans to implement public outreach and education campaigns with
specific performance goals and deadlines
021611
Montgomery County Coordinated Implementation Strategy - DRAFT
2 EXISTING CONDITIONS
Watershed health is variable throughout the County and typically well correlated with intensity
and age of urbanization More specifically watershed health typically declines with increasing
density and older age of development Many of Montgomery Countys older urban and
suburban areas were developed in an era when runoff from paved surfaces (roads parking lots
driveways) was directed to storm drains which conveyed untreated runoff directly to streams
This large volume of water caused massive erosion of the stream banks and destroyed habitat
Stormwater treatment using stormwater ponds to receive detain and filter runoff before it
flowed into streams was either inadequate or non-existent The Anacostia Rock Creek and
Cabin John Creek watersheds are examples where these conditions are common Modern
stormwater techniques known as environmental site design or ESD encourage the reduction
of runoff by infiltrating the water into the ground near its source
Watershed health improves in more rural areas of the County but even in these areas stream
degradation can occur stemming from large lot development and poor agricultural
management practices
The County has conducted comprehensive water quality and biological sampling for more than
a decade which provides a representative snapshot of existing watershed health as well as the
ability to track watershed health over time Figure 21 shows countywide watershed resource
conditions based on monitoring that was conducted from 2000-2008 The area inside the
beltway in the more urban core has lower water quality (fair to poor) while the area outside the
beltway tends to have better water quality (fair to good to excellent)
021611
---- -
-----
Montgomery County Coordinated Implementation Strategy - DRAFT
Watershed Resource Conditions Montgomery County Maryland
LEGEND z fbn
G 0middot1 - -~UlIS
- tI)Jogtf~
UJJOf Wrw Ftns
Splaquo1lII PnreltbOrI NtH SPAl
3D~~ennHI
[=jji=---~~-
Figure 21 County Watershed Resource Conditions
County Statistics
The Strategy will benefit from the fact that the majority of county residents own the property
they reside on (nearly 70) and thus have control over that property Also nearly 70 of the
residences are single unit homes Moreover the average household income is roughly $90000
making the likelihood of financial capability to install BMPs an appropriate assumption Both of
these statistics make advocacy of BMPs on residential properties an imperative for the Strategy
Montgomery Countys robust business economy was also considered in the Strategy
development Despite the current economic volatility Montgomery Countys business
community is still profitable and still maintaining and improving existing facilities Moreover
the construction of the inter-county-connector (ICC) through much of Montgomery County will
provide opportunities to install demonstration BMPs on newly developing properties for
replication throughout stakeholder groups Also the presence of communication industry
leaders (ie Discovery Channel) in the County creates unique stewardship education
partnership possibilities with businesses The Strategy will include these stakeholders
021611
Montgomery County Coordinated Implementation Strategy - DRAFT
involvement opportunities to best harness the power of Montgomery Countys healthy
business economy
The county includes a fairly even split of males and females The majority of residents nearly
50 fall between the ages of 25 and 55 Only 15 of the population is aged 60 and above In
addition the majority of Montgomery County residents indicate their preferred language as
English however Spanish translations of stakeholder involvement opportunities will be
required in select watersheds to accommodate the 13 of county residents that indicate their
preferred language as Spanish Other potential target groups for translation for stakeholder
involvement include the Asian community as 11 of the countys population is Asian (mostly
Korean and Vietnamese) Because of this the Strategy and implementation plans will take
multilingual requirements into consideration for signage and other educational tools as well
MS4 Permit Coverage
The Countys most recent NPDES MS4 stormwater permit only covers runoff from
developments within the County area The following areas are excluded from the Countys MS4
permit area shown in Figure 22
bull Cities of Gaithersburg Rockville and Takoma Park
bull Maryland National Capital Park and Planning Commission (MNCPPC) lands
bull Washington Sanitary Sewer Commission (WSSC) land
bull Federal and State government owned land and facilities
bull Rural zoning
021611 G
Montgomery County Coordinated Implementation Strategy - DRAFT
MS4 Permit Area Montgomery County Maryland
(-i Gaithersbur9 ~
M Ro ckville
TkD m Parilt -Jr MNC PPC Lnds
0 5 3
Feder 1 and SI PropertyM i KbnelefS
M 0 I 2 ~- Federal and Sta1e Roads
~ i s Rural Zon ing
Figure 22 Areas outside the Montgomery County MS4 Permit Area
Impervious Surfaces
As previously mentioned the Countys MS4 Permit requires treatment of an additional 20 of
impervious cover not currently receiving treatment to the MEP Table 21 presents a summary
of the countywide impervious cover totals along with breakdowns by major land cover type
These land covers will be the focus of much of the Countys targeted effort to treat the 20
target
021611
Montgomery County Coordinated Implementation Strategy - DRAFT
Table 2llmpervious Surface Summary
Description
Total County Area 324552 100
Total Area of 1m ervious Surface 35965 _ _-----shy 11
County Area Subject to Stormwater Permit (1) 138649 43
Imllervious Cover Subject to Stormwater Permit 2) ~==5119====18o2 == ==== Areas of Impervious Surface (3)
Road 13607 38
Building 13073 36
Parking 22
Sidewalk 1069 3
Recreation (4) 347 1 1 Exclusions include Certain zoning codes parklands forests municipalities with own stormwater management
programs state and federal properties and state and federal maintained roads 2 Percent of County Jurisdictional Area subject to the Stormwater Permit 3 Impervious area within each category within the total County area 4 Recreation imperviousness excludes swimming pools
Implementation Plan Guidance Document
The Implementation Plan Guidance Document (revised October 252010) provides a road map
for how the implementation plans were created The primary sections of the Guidance
Document and a short description of each are provided in Appendix A
The Guidance Document divides BMPs into five classes or codes shown below The Guidance
Document also provides a list of BMPs and which code they fall under which is provided in
Appendix B
Code 0 Pretreatment Practices
Code 1 Non-performing BMPs No runoff reduction and no long term pollutant removal
Code 2 Under-performing BMPs Limited runoff reduction and low pollutant removal
Code 3 Effective BMPs No runoff reduction but moderate to high pollutant removal
Code 4 ESO BMPs High runoff reduction and moderate to high pollutant removal
Impervious Cover Accounting and Tracking
Montgomery County has GIS data layers that contain all the stormwater BMPs in the County
and their drainage areas In order to determine the 20 target for impervious cover treatment
021611
Montgomery County Coordinated Implementation Strategy - DRAFT
to the MEP the County analyzed their existing impervious cover and their existing BMP
database to determine how much impervious cover is currently being treated to the MEP
Several methods were considered based on a determination of the MEP standard compared to
existing treatment methods According to MDE guidance to be considered MEP a BMP must
capture at least the Water Quality Volume (WQv) (the first inch of rainfall) or the CPv volume
(26 inches of rainfall) The final method used for determining which BMPs are MEP and the
amount of impervious surface not treated to the MEP was as follows
1 All BMPs that were installed after 2002 or are classified as Code 4 were considered MEP
2 An analysis of typical Code 3 stormwater ponds installed after 1986 was performed to
determine if this class of BMPs met the definition of IVIEP Based on that analysis Code
3 BMPs constructed after 1986 are considered MEP
3 All other classes of BMPs not specified above are not considered MEP and are eligible
for retrofit
Table 22 below shows the breakdown of the impervious acres treated by BMP codes and era
(shaded areas are BMP codes treated to the MEP)
Table 22 Acres of Impervious Cover Treated by BMP Code and Design Era
Design Era Post2002 1986-2002 Pre1986 Blank Total
CIJ tl 0 u Q
~ co
0 28 711 24 132 895
1 33 555 1391 367 2346
2 41 299 12 23 375
3 75 2482 1437 267 4261
4 20 459 482 40 1001
Totals 198 4506 3345 828 8877
IC Credit 100 Code 3amp 4 Code 4 Total Acres treated to
MEP 198 2942 482 40 3661
Assuming a total countywide impervious acreage of 25119 acres and an impervious acreage
treated to the MEP of 3661 as shown in Table 22 there are currently 21458 acres of
untreated impervious area Twenty percent of 21458 equates to 4292 acres of impervious
area that must be restored over the current permit cycle
021611
Montgomery County Coordinated Implementation Strategy - DRAFT
Pollutant Load Tracking
In addition to tracking impervious cover it is necessary to compute existing pollutant loads and
projected reductions in loads as a result of applying storm water controls and BMPs The Center
for Watershed Protections (CWP) Watershed Treatment Model (WTM) version 20 (CWP 2001)
was the tool selected to conduct this analysis and track load reductions across a range of
implementation strategies
The WTM uses a spreadsheet model to calculate annual pollutant loads and runoff volumes
The model also accounts for the benefits contributed by a full suite of stormwater treatment
practices and programs The first step in the model calculates existing pollutant loads by adding
primary and secondary source loads then subtracting reductions according to existing
management practices The second step applies future management practices by subtracting
these calculated reductions from the existing loads Appendix B of the Guidance Document
provides a detailed explanation of the assumptions and steps in the modeling process
For each watershed the WTM was run under existing conditions with existing BMPs to
determine a baseline pollutant load for targeted pollutants The baseline period for non-TMDL
parameters was based on 2002 Maryland Department of Planning land useland cover data
coupled with the Countys existing urban BMP database Pollutants targeted included bacteria
Total Phosphorus (TP) Total Nitrogen (TN) Total Suspended Solids (TSS) and Trash Next a
series of model runs was developed for analyzing the pollutant load reduction effect that
various restoration strategies would have based on assumed levels of implementation for the
various strategies Individual restoration strategies that were sequentially modeled included
the following
bull Completed and High Priority Projects - these include projects already completed or high
priority structural BMPs scheduled for retrofit in the FYll-FY16 Capital Improvements
Program (CIP)
bull Low Priority Projects - these includes FY11-FY16 CIP projects that for various reasons
are considered a lower priority
bull Other Potential Projects - these include other projects in existing inventories that were
not listed in the previous two categories For the Anacostia they include projects in
Anacostia Restoration Plan (ARP) prepared by the Army Corp of Engineers
bull Public ESD Retrofits - These include small scale ESD practices applied to County-owned
buildings streets and parking lots and rights of way Examples include rainwater
harvesting green roofs upland reforestation soil compost amendments rooftop
disconnection green street retrofits and converting drainage ditches to dry swales
021611
Montgomery County Coordinated Implementation Strategy - DRAFT
These are Code 4 structures This category also includes other structural BMP upgrades
to existing County BMPs which were designated as under-performing or nonshy
performing
bull Private ESD Retrofits - These projects include ESD on commercial property and
residential property and include green roofs rain gardens and permeable pavement
bull Riparian Reforestation - Focuses primarily on tree planting for riparian buffer
restoration
bull Stream Restoration - Includes the use of natural materials such as rocks logs and native
vegetation to reduce pressure on eroded banks prevent down-cutting of the
streambed and restore the natural meander patterns and slope profiles found in stable
reference streams
bull Programmatic Practices - This category deals with potential pollutant reduction that can
be attributed and quantified through MS4 stormwater pollution prevention
improvements and better housekeeping on County land and facilities Also includes any
pollutant reductions due to product substitution (eg nitrogen and phosphorus limits in
fertilizer) operational programs (eg recycling) and enforcement This category also
deals with reduced pollutants that can be attributed and quantified through MS4
stormwater education (eg lawn care) and outreach aimed at pollution prevention
better housekeeping and increased stewardship
The naming convention applied for the model runs was WTM 10 (ie baseline) WTM 20 (Le
completed and high priority low priority and other potential projects) WTM 30 (Le public
and private ESD) WTM 40 (ie riparian reforestation and stream restoration) and WTM 50
(ie programmatic) Model runs were developed sequentially to yield incremental increases in
load reduction by strategy In practice however strategies can be applied in combination and
out of sequence to achieve targeted outcomes and the most cost-effective solutions A
summary of the scenarios is provided in Table 23 below
021611
Montgomery County Coordinated Implementation Strategy - DRAFT
Table 23 Summary of Watershed Treatment Model (WTM) Scenarios
Implementation Phase Description
The WTM was run under existing conditions approach
WTM Baseline Conditions with the MDP year 2002 land useland cover data and
existing BMPs
WTM 20 Completed as of
2009j High Priorityj Low
Priority and Other Potential
Projects
The WTM was run with a series of future management
practices which were proposed projects from the
County inventory of restoration sites These practices
cover new ponds retrofits of existing BMPs and some
ESD practices from the proposed projects list
The Countys inventory for other project types that
include public properties eg libraries and parkingWTM 30 ESD Strategies and
lots public schools and open section roads available Other Structural BMPs
for ESD retrofits was reviewed as were areas for
private property ESD retrofits
This category includes any pollutant reduction or volume
reduction that can be attributed to specific stream
WTM 40 Habitat rehabilitation wetland restoration and or riparian
Restoration reforestation projects planned for construction in the
watershed for the permit cycle
WTM 50 MS4 Programmatic See description above
Practices
TMDL Calibration and Tracking
Where TMDLs existed for individual watersheds the WTM was run under existing conditions
with existing BMPs based on the year in which the data was collected for TMDL development
The baseline pollutant load was then compared and normalized to the MDE-determined
baseline MS4 load for the TMDL pollutant Any BMPs with approved dates after the year in
which the data was collected for TMDL development were not included in the baseline
calculation but rather were counted towards meeting the TMDL reduction target
Once the normalized model was established reductions achieved through programs and
practices were tracked using the WTM scenarios based on the percent load reduction from
baseline toward meeting the TMDL required WLA The normalized baseline and WLA target are
determined and specified in the relevant TMDL documents developed by M DE
021611
Montgomery County Coordinated Implementation Strategy - DRAFT
3 WATERSHED IMPLEMENTATION PLANS AND RESTORATION POTENTIAL
The watershed implementation plans and pre-assessments developed in conjunction with the
Strategy are driven by regulatory requirements facing each watershed Table 31 summarizes
the drivers by watershed
Table 31 Restoration Objectives -
W~tershedSubwater~hed - Trash
4 bull - I _ _ -
Patuxent
Anacostia
Rock Creek
Great Seneca
Cabin John Creek
lower Monocacy
Watts BranchMuddy Branch
Dry and little Seneca
lower Potomac Direct
Table 32 presents the more detailed and quantitative aspects of the TMDl requirements for
the MS4 portion within each watershed The Strategy has been developed to meet the MS4
permit area WLA compliance targets presented in Tables 32
In addition to the individual watershed requirements there is a Countywide requirement to
comply with the wasteload allocations associated with urban areas under the Chesapeake Bay
TMDl which applies to nutrients and sediment There is an interim target established for 2017
where reductions from baseline conditions of 9 12 and 20 respectively for TN TP and
TSS are to occur Then by 2020 full compliance is required which correspond to reductions
from baseline conditions of 18 34 and 37 respectively for TN TP and TSS
021611
Montgomery County Coordinated Implementation Strategy - DRAFT
Table 32 TMDl Summary by Impairment
Watershed
Cabin John Creek
Rock 2007 Enterococci 970 453669 18195 Creek
Anacostia 2007 Enterococci 860 247809 29978 River
Aoacostia 2008 TN 788 206312 38959 River
Anacostia 2008 TP 797 20953 3947 Ibsyr River
Triadelphia 2008 TP 580 438 Reservoir
Rocky Gorge 2008 TP 480 4268 3628 Reservoir
Clopper Lake 2002 TP 393
Anacostia 2007 TSS 850 7682 River
Triadelphia 2008 TSS Reservoir Clopper 2002 TSS 00 13 13
Lake
Lower 2009 TSS 380010 172 Monocacy
River
Anacostia 2010 Trash 1000 228683 Ibsyr River
Adapted from 2010 Status of Approved Stormwater Waste load Allocations for NPDES Regulated Stormwater Entities in Montgomery County April 27 2010 by Jeff White MDE
Potential to Reduce Stormwater Pollutant loads
Within each of the implementation plans an analysis was developed that explored the
restoration potential for that watershed Cost was not a limiting factor for the analysis but
rather assumptions were made based on feasibility of implementation rates and consideration
of conflicts with typical site conditions with respect to site use utilities land ownership etc
For example it was assumed that 40 of large County-owned parking lots would be available
for stormwater retrofitting These assumptions are necessary for planning purposes where
detailed site investigations have not occurred However some level of implementation is
021611
Montgomery County Coordinated Implementation Strategy - DRAFT
reasonable to assume In addition all identified high priority and low priority County projects
that have the potential to be constructed were assumed to be implemented
Implementation cost and effectiveness (in terms of pollutant load reduced) was also tracked
through the process of determining watershed restoration potential which enables the
costbenefit evaluation of various strategies for a target parameter (eg tons of sediment per
dollar spent or billion MPN of bacteria per dollar etc) For example by tracking cost and
effectiveness it is possible to evaluate the relative costbenefit of a strategy like ESD versus a
non-structural programmatic practice Moreover the comparison of these two strategies is
going to be different depending on what parameter is being considered eg ESD may be more
cost effective for nutrient reduction but less cost effective for bacterial load reduction
The tables in Appendix C help to illustrate this point Specifically a series of summary charts
and tables have been developed that illustrate the cost effectiveness of the range of strategies
considered by watershed with respect to pollutant load reduction The summaries reflect the
full restoration potential developed for each watershed
It is also useful to compare strategy effectiveness and range of opportunity across watersheds
To facilitate this a series of tables were compiled that groups all watersheds together and
considers watershed restoration potential by strategy These summary tables are presented in
Tables 33 through 310
For this analysis stream restoration was treated as a special modeling case (Table 39) because
it was not tracked as a strategy that receives credit for impervious cover treatment and because
it requires a different pollutant load reduction tracking method based on linear feet of
implementation and the existing stream resource condition (good fair or poor IBI scores
received different pollutant removal credit) Further details on stream restoration modeling
are presented in the individual implementation plans and the Guidance Document
Not all WTM scenarios were modeled for all watersheds For example if there were no
previously identified completed high priority low priority or other potential projects within a
watershed they would appear as zeros for that individual watershed in Tables 33 through 36
Also for non-TMDl watersheds such as Great Seneca and Muddy Branch and Watts Branch
subwatersheds the public and private property ESD riparian reforestation and MS4
programmatic practices scenarios were not modeled due to the lack of regulatory drivers that
define pollutant removal targets
021611
Montgomery County Coordinated Implementation Strategy - DRAFT
Table 33 Cost and benefit summary for completed projects (WTM 20)
Watershed Total ESD PrOjects Incremental reduction from baseline ()
i Cost Numberof Impervious
Cost
I Impervious Trash control added TN TP TSS Bacteria
(million $) projects bullbull (ac)
(total) (total)
Anacostia 95 25 167 7 3 4 4 1 4 4
Cabin John 00 0 0 0 0 02 02 03 03 1
Rock Creek 44 6 212 13 1 2 2 3 3 2 i
I Triadelphia 00 0 0 0 0 0 0 0 0 0
Rocky Gorge 00 0 0 0 0 0 01 0 0 0
Lower Monocacy 00 0 0 0 0 0 0 0 0 0
Clopper lake 00 0 0 0 0 0 0 0 0 0
Great Seneca bull 06 2 11 0 0 1 1 I 1 0 2
MuddyWatts 00 0 0 0 0 0 0 0 0 0
Indudes Clopper lake Project count does not include stream restoration Pollutants with a TMDL are highlighted
Table 34 Cost and benefit summary for high priority projects (WTM 20)
Watershed I
I
Total ESD Projects Incremental reduction from baseline ()
Cost
(million $)
i Numberof
projects bullbull
Impervious
control added
(ac)
ICost (total)
Impervious
(total) TN
I TP TSS I TrashBacteria
Anacostia 64 33 148 65 16 2 2 06 2 2
Cabin John 16 6 88 19 2 3 3 3 3 1
Rock Creek 89 14 373 13 1 2 3 3 3 4
Triadelphia 00 0 0 04 0 0 0 0 0 0
I Rocky Gorge 04 2 5 77 27 06 06 07 06 1
Lower Monocacy 00 0 0 0 0 0 0 0 0 0
Clopper lake 00 0 0 0 010 0 0 0 0 0 Great Seneca bull 183 24 789 6 08 19 19 20 0 24
MuddyWatts 44 16 211 8 1 6 6 6 0 6
Indudes Clopper lake bullbull Project count does not indude stream restoration Pollutants with a TMDL are highlighted
Table 35 Cost and benefit summary for low priority projects (WTM 20)
I Watershed Total ESO Projects Incremental reduction from baseline ()
Numberof Impervious ICost 1m ~ i Cost Impervious
I (million $) projects bullbull
control added (total) (total)
TN TP Bacteria Trash
(ac)
I Anacostia 51 16 188 61 8 2 2 07 2 3
Cabin John 16 8 10 98 78 02 02 02 02 03
I Rock Creek 88 24 657 7 1 4 4 6 5 7
Triadelphia 040 1 20 100 100 05 05 06 05 1
Rocky Gorge 09 2 458 100 100 84 82 83 82 116 i
I Lower Monocacy 0 0 0 0 0 0 0 0 0 0 I Clopper lake 0 0 0 0 0 0 0 0 0 0
I Great Seneca bull 66 16 87 41 15 4 4 4 010 4
I MuddyWatts 20 6 26 84 33 0 0 1 0 0
Includes Clopper Lake Project count does not include stream restoration Pollutants wth a TMDL are highlighted
021611
Montgomery County Coordinated Implementation Strategy - DRAFT
Table 36 Cost and benefit summary for other potential projects (WTM 20)
I Watershed Total ESO Projects Incremental reduction from baseline ()
ICost Impervious I Cost
I I Trash INumber of
control added Impervious
TN TP TSS Bacteria (million $) projects bullbull
(ac) (total) (total)
i i
Anacostia 2492 497 2222 73 62 23 8 26 301
Cabin John 00840 1 5 0 010 01 01 01 01 01
Rock Creek 20 4 201 0 0 12 12 19 15 21
Triadelphia 00 0 0 010 0 00 00 00 00 00
Rocky Gorge 20 2 0 010 0 00 00 00 00 00
lower Monocacy 00 0 0 0( 0 00 00 00 00 0010
Clopper Lake 00 0 0 0 0 00 00 00 00 0010
Great Seneca bull 02 S S3 0 0 23 23 27 00 27
MuddyWatts 00 0 0 0 0( 00 00 00 00 0010
bull Includes Clopper Lake bullbull Project count does not include stream restoration Pollutants with a TMDL are highlighted
Table 37 Cost and benefit summary for ESO projects (WTM 30)
Watershed
I
Cost (million $) Impervious
control added
(ac)
Incremental reduction from baseline ()
ESDfor i ESO for private
public
property property
TN TP TSS Bacteria Trash
Anacostia 2378 21296 1813 20 21 7 22 27
Cabin John 878 10307 876 22 23 25 24 28
Rock Creek 2471 341 2427 30 30 33 32 35
Triadelphia 41 47 36 10 1010 11 11 20
Rocky Gorge 312 19 28S 26 27 32 30 46
lower Monocacy 86 29 53 14 15 15 15 010
Clopper lake 08 051 21 14 14 15 0 14
Great Seneca bull 00 0 0 010 0 0( 0( 010
MuddyWatts 00 a 0 0 01 010 0 0
bull Includes Clopper lake Pollutants with a TMDL are highlighted
Table 3B Cost and benefit summary for riparian reforestation (WTM 40)
IWatershed Cost (million $) Impervious
Incremental reduction from baseline ()
control added Habitat restoration (ac) TN TP TSS Bacteria Trash
Anacostia 1 6 0 0 0 01 02
Cabin John 777 39 1 2 lili
3
Rock Creek 24 119 2 2 2 5
Triadelphia 010 1 01 02 01 04 03
Rocky Gorge 25 12 1 2 2 3 8
lower Monocacy 11 S 3 3 3 4 0
Clopper Lake 023 2 4 4 2 010 4
Great Seneca bull 0 a 010 010 0 010 0
MuddyWatts 0 0 010 0 0 0 0
bull Includes Clopper lake Pallutonts with a TMDL are highlighted
021611
Montgomery County Coordinated Implementation Strategy - DRAFT
Table 57 Cost and benefit summary for stream restoration (WTM 40)
Watershed Stream Restoration Incremental reduction from baseline ()
Number of Impervious control
Cost (million $) added(ac) TN TP TSS Bacteria Trash projects
Anacostia 937 200 0 42 56 326 0 0
Cabinlohn 162 15 0 17 9 80 0 0
Rock Creek 201 30 a 9 710 100 0 0
Triadelphia 00 0 0 0 0 0 010 0
Rocky Gorge 191 18 I 0 10 7 36 0 O lower Monocacy 73 nla 0 7 10 32 010 0
Clopper Lake 00 a 0 0 0 0 0 0
Great Seneca It I 259 33 0 19 8 16 0 0
MuddyWatts 242 45 0 16 7 13 0 0
Includes Clopper Lake Pollutants with a TMDL are highlighted
Table 58 Cost and benefit summary for M54programmatlc practices (WTM 50)
Watershed Cost (million $) Incremental reduction from baseline ()
Programmatic
practices - M54
Impervious control
added (ac) TN TP TSS Bacteria Trash
Anacostia 36 0 9 9 10 8 82
Cabin John 047 0 15 14 0 10 0
Rockereek 12 0 11 11 0 7 0
Triadelphia 00056 a 23 3 0 0 0
Rocky Gorge 009 0 38 8 03 5 2
lower Monocacy 007 0 0 0 19 0 0
Clopper Lake 0Q1 0 61 30
~=r 0
Great Seneca 10 0 0 0 0 0Y0 0 0
MuddyWatts 0 0 0 0 0 0 0
bull Includes Clopper Lake Pollutants with a TMDL are highlighted
021611
Montgomery County Coordinated Implementation Strategy - DRAFT
4 COORDINATED IMPLEMENTATION STRATEGY
The Strategy has multiple objectives to accomplish whereby a challenging balance between
strategies and timeframe is required There isnt necessarily a correct answer in the process
but rather an optimized result that addresses an agreed upon suite of priorities The Strategy
presented here was primarily driven by known and established regulatory timeframes and
compliance endpoints Meeting these endpoints using the more cost effective approaches was
also given priority After this consideration was given to other known and important
approaches that stakeholders and the County have an interest in pursuing Specifically the
following compliance dates and objectives were conSidered in developing the Strategy over the
long-term (Table 41)
Table 41 Compliance Targets for Countywide Coordinated Implementation Strategy
Target Date
2015
2017
2020
Compliance Target
Meeting 20 impervious cover treatment requirement
within the MS4 Permit cycle
Meet the interim dates and targets for the Chesapeake
Bay TMDL which include specific regulated urban area
reductions by 2017 for nutrients and sediment (based
on Maryland Department of the Environments
Watershed Implementation Plan)
Meet the full compliance and targets for the
Chesapeake BayTIVIDL which include specific regulated
urban area reduction by 2020 for nutrients and
sediment (based on Maryland Department of the
Environments Watershed Implementation Plan)
Metric
~4300 acres of
Impervious Cover
9 12 and 20
respectively for TN TP
and TSS reductions
from baseline
conditions
18 34 and 37
respectively for TN TP
and TSS reductions
from baseline
conditions
2025
2030
Meet additional impervious cover treatment targets
associated with next MS4 Permit cycle (assumes
another 20 target)
Meet additional impervious cover treatment targets
associated with next MS4 Permit cycle (assumes
another 20 target)
Out year compliance with other watershed TMDLs
~3400 acres of
Impervious Cover (20
of impervious
remaining after 2015)
~2750 acres of
Impervious Cover (20
of impervious
remaining after 2020)
100 compliance with
MS4 Permit Area WLAs
021611
Montgomery County Coordinated Implementation Strategy - DRAFT
To meet the compliance targets outlined in Table 41 the following priorities were generally
followed
bull 100 implementation of completed high and low priority County projects in first five
years (by 2015)
bull Greater ESD focus in urban (as opposed to suburban and rural) watersheds initially Goal
for ESD in these watersheds on pUblic property in first five years is 10 and on private
property is 10 The level of implementation was largely driven by the 20 Countywide
impervious goal
bull 100 of Public Outreach Potential for all TIVIDl watersheds in first five years This was
pursued to address trash nutrient and bacteria loading which rely strongly on effective
outreach programs to modify behaviors
bull Generally limited strategies to the top four most cost effective per watershed
bull Habitat restoration (stream restoration and buffer reforestation) not pursued as priority
until after first five year period These programs emphasize greater pollutant reduction
efficiency rather than impervious cover treatment which is the primary focus for the
first permit cycle
The Strategy was informed by the individual watershed implementation plans for seven
watersheds which included the Clopper lake and Patuxent subwatersheds Therefore in order
to develop countywide estimates for pollutant load reduction (as is required by the Chesapeake
Bay TMDl) watershed area weighting was applied The process for developing the Countywide
strategy and individual watershed implementation plans was woven together Once the
restoration potential was determined from the individual plans the strategy and schedule was
compiled using the restoration potentials and the drivers listed above The final restoration
cost and schedule was then placed in the implementation plans
It is also worth noting that the high and low priority projects along with the other potential
projects strategies represent a static or fixed number of projects that have been identified by
the County For this analysiS this list of practices is not replenished and therefore once all
opportunities have been implemented other strategies are pursued In reality the County will
continue to develop and update its list of specific project opportunities and have these
available for implementation in future years
The output from this effort is presented in a series of tables ordered by target date in Appendix
D In addition Table 42 provides an overall summary of pollutant load reduction tracking
versus time Through inspection of Table 42 it can be seen that the Strategy meets the
021611
Montgomery County Coordinated Implementation Strategy - DRAFT
impervious cover treatment targets under the current MS4 permit (as well as projected targets
for 2020 and 2025 assuming a continued 20 treatment requirement) interim and final
Chesapeake Bay nutrient and sediment reduction targets by 2017 and 2020 respectively and
out year MS4 permit area WLA compliance for the majority of pollutants Exceptions include
meeting the bacteria WLA load reductions required for the Anacostia and Rock Creek
021611
Montgomery County Coordinated Implementation Strategy - DRAFT
Table 42 Projection by Phase for Watersheds and Pollutants PermitTMDL Targets
Watershed Fiscal Year 2015 2017 2020 2025 2030 2017 2020
Impervious Treated (acres) 1421 2393 3364 4272 4544
ESD ( Impervious) 26 44 61 69A 71
Cost (Million $) 160 307 486 732 820
E5D( Cost) 45 62 71 78 78
Anacostia Nitrogen 25 39 68 89A l00A 818 82
Phosphorus 27 42 77 100 100 812 81
i Sediment 47 72 100 l00A) l00A 875 88
Bacteria 21 33 46 59A 64 879 88
Trash 41 65 89 l00A) 100
Impervious Treated (acres) 1541 1961 2381 3625 3989
ESD ( Impervious) 17 28 36 57A 61
Cost (Million $) 87 172 262 566 658
ESD ( Cost) 7(JA 79 79A 89A 9(JA
Rock Creek Nitrogen 24 30 38 55 61
Phosphorus 25 3(JA 38 54 GfJA)
Sediment 38 50 92 l00A 100
Bacteria 21 27 33 5(JA 55 96(JA 96
Trash 17 24 31 5(JA) 55
Impervious Treated (acres) 187 380 570 1018 1018
ESD ( Impervious) 52 72 78 87A 87A
Cost (Million $) 23 65 114 215 219
ESD ( Cost) 92 91 86 90 88
Cabin John Nitrogen 21 27A 39A 55 58 Phosphorus 2(JA 26 35 49 51
Sediment 6 17 GfJA 91 100
Bacteria 16 22 27 4(JA) 40 31 31
Trash 6 12 19 34 34
Impervious Treated (acres) 237 237 237 237 237
ESD ( Impervious) 4 4 4 4 4
Cost (Million $) 6 8 19 25 31
ESD ( Cost) 32 27A 11 8 7
Muddy Watts Nitrogen 6 7 15 18 22
Phosphorus 6 7 10 12 13 Sediment 7 8 14 17 2(JA
Bacteria 0 (JA 0 (JA 0 i Trash 6 6 6 6 6
bull Impervious Treated (acres) 901 921 941 941 941 ESD ( Impervious) 2 2 2 2 2
Cost (Million $) 26 48 SO 51 52 ESD ( Cost) 15 8 8 8 8
Great Seneca Nitrogen 24 41 43 44 45
Phosphorus 24 32 34 34 34
i Sediment 26 41 43 44 44
I Bacteria (JA) 0 0 0 (JA
Trash 31 32 33 33 33
021611
Montgomery County Coordinated Implementation Strategy - DRAFT
Pe rmitTMDL Targets
Watershed Fiscal Year 2015 2017 2020 2025 2030 2017 2020
Clopper
Impervious Treated (acres) 0 6 12 22 22
ESD ( Impervious) 0 86 86 92 92
Cost (Million $) 0 0 1 2 2
ESD ( Cost) 0 72 73 84 84
Nitrogen 61 67 72 79 79
Phosphorus 30 36 41 48 48 45 45
Sediment 0 5 10 17 17
Bacteria 0 0 0 0 0
Trash 0 6 11 18 18
Lower Monocacy
Impervious Treated (acres) 1 16 32 58 58
ESD ( Impervious) 100 85 84 91 91
Cost (Million $) 0 4 11 18 20
ESD ( Cost) 100 85 54 63 58
Nitrogen 0 5 14 22 24
Phosphorus 0 5 16 26 28
Sediment 0 5 46 61 69 608 61
Bacteria 0 6 12 19 19
Trash 0 0 0 0 0
Rocky Gorge
Impervious Treated (acres) 11 88 165 307 307
ESD ( Impervious) 64 89 90 95 95
Cost (Million $) 3 17 40 70 75
ESD ( Cost) 55 82 64 73 68
Nitrogen 47 55 6710 82 85
Phosphorus 17 25 36 52 53 15 15
Sediment 10 19 45 7(J1o 79
Bacteria 14 23 32 47 47
Trash 15 30 46 68 68
Triadelphia
Impervious Treated (acres) 3 12 20 38 38
ESD ( Impervious) 100 98 97 99 99
Cost (Million $) 1 3 5 9 9
ESD ( Cost) 99 98 98 99 99
Nitrogen 24 27 29 34 34
Phosphorus 4 7 9 14 14 15 15
Sediment 1 4 6 12 12
Bacteria 1 4 6 12 12
Trash 2 6 11 21 21
Countywide
Impervious Treated (acres) 4302 6014 7722 10518 11154 6008 7723
ESD ( Impervious) 18 34 47 6(J1o 63
Cost (Million $) 305 622 987 1687 1884
ESD ( Cost) 53 66 7(J1o 8(J1o 80
Nitrogen 18 25 36 46 51 9 2(J1o
Phosphorus 17 23 34 44 46 12 34
Sediment 23 34 54 6(J1o 62 20 37
Bacteria 11 15 20 28 30
Trash 18 26 33 41 42
Assumptio~s
1 Does no~ includerepeated Outreach and Education costs beyond FY2015
2 Does not include ~n inflation multiplier
021611
Montgomery County Coordinated Implementation Strategy - DRAFT
Summary of Individual Implementation Plans
A summary of the general considerations and prioritization for each watershed implementation
plan is provided below
Anacostia - For the first permit cycle (through 2015) a priority was placed on full
implementation of completed high and low priority projects Next implementation of a third
of the other potential projects was targeted as a large number of these were identified in
conjunction with the USACEs Anacostia Watershed Restoration Plan efforts ESD was
emphasized on both public (10) and private property (10) Finally outreach (25) and
stream restoration (12) are targeted for pollutant load reduction but are not credited towards
impervious cover credit In future permit cycles the remainder of the other potential projects
are targeted along with ESD and a limited amount of riparian reforestation for impervious cover
and pollutant load reduction Outreach and stream restoration are significant strategies
pursued for load reduction benefits Nutrient and sediment MS4 permit area WLAs are met by
2030 but bacteria load reduction does not meet MS4 permit area WLA compliance The
remaining bacteria reduction is believed to be associated with urban wildlife sources Unless
intense urban wildlife management practices are implemented this remaining load reduction
will not be possible
Rock Creek- For the first permit cycle (through 2015) a priority was placed on full
implementation of complete high and low priority projects Next 25 implementation of
other potential projects was targeted ESD was emphasized on both public (10) and private
property (10) with private property implementation being linked to Rainscapes Program
success Finally outreach (100) and stream restoration (22) are targeted for pollutant load
reduction but are not credited towards impervious cover credit In future permit cycles the
remainder of the other potential projects are targeted along with ESD and riparian
reforestation for impervious cover and pollutant load reduction Stream restoration is a
significant strategy pursued for load reduction benefits The bacterial load reduction does not
meet MS4 permit area WLA compliance However the remaining bacterial load is believed to
be associated with urban wildlife sources Unless intense urban wildlife management practices
are implemented this remaining load reduction will not be possible
Cabin John Creek - Similar to the other two more urban watersheds in the County during the
first permit cycle (through 2015) a priority was placed on full implementation of complete high
and low priority projects Fewer opportunities exist overall compared to the Anacostia and Rock
Creek Next 25 implementation of other potential projects was targeted ESD was
emphasized on both public (10) and private property (10) Finally outreach (100) was
021611
Montgomery County Coordinated Implementation Strategy - DRAFT
targeted for pollutant load reduction but not credited towards impervious cover credit No
riparian reforestation or stream restoration was targeted due to limited or no opportunities In
future permit cycles the remainder of the other potential projects are targeted along with ESD
and some riparian reforestation for impervious cover and pollutant load reduction The
bacteria load reduction meets MS4 permit area WLA compliance by 2025
Muddy BranchWatts Branch - During the first permit cycle (through 2015) a priority was
placed on full implementation of complete high and low priority projects Fewer opportunities
exist overall compared to the Anacostia and Rock Creek Watersheds No other strategies were
pursued as there are no existing TMDLs in the Muddy BranchWatts Branch subwatersheds In
future permit cycles previously identified stream restoration projects are implemented for
pollutant load reduction
Great Seneca Creek - This watershed implementation plan is unique in that it includes the small
Clopper Lake subwatershed which has a TMDL for phosphorus Even with the TMDL there are
limited identified opportunities to pursue in the Clopper Lake subwatershed in part due to the
limited area of the subwatershed within the County MS4 permit area During the first permit
cycle (through 2015) a priority was placed on full implementation of complete high and low
priority projects within Great Seneca Creek subwatershed No opportunities exist for these
strategies in Clopper Lake However full outreach was applied in Clopper Lake in the first
permit cycle In future years other potential projects ESD on public and private property and a
small amount of riparian reforestation (in Clopper Lake) is pursued The Clopper Lake WLA for
phosphorus within the MS4 permit area is met
Patuxent - During the first permit cycle through 2015 a priority was placed on full
implementation of complete high and low priority projects Far fewer opportunities exist
overall compared to the Anacostia and Rock Creek A limited amount of ESD on private land
and stream restoration was pursued Finally outreach (100) was targeted for pollutant load
reduction (primarily nutrients) but not credited towards impervious cover credit No riparian
reforestation was targeted within the MS4 Permit area due to cost effectiveness in the Rocky
Gorge subwatershed and limited opportunities in the Triadelphia subwatershed In future
permit cycles ESD on private and public land is pursued more substantially as is stream
restoration A limited amount of riparian reforestation achieves some impervious cover and
pollutant load reduction The Rocky Gorge phosphorus WLA within the MS4 permit area is met
easily and the Tridelphia phosphorus WLA is also met but with a longer timeframe needed for
compliance
021611
Montgomery County Coordinated Implementation Strategy - DRAFT
Lower Monocacy Creek -lower Monocacy Creek is the most rural watershed in the County and
has the least amount of area subject to the County MS4 permit In addition there are no preshy
identified restoration projects within the watershed Therefore during the first permit cycle
(through 2015) only a very small amount (5) of private property ESD is pursued It is not until
the second permit cycle that more focus is placed on private and public ESD as well as stream
restoration and programmatic strategies such as street sweeping to target sediment loads
associated with the TM Dl In future permit cycles stream restoration is pursued for pollutant
load reduction The sediment WlA within the MS4 permit area is projected to be met around
2025
Countywide - The Countywide effort was driven by impervious cover treatment targets and
Chesapeake Bay TMDl2017 and 2020 reduction targets associated with sediment and nutrients
for urban MS4s For impervious cover it was assumed that a 20 target would be required for
each five-year permit cycle The Bay TMDl targets for urban MS4 areas were easily met for all
pollutants in 2017 and easily met for nitrogen and sediment but more difficult to meet for
phosphorus in 2020
Public Outreach and Stewardship
The County recognizes and is committed to the increasingly important role that public outreach
and stewardship will play if improved water quality conditions are going to be achieved
countywide While the County currently has a very active and layered outreach program the
model requires changes that will result in broader stakeholder groups serving as the leaders
and primary champions for clean water in their communities This includes greater participation
from minority and faith-based groups business consortiums schools neighborhood
associations and civic groups Additionally the new model requires revisiting current
initiatives carried out by the various County agencies to look for better and more efficient ways
to communicate messages cross-train and create synergies that result in greater engagement
greater awareness and sustained changes in behavior
Within each implementation plan specific suggestions for outreach and education
opportunities are identified In addition Appendix E of this Strategy contains practice sheets
which highlight targeted restoration activities for the County to develop and refine A total of
eight practices have been identified that can be adopted countywide or in more targeted
watershed areas where there are specific water quality issues to address Many of the
practices build upon existing County programs but require a much broader reach to new
partner groups Program start up costs are suggested and were used to for cost estimates
associated with Countywide strategy The highlighted practices include
021611
Montgomery County Coordinated Implementation Strategy - DRAFT
bull Pet Waste Pickup Education and Outreach Campaign
bull Lawn Stewardship Education and Outreach Campaign
bull Anti-littering Education and Outreach Campaign
bull Innovative Stormwater Management Awareness Campaign
bull Stream Stewards Education and Outreach Campaign
bull Riparian Reforestation Education and Outreach Campaign
bull Roof Runoff Reduction Education and Outreach Campaign
bull Parking Lot Recharge Value Education and Outreach Campaign
Start up costs by practice along with an overall five year cost estimate are provided in Table
43 Start up timeframes are assumed to be up to 18 months
Table 43 Outreach Start Up and 5-Year Cost Projections
Practice Practice Start Up Cost
Pet Waste Pickup $240500
Lawn Stewardship $301 600
Anti-Littering $175050
Stormwater Management Improvements Awareness $50450
Stream Stewards $74825
Riparian Reforestation $30575
Roof Runoff Reduction $101400
Parking Lot Recharge Value $41500
Estimated Start Up Total $744900
5-Year Outreach Budget Projection $2650000
These eight practice sheets provide specific costs and timelines for implementation They also
provide suggestions for measuring program success These practice sheets along with the
specific recommendations in the implementation plans make up the Public Outreach and
Education Campaign
Trash Reduction
Most of the implementation plans have to address trash loadings to meet requirements of the
Potomac Trash Treaty that is referenced in the County1s MS4 Permit In addition the Anacostia
Trash TMDL has recently been accepted by MDE and the EPA According to the Anacostia
021611
Montgomery County Coordinated Implementation Strategy - DRAFT
TMDl there is reasonable assurance that the goals of the Treaty and TMDl can be met with
proper watershed planning implementing pollution-reduction BMPs and using strong political
and financial mechanisms
Currently the County has a number of activities which target trash reduction They include the
following
bull Adopt-a-Road Program through DOT which focuses on public awareness and involvement in trash management There are 205 participants who adopted road segments and agreed to six major road cleanups per year
bull Storm Drain Marking through DOT bull Support for illegal dumping enforcement outreach and research and monitoring bull Partnership with DOT to conduct street sweeping covering about 2500 curb miles and
occurring once a year
bull Partnership with the Park Police to monitor illegal dumping which combined enforces 300-400 actions a year
bull Non-residential and residential recycling programs through Solid Waste Services (SWS) bull Transit stop trash management program at 600 bus stops countywide supported by DOT
Transit Services
In addition to continuing these efforts a number of trash good-housekeeping efforts have been
proposed as part of this Strategy A detailed description of the quantitative methods and
strategies applied can be found in Appendix E of the Guidance Document In general the
following six trash-reduction strategies are recommended
1 Significantly increase funding for trash reduction programs 2 Create and enhance regional partnerships and coordination among businesses
environmental groups individual citizens and government at all levels and in all jurisdictions
3 Improve peoples awareness knowledge and behavior relating to littering and illegal dumping
4 Promote the greater introduction and use of effective trash-reduction technologies and approaches
5 Improve enactment and enforcement of laws to reduce trash 6 Increase trash monitoring-related data collection generation and dissemination efforts
The Anacostia watershed implementation plan provides an outline of the actions that will be
taken through the first permit cycle to reduce trash The range of programs and practices
specially aimed at reducing trash inputs to roads and streams that will be targeted include
reduce reuse and recycle campaigns littering and illegal dumping enforcement stream
cleanups and street sweeping These measures are in addition to any trash trapped and
021611
Montgomery County Coordinated Implementation Strategy - DRAFT
removed by structural practices which are computed using the WTM The plan shows that the
trash TMDl can be met by 2025 at a cost of 732 million dollars
Adaptive Management Monitoring and Reporting
Sound implementation strategies require assessment and effective adaptation to respond to
new information changing conditions new technologies and lessons learned This will be the
basis of the plan that will be used when benchmarks are not met and the projected funding is
inadequate
Adaptive management requires monitoring of a variety of measures that can be used to
determine whether progress is being made towards meeting the Countywide water quality
objectives Ultimately it is the instream water quality and the loading limits with respect to the
TMDls that determine the success of implementation however there are many interim
measures that can also be correlated to success which are worthwhile pursuing
Surface water monitoring can be an expensive and time consuming undertaking Montgomery
County is fortunate to have an extensive Countywide stream monitoring network that can serve
as a foundation for providing spatial and temporal data to indicate stream health The Countys
MS4 Permit also outlines the required assessment of controls which includes chemical
biological and physical monitoring Specifically the permit calls for the County to continue
their watershed restoration monitoring of the lower Paint Branch subwatershed and physical
monitoring ofthe Clarksburg Special Protection area In addition to the existing monitoring
network the County will continue tracking and data reporting associated with levels of
implementation (eg acres of impervious cover treated areas of buffer planted miles of
stream restored miles of streets swept) For measuring effectiveness of outreach and
stewardship efforts other types of monitoring and reporting are planned that include before
and after attitude surveys frequency of website visits and information requests
For many restoration strategies it may be difficult to tease out their individual effectiveness in
terms of pollutant load reductions but collectively the monitoring that occurs should provide
adequate insight into the overall effectiveness of a layered implementation strategy
In addition to the monitoring and assessment the County will be reporting results on an annual
basis as part of their NPDES MS4 Permit annual report The MS4 Permit requires annual
reporting of the following
021611
Montgomery County Coordinated Implementation Strategy - DRAFT
bull The status of implementing the components of the stormwater management program
that are established as permit conditions
bull A narrative summary describing the results and analyses of data including monitoring
data that is accumulated throughout the reporting year
bull Expenditures for the reporting period and the proposed budget for the upcoming year
bull A summary describing the number and nature of enforcement actions inspections and
public education programs
bull The identification of water quality improvements and documentation of progress
toward meeting applicable WLAs developed under EPA approved TMDLs and
bull The identification of any proposed changes to the Countys program when WLAs are not
being met
The County will build upon annual reporting that has historically occurred to meet permit
requirements and will supplement this reporting with tracking table summaries that quantify
implementation activities for the range of strategies pursued during that year and the
associated treatment (eg impervious cover treated pollutant load reduced education and
outreach partners established etc) Cost will also be tracked in association with rates of
implementation This level of performance will then be compared with countywide strategy
targets (eg progress towards meeting WLAs) associated with key performance dates such as
those presented in Table 41 The level of progress achieved by the County will then feed into
the adaptive management approach described above
Organization Needs to Implement Strategy
Montgomery County DEP staff possesses substantial expertise and institutional knowledge that
yields many positive outcomes and efficient processes under the current pace of restoration
and permit compliance activities Under this strategy however the pace of implementation is
required to significantly increase Based on an increase in the level of implementation it is
reasonable to assume that additional capacity may be needed to provide sufficient oversight
and management of all the projects
Another critical element of this strategy is the recognition and commitment to pursuing
outreach initiatives that build community capacity by targeting new partner groups that
provide the necessary leadership oversight and sustained effort to change behaviors and
foster stewardship The County currently carries out many well established and managed
outreach programs but it may require additional focus across County agencies and
departments for these partnerships to become established and thrive
021611 G
Montgomery County Coordinated Implementation Strategy - DRAFT
Through the implementation process and the monitoring and reporting that is required large
amounts of data will be generated Technological advances happen so rapidly in this day and
age it will be important for the County to stay current with technology and methods so that
more efficient and cost-effective data management and reporting will be possible The County
currently relies on a detailed and sophisticated GIS to spatially locate projects and manage
tables of data related to projects The growth and development of this spatial database will be
a critical component of the reporting and tracking capability of the County These databases
generate the input data that are used to measure progress towards baseline loading targets
Regular review and upkeep of the data as well as routine summarization of progress (annually
at a minimum) will likely require additional dedication of staff This is especially the case during
periods where the implementation rate of structural practices in the ground is accelerated
021611
Montgomery County Coordinated Implementation Strategy - DRAFT
Appendix C - Restoration Potential by Watershed
021611
c-
04 03 02 01
a
_ Nitrogen Load Reduction
--shy TMDL WLA Target
_Cost
MONTGOMERY COUNTY URBAN WATERSHEDS POLLUTANTS _Bk)~Ibilats ~1~ l~ fjfsi --
Rank
1
2
3
4
5
6
7
8
9
10
11
Restoration Strategy TN reduction
Ibsyr
Pet Waste Education 15169
Retrofit of Underperforming BMPs 1769
Stream Restoration 72423
Completed Projects ~43 High Priority Projects 3260
Other Potential Projects 43276
Habitat Restoration 224
Public Property ESD Retrofits 18270
Priority Neighborhoods ESD Retrofits 9271
Private Non-residential ESD Retrofits 5594
Street Sweeping -
Incremental Cost Unit Cost
Million $ IbsMillion $ 088 17193
120 1475
9304 778
948 701
635 513
25430 170
141 158
23655 77
13278 70
8018 70
124 -
Qj c
Qj
nI CXI
o -f-
1 09 08 07 06 05
$900 $800 $700
~ $600 c $500 ~ $400 $300 0 u $200 $100
$shy
~~mf il_~IJrt~
MONTGOMERY COUNTY URBAN WATERSHEDS POLLUTANTS ItfiQ14lbilJts i~5 [i
1 $900 Qj
09 $8005 iii en 08 $700
~co 07 $600 co - til
06 $500 ~ 05- $400 ~ 04 en$300 003 u $20002
en $100I 01 o 0 $shys Q en o
s Q
Phosphorus Load Reduction
--- TMDL WLA Target
__Cost
I Rank I
1
2
3
4
5
6
7
8
9
Restoration Strategy
Pet Waste Education
Retrofit of Underperforming BMPs
Stream Restoration
Completed Projects
High Priority Projects
Habitat Restoration
Other Potential Projects
Public Property ESD Retrofits
Priority Neighborhoods ESD Retrofits
10 I Private Non-residential ESD Retrofits
11 Street Sweeping
TP reduction Incremental Cost Unit Cost
Ibsyr Million $ IbsMillion $ 1979 088 2243
247 120 206
13097 9304 141
915 948 96
451 635 71
37 141 26
6067 25430 24
2546 23655 11
1294 13278 10
781 8018 10
- 124 -
MONTGOMERY COUNTY URBAN WATERSHEDS POLLUTANTS IItQjQhabillt$middot
Cii 5 Cii 11 It CD
6 ~ r o ~ s
0 ltIIa r ltII e c ltII III
1 09 08 07 06 05 04 03 02 01
0
$900
$800 $700
v$600 r
0 $500 == $400 $300 11
0 u $200 $100
$shy
_ Sediment load Reduction
--- TMDl WlA Target
__Cost
Rank Restoration Strategy
Sediment reduction
Incremental Cost
Unit Cost
tonsyr Million $ tonsMillion $ 1 Street Sweeping 800 124 645
2 Stream Restoration 25057 9304 269
3 Retrofit of Underperforming BMPs 25 120 21
4 Completed Projects 97 948 10
5 High Priority Projects 47 635 7
6 Other Potential Projects 660 25430 3
7 I Public Property ESD Retrofits 272 23655 1
8 Priority Neighborhoods ESD Retrofits 139 13278 1
9 Private Non-residential ESD Retrofits 84 8018 1
10 Habitat Restoration 2 141 1
11 Pet Waste Education - 088 -
C-3
MONTGOMERY COUNTY URBAN WATERSHEDS POLLUTANTS
-QI5 5i ~
1 09 08 07 06 05 04 03 02 01
0
$900
$800
$700
$600 ~ 0
$500 == $400 $300 11
0 u $200
$100
$shy
--shy TMDL WLA Target
___ Cost
Rank Restoration Strategy
Enterrococci reduction
Incremental Cost
Unit Cost
Billion MPNyr Million $ Billion MPN Million $
1 Pet Waste Education 19643 088 22263
2 Retrofit of Underperforming BMPs 2781 120 2318
3 Completed Projects 10441 948 1101
4 High Priority Projects 5120 635 806
5 Other Potential Projects 69895 25430 275
6 Riparian Reforestation 310 141 219
7 Public Property ESD Retrofits 29025 23655 123
8 Priority Neighborhoods ESD Retrofits 14777 13278 111
9 Private Non-residential ESD Retrofits 8917 8018 111
10 Stream Restoration - 9304 -
11 Street Sweeping - 124 I -
~ I~~~i MONTGOMERY COUNTY URBAN WATERSHEDS POLLUTANTS 1tI2~mL ~ I~I
~$ I -~-- I
100 90 80 70 60 50 40 30 20 10
0
$900 $800 $700 $600 $500 $400 $300 $200 $100 $shy
vi c
~ 5 11 0 u
Implementation Phase
Potential Trash Incremental Unit Cost
I
Rank Restoration Strategy Reduction Cost
Ibsyear Million $ IbsMillion $ 1 Recycling Education and Investigations 51654 02 238837
2 Plastic Bag Ban and Misc Enforcement 63546 13 48882
3 Anti-litter Campaign Education 23J61 09 26930
4 Retrofit of Underperforming BMPs 1144 12 954
5 Completed Projects 6598 95 696
6 High Priority Projects 2786 64 439
7 Other Potential Projects 56341 2543 222
8 Habitat Restoration 266 14 188
9 Street Sweeping 204 12 164
10 Public Property ESD Retrofits 25348 2366 107
11 Priority lIeighborhoods ESD Retrofits 12529 1328 94
12 Private Non-residential ESD Retrofits 7547 802 94 ru Stream Restoration - 930 -14 Pet Waste Education - 09 -
C-5
MONTGOMERY COUNTY URBAN WATERSHEDS POLLUTANTS
CABIN JOHN
1 250
__CostImplementation Phase
09 08 07 06 05 04 03 02 01
0
200 ~ c
150 g E
100 - ltII 0 u
50
0
_E Coli
- - - Waste Load Allocation
Rank Restoration Strategy
E coli reduction
Incremental Cost
Unit Cost
Billion
MPNyr Million $
Billion MPN
Million $ 1 Pet Waste Education 4388 $05 9436
2 Underperforming BMP Retrofits 1892 $19 1022
3 High Priority Projects 1289 $16 800
4 Riparian Reforestation 1133 $78 146
5 Other Potential Projects 148 $17 86
6 Public Property ESD Retrofits 4AOO $860 Sl 7 Private Non-residential ESD Retrofits 1618 $392 41
8 Priority Neighborhoods ESD Retrofits 2633 $638 41
9 Completed Projects 112 $00 0
C-6
MONTGOMERY COUNTY URBAN WATERSHEDS POLLUTANTS 1Itf~~Jabitm
ROCK CREEK
1 $700 Qj5 09
o
_
$600 Qj 08
111 $500 ~ampl 07 c
t5 06 $400 ~ e 05 ~ $3005 04 - 111tl 03 $200 0 u-6 02
$100J 01 $-
Enterrococci
- - - Waste load Allocation Implementation Phase
__Cost
Rank Restoration Strategy
Enterrococci reduction
Incremental Cost
Unit Cost
Billion MPNyr Million $ Billion MPN Million $
Et Pet Waste Management 35734 118 30190
Underperforming BMP Upgrades
Other Potential Projects
28800
30239
577
1083
4995
2792
4 Completed Projects 12131 444 2734
5 High Priority Projects 14239 890 1600
6 Riparian Reforestation 18999 2384 797
7 County Property ESD Retrofits 54519 24136 226
8 Private Residential ESD Retrofits 35230 17737 199
9 Private Non-residential ESD Retrofits 32A86 16380 198
C-7
MONTGOMERY COUNTY URBAN WATERSHEDS POLLUTANTS _f~~pabitafS (fi~r ~~ l-middotshy
ROCK CREEK
100 $900 90 $800 80 $700 u70 $600 c 60 2$50050 -~$40040
lt1$300 030 $200 u
20 10 $100
0 $shy
Implementation Phase
Rank Restoration Strategy Trash Reduction
Incremental Cost
Unit Cost I
Ibsyear Million $ IbsMillion $ 1 Other Potential Projects 16038 1085 1478
2 Underperforming BMP Upgrades 6756 577 1172
3 Completed Projects 4217 444 950
4 High Priority Projects 6366 890 715
5 Riparian Reforestation 9237 2384 387
6 Public Property ESD Retrofits 24587 24136 102
7 Priority Neighborhoods ESD Retrofits 16155 17737 91
8 Private Non-residential ESD Retrofits 14793 16380 90
9 Pet Waste Education - 118 -
(-8
MONTGOMERY COUNTY RURAL WATERSHEDS POLLUTANTS
SENECA - CLOPPER LAKE -
100 Qi
90 iii 80VI to -CQ 70 0 60e 50I 0 40 u l 30
C QJ 20ex
C 10to 0
J 0
$18
$16
$14 n
$12 I
$10 sect $08 ~ $06 0
VI
U $04
$02
$shy
_TPRemoval - - - TMDL Reduction Target
Implementation Phase ___Cost
Rank Restoration Strategy TP
Reduction (Ibsyr)
Incremental Cost (Million $)
Unit Cost (IbsvrMillion $)
1 Residential Education 33 001 6246
2 Underperforming BMP Retrofits 13 004 341 3 Riparian Buffer Reforestation 19 023 99 4 Priority Neighborhood ESD Retrofits 15 051 35 5 Public Property ESD Retrofits 7 075 99
C-9
-pj[fti
MONTGOMERY COUNTY URBAN WATERSHEDS POLLUTANTS 1It[~~JIlbitIL f bull~
LOWER MONOCACY
1 09 08 07 06 05 04 03 02 01
0
Implementation Phase
25
20 ~ c
15 ~ ~
10 - 0 u
5
0
_TSS
- - - Waste load Allocation _Cost
Rank Restoration Strategy
Sediment reduction
Incremental
Cost Unit Cost
tonsyear Million $ tonMilli
1 Street Sweeping 22 $007 3121
2 Underperforming BMP Retrofits 4 $010 389
3 Stream Restoration 37 $734 51
4 Riparian Buffer Reforestation 3 $109 25
5 Other Structural BMPs and ESD Strategies 10 $851 12
6 Priority Neighborhoods ESD Retrofits 2 $160 10
7 Non-residential ESD Retrofits 1 $132 10
C-10
MONTGOMERY COUNTY RURAL WATERSHEDS POLLUTANTS 1tlj~lIbiIalSlt~~II
1 09 08 07 06 05 04 03 02 01
0
$70
$60
$50 ~ c
$40 ~ ~ $30 - UI
$20 0 v
$10
$0
_ Phosphorus Load Reduction
- - - Waste Load Allocation ___ CostImplementation Phase
Rank Restoration Strategy TP Incremental Cost
Million $ Unit Cost
Ibsyr Ibs Million $ 1 Lawn Care Education 3670 01 37394
2 Underperforming BMP Retrofits 3499 08 4338
3 Other Potential Projects 3524 33 1076
4 High Priority Projects 252 04 685
5 Riparian Reforestation 762 26 298
6 Public Property Retrofits 5854 345 169
7 Priority Neighborhoods ESD Retrofits 796 65 123
8 Private Non-residential ESD Retrofits 1941 168 116
9 Completed Projects 53 00 00
c- 11
MONTGOMERY COUNTY RURAL WATERSHEDS POLLUTANTSal12hdJilats ~I~ ~ [ -
1 10 ii 5 09 9 1 08 8 II al- 07 7 1ii o 06 6
c
~ ~ 1 o E IV
05 04 03
5 4
3
~ 11 0 u
0 11 02 2 J o 01 1
t a 0 0 11 o
t 0
_ Phosphorus Reduction
- - - Waste Load Allocation
-Cost
Rank Restoration Strategy TP Incremental Cost
Million $ Unit Cost
Ibsyr Ibs Million $ 1 Lawn Care Education 3670 01 37394
2 Underperforming BMP Retrofits 3499 08 4338
3 Other Potential Projects 3524 33 1076
4 High Priority Projects 252 04 685
5 Riparian Reforestation 762 26 298
6 Public Property Retrofits 5854 345 169
7 Priority Neighborhoods ESD Retrofits 796 65 123
8 Private Non-residential ESD Retrofits 1941 168 116
9 Completed Projects 53 00 00
C-12
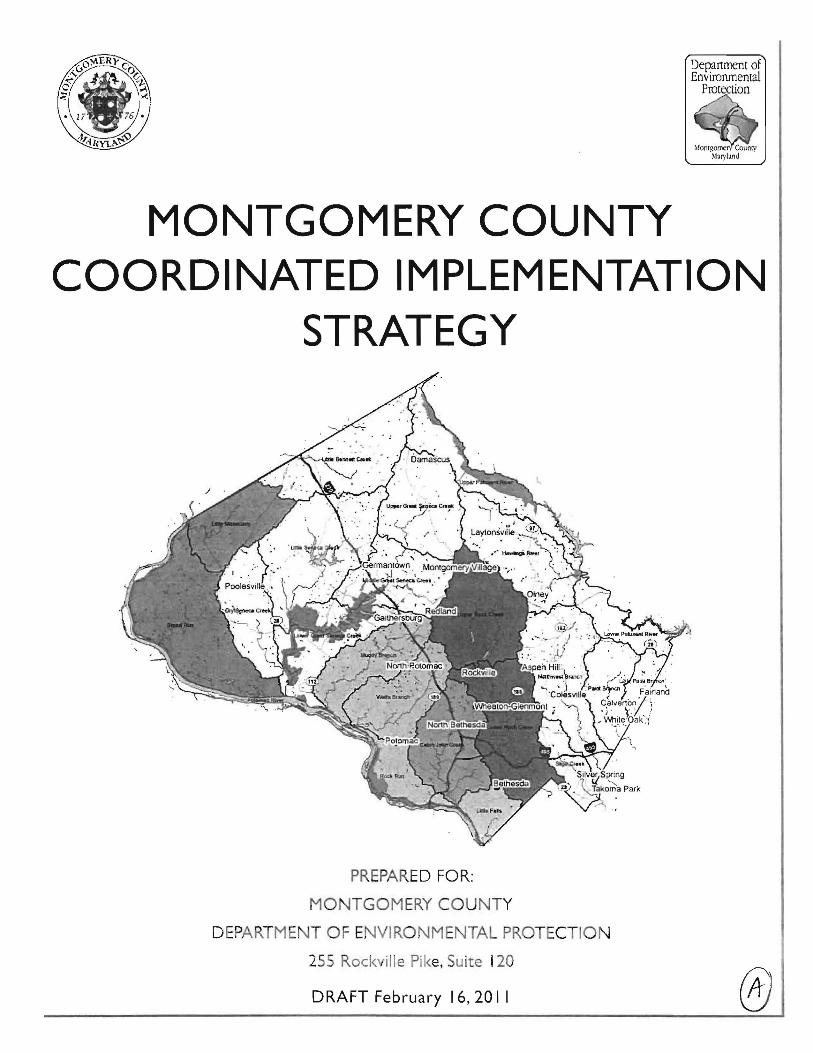
Montgomery County Coordinated Implementation Strategy - DRAFT
TABLE OF CONTENTS
TABLE OF CONTENTS i
ACRONYMS ii
1 PURPOSE 1
Project Overview 1
Chesapeake Bay Total Maximum Daily Load (TMDL) 1
Montgomery County TMDLs 2
Montgomery County MS4 Permit Background 4
Implementation Plans and Pre-assessments 4
Trash Free Potomac 6
Public Outreach and Stewardship 7
2 EXISTING CONDITIONS 8
MS4 Permit Coverage 10
Impervious Surfaces 11
Implementation Plan Guidance Document 12
Impervious Cover Accounting and Tracking 12
Pollutant Load Tracking 14
3 WATERSHED IMPLEMENTATION PLANS AND RESTORATION POTENTIAL 17
4 COORDINATED IMPLEMENTATION STRATEGy 23
Summary of Individual Implementation Plans 28
Public Outreach and Stewardship 30
Trash Reduction 31
Adaptive Management Monitoring and Reporting 33
Organization Needs to Implement Strategy 34
5 REFERENCES 36
APPENDICES 38
021611
Montgomery County Coordinated Implementation Strategy - DRAFT
ACRONYMS
BMPs - best management practices
DA - drainage area
DEP - Department of Environmental
Protection
DF - discount factor
DU - dwelling unit
EPA - Environmental Protection Agency
ESD - environmental site design
GIS - geographic information systems
HOA - homeowners association
IA - impervious area
IC - impervious cover
LDR -low density residential
LID -low impact development
MDE - Maryland Department of the
Environment
MEP - maximum extent practicable
MDP - Maryland Department of Planning
MNCPPC - Maryland National Capital Parks
and Planning Commission
MPN - most probable number
MPR - maximum practicable reductions
MS4 - municipal separate storm sewer
system
NPDES - National Pollutant Discharge
Elimination System
RR - runoff reduction
SPA - Special Protection Area
TFPI - Trash Free Potomac Watershed
Initiative
TMDLs -total maximum daily loads
TN - total nitrogen
TP - total phosphorus
TSS - total suspended sediment
USACE - Army Corps of Engineers
WLAs - waste load allocations
WQPC - water quality protection charge
WRAP - watershed restoration action plan
WTM - watershed treatment model
021611 ii
Montgomery County Coordinated Implementation Strategy - DRAFT
1 PURPOSE
Project Overview
Montgomery Countys Department of Environmental Protection (DEP) watershed restoration
programs are restoring stream valleys improving water quality and addressing historical
damage caused by urban stormwater pollution Watershed restoration is a regulatory
requirement of the Countys National Pollutant Discharge Elimination System (NPDES)
Municipal Separate Storm Sewer System (MS4) Permit
This Countywide Coordinated Implementation Strategy (the Strategy) document presents the
restoration strategies that are needed to meet the watershed-specific restoration goals and
water quality standards as specified in the current MS4 permit Specifically the Strategy will
provide the planning basis for the County to
1 Meet Total Maximum Daily Load (TMDL) Wasteload Allocations (WLAs) approved by EPA
2 Provide additional stormwater runoff management on impervious acres equal to 20 of the impervious area for which runoff is not currently managed to the maximum extent practicable (MEP)
3 Meet commitments in the Trash Free Potomac Watershed Initiative 2006 Action Agreement which include support for regional strategies and collaborations aimed at reducing trash increasing recycling and increasing education and awareness of trash issues throughout the Potomac Watershed
4 Educate and involve residents businesses and stakeholder groups in achieving measurable water quality improvements
5 Establish a reporting framework that will be used for annual reporting as required in the Countys IIPDES MS4 Permit
6 Identify necessary organizational infrastructure changes needed to implement the Strategy
Chesapeake Bay Total Maximum Daily load (TMDl)
The Chesapeake Bay Total Maximum Daily Load (TMDL) established by the US Environmental
Protection Agency (EPA) sets pollution limits for nitrogen phosphorus and sediment in the
Chesapeake Bay Watershed This TMDL required under the Clean Water Act is in response to
021611
Montgomery County Coordinated Implementation Strategy - DRAFT
the slow progress by states within the watershed to limit their pollutants to levels which meet
water quality standards in the Bay and its tidal tributaries Total limits set in the Bay TMDL for
the states of Delaware Maryland New York Pennsylvania Virginia West Virginia and the
District of Columbia are 1859 million pounds of nitrogen 125 million pounds of phosphorus
and 645 billion pounds of sediment per year - a 25 percent reduction in nitrogen 24 percent
reduction in phosphorus and 20 percent reduction in sediment (USEPA December 2010) The
TMDL also sets rigorous accountability measures for state compliance Although an
implementation plan for the bay TMDL has not been completed the goals for Urban MS4s (18
nitrogen 34 phosphorus and 37 sediment) are compared to the reductions provided by
implementation of the Strategy
Montgomery County TMDLs
The County has a number of watersheds where EPA-approved TMDLs have established
pollutant loading limits for waterbodies These loading limits represent the maximum amount
of a pollutant that the waterbody can receive and still meet water quality standards and an
allocation of that load among the various sources of that pollutant (eg point sources or
nonpoint sources) MS4 permit jurisdictions like Montgomery County are considered point
sources and are given a waste load allocation (WLA)
Pollutant loads from point and non point sources must be reduced by implementing a variety of
measures One condition of the Countys MS4 Permit is to make progress toward
implementation of TMDL load reduction allocations in the Countys watersheds In addition to
TMDLs all of the watersheds in the County also have listed impairments Table 11 below lists
TMDLs and Impairments per watershed
021611
Montgomery County Coordinated Implementation Strategy - DRAFT
Table 11 Summary of TMDLs
Watershed Grouping
Approved TMDLs (Approval Date)
Bacteria (2007) Sediment (2007) Nutrients (2008)
Trash (20lQl Bacteria (2007)
Bacteria (2007)
DraftTMDLs
PCBs (2010)
Sediment (2010)
Sediment (2010)
Impairments (First Listed)
Heptaclor Epoxide (2002) Biological (2006)
Phosphorus (1996) TSS(1996)
Biological (2002)
Biological (2006)
Seneca Creek Sediment (2010) Biological (2006) (Mainstem)
Seneca Creek (Clopper Lake)
P osphorus and Sediment
~ ~
Lower Fecal Bacteria (2009) Nutrients (2010) Phosphorus (1996) Monocacy Sediment (2009) Biological (2002)
Phosphorus (1996) TSS (1996)
Biological (2006) PCBs in Fish Tissue (2008)
Phosphorus (1996) TSS (1996)
Biological (2006) PCBs in Fish Tissue (2008)
Biological
Sources httpwwwmdestatemdusprogramsWaterTMDLCurrentStatusPagesProgramsWaterPrograms TIVI DLSu m itta Isindexas px httpwwwmdemarylandgovprogramsWaterQualityFinancingSaterQualityFinanceHomePagesW
aterhb1141map wg montgomerycoaspx
MDE 2008 Integrated Report (combined 303(d) List and 30Sb Report)
TIVIDL was approved after Task Order tt7 was issued and is therefore not included in the detailed
pollutant load modeling associated with the Strategy
Patuxent (Tridelphia)
Patuxent
~middotmiddotIlmiddot- t- I ~ t I 4
bull 1 ~ bull t - - shy -l=~ _~l i-
(Rocky Gorge)
021611
Montgomery County Coordinated Implementation Strategy - DRAFT
Montgomery County MS4 Permit Background
On February 16 2010 Maryland Department of the Environment (MOE) issued Montgomery
County a new MS4 permit This S-year permit complies with the Environmental Protection
Agencys NPDES regulations that require large urban jurisdictions to control pollution from
stormwater runoff to the maximum extent practicable The EPAs latest estimates are that 10
percent of Marylands nitrogen load comes from urban and suburban stormwater runoff
(USEPA May 2010) The County MS4 Permit requires development of implementation plans to
meet WLAs through watershed restoration and other programmatic measures
Major new provisions of the permit include
bull Requiring restoration of an additional 20 percent of impervious surfaces not currently
receiving adequate treatment
bull Developing and implementing measurable strategies to reduce trash as part of the
Countys commitment to a trash-free Potomac River
bull Reducing pollutant loadings to comply with pollution limits necessary to meet water
quality standards for impaired waters (TMDLs)
The plans and strategies outlined in this document establish the steps Montgomery County is
taking to fulfill the requirements associated with this MS4 Permit
Implementation Plans and Pre-assessments
There are two major watersheds located within Montgomery County the Potomac River
watershed which covers approximately 88 of the County and the Patuxent River watershed
which covers approximately 12 of the County In terms of the Countys MS4 Permit area the
area proportion is 96 in the Potomac and 4 in the Patuxent River watersheds The County is
further divided into eight subwatersheds based on the eight digit United States Geologic Survey
(USGS) Hydrologic Unit Code (HUC) as shown in Figure 11 Seven of the eight subwatersheds
have restoration implementation plans that have been developed for this project effort The
eighth watershed Upper Potomac Direct does not have an implementation plan because a
watershed assessment has not yet been completed for the watershed as noted below
For more information about a specific watershed and the associated plans see the DEP website
(wwwmontgomerycountymdgovstormwaterpermit) The seven watersheds that have
implementation plans are
bull Anacostia
021611
Montgomery County Coordinated Implementation Strategy - DRAFT
bull Cabin John Creek
bull Lower Monocacy
bull Lower Potomac Direct (Muddy Branch and Watts Branch)
bull Patuxent
bull Rock Creek
bull Seneca Creek (Great Seneca including Clopper Lake)
lEGeND
_ Stal N nfU 1 P r
M3or ~til~hd5
D Atgt~
o COIIlln Jchl
D La frloocKJ
o Law Pctamox Quo
Dpsa~ll l Rod ~(~
Figure 11 Map of Watersheds
The goals of the implementation plans are to
bull Identify feasible best management practices (BMPs)
bull Quantify the area they treat and the amount of pollutants they can remove from
stormwater runoff before entering into the Countys streams rivers and lakes
021611
Montgomery County Coordinated Implementation Strategy - DRAFT
bull Determine the restoration potential for each watershed or subwatershed and evaluate
the ability to meet applicable TMDLs
bull Provide a schedule and cost estimate for meeting the WLAs set by the TMDL
In addition to the seven implementation plans there are three watershed pre-assessments that
have been completed for watersheds that have not been previously assessed The preshy
assessments will be used by the County to develop watershed assessments and associated
implementation plans which will be completed this permit cycle They include
bull Seneca Creek Little Seneca and Dry Seneca
bull Lower Potomac Direct including Rock Run and Little Falls but excluding Muddy Branch
and Watts Branch
bull Upper Potomac Direct including Little Monocacy amp Broad Run
The seven implementation plans (Table 12) provided the input data for the development of
this Strategy
Table 12 Watershed Groupings and Plans
Pre-Assessment
x x
x x
lower Potomac Direct (East of Seneca Creek not described in any other grouping)
Muddy Branch and Watts Branch x All other subwatersheds x
Patuxent (TriadelphiaBrighton Dam and Rocky
Gorge)
x
Great Seneca (including Clopper Lake)
Dry Seneca and Little Seneca
lower Monocacy
Upper Potomac Direct (West of Seneca Creek not described in any other grouping)
Trash Free Potomac
The Alice Ferguson Foundation founded the Trash Free Potomac Watershed Initiative (TFPWI)
in 2005 to reduce trash and increase awareness of trash issues in the watershed TFPWI actions
021611
Montgomery County Coordinated Implementation Strategy - DRAFT
include the Potomac River Watershed Trash Treaty Annual Potomac River Watershed Trash
Summit Annual Potomac River Watershed Cleanup market-based approaches such as the
Trash Free Potomac Facility Program and a Regional Anti-Litter Campaign (Alice Ferguson
Foundation 2011) The MS4 permit requires Montgomery County to meet the commitments of
Potomac River Watershed Treaty The permit specifically requires that Montgomery County
1 Support and implement regional strategies to reduce trash
2 Develop a work plan to implement a public outreach and education campaign
3 Establish baseline conditions of trash being discharged and develop a reduction strategy
and work plan for the Montgomery County portion of the Anacostia Watershed
4 Implement approved control measures in accordance with the trash reduction work
plan
5 Conduct public participation in development of trash reduction strategy
6 Submit progress annually
Public Outreach and Stewardship
The Countys MS4 Permit requires significant opportunities for public participation in achieving
TMDls watershed restoration and trash management The permit specifically requires the
County to prepare a work plan to implement a public outreach and education campaign The
County recognizes that a successful strategy will require a significant increase in effective and
coordinated public outreach and public stewardship The implementation plans and this
Strategy describe how DEP plans to implement public outreach and education campaigns with
specific performance goals and deadlines
021611
Montgomery County Coordinated Implementation Strategy - DRAFT
2 EXISTING CONDITIONS
Watershed health is variable throughout the County and typically well correlated with intensity
and age of urbanization More specifically watershed health typically declines with increasing
density and older age of development Many of Montgomery Countys older urban and
suburban areas were developed in an era when runoff from paved surfaces (roads parking lots
driveways) was directed to storm drains which conveyed untreated runoff directly to streams
This large volume of water caused massive erosion of the stream banks and destroyed habitat
Stormwater treatment using stormwater ponds to receive detain and filter runoff before it
flowed into streams was either inadequate or non-existent The Anacostia Rock Creek and
Cabin John Creek watersheds are examples where these conditions are common Modern
stormwater techniques known as environmental site design or ESD encourage the reduction
of runoff by infiltrating the water into the ground near its source
Watershed health improves in more rural areas of the County but even in these areas stream
degradation can occur stemming from large lot development and poor agricultural
management practices
The County has conducted comprehensive water quality and biological sampling for more than
a decade which provides a representative snapshot of existing watershed health as well as the
ability to track watershed health over time Figure 21 shows countywide watershed resource
conditions based on monitoring that was conducted from 2000-2008 The area inside the
beltway in the more urban core has lower water quality (fair to poor) while the area outside the
beltway tends to have better water quality (fair to good to excellent)
021611
---- -
-----
Montgomery County Coordinated Implementation Strategy - DRAFT
Watershed Resource Conditions Montgomery County Maryland
LEGEND z fbn
G 0middot1 - -~UlIS
- tI)Jogtf~
UJJOf Wrw Ftns
Splaquo1lII PnreltbOrI NtH SPAl
3D~~ennHI
[=jji=---~~-
Figure 21 County Watershed Resource Conditions
County Statistics
The Strategy will benefit from the fact that the majority of county residents own the property
they reside on (nearly 70) and thus have control over that property Also nearly 70 of the
residences are single unit homes Moreover the average household income is roughly $90000
making the likelihood of financial capability to install BMPs an appropriate assumption Both of
these statistics make advocacy of BMPs on residential properties an imperative for the Strategy
Montgomery Countys robust business economy was also considered in the Strategy
development Despite the current economic volatility Montgomery Countys business
community is still profitable and still maintaining and improving existing facilities Moreover
the construction of the inter-county-connector (ICC) through much of Montgomery County will
provide opportunities to install demonstration BMPs on newly developing properties for
replication throughout stakeholder groups Also the presence of communication industry
leaders (ie Discovery Channel) in the County creates unique stewardship education
partnership possibilities with businesses The Strategy will include these stakeholders
021611
Montgomery County Coordinated Implementation Strategy - DRAFT
involvement opportunities to best harness the power of Montgomery Countys healthy
business economy
The county includes a fairly even split of males and females The majority of residents nearly
50 fall between the ages of 25 and 55 Only 15 of the population is aged 60 and above In
addition the majority of Montgomery County residents indicate their preferred language as
English however Spanish translations of stakeholder involvement opportunities will be
required in select watersheds to accommodate the 13 of county residents that indicate their
preferred language as Spanish Other potential target groups for translation for stakeholder
involvement include the Asian community as 11 of the countys population is Asian (mostly
Korean and Vietnamese) Because of this the Strategy and implementation plans will take
multilingual requirements into consideration for signage and other educational tools as well
MS4 Permit Coverage
The Countys most recent NPDES MS4 stormwater permit only covers runoff from
developments within the County area The following areas are excluded from the Countys MS4
permit area shown in Figure 22
bull Cities of Gaithersburg Rockville and Takoma Park
bull Maryland National Capital Park and Planning Commission (MNCPPC) lands
bull Washington Sanitary Sewer Commission (WSSC) land
bull Federal and State government owned land and facilities
bull Rural zoning
021611 G
Montgomery County Coordinated Implementation Strategy - DRAFT
MS4 Permit Area Montgomery County Maryland
(-i Gaithersbur9 ~
M Ro ckville
TkD m Parilt -Jr MNC PPC Lnds
0 5 3
Feder 1 and SI PropertyM i KbnelefS
M 0 I 2 ~- Federal and Sta1e Roads
~ i s Rural Zon ing
Figure 22 Areas outside the Montgomery County MS4 Permit Area
Impervious Surfaces
As previously mentioned the Countys MS4 Permit requires treatment of an additional 20 of
impervious cover not currently receiving treatment to the MEP Table 21 presents a summary
of the countywide impervious cover totals along with breakdowns by major land cover type
These land covers will be the focus of much of the Countys targeted effort to treat the 20
target
021611
Montgomery County Coordinated Implementation Strategy - DRAFT
Table 2llmpervious Surface Summary
Description
Total County Area 324552 100
Total Area of 1m ervious Surface 35965 _ _-----shy 11
County Area Subject to Stormwater Permit (1) 138649 43
Imllervious Cover Subject to Stormwater Permit 2) ~==5119====18o2 == ==== Areas of Impervious Surface (3)
Road 13607 38
Building 13073 36
Parking 22
Sidewalk 1069 3
Recreation (4) 347 1 1 Exclusions include Certain zoning codes parklands forests municipalities with own stormwater management
programs state and federal properties and state and federal maintained roads 2 Percent of County Jurisdictional Area subject to the Stormwater Permit 3 Impervious area within each category within the total County area 4 Recreation imperviousness excludes swimming pools
Implementation Plan Guidance Document
The Implementation Plan Guidance Document (revised October 252010) provides a road map
for how the implementation plans were created The primary sections of the Guidance
Document and a short description of each are provided in Appendix A
The Guidance Document divides BMPs into five classes or codes shown below The Guidance
Document also provides a list of BMPs and which code they fall under which is provided in
Appendix B
Code 0 Pretreatment Practices
Code 1 Non-performing BMPs No runoff reduction and no long term pollutant removal
Code 2 Under-performing BMPs Limited runoff reduction and low pollutant removal
Code 3 Effective BMPs No runoff reduction but moderate to high pollutant removal
Code 4 ESO BMPs High runoff reduction and moderate to high pollutant removal
Impervious Cover Accounting and Tracking
Montgomery County has GIS data layers that contain all the stormwater BMPs in the County
and their drainage areas In order to determine the 20 target for impervious cover treatment
021611
Montgomery County Coordinated Implementation Strategy - DRAFT
to the MEP the County analyzed their existing impervious cover and their existing BMP
database to determine how much impervious cover is currently being treated to the MEP
Several methods were considered based on a determination of the MEP standard compared to
existing treatment methods According to MDE guidance to be considered MEP a BMP must
capture at least the Water Quality Volume (WQv) (the first inch of rainfall) or the CPv volume
(26 inches of rainfall) The final method used for determining which BMPs are MEP and the
amount of impervious surface not treated to the MEP was as follows
1 All BMPs that were installed after 2002 or are classified as Code 4 were considered MEP
2 An analysis of typical Code 3 stormwater ponds installed after 1986 was performed to
determine if this class of BMPs met the definition of IVIEP Based on that analysis Code
3 BMPs constructed after 1986 are considered MEP
3 All other classes of BMPs not specified above are not considered MEP and are eligible
for retrofit
Table 22 below shows the breakdown of the impervious acres treated by BMP codes and era
(shaded areas are BMP codes treated to the MEP)
Table 22 Acres of Impervious Cover Treated by BMP Code and Design Era
Design Era Post2002 1986-2002 Pre1986 Blank Total
CIJ tl 0 u Q
~ co
0 28 711 24 132 895
1 33 555 1391 367 2346
2 41 299 12 23 375
3 75 2482 1437 267 4261
4 20 459 482 40 1001
Totals 198 4506 3345 828 8877
IC Credit 100 Code 3amp 4 Code 4 Total Acres treated to
MEP 198 2942 482 40 3661
Assuming a total countywide impervious acreage of 25119 acres and an impervious acreage
treated to the MEP of 3661 as shown in Table 22 there are currently 21458 acres of
untreated impervious area Twenty percent of 21458 equates to 4292 acres of impervious
area that must be restored over the current permit cycle
021611
Montgomery County Coordinated Implementation Strategy - DRAFT
Pollutant Load Tracking
In addition to tracking impervious cover it is necessary to compute existing pollutant loads and
projected reductions in loads as a result of applying storm water controls and BMPs The Center
for Watershed Protections (CWP) Watershed Treatment Model (WTM) version 20 (CWP 2001)
was the tool selected to conduct this analysis and track load reductions across a range of
implementation strategies
The WTM uses a spreadsheet model to calculate annual pollutant loads and runoff volumes
The model also accounts for the benefits contributed by a full suite of stormwater treatment
practices and programs The first step in the model calculates existing pollutant loads by adding
primary and secondary source loads then subtracting reductions according to existing
management practices The second step applies future management practices by subtracting
these calculated reductions from the existing loads Appendix B of the Guidance Document
provides a detailed explanation of the assumptions and steps in the modeling process
For each watershed the WTM was run under existing conditions with existing BMPs to
determine a baseline pollutant load for targeted pollutants The baseline period for non-TMDL
parameters was based on 2002 Maryland Department of Planning land useland cover data
coupled with the Countys existing urban BMP database Pollutants targeted included bacteria
Total Phosphorus (TP) Total Nitrogen (TN) Total Suspended Solids (TSS) and Trash Next a
series of model runs was developed for analyzing the pollutant load reduction effect that
various restoration strategies would have based on assumed levels of implementation for the
various strategies Individual restoration strategies that were sequentially modeled included
the following
bull Completed and High Priority Projects - these include projects already completed or high
priority structural BMPs scheduled for retrofit in the FYll-FY16 Capital Improvements
Program (CIP)
bull Low Priority Projects - these includes FY11-FY16 CIP projects that for various reasons
are considered a lower priority
bull Other Potential Projects - these include other projects in existing inventories that were
not listed in the previous two categories For the Anacostia they include projects in
Anacostia Restoration Plan (ARP) prepared by the Army Corp of Engineers
bull Public ESD Retrofits - These include small scale ESD practices applied to County-owned
buildings streets and parking lots and rights of way Examples include rainwater
harvesting green roofs upland reforestation soil compost amendments rooftop
disconnection green street retrofits and converting drainage ditches to dry swales
021611
Montgomery County Coordinated Implementation Strategy - DRAFT
These are Code 4 structures This category also includes other structural BMP upgrades
to existing County BMPs which were designated as under-performing or nonshy
performing
bull Private ESD Retrofits - These projects include ESD on commercial property and
residential property and include green roofs rain gardens and permeable pavement
bull Riparian Reforestation - Focuses primarily on tree planting for riparian buffer
restoration
bull Stream Restoration - Includes the use of natural materials such as rocks logs and native
vegetation to reduce pressure on eroded banks prevent down-cutting of the
streambed and restore the natural meander patterns and slope profiles found in stable
reference streams
bull Programmatic Practices - This category deals with potential pollutant reduction that can
be attributed and quantified through MS4 stormwater pollution prevention
improvements and better housekeeping on County land and facilities Also includes any
pollutant reductions due to product substitution (eg nitrogen and phosphorus limits in
fertilizer) operational programs (eg recycling) and enforcement This category also
deals with reduced pollutants that can be attributed and quantified through MS4
stormwater education (eg lawn care) and outreach aimed at pollution prevention
better housekeeping and increased stewardship
The naming convention applied for the model runs was WTM 10 (ie baseline) WTM 20 (Le
completed and high priority low priority and other potential projects) WTM 30 (Le public
and private ESD) WTM 40 (ie riparian reforestation and stream restoration) and WTM 50
(ie programmatic) Model runs were developed sequentially to yield incremental increases in
load reduction by strategy In practice however strategies can be applied in combination and
out of sequence to achieve targeted outcomes and the most cost-effective solutions A
summary of the scenarios is provided in Table 23 below
021611
Montgomery County Coordinated Implementation Strategy - DRAFT
Table 23 Summary of Watershed Treatment Model (WTM) Scenarios
Implementation Phase Description
The WTM was run under existing conditions approach
WTM Baseline Conditions with the MDP year 2002 land useland cover data and
existing BMPs
WTM 20 Completed as of
2009j High Priorityj Low
Priority and Other Potential
Projects
The WTM was run with a series of future management
practices which were proposed projects from the
County inventory of restoration sites These practices
cover new ponds retrofits of existing BMPs and some
ESD practices from the proposed projects list
The Countys inventory for other project types that
include public properties eg libraries and parkingWTM 30 ESD Strategies and
lots public schools and open section roads available Other Structural BMPs
for ESD retrofits was reviewed as were areas for
private property ESD retrofits
This category includes any pollutant reduction or volume
reduction that can be attributed to specific stream
WTM 40 Habitat rehabilitation wetland restoration and or riparian
Restoration reforestation projects planned for construction in the
watershed for the permit cycle
WTM 50 MS4 Programmatic See description above
Practices
TMDL Calibration and Tracking
Where TMDLs existed for individual watersheds the WTM was run under existing conditions
with existing BMPs based on the year in which the data was collected for TMDL development
The baseline pollutant load was then compared and normalized to the MDE-determined
baseline MS4 load for the TMDL pollutant Any BMPs with approved dates after the year in
which the data was collected for TMDL development were not included in the baseline
calculation but rather were counted towards meeting the TMDL reduction target
Once the normalized model was established reductions achieved through programs and
practices were tracked using the WTM scenarios based on the percent load reduction from
baseline toward meeting the TMDL required WLA The normalized baseline and WLA target are
determined and specified in the relevant TMDL documents developed by M DE
021611
Montgomery County Coordinated Implementation Strategy - DRAFT
3 WATERSHED IMPLEMENTATION PLANS AND RESTORATION POTENTIAL
The watershed implementation plans and pre-assessments developed in conjunction with the
Strategy are driven by regulatory requirements facing each watershed Table 31 summarizes
the drivers by watershed
Table 31 Restoration Objectives -
W~tershedSubwater~hed - Trash
4 bull - I _ _ -
Patuxent
Anacostia
Rock Creek
Great Seneca
Cabin John Creek
lower Monocacy
Watts BranchMuddy Branch
Dry and little Seneca
lower Potomac Direct
Table 32 presents the more detailed and quantitative aspects of the TMDl requirements for
the MS4 portion within each watershed The Strategy has been developed to meet the MS4
permit area WLA compliance targets presented in Tables 32
In addition to the individual watershed requirements there is a Countywide requirement to
comply with the wasteload allocations associated with urban areas under the Chesapeake Bay
TMDl which applies to nutrients and sediment There is an interim target established for 2017
where reductions from baseline conditions of 9 12 and 20 respectively for TN TP and
TSS are to occur Then by 2020 full compliance is required which correspond to reductions
from baseline conditions of 18 34 and 37 respectively for TN TP and TSS
021611
Montgomery County Coordinated Implementation Strategy - DRAFT
Table 32 TMDl Summary by Impairment
Watershed
Cabin John Creek
Rock 2007 Enterococci 970 453669 18195 Creek
Anacostia 2007 Enterococci 860 247809 29978 River
Aoacostia 2008 TN 788 206312 38959 River
Anacostia 2008 TP 797 20953 3947 Ibsyr River
Triadelphia 2008 TP 580 438 Reservoir
Rocky Gorge 2008 TP 480 4268 3628 Reservoir
Clopper Lake 2002 TP 393
Anacostia 2007 TSS 850 7682 River
Triadelphia 2008 TSS Reservoir Clopper 2002 TSS 00 13 13
Lake
Lower 2009 TSS 380010 172 Monocacy
River
Anacostia 2010 Trash 1000 228683 Ibsyr River
Adapted from 2010 Status of Approved Stormwater Waste load Allocations for NPDES Regulated Stormwater Entities in Montgomery County April 27 2010 by Jeff White MDE
Potential to Reduce Stormwater Pollutant loads
Within each of the implementation plans an analysis was developed that explored the
restoration potential for that watershed Cost was not a limiting factor for the analysis but
rather assumptions were made based on feasibility of implementation rates and consideration
of conflicts with typical site conditions with respect to site use utilities land ownership etc
For example it was assumed that 40 of large County-owned parking lots would be available
for stormwater retrofitting These assumptions are necessary for planning purposes where
detailed site investigations have not occurred However some level of implementation is
021611
Montgomery County Coordinated Implementation Strategy - DRAFT
reasonable to assume In addition all identified high priority and low priority County projects
that have the potential to be constructed were assumed to be implemented
Implementation cost and effectiveness (in terms of pollutant load reduced) was also tracked
through the process of determining watershed restoration potential which enables the
costbenefit evaluation of various strategies for a target parameter (eg tons of sediment per
dollar spent or billion MPN of bacteria per dollar etc) For example by tracking cost and
effectiveness it is possible to evaluate the relative costbenefit of a strategy like ESD versus a
non-structural programmatic practice Moreover the comparison of these two strategies is
going to be different depending on what parameter is being considered eg ESD may be more
cost effective for nutrient reduction but less cost effective for bacterial load reduction
The tables in Appendix C help to illustrate this point Specifically a series of summary charts
and tables have been developed that illustrate the cost effectiveness of the range of strategies
considered by watershed with respect to pollutant load reduction The summaries reflect the
full restoration potential developed for each watershed
It is also useful to compare strategy effectiveness and range of opportunity across watersheds
To facilitate this a series of tables were compiled that groups all watersheds together and
considers watershed restoration potential by strategy These summary tables are presented in
Tables 33 through 310
For this analysis stream restoration was treated as a special modeling case (Table 39) because
it was not tracked as a strategy that receives credit for impervious cover treatment and because
it requires a different pollutant load reduction tracking method based on linear feet of
implementation and the existing stream resource condition (good fair or poor IBI scores
received different pollutant removal credit) Further details on stream restoration modeling
are presented in the individual implementation plans and the Guidance Document
Not all WTM scenarios were modeled for all watersheds For example if there were no
previously identified completed high priority low priority or other potential projects within a
watershed they would appear as zeros for that individual watershed in Tables 33 through 36
Also for non-TMDl watersheds such as Great Seneca and Muddy Branch and Watts Branch
subwatersheds the public and private property ESD riparian reforestation and MS4
programmatic practices scenarios were not modeled due to the lack of regulatory drivers that
define pollutant removal targets
021611
Montgomery County Coordinated Implementation Strategy - DRAFT
Table 33 Cost and benefit summary for completed projects (WTM 20)
Watershed Total ESD PrOjects Incremental reduction from baseline ()
i Cost Numberof Impervious
Cost
I Impervious Trash control added TN TP TSS Bacteria
(million $) projects bullbull (ac)
(total) (total)
Anacostia 95 25 167 7 3 4 4 1 4 4
Cabin John 00 0 0 0 0 02 02 03 03 1
Rock Creek 44 6 212 13 1 2 2 3 3 2 i
I Triadelphia 00 0 0 0 0 0 0 0 0 0
Rocky Gorge 00 0 0 0 0 0 01 0 0 0
Lower Monocacy 00 0 0 0 0 0 0 0 0 0
Clopper lake 00 0 0 0 0 0 0 0 0 0
Great Seneca bull 06 2 11 0 0 1 1 I 1 0 2
MuddyWatts 00 0 0 0 0 0 0 0 0 0
Indudes Clopper lake Project count does not include stream restoration Pollutants with a TMDL are highlighted
Table 34 Cost and benefit summary for high priority projects (WTM 20)
Watershed I
I
Total ESD Projects Incremental reduction from baseline ()
Cost
(million $)
i Numberof
projects bullbull
Impervious
control added
(ac)
ICost (total)
Impervious
(total) TN
I TP TSS I TrashBacteria
Anacostia 64 33 148 65 16 2 2 06 2 2
Cabin John 16 6 88 19 2 3 3 3 3 1
Rock Creek 89 14 373 13 1 2 3 3 3 4
Triadelphia 00 0 0 04 0 0 0 0 0 0
I Rocky Gorge 04 2 5 77 27 06 06 07 06 1
Lower Monocacy 00 0 0 0 0 0 0 0 0 0
Clopper lake 00 0 0 0 010 0 0 0 0 0 Great Seneca bull 183 24 789 6 08 19 19 20 0 24
MuddyWatts 44 16 211 8 1 6 6 6 0 6
Indudes Clopper lake bullbull Project count does not indude stream restoration Pollutants with a TMDL are highlighted
Table 35 Cost and benefit summary for low priority projects (WTM 20)
I Watershed Total ESO Projects Incremental reduction from baseline ()
Numberof Impervious ICost 1m ~ i Cost Impervious
I (million $) projects bullbull
control added (total) (total)
TN TP Bacteria Trash
(ac)
I Anacostia 51 16 188 61 8 2 2 07 2 3
Cabin John 16 8 10 98 78 02 02 02 02 03
I Rock Creek 88 24 657 7 1 4 4 6 5 7
Triadelphia 040 1 20 100 100 05 05 06 05 1
Rocky Gorge 09 2 458 100 100 84 82 83 82 116 i
I Lower Monocacy 0 0 0 0 0 0 0 0 0 0 I Clopper lake 0 0 0 0 0 0 0 0 0 0
I Great Seneca bull 66 16 87 41 15 4 4 4 010 4
I MuddyWatts 20 6 26 84 33 0 0 1 0 0
Includes Clopper Lake Project count does not include stream restoration Pollutants wth a TMDL are highlighted
021611
Montgomery County Coordinated Implementation Strategy - DRAFT
Table 36 Cost and benefit summary for other potential projects (WTM 20)
I Watershed Total ESO Projects Incremental reduction from baseline ()
ICost Impervious I Cost
I I Trash INumber of
control added Impervious
TN TP TSS Bacteria (million $) projects bullbull
(ac) (total) (total)
i i
Anacostia 2492 497 2222 73 62 23 8 26 301
Cabin John 00840 1 5 0 010 01 01 01 01 01
Rock Creek 20 4 201 0 0 12 12 19 15 21
Triadelphia 00 0 0 010 0 00 00 00 00 00
Rocky Gorge 20 2 0 010 0 00 00 00 00 00
lower Monocacy 00 0 0 0( 0 00 00 00 00 0010
Clopper Lake 00 0 0 0 0 00 00 00 00 0010
Great Seneca bull 02 S S3 0 0 23 23 27 00 27
MuddyWatts 00 0 0 0 0( 00 00 00 00 0010
bull Includes Clopper Lake bullbull Project count does not include stream restoration Pollutants with a TMDL are highlighted
Table 37 Cost and benefit summary for ESO projects (WTM 30)
Watershed
I
Cost (million $) Impervious
control added
(ac)
Incremental reduction from baseline ()
ESDfor i ESO for private
public
property property
TN TP TSS Bacteria Trash
Anacostia 2378 21296 1813 20 21 7 22 27
Cabin John 878 10307 876 22 23 25 24 28
Rock Creek 2471 341 2427 30 30 33 32 35
Triadelphia 41 47 36 10 1010 11 11 20
Rocky Gorge 312 19 28S 26 27 32 30 46
lower Monocacy 86 29 53 14 15 15 15 010
Clopper lake 08 051 21 14 14 15 0 14
Great Seneca bull 00 0 0 010 0 0( 0( 010
MuddyWatts 00 a 0 0 01 010 0 0
bull Includes Clopper lake Pollutants with a TMDL are highlighted
Table 3B Cost and benefit summary for riparian reforestation (WTM 40)
IWatershed Cost (million $) Impervious
Incremental reduction from baseline ()
control added Habitat restoration (ac) TN TP TSS Bacteria Trash
Anacostia 1 6 0 0 0 01 02
Cabin John 777 39 1 2 lili
3
Rock Creek 24 119 2 2 2 5
Triadelphia 010 1 01 02 01 04 03
Rocky Gorge 25 12 1 2 2 3 8
lower Monocacy 11 S 3 3 3 4 0
Clopper Lake 023 2 4 4 2 010 4
Great Seneca bull 0 a 010 010 0 010 0
MuddyWatts 0 0 010 0 0 0 0
bull Includes Clopper lake Pallutonts with a TMDL are highlighted
021611
Montgomery County Coordinated Implementation Strategy - DRAFT
Table 57 Cost and benefit summary for stream restoration (WTM 40)
Watershed Stream Restoration Incremental reduction from baseline ()
Number of Impervious control
Cost (million $) added(ac) TN TP TSS Bacteria Trash projects
Anacostia 937 200 0 42 56 326 0 0
Cabinlohn 162 15 0 17 9 80 0 0
Rock Creek 201 30 a 9 710 100 0 0
Triadelphia 00 0 0 0 0 0 010 0
Rocky Gorge 191 18 I 0 10 7 36 0 O lower Monocacy 73 nla 0 7 10 32 010 0
Clopper Lake 00 a 0 0 0 0 0 0
Great Seneca It I 259 33 0 19 8 16 0 0
MuddyWatts 242 45 0 16 7 13 0 0
Includes Clopper Lake Pollutants with a TMDL are highlighted
Table 58 Cost and benefit summary for M54programmatlc practices (WTM 50)
Watershed Cost (million $) Incremental reduction from baseline ()
Programmatic
practices - M54
Impervious control
added (ac) TN TP TSS Bacteria Trash
Anacostia 36 0 9 9 10 8 82
Cabin John 047 0 15 14 0 10 0
Rockereek 12 0 11 11 0 7 0
Triadelphia 00056 a 23 3 0 0 0
Rocky Gorge 009 0 38 8 03 5 2
lower Monocacy 007 0 0 0 19 0 0
Clopper Lake 0Q1 0 61 30
~=r 0
Great Seneca 10 0 0 0 0 0Y0 0 0
MuddyWatts 0 0 0 0 0 0 0
bull Includes Clopper Lake Pollutants with a TMDL are highlighted
021611
Montgomery County Coordinated Implementation Strategy - DRAFT
4 COORDINATED IMPLEMENTATION STRATEGY
The Strategy has multiple objectives to accomplish whereby a challenging balance between
strategies and timeframe is required There isnt necessarily a correct answer in the process
but rather an optimized result that addresses an agreed upon suite of priorities The Strategy
presented here was primarily driven by known and established regulatory timeframes and
compliance endpoints Meeting these endpoints using the more cost effective approaches was
also given priority After this consideration was given to other known and important
approaches that stakeholders and the County have an interest in pursuing Specifically the
following compliance dates and objectives were conSidered in developing the Strategy over the
long-term (Table 41)
Table 41 Compliance Targets for Countywide Coordinated Implementation Strategy
Target Date
2015
2017
2020
Compliance Target
Meeting 20 impervious cover treatment requirement
within the MS4 Permit cycle
Meet the interim dates and targets for the Chesapeake
Bay TMDL which include specific regulated urban area
reductions by 2017 for nutrients and sediment (based
on Maryland Department of the Environments
Watershed Implementation Plan)
Meet the full compliance and targets for the
Chesapeake BayTIVIDL which include specific regulated
urban area reduction by 2020 for nutrients and
sediment (based on Maryland Department of the
Environments Watershed Implementation Plan)
Metric
~4300 acres of
Impervious Cover
9 12 and 20
respectively for TN TP
and TSS reductions
from baseline
conditions
18 34 and 37
respectively for TN TP
and TSS reductions
from baseline
conditions
2025
2030
Meet additional impervious cover treatment targets
associated with next MS4 Permit cycle (assumes
another 20 target)
Meet additional impervious cover treatment targets
associated with next MS4 Permit cycle (assumes
another 20 target)
Out year compliance with other watershed TMDLs
~3400 acres of
Impervious Cover (20
of impervious
remaining after 2015)
~2750 acres of
Impervious Cover (20
of impervious
remaining after 2020)
100 compliance with
MS4 Permit Area WLAs
021611
Montgomery County Coordinated Implementation Strategy - DRAFT
To meet the compliance targets outlined in Table 41 the following priorities were generally
followed
bull 100 implementation of completed high and low priority County projects in first five
years (by 2015)
bull Greater ESD focus in urban (as opposed to suburban and rural) watersheds initially Goal
for ESD in these watersheds on pUblic property in first five years is 10 and on private
property is 10 The level of implementation was largely driven by the 20 Countywide
impervious goal
bull 100 of Public Outreach Potential for all TIVIDl watersheds in first five years This was
pursued to address trash nutrient and bacteria loading which rely strongly on effective
outreach programs to modify behaviors
bull Generally limited strategies to the top four most cost effective per watershed
bull Habitat restoration (stream restoration and buffer reforestation) not pursued as priority
until after first five year period These programs emphasize greater pollutant reduction
efficiency rather than impervious cover treatment which is the primary focus for the
first permit cycle
The Strategy was informed by the individual watershed implementation plans for seven
watersheds which included the Clopper lake and Patuxent subwatersheds Therefore in order
to develop countywide estimates for pollutant load reduction (as is required by the Chesapeake
Bay TMDl) watershed area weighting was applied The process for developing the Countywide
strategy and individual watershed implementation plans was woven together Once the
restoration potential was determined from the individual plans the strategy and schedule was
compiled using the restoration potentials and the drivers listed above The final restoration
cost and schedule was then placed in the implementation plans
It is also worth noting that the high and low priority projects along with the other potential
projects strategies represent a static or fixed number of projects that have been identified by
the County For this analysiS this list of practices is not replenished and therefore once all
opportunities have been implemented other strategies are pursued In reality the County will
continue to develop and update its list of specific project opportunities and have these
available for implementation in future years
The output from this effort is presented in a series of tables ordered by target date in Appendix
D In addition Table 42 provides an overall summary of pollutant load reduction tracking
versus time Through inspection of Table 42 it can be seen that the Strategy meets the
021611
Montgomery County Coordinated Implementation Strategy - DRAFT
impervious cover treatment targets under the current MS4 permit (as well as projected targets
for 2020 and 2025 assuming a continued 20 treatment requirement) interim and final
Chesapeake Bay nutrient and sediment reduction targets by 2017 and 2020 respectively and
out year MS4 permit area WLA compliance for the majority of pollutants Exceptions include
meeting the bacteria WLA load reductions required for the Anacostia and Rock Creek
021611
Montgomery County Coordinated Implementation Strategy - DRAFT
Table 42 Projection by Phase for Watersheds and Pollutants PermitTMDL Targets
Watershed Fiscal Year 2015 2017 2020 2025 2030 2017 2020
Impervious Treated (acres) 1421 2393 3364 4272 4544
ESD ( Impervious) 26 44 61 69A 71
Cost (Million $) 160 307 486 732 820
E5D( Cost) 45 62 71 78 78
Anacostia Nitrogen 25 39 68 89A l00A 818 82
Phosphorus 27 42 77 100 100 812 81
i Sediment 47 72 100 l00A) l00A 875 88
Bacteria 21 33 46 59A 64 879 88
Trash 41 65 89 l00A) 100
Impervious Treated (acres) 1541 1961 2381 3625 3989
ESD ( Impervious) 17 28 36 57A 61
Cost (Million $) 87 172 262 566 658
ESD ( Cost) 7(JA 79 79A 89A 9(JA
Rock Creek Nitrogen 24 30 38 55 61
Phosphorus 25 3(JA 38 54 GfJA)
Sediment 38 50 92 l00A 100
Bacteria 21 27 33 5(JA 55 96(JA 96
Trash 17 24 31 5(JA) 55
Impervious Treated (acres) 187 380 570 1018 1018
ESD ( Impervious) 52 72 78 87A 87A
Cost (Million $) 23 65 114 215 219
ESD ( Cost) 92 91 86 90 88
Cabin John Nitrogen 21 27A 39A 55 58 Phosphorus 2(JA 26 35 49 51
Sediment 6 17 GfJA 91 100
Bacteria 16 22 27 4(JA) 40 31 31
Trash 6 12 19 34 34
Impervious Treated (acres) 237 237 237 237 237
ESD ( Impervious) 4 4 4 4 4
Cost (Million $) 6 8 19 25 31
ESD ( Cost) 32 27A 11 8 7
Muddy Watts Nitrogen 6 7 15 18 22
Phosphorus 6 7 10 12 13 Sediment 7 8 14 17 2(JA
Bacteria 0 (JA 0 (JA 0 i Trash 6 6 6 6 6
bull Impervious Treated (acres) 901 921 941 941 941 ESD ( Impervious) 2 2 2 2 2
Cost (Million $) 26 48 SO 51 52 ESD ( Cost) 15 8 8 8 8
Great Seneca Nitrogen 24 41 43 44 45
Phosphorus 24 32 34 34 34
i Sediment 26 41 43 44 44
I Bacteria (JA) 0 0 0 (JA
Trash 31 32 33 33 33
021611
Montgomery County Coordinated Implementation Strategy - DRAFT
Pe rmitTMDL Targets
Watershed Fiscal Year 2015 2017 2020 2025 2030 2017 2020
Clopper
Impervious Treated (acres) 0 6 12 22 22
ESD ( Impervious) 0 86 86 92 92
Cost (Million $) 0 0 1 2 2
ESD ( Cost) 0 72 73 84 84
Nitrogen 61 67 72 79 79
Phosphorus 30 36 41 48 48 45 45
Sediment 0 5 10 17 17
Bacteria 0 0 0 0 0
Trash 0 6 11 18 18
Lower Monocacy
Impervious Treated (acres) 1 16 32 58 58
ESD ( Impervious) 100 85 84 91 91
Cost (Million $) 0 4 11 18 20
ESD ( Cost) 100 85 54 63 58
Nitrogen 0 5 14 22 24
Phosphorus 0 5 16 26 28
Sediment 0 5 46 61 69 608 61
Bacteria 0 6 12 19 19
Trash 0 0 0 0 0
Rocky Gorge
Impervious Treated (acres) 11 88 165 307 307
ESD ( Impervious) 64 89 90 95 95
Cost (Million $) 3 17 40 70 75
ESD ( Cost) 55 82 64 73 68
Nitrogen 47 55 6710 82 85
Phosphorus 17 25 36 52 53 15 15
Sediment 10 19 45 7(J1o 79
Bacteria 14 23 32 47 47
Trash 15 30 46 68 68
Triadelphia
Impervious Treated (acres) 3 12 20 38 38
ESD ( Impervious) 100 98 97 99 99
Cost (Million $) 1 3 5 9 9
ESD ( Cost) 99 98 98 99 99
Nitrogen 24 27 29 34 34
Phosphorus 4 7 9 14 14 15 15
Sediment 1 4 6 12 12
Bacteria 1 4 6 12 12
Trash 2 6 11 21 21
Countywide
Impervious Treated (acres) 4302 6014 7722 10518 11154 6008 7723
ESD ( Impervious) 18 34 47 6(J1o 63
Cost (Million $) 305 622 987 1687 1884
ESD ( Cost) 53 66 7(J1o 8(J1o 80
Nitrogen 18 25 36 46 51 9 2(J1o
Phosphorus 17 23 34 44 46 12 34
Sediment 23 34 54 6(J1o 62 20 37
Bacteria 11 15 20 28 30
Trash 18 26 33 41 42
Assumptio~s
1 Does no~ includerepeated Outreach and Education costs beyond FY2015
2 Does not include ~n inflation multiplier
021611
Montgomery County Coordinated Implementation Strategy - DRAFT
Summary of Individual Implementation Plans
A summary of the general considerations and prioritization for each watershed implementation
plan is provided below
Anacostia - For the first permit cycle (through 2015) a priority was placed on full
implementation of completed high and low priority projects Next implementation of a third
of the other potential projects was targeted as a large number of these were identified in
conjunction with the USACEs Anacostia Watershed Restoration Plan efforts ESD was
emphasized on both public (10) and private property (10) Finally outreach (25) and
stream restoration (12) are targeted for pollutant load reduction but are not credited towards
impervious cover credit In future permit cycles the remainder of the other potential projects
are targeted along with ESD and a limited amount of riparian reforestation for impervious cover
and pollutant load reduction Outreach and stream restoration are significant strategies
pursued for load reduction benefits Nutrient and sediment MS4 permit area WLAs are met by
2030 but bacteria load reduction does not meet MS4 permit area WLA compliance The
remaining bacteria reduction is believed to be associated with urban wildlife sources Unless
intense urban wildlife management practices are implemented this remaining load reduction
will not be possible
Rock Creek- For the first permit cycle (through 2015) a priority was placed on full
implementation of complete high and low priority projects Next 25 implementation of
other potential projects was targeted ESD was emphasized on both public (10) and private
property (10) with private property implementation being linked to Rainscapes Program
success Finally outreach (100) and stream restoration (22) are targeted for pollutant load
reduction but are not credited towards impervious cover credit In future permit cycles the
remainder of the other potential projects are targeted along with ESD and riparian
reforestation for impervious cover and pollutant load reduction Stream restoration is a
significant strategy pursued for load reduction benefits The bacterial load reduction does not
meet MS4 permit area WLA compliance However the remaining bacterial load is believed to
be associated with urban wildlife sources Unless intense urban wildlife management practices
are implemented this remaining load reduction will not be possible
Cabin John Creek - Similar to the other two more urban watersheds in the County during the
first permit cycle (through 2015) a priority was placed on full implementation of complete high
and low priority projects Fewer opportunities exist overall compared to the Anacostia and Rock
Creek Next 25 implementation of other potential projects was targeted ESD was
emphasized on both public (10) and private property (10) Finally outreach (100) was
021611
Montgomery County Coordinated Implementation Strategy - DRAFT
targeted for pollutant load reduction but not credited towards impervious cover credit No
riparian reforestation or stream restoration was targeted due to limited or no opportunities In
future permit cycles the remainder of the other potential projects are targeted along with ESD
and some riparian reforestation for impervious cover and pollutant load reduction The
bacteria load reduction meets MS4 permit area WLA compliance by 2025
Muddy BranchWatts Branch - During the first permit cycle (through 2015) a priority was
placed on full implementation of complete high and low priority projects Fewer opportunities
exist overall compared to the Anacostia and Rock Creek Watersheds No other strategies were
pursued as there are no existing TMDLs in the Muddy BranchWatts Branch subwatersheds In
future permit cycles previously identified stream restoration projects are implemented for
pollutant load reduction
Great Seneca Creek - This watershed implementation plan is unique in that it includes the small
Clopper Lake subwatershed which has a TMDL for phosphorus Even with the TMDL there are
limited identified opportunities to pursue in the Clopper Lake subwatershed in part due to the
limited area of the subwatershed within the County MS4 permit area During the first permit
cycle (through 2015) a priority was placed on full implementation of complete high and low
priority projects within Great Seneca Creek subwatershed No opportunities exist for these
strategies in Clopper Lake However full outreach was applied in Clopper Lake in the first
permit cycle In future years other potential projects ESD on public and private property and a
small amount of riparian reforestation (in Clopper Lake) is pursued The Clopper Lake WLA for
phosphorus within the MS4 permit area is met
Patuxent - During the first permit cycle through 2015 a priority was placed on full
implementation of complete high and low priority projects Far fewer opportunities exist
overall compared to the Anacostia and Rock Creek A limited amount of ESD on private land
and stream restoration was pursued Finally outreach (100) was targeted for pollutant load
reduction (primarily nutrients) but not credited towards impervious cover credit No riparian
reforestation was targeted within the MS4 Permit area due to cost effectiveness in the Rocky
Gorge subwatershed and limited opportunities in the Triadelphia subwatershed In future
permit cycles ESD on private and public land is pursued more substantially as is stream
restoration A limited amount of riparian reforestation achieves some impervious cover and
pollutant load reduction The Rocky Gorge phosphorus WLA within the MS4 permit area is met
easily and the Tridelphia phosphorus WLA is also met but with a longer timeframe needed for
compliance
021611
Montgomery County Coordinated Implementation Strategy - DRAFT
Lower Monocacy Creek -lower Monocacy Creek is the most rural watershed in the County and
has the least amount of area subject to the County MS4 permit In addition there are no preshy
identified restoration projects within the watershed Therefore during the first permit cycle
(through 2015) only a very small amount (5) of private property ESD is pursued It is not until
the second permit cycle that more focus is placed on private and public ESD as well as stream
restoration and programmatic strategies such as street sweeping to target sediment loads
associated with the TM Dl In future permit cycles stream restoration is pursued for pollutant
load reduction The sediment WlA within the MS4 permit area is projected to be met around
2025
Countywide - The Countywide effort was driven by impervious cover treatment targets and
Chesapeake Bay TMDl2017 and 2020 reduction targets associated with sediment and nutrients
for urban MS4s For impervious cover it was assumed that a 20 target would be required for
each five-year permit cycle The Bay TMDl targets for urban MS4 areas were easily met for all
pollutants in 2017 and easily met for nitrogen and sediment but more difficult to meet for
phosphorus in 2020
Public Outreach and Stewardship
The County recognizes and is committed to the increasingly important role that public outreach
and stewardship will play if improved water quality conditions are going to be achieved
countywide While the County currently has a very active and layered outreach program the
model requires changes that will result in broader stakeholder groups serving as the leaders
and primary champions for clean water in their communities This includes greater participation
from minority and faith-based groups business consortiums schools neighborhood
associations and civic groups Additionally the new model requires revisiting current
initiatives carried out by the various County agencies to look for better and more efficient ways
to communicate messages cross-train and create synergies that result in greater engagement
greater awareness and sustained changes in behavior
Within each implementation plan specific suggestions for outreach and education
opportunities are identified In addition Appendix E of this Strategy contains practice sheets
which highlight targeted restoration activities for the County to develop and refine A total of
eight practices have been identified that can be adopted countywide or in more targeted
watershed areas where there are specific water quality issues to address Many of the
practices build upon existing County programs but require a much broader reach to new
partner groups Program start up costs are suggested and were used to for cost estimates
associated with Countywide strategy The highlighted practices include
021611
Montgomery County Coordinated Implementation Strategy - DRAFT
bull Pet Waste Pickup Education and Outreach Campaign
bull Lawn Stewardship Education and Outreach Campaign
bull Anti-littering Education and Outreach Campaign
bull Innovative Stormwater Management Awareness Campaign
bull Stream Stewards Education and Outreach Campaign
bull Riparian Reforestation Education and Outreach Campaign
bull Roof Runoff Reduction Education and Outreach Campaign
bull Parking Lot Recharge Value Education and Outreach Campaign
Start up costs by practice along with an overall five year cost estimate are provided in Table
43 Start up timeframes are assumed to be up to 18 months
Table 43 Outreach Start Up and 5-Year Cost Projections
Practice Practice Start Up Cost
Pet Waste Pickup $240500
Lawn Stewardship $301 600
Anti-Littering $175050
Stormwater Management Improvements Awareness $50450
Stream Stewards $74825
Riparian Reforestation $30575
Roof Runoff Reduction $101400
Parking Lot Recharge Value $41500
Estimated Start Up Total $744900
5-Year Outreach Budget Projection $2650000
These eight practice sheets provide specific costs and timelines for implementation They also
provide suggestions for measuring program success These practice sheets along with the
specific recommendations in the implementation plans make up the Public Outreach and
Education Campaign
Trash Reduction
Most of the implementation plans have to address trash loadings to meet requirements of the
Potomac Trash Treaty that is referenced in the County1s MS4 Permit In addition the Anacostia
Trash TMDL has recently been accepted by MDE and the EPA According to the Anacostia
021611
Montgomery County Coordinated Implementation Strategy - DRAFT
TMDl there is reasonable assurance that the goals of the Treaty and TMDl can be met with
proper watershed planning implementing pollution-reduction BMPs and using strong political
and financial mechanisms
Currently the County has a number of activities which target trash reduction They include the
following
bull Adopt-a-Road Program through DOT which focuses on public awareness and involvement in trash management There are 205 participants who adopted road segments and agreed to six major road cleanups per year
bull Storm Drain Marking through DOT bull Support for illegal dumping enforcement outreach and research and monitoring bull Partnership with DOT to conduct street sweeping covering about 2500 curb miles and
occurring once a year
bull Partnership with the Park Police to monitor illegal dumping which combined enforces 300-400 actions a year
bull Non-residential and residential recycling programs through Solid Waste Services (SWS) bull Transit stop trash management program at 600 bus stops countywide supported by DOT
Transit Services
In addition to continuing these efforts a number of trash good-housekeeping efforts have been
proposed as part of this Strategy A detailed description of the quantitative methods and
strategies applied can be found in Appendix E of the Guidance Document In general the
following six trash-reduction strategies are recommended
1 Significantly increase funding for trash reduction programs 2 Create and enhance regional partnerships and coordination among businesses
environmental groups individual citizens and government at all levels and in all jurisdictions
3 Improve peoples awareness knowledge and behavior relating to littering and illegal dumping
4 Promote the greater introduction and use of effective trash-reduction technologies and approaches
5 Improve enactment and enforcement of laws to reduce trash 6 Increase trash monitoring-related data collection generation and dissemination efforts
The Anacostia watershed implementation plan provides an outline of the actions that will be
taken through the first permit cycle to reduce trash The range of programs and practices
specially aimed at reducing trash inputs to roads and streams that will be targeted include
reduce reuse and recycle campaigns littering and illegal dumping enforcement stream
cleanups and street sweeping These measures are in addition to any trash trapped and
021611
Montgomery County Coordinated Implementation Strategy - DRAFT
removed by structural practices which are computed using the WTM The plan shows that the
trash TMDl can be met by 2025 at a cost of 732 million dollars
Adaptive Management Monitoring and Reporting
Sound implementation strategies require assessment and effective adaptation to respond to
new information changing conditions new technologies and lessons learned This will be the
basis of the plan that will be used when benchmarks are not met and the projected funding is
inadequate
Adaptive management requires monitoring of a variety of measures that can be used to
determine whether progress is being made towards meeting the Countywide water quality
objectives Ultimately it is the instream water quality and the loading limits with respect to the
TMDls that determine the success of implementation however there are many interim
measures that can also be correlated to success which are worthwhile pursuing
Surface water monitoring can be an expensive and time consuming undertaking Montgomery
County is fortunate to have an extensive Countywide stream monitoring network that can serve
as a foundation for providing spatial and temporal data to indicate stream health The Countys
MS4 Permit also outlines the required assessment of controls which includes chemical
biological and physical monitoring Specifically the permit calls for the County to continue
their watershed restoration monitoring of the lower Paint Branch subwatershed and physical
monitoring ofthe Clarksburg Special Protection area In addition to the existing monitoring
network the County will continue tracking and data reporting associated with levels of
implementation (eg acres of impervious cover treated areas of buffer planted miles of
stream restored miles of streets swept) For measuring effectiveness of outreach and
stewardship efforts other types of monitoring and reporting are planned that include before
and after attitude surveys frequency of website visits and information requests
For many restoration strategies it may be difficult to tease out their individual effectiveness in
terms of pollutant load reductions but collectively the monitoring that occurs should provide
adequate insight into the overall effectiveness of a layered implementation strategy
In addition to the monitoring and assessment the County will be reporting results on an annual
basis as part of their NPDES MS4 Permit annual report The MS4 Permit requires annual
reporting of the following
021611
Montgomery County Coordinated Implementation Strategy - DRAFT
bull The status of implementing the components of the stormwater management program
that are established as permit conditions
bull A narrative summary describing the results and analyses of data including monitoring
data that is accumulated throughout the reporting year
bull Expenditures for the reporting period and the proposed budget for the upcoming year
bull A summary describing the number and nature of enforcement actions inspections and
public education programs
bull The identification of water quality improvements and documentation of progress
toward meeting applicable WLAs developed under EPA approved TMDLs and
bull The identification of any proposed changes to the Countys program when WLAs are not
being met
The County will build upon annual reporting that has historically occurred to meet permit
requirements and will supplement this reporting with tracking table summaries that quantify
implementation activities for the range of strategies pursued during that year and the
associated treatment (eg impervious cover treated pollutant load reduced education and
outreach partners established etc) Cost will also be tracked in association with rates of
implementation This level of performance will then be compared with countywide strategy
targets (eg progress towards meeting WLAs) associated with key performance dates such as
those presented in Table 41 The level of progress achieved by the County will then feed into
the adaptive management approach described above
Organization Needs to Implement Strategy
Montgomery County DEP staff possesses substantial expertise and institutional knowledge that
yields many positive outcomes and efficient processes under the current pace of restoration
and permit compliance activities Under this strategy however the pace of implementation is
required to significantly increase Based on an increase in the level of implementation it is
reasonable to assume that additional capacity may be needed to provide sufficient oversight
and management of all the projects
Another critical element of this strategy is the recognition and commitment to pursuing
outreach initiatives that build community capacity by targeting new partner groups that
provide the necessary leadership oversight and sustained effort to change behaviors and
foster stewardship The County currently carries out many well established and managed
outreach programs but it may require additional focus across County agencies and
departments for these partnerships to become established and thrive
021611 G
Montgomery County Coordinated Implementation Strategy - DRAFT
Through the implementation process and the monitoring and reporting that is required large
amounts of data will be generated Technological advances happen so rapidly in this day and
age it will be important for the County to stay current with technology and methods so that
more efficient and cost-effective data management and reporting will be possible The County
currently relies on a detailed and sophisticated GIS to spatially locate projects and manage
tables of data related to projects The growth and development of this spatial database will be
a critical component of the reporting and tracking capability of the County These databases
generate the input data that are used to measure progress towards baseline loading targets
Regular review and upkeep of the data as well as routine summarization of progress (annually
at a minimum) will likely require additional dedication of staff This is especially the case during
periods where the implementation rate of structural practices in the ground is accelerated
021611
Montgomery County Coordinated Implementation Strategy - DRAFT
Appendix C - Restoration Potential by Watershed
021611
c-
04 03 02 01
a
_ Nitrogen Load Reduction
--shy TMDL WLA Target
_Cost
MONTGOMERY COUNTY URBAN WATERSHEDS POLLUTANTS _Bk)~Ibilats ~1~ l~ fjfsi --
Rank
1
2
3
4
5
6
7
8
9
10
11
Restoration Strategy TN reduction
Ibsyr
Pet Waste Education 15169
Retrofit of Underperforming BMPs 1769
Stream Restoration 72423
Completed Projects ~43 High Priority Projects 3260
Other Potential Projects 43276
Habitat Restoration 224
Public Property ESD Retrofits 18270
Priority Neighborhoods ESD Retrofits 9271
Private Non-residential ESD Retrofits 5594
Street Sweeping -
Incremental Cost Unit Cost
Million $ IbsMillion $ 088 17193
120 1475
9304 778
948 701
635 513
25430 170
141 158
23655 77
13278 70
8018 70
124 -
Qj c
Qj
nI CXI
o -f-
1 09 08 07 06 05
$900 $800 $700
~ $600 c $500 ~ $400 $300 0 u $200 $100
$shy
~~mf il_~IJrt~
MONTGOMERY COUNTY URBAN WATERSHEDS POLLUTANTS ItfiQ14lbilJts i~5 [i
1 $900 Qj
09 $8005 iii en 08 $700
~co 07 $600 co - til
06 $500 ~ 05- $400 ~ 04 en$300 003 u $20002
en $100I 01 o 0 $shys Q en o
s Q
Phosphorus Load Reduction
--- TMDL WLA Target
__Cost
I Rank I
1
2
3
4
5
6
7
8
9
Restoration Strategy
Pet Waste Education
Retrofit of Underperforming BMPs
Stream Restoration
Completed Projects
High Priority Projects
Habitat Restoration
Other Potential Projects
Public Property ESD Retrofits
Priority Neighborhoods ESD Retrofits
10 I Private Non-residential ESD Retrofits
11 Street Sweeping
TP reduction Incremental Cost Unit Cost
Ibsyr Million $ IbsMillion $ 1979 088 2243
247 120 206
13097 9304 141
915 948 96
451 635 71
37 141 26
6067 25430 24
2546 23655 11
1294 13278 10
781 8018 10
- 124 -
MONTGOMERY COUNTY URBAN WATERSHEDS POLLUTANTS IItQjQhabillt$middot
Cii 5 Cii 11 It CD
6 ~ r o ~ s
0 ltIIa r ltII e c ltII III
1 09 08 07 06 05 04 03 02 01
0
$900
$800 $700
v$600 r
0 $500 == $400 $300 11
0 u $200 $100
$shy
_ Sediment load Reduction
--- TMDl WlA Target
__Cost
Rank Restoration Strategy
Sediment reduction
Incremental Cost
Unit Cost
tonsyr Million $ tonsMillion $ 1 Street Sweeping 800 124 645
2 Stream Restoration 25057 9304 269
3 Retrofit of Underperforming BMPs 25 120 21
4 Completed Projects 97 948 10
5 High Priority Projects 47 635 7
6 Other Potential Projects 660 25430 3
7 I Public Property ESD Retrofits 272 23655 1
8 Priority Neighborhoods ESD Retrofits 139 13278 1
9 Private Non-residential ESD Retrofits 84 8018 1
10 Habitat Restoration 2 141 1
11 Pet Waste Education - 088 -
C-3
MONTGOMERY COUNTY URBAN WATERSHEDS POLLUTANTS
-QI5 5i ~
1 09 08 07 06 05 04 03 02 01
0
$900
$800
$700
$600 ~ 0
$500 == $400 $300 11
0 u $200
$100
$shy
--shy TMDL WLA Target
___ Cost
Rank Restoration Strategy
Enterrococci reduction
Incremental Cost
Unit Cost
Billion MPNyr Million $ Billion MPN Million $
1 Pet Waste Education 19643 088 22263
2 Retrofit of Underperforming BMPs 2781 120 2318
3 Completed Projects 10441 948 1101
4 High Priority Projects 5120 635 806
5 Other Potential Projects 69895 25430 275
6 Riparian Reforestation 310 141 219
7 Public Property ESD Retrofits 29025 23655 123
8 Priority Neighborhoods ESD Retrofits 14777 13278 111
9 Private Non-residential ESD Retrofits 8917 8018 111
10 Stream Restoration - 9304 -
11 Street Sweeping - 124 I -
~ I~~~i MONTGOMERY COUNTY URBAN WATERSHEDS POLLUTANTS 1tI2~mL ~ I~I
~$ I -~-- I
100 90 80 70 60 50 40 30 20 10
0
$900 $800 $700 $600 $500 $400 $300 $200 $100 $shy
vi c
~ 5 11 0 u
Implementation Phase
Potential Trash Incremental Unit Cost
I
Rank Restoration Strategy Reduction Cost
Ibsyear Million $ IbsMillion $ 1 Recycling Education and Investigations 51654 02 238837
2 Plastic Bag Ban and Misc Enforcement 63546 13 48882
3 Anti-litter Campaign Education 23J61 09 26930
4 Retrofit of Underperforming BMPs 1144 12 954
5 Completed Projects 6598 95 696
6 High Priority Projects 2786 64 439
7 Other Potential Projects 56341 2543 222
8 Habitat Restoration 266 14 188
9 Street Sweeping 204 12 164
10 Public Property ESD Retrofits 25348 2366 107
11 Priority lIeighborhoods ESD Retrofits 12529 1328 94
12 Private Non-residential ESD Retrofits 7547 802 94 ru Stream Restoration - 930 -14 Pet Waste Education - 09 -
C-5
MONTGOMERY COUNTY URBAN WATERSHEDS POLLUTANTS
CABIN JOHN
1 250
__CostImplementation Phase
09 08 07 06 05 04 03 02 01
0
200 ~ c
150 g E
100 - ltII 0 u
50
0
_E Coli
- - - Waste Load Allocation
Rank Restoration Strategy
E coli reduction
Incremental Cost
Unit Cost
Billion
MPNyr Million $
Billion MPN
Million $ 1 Pet Waste Education 4388 $05 9436
2 Underperforming BMP Retrofits 1892 $19 1022
3 High Priority Projects 1289 $16 800
4 Riparian Reforestation 1133 $78 146
5 Other Potential Projects 148 $17 86
6 Public Property ESD Retrofits 4AOO $860 Sl 7 Private Non-residential ESD Retrofits 1618 $392 41
8 Priority Neighborhoods ESD Retrofits 2633 $638 41
9 Completed Projects 112 $00 0
C-6
MONTGOMERY COUNTY URBAN WATERSHEDS POLLUTANTS 1Itf~~Jabitm
ROCK CREEK
1 $700 Qj5 09
o
_
$600 Qj 08
111 $500 ~ampl 07 c
t5 06 $400 ~ e 05 ~ $3005 04 - 111tl 03 $200 0 u-6 02
$100J 01 $-
Enterrococci
- - - Waste load Allocation Implementation Phase
__Cost
Rank Restoration Strategy
Enterrococci reduction
Incremental Cost
Unit Cost
Billion MPNyr Million $ Billion MPN Million $
Et Pet Waste Management 35734 118 30190
Underperforming BMP Upgrades
Other Potential Projects
28800
30239
577
1083
4995
2792
4 Completed Projects 12131 444 2734
5 High Priority Projects 14239 890 1600
6 Riparian Reforestation 18999 2384 797
7 County Property ESD Retrofits 54519 24136 226
8 Private Residential ESD Retrofits 35230 17737 199
9 Private Non-residential ESD Retrofits 32A86 16380 198
C-7
MONTGOMERY COUNTY URBAN WATERSHEDS POLLUTANTS _f~~pabitafS (fi~r ~~ l-middotshy
ROCK CREEK
100 $900 90 $800 80 $700 u70 $600 c 60 2$50050 -~$40040
lt1$300 030 $200 u
20 10 $100
0 $shy
Implementation Phase
Rank Restoration Strategy Trash Reduction
Incremental Cost
Unit Cost I
Ibsyear Million $ IbsMillion $ 1 Other Potential Projects 16038 1085 1478
2 Underperforming BMP Upgrades 6756 577 1172
3 Completed Projects 4217 444 950
4 High Priority Projects 6366 890 715
5 Riparian Reforestation 9237 2384 387
6 Public Property ESD Retrofits 24587 24136 102
7 Priority Neighborhoods ESD Retrofits 16155 17737 91
8 Private Non-residential ESD Retrofits 14793 16380 90
9 Pet Waste Education - 118 -
(-8
MONTGOMERY COUNTY RURAL WATERSHEDS POLLUTANTS
SENECA - CLOPPER LAKE -
100 Qi
90 iii 80VI to -CQ 70 0 60e 50I 0 40 u l 30
C QJ 20ex
C 10to 0
J 0
$18
$16
$14 n
$12 I
$10 sect $08 ~ $06 0
VI
U $04
$02
$shy
_TPRemoval - - - TMDL Reduction Target
Implementation Phase ___Cost
Rank Restoration Strategy TP
Reduction (Ibsyr)
Incremental Cost (Million $)
Unit Cost (IbsvrMillion $)
1 Residential Education 33 001 6246
2 Underperforming BMP Retrofits 13 004 341 3 Riparian Buffer Reforestation 19 023 99 4 Priority Neighborhood ESD Retrofits 15 051 35 5 Public Property ESD Retrofits 7 075 99
C-9
-pj[fti
MONTGOMERY COUNTY URBAN WATERSHEDS POLLUTANTS 1It[~~JIlbitIL f bull~
LOWER MONOCACY
1 09 08 07 06 05 04 03 02 01
0
Implementation Phase
25
20 ~ c
15 ~ ~
10 - 0 u
5
0
_TSS
- - - Waste load Allocation _Cost
Rank Restoration Strategy
Sediment reduction
Incremental
Cost Unit Cost
tonsyear Million $ tonMilli
1 Street Sweeping 22 $007 3121
2 Underperforming BMP Retrofits 4 $010 389
3 Stream Restoration 37 $734 51
4 Riparian Buffer Reforestation 3 $109 25
5 Other Structural BMPs and ESD Strategies 10 $851 12
6 Priority Neighborhoods ESD Retrofits 2 $160 10
7 Non-residential ESD Retrofits 1 $132 10
C-10
MONTGOMERY COUNTY RURAL WATERSHEDS POLLUTANTS 1tlj~lIbiIalSlt~~II
1 09 08 07 06 05 04 03 02 01
0
$70
$60
$50 ~ c
$40 ~ ~ $30 - UI
$20 0 v
$10
$0
_ Phosphorus Load Reduction
- - - Waste Load Allocation ___ CostImplementation Phase
Rank Restoration Strategy TP Incremental Cost
Million $ Unit Cost
Ibsyr Ibs Million $ 1 Lawn Care Education 3670 01 37394
2 Underperforming BMP Retrofits 3499 08 4338
3 Other Potential Projects 3524 33 1076
4 High Priority Projects 252 04 685
5 Riparian Reforestation 762 26 298
6 Public Property Retrofits 5854 345 169
7 Priority Neighborhoods ESD Retrofits 796 65 123
8 Private Non-residential ESD Retrofits 1941 168 116
9 Completed Projects 53 00 00
c- 11
MONTGOMERY COUNTY RURAL WATERSHEDS POLLUTANTSal12hdJilats ~I~ ~ [ -
1 10 ii 5 09 9 1 08 8 II al- 07 7 1ii o 06 6
c
~ ~ 1 o E IV
05 04 03
5 4
3
~ 11 0 u
0 11 02 2 J o 01 1
t a 0 0 11 o
t 0
_ Phosphorus Reduction
- - - Waste Load Allocation
-Cost
Rank Restoration Strategy TP Incremental Cost
Million $ Unit Cost
Ibsyr Ibs Million $ 1 Lawn Care Education 3670 01 37394
2 Underperforming BMP Retrofits 3499 08 4338
3 Other Potential Projects 3524 33 1076
4 High Priority Projects 252 04 685
5 Riparian Reforestation 762 26 298
6 Public Property Retrofits 5854 345 169
7 Priority Neighborhoods ESD Retrofits 796 65 123
8 Private Non-residential ESD Retrofits 1941 168 116
9 Completed Projects 53 00 00
C-12
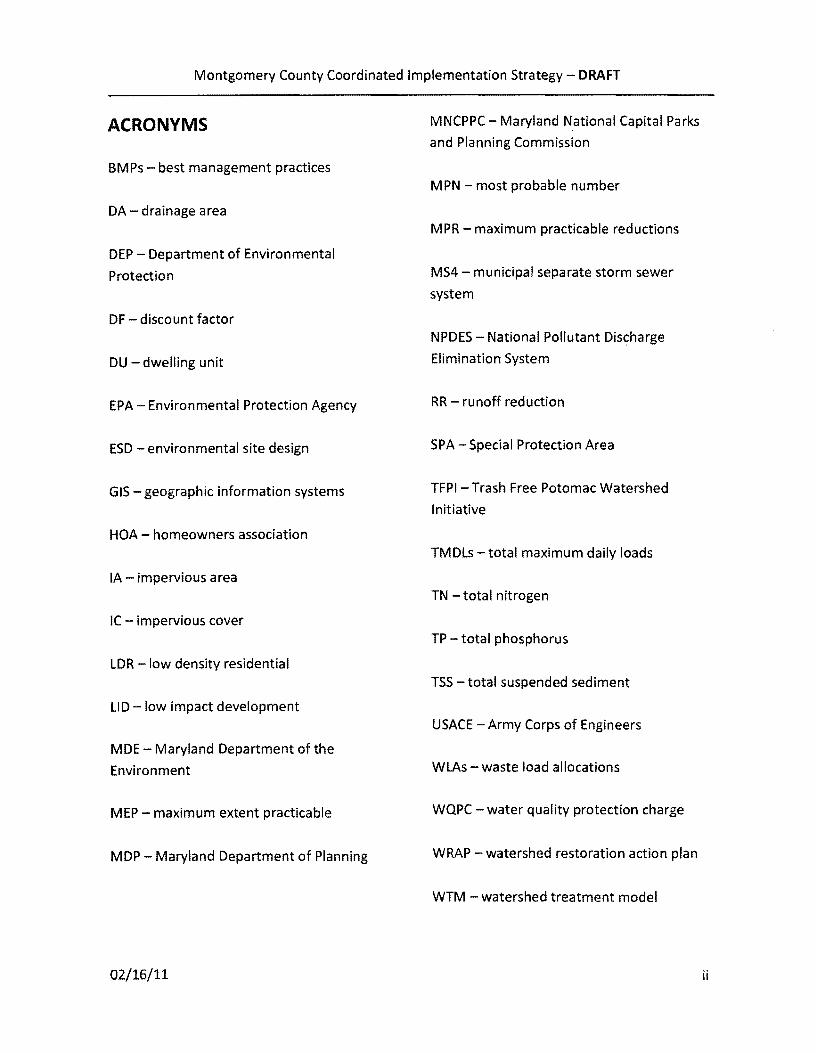
Montgomery County Coordinated Implementation Strategy - DRAFT
ACRONYMS
BMPs - best management practices
DA - drainage area
DEP - Department of Environmental
Protection
DF - discount factor
DU - dwelling unit
EPA - Environmental Protection Agency
ESD - environmental site design
GIS - geographic information systems
HOA - homeowners association
IA - impervious area
IC - impervious cover
LDR -low density residential
LID -low impact development
MDE - Maryland Department of the
Environment
MEP - maximum extent practicable
MDP - Maryland Department of Planning
MNCPPC - Maryland National Capital Parks
and Planning Commission
MPN - most probable number
MPR - maximum practicable reductions
MS4 - municipal separate storm sewer
system
NPDES - National Pollutant Discharge
Elimination System
RR - runoff reduction
SPA - Special Protection Area
TFPI - Trash Free Potomac Watershed
Initiative
TMDLs -total maximum daily loads
TN - total nitrogen
TP - total phosphorus
TSS - total suspended sediment
USACE - Army Corps of Engineers
WLAs - waste load allocations
WQPC - water quality protection charge
WRAP - watershed restoration action plan
WTM - watershed treatment model
021611 ii
Montgomery County Coordinated Implementation Strategy - DRAFT
1 PURPOSE
Project Overview
Montgomery Countys Department of Environmental Protection (DEP) watershed restoration
programs are restoring stream valleys improving water quality and addressing historical
damage caused by urban stormwater pollution Watershed restoration is a regulatory
requirement of the Countys National Pollutant Discharge Elimination System (NPDES)
Municipal Separate Storm Sewer System (MS4) Permit
This Countywide Coordinated Implementation Strategy (the Strategy) document presents the
restoration strategies that are needed to meet the watershed-specific restoration goals and
water quality standards as specified in the current MS4 permit Specifically the Strategy will
provide the planning basis for the County to
1 Meet Total Maximum Daily Load (TMDL) Wasteload Allocations (WLAs) approved by EPA
2 Provide additional stormwater runoff management on impervious acres equal to 20 of the impervious area for which runoff is not currently managed to the maximum extent practicable (MEP)
3 Meet commitments in the Trash Free Potomac Watershed Initiative 2006 Action Agreement which include support for regional strategies and collaborations aimed at reducing trash increasing recycling and increasing education and awareness of trash issues throughout the Potomac Watershed
4 Educate and involve residents businesses and stakeholder groups in achieving measurable water quality improvements
5 Establish a reporting framework that will be used for annual reporting as required in the Countys IIPDES MS4 Permit
6 Identify necessary organizational infrastructure changes needed to implement the Strategy
Chesapeake Bay Total Maximum Daily load (TMDl)
The Chesapeake Bay Total Maximum Daily Load (TMDL) established by the US Environmental
Protection Agency (EPA) sets pollution limits for nitrogen phosphorus and sediment in the
Chesapeake Bay Watershed This TMDL required under the Clean Water Act is in response to
021611
Montgomery County Coordinated Implementation Strategy - DRAFT
the slow progress by states within the watershed to limit their pollutants to levels which meet
water quality standards in the Bay and its tidal tributaries Total limits set in the Bay TMDL for
the states of Delaware Maryland New York Pennsylvania Virginia West Virginia and the
District of Columbia are 1859 million pounds of nitrogen 125 million pounds of phosphorus
and 645 billion pounds of sediment per year - a 25 percent reduction in nitrogen 24 percent
reduction in phosphorus and 20 percent reduction in sediment (USEPA December 2010) The
TMDL also sets rigorous accountability measures for state compliance Although an
implementation plan for the bay TMDL has not been completed the goals for Urban MS4s (18
nitrogen 34 phosphorus and 37 sediment) are compared to the reductions provided by
implementation of the Strategy
Montgomery County TMDLs
The County has a number of watersheds where EPA-approved TMDLs have established
pollutant loading limits for waterbodies These loading limits represent the maximum amount
of a pollutant that the waterbody can receive and still meet water quality standards and an
allocation of that load among the various sources of that pollutant (eg point sources or
nonpoint sources) MS4 permit jurisdictions like Montgomery County are considered point
sources and are given a waste load allocation (WLA)
Pollutant loads from point and non point sources must be reduced by implementing a variety of
measures One condition of the Countys MS4 Permit is to make progress toward
implementation of TMDL load reduction allocations in the Countys watersheds In addition to
TMDLs all of the watersheds in the County also have listed impairments Table 11 below lists
TMDLs and Impairments per watershed
021611
Montgomery County Coordinated Implementation Strategy - DRAFT
Table 11 Summary of TMDLs
Watershed Grouping
Approved TMDLs (Approval Date)
Bacteria (2007) Sediment (2007) Nutrients (2008)
Trash (20lQl Bacteria (2007)
Bacteria (2007)
DraftTMDLs
PCBs (2010)
Sediment (2010)
Sediment (2010)
Impairments (First Listed)
Heptaclor Epoxide (2002) Biological (2006)
Phosphorus (1996) TSS(1996)
Biological (2002)
Biological (2006)
Seneca Creek Sediment (2010) Biological (2006) (Mainstem)
Seneca Creek (Clopper Lake)
P osphorus and Sediment
~ ~
Lower Fecal Bacteria (2009) Nutrients (2010) Phosphorus (1996) Monocacy Sediment (2009) Biological (2002)
Phosphorus (1996) TSS (1996)
Biological (2006) PCBs in Fish Tissue (2008)
Phosphorus (1996) TSS (1996)
Biological (2006) PCBs in Fish Tissue (2008)
Biological
Sources httpwwwmdestatemdusprogramsWaterTMDLCurrentStatusPagesProgramsWaterPrograms TIVI DLSu m itta Isindexas px httpwwwmdemarylandgovprogramsWaterQualityFinancingSaterQualityFinanceHomePagesW
aterhb1141map wg montgomerycoaspx
MDE 2008 Integrated Report (combined 303(d) List and 30Sb Report)
TIVIDL was approved after Task Order tt7 was issued and is therefore not included in the detailed
pollutant load modeling associated with the Strategy
Patuxent (Tridelphia)
Patuxent
~middotmiddotIlmiddot- t- I ~ t I 4
bull 1 ~ bull t - - shy -l=~ _~l i-
(Rocky Gorge)
021611
Montgomery County Coordinated Implementation Strategy - DRAFT
Montgomery County MS4 Permit Background
On February 16 2010 Maryland Department of the Environment (MOE) issued Montgomery
County a new MS4 permit This S-year permit complies with the Environmental Protection
Agencys NPDES regulations that require large urban jurisdictions to control pollution from
stormwater runoff to the maximum extent practicable The EPAs latest estimates are that 10
percent of Marylands nitrogen load comes from urban and suburban stormwater runoff
(USEPA May 2010) The County MS4 Permit requires development of implementation plans to
meet WLAs through watershed restoration and other programmatic measures
Major new provisions of the permit include
bull Requiring restoration of an additional 20 percent of impervious surfaces not currently
receiving adequate treatment
bull Developing and implementing measurable strategies to reduce trash as part of the
Countys commitment to a trash-free Potomac River
bull Reducing pollutant loadings to comply with pollution limits necessary to meet water
quality standards for impaired waters (TMDLs)
The plans and strategies outlined in this document establish the steps Montgomery County is
taking to fulfill the requirements associated with this MS4 Permit
Implementation Plans and Pre-assessments
There are two major watersheds located within Montgomery County the Potomac River
watershed which covers approximately 88 of the County and the Patuxent River watershed
which covers approximately 12 of the County In terms of the Countys MS4 Permit area the
area proportion is 96 in the Potomac and 4 in the Patuxent River watersheds The County is
further divided into eight subwatersheds based on the eight digit United States Geologic Survey
(USGS) Hydrologic Unit Code (HUC) as shown in Figure 11 Seven of the eight subwatersheds
have restoration implementation plans that have been developed for this project effort The
eighth watershed Upper Potomac Direct does not have an implementation plan because a
watershed assessment has not yet been completed for the watershed as noted below
For more information about a specific watershed and the associated plans see the DEP website
(wwwmontgomerycountymdgovstormwaterpermit) The seven watersheds that have
implementation plans are
bull Anacostia
021611
Montgomery County Coordinated Implementation Strategy - DRAFT
bull Cabin John Creek
bull Lower Monocacy
bull Lower Potomac Direct (Muddy Branch and Watts Branch)
bull Patuxent
bull Rock Creek
bull Seneca Creek (Great Seneca including Clopper Lake)
lEGeND
_ Stal N nfU 1 P r
M3or ~til~hd5
D Atgt~
o COIIlln Jchl
D La frloocKJ
o Law Pctamox Quo
Dpsa~ll l Rod ~(~
Figure 11 Map of Watersheds
The goals of the implementation plans are to
bull Identify feasible best management practices (BMPs)
bull Quantify the area they treat and the amount of pollutants they can remove from
stormwater runoff before entering into the Countys streams rivers and lakes
021611
Montgomery County Coordinated Implementation Strategy - DRAFT
bull Determine the restoration potential for each watershed or subwatershed and evaluate
the ability to meet applicable TMDLs
bull Provide a schedule and cost estimate for meeting the WLAs set by the TMDL
In addition to the seven implementation plans there are three watershed pre-assessments that
have been completed for watersheds that have not been previously assessed The preshy
assessments will be used by the County to develop watershed assessments and associated
implementation plans which will be completed this permit cycle They include
bull Seneca Creek Little Seneca and Dry Seneca
bull Lower Potomac Direct including Rock Run and Little Falls but excluding Muddy Branch
and Watts Branch
bull Upper Potomac Direct including Little Monocacy amp Broad Run
The seven implementation plans (Table 12) provided the input data for the development of
this Strategy
Table 12 Watershed Groupings and Plans
Pre-Assessment
x x
x x
lower Potomac Direct (East of Seneca Creek not described in any other grouping)
Muddy Branch and Watts Branch x All other subwatersheds x
Patuxent (TriadelphiaBrighton Dam and Rocky
Gorge)
x
Great Seneca (including Clopper Lake)
Dry Seneca and Little Seneca
lower Monocacy
Upper Potomac Direct (West of Seneca Creek not described in any other grouping)
Trash Free Potomac
The Alice Ferguson Foundation founded the Trash Free Potomac Watershed Initiative (TFPWI)
in 2005 to reduce trash and increase awareness of trash issues in the watershed TFPWI actions
021611
Montgomery County Coordinated Implementation Strategy - DRAFT
include the Potomac River Watershed Trash Treaty Annual Potomac River Watershed Trash
Summit Annual Potomac River Watershed Cleanup market-based approaches such as the
Trash Free Potomac Facility Program and a Regional Anti-Litter Campaign (Alice Ferguson
Foundation 2011) The MS4 permit requires Montgomery County to meet the commitments of
Potomac River Watershed Treaty The permit specifically requires that Montgomery County
1 Support and implement regional strategies to reduce trash
2 Develop a work plan to implement a public outreach and education campaign
3 Establish baseline conditions of trash being discharged and develop a reduction strategy
and work plan for the Montgomery County portion of the Anacostia Watershed
4 Implement approved control measures in accordance with the trash reduction work
plan
5 Conduct public participation in development of trash reduction strategy
6 Submit progress annually
Public Outreach and Stewardship
The Countys MS4 Permit requires significant opportunities for public participation in achieving
TMDls watershed restoration and trash management The permit specifically requires the
County to prepare a work plan to implement a public outreach and education campaign The
County recognizes that a successful strategy will require a significant increase in effective and
coordinated public outreach and public stewardship The implementation plans and this
Strategy describe how DEP plans to implement public outreach and education campaigns with
specific performance goals and deadlines
021611
Montgomery County Coordinated Implementation Strategy - DRAFT
2 EXISTING CONDITIONS
Watershed health is variable throughout the County and typically well correlated with intensity
and age of urbanization More specifically watershed health typically declines with increasing
density and older age of development Many of Montgomery Countys older urban and
suburban areas were developed in an era when runoff from paved surfaces (roads parking lots
driveways) was directed to storm drains which conveyed untreated runoff directly to streams
This large volume of water caused massive erosion of the stream banks and destroyed habitat
Stormwater treatment using stormwater ponds to receive detain and filter runoff before it
flowed into streams was either inadequate or non-existent The Anacostia Rock Creek and
Cabin John Creek watersheds are examples where these conditions are common Modern
stormwater techniques known as environmental site design or ESD encourage the reduction
of runoff by infiltrating the water into the ground near its source
Watershed health improves in more rural areas of the County but even in these areas stream
degradation can occur stemming from large lot development and poor agricultural
management practices
The County has conducted comprehensive water quality and biological sampling for more than
a decade which provides a representative snapshot of existing watershed health as well as the
ability to track watershed health over time Figure 21 shows countywide watershed resource
conditions based on monitoring that was conducted from 2000-2008 The area inside the
beltway in the more urban core has lower water quality (fair to poor) while the area outside the
beltway tends to have better water quality (fair to good to excellent)
021611
---- -
-----
Montgomery County Coordinated Implementation Strategy - DRAFT
Watershed Resource Conditions Montgomery County Maryland
LEGEND z fbn
G 0middot1 - -~UlIS
- tI)Jogtf~
UJJOf Wrw Ftns
Splaquo1lII PnreltbOrI NtH SPAl
3D~~ennHI
[=jji=---~~-
Figure 21 County Watershed Resource Conditions
County Statistics
The Strategy will benefit from the fact that the majority of county residents own the property
they reside on (nearly 70) and thus have control over that property Also nearly 70 of the
residences are single unit homes Moreover the average household income is roughly $90000
making the likelihood of financial capability to install BMPs an appropriate assumption Both of
these statistics make advocacy of BMPs on residential properties an imperative for the Strategy
Montgomery Countys robust business economy was also considered in the Strategy
development Despite the current economic volatility Montgomery Countys business
community is still profitable and still maintaining and improving existing facilities Moreover
the construction of the inter-county-connector (ICC) through much of Montgomery County will
provide opportunities to install demonstration BMPs on newly developing properties for
replication throughout stakeholder groups Also the presence of communication industry
leaders (ie Discovery Channel) in the County creates unique stewardship education
partnership possibilities with businesses The Strategy will include these stakeholders
021611
Montgomery County Coordinated Implementation Strategy - DRAFT
involvement opportunities to best harness the power of Montgomery Countys healthy
business economy
The county includes a fairly even split of males and females The majority of residents nearly
50 fall between the ages of 25 and 55 Only 15 of the population is aged 60 and above In
addition the majority of Montgomery County residents indicate their preferred language as
English however Spanish translations of stakeholder involvement opportunities will be
required in select watersheds to accommodate the 13 of county residents that indicate their
preferred language as Spanish Other potential target groups for translation for stakeholder
involvement include the Asian community as 11 of the countys population is Asian (mostly
Korean and Vietnamese) Because of this the Strategy and implementation plans will take
multilingual requirements into consideration for signage and other educational tools as well
MS4 Permit Coverage
The Countys most recent NPDES MS4 stormwater permit only covers runoff from
developments within the County area The following areas are excluded from the Countys MS4
permit area shown in Figure 22
bull Cities of Gaithersburg Rockville and Takoma Park
bull Maryland National Capital Park and Planning Commission (MNCPPC) lands
bull Washington Sanitary Sewer Commission (WSSC) land
bull Federal and State government owned land and facilities
bull Rural zoning
021611 G
Montgomery County Coordinated Implementation Strategy - DRAFT
MS4 Permit Area Montgomery County Maryland
(-i Gaithersbur9 ~
M Ro ckville
TkD m Parilt -Jr MNC PPC Lnds
0 5 3
Feder 1 and SI PropertyM i KbnelefS
M 0 I 2 ~- Federal and Sta1e Roads
~ i s Rural Zon ing
Figure 22 Areas outside the Montgomery County MS4 Permit Area
Impervious Surfaces
As previously mentioned the Countys MS4 Permit requires treatment of an additional 20 of
impervious cover not currently receiving treatment to the MEP Table 21 presents a summary
of the countywide impervious cover totals along with breakdowns by major land cover type
These land covers will be the focus of much of the Countys targeted effort to treat the 20
target
021611
Montgomery County Coordinated Implementation Strategy - DRAFT
Table 2llmpervious Surface Summary
Description
Total County Area 324552 100
Total Area of 1m ervious Surface 35965 _ _-----shy 11
County Area Subject to Stormwater Permit (1) 138649 43
Imllervious Cover Subject to Stormwater Permit 2) ~==5119====18o2 == ==== Areas of Impervious Surface (3)
Road 13607 38
Building 13073 36
Parking 22
Sidewalk 1069 3
Recreation (4) 347 1 1 Exclusions include Certain zoning codes parklands forests municipalities with own stormwater management
programs state and federal properties and state and federal maintained roads 2 Percent of County Jurisdictional Area subject to the Stormwater Permit 3 Impervious area within each category within the total County area 4 Recreation imperviousness excludes swimming pools
Implementation Plan Guidance Document
The Implementation Plan Guidance Document (revised October 252010) provides a road map
for how the implementation plans were created The primary sections of the Guidance
Document and a short description of each are provided in Appendix A
The Guidance Document divides BMPs into five classes or codes shown below The Guidance
Document also provides a list of BMPs and which code they fall under which is provided in
Appendix B
Code 0 Pretreatment Practices
Code 1 Non-performing BMPs No runoff reduction and no long term pollutant removal
Code 2 Under-performing BMPs Limited runoff reduction and low pollutant removal
Code 3 Effective BMPs No runoff reduction but moderate to high pollutant removal
Code 4 ESO BMPs High runoff reduction and moderate to high pollutant removal
Impervious Cover Accounting and Tracking
Montgomery County has GIS data layers that contain all the stormwater BMPs in the County
and their drainage areas In order to determine the 20 target for impervious cover treatment
021611
Montgomery County Coordinated Implementation Strategy - DRAFT
to the MEP the County analyzed their existing impervious cover and their existing BMP
database to determine how much impervious cover is currently being treated to the MEP
Several methods were considered based on a determination of the MEP standard compared to
existing treatment methods According to MDE guidance to be considered MEP a BMP must
capture at least the Water Quality Volume (WQv) (the first inch of rainfall) or the CPv volume
(26 inches of rainfall) The final method used for determining which BMPs are MEP and the
amount of impervious surface not treated to the MEP was as follows
1 All BMPs that were installed after 2002 or are classified as Code 4 were considered MEP
2 An analysis of typical Code 3 stormwater ponds installed after 1986 was performed to
determine if this class of BMPs met the definition of IVIEP Based on that analysis Code
3 BMPs constructed after 1986 are considered MEP
3 All other classes of BMPs not specified above are not considered MEP and are eligible
for retrofit
Table 22 below shows the breakdown of the impervious acres treated by BMP codes and era
(shaded areas are BMP codes treated to the MEP)
Table 22 Acres of Impervious Cover Treated by BMP Code and Design Era
Design Era Post2002 1986-2002 Pre1986 Blank Total
CIJ tl 0 u Q
~ co
0 28 711 24 132 895
1 33 555 1391 367 2346
2 41 299 12 23 375
3 75 2482 1437 267 4261
4 20 459 482 40 1001
Totals 198 4506 3345 828 8877
IC Credit 100 Code 3amp 4 Code 4 Total Acres treated to
MEP 198 2942 482 40 3661
Assuming a total countywide impervious acreage of 25119 acres and an impervious acreage
treated to the MEP of 3661 as shown in Table 22 there are currently 21458 acres of
untreated impervious area Twenty percent of 21458 equates to 4292 acres of impervious
area that must be restored over the current permit cycle
021611
Montgomery County Coordinated Implementation Strategy - DRAFT
Pollutant Load Tracking
In addition to tracking impervious cover it is necessary to compute existing pollutant loads and
projected reductions in loads as a result of applying storm water controls and BMPs The Center
for Watershed Protections (CWP) Watershed Treatment Model (WTM) version 20 (CWP 2001)
was the tool selected to conduct this analysis and track load reductions across a range of
implementation strategies
The WTM uses a spreadsheet model to calculate annual pollutant loads and runoff volumes
The model also accounts for the benefits contributed by a full suite of stormwater treatment
practices and programs The first step in the model calculates existing pollutant loads by adding
primary and secondary source loads then subtracting reductions according to existing
management practices The second step applies future management practices by subtracting
these calculated reductions from the existing loads Appendix B of the Guidance Document
provides a detailed explanation of the assumptions and steps in the modeling process
For each watershed the WTM was run under existing conditions with existing BMPs to
determine a baseline pollutant load for targeted pollutants The baseline period for non-TMDL
parameters was based on 2002 Maryland Department of Planning land useland cover data
coupled with the Countys existing urban BMP database Pollutants targeted included bacteria
Total Phosphorus (TP) Total Nitrogen (TN) Total Suspended Solids (TSS) and Trash Next a
series of model runs was developed for analyzing the pollutant load reduction effect that
various restoration strategies would have based on assumed levels of implementation for the
various strategies Individual restoration strategies that were sequentially modeled included
the following
bull Completed and High Priority Projects - these include projects already completed or high
priority structural BMPs scheduled for retrofit in the FYll-FY16 Capital Improvements
Program (CIP)
bull Low Priority Projects - these includes FY11-FY16 CIP projects that for various reasons
are considered a lower priority
bull Other Potential Projects - these include other projects in existing inventories that were
not listed in the previous two categories For the Anacostia they include projects in
Anacostia Restoration Plan (ARP) prepared by the Army Corp of Engineers
bull Public ESD Retrofits - These include small scale ESD practices applied to County-owned
buildings streets and parking lots and rights of way Examples include rainwater
harvesting green roofs upland reforestation soil compost amendments rooftop
disconnection green street retrofits and converting drainage ditches to dry swales
021611
Montgomery County Coordinated Implementation Strategy - DRAFT
These are Code 4 structures This category also includes other structural BMP upgrades
to existing County BMPs which were designated as under-performing or nonshy
performing
bull Private ESD Retrofits - These projects include ESD on commercial property and
residential property and include green roofs rain gardens and permeable pavement
bull Riparian Reforestation - Focuses primarily on tree planting for riparian buffer
restoration
bull Stream Restoration - Includes the use of natural materials such as rocks logs and native
vegetation to reduce pressure on eroded banks prevent down-cutting of the
streambed and restore the natural meander patterns and slope profiles found in stable
reference streams
bull Programmatic Practices - This category deals with potential pollutant reduction that can
be attributed and quantified through MS4 stormwater pollution prevention
improvements and better housekeeping on County land and facilities Also includes any
pollutant reductions due to product substitution (eg nitrogen and phosphorus limits in
fertilizer) operational programs (eg recycling) and enforcement This category also
deals with reduced pollutants that can be attributed and quantified through MS4
stormwater education (eg lawn care) and outreach aimed at pollution prevention
better housekeeping and increased stewardship
The naming convention applied for the model runs was WTM 10 (ie baseline) WTM 20 (Le
completed and high priority low priority and other potential projects) WTM 30 (Le public
and private ESD) WTM 40 (ie riparian reforestation and stream restoration) and WTM 50
(ie programmatic) Model runs were developed sequentially to yield incremental increases in
load reduction by strategy In practice however strategies can be applied in combination and
out of sequence to achieve targeted outcomes and the most cost-effective solutions A
summary of the scenarios is provided in Table 23 below
021611
Montgomery County Coordinated Implementation Strategy - DRAFT
Table 23 Summary of Watershed Treatment Model (WTM) Scenarios
Implementation Phase Description
The WTM was run under existing conditions approach
WTM Baseline Conditions with the MDP year 2002 land useland cover data and
existing BMPs
WTM 20 Completed as of
2009j High Priorityj Low
Priority and Other Potential
Projects
The WTM was run with a series of future management
practices which were proposed projects from the
County inventory of restoration sites These practices
cover new ponds retrofits of existing BMPs and some
ESD practices from the proposed projects list
The Countys inventory for other project types that
include public properties eg libraries and parkingWTM 30 ESD Strategies and
lots public schools and open section roads available Other Structural BMPs
for ESD retrofits was reviewed as were areas for
private property ESD retrofits
This category includes any pollutant reduction or volume
reduction that can be attributed to specific stream
WTM 40 Habitat rehabilitation wetland restoration and or riparian
Restoration reforestation projects planned for construction in the
watershed for the permit cycle
WTM 50 MS4 Programmatic See description above
Practices
TMDL Calibration and Tracking
Where TMDLs existed for individual watersheds the WTM was run under existing conditions
with existing BMPs based on the year in which the data was collected for TMDL development
The baseline pollutant load was then compared and normalized to the MDE-determined
baseline MS4 load for the TMDL pollutant Any BMPs with approved dates after the year in
which the data was collected for TMDL development were not included in the baseline
calculation but rather were counted towards meeting the TMDL reduction target
Once the normalized model was established reductions achieved through programs and
practices were tracked using the WTM scenarios based on the percent load reduction from
baseline toward meeting the TMDL required WLA The normalized baseline and WLA target are
determined and specified in the relevant TMDL documents developed by M DE
021611
Montgomery County Coordinated Implementation Strategy - DRAFT
3 WATERSHED IMPLEMENTATION PLANS AND RESTORATION POTENTIAL
The watershed implementation plans and pre-assessments developed in conjunction with the
Strategy are driven by regulatory requirements facing each watershed Table 31 summarizes
the drivers by watershed
Table 31 Restoration Objectives -
W~tershedSubwater~hed - Trash
4 bull - I _ _ -
Patuxent
Anacostia
Rock Creek
Great Seneca
Cabin John Creek
lower Monocacy
Watts BranchMuddy Branch
Dry and little Seneca
lower Potomac Direct
Table 32 presents the more detailed and quantitative aspects of the TMDl requirements for
the MS4 portion within each watershed The Strategy has been developed to meet the MS4
permit area WLA compliance targets presented in Tables 32
In addition to the individual watershed requirements there is a Countywide requirement to
comply with the wasteload allocations associated with urban areas under the Chesapeake Bay
TMDl which applies to nutrients and sediment There is an interim target established for 2017
where reductions from baseline conditions of 9 12 and 20 respectively for TN TP and
TSS are to occur Then by 2020 full compliance is required which correspond to reductions
from baseline conditions of 18 34 and 37 respectively for TN TP and TSS
021611
Montgomery County Coordinated Implementation Strategy - DRAFT
Table 32 TMDl Summary by Impairment
Watershed
Cabin John Creek
Rock 2007 Enterococci 970 453669 18195 Creek
Anacostia 2007 Enterococci 860 247809 29978 River
Aoacostia 2008 TN 788 206312 38959 River
Anacostia 2008 TP 797 20953 3947 Ibsyr River
Triadelphia 2008 TP 580 438 Reservoir
Rocky Gorge 2008 TP 480 4268 3628 Reservoir
Clopper Lake 2002 TP 393
Anacostia 2007 TSS 850 7682 River
Triadelphia 2008 TSS Reservoir Clopper 2002 TSS 00 13 13
Lake
Lower 2009 TSS 380010 172 Monocacy
River
Anacostia 2010 Trash 1000 228683 Ibsyr River
Adapted from 2010 Status of Approved Stormwater Waste load Allocations for NPDES Regulated Stormwater Entities in Montgomery County April 27 2010 by Jeff White MDE
Potential to Reduce Stormwater Pollutant loads
Within each of the implementation plans an analysis was developed that explored the
restoration potential for that watershed Cost was not a limiting factor for the analysis but
rather assumptions were made based on feasibility of implementation rates and consideration
of conflicts with typical site conditions with respect to site use utilities land ownership etc
For example it was assumed that 40 of large County-owned parking lots would be available
for stormwater retrofitting These assumptions are necessary for planning purposes where
detailed site investigations have not occurred However some level of implementation is
021611
Montgomery County Coordinated Implementation Strategy - DRAFT
reasonable to assume In addition all identified high priority and low priority County projects
that have the potential to be constructed were assumed to be implemented
Implementation cost and effectiveness (in terms of pollutant load reduced) was also tracked
through the process of determining watershed restoration potential which enables the
costbenefit evaluation of various strategies for a target parameter (eg tons of sediment per
dollar spent or billion MPN of bacteria per dollar etc) For example by tracking cost and
effectiveness it is possible to evaluate the relative costbenefit of a strategy like ESD versus a
non-structural programmatic practice Moreover the comparison of these two strategies is
going to be different depending on what parameter is being considered eg ESD may be more
cost effective for nutrient reduction but less cost effective for bacterial load reduction
The tables in Appendix C help to illustrate this point Specifically a series of summary charts
and tables have been developed that illustrate the cost effectiveness of the range of strategies
considered by watershed with respect to pollutant load reduction The summaries reflect the
full restoration potential developed for each watershed
It is also useful to compare strategy effectiveness and range of opportunity across watersheds
To facilitate this a series of tables were compiled that groups all watersheds together and
considers watershed restoration potential by strategy These summary tables are presented in
Tables 33 through 310
For this analysis stream restoration was treated as a special modeling case (Table 39) because
it was not tracked as a strategy that receives credit for impervious cover treatment and because
it requires a different pollutant load reduction tracking method based on linear feet of
implementation and the existing stream resource condition (good fair or poor IBI scores
received different pollutant removal credit) Further details on stream restoration modeling
are presented in the individual implementation plans and the Guidance Document
Not all WTM scenarios were modeled for all watersheds For example if there were no
previously identified completed high priority low priority or other potential projects within a
watershed they would appear as zeros for that individual watershed in Tables 33 through 36
Also for non-TMDl watersheds such as Great Seneca and Muddy Branch and Watts Branch
subwatersheds the public and private property ESD riparian reforestation and MS4
programmatic practices scenarios were not modeled due to the lack of regulatory drivers that
define pollutant removal targets
021611
Montgomery County Coordinated Implementation Strategy - DRAFT
Table 33 Cost and benefit summary for completed projects (WTM 20)
Watershed Total ESD PrOjects Incremental reduction from baseline ()
i Cost Numberof Impervious
Cost
I Impervious Trash control added TN TP TSS Bacteria
(million $) projects bullbull (ac)
(total) (total)
Anacostia 95 25 167 7 3 4 4 1 4 4
Cabin John 00 0 0 0 0 02 02 03 03 1
Rock Creek 44 6 212 13 1 2 2 3 3 2 i
I Triadelphia 00 0 0 0 0 0 0 0 0 0
Rocky Gorge 00 0 0 0 0 0 01 0 0 0
Lower Monocacy 00 0 0 0 0 0 0 0 0 0
Clopper lake 00 0 0 0 0 0 0 0 0 0
Great Seneca bull 06 2 11 0 0 1 1 I 1 0 2
MuddyWatts 00 0 0 0 0 0 0 0 0 0
Indudes Clopper lake Project count does not include stream restoration Pollutants with a TMDL are highlighted
Table 34 Cost and benefit summary for high priority projects (WTM 20)
Watershed I
I
Total ESD Projects Incremental reduction from baseline ()
Cost
(million $)
i Numberof
projects bullbull
Impervious
control added
(ac)
ICost (total)
Impervious
(total) TN
I TP TSS I TrashBacteria
Anacostia 64 33 148 65 16 2 2 06 2 2
Cabin John 16 6 88 19 2 3 3 3 3 1
Rock Creek 89 14 373 13 1 2 3 3 3 4
Triadelphia 00 0 0 04 0 0 0 0 0 0
I Rocky Gorge 04 2 5 77 27 06 06 07 06 1
Lower Monocacy 00 0 0 0 0 0 0 0 0 0
Clopper lake 00 0 0 0 010 0 0 0 0 0 Great Seneca bull 183 24 789 6 08 19 19 20 0 24
MuddyWatts 44 16 211 8 1 6 6 6 0 6
Indudes Clopper lake bullbull Project count does not indude stream restoration Pollutants with a TMDL are highlighted
Table 35 Cost and benefit summary for low priority projects (WTM 20)
I Watershed Total ESO Projects Incremental reduction from baseline ()
Numberof Impervious ICost 1m ~ i Cost Impervious
I (million $) projects bullbull
control added (total) (total)
TN TP Bacteria Trash
(ac)
I Anacostia 51 16 188 61 8 2 2 07 2 3
Cabin John 16 8 10 98 78 02 02 02 02 03
I Rock Creek 88 24 657 7 1 4 4 6 5 7
Triadelphia 040 1 20 100 100 05 05 06 05 1
Rocky Gorge 09 2 458 100 100 84 82 83 82 116 i
I Lower Monocacy 0 0 0 0 0 0 0 0 0 0 I Clopper lake 0 0 0 0 0 0 0 0 0 0
I Great Seneca bull 66 16 87 41 15 4 4 4 010 4
I MuddyWatts 20 6 26 84 33 0 0 1 0 0
Includes Clopper Lake Project count does not include stream restoration Pollutants wth a TMDL are highlighted
021611
Montgomery County Coordinated Implementation Strategy - DRAFT
Table 36 Cost and benefit summary for other potential projects (WTM 20)
I Watershed Total ESO Projects Incremental reduction from baseline ()
ICost Impervious I Cost
I I Trash INumber of
control added Impervious
TN TP TSS Bacteria (million $) projects bullbull
(ac) (total) (total)
i i
Anacostia 2492 497 2222 73 62 23 8 26 301
Cabin John 00840 1 5 0 010 01 01 01 01 01
Rock Creek 20 4 201 0 0 12 12 19 15 21
Triadelphia 00 0 0 010 0 00 00 00 00 00
Rocky Gorge 20 2 0 010 0 00 00 00 00 00
lower Monocacy 00 0 0 0( 0 00 00 00 00 0010
Clopper Lake 00 0 0 0 0 00 00 00 00 0010
Great Seneca bull 02 S S3 0 0 23 23 27 00 27
MuddyWatts 00 0 0 0 0( 00 00 00 00 0010
bull Includes Clopper Lake bullbull Project count does not include stream restoration Pollutants with a TMDL are highlighted
Table 37 Cost and benefit summary for ESO projects (WTM 30)
Watershed
I
Cost (million $) Impervious
control added
(ac)
Incremental reduction from baseline ()
ESDfor i ESO for private
public
property property
TN TP TSS Bacteria Trash
Anacostia 2378 21296 1813 20 21 7 22 27
Cabin John 878 10307 876 22 23 25 24 28
Rock Creek 2471 341 2427 30 30 33 32 35
Triadelphia 41 47 36 10 1010 11 11 20
Rocky Gorge 312 19 28S 26 27 32 30 46
lower Monocacy 86 29 53 14 15 15 15 010
Clopper lake 08 051 21 14 14 15 0 14
Great Seneca bull 00 0 0 010 0 0( 0( 010
MuddyWatts 00 a 0 0 01 010 0 0
bull Includes Clopper lake Pollutants with a TMDL are highlighted
Table 3B Cost and benefit summary for riparian reforestation (WTM 40)
IWatershed Cost (million $) Impervious
Incremental reduction from baseline ()
control added Habitat restoration (ac) TN TP TSS Bacteria Trash
Anacostia 1 6 0 0 0 01 02
Cabin John 777 39 1 2 lili
3
Rock Creek 24 119 2 2 2 5
Triadelphia 010 1 01 02 01 04 03
Rocky Gorge 25 12 1 2 2 3 8
lower Monocacy 11 S 3 3 3 4 0
Clopper Lake 023 2 4 4 2 010 4
Great Seneca bull 0 a 010 010 0 010 0
MuddyWatts 0 0 010 0 0 0 0
bull Includes Clopper lake Pallutonts with a TMDL are highlighted
021611
Montgomery County Coordinated Implementation Strategy - DRAFT
Table 57 Cost and benefit summary for stream restoration (WTM 40)
Watershed Stream Restoration Incremental reduction from baseline ()
Number of Impervious control
Cost (million $) added(ac) TN TP TSS Bacteria Trash projects
Anacostia 937 200 0 42 56 326 0 0
Cabinlohn 162 15 0 17 9 80 0 0
Rock Creek 201 30 a 9 710 100 0 0
Triadelphia 00 0 0 0 0 0 010 0
Rocky Gorge 191 18 I 0 10 7 36 0 O lower Monocacy 73 nla 0 7 10 32 010 0
Clopper Lake 00 a 0 0 0 0 0 0
Great Seneca It I 259 33 0 19 8 16 0 0
MuddyWatts 242 45 0 16 7 13 0 0
Includes Clopper Lake Pollutants with a TMDL are highlighted
Table 58 Cost and benefit summary for M54programmatlc practices (WTM 50)
Watershed Cost (million $) Incremental reduction from baseline ()
Programmatic
practices - M54
Impervious control
added (ac) TN TP TSS Bacteria Trash
Anacostia 36 0 9 9 10 8 82
Cabin John 047 0 15 14 0 10 0
Rockereek 12 0 11 11 0 7 0
Triadelphia 00056 a 23 3 0 0 0
Rocky Gorge 009 0 38 8 03 5 2
lower Monocacy 007 0 0 0 19 0 0
Clopper Lake 0Q1 0 61 30
~=r 0
Great Seneca 10 0 0 0 0 0Y0 0 0
MuddyWatts 0 0 0 0 0 0 0
bull Includes Clopper Lake Pollutants with a TMDL are highlighted
021611
Montgomery County Coordinated Implementation Strategy - DRAFT
4 COORDINATED IMPLEMENTATION STRATEGY
The Strategy has multiple objectives to accomplish whereby a challenging balance between
strategies and timeframe is required There isnt necessarily a correct answer in the process
but rather an optimized result that addresses an agreed upon suite of priorities The Strategy
presented here was primarily driven by known and established regulatory timeframes and
compliance endpoints Meeting these endpoints using the more cost effective approaches was
also given priority After this consideration was given to other known and important
approaches that stakeholders and the County have an interest in pursuing Specifically the
following compliance dates and objectives were conSidered in developing the Strategy over the
long-term (Table 41)
Table 41 Compliance Targets for Countywide Coordinated Implementation Strategy
Target Date
2015
2017
2020
Compliance Target
Meeting 20 impervious cover treatment requirement
within the MS4 Permit cycle
Meet the interim dates and targets for the Chesapeake
Bay TMDL which include specific regulated urban area
reductions by 2017 for nutrients and sediment (based
on Maryland Department of the Environments
Watershed Implementation Plan)
Meet the full compliance and targets for the
Chesapeake BayTIVIDL which include specific regulated
urban area reduction by 2020 for nutrients and
sediment (based on Maryland Department of the
Environments Watershed Implementation Plan)
Metric
~4300 acres of
Impervious Cover
9 12 and 20
respectively for TN TP
and TSS reductions
from baseline
conditions
18 34 and 37
respectively for TN TP
and TSS reductions
from baseline
conditions
2025
2030
Meet additional impervious cover treatment targets
associated with next MS4 Permit cycle (assumes
another 20 target)
Meet additional impervious cover treatment targets
associated with next MS4 Permit cycle (assumes
another 20 target)
Out year compliance with other watershed TMDLs
~3400 acres of
Impervious Cover (20
of impervious
remaining after 2015)
~2750 acres of
Impervious Cover (20
of impervious
remaining after 2020)
100 compliance with
MS4 Permit Area WLAs
021611
Montgomery County Coordinated Implementation Strategy - DRAFT
To meet the compliance targets outlined in Table 41 the following priorities were generally
followed
bull 100 implementation of completed high and low priority County projects in first five
years (by 2015)
bull Greater ESD focus in urban (as opposed to suburban and rural) watersheds initially Goal
for ESD in these watersheds on pUblic property in first five years is 10 and on private
property is 10 The level of implementation was largely driven by the 20 Countywide
impervious goal
bull 100 of Public Outreach Potential for all TIVIDl watersheds in first five years This was
pursued to address trash nutrient and bacteria loading which rely strongly on effective
outreach programs to modify behaviors
bull Generally limited strategies to the top four most cost effective per watershed
bull Habitat restoration (stream restoration and buffer reforestation) not pursued as priority
until after first five year period These programs emphasize greater pollutant reduction
efficiency rather than impervious cover treatment which is the primary focus for the
first permit cycle
The Strategy was informed by the individual watershed implementation plans for seven
watersheds which included the Clopper lake and Patuxent subwatersheds Therefore in order
to develop countywide estimates for pollutant load reduction (as is required by the Chesapeake
Bay TMDl) watershed area weighting was applied The process for developing the Countywide
strategy and individual watershed implementation plans was woven together Once the
restoration potential was determined from the individual plans the strategy and schedule was
compiled using the restoration potentials and the drivers listed above The final restoration
cost and schedule was then placed in the implementation plans
It is also worth noting that the high and low priority projects along with the other potential
projects strategies represent a static or fixed number of projects that have been identified by
the County For this analysiS this list of practices is not replenished and therefore once all
opportunities have been implemented other strategies are pursued In reality the County will
continue to develop and update its list of specific project opportunities and have these
available for implementation in future years
The output from this effort is presented in a series of tables ordered by target date in Appendix
D In addition Table 42 provides an overall summary of pollutant load reduction tracking
versus time Through inspection of Table 42 it can be seen that the Strategy meets the
021611
Montgomery County Coordinated Implementation Strategy - DRAFT
impervious cover treatment targets under the current MS4 permit (as well as projected targets
for 2020 and 2025 assuming a continued 20 treatment requirement) interim and final
Chesapeake Bay nutrient and sediment reduction targets by 2017 and 2020 respectively and
out year MS4 permit area WLA compliance for the majority of pollutants Exceptions include
meeting the bacteria WLA load reductions required for the Anacostia and Rock Creek
021611
Montgomery County Coordinated Implementation Strategy - DRAFT
Table 42 Projection by Phase for Watersheds and Pollutants PermitTMDL Targets
Watershed Fiscal Year 2015 2017 2020 2025 2030 2017 2020
Impervious Treated (acres) 1421 2393 3364 4272 4544
ESD ( Impervious) 26 44 61 69A 71
Cost (Million $) 160 307 486 732 820
E5D( Cost) 45 62 71 78 78
Anacostia Nitrogen 25 39 68 89A l00A 818 82
Phosphorus 27 42 77 100 100 812 81
i Sediment 47 72 100 l00A) l00A 875 88
Bacteria 21 33 46 59A 64 879 88
Trash 41 65 89 l00A) 100
Impervious Treated (acres) 1541 1961 2381 3625 3989
ESD ( Impervious) 17 28 36 57A 61
Cost (Million $) 87 172 262 566 658
ESD ( Cost) 7(JA 79 79A 89A 9(JA
Rock Creek Nitrogen 24 30 38 55 61
Phosphorus 25 3(JA 38 54 GfJA)
Sediment 38 50 92 l00A 100
Bacteria 21 27 33 5(JA 55 96(JA 96
Trash 17 24 31 5(JA) 55
Impervious Treated (acres) 187 380 570 1018 1018
ESD ( Impervious) 52 72 78 87A 87A
Cost (Million $) 23 65 114 215 219
ESD ( Cost) 92 91 86 90 88
Cabin John Nitrogen 21 27A 39A 55 58 Phosphorus 2(JA 26 35 49 51
Sediment 6 17 GfJA 91 100
Bacteria 16 22 27 4(JA) 40 31 31
Trash 6 12 19 34 34
Impervious Treated (acres) 237 237 237 237 237
ESD ( Impervious) 4 4 4 4 4
Cost (Million $) 6 8 19 25 31
ESD ( Cost) 32 27A 11 8 7
Muddy Watts Nitrogen 6 7 15 18 22
Phosphorus 6 7 10 12 13 Sediment 7 8 14 17 2(JA
Bacteria 0 (JA 0 (JA 0 i Trash 6 6 6 6 6
bull Impervious Treated (acres) 901 921 941 941 941 ESD ( Impervious) 2 2 2 2 2
Cost (Million $) 26 48 SO 51 52 ESD ( Cost) 15 8 8 8 8
Great Seneca Nitrogen 24 41 43 44 45
Phosphorus 24 32 34 34 34
i Sediment 26 41 43 44 44
I Bacteria (JA) 0 0 0 (JA
Trash 31 32 33 33 33
021611
Montgomery County Coordinated Implementation Strategy - DRAFT
Pe rmitTMDL Targets
Watershed Fiscal Year 2015 2017 2020 2025 2030 2017 2020
Clopper
Impervious Treated (acres) 0 6 12 22 22
ESD ( Impervious) 0 86 86 92 92
Cost (Million $) 0 0 1 2 2
ESD ( Cost) 0 72 73 84 84
Nitrogen 61 67 72 79 79
Phosphorus 30 36 41 48 48 45 45
Sediment 0 5 10 17 17
Bacteria 0 0 0 0 0
Trash 0 6 11 18 18
Lower Monocacy
Impervious Treated (acres) 1 16 32 58 58
ESD ( Impervious) 100 85 84 91 91
Cost (Million $) 0 4 11 18 20
ESD ( Cost) 100 85 54 63 58
Nitrogen 0 5 14 22 24
Phosphorus 0 5 16 26 28
Sediment 0 5 46 61 69 608 61
Bacteria 0 6 12 19 19
Trash 0 0 0 0 0
Rocky Gorge
Impervious Treated (acres) 11 88 165 307 307
ESD ( Impervious) 64 89 90 95 95
Cost (Million $) 3 17 40 70 75
ESD ( Cost) 55 82 64 73 68
Nitrogen 47 55 6710 82 85
Phosphorus 17 25 36 52 53 15 15
Sediment 10 19 45 7(J1o 79
Bacteria 14 23 32 47 47
Trash 15 30 46 68 68
Triadelphia
Impervious Treated (acres) 3 12 20 38 38
ESD ( Impervious) 100 98 97 99 99
Cost (Million $) 1 3 5 9 9
ESD ( Cost) 99 98 98 99 99
Nitrogen 24 27 29 34 34
Phosphorus 4 7 9 14 14 15 15
Sediment 1 4 6 12 12
Bacteria 1 4 6 12 12
Trash 2 6 11 21 21
Countywide
Impervious Treated (acres) 4302 6014 7722 10518 11154 6008 7723
ESD ( Impervious) 18 34 47 6(J1o 63
Cost (Million $) 305 622 987 1687 1884
ESD ( Cost) 53 66 7(J1o 8(J1o 80
Nitrogen 18 25 36 46 51 9 2(J1o
Phosphorus 17 23 34 44 46 12 34
Sediment 23 34 54 6(J1o 62 20 37
Bacteria 11 15 20 28 30
Trash 18 26 33 41 42
Assumptio~s
1 Does no~ includerepeated Outreach and Education costs beyond FY2015
2 Does not include ~n inflation multiplier
021611
Montgomery County Coordinated Implementation Strategy - DRAFT
Summary of Individual Implementation Plans
A summary of the general considerations and prioritization for each watershed implementation
plan is provided below
Anacostia - For the first permit cycle (through 2015) a priority was placed on full
implementation of completed high and low priority projects Next implementation of a third
of the other potential projects was targeted as a large number of these were identified in
conjunction with the USACEs Anacostia Watershed Restoration Plan efforts ESD was
emphasized on both public (10) and private property (10) Finally outreach (25) and
stream restoration (12) are targeted for pollutant load reduction but are not credited towards
impervious cover credit In future permit cycles the remainder of the other potential projects
are targeted along with ESD and a limited amount of riparian reforestation for impervious cover
and pollutant load reduction Outreach and stream restoration are significant strategies
pursued for load reduction benefits Nutrient and sediment MS4 permit area WLAs are met by
2030 but bacteria load reduction does not meet MS4 permit area WLA compliance The
remaining bacteria reduction is believed to be associated with urban wildlife sources Unless
intense urban wildlife management practices are implemented this remaining load reduction
will not be possible
Rock Creek- For the first permit cycle (through 2015) a priority was placed on full
implementation of complete high and low priority projects Next 25 implementation of
other potential projects was targeted ESD was emphasized on both public (10) and private
property (10) with private property implementation being linked to Rainscapes Program
success Finally outreach (100) and stream restoration (22) are targeted for pollutant load
reduction but are not credited towards impervious cover credit In future permit cycles the
remainder of the other potential projects are targeted along with ESD and riparian
reforestation for impervious cover and pollutant load reduction Stream restoration is a
significant strategy pursued for load reduction benefits The bacterial load reduction does not
meet MS4 permit area WLA compliance However the remaining bacterial load is believed to
be associated with urban wildlife sources Unless intense urban wildlife management practices
are implemented this remaining load reduction will not be possible
Cabin John Creek - Similar to the other two more urban watersheds in the County during the
first permit cycle (through 2015) a priority was placed on full implementation of complete high
and low priority projects Fewer opportunities exist overall compared to the Anacostia and Rock
Creek Next 25 implementation of other potential projects was targeted ESD was
emphasized on both public (10) and private property (10) Finally outreach (100) was
021611
Montgomery County Coordinated Implementation Strategy - DRAFT
targeted for pollutant load reduction but not credited towards impervious cover credit No
riparian reforestation or stream restoration was targeted due to limited or no opportunities In
future permit cycles the remainder of the other potential projects are targeted along with ESD
and some riparian reforestation for impervious cover and pollutant load reduction The
bacteria load reduction meets MS4 permit area WLA compliance by 2025
Muddy BranchWatts Branch - During the first permit cycle (through 2015) a priority was
placed on full implementation of complete high and low priority projects Fewer opportunities
exist overall compared to the Anacostia and Rock Creek Watersheds No other strategies were
pursued as there are no existing TMDLs in the Muddy BranchWatts Branch subwatersheds In
future permit cycles previously identified stream restoration projects are implemented for
pollutant load reduction
Great Seneca Creek - This watershed implementation plan is unique in that it includes the small
Clopper Lake subwatershed which has a TMDL for phosphorus Even with the TMDL there are
limited identified opportunities to pursue in the Clopper Lake subwatershed in part due to the
limited area of the subwatershed within the County MS4 permit area During the first permit
cycle (through 2015) a priority was placed on full implementation of complete high and low
priority projects within Great Seneca Creek subwatershed No opportunities exist for these
strategies in Clopper Lake However full outreach was applied in Clopper Lake in the first
permit cycle In future years other potential projects ESD on public and private property and a
small amount of riparian reforestation (in Clopper Lake) is pursued The Clopper Lake WLA for
phosphorus within the MS4 permit area is met
Patuxent - During the first permit cycle through 2015 a priority was placed on full
implementation of complete high and low priority projects Far fewer opportunities exist
overall compared to the Anacostia and Rock Creek A limited amount of ESD on private land
and stream restoration was pursued Finally outreach (100) was targeted for pollutant load
reduction (primarily nutrients) but not credited towards impervious cover credit No riparian
reforestation was targeted within the MS4 Permit area due to cost effectiveness in the Rocky
Gorge subwatershed and limited opportunities in the Triadelphia subwatershed In future
permit cycles ESD on private and public land is pursued more substantially as is stream
restoration A limited amount of riparian reforestation achieves some impervious cover and
pollutant load reduction The Rocky Gorge phosphorus WLA within the MS4 permit area is met
easily and the Tridelphia phosphorus WLA is also met but with a longer timeframe needed for
compliance
021611
Montgomery County Coordinated Implementation Strategy - DRAFT
Lower Monocacy Creek -lower Monocacy Creek is the most rural watershed in the County and
has the least amount of area subject to the County MS4 permit In addition there are no preshy
identified restoration projects within the watershed Therefore during the first permit cycle
(through 2015) only a very small amount (5) of private property ESD is pursued It is not until
the second permit cycle that more focus is placed on private and public ESD as well as stream
restoration and programmatic strategies such as street sweeping to target sediment loads
associated with the TM Dl In future permit cycles stream restoration is pursued for pollutant
load reduction The sediment WlA within the MS4 permit area is projected to be met around
2025
Countywide - The Countywide effort was driven by impervious cover treatment targets and
Chesapeake Bay TMDl2017 and 2020 reduction targets associated with sediment and nutrients
for urban MS4s For impervious cover it was assumed that a 20 target would be required for
each five-year permit cycle The Bay TMDl targets for urban MS4 areas were easily met for all
pollutants in 2017 and easily met for nitrogen and sediment but more difficult to meet for
phosphorus in 2020
Public Outreach and Stewardship
The County recognizes and is committed to the increasingly important role that public outreach
and stewardship will play if improved water quality conditions are going to be achieved
countywide While the County currently has a very active and layered outreach program the
model requires changes that will result in broader stakeholder groups serving as the leaders
and primary champions for clean water in their communities This includes greater participation
from minority and faith-based groups business consortiums schools neighborhood
associations and civic groups Additionally the new model requires revisiting current
initiatives carried out by the various County agencies to look for better and more efficient ways
to communicate messages cross-train and create synergies that result in greater engagement
greater awareness and sustained changes in behavior
Within each implementation plan specific suggestions for outreach and education
opportunities are identified In addition Appendix E of this Strategy contains practice sheets
which highlight targeted restoration activities for the County to develop and refine A total of
eight practices have been identified that can be adopted countywide or in more targeted
watershed areas where there are specific water quality issues to address Many of the
practices build upon existing County programs but require a much broader reach to new
partner groups Program start up costs are suggested and were used to for cost estimates
associated with Countywide strategy The highlighted practices include
021611
Montgomery County Coordinated Implementation Strategy - DRAFT
bull Pet Waste Pickup Education and Outreach Campaign
bull Lawn Stewardship Education and Outreach Campaign
bull Anti-littering Education and Outreach Campaign
bull Innovative Stormwater Management Awareness Campaign
bull Stream Stewards Education and Outreach Campaign
bull Riparian Reforestation Education and Outreach Campaign
bull Roof Runoff Reduction Education and Outreach Campaign
bull Parking Lot Recharge Value Education and Outreach Campaign
Start up costs by practice along with an overall five year cost estimate are provided in Table
43 Start up timeframes are assumed to be up to 18 months
Table 43 Outreach Start Up and 5-Year Cost Projections
Practice Practice Start Up Cost
Pet Waste Pickup $240500
Lawn Stewardship $301 600
Anti-Littering $175050
Stormwater Management Improvements Awareness $50450
Stream Stewards $74825
Riparian Reforestation $30575
Roof Runoff Reduction $101400
Parking Lot Recharge Value $41500
Estimated Start Up Total $744900
5-Year Outreach Budget Projection $2650000
These eight practice sheets provide specific costs and timelines for implementation They also
provide suggestions for measuring program success These practice sheets along with the
specific recommendations in the implementation plans make up the Public Outreach and
Education Campaign
Trash Reduction
Most of the implementation plans have to address trash loadings to meet requirements of the
Potomac Trash Treaty that is referenced in the County1s MS4 Permit In addition the Anacostia
Trash TMDL has recently been accepted by MDE and the EPA According to the Anacostia
021611
Montgomery County Coordinated Implementation Strategy - DRAFT
TMDl there is reasonable assurance that the goals of the Treaty and TMDl can be met with
proper watershed planning implementing pollution-reduction BMPs and using strong political
and financial mechanisms
Currently the County has a number of activities which target trash reduction They include the
following
bull Adopt-a-Road Program through DOT which focuses on public awareness and involvement in trash management There are 205 participants who adopted road segments and agreed to six major road cleanups per year
bull Storm Drain Marking through DOT bull Support for illegal dumping enforcement outreach and research and monitoring bull Partnership with DOT to conduct street sweeping covering about 2500 curb miles and
occurring once a year
bull Partnership with the Park Police to monitor illegal dumping which combined enforces 300-400 actions a year
bull Non-residential and residential recycling programs through Solid Waste Services (SWS) bull Transit stop trash management program at 600 bus stops countywide supported by DOT
Transit Services
In addition to continuing these efforts a number of trash good-housekeeping efforts have been
proposed as part of this Strategy A detailed description of the quantitative methods and
strategies applied can be found in Appendix E of the Guidance Document In general the
following six trash-reduction strategies are recommended
1 Significantly increase funding for trash reduction programs 2 Create and enhance regional partnerships and coordination among businesses
environmental groups individual citizens and government at all levels and in all jurisdictions
3 Improve peoples awareness knowledge and behavior relating to littering and illegal dumping
4 Promote the greater introduction and use of effective trash-reduction technologies and approaches
5 Improve enactment and enforcement of laws to reduce trash 6 Increase trash monitoring-related data collection generation and dissemination efforts
The Anacostia watershed implementation plan provides an outline of the actions that will be
taken through the first permit cycle to reduce trash The range of programs and practices
specially aimed at reducing trash inputs to roads and streams that will be targeted include
reduce reuse and recycle campaigns littering and illegal dumping enforcement stream
cleanups and street sweeping These measures are in addition to any trash trapped and
021611
Montgomery County Coordinated Implementation Strategy - DRAFT
removed by structural practices which are computed using the WTM The plan shows that the
trash TMDl can be met by 2025 at a cost of 732 million dollars
Adaptive Management Monitoring and Reporting
Sound implementation strategies require assessment and effective adaptation to respond to
new information changing conditions new technologies and lessons learned This will be the
basis of the plan that will be used when benchmarks are not met and the projected funding is
inadequate
Adaptive management requires monitoring of a variety of measures that can be used to
determine whether progress is being made towards meeting the Countywide water quality
objectives Ultimately it is the instream water quality and the loading limits with respect to the
TMDls that determine the success of implementation however there are many interim
measures that can also be correlated to success which are worthwhile pursuing
Surface water monitoring can be an expensive and time consuming undertaking Montgomery
County is fortunate to have an extensive Countywide stream monitoring network that can serve
as a foundation for providing spatial and temporal data to indicate stream health The Countys
MS4 Permit also outlines the required assessment of controls which includes chemical
biological and physical monitoring Specifically the permit calls for the County to continue
their watershed restoration monitoring of the lower Paint Branch subwatershed and physical
monitoring ofthe Clarksburg Special Protection area In addition to the existing monitoring
network the County will continue tracking and data reporting associated with levels of
implementation (eg acres of impervious cover treated areas of buffer planted miles of
stream restored miles of streets swept) For measuring effectiveness of outreach and
stewardship efforts other types of monitoring and reporting are planned that include before
and after attitude surveys frequency of website visits and information requests
For many restoration strategies it may be difficult to tease out their individual effectiveness in
terms of pollutant load reductions but collectively the monitoring that occurs should provide
adequate insight into the overall effectiveness of a layered implementation strategy
In addition to the monitoring and assessment the County will be reporting results on an annual
basis as part of their NPDES MS4 Permit annual report The MS4 Permit requires annual
reporting of the following
021611
Montgomery County Coordinated Implementation Strategy - DRAFT
bull The status of implementing the components of the stormwater management program
that are established as permit conditions
bull A narrative summary describing the results and analyses of data including monitoring
data that is accumulated throughout the reporting year
bull Expenditures for the reporting period and the proposed budget for the upcoming year
bull A summary describing the number and nature of enforcement actions inspections and
public education programs
bull The identification of water quality improvements and documentation of progress
toward meeting applicable WLAs developed under EPA approved TMDLs and
bull The identification of any proposed changes to the Countys program when WLAs are not
being met
The County will build upon annual reporting that has historically occurred to meet permit
requirements and will supplement this reporting with tracking table summaries that quantify
implementation activities for the range of strategies pursued during that year and the
associated treatment (eg impervious cover treated pollutant load reduced education and
outreach partners established etc) Cost will also be tracked in association with rates of
implementation This level of performance will then be compared with countywide strategy
targets (eg progress towards meeting WLAs) associated with key performance dates such as
those presented in Table 41 The level of progress achieved by the County will then feed into
the adaptive management approach described above
Organization Needs to Implement Strategy
Montgomery County DEP staff possesses substantial expertise and institutional knowledge that
yields many positive outcomes and efficient processes under the current pace of restoration
and permit compliance activities Under this strategy however the pace of implementation is
required to significantly increase Based on an increase in the level of implementation it is
reasonable to assume that additional capacity may be needed to provide sufficient oversight
and management of all the projects
Another critical element of this strategy is the recognition and commitment to pursuing
outreach initiatives that build community capacity by targeting new partner groups that
provide the necessary leadership oversight and sustained effort to change behaviors and
foster stewardship The County currently carries out many well established and managed
outreach programs but it may require additional focus across County agencies and
departments for these partnerships to become established and thrive
021611 G
Montgomery County Coordinated Implementation Strategy - DRAFT
Through the implementation process and the monitoring and reporting that is required large
amounts of data will be generated Technological advances happen so rapidly in this day and
age it will be important for the County to stay current with technology and methods so that
more efficient and cost-effective data management and reporting will be possible The County
currently relies on a detailed and sophisticated GIS to spatially locate projects and manage
tables of data related to projects The growth and development of this spatial database will be
a critical component of the reporting and tracking capability of the County These databases
generate the input data that are used to measure progress towards baseline loading targets
Regular review and upkeep of the data as well as routine summarization of progress (annually
at a minimum) will likely require additional dedication of staff This is especially the case during
periods where the implementation rate of structural practices in the ground is accelerated
021611
Montgomery County Coordinated Implementation Strategy - DRAFT
Appendix C - Restoration Potential by Watershed
021611
c-
04 03 02 01
a
_ Nitrogen Load Reduction
--shy TMDL WLA Target
_Cost
MONTGOMERY COUNTY URBAN WATERSHEDS POLLUTANTS _Bk)~Ibilats ~1~ l~ fjfsi --
Rank
1
2
3
4
5
6
7
8
9
10
11
Restoration Strategy TN reduction
Ibsyr
Pet Waste Education 15169
Retrofit of Underperforming BMPs 1769
Stream Restoration 72423
Completed Projects ~43 High Priority Projects 3260
Other Potential Projects 43276
Habitat Restoration 224
Public Property ESD Retrofits 18270
Priority Neighborhoods ESD Retrofits 9271
Private Non-residential ESD Retrofits 5594
Street Sweeping -
Incremental Cost Unit Cost
Million $ IbsMillion $ 088 17193
120 1475
9304 778
948 701
635 513
25430 170
141 158
23655 77
13278 70
8018 70
124 -
Qj c
Qj
nI CXI
o -f-
1 09 08 07 06 05
$900 $800 $700
~ $600 c $500 ~ $400 $300 0 u $200 $100
$shy
~~mf il_~IJrt~
MONTGOMERY COUNTY URBAN WATERSHEDS POLLUTANTS ItfiQ14lbilJts i~5 [i
1 $900 Qj
09 $8005 iii en 08 $700
~co 07 $600 co - til
06 $500 ~ 05- $400 ~ 04 en$300 003 u $20002
en $100I 01 o 0 $shys Q en o
s Q
Phosphorus Load Reduction
--- TMDL WLA Target
__Cost
I Rank I
1
2
3
4
5
6
7
8
9
Restoration Strategy
Pet Waste Education
Retrofit of Underperforming BMPs
Stream Restoration
Completed Projects
High Priority Projects
Habitat Restoration
Other Potential Projects
Public Property ESD Retrofits
Priority Neighborhoods ESD Retrofits
10 I Private Non-residential ESD Retrofits
11 Street Sweeping
TP reduction Incremental Cost Unit Cost
Ibsyr Million $ IbsMillion $ 1979 088 2243
247 120 206
13097 9304 141
915 948 96
451 635 71
37 141 26
6067 25430 24
2546 23655 11
1294 13278 10
781 8018 10
- 124 -
MONTGOMERY COUNTY URBAN WATERSHEDS POLLUTANTS IItQjQhabillt$middot
Cii 5 Cii 11 It CD
6 ~ r o ~ s
0 ltIIa r ltII e c ltII III
1 09 08 07 06 05 04 03 02 01
0
$900
$800 $700
v$600 r
0 $500 == $400 $300 11
0 u $200 $100
$shy
_ Sediment load Reduction
--- TMDl WlA Target
__Cost
Rank Restoration Strategy
Sediment reduction
Incremental Cost
Unit Cost
tonsyr Million $ tonsMillion $ 1 Street Sweeping 800 124 645
2 Stream Restoration 25057 9304 269
3 Retrofit of Underperforming BMPs 25 120 21
4 Completed Projects 97 948 10
5 High Priority Projects 47 635 7
6 Other Potential Projects 660 25430 3
7 I Public Property ESD Retrofits 272 23655 1
8 Priority Neighborhoods ESD Retrofits 139 13278 1
9 Private Non-residential ESD Retrofits 84 8018 1
10 Habitat Restoration 2 141 1
11 Pet Waste Education - 088 -
C-3
MONTGOMERY COUNTY URBAN WATERSHEDS POLLUTANTS
-QI5 5i ~
1 09 08 07 06 05 04 03 02 01
0
$900
$800
$700
$600 ~ 0
$500 == $400 $300 11
0 u $200
$100
$shy
--shy TMDL WLA Target
___ Cost
Rank Restoration Strategy
Enterrococci reduction
Incremental Cost
Unit Cost
Billion MPNyr Million $ Billion MPN Million $
1 Pet Waste Education 19643 088 22263
2 Retrofit of Underperforming BMPs 2781 120 2318
3 Completed Projects 10441 948 1101
4 High Priority Projects 5120 635 806
5 Other Potential Projects 69895 25430 275
6 Riparian Reforestation 310 141 219
7 Public Property ESD Retrofits 29025 23655 123
8 Priority Neighborhoods ESD Retrofits 14777 13278 111
9 Private Non-residential ESD Retrofits 8917 8018 111
10 Stream Restoration - 9304 -
11 Street Sweeping - 124 I -
~ I~~~i MONTGOMERY COUNTY URBAN WATERSHEDS POLLUTANTS 1tI2~mL ~ I~I
~$ I -~-- I
100 90 80 70 60 50 40 30 20 10
0
$900 $800 $700 $600 $500 $400 $300 $200 $100 $shy
vi c
~ 5 11 0 u
Implementation Phase
Potential Trash Incremental Unit Cost
I
Rank Restoration Strategy Reduction Cost
Ibsyear Million $ IbsMillion $ 1 Recycling Education and Investigations 51654 02 238837
2 Plastic Bag Ban and Misc Enforcement 63546 13 48882
3 Anti-litter Campaign Education 23J61 09 26930
4 Retrofit of Underperforming BMPs 1144 12 954
5 Completed Projects 6598 95 696
6 High Priority Projects 2786 64 439
7 Other Potential Projects 56341 2543 222
8 Habitat Restoration 266 14 188
9 Street Sweeping 204 12 164
10 Public Property ESD Retrofits 25348 2366 107
11 Priority lIeighborhoods ESD Retrofits 12529 1328 94
12 Private Non-residential ESD Retrofits 7547 802 94 ru Stream Restoration - 930 -14 Pet Waste Education - 09 -
C-5
MONTGOMERY COUNTY URBAN WATERSHEDS POLLUTANTS
CABIN JOHN
1 250
__CostImplementation Phase
09 08 07 06 05 04 03 02 01
0
200 ~ c
150 g E
100 - ltII 0 u
50
0
_E Coli
- - - Waste Load Allocation
Rank Restoration Strategy
E coli reduction
Incremental Cost
Unit Cost
Billion
MPNyr Million $
Billion MPN
Million $ 1 Pet Waste Education 4388 $05 9436
2 Underperforming BMP Retrofits 1892 $19 1022
3 High Priority Projects 1289 $16 800
4 Riparian Reforestation 1133 $78 146
5 Other Potential Projects 148 $17 86
6 Public Property ESD Retrofits 4AOO $860 Sl 7 Private Non-residential ESD Retrofits 1618 $392 41
8 Priority Neighborhoods ESD Retrofits 2633 $638 41
9 Completed Projects 112 $00 0
C-6
MONTGOMERY COUNTY URBAN WATERSHEDS POLLUTANTS 1Itf~~Jabitm
ROCK CREEK
1 $700 Qj5 09
o
_
$600 Qj 08
111 $500 ~ampl 07 c
t5 06 $400 ~ e 05 ~ $3005 04 - 111tl 03 $200 0 u-6 02
$100J 01 $-
Enterrococci
- - - Waste load Allocation Implementation Phase
__Cost
Rank Restoration Strategy
Enterrococci reduction
Incremental Cost
Unit Cost
Billion MPNyr Million $ Billion MPN Million $
Et Pet Waste Management 35734 118 30190
Underperforming BMP Upgrades
Other Potential Projects
28800
30239
577
1083
4995
2792
4 Completed Projects 12131 444 2734
5 High Priority Projects 14239 890 1600
6 Riparian Reforestation 18999 2384 797
7 County Property ESD Retrofits 54519 24136 226
8 Private Residential ESD Retrofits 35230 17737 199
9 Private Non-residential ESD Retrofits 32A86 16380 198
C-7
MONTGOMERY COUNTY URBAN WATERSHEDS POLLUTANTS _f~~pabitafS (fi~r ~~ l-middotshy
ROCK CREEK
100 $900 90 $800 80 $700 u70 $600 c 60 2$50050 -~$40040
lt1$300 030 $200 u
20 10 $100
0 $shy
Implementation Phase
Rank Restoration Strategy Trash Reduction
Incremental Cost
Unit Cost I
Ibsyear Million $ IbsMillion $ 1 Other Potential Projects 16038 1085 1478
2 Underperforming BMP Upgrades 6756 577 1172
3 Completed Projects 4217 444 950
4 High Priority Projects 6366 890 715
5 Riparian Reforestation 9237 2384 387
6 Public Property ESD Retrofits 24587 24136 102
7 Priority Neighborhoods ESD Retrofits 16155 17737 91
8 Private Non-residential ESD Retrofits 14793 16380 90
9 Pet Waste Education - 118 -
(-8
MONTGOMERY COUNTY RURAL WATERSHEDS POLLUTANTS
SENECA - CLOPPER LAKE -
100 Qi
90 iii 80VI to -CQ 70 0 60e 50I 0 40 u l 30
C QJ 20ex
C 10to 0
J 0
$18
$16
$14 n
$12 I
$10 sect $08 ~ $06 0
VI
U $04
$02
$shy
_TPRemoval - - - TMDL Reduction Target
Implementation Phase ___Cost
Rank Restoration Strategy TP
Reduction (Ibsyr)
Incremental Cost (Million $)
Unit Cost (IbsvrMillion $)
1 Residential Education 33 001 6246
2 Underperforming BMP Retrofits 13 004 341 3 Riparian Buffer Reforestation 19 023 99 4 Priority Neighborhood ESD Retrofits 15 051 35 5 Public Property ESD Retrofits 7 075 99
C-9
-pj[fti
MONTGOMERY COUNTY URBAN WATERSHEDS POLLUTANTS 1It[~~JIlbitIL f bull~
LOWER MONOCACY
1 09 08 07 06 05 04 03 02 01
0
Implementation Phase
25
20 ~ c
15 ~ ~
10 - 0 u
5
0
_TSS
- - - Waste load Allocation _Cost
Rank Restoration Strategy
Sediment reduction
Incremental
Cost Unit Cost
tonsyear Million $ tonMilli
1 Street Sweeping 22 $007 3121
2 Underperforming BMP Retrofits 4 $010 389
3 Stream Restoration 37 $734 51
4 Riparian Buffer Reforestation 3 $109 25
5 Other Structural BMPs and ESD Strategies 10 $851 12
6 Priority Neighborhoods ESD Retrofits 2 $160 10
7 Non-residential ESD Retrofits 1 $132 10
C-10
MONTGOMERY COUNTY RURAL WATERSHEDS POLLUTANTS 1tlj~lIbiIalSlt~~II
1 09 08 07 06 05 04 03 02 01
0
$70
$60
$50 ~ c
$40 ~ ~ $30 - UI
$20 0 v
$10
$0
_ Phosphorus Load Reduction
- - - Waste Load Allocation ___ CostImplementation Phase
Rank Restoration Strategy TP Incremental Cost
Million $ Unit Cost
Ibsyr Ibs Million $ 1 Lawn Care Education 3670 01 37394
2 Underperforming BMP Retrofits 3499 08 4338
3 Other Potential Projects 3524 33 1076
4 High Priority Projects 252 04 685
5 Riparian Reforestation 762 26 298
6 Public Property Retrofits 5854 345 169
7 Priority Neighborhoods ESD Retrofits 796 65 123
8 Private Non-residential ESD Retrofits 1941 168 116
9 Completed Projects 53 00 00
c- 11
MONTGOMERY COUNTY RURAL WATERSHEDS POLLUTANTSal12hdJilats ~I~ ~ [ -
1 10 ii 5 09 9 1 08 8 II al- 07 7 1ii o 06 6
c
~ ~ 1 o E IV
05 04 03
5 4
3
~ 11 0 u
0 11 02 2 J o 01 1
t a 0 0 11 o
t 0
_ Phosphorus Reduction
- - - Waste Load Allocation
-Cost
Rank Restoration Strategy TP Incremental Cost
Million $ Unit Cost
Ibsyr Ibs Million $ 1 Lawn Care Education 3670 01 37394
2 Underperforming BMP Retrofits 3499 08 4338
3 Other Potential Projects 3524 33 1076
4 High Priority Projects 252 04 685
5 Riparian Reforestation 762 26 298
6 Public Property Retrofits 5854 345 169
7 Priority Neighborhoods ESD Retrofits 796 65 123
8 Private Non-residential ESD Retrofits 1941 168 116
9 Completed Projects 53 00 00
C-12
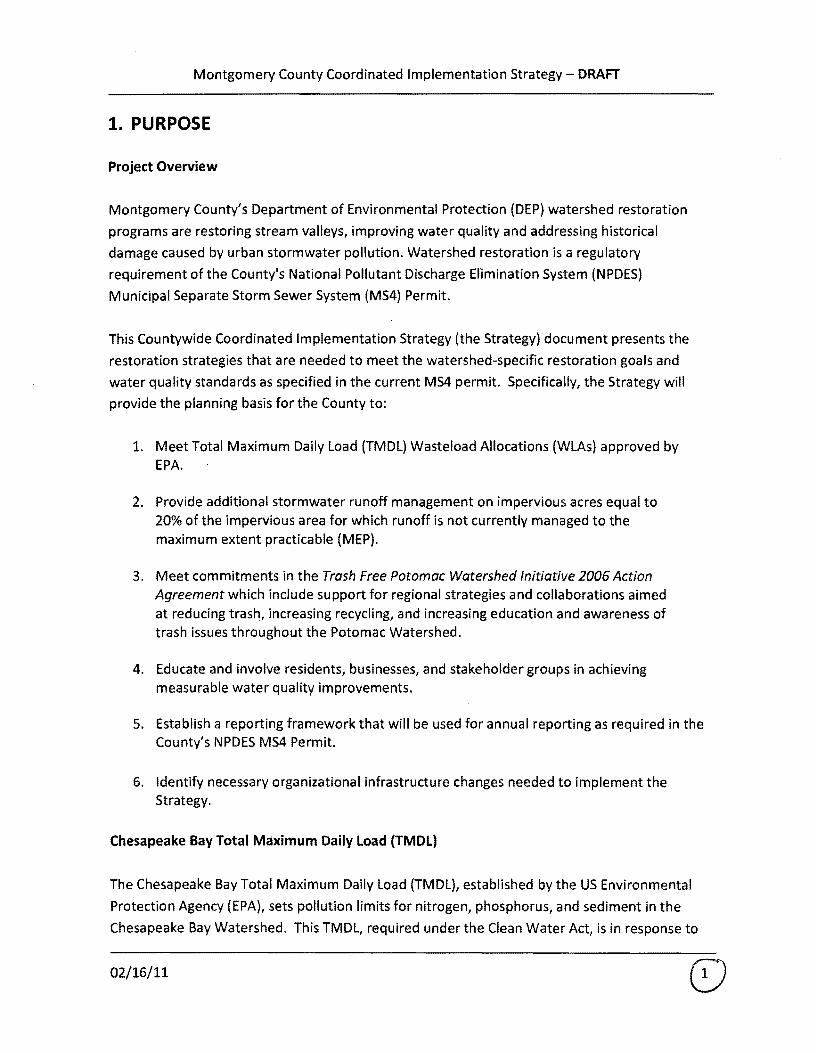
Montgomery County Coordinated Implementation Strategy - DRAFT
the slow progress by states within the watershed to limit their pollutants to levels which meet
water quality standards in the Bay and its tidal tributaries Total limits set in the Bay TMDL for
the states of Delaware Maryland New York Pennsylvania Virginia West Virginia and the
District of Columbia are 1859 million pounds of nitrogen 125 million pounds of phosphorus
and 645 billion pounds of sediment per year - a 25 percent reduction in nitrogen 24 percent
reduction in phosphorus and 20 percent reduction in sediment (USEPA December 2010) The
TMDL also sets rigorous accountability measures for state compliance Although an
implementation plan for the bay TMDL has not been completed the goals for Urban MS4s (18
nitrogen 34 phosphorus and 37 sediment) are compared to the reductions provided by
implementation of the Strategy
Montgomery County TMDLs
The County has a number of watersheds where EPA-approved TMDLs have established
pollutant loading limits for waterbodies These loading limits represent the maximum amount
of a pollutant that the waterbody can receive and still meet water quality standards and an
allocation of that load among the various sources of that pollutant (eg point sources or
nonpoint sources) MS4 permit jurisdictions like Montgomery County are considered point
sources and are given a waste load allocation (WLA)
Pollutant loads from point and non point sources must be reduced by implementing a variety of
measures One condition of the Countys MS4 Permit is to make progress toward
implementation of TMDL load reduction allocations in the Countys watersheds In addition to
TMDLs all of the watersheds in the County also have listed impairments Table 11 below lists
TMDLs and Impairments per watershed
021611
Montgomery County Coordinated Implementation Strategy - DRAFT
Table 11 Summary of TMDLs
Watershed Grouping
Approved TMDLs (Approval Date)
Bacteria (2007) Sediment (2007) Nutrients (2008)
Trash (20lQl Bacteria (2007)
Bacteria (2007)
DraftTMDLs
PCBs (2010)
Sediment (2010)
Sediment (2010)
Impairments (First Listed)
Heptaclor Epoxide (2002) Biological (2006)
Phosphorus (1996) TSS(1996)
Biological (2002)
Biological (2006)
Seneca Creek Sediment (2010) Biological (2006) (Mainstem)
Seneca Creek (Clopper Lake)
P osphorus and Sediment
~ ~
Lower Fecal Bacteria (2009) Nutrients (2010) Phosphorus (1996) Monocacy Sediment (2009) Biological (2002)
Phosphorus (1996) TSS (1996)
Biological (2006) PCBs in Fish Tissue (2008)
Phosphorus (1996) TSS (1996)
Biological (2006) PCBs in Fish Tissue (2008)
Biological
Sources httpwwwmdestatemdusprogramsWaterTMDLCurrentStatusPagesProgramsWaterPrograms TIVI DLSu m itta Isindexas px httpwwwmdemarylandgovprogramsWaterQualityFinancingSaterQualityFinanceHomePagesW
aterhb1141map wg montgomerycoaspx
MDE 2008 Integrated Report (combined 303(d) List and 30Sb Report)
TIVIDL was approved after Task Order tt7 was issued and is therefore not included in the detailed
pollutant load modeling associated with the Strategy
Patuxent (Tridelphia)
Patuxent
~middotmiddotIlmiddot- t- I ~ t I 4
bull 1 ~ bull t - - shy -l=~ _~l i-
(Rocky Gorge)
021611
Montgomery County Coordinated Implementation Strategy - DRAFT
Montgomery County MS4 Permit Background
On February 16 2010 Maryland Department of the Environment (MOE) issued Montgomery
County a new MS4 permit This S-year permit complies with the Environmental Protection
Agencys NPDES regulations that require large urban jurisdictions to control pollution from
stormwater runoff to the maximum extent practicable The EPAs latest estimates are that 10
percent of Marylands nitrogen load comes from urban and suburban stormwater runoff
(USEPA May 2010) The County MS4 Permit requires development of implementation plans to
meet WLAs through watershed restoration and other programmatic measures
Major new provisions of the permit include
bull Requiring restoration of an additional 20 percent of impervious surfaces not currently
receiving adequate treatment
bull Developing and implementing measurable strategies to reduce trash as part of the
Countys commitment to a trash-free Potomac River
bull Reducing pollutant loadings to comply with pollution limits necessary to meet water
quality standards for impaired waters (TMDLs)
The plans and strategies outlined in this document establish the steps Montgomery County is
taking to fulfill the requirements associated with this MS4 Permit
Implementation Plans and Pre-assessments
There are two major watersheds located within Montgomery County the Potomac River
watershed which covers approximately 88 of the County and the Patuxent River watershed
which covers approximately 12 of the County In terms of the Countys MS4 Permit area the
area proportion is 96 in the Potomac and 4 in the Patuxent River watersheds The County is
further divided into eight subwatersheds based on the eight digit United States Geologic Survey
(USGS) Hydrologic Unit Code (HUC) as shown in Figure 11 Seven of the eight subwatersheds
have restoration implementation plans that have been developed for this project effort The
eighth watershed Upper Potomac Direct does not have an implementation plan because a
watershed assessment has not yet been completed for the watershed as noted below
For more information about a specific watershed and the associated plans see the DEP website
(wwwmontgomerycountymdgovstormwaterpermit) The seven watersheds that have
implementation plans are
bull Anacostia
021611
Montgomery County Coordinated Implementation Strategy - DRAFT
bull Cabin John Creek
bull Lower Monocacy
bull Lower Potomac Direct (Muddy Branch and Watts Branch)
bull Patuxent
bull Rock Creek
bull Seneca Creek (Great Seneca including Clopper Lake)
lEGeND
_ Stal N nfU 1 P r
M3or ~til~hd5
D Atgt~
o COIIlln Jchl
D La frloocKJ
o Law Pctamox Quo
Dpsa~ll l Rod ~(~
Figure 11 Map of Watersheds
The goals of the implementation plans are to
bull Identify feasible best management practices (BMPs)
bull Quantify the area they treat and the amount of pollutants they can remove from
stormwater runoff before entering into the Countys streams rivers and lakes
021611
Montgomery County Coordinated Implementation Strategy - DRAFT
bull Determine the restoration potential for each watershed or subwatershed and evaluate
the ability to meet applicable TMDLs
bull Provide a schedule and cost estimate for meeting the WLAs set by the TMDL
In addition to the seven implementation plans there are three watershed pre-assessments that
have been completed for watersheds that have not been previously assessed The preshy
assessments will be used by the County to develop watershed assessments and associated
implementation plans which will be completed this permit cycle They include
bull Seneca Creek Little Seneca and Dry Seneca
bull Lower Potomac Direct including Rock Run and Little Falls but excluding Muddy Branch
and Watts Branch
bull Upper Potomac Direct including Little Monocacy amp Broad Run
The seven implementation plans (Table 12) provided the input data for the development of
this Strategy
Table 12 Watershed Groupings and Plans
Pre-Assessment
x x
x x
lower Potomac Direct (East of Seneca Creek not described in any other grouping)
Muddy Branch and Watts Branch x All other subwatersheds x
Patuxent (TriadelphiaBrighton Dam and Rocky
Gorge)
x
Great Seneca (including Clopper Lake)
Dry Seneca and Little Seneca
lower Monocacy
Upper Potomac Direct (West of Seneca Creek not described in any other grouping)
Trash Free Potomac
The Alice Ferguson Foundation founded the Trash Free Potomac Watershed Initiative (TFPWI)
in 2005 to reduce trash and increase awareness of trash issues in the watershed TFPWI actions
021611
Montgomery County Coordinated Implementation Strategy - DRAFT
include the Potomac River Watershed Trash Treaty Annual Potomac River Watershed Trash
Summit Annual Potomac River Watershed Cleanup market-based approaches such as the
Trash Free Potomac Facility Program and a Regional Anti-Litter Campaign (Alice Ferguson
Foundation 2011) The MS4 permit requires Montgomery County to meet the commitments of
Potomac River Watershed Treaty The permit specifically requires that Montgomery County
1 Support and implement regional strategies to reduce trash
2 Develop a work plan to implement a public outreach and education campaign
3 Establish baseline conditions of trash being discharged and develop a reduction strategy
and work plan for the Montgomery County portion of the Anacostia Watershed
4 Implement approved control measures in accordance with the trash reduction work
plan
5 Conduct public participation in development of trash reduction strategy
6 Submit progress annually
Public Outreach and Stewardship
The Countys MS4 Permit requires significant opportunities for public participation in achieving
TMDls watershed restoration and trash management The permit specifically requires the
County to prepare a work plan to implement a public outreach and education campaign The
County recognizes that a successful strategy will require a significant increase in effective and
coordinated public outreach and public stewardship The implementation plans and this
Strategy describe how DEP plans to implement public outreach and education campaigns with
specific performance goals and deadlines
021611
Montgomery County Coordinated Implementation Strategy - DRAFT
2 EXISTING CONDITIONS
Watershed health is variable throughout the County and typically well correlated with intensity
and age of urbanization More specifically watershed health typically declines with increasing
density and older age of development Many of Montgomery Countys older urban and
suburban areas were developed in an era when runoff from paved surfaces (roads parking lots
driveways) was directed to storm drains which conveyed untreated runoff directly to streams
This large volume of water caused massive erosion of the stream banks and destroyed habitat
Stormwater treatment using stormwater ponds to receive detain and filter runoff before it
flowed into streams was either inadequate or non-existent The Anacostia Rock Creek and
Cabin John Creek watersheds are examples where these conditions are common Modern
stormwater techniques known as environmental site design or ESD encourage the reduction
of runoff by infiltrating the water into the ground near its source
Watershed health improves in more rural areas of the County but even in these areas stream
degradation can occur stemming from large lot development and poor agricultural
management practices
The County has conducted comprehensive water quality and biological sampling for more than
a decade which provides a representative snapshot of existing watershed health as well as the
ability to track watershed health over time Figure 21 shows countywide watershed resource
conditions based on monitoring that was conducted from 2000-2008 The area inside the
beltway in the more urban core has lower water quality (fair to poor) while the area outside the
beltway tends to have better water quality (fair to good to excellent)
021611
---- -
-----
Montgomery County Coordinated Implementation Strategy - DRAFT
Watershed Resource Conditions Montgomery County Maryland
LEGEND z fbn
G 0middot1 - -~UlIS
- tI)Jogtf~
UJJOf Wrw Ftns
Splaquo1lII PnreltbOrI NtH SPAl
3D~~ennHI
[=jji=---~~-
Figure 21 County Watershed Resource Conditions
County Statistics
The Strategy will benefit from the fact that the majority of county residents own the property
they reside on (nearly 70) and thus have control over that property Also nearly 70 of the
residences are single unit homes Moreover the average household income is roughly $90000
making the likelihood of financial capability to install BMPs an appropriate assumption Both of
these statistics make advocacy of BMPs on residential properties an imperative for the Strategy
Montgomery Countys robust business economy was also considered in the Strategy
development Despite the current economic volatility Montgomery Countys business
community is still profitable and still maintaining and improving existing facilities Moreover
the construction of the inter-county-connector (ICC) through much of Montgomery County will
provide opportunities to install demonstration BMPs on newly developing properties for
replication throughout stakeholder groups Also the presence of communication industry
leaders (ie Discovery Channel) in the County creates unique stewardship education
partnership possibilities with businesses The Strategy will include these stakeholders
021611
Montgomery County Coordinated Implementation Strategy - DRAFT
involvement opportunities to best harness the power of Montgomery Countys healthy
business economy
The county includes a fairly even split of males and females The majority of residents nearly
50 fall between the ages of 25 and 55 Only 15 of the population is aged 60 and above In
addition the majority of Montgomery County residents indicate their preferred language as
English however Spanish translations of stakeholder involvement opportunities will be
required in select watersheds to accommodate the 13 of county residents that indicate their
preferred language as Spanish Other potential target groups for translation for stakeholder
involvement include the Asian community as 11 of the countys population is Asian (mostly
Korean and Vietnamese) Because of this the Strategy and implementation plans will take
multilingual requirements into consideration for signage and other educational tools as well
MS4 Permit Coverage
The Countys most recent NPDES MS4 stormwater permit only covers runoff from
developments within the County area The following areas are excluded from the Countys MS4
permit area shown in Figure 22
bull Cities of Gaithersburg Rockville and Takoma Park
bull Maryland National Capital Park and Planning Commission (MNCPPC) lands
bull Washington Sanitary Sewer Commission (WSSC) land
bull Federal and State government owned land and facilities
bull Rural zoning
021611 G
Montgomery County Coordinated Implementation Strategy - DRAFT
MS4 Permit Area Montgomery County Maryland
(-i Gaithersbur9 ~
M Ro ckville
TkD m Parilt -Jr MNC PPC Lnds
0 5 3
Feder 1 and SI PropertyM i KbnelefS
M 0 I 2 ~- Federal and Sta1e Roads
~ i s Rural Zon ing
Figure 22 Areas outside the Montgomery County MS4 Permit Area
Impervious Surfaces
As previously mentioned the Countys MS4 Permit requires treatment of an additional 20 of
impervious cover not currently receiving treatment to the MEP Table 21 presents a summary
of the countywide impervious cover totals along with breakdowns by major land cover type
These land covers will be the focus of much of the Countys targeted effort to treat the 20
target
021611
Montgomery County Coordinated Implementation Strategy - DRAFT
Table 2llmpervious Surface Summary
Description
Total County Area 324552 100
Total Area of 1m ervious Surface 35965 _ _-----shy 11
County Area Subject to Stormwater Permit (1) 138649 43
Imllervious Cover Subject to Stormwater Permit 2) ~==5119====18o2 == ==== Areas of Impervious Surface (3)
Road 13607 38
Building 13073 36
Parking 22
Sidewalk 1069 3
Recreation (4) 347 1 1 Exclusions include Certain zoning codes parklands forests municipalities with own stormwater management
programs state and federal properties and state and federal maintained roads 2 Percent of County Jurisdictional Area subject to the Stormwater Permit 3 Impervious area within each category within the total County area 4 Recreation imperviousness excludes swimming pools
Implementation Plan Guidance Document
The Implementation Plan Guidance Document (revised October 252010) provides a road map
for how the implementation plans were created The primary sections of the Guidance
Document and a short description of each are provided in Appendix A
The Guidance Document divides BMPs into five classes or codes shown below The Guidance
Document also provides a list of BMPs and which code they fall under which is provided in
Appendix B
Code 0 Pretreatment Practices
Code 1 Non-performing BMPs No runoff reduction and no long term pollutant removal
Code 2 Under-performing BMPs Limited runoff reduction and low pollutant removal
Code 3 Effective BMPs No runoff reduction but moderate to high pollutant removal
Code 4 ESO BMPs High runoff reduction and moderate to high pollutant removal
Impervious Cover Accounting and Tracking
Montgomery County has GIS data layers that contain all the stormwater BMPs in the County
and their drainage areas In order to determine the 20 target for impervious cover treatment
021611
Montgomery County Coordinated Implementation Strategy - DRAFT
to the MEP the County analyzed their existing impervious cover and their existing BMP
database to determine how much impervious cover is currently being treated to the MEP
Several methods were considered based on a determination of the MEP standard compared to
existing treatment methods According to MDE guidance to be considered MEP a BMP must
capture at least the Water Quality Volume (WQv) (the first inch of rainfall) or the CPv volume
(26 inches of rainfall) The final method used for determining which BMPs are MEP and the
amount of impervious surface not treated to the MEP was as follows
1 All BMPs that were installed after 2002 or are classified as Code 4 were considered MEP
2 An analysis of typical Code 3 stormwater ponds installed after 1986 was performed to
determine if this class of BMPs met the definition of IVIEP Based on that analysis Code
3 BMPs constructed after 1986 are considered MEP
3 All other classes of BMPs not specified above are not considered MEP and are eligible
for retrofit
Table 22 below shows the breakdown of the impervious acres treated by BMP codes and era
(shaded areas are BMP codes treated to the MEP)
Table 22 Acres of Impervious Cover Treated by BMP Code and Design Era
Design Era Post2002 1986-2002 Pre1986 Blank Total
CIJ tl 0 u Q
~ co
0 28 711 24 132 895
1 33 555 1391 367 2346
2 41 299 12 23 375
3 75 2482 1437 267 4261
4 20 459 482 40 1001
Totals 198 4506 3345 828 8877
IC Credit 100 Code 3amp 4 Code 4 Total Acres treated to
MEP 198 2942 482 40 3661
Assuming a total countywide impervious acreage of 25119 acres and an impervious acreage
treated to the MEP of 3661 as shown in Table 22 there are currently 21458 acres of
untreated impervious area Twenty percent of 21458 equates to 4292 acres of impervious
area that must be restored over the current permit cycle
021611
Montgomery County Coordinated Implementation Strategy - DRAFT
Pollutant Load Tracking
In addition to tracking impervious cover it is necessary to compute existing pollutant loads and
projected reductions in loads as a result of applying storm water controls and BMPs The Center
for Watershed Protections (CWP) Watershed Treatment Model (WTM) version 20 (CWP 2001)
was the tool selected to conduct this analysis and track load reductions across a range of
implementation strategies
The WTM uses a spreadsheet model to calculate annual pollutant loads and runoff volumes
The model also accounts for the benefits contributed by a full suite of stormwater treatment
practices and programs The first step in the model calculates existing pollutant loads by adding
primary and secondary source loads then subtracting reductions according to existing
management practices The second step applies future management practices by subtracting
these calculated reductions from the existing loads Appendix B of the Guidance Document
provides a detailed explanation of the assumptions and steps in the modeling process
For each watershed the WTM was run under existing conditions with existing BMPs to
determine a baseline pollutant load for targeted pollutants The baseline period for non-TMDL
parameters was based on 2002 Maryland Department of Planning land useland cover data
coupled with the Countys existing urban BMP database Pollutants targeted included bacteria
Total Phosphorus (TP) Total Nitrogen (TN) Total Suspended Solids (TSS) and Trash Next a
series of model runs was developed for analyzing the pollutant load reduction effect that
various restoration strategies would have based on assumed levels of implementation for the
various strategies Individual restoration strategies that were sequentially modeled included
the following
bull Completed and High Priority Projects - these include projects already completed or high
priority structural BMPs scheduled for retrofit in the FYll-FY16 Capital Improvements
Program (CIP)
bull Low Priority Projects - these includes FY11-FY16 CIP projects that for various reasons
are considered a lower priority
bull Other Potential Projects - these include other projects in existing inventories that were
not listed in the previous two categories For the Anacostia they include projects in
Anacostia Restoration Plan (ARP) prepared by the Army Corp of Engineers
bull Public ESD Retrofits - These include small scale ESD practices applied to County-owned
buildings streets and parking lots and rights of way Examples include rainwater
harvesting green roofs upland reforestation soil compost amendments rooftop
disconnection green street retrofits and converting drainage ditches to dry swales
021611
Montgomery County Coordinated Implementation Strategy - DRAFT
These are Code 4 structures This category also includes other structural BMP upgrades
to existing County BMPs which were designated as under-performing or nonshy
performing
bull Private ESD Retrofits - These projects include ESD on commercial property and
residential property and include green roofs rain gardens and permeable pavement
bull Riparian Reforestation - Focuses primarily on tree planting for riparian buffer
restoration
bull Stream Restoration - Includes the use of natural materials such as rocks logs and native
vegetation to reduce pressure on eroded banks prevent down-cutting of the
streambed and restore the natural meander patterns and slope profiles found in stable
reference streams
bull Programmatic Practices - This category deals with potential pollutant reduction that can
be attributed and quantified through MS4 stormwater pollution prevention
improvements and better housekeeping on County land and facilities Also includes any
pollutant reductions due to product substitution (eg nitrogen and phosphorus limits in
fertilizer) operational programs (eg recycling) and enforcement This category also
deals with reduced pollutants that can be attributed and quantified through MS4
stormwater education (eg lawn care) and outreach aimed at pollution prevention
better housekeeping and increased stewardship
The naming convention applied for the model runs was WTM 10 (ie baseline) WTM 20 (Le
completed and high priority low priority and other potential projects) WTM 30 (Le public
and private ESD) WTM 40 (ie riparian reforestation and stream restoration) and WTM 50
(ie programmatic) Model runs were developed sequentially to yield incremental increases in
load reduction by strategy In practice however strategies can be applied in combination and
out of sequence to achieve targeted outcomes and the most cost-effective solutions A
summary of the scenarios is provided in Table 23 below
021611
Montgomery County Coordinated Implementation Strategy - DRAFT
Table 23 Summary of Watershed Treatment Model (WTM) Scenarios
Implementation Phase Description
The WTM was run under existing conditions approach
WTM Baseline Conditions with the MDP year 2002 land useland cover data and
existing BMPs
WTM 20 Completed as of
2009j High Priorityj Low
Priority and Other Potential
Projects
The WTM was run with a series of future management
practices which were proposed projects from the
County inventory of restoration sites These practices
cover new ponds retrofits of existing BMPs and some
ESD practices from the proposed projects list
The Countys inventory for other project types that
include public properties eg libraries and parkingWTM 30 ESD Strategies and
lots public schools and open section roads available Other Structural BMPs
for ESD retrofits was reviewed as were areas for
private property ESD retrofits
This category includes any pollutant reduction or volume
reduction that can be attributed to specific stream
WTM 40 Habitat rehabilitation wetland restoration and or riparian
Restoration reforestation projects planned for construction in the
watershed for the permit cycle
WTM 50 MS4 Programmatic See description above
Practices
TMDL Calibration and Tracking
Where TMDLs existed for individual watersheds the WTM was run under existing conditions
with existing BMPs based on the year in which the data was collected for TMDL development
The baseline pollutant load was then compared and normalized to the MDE-determined
baseline MS4 load for the TMDL pollutant Any BMPs with approved dates after the year in
which the data was collected for TMDL development were not included in the baseline
calculation but rather were counted towards meeting the TMDL reduction target
Once the normalized model was established reductions achieved through programs and
practices were tracked using the WTM scenarios based on the percent load reduction from
baseline toward meeting the TMDL required WLA The normalized baseline and WLA target are
determined and specified in the relevant TMDL documents developed by M DE
021611
Montgomery County Coordinated Implementation Strategy - DRAFT
3 WATERSHED IMPLEMENTATION PLANS AND RESTORATION POTENTIAL
The watershed implementation plans and pre-assessments developed in conjunction with the
Strategy are driven by regulatory requirements facing each watershed Table 31 summarizes
the drivers by watershed
Table 31 Restoration Objectives -
W~tershedSubwater~hed - Trash
4 bull - I _ _ -
Patuxent
Anacostia
Rock Creek
Great Seneca
Cabin John Creek
lower Monocacy
Watts BranchMuddy Branch
Dry and little Seneca
lower Potomac Direct
Table 32 presents the more detailed and quantitative aspects of the TMDl requirements for
the MS4 portion within each watershed The Strategy has been developed to meet the MS4
permit area WLA compliance targets presented in Tables 32
In addition to the individual watershed requirements there is a Countywide requirement to
comply with the wasteload allocations associated with urban areas under the Chesapeake Bay
TMDl which applies to nutrients and sediment There is an interim target established for 2017
where reductions from baseline conditions of 9 12 and 20 respectively for TN TP and
TSS are to occur Then by 2020 full compliance is required which correspond to reductions
from baseline conditions of 18 34 and 37 respectively for TN TP and TSS
021611
Montgomery County Coordinated Implementation Strategy - DRAFT
Table 32 TMDl Summary by Impairment
Watershed
Cabin John Creek
Rock 2007 Enterococci 970 453669 18195 Creek
Anacostia 2007 Enterococci 860 247809 29978 River
Aoacostia 2008 TN 788 206312 38959 River
Anacostia 2008 TP 797 20953 3947 Ibsyr River
Triadelphia 2008 TP 580 438 Reservoir
Rocky Gorge 2008 TP 480 4268 3628 Reservoir
Clopper Lake 2002 TP 393
Anacostia 2007 TSS 850 7682 River
Triadelphia 2008 TSS Reservoir Clopper 2002 TSS 00 13 13
Lake
Lower 2009 TSS 380010 172 Monocacy
River
Anacostia 2010 Trash 1000 228683 Ibsyr River
Adapted from 2010 Status of Approved Stormwater Waste load Allocations for NPDES Regulated Stormwater Entities in Montgomery County April 27 2010 by Jeff White MDE
Potential to Reduce Stormwater Pollutant loads
Within each of the implementation plans an analysis was developed that explored the
restoration potential for that watershed Cost was not a limiting factor for the analysis but
rather assumptions were made based on feasibility of implementation rates and consideration
of conflicts with typical site conditions with respect to site use utilities land ownership etc
For example it was assumed that 40 of large County-owned parking lots would be available
for stormwater retrofitting These assumptions are necessary for planning purposes where
detailed site investigations have not occurred However some level of implementation is
021611
Montgomery County Coordinated Implementation Strategy - DRAFT
reasonable to assume In addition all identified high priority and low priority County projects
that have the potential to be constructed were assumed to be implemented
Implementation cost and effectiveness (in terms of pollutant load reduced) was also tracked
through the process of determining watershed restoration potential which enables the
costbenefit evaluation of various strategies for a target parameter (eg tons of sediment per
dollar spent or billion MPN of bacteria per dollar etc) For example by tracking cost and
effectiveness it is possible to evaluate the relative costbenefit of a strategy like ESD versus a
non-structural programmatic practice Moreover the comparison of these two strategies is
going to be different depending on what parameter is being considered eg ESD may be more
cost effective for nutrient reduction but less cost effective for bacterial load reduction
The tables in Appendix C help to illustrate this point Specifically a series of summary charts
and tables have been developed that illustrate the cost effectiveness of the range of strategies
considered by watershed with respect to pollutant load reduction The summaries reflect the
full restoration potential developed for each watershed
It is also useful to compare strategy effectiveness and range of opportunity across watersheds
To facilitate this a series of tables were compiled that groups all watersheds together and
considers watershed restoration potential by strategy These summary tables are presented in
Tables 33 through 310
For this analysis stream restoration was treated as a special modeling case (Table 39) because
it was not tracked as a strategy that receives credit for impervious cover treatment and because
it requires a different pollutant load reduction tracking method based on linear feet of
implementation and the existing stream resource condition (good fair or poor IBI scores
received different pollutant removal credit) Further details on stream restoration modeling
are presented in the individual implementation plans and the Guidance Document
Not all WTM scenarios were modeled for all watersheds For example if there were no
previously identified completed high priority low priority or other potential projects within a
watershed they would appear as zeros for that individual watershed in Tables 33 through 36
Also for non-TMDl watersheds such as Great Seneca and Muddy Branch and Watts Branch
subwatersheds the public and private property ESD riparian reforestation and MS4
programmatic practices scenarios were not modeled due to the lack of regulatory drivers that
define pollutant removal targets
021611
Montgomery County Coordinated Implementation Strategy - DRAFT
Table 33 Cost and benefit summary for completed projects (WTM 20)
Watershed Total ESD PrOjects Incremental reduction from baseline ()
i Cost Numberof Impervious
Cost
I Impervious Trash control added TN TP TSS Bacteria
(million $) projects bullbull (ac)
(total) (total)
Anacostia 95 25 167 7 3 4 4 1 4 4
Cabin John 00 0 0 0 0 02 02 03 03 1
Rock Creek 44 6 212 13 1 2 2 3 3 2 i
I Triadelphia 00 0 0 0 0 0 0 0 0 0
Rocky Gorge 00 0 0 0 0 0 01 0 0 0
Lower Monocacy 00 0 0 0 0 0 0 0 0 0
Clopper lake 00 0 0 0 0 0 0 0 0 0
Great Seneca bull 06 2 11 0 0 1 1 I 1 0 2
MuddyWatts 00 0 0 0 0 0 0 0 0 0
Indudes Clopper lake Project count does not include stream restoration Pollutants with a TMDL are highlighted
Table 34 Cost and benefit summary for high priority projects (WTM 20)
Watershed I
I
Total ESD Projects Incremental reduction from baseline ()
Cost
(million $)
i Numberof
projects bullbull
Impervious
control added
(ac)
ICost (total)
Impervious
(total) TN
I TP TSS I TrashBacteria
Anacostia 64 33 148 65 16 2 2 06 2 2
Cabin John 16 6 88 19 2 3 3 3 3 1
Rock Creek 89 14 373 13 1 2 3 3 3 4
Triadelphia 00 0 0 04 0 0 0 0 0 0
I Rocky Gorge 04 2 5 77 27 06 06 07 06 1
Lower Monocacy 00 0 0 0 0 0 0 0 0 0
Clopper lake 00 0 0 0 010 0 0 0 0 0 Great Seneca bull 183 24 789 6 08 19 19 20 0 24
MuddyWatts 44 16 211 8 1 6 6 6 0 6
Indudes Clopper lake bullbull Project count does not indude stream restoration Pollutants with a TMDL are highlighted
Table 35 Cost and benefit summary for low priority projects (WTM 20)
I Watershed Total ESO Projects Incremental reduction from baseline ()
Numberof Impervious ICost 1m ~ i Cost Impervious
I (million $) projects bullbull
control added (total) (total)
TN TP Bacteria Trash
(ac)
I Anacostia 51 16 188 61 8 2 2 07 2 3
Cabin John 16 8 10 98 78 02 02 02 02 03
I Rock Creek 88 24 657 7 1 4 4 6 5 7
Triadelphia 040 1 20 100 100 05 05 06 05 1
Rocky Gorge 09 2 458 100 100 84 82 83 82 116 i
I Lower Monocacy 0 0 0 0 0 0 0 0 0 0 I Clopper lake 0 0 0 0 0 0 0 0 0 0
I Great Seneca bull 66 16 87 41 15 4 4 4 010 4
I MuddyWatts 20 6 26 84 33 0 0 1 0 0
Includes Clopper Lake Project count does not include stream restoration Pollutants wth a TMDL are highlighted
021611
Montgomery County Coordinated Implementation Strategy - DRAFT
Table 36 Cost and benefit summary for other potential projects (WTM 20)
I Watershed Total ESO Projects Incremental reduction from baseline ()
ICost Impervious I Cost
I I Trash INumber of
control added Impervious
TN TP TSS Bacteria (million $) projects bullbull
(ac) (total) (total)
i i
Anacostia 2492 497 2222 73 62 23 8 26 301
Cabin John 00840 1 5 0 010 01 01 01 01 01
Rock Creek 20 4 201 0 0 12 12 19 15 21
Triadelphia 00 0 0 010 0 00 00 00 00 00
Rocky Gorge 20 2 0 010 0 00 00 00 00 00
lower Monocacy 00 0 0 0( 0 00 00 00 00 0010
Clopper Lake 00 0 0 0 0 00 00 00 00 0010
Great Seneca bull 02 S S3 0 0 23 23 27 00 27
MuddyWatts 00 0 0 0 0( 00 00 00 00 0010
bull Includes Clopper Lake bullbull Project count does not include stream restoration Pollutants with a TMDL are highlighted
Table 37 Cost and benefit summary for ESO projects (WTM 30)
Watershed
I
Cost (million $) Impervious
control added
(ac)
Incremental reduction from baseline ()
ESDfor i ESO for private
public
property property
TN TP TSS Bacteria Trash
Anacostia 2378 21296 1813 20 21 7 22 27
Cabin John 878 10307 876 22 23 25 24 28
Rock Creek 2471 341 2427 30 30 33 32 35
Triadelphia 41 47 36 10 1010 11 11 20
Rocky Gorge 312 19 28S 26 27 32 30 46
lower Monocacy 86 29 53 14 15 15 15 010
Clopper lake 08 051 21 14 14 15 0 14
Great Seneca bull 00 0 0 010 0 0( 0( 010
MuddyWatts 00 a 0 0 01 010 0 0
bull Includes Clopper lake Pollutants with a TMDL are highlighted
Table 3B Cost and benefit summary for riparian reforestation (WTM 40)
IWatershed Cost (million $) Impervious
Incremental reduction from baseline ()
control added Habitat restoration (ac) TN TP TSS Bacteria Trash
Anacostia 1 6 0 0 0 01 02
Cabin John 777 39 1 2 lili
3
Rock Creek 24 119 2 2 2 5
Triadelphia 010 1 01 02 01 04 03
Rocky Gorge 25 12 1 2 2 3 8
lower Monocacy 11 S 3 3 3 4 0
Clopper Lake 023 2 4 4 2 010 4
Great Seneca bull 0 a 010 010 0 010 0
MuddyWatts 0 0 010 0 0 0 0
bull Includes Clopper lake Pallutonts with a TMDL are highlighted
021611
Montgomery County Coordinated Implementation Strategy - DRAFT
Table 57 Cost and benefit summary for stream restoration (WTM 40)
Watershed Stream Restoration Incremental reduction from baseline ()
Number of Impervious control
Cost (million $) added(ac) TN TP TSS Bacteria Trash projects
Anacostia 937 200 0 42 56 326 0 0
Cabinlohn 162 15 0 17 9 80 0 0
Rock Creek 201 30 a 9 710 100 0 0
Triadelphia 00 0 0 0 0 0 010 0
Rocky Gorge 191 18 I 0 10 7 36 0 O lower Monocacy 73 nla 0 7 10 32 010 0
Clopper Lake 00 a 0 0 0 0 0 0
Great Seneca It I 259 33 0 19 8 16 0 0
MuddyWatts 242 45 0 16 7 13 0 0
Includes Clopper Lake Pollutants with a TMDL are highlighted
Table 58 Cost and benefit summary for M54programmatlc practices (WTM 50)
Watershed Cost (million $) Incremental reduction from baseline ()
Programmatic
practices - M54
Impervious control
added (ac) TN TP TSS Bacteria Trash
Anacostia 36 0 9 9 10 8 82
Cabin John 047 0 15 14 0 10 0
Rockereek 12 0 11 11 0 7 0
Triadelphia 00056 a 23 3 0 0 0
Rocky Gorge 009 0 38 8 03 5 2
lower Monocacy 007 0 0 0 19 0 0
Clopper Lake 0Q1 0 61 30
~=r 0
Great Seneca 10 0 0 0 0 0Y0 0 0
MuddyWatts 0 0 0 0 0 0 0
bull Includes Clopper Lake Pollutants with a TMDL are highlighted
021611
Montgomery County Coordinated Implementation Strategy - DRAFT
4 COORDINATED IMPLEMENTATION STRATEGY
The Strategy has multiple objectives to accomplish whereby a challenging balance between
strategies and timeframe is required There isnt necessarily a correct answer in the process
but rather an optimized result that addresses an agreed upon suite of priorities The Strategy
presented here was primarily driven by known and established regulatory timeframes and
compliance endpoints Meeting these endpoints using the more cost effective approaches was
also given priority After this consideration was given to other known and important
approaches that stakeholders and the County have an interest in pursuing Specifically the
following compliance dates and objectives were conSidered in developing the Strategy over the
long-term (Table 41)
Table 41 Compliance Targets for Countywide Coordinated Implementation Strategy
Target Date
2015
2017
2020
Compliance Target
Meeting 20 impervious cover treatment requirement
within the MS4 Permit cycle
Meet the interim dates and targets for the Chesapeake
Bay TMDL which include specific regulated urban area
reductions by 2017 for nutrients and sediment (based
on Maryland Department of the Environments
Watershed Implementation Plan)
Meet the full compliance and targets for the
Chesapeake BayTIVIDL which include specific regulated
urban area reduction by 2020 for nutrients and
sediment (based on Maryland Department of the
Environments Watershed Implementation Plan)
Metric
~4300 acres of
Impervious Cover
9 12 and 20
respectively for TN TP
and TSS reductions
from baseline
conditions
18 34 and 37
respectively for TN TP
and TSS reductions
from baseline
conditions
2025
2030
Meet additional impervious cover treatment targets
associated with next MS4 Permit cycle (assumes
another 20 target)
Meet additional impervious cover treatment targets
associated with next MS4 Permit cycle (assumes
another 20 target)
Out year compliance with other watershed TMDLs
~3400 acres of
Impervious Cover (20
of impervious
remaining after 2015)
~2750 acres of
Impervious Cover (20
of impervious
remaining after 2020)
100 compliance with
MS4 Permit Area WLAs
021611
Montgomery County Coordinated Implementation Strategy - DRAFT
To meet the compliance targets outlined in Table 41 the following priorities were generally
followed
bull 100 implementation of completed high and low priority County projects in first five
years (by 2015)
bull Greater ESD focus in urban (as opposed to suburban and rural) watersheds initially Goal
for ESD in these watersheds on pUblic property in first five years is 10 and on private
property is 10 The level of implementation was largely driven by the 20 Countywide
impervious goal
bull 100 of Public Outreach Potential for all TIVIDl watersheds in first five years This was
pursued to address trash nutrient and bacteria loading which rely strongly on effective
outreach programs to modify behaviors
bull Generally limited strategies to the top four most cost effective per watershed
bull Habitat restoration (stream restoration and buffer reforestation) not pursued as priority
until after first five year period These programs emphasize greater pollutant reduction
efficiency rather than impervious cover treatment which is the primary focus for the
first permit cycle
The Strategy was informed by the individual watershed implementation plans for seven
watersheds which included the Clopper lake and Patuxent subwatersheds Therefore in order
to develop countywide estimates for pollutant load reduction (as is required by the Chesapeake
Bay TMDl) watershed area weighting was applied The process for developing the Countywide
strategy and individual watershed implementation plans was woven together Once the
restoration potential was determined from the individual plans the strategy and schedule was
compiled using the restoration potentials and the drivers listed above The final restoration
cost and schedule was then placed in the implementation plans
It is also worth noting that the high and low priority projects along with the other potential
projects strategies represent a static or fixed number of projects that have been identified by
the County For this analysiS this list of practices is not replenished and therefore once all
opportunities have been implemented other strategies are pursued In reality the County will
continue to develop and update its list of specific project opportunities and have these
available for implementation in future years
The output from this effort is presented in a series of tables ordered by target date in Appendix
D In addition Table 42 provides an overall summary of pollutant load reduction tracking
versus time Through inspection of Table 42 it can be seen that the Strategy meets the
021611
Montgomery County Coordinated Implementation Strategy - DRAFT
impervious cover treatment targets under the current MS4 permit (as well as projected targets
for 2020 and 2025 assuming a continued 20 treatment requirement) interim and final
Chesapeake Bay nutrient and sediment reduction targets by 2017 and 2020 respectively and
out year MS4 permit area WLA compliance for the majority of pollutants Exceptions include
meeting the bacteria WLA load reductions required for the Anacostia and Rock Creek
021611
Montgomery County Coordinated Implementation Strategy - DRAFT
Table 42 Projection by Phase for Watersheds and Pollutants PermitTMDL Targets
Watershed Fiscal Year 2015 2017 2020 2025 2030 2017 2020
Impervious Treated (acres) 1421 2393 3364 4272 4544
ESD ( Impervious) 26 44 61 69A 71
Cost (Million $) 160 307 486 732 820
E5D( Cost) 45 62 71 78 78
Anacostia Nitrogen 25 39 68 89A l00A 818 82
Phosphorus 27 42 77 100 100 812 81
i Sediment 47 72 100 l00A) l00A 875 88
Bacteria 21 33 46 59A 64 879 88
Trash 41 65 89 l00A) 100
Impervious Treated (acres) 1541 1961 2381 3625 3989
ESD ( Impervious) 17 28 36 57A 61
Cost (Million $) 87 172 262 566 658
ESD ( Cost) 7(JA 79 79A 89A 9(JA
Rock Creek Nitrogen 24 30 38 55 61
Phosphorus 25 3(JA 38 54 GfJA)
Sediment 38 50 92 l00A 100
Bacteria 21 27 33 5(JA 55 96(JA 96
Trash 17 24 31 5(JA) 55
Impervious Treated (acres) 187 380 570 1018 1018
ESD ( Impervious) 52 72 78 87A 87A
Cost (Million $) 23 65 114 215 219
ESD ( Cost) 92 91 86 90 88
Cabin John Nitrogen 21 27A 39A 55 58 Phosphorus 2(JA 26 35 49 51
Sediment 6 17 GfJA 91 100
Bacteria 16 22 27 4(JA) 40 31 31
Trash 6 12 19 34 34
Impervious Treated (acres) 237 237 237 237 237
ESD ( Impervious) 4 4 4 4 4
Cost (Million $) 6 8 19 25 31
ESD ( Cost) 32 27A 11 8 7
Muddy Watts Nitrogen 6 7 15 18 22
Phosphorus 6 7 10 12 13 Sediment 7 8 14 17 2(JA
Bacteria 0 (JA 0 (JA 0 i Trash 6 6 6 6 6
bull Impervious Treated (acres) 901 921 941 941 941 ESD ( Impervious) 2 2 2 2 2
Cost (Million $) 26 48 SO 51 52 ESD ( Cost) 15 8 8 8 8
Great Seneca Nitrogen 24 41 43 44 45
Phosphorus 24 32 34 34 34
i Sediment 26 41 43 44 44
I Bacteria (JA) 0 0 0 (JA
Trash 31 32 33 33 33
021611
Montgomery County Coordinated Implementation Strategy - DRAFT
Pe rmitTMDL Targets
Watershed Fiscal Year 2015 2017 2020 2025 2030 2017 2020
Clopper
Impervious Treated (acres) 0 6 12 22 22
ESD ( Impervious) 0 86 86 92 92
Cost (Million $) 0 0 1 2 2
ESD ( Cost) 0 72 73 84 84
Nitrogen 61 67 72 79 79
Phosphorus 30 36 41 48 48 45 45
Sediment 0 5 10 17 17
Bacteria 0 0 0 0 0
Trash 0 6 11 18 18
Lower Monocacy
Impervious Treated (acres) 1 16 32 58 58
ESD ( Impervious) 100 85 84 91 91
Cost (Million $) 0 4 11 18 20
ESD ( Cost) 100 85 54 63 58
Nitrogen 0 5 14 22 24
Phosphorus 0 5 16 26 28
Sediment 0 5 46 61 69 608 61
Bacteria 0 6 12 19 19
Trash 0 0 0 0 0
Rocky Gorge
Impervious Treated (acres) 11 88 165 307 307
ESD ( Impervious) 64 89 90 95 95
Cost (Million $) 3 17 40 70 75
ESD ( Cost) 55 82 64 73 68
Nitrogen 47 55 6710 82 85
Phosphorus 17 25 36 52 53 15 15
Sediment 10 19 45 7(J1o 79
Bacteria 14 23 32 47 47
Trash 15 30 46 68 68
Triadelphia
Impervious Treated (acres) 3 12 20 38 38
ESD ( Impervious) 100 98 97 99 99
Cost (Million $) 1 3 5 9 9
ESD ( Cost) 99 98 98 99 99
Nitrogen 24 27 29 34 34
Phosphorus 4 7 9 14 14 15 15
Sediment 1 4 6 12 12
Bacteria 1 4 6 12 12
Trash 2 6 11 21 21
Countywide
Impervious Treated (acres) 4302 6014 7722 10518 11154 6008 7723
ESD ( Impervious) 18 34 47 6(J1o 63
Cost (Million $) 305 622 987 1687 1884
ESD ( Cost) 53 66 7(J1o 8(J1o 80
Nitrogen 18 25 36 46 51 9 2(J1o
Phosphorus 17 23 34 44 46 12 34
Sediment 23 34 54 6(J1o 62 20 37
Bacteria 11 15 20 28 30
Trash 18 26 33 41 42
Assumptio~s
1 Does no~ includerepeated Outreach and Education costs beyond FY2015
2 Does not include ~n inflation multiplier
021611
Montgomery County Coordinated Implementation Strategy - DRAFT
Summary of Individual Implementation Plans
A summary of the general considerations and prioritization for each watershed implementation
plan is provided below
Anacostia - For the first permit cycle (through 2015) a priority was placed on full
implementation of completed high and low priority projects Next implementation of a third
of the other potential projects was targeted as a large number of these were identified in
conjunction with the USACEs Anacostia Watershed Restoration Plan efforts ESD was
emphasized on both public (10) and private property (10) Finally outreach (25) and
stream restoration (12) are targeted for pollutant load reduction but are not credited towards
impervious cover credit In future permit cycles the remainder of the other potential projects
are targeted along with ESD and a limited amount of riparian reforestation for impervious cover
and pollutant load reduction Outreach and stream restoration are significant strategies
pursued for load reduction benefits Nutrient and sediment MS4 permit area WLAs are met by
2030 but bacteria load reduction does not meet MS4 permit area WLA compliance The
remaining bacteria reduction is believed to be associated with urban wildlife sources Unless
intense urban wildlife management practices are implemented this remaining load reduction
will not be possible
Rock Creek- For the first permit cycle (through 2015) a priority was placed on full
implementation of complete high and low priority projects Next 25 implementation of
other potential projects was targeted ESD was emphasized on both public (10) and private
property (10) with private property implementation being linked to Rainscapes Program
success Finally outreach (100) and stream restoration (22) are targeted for pollutant load
reduction but are not credited towards impervious cover credit In future permit cycles the
remainder of the other potential projects are targeted along with ESD and riparian
reforestation for impervious cover and pollutant load reduction Stream restoration is a
significant strategy pursued for load reduction benefits The bacterial load reduction does not
meet MS4 permit area WLA compliance However the remaining bacterial load is believed to
be associated with urban wildlife sources Unless intense urban wildlife management practices
are implemented this remaining load reduction will not be possible
Cabin John Creek - Similar to the other two more urban watersheds in the County during the
first permit cycle (through 2015) a priority was placed on full implementation of complete high
and low priority projects Fewer opportunities exist overall compared to the Anacostia and Rock
Creek Next 25 implementation of other potential projects was targeted ESD was
emphasized on both public (10) and private property (10) Finally outreach (100) was
021611
Montgomery County Coordinated Implementation Strategy - DRAFT
targeted for pollutant load reduction but not credited towards impervious cover credit No
riparian reforestation or stream restoration was targeted due to limited or no opportunities In
future permit cycles the remainder of the other potential projects are targeted along with ESD
and some riparian reforestation for impervious cover and pollutant load reduction The
bacteria load reduction meets MS4 permit area WLA compliance by 2025
Muddy BranchWatts Branch - During the first permit cycle (through 2015) a priority was
placed on full implementation of complete high and low priority projects Fewer opportunities
exist overall compared to the Anacostia and Rock Creek Watersheds No other strategies were
pursued as there are no existing TMDLs in the Muddy BranchWatts Branch subwatersheds In
future permit cycles previously identified stream restoration projects are implemented for
pollutant load reduction
Great Seneca Creek - This watershed implementation plan is unique in that it includes the small
Clopper Lake subwatershed which has a TMDL for phosphorus Even with the TMDL there are
limited identified opportunities to pursue in the Clopper Lake subwatershed in part due to the
limited area of the subwatershed within the County MS4 permit area During the first permit
cycle (through 2015) a priority was placed on full implementation of complete high and low
priority projects within Great Seneca Creek subwatershed No opportunities exist for these
strategies in Clopper Lake However full outreach was applied in Clopper Lake in the first
permit cycle In future years other potential projects ESD on public and private property and a
small amount of riparian reforestation (in Clopper Lake) is pursued The Clopper Lake WLA for
phosphorus within the MS4 permit area is met
Patuxent - During the first permit cycle through 2015 a priority was placed on full
implementation of complete high and low priority projects Far fewer opportunities exist
overall compared to the Anacostia and Rock Creek A limited amount of ESD on private land
and stream restoration was pursued Finally outreach (100) was targeted for pollutant load
reduction (primarily nutrients) but not credited towards impervious cover credit No riparian
reforestation was targeted within the MS4 Permit area due to cost effectiveness in the Rocky
Gorge subwatershed and limited opportunities in the Triadelphia subwatershed In future
permit cycles ESD on private and public land is pursued more substantially as is stream
restoration A limited amount of riparian reforestation achieves some impervious cover and
pollutant load reduction The Rocky Gorge phosphorus WLA within the MS4 permit area is met
easily and the Tridelphia phosphorus WLA is also met but with a longer timeframe needed for
compliance
021611
Montgomery County Coordinated Implementation Strategy - DRAFT
Lower Monocacy Creek -lower Monocacy Creek is the most rural watershed in the County and
has the least amount of area subject to the County MS4 permit In addition there are no preshy
identified restoration projects within the watershed Therefore during the first permit cycle
(through 2015) only a very small amount (5) of private property ESD is pursued It is not until
the second permit cycle that more focus is placed on private and public ESD as well as stream
restoration and programmatic strategies such as street sweeping to target sediment loads
associated with the TM Dl In future permit cycles stream restoration is pursued for pollutant
load reduction The sediment WlA within the MS4 permit area is projected to be met around
2025
Countywide - The Countywide effort was driven by impervious cover treatment targets and
Chesapeake Bay TMDl2017 and 2020 reduction targets associated with sediment and nutrients
for urban MS4s For impervious cover it was assumed that a 20 target would be required for
each five-year permit cycle The Bay TMDl targets for urban MS4 areas were easily met for all
pollutants in 2017 and easily met for nitrogen and sediment but more difficult to meet for
phosphorus in 2020
Public Outreach and Stewardship
The County recognizes and is committed to the increasingly important role that public outreach
and stewardship will play if improved water quality conditions are going to be achieved
countywide While the County currently has a very active and layered outreach program the
model requires changes that will result in broader stakeholder groups serving as the leaders
and primary champions for clean water in their communities This includes greater participation
from minority and faith-based groups business consortiums schools neighborhood
associations and civic groups Additionally the new model requires revisiting current
initiatives carried out by the various County agencies to look for better and more efficient ways
to communicate messages cross-train and create synergies that result in greater engagement
greater awareness and sustained changes in behavior
Within each implementation plan specific suggestions for outreach and education
opportunities are identified In addition Appendix E of this Strategy contains practice sheets
which highlight targeted restoration activities for the County to develop and refine A total of
eight practices have been identified that can be adopted countywide or in more targeted
watershed areas where there are specific water quality issues to address Many of the
practices build upon existing County programs but require a much broader reach to new
partner groups Program start up costs are suggested and were used to for cost estimates
associated with Countywide strategy The highlighted practices include
021611
Montgomery County Coordinated Implementation Strategy - DRAFT
bull Pet Waste Pickup Education and Outreach Campaign
bull Lawn Stewardship Education and Outreach Campaign
bull Anti-littering Education and Outreach Campaign
bull Innovative Stormwater Management Awareness Campaign
bull Stream Stewards Education and Outreach Campaign
bull Riparian Reforestation Education and Outreach Campaign
bull Roof Runoff Reduction Education and Outreach Campaign
bull Parking Lot Recharge Value Education and Outreach Campaign
Start up costs by practice along with an overall five year cost estimate are provided in Table
43 Start up timeframes are assumed to be up to 18 months
Table 43 Outreach Start Up and 5-Year Cost Projections
Practice Practice Start Up Cost
Pet Waste Pickup $240500
Lawn Stewardship $301 600
Anti-Littering $175050
Stormwater Management Improvements Awareness $50450
Stream Stewards $74825
Riparian Reforestation $30575
Roof Runoff Reduction $101400
Parking Lot Recharge Value $41500
Estimated Start Up Total $744900
5-Year Outreach Budget Projection $2650000
These eight practice sheets provide specific costs and timelines for implementation They also
provide suggestions for measuring program success These practice sheets along with the
specific recommendations in the implementation plans make up the Public Outreach and
Education Campaign
Trash Reduction
Most of the implementation plans have to address trash loadings to meet requirements of the
Potomac Trash Treaty that is referenced in the County1s MS4 Permit In addition the Anacostia
Trash TMDL has recently been accepted by MDE and the EPA According to the Anacostia
021611
Montgomery County Coordinated Implementation Strategy - DRAFT
TMDl there is reasonable assurance that the goals of the Treaty and TMDl can be met with
proper watershed planning implementing pollution-reduction BMPs and using strong political
and financial mechanisms
Currently the County has a number of activities which target trash reduction They include the
following
bull Adopt-a-Road Program through DOT which focuses on public awareness and involvement in trash management There are 205 participants who adopted road segments and agreed to six major road cleanups per year
bull Storm Drain Marking through DOT bull Support for illegal dumping enforcement outreach and research and monitoring bull Partnership with DOT to conduct street sweeping covering about 2500 curb miles and
occurring once a year
bull Partnership with the Park Police to monitor illegal dumping which combined enforces 300-400 actions a year
bull Non-residential and residential recycling programs through Solid Waste Services (SWS) bull Transit stop trash management program at 600 bus stops countywide supported by DOT
Transit Services
In addition to continuing these efforts a number of trash good-housekeeping efforts have been
proposed as part of this Strategy A detailed description of the quantitative methods and
strategies applied can be found in Appendix E of the Guidance Document In general the
following six trash-reduction strategies are recommended
1 Significantly increase funding for trash reduction programs 2 Create and enhance regional partnerships and coordination among businesses
environmental groups individual citizens and government at all levels and in all jurisdictions
3 Improve peoples awareness knowledge and behavior relating to littering and illegal dumping
4 Promote the greater introduction and use of effective trash-reduction technologies and approaches
5 Improve enactment and enforcement of laws to reduce trash 6 Increase trash monitoring-related data collection generation and dissemination efforts
The Anacostia watershed implementation plan provides an outline of the actions that will be
taken through the first permit cycle to reduce trash The range of programs and practices
specially aimed at reducing trash inputs to roads and streams that will be targeted include
reduce reuse and recycle campaigns littering and illegal dumping enforcement stream
cleanups and street sweeping These measures are in addition to any trash trapped and
021611
Montgomery County Coordinated Implementation Strategy - DRAFT
removed by structural practices which are computed using the WTM The plan shows that the
trash TMDl can be met by 2025 at a cost of 732 million dollars
Adaptive Management Monitoring and Reporting
Sound implementation strategies require assessment and effective adaptation to respond to
new information changing conditions new technologies and lessons learned This will be the
basis of the plan that will be used when benchmarks are not met and the projected funding is
inadequate
Adaptive management requires monitoring of a variety of measures that can be used to
determine whether progress is being made towards meeting the Countywide water quality
objectives Ultimately it is the instream water quality and the loading limits with respect to the
TMDls that determine the success of implementation however there are many interim
measures that can also be correlated to success which are worthwhile pursuing
Surface water monitoring can be an expensive and time consuming undertaking Montgomery
County is fortunate to have an extensive Countywide stream monitoring network that can serve
as a foundation for providing spatial and temporal data to indicate stream health The Countys
MS4 Permit also outlines the required assessment of controls which includes chemical
biological and physical monitoring Specifically the permit calls for the County to continue
their watershed restoration monitoring of the lower Paint Branch subwatershed and physical
monitoring ofthe Clarksburg Special Protection area In addition to the existing monitoring
network the County will continue tracking and data reporting associated with levels of
implementation (eg acres of impervious cover treated areas of buffer planted miles of
stream restored miles of streets swept) For measuring effectiveness of outreach and
stewardship efforts other types of monitoring and reporting are planned that include before
and after attitude surveys frequency of website visits and information requests
For many restoration strategies it may be difficult to tease out their individual effectiveness in
terms of pollutant load reductions but collectively the monitoring that occurs should provide
adequate insight into the overall effectiveness of a layered implementation strategy
In addition to the monitoring and assessment the County will be reporting results on an annual
basis as part of their NPDES MS4 Permit annual report The MS4 Permit requires annual
reporting of the following
021611
Montgomery County Coordinated Implementation Strategy - DRAFT
bull The status of implementing the components of the stormwater management program
that are established as permit conditions
bull A narrative summary describing the results and analyses of data including monitoring
data that is accumulated throughout the reporting year
bull Expenditures for the reporting period and the proposed budget for the upcoming year
bull A summary describing the number and nature of enforcement actions inspections and
public education programs
bull The identification of water quality improvements and documentation of progress
toward meeting applicable WLAs developed under EPA approved TMDLs and
bull The identification of any proposed changes to the Countys program when WLAs are not
being met
The County will build upon annual reporting that has historically occurred to meet permit
requirements and will supplement this reporting with tracking table summaries that quantify
implementation activities for the range of strategies pursued during that year and the
associated treatment (eg impervious cover treated pollutant load reduced education and
outreach partners established etc) Cost will also be tracked in association with rates of
implementation This level of performance will then be compared with countywide strategy
targets (eg progress towards meeting WLAs) associated with key performance dates such as
those presented in Table 41 The level of progress achieved by the County will then feed into
the adaptive management approach described above
Organization Needs to Implement Strategy
Montgomery County DEP staff possesses substantial expertise and institutional knowledge that
yields many positive outcomes and efficient processes under the current pace of restoration
and permit compliance activities Under this strategy however the pace of implementation is
required to significantly increase Based on an increase in the level of implementation it is
reasonable to assume that additional capacity may be needed to provide sufficient oversight
and management of all the projects
Another critical element of this strategy is the recognition and commitment to pursuing
outreach initiatives that build community capacity by targeting new partner groups that
provide the necessary leadership oversight and sustained effort to change behaviors and
foster stewardship The County currently carries out many well established and managed
outreach programs but it may require additional focus across County agencies and
departments for these partnerships to become established and thrive
021611 G
Montgomery County Coordinated Implementation Strategy - DRAFT
Through the implementation process and the monitoring and reporting that is required large
amounts of data will be generated Technological advances happen so rapidly in this day and
age it will be important for the County to stay current with technology and methods so that
more efficient and cost-effective data management and reporting will be possible The County
currently relies on a detailed and sophisticated GIS to spatially locate projects and manage
tables of data related to projects The growth and development of this spatial database will be
a critical component of the reporting and tracking capability of the County These databases
generate the input data that are used to measure progress towards baseline loading targets
Regular review and upkeep of the data as well as routine summarization of progress (annually
at a minimum) will likely require additional dedication of staff This is especially the case during
periods where the implementation rate of structural practices in the ground is accelerated
021611
Montgomery County Coordinated Implementation Strategy - DRAFT
Appendix C - Restoration Potential by Watershed
021611
c-
04 03 02 01
a
_ Nitrogen Load Reduction
--shy TMDL WLA Target
_Cost
MONTGOMERY COUNTY URBAN WATERSHEDS POLLUTANTS _Bk)~Ibilats ~1~ l~ fjfsi --
Rank
1
2
3
4
5
6
7
8
9
10
11
Restoration Strategy TN reduction
Ibsyr
Pet Waste Education 15169
Retrofit of Underperforming BMPs 1769
Stream Restoration 72423
Completed Projects ~43 High Priority Projects 3260
Other Potential Projects 43276
Habitat Restoration 224
Public Property ESD Retrofits 18270
Priority Neighborhoods ESD Retrofits 9271
Private Non-residential ESD Retrofits 5594
Street Sweeping -
Incremental Cost Unit Cost
Million $ IbsMillion $ 088 17193
120 1475
9304 778
948 701
635 513
25430 170
141 158
23655 77
13278 70
8018 70
124 -
Qj c
Qj
nI CXI
o -f-
1 09 08 07 06 05
$900 $800 $700
~ $600 c $500 ~ $400 $300 0 u $200 $100
$shy
~~mf il_~IJrt~
MONTGOMERY COUNTY URBAN WATERSHEDS POLLUTANTS ItfiQ14lbilJts i~5 [i
1 $900 Qj
09 $8005 iii en 08 $700
~co 07 $600 co - til
06 $500 ~ 05- $400 ~ 04 en$300 003 u $20002
en $100I 01 o 0 $shys Q en o
s Q
Phosphorus Load Reduction
--- TMDL WLA Target
__Cost
I Rank I
1
2
3
4
5
6
7
8
9
Restoration Strategy
Pet Waste Education
Retrofit of Underperforming BMPs
Stream Restoration
Completed Projects
High Priority Projects
Habitat Restoration
Other Potential Projects
Public Property ESD Retrofits
Priority Neighborhoods ESD Retrofits
10 I Private Non-residential ESD Retrofits
11 Street Sweeping
TP reduction Incremental Cost Unit Cost
Ibsyr Million $ IbsMillion $ 1979 088 2243
247 120 206
13097 9304 141
915 948 96
451 635 71
37 141 26
6067 25430 24
2546 23655 11
1294 13278 10
781 8018 10
- 124 -
MONTGOMERY COUNTY URBAN WATERSHEDS POLLUTANTS IItQjQhabillt$middot
Cii 5 Cii 11 It CD
6 ~ r o ~ s
0 ltIIa r ltII e c ltII III
1 09 08 07 06 05 04 03 02 01
0
$900
$800 $700
v$600 r
0 $500 == $400 $300 11
0 u $200 $100
$shy
_ Sediment load Reduction
--- TMDl WlA Target
__Cost
Rank Restoration Strategy
Sediment reduction
Incremental Cost
Unit Cost
tonsyr Million $ tonsMillion $ 1 Street Sweeping 800 124 645
2 Stream Restoration 25057 9304 269
3 Retrofit of Underperforming BMPs 25 120 21
4 Completed Projects 97 948 10
5 High Priority Projects 47 635 7
6 Other Potential Projects 660 25430 3
7 I Public Property ESD Retrofits 272 23655 1
8 Priority Neighborhoods ESD Retrofits 139 13278 1
9 Private Non-residential ESD Retrofits 84 8018 1
10 Habitat Restoration 2 141 1
11 Pet Waste Education - 088 -
C-3
MONTGOMERY COUNTY URBAN WATERSHEDS POLLUTANTS
-QI5 5i ~
1 09 08 07 06 05 04 03 02 01
0
$900
$800
$700
$600 ~ 0
$500 == $400 $300 11
0 u $200
$100
$shy
--shy TMDL WLA Target
___ Cost
Rank Restoration Strategy
Enterrococci reduction
Incremental Cost
Unit Cost
Billion MPNyr Million $ Billion MPN Million $
1 Pet Waste Education 19643 088 22263
2 Retrofit of Underperforming BMPs 2781 120 2318
3 Completed Projects 10441 948 1101
4 High Priority Projects 5120 635 806
5 Other Potential Projects 69895 25430 275
6 Riparian Reforestation 310 141 219
7 Public Property ESD Retrofits 29025 23655 123
8 Priority Neighborhoods ESD Retrofits 14777 13278 111
9 Private Non-residential ESD Retrofits 8917 8018 111
10 Stream Restoration - 9304 -
11 Street Sweeping - 124 I -
~ I~~~i MONTGOMERY COUNTY URBAN WATERSHEDS POLLUTANTS 1tI2~mL ~ I~I
~$ I -~-- I
100 90 80 70 60 50 40 30 20 10
0
$900 $800 $700 $600 $500 $400 $300 $200 $100 $shy
vi c
~ 5 11 0 u
Implementation Phase
Potential Trash Incremental Unit Cost
I
Rank Restoration Strategy Reduction Cost
Ibsyear Million $ IbsMillion $ 1 Recycling Education and Investigations 51654 02 238837
2 Plastic Bag Ban and Misc Enforcement 63546 13 48882
3 Anti-litter Campaign Education 23J61 09 26930
4 Retrofit of Underperforming BMPs 1144 12 954
5 Completed Projects 6598 95 696
6 High Priority Projects 2786 64 439
7 Other Potential Projects 56341 2543 222
8 Habitat Restoration 266 14 188
9 Street Sweeping 204 12 164
10 Public Property ESD Retrofits 25348 2366 107
11 Priority lIeighborhoods ESD Retrofits 12529 1328 94
12 Private Non-residential ESD Retrofits 7547 802 94 ru Stream Restoration - 930 -14 Pet Waste Education - 09 -
C-5
MONTGOMERY COUNTY URBAN WATERSHEDS POLLUTANTS
CABIN JOHN
1 250
__CostImplementation Phase
09 08 07 06 05 04 03 02 01
0
200 ~ c
150 g E
100 - ltII 0 u
50
0
_E Coli
- - - Waste Load Allocation
Rank Restoration Strategy
E coli reduction
Incremental Cost
Unit Cost
Billion
MPNyr Million $
Billion MPN
Million $ 1 Pet Waste Education 4388 $05 9436
2 Underperforming BMP Retrofits 1892 $19 1022
3 High Priority Projects 1289 $16 800
4 Riparian Reforestation 1133 $78 146
5 Other Potential Projects 148 $17 86
6 Public Property ESD Retrofits 4AOO $860 Sl 7 Private Non-residential ESD Retrofits 1618 $392 41
8 Priority Neighborhoods ESD Retrofits 2633 $638 41
9 Completed Projects 112 $00 0
C-6
MONTGOMERY COUNTY URBAN WATERSHEDS POLLUTANTS 1Itf~~Jabitm
ROCK CREEK
1 $700 Qj5 09
o
_
$600 Qj 08
111 $500 ~ampl 07 c
t5 06 $400 ~ e 05 ~ $3005 04 - 111tl 03 $200 0 u-6 02
$100J 01 $-
Enterrococci
- - - Waste load Allocation Implementation Phase
__Cost
Rank Restoration Strategy
Enterrococci reduction
Incremental Cost
Unit Cost
Billion MPNyr Million $ Billion MPN Million $
Et Pet Waste Management 35734 118 30190
Underperforming BMP Upgrades
Other Potential Projects
28800
30239
577
1083
4995
2792
4 Completed Projects 12131 444 2734
5 High Priority Projects 14239 890 1600
6 Riparian Reforestation 18999 2384 797
7 County Property ESD Retrofits 54519 24136 226
8 Private Residential ESD Retrofits 35230 17737 199
9 Private Non-residential ESD Retrofits 32A86 16380 198
C-7
MONTGOMERY COUNTY URBAN WATERSHEDS POLLUTANTS _f~~pabitafS (fi~r ~~ l-middotshy
ROCK CREEK
100 $900 90 $800 80 $700 u70 $600 c 60 2$50050 -~$40040
lt1$300 030 $200 u
20 10 $100
0 $shy
Implementation Phase
Rank Restoration Strategy Trash Reduction
Incremental Cost
Unit Cost I
Ibsyear Million $ IbsMillion $ 1 Other Potential Projects 16038 1085 1478
2 Underperforming BMP Upgrades 6756 577 1172
3 Completed Projects 4217 444 950
4 High Priority Projects 6366 890 715
5 Riparian Reforestation 9237 2384 387
6 Public Property ESD Retrofits 24587 24136 102
7 Priority Neighborhoods ESD Retrofits 16155 17737 91
8 Private Non-residential ESD Retrofits 14793 16380 90
9 Pet Waste Education - 118 -
(-8
MONTGOMERY COUNTY RURAL WATERSHEDS POLLUTANTS
SENECA - CLOPPER LAKE -
100 Qi
90 iii 80VI to -CQ 70 0 60e 50I 0 40 u l 30
C QJ 20ex
C 10to 0
J 0
$18
$16
$14 n
$12 I
$10 sect $08 ~ $06 0
VI
U $04
$02
$shy
_TPRemoval - - - TMDL Reduction Target
Implementation Phase ___Cost
Rank Restoration Strategy TP
Reduction (Ibsyr)
Incremental Cost (Million $)
Unit Cost (IbsvrMillion $)
1 Residential Education 33 001 6246
2 Underperforming BMP Retrofits 13 004 341 3 Riparian Buffer Reforestation 19 023 99 4 Priority Neighborhood ESD Retrofits 15 051 35 5 Public Property ESD Retrofits 7 075 99
C-9
-pj[fti
MONTGOMERY COUNTY URBAN WATERSHEDS POLLUTANTS 1It[~~JIlbitIL f bull~
LOWER MONOCACY
1 09 08 07 06 05 04 03 02 01
0
Implementation Phase
25
20 ~ c
15 ~ ~
10 - 0 u
5
0
_TSS
- - - Waste load Allocation _Cost
Rank Restoration Strategy
Sediment reduction
Incremental
Cost Unit Cost
tonsyear Million $ tonMilli
1 Street Sweeping 22 $007 3121
2 Underperforming BMP Retrofits 4 $010 389
3 Stream Restoration 37 $734 51
4 Riparian Buffer Reforestation 3 $109 25
5 Other Structural BMPs and ESD Strategies 10 $851 12
6 Priority Neighborhoods ESD Retrofits 2 $160 10
7 Non-residential ESD Retrofits 1 $132 10
C-10
MONTGOMERY COUNTY RURAL WATERSHEDS POLLUTANTS 1tlj~lIbiIalSlt~~II
1 09 08 07 06 05 04 03 02 01
0
$70
$60
$50 ~ c
$40 ~ ~ $30 - UI
$20 0 v
$10
$0
_ Phosphorus Load Reduction
- - - Waste Load Allocation ___ CostImplementation Phase
Rank Restoration Strategy TP Incremental Cost
Million $ Unit Cost
Ibsyr Ibs Million $ 1 Lawn Care Education 3670 01 37394
2 Underperforming BMP Retrofits 3499 08 4338
3 Other Potential Projects 3524 33 1076
4 High Priority Projects 252 04 685
5 Riparian Reforestation 762 26 298
6 Public Property Retrofits 5854 345 169
7 Priority Neighborhoods ESD Retrofits 796 65 123
8 Private Non-residential ESD Retrofits 1941 168 116
9 Completed Projects 53 00 00
c- 11
MONTGOMERY COUNTY RURAL WATERSHEDS POLLUTANTSal12hdJilats ~I~ ~ [ -
1 10 ii 5 09 9 1 08 8 II al- 07 7 1ii o 06 6
c
~ ~ 1 o E IV
05 04 03
5 4
3
~ 11 0 u
0 11 02 2 J o 01 1
t a 0 0 11 o
t 0
_ Phosphorus Reduction
- - - Waste Load Allocation
-Cost
Rank Restoration Strategy TP Incremental Cost
Million $ Unit Cost
Ibsyr Ibs Million $ 1 Lawn Care Education 3670 01 37394
2 Underperforming BMP Retrofits 3499 08 4338
3 Other Potential Projects 3524 33 1076
4 High Priority Projects 252 04 685
5 Riparian Reforestation 762 26 298
6 Public Property Retrofits 5854 345 169
7 Priority Neighborhoods ESD Retrofits 796 65 123
8 Private Non-residential ESD Retrofits 1941 168 116
9 Completed Projects 53 00 00
C-12
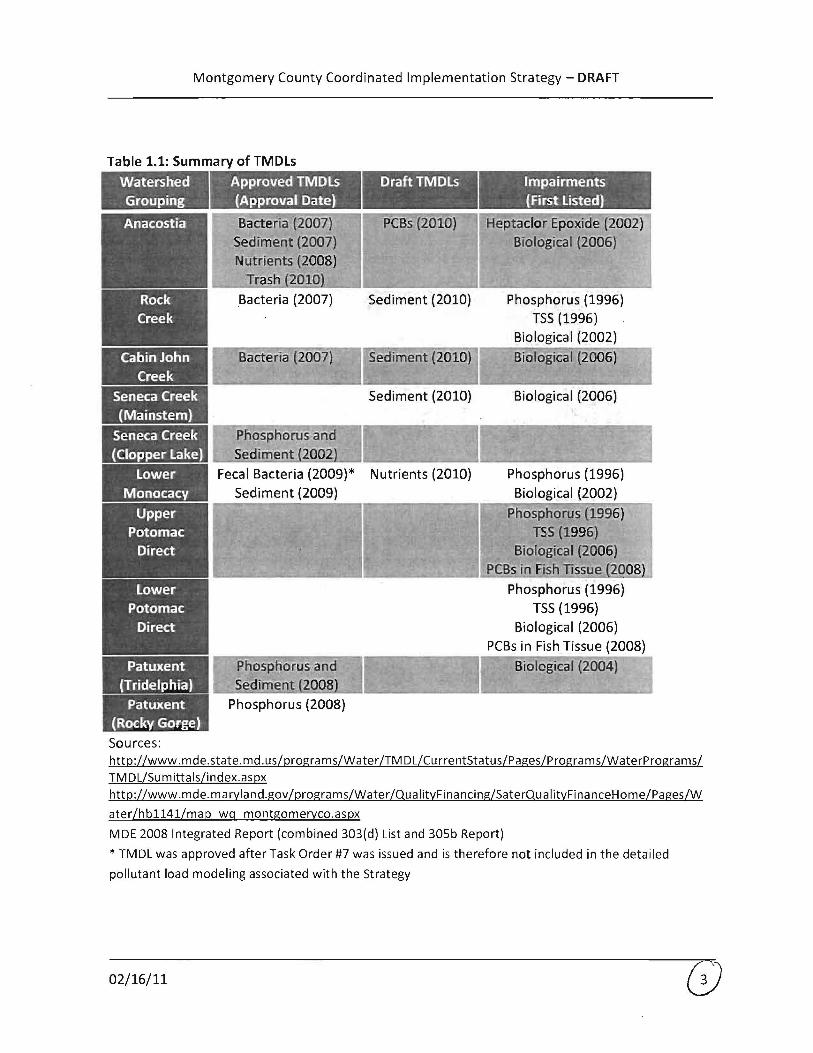
Montgomery County Coordinated Implementation Strategy - DRAFT
Table 11 Summary of TMDLs
Watershed Grouping
Approved TMDLs (Approval Date)
Bacteria (2007) Sediment (2007) Nutrients (2008)
Trash (20lQl Bacteria (2007)
Bacteria (2007)
DraftTMDLs
PCBs (2010)
Sediment (2010)
Sediment (2010)
Impairments (First Listed)
Heptaclor Epoxide (2002) Biological (2006)
Phosphorus (1996) TSS(1996)
Biological (2002)
Biological (2006)
Seneca Creek Sediment (2010) Biological (2006) (Mainstem)
Seneca Creek (Clopper Lake)
P osphorus and Sediment
~ ~
Lower Fecal Bacteria (2009) Nutrients (2010) Phosphorus (1996) Monocacy Sediment (2009) Biological (2002)
Phosphorus (1996) TSS (1996)
Biological (2006) PCBs in Fish Tissue (2008)
Phosphorus (1996) TSS (1996)
Biological (2006) PCBs in Fish Tissue (2008)
Biological
Sources httpwwwmdestatemdusprogramsWaterTMDLCurrentStatusPagesProgramsWaterPrograms TIVI DLSu m itta Isindexas px httpwwwmdemarylandgovprogramsWaterQualityFinancingSaterQualityFinanceHomePagesW
aterhb1141map wg montgomerycoaspx
MDE 2008 Integrated Report (combined 303(d) List and 30Sb Report)
TIVIDL was approved after Task Order tt7 was issued and is therefore not included in the detailed
pollutant load modeling associated with the Strategy
Patuxent (Tridelphia)
Patuxent
~middotmiddotIlmiddot- t- I ~ t I 4
bull 1 ~ bull t - - shy -l=~ _~l i-
(Rocky Gorge)
021611
Montgomery County Coordinated Implementation Strategy - DRAFT
Montgomery County MS4 Permit Background
On February 16 2010 Maryland Department of the Environment (MOE) issued Montgomery
County a new MS4 permit This S-year permit complies with the Environmental Protection
Agencys NPDES regulations that require large urban jurisdictions to control pollution from
stormwater runoff to the maximum extent practicable The EPAs latest estimates are that 10
percent of Marylands nitrogen load comes from urban and suburban stormwater runoff
(USEPA May 2010) The County MS4 Permit requires development of implementation plans to
meet WLAs through watershed restoration and other programmatic measures
Major new provisions of the permit include
bull Requiring restoration of an additional 20 percent of impervious surfaces not currently
receiving adequate treatment
bull Developing and implementing measurable strategies to reduce trash as part of the
Countys commitment to a trash-free Potomac River
bull Reducing pollutant loadings to comply with pollution limits necessary to meet water
quality standards for impaired waters (TMDLs)
The plans and strategies outlined in this document establish the steps Montgomery County is
taking to fulfill the requirements associated with this MS4 Permit
Implementation Plans and Pre-assessments
There are two major watersheds located within Montgomery County the Potomac River
watershed which covers approximately 88 of the County and the Patuxent River watershed
which covers approximately 12 of the County In terms of the Countys MS4 Permit area the
area proportion is 96 in the Potomac and 4 in the Patuxent River watersheds The County is
further divided into eight subwatersheds based on the eight digit United States Geologic Survey
(USGS) Hydrologic Unit Code (HUC) as shown in Figure 11 Seven of the eight subwatersheds
have restoration implementation plans that have been developed for this project effort The
eighth watershed Upper Potomac Direct does not have an implementation plan because a
watershed assessment has not yet been completed for the watershed as noted below
For more information about a specific watershed and the associated plans see the DEP website
(wwwmontgomerycountymdgovstormwaterpermit) The seven watersheds that have
implementation plans are
bull Anacostia
021611
Montgomery County Coordinated Implementation Strategy - DRAFT
bull Cabin John Creek
bull Lower Monocacy
bull Lower Potomac Direct (Muddy Branch and Watts Branch)
bull Patuxent
bull Rock Creek
bull Seneca Creek (Great Seneca including Clopper Lake)
lEGeND
_ Stal N nfU 1 P r
M3or ~til~hd5
D Atgt~
o COIIlln Jchl
D La frloocKJ
o Law Pctamox Quo
Dpsa~ll l Rod ~(~
Figure 11 Map of Watersheds
The goals of the implementation plans are to
bull Identify feasible best management practices (BMPs)
bull Quantify the area they treat and the amount of pollutants they can remove from
stormwater runoff before entering into the Countys streams rivers and lakes
021611
Montgomery County Coordinated Implementation Strategy - DRAFT
bull Determine the restoration potential for each watershed or subwatershed and evaluate
the ability to meet applicable TMDLs
bull Provide a schedule and cost estimate for meeting the WLAs set by the TMDL
In addition to the seven implementation plans there are three watershed pre-assessments that
have been completed for watersheds that have not been previously assessed The preshy
assessments will be used by the County to develop watershed assessments and associated
implementation plans which will be completed this permit cycle They include
bull Seneca Creek Little Seneca and Dry Seneca
bull Lower Potomac Direct including Rock Run and Little Falls but excluding Muddy Branch
and Watts Branch
bull Upper Potomac Direct including Little Monocacy amp Broad Run
The seven implementation plans (Table 12) provided the input data for the development of
this Strategy
Table 12 Watershed Groupings and Plans
Pre-Assessment
x x
x x
lower Potomac Direct (East of Seneca Creek not described in any other grouping)
Muddy Branch and Watts Branch x All other subwatersheds x
Patuxent (TriadelphiaBrighton Dam and Rocky
Gorge)
x
Great Seneca (including Clopper Lake)
Dry Seneca and Little Seneca
lower Monocacy
Upper Potomac Direct (West of Seneca Creek not described in any other grouping)
Trash Free Potomac
The Alice Ferguson Foundation founded the Trash Free Potomac Watershed Initiative (TFPWI)
in 2005 to reduce trash and increase awareness of trash issues in the watershed TFPWI actions
021611
Montgomery County Coordinated Implementation Strategy - DRAFT
include the Potomac River Watershed Trash Treaty Annual Potomac River Watershed Trash
Summit Annual Potomac River Watershed Cleanup market-based approaches such as the
Trash Free Potomac Facility Program and a Regional Anti-Litter Campaign (Alice Ferguson
Foundation 2011) The MS4 permit requires Montgomery County to meet the commitments of
Potomac River Watershed Treaty The permit specifically requires that Montgomery County
1 Support and implement regional strategies to reduce trash
2 Develop a work plan to implement a public outreach and education campaign
3 Establish baseline conditions of trash being discharged and develop a reduction strategy
and work plan for the Montgomery County portion of the Anacostia Watershed
4 Implement approved control measures in accordance with the trash reduction work
plan
5 Conduct public participation in development of trash reduction strategy
6 Submit progress annually
Public Outreach and Stewardship
The Countys MS4 Permit requires significant opportunities for public participation in achieving
TMDls watershed restoration and trash management The permit specifically requires the
County to prepare a work plan to implement a public outreach and education campaign The
County recognizes that a successful strategy will require a significant increase in effective and
coordinated public outreach and public stewardship The implementation plans and this
Strategy describe how DEP plans to implement public outreach and education campaigns with
specific performance goals and deadlines
021611
Montgomery County Coordinated Implementation Strategy - DRAFT
2 EXISTING CONDITIONS
Watershed health is variable throughout the County and typically well correlated with intensity
and age of urbanization More specifically watershed health typically declines with increasing
density and older age of development Many of Montgomery Countys older urban and
suburban areas were developed in an era when runoff from paved surfaces (roads parking lots
driveways) was directed to storm drains which conveyed untreated runoff directly to streams
This large volume of water caused massive erosion of the stream banks and destroyed habitat
Stormwater treatment using stormwater ponds to receive detain and filter runoff before it
flowed into streams was either inadequate or non-existent The Anacostia Rock Creek and
Cabin John Creek watersheds are examples where these conditions are common Modern
stormwater techniques known as environmental site design or ESD encourage the reduction
of runoff by infiltrating the water into the ground near its source
Watershed health improves in more rural areas of the County but even in these areas stream
degradation can occur stemming from large lot development and poor agricultural
management practices
The County has conducted comprehensive water quality and biological sampling for more than
a decade which provides a representative snapshot of existing watershed health as well as the
ability to track watershed health over time Figure 21 shows countywide watershed resource
conditions based on monitoring that was conducted from 2000-2008 The area inside the
beltway in the more urban core has lower water quality (fair to poor) while the area outside the
beltway tends to have better water quality (fair to good to excellent)
021611
---- -
-----
Montgomery County Coordinated Implementation Strategy - DRAFT
Watershed Resource Conditions Montgomery County Maryland
LEGEND z fbn
G 0middot1 - -~UlIS
- tI)Jogtf~
UJJOf Wrw Ftns
Splaquo1lII PnreltbOrI NtH SPAl
3D~~ennHI
[=jji=---~~-
Figure 21 County Watershed Resource Conditions
County Statistics
The Strategy will benefit from the fact that the majority of county residents own the property
they reside on (nearly 70) and thus have control over that property Also nearly 70 of the
residences are single unit homes Moreover the average household income is roughly $90000
making the likelihood of financial capability to install BMPs an appropriate assumption Both of
these statistics make advocacy of BMPs on residential properties an imperative for the Strategy
Montgomery Countys robust business economy was also considered in the Strategy
development Despite the current economic volatility Montgomery Countys business
community is still profitable and still maintaining and improving existing facilities Moreover
the construction of the inter-county-connector (ICC) through much of Montgomery County will
provide opportunities to install demonstration BMPs on newly developing properties for
replication throughout stakeholder groups Also the presence of communication industry
leaders (ie Discovery Channel) in the County creates unique stewardship education
partnership possibilities with businesses The Strategy will include these stakeholders
021611
Montgomery County Coordinated Implementation Strategy - DRAFT
involvement opportunities to best harness the power of Montgomery Countys healthy
business economy
The county includes a fairly even split of males and females The majority of residents nearly
50 fall between the ages of 25 and 55 Only 15 of the population is aged 60 and above In
addition the majority of Montgomery County residents indicate their preferred language as
English however Spanish translations of stakeholder involvement opportunities will be
required in select watersheds to accommodate the 13 of county residents that indicate their
preferred language as Spanish Other potential target groups for translation for stakeholder
involvement include the Asian community as 11 of the countys population is Asian (mostly
Korean and Vietnamese) Because of this the Strategy and implementation plans will take
multilingual requirements into consideration for signage and other educational tools as well
MS4 Permit Coverage
The Countys most recent NPDES MS4 stormwater permit only covers runoff from
developments within the County area The following areas are excluded from the Countys MS4
permit area shown in Figure 22
bull Cities of Gaithersburg Rockville and Takoma Park
bull Maryland National Capital Park and Planning Commission (MNCPPC) lands
bull Washington Sanitary Sewer Commission (WSSC) land
bull Federal and State government owned land and facilities
bull Rural zoning
021611 G
Montgomery County Coordinated Implementation Strategy - DRAFT
MS4 Permit Area Montgomery County Maryland
(-i Gaithersbur9 ~
M Ro ckville
TkD m Parilt -Jr MNC PPC Lnds
0 5 3
Feder 1 and SI PropertyM i KbnelefS
M 0 I 2 ~- Federal and Sta1e Roads
~ i s Rural Zon ing
Figure 22 Areas outside the Montgomery County MS4 Permit Area
Impervious Surfaces
As previously mentioned the Countys MS4 Permit requires treatment of an additional 20 of
impervious cover not currently receiving treatment to the MEP Table 21 presents a summary
of the countywide impervious cover totals along with breakdowns by major land cover type
These land covers will be the focus of much of the Countys targeted effort to treat the 20
target
021611
Montgomery County Coordinated Implementation Strategy - DRAFT
Table 2llmpervious Surface Summary
Description
Total County Area 324552 100
Total Area of 1m ervious Surface 35965 _ _-----shy 11
County Area Subject to Stormwater Permit (1) 138649 43
Imllervious Cover Subject to Stormwater Permit 2) ~==5119====18o2 == ==== Areas of Impervious Surface (3)
Road 13607 38
Building 13073 36
Parking 22
Sidewalk 1069 3
Recreation (4) 347 1 1 Exclusions include Certain zoning codes parklands forests municipalities with own stormwater management
programs state and federal properties and state and federal maintained roads 2 Percent of County Jurisdictional Area subject to the Stormwater Permit 3 Impervious area within each category within the total County area 4 Recreation imperviousness excludes swimming pools
Implementation Plan Guidance Document
The Implementation Plan Guidance Document (revised October 252010) provides a road map
for how the implementation plans were created The primary sections of the Guidance
Document and a short description of each are provided in Appendix A
The Guidance Document divides BMPs into five classes or codes shown below The Guidance
Document also provides a list of BMPs and which code they fall under which is provided in
Appendix B
Code 0 Pretreatment Practices
Code 1 Non-performing BMPs No runoff reduction and no long term pollutant removal
Code 2 Under-performing BMPs Limited runoff reduction and low pollutant removal
Code 3 Effective BMPs No runoff reduction but moderate to high pollutant removal
Code 4 ESO BMPs High runoff reduction and moderate to high pollutant removal
Impervious Cover Accounting and Tracking
Montgomery County has GIS data layers that contain all the stormwater BMPs in the County
and their drainage areas In order to determine the 20 target for impervious cover treatment
021611
Montgomery County Coordinated Implementation Strategy - DRAFT
to the MEP the County analyzed their existing impervious cover and their existing BMP
database to determine how much impervious cover is currently being treated to the MEP
Several methods were considered based on a determination of the MEP standard compared to
existing treatment methods According to MDE guidance to be considered MEP a BMP must
capture at least the Water Quality Volume (WQv) (the first inch of rainfall) or the CPv volume
(26 inches of rainfall) The final method used for determining which BMPs are MEP and the
amount of impervious surface not treated to the MEP was as follows
1 All BMPs that were installed after 2002 or are classified as Code 4 were considered MEP
2 An analysis of typical Code 3 stormwater ponds installed after 1986 was performed to
determine if this class of BMPs met the definition of IVIEP Based on that analysis Code
3 BMPs constructed after 1986 are considered MEP
3 All other classes of BMPs not specified above are not considered MEP and are eligible
for retrofit
Table 22 below shows the breakdown of the impervious acres treated by BMP codes and era
(shaded areas are BMP codes treated to the MEP)
Table 22 Acres of Impervious Cover Treated by BMP Code and Design Era
Design Era Post2002 1986-2002 Pre1986 Blank Total
CIJ tl 0 u Q
~ co
0 28 711 24 132 895
1 33 555 1391 367 2346
2 41 299 12 23 375
3 75 2482 1437 267 4261
4 20 459 482 40 1001
Totals 198 4506 3345 828 8877
IC Credit 100 Code 3amp 4 Code 4 Total Acres treated to
MEP 198 2942 482 40 3661
Assuming a total countywide impervious acreage of 25119 acres and an impervious acreage
treated to the MEP of 3661 as shown in Table 22 there are currently 21458 acres of
untreated impervious area Twenty percent of 21458 equates to 4292 acres of impervious
area that must be restored over the current permit cycle
021611
Montgomery County Coordinated Implementation Strategy - DRAFT
Pollutant Load Tracking
In addition to tracking impervious cover it is necessary to compute existing pollutant loads and
projected reductions in loads as a result of applying storm water controls and BMPs The Center
for Watershed Protections (CWP) Watershed Treatment Model (WTM) version 20 (CWP 2001)
was the tool selected to conduct this analysis and track load reductions across a range of
implementation strategies
The WTM uses a spreadsheet model to calculate annual pollutant loads and runoff volumes
The model also accounts for the benefits contributed by a full suite of stormwater treatment
practices and programs The first step in the model calculates existing pollutant loads by adding
primary and secondary source loads then subtracting reductions according to existing
management practices The second step applies future management practices by subtracting
these calculated reductions from the existing loads Appendix B of the Guidance Document
provides a detailed explanation of the assumptions and steps in the modeling process
For each watershed the WTM was run under existing conditions with existing BMPs to
determine a baseline pollutant load for targeted pollutants The baseline period for non-TMDL
parameters was based on 2002 Maryland Department of Planning land useland cover data
coupled with the Countys existing urban BMP database Pollutants targeted included bacteria
Total Phosphorus (TP) Total Nitrogen (TN) Total Suspended Solids (TSS) and Trash Next a
series of model runs was developed for analyzing the pollutant load reduction effect that
various restoration strategies would have based on assumed levels of implementation for the
various strategies Individual restoration strategies that were sequentially modeled included
the following
bull Completed and High Priority Projects - these include projects already completed or high
priority structural BMPs scheduled for retrofit in the FYll-FY16 Capital Improvements
Program (CIP)
bull Low Priority Projects - these includes FY11-FY16 CIP projects that for various reasons
are considered a lower priority
bull Other Potential Projects - these include other projects in existing inventories that were
not listed in the previous two categories For the Anacostia they include projects in
Anacostia Restoration Plan (ARP) prepared by the Army Corp of Engineers
bull Public ESD Retrofits - These include small scale ESD practices applied to County-owned
buildings streets and parking lots and rights of way Examples include rainwater
harvesting green roofs upland reforestation soil compost amendments rooftop
disconnection green street retrofits and converting drainage ditches to dry swales
021611
Montgomery County Coordinated Implementation Strategy - DRAFT
These are Code 4 structures This category also includes other structural BMP upgrades
to existing County BMPs which were designated as under-performing or nonshy
performing
bull Private ESD Retrofits - These projects include ESD on commercial property and
residential property and include green roofs rain gardens and permeable pavement
bull Riparian Reforestation - Focuses primarily on tree planting for riparian buffer
restoration
bull Stream Restoration - Includes the use of natural materials such as rocks logs and native
vegetation to reduce pressure on eroded banks prevent down-cutting of the
streambed and restore the natural meander patterns and slope profiles found in stable
reference streams
bull Programmatic Practices - This category deals with potential pollutant reduction that can
be attributed and quantified through MS4 stormwater pollution prevention
improvements and better housekeeping on County land and facilities Also includes any
pollutant reductions due to product substitution (eg nitrogen and phosphorus limits in
fertilizer) operational programs (eg recycling) and enforcement This category also
deals with reduced pollutants that can be attributed and quantified through MS4
stormwater education (eg lawn care) and outreach aimed at pollution prevention
better housekeeping and increased stewardship
The naming convention applied for the model runs was WTM 10 (ie baseline) WTM 20 (Le
completed and high priority low priority and other potential projects) WTM 30 (Le public
and private ESD) WTM 40 (ie riparian reforestation and stream restoration) and WTM 50
(ie programmatic) Model runs were developed sequentially to yield incremental increases in
load reduction by strategy In practice however strategies can be applied in combination and
out of sequence to achieve targeted outcomes and the most cost-effective solutions A
summary of the scenarios is provided in Table 23 below
021611
Montgomery County Coordinated Implementation Strategy - DRAFT
Table 23 Summary of Watershed Treatment Model (WTM) Scenarios
Implementation Phase Description
The WTM was run under existing conditions approach
WTM Baseline Conditions with the MDP year 2002 land useland cover data and
existing BMPs
WTM 20 Completed as of
2009j High Priorityj Low
Priority and Other Potential
Projects
The WTM was run with a series of future management
practices which were proposed projects from the
County inventory of restoration sites These practices
cover new ponds retrofits of existing BMPs and some
ESD practices from the proposed projects list
The Countys inventory for other project types that
include public properties eg libraries and parkingWTM 30 ESD Strategies and
lots public schools and open section roads available Other Structural BMPs
for ESD retrofits was reviewed as were areas for
private property ESD retrofits
This category includes any pollutant reduction or volume
reduction that can be attributed to specific stream
WTM 40 Habitat rehabilitation wetland restoration and or riparian
Restoration reforestation projects planned for construction in the
watershed for the permit cycle
WTM 50 MS4 Programmatic See description above
Practices
TMDL Calibration and Tracking
Where TMDLs existed for individual watersheds the WTM was run under existing conditions
with existing BMPs based on the year in which the data was collected for TMDL development
The baseline pollutant load was then compared and normalized to the MDE-determined
baseline MS4 load for the TMDL pollutant Any BMPs with approved dates after the year in
which the data was collected for TMDL development were not included in the baseline
calculation but rather were counted towards meeting the TMDL reduction target
Once the normalized model was established reductions achieved through programs and
practices were tracked using the WTM scenarios based on the percent load reduction from
baseline toward meeting the TMDL required WLA The normalized baseline and WLA target are
determined and specified in the relevant TMDL documents developed by M DE
021611
Montgomery County Coordinated Implementation Strategy - DRAFT
3 WATERSHED IMPLEMENTATION PLANS AND RESTORATION POTENTIAL
The watershed implementation plans and pre-assessments developed in conjunction with the
Strategy are driven by regulatory requirements facing each watershed Table 31 summarizes
the drivers by watershed
Table 31 Restoration Objectives -
W~tershedSubwater~hed - Trash
4 bull - I _ _ -
Patuxent
Anacostia
Rock Creek
Great Seneca
Cabin John Creek
lower Monocacy
Watts BranchMuddy Branch
Dry and little Seneca
lower Potomac Direct
Table 32 presents the more detailed and quantitative aspects of the TMDl requirements for
the MS4 portion within each watershed The Strategy has been developed to meet the MS4
permit area WLA compliance targets presented in Tables 32
In addition to the individual watershed requirements there is a Countywide requirement to
comply with the wasteload allocations associated with urban areas under the Chesapeake Bay
TMDl which applies to nutrients and sediment There is an interim target established for 2017
where reductions from baseline conditions of 9 12 and 20 respectively for TN TP and
TSS are to occur Then by 2020 full compliance is required which correspond to reductions
from baseline conditions of 18 34 and 37 respectively for TN TP and TSS
021611
Montgomery County Coordinated Implementation Strategy - DRAFT
Table 32 TMDl Summary by Impairment
Watershed
Cabin John Creek
Rock 2007 Enterococci 970 453669 18195 Creek
Anacostia 2007 Enterococci 860 247809 29978 River
Aoacostia 2008 TN 788 206312 38959 River
Anacostia 2008 TP 797 20953 3947 Ibsyr River
Triadelphia 2008 TP 580 438 Reservoir
Rocky Gorge 2008 TP 480 4268 3628 Reservoir
Clopper Lake 2002 TP 393
Anacostia 2007 TSS 850 7682 River
Triadelphia 2008 TSS Reservoir Clopper 2002 TSS 00 13 13
Lake
Lower 2009 TSS 380010 172 Monocacy
River
Anacostia 2010 Trash 1000 228683 Ibsyr River
Adapted from 2010 Status of Approved Stormwater Waste load Allocations for NPDES Regulated Stormwater Entities in Montgomery County April 27 2010 by Jeff White MDE
Potential to Reduce Stormwater Pollutant loads
Within each of the implementation plans an analysis was developed that explored the
restoration potential for that watershed Cost was not a limiting factor for the analysis but
rather assumptions were made based on feasibility of implementation rates and consideration
of conflicts with typical site conditions with respect to site use utilities land ownership etc
For example it was assumed that 40 of large County-owned parking lots would be available
for stormwater retrofitting These assumptions are necessary for planning purposes where
detailed site investigations have not occurred However some level of implementation is
021611
Montgomery County Coordinated Implementation Strategy - DRAFT
reasonable to assume In addition all identified high priority and low priority County projects
that have the potential to be constructed were assumed to be implemented
Implementation cost and effectiveness (in terms of pollutant load reduced) was also tracked
through the process of determining watershed restoration potential which enables the
costbenefit evaluation of various strategies for a target parameter (eg tons of sediment per
dollar spent or billion MPN of bacteria per dollar etc) For example by tracking cost and
effectiveness it is possible to evaluate the relative costbenefit of a strategy like ESD versus a
non-structural programmatic practice Moreover the comparison of these two strategies is
going to be different depending on what parameter is being considered eg ESD may be more
cost effective for nutrient reduction but less cost effective for bacterial load reduction
The tables in Appendix C help to illustrate this point Specifically a series of summary charts
and tables have been developed that illustrate the cost effectiveness of the range of strategies
considered by watershed with respect to pollutant load reduction The summaries reflect the
full restoration potential developed for each watershed
It is also useful to compare strategy effectiveness and range of opportunity across watersheds
To facilitate this a series of tables were compiled that groups all watersheds together and
considers watershed restoration potential by strategy These summary tables are presented in
Tables 33 through 310
For this analysis stream restoration was treated as a special modeling case (Table 39) because
it was not tracked as a strategy that receives credit for impervious cover treatment and because
it requires a different pollutant load reduction tracking method based on linear feet of
implementation and the existing stream resource condition (good fair or poor IBI scores
received different pollutant removal credit) Further details on stream restoration modeling
are presented in the individual implementation plans and the Guidance Document
Not all WTM scenarios were modeled for all watersheds For example if there were no
previously identified completed high priority low priority or other potential projects within a
watershed they would appear as zeros for that individual watershed in Tables 33 through 36
Also for non-TMDl watersheds such as Great Seneca and Muddy Branch and Watts Branch
subwatersheds the public and private property ESD riparian reforestation and MS4
programmatic practices scenarios were not modeled due to the lack of regulatory drivers that
define pollutant removal targets
021611
Montgomery County Coordinated Implementation Strategy - DRAFT
Table 33 Cost and benefit summary for completed projects (WTM 20)
Watershed Total ESD PrOjects Incremental reduction from baseline ()
i Cost Numberof Impervious
Cost
I Impervious Trash control added TN TP TSS Bacteria
(million $) projects bullbull (ac)
(total) (total)
Anacostia 95 25 167 7 3 4 4 1 4 4
Cabin John 00 0 0 0 0 02 02 03 03 1
Rock Creek 44 6 212 13 1 2 2 3 3 2 i
I Triadelphia 00 0 0 0 0 0 0 0 0 0
Rocky Gorge 00 0 0 0 0 0 01 0 0 0
Lower Monocacy 00 0 0 0 0 0 0 0 0 0
Clopper lake 00 0 0 0 0 0 0 0 0 0
Great Seneca bull 06 2 11 0 0 1 1 I 1 0 2
MuddyWatts 00 0 0 0 0 0 0 0 0 0
Indudes Clopper lake Project count does not include stream restoration Pollutants with a TMDL are highlighted
Table 34 Cost and benefit summary for high priority projects (WTM 20)
Watershed I
I
Total ESD Projects Incremental reduction from baseline ()
Cost
(million $)
i Numberof
projects bullbull
Impervious
control added
(ac)
ICost (total)
Impervious
(total) TN
I TP TSS I TrashBacteria
Anacostia 64 33 148 65 16 2 2 06 2 2
Cabin John 16 6 88 19 2 3 3 3 3 1
Rock Creek 89 14 373 13 1 2 3 3 3 4
Triadelphia 00 0 0 04 0 0 0 0 0 0
I Rocky Gorge 04 2 5 77 27 06 06 07 06 1
Lower Monocacy 00 0 0 0 0 0 0 0 0 0
Clopper lake 00 0 0 0 010 0 0 0 0 0 Great Seneca bull 183 24 789 6 08 19 19 20 0 24
MuddyWatts 44 16 211 8 1 6 6 6 0 6
Indudes Clopper lake bullbull Project count does not indude stream restoration Pollutants with a TMDL are highlighted
Table 35 Cost and benefit summary for low priority projects (WTM 20)
I Watershed Total ESO Projects Incremental reduction from baseline ()
Numberof Impervious ICost 1m ~ i Cost Impervious
I (million $) projects bullbull
control added (total) (total)
TN TP Bacteria Trash
(ac)
I Anacostia 51 16 188 61 8 2 2 07 2 3
Cabin John 16 8 10 98 78 02 02 02 02 03
I Rock Creek 88 24 657 7 1 4 4 6 5 7
Triadelphia 040 1 20 100 100 05 05 06 05 1
Rocky Gorge 09 2 458 100 100 84 82 83 82 116 i
I Lower Monocacy 0 0 0 0 0 0 0 0 0 0 I Clopper lake 0 0 0 0 0 0 0 0 0 0
I Great Seneca bull 66 16 87 41 15 4 4 4 010 4
I MuddyWatts 20 6 26 84 33 0 0 1 0 0
Includes Clopper Lake Project count does not include stream restoration Pollutants wth a TMDL are highlighted
021611
Montgomery County Coordinated Implementation Strategy - DRAFT
Table 36 Cost and benefit summary for other potential projects (WTM 20)
I Watershed Total ESO Projects Incremental reduction from baseline ()
ICost Impervious I Cost
I I Trash INumber of
control added Impervious
TN TP TSS Bacteria (million $) projects bullbull
(ac) (total) (total)
i i
Anacostia 2492 497 2222 73 62 23 8 26 301
Cabin John 00840 1 5 0 010 01 01 01 01 01
Rock Creek 20 4 201 0 0 12 12 19 15 21
Triadelphia 00 0 0 010 0 00 00 00 00 00
Rocky Gorge 20 2 0 010 0 00 00 00 00 00
lower Monocacy 00 0 0 0( 0 00 00 00 00 0010
Clopper Lake 00 0 0 0 0 00 00 00 00 0010
Great Seneca bull 02 S S3 0 0 23 23 27 00 27
MuddyWatts 00 0 0 0 0( 00 00 00 00 0010
bull Includes Clopper Lake bullbull Project count does not include stream restoration Pollutants with a TMDL are highlighted
Table 37 Cost and benefit summary for ESO projects (WTM 30)
Watershed
I
Cost (million $) Impervious
control added
(ac)
Incremental reduction from baseline ()
ESDfor i ESO for private
public
property property
TN TP TSS Bacteria Trash
Anacostia 2378 21296 1813 20 21 7 22 27
Cabin John 878 10307 876 22 23 25 24 28
Rock Creek 2471 341 2427 30 30 33 32 35
Triadelphia 41 47 36 10 1010 11 11 20
Rocky Gorge 312 19 28S 26 27 32 30 46
lower Monocacy 86 29 53 14 15 15 15 010
Clopper lake 08 051 21 14 14 15 0 14
Great Seneca bull 00 0 0 010 0 0( 0( 010
MuddyWatts 00 a 0 0 01 010 0 0
bull Includes Clopper lake Pollutants with a TMDL are highlighted
Table 3B Cost and benefit summary for riparian reforestation (WTM 40)
IWatershed Cost (million $) Impervious
Incremental reduction from baseline ()
control added Habitat restoration (ac) TN TP TSS Bacteria Trash
Anacostia 1 6 0 0 0 01 02
Cabin John 777 39 1 2 lili
3
Rock Creek 24 119 2 2 2 5
Triadelphia 010 1 01 02 01 04 03
Rocky Gorge 25 12 1 2 2 3 8
lower Monocacy 11 S 3 3 3 4 0
Clopper Lake 023 2 4 4 2 010 4
Great Seneca bull 0 a 010 010 0 010 0
MuddyWatts 0 0 010 0 0 0 0
bull Includes Clopper lake Pallutonts with a TMDL are highlighted
021611
Montgomery County Coordinated Implementation Strategy - DRAFT
Table 57 Cost and benefit summary for stream restoration (WTM 40)
Watershed Stream Restoration Incremental reduction from baseline ()
Number of Impervious control
Cost (million $) added(ac) TN TP TSS Bacteria Trash projects
Anacostia 937 200 0 42 56 326 0 0
Cabinlohn 162 15 0 17 9 80 0 0
Rock Creek 201 30 a 9 710 100 0 0
Triadelphia 00 0 0 0 0 0 010 0
Rocky Gorge 191 18 I 0 10 7 36 0 O lower Monocacy 73 nla 0 7 10 32 010 0
Clopper Lake 00 a 0 0 0 0 0 0
Great Seneca It I 259 33 0 19 8 16 0 0
MuddyWatts 242 45 0 16 7 13 0 0
Includes Clopper Lake Pollutants with a TMDL are highlighted
Table 58 Cost and benefit summary for M54programmatlc practices (WTM 50)
Watershed Cost (million $) Incremental reduction from baseline ()
Programmatic
practices - M54
Impervious control
added (ac) TN TP TSS Bacteria Trash
Anacostia 36 0 9 9 10 8 82
Cabin John 047 0 15 14 0 10 0
Rockereek 12 0 11 11 0 7 0
Triadelphia 00056 a 23 3 0 0 0
Rocky Gorge 009 0 38 8 03 5 2
lower Monocacy 007 0 0 0 19 0 0
Clopper Lake 0Q1 0 61 30
~=r 0
Great Seneca 10 0 0 0 0 0Y0 0 0
MuddyWatts 0 0 0 0 0 0 0
bull Includes Clopper Lake Pollutants with a TMDL are highlighted
021611
Montgomery County Coordinated Implementation Strategy - DRAFT
4 COORDINATED IMPLEMENTATION STRATEGY
The Strategy has multiple objectives to accomplish whereby a challenging balance between
strategies and timeframe is required There isnt necessarily a correct answer in the process
but rather an optimized result that addresses an agreed upon suite of priorities The Strategy
presented here was primarily driven by known and established regulatory timeframes and
compliance endpoints Meeting these endpoints using the more cost effective approaches was
also given priority After this consideration was given to other known and important
approaches that stakeholders and the County have an interest in pursuing Specifically the
following compliance dates and objectives were conSidered in developing the Strategy over the
long-term (Table 41)
Table 41 Compliance Targets for Countywide Coordinated Implementation Strategy
Target Date
2015
2017
2020
Compliance Target
Meeting 20 impervious cover treatment requirement
within the MS4 Permit cycle
Meet the interim dates and targets for the Chesapeake
Bay TMDL which include specific regulated urban area
reductions by 2017 for nutrients and sediment (based
on Maryland Department of the Environments
Watershed Implementation Plan)
Meet the full compliance and targets for the
Chesapeake BayTIVIDL which include specific regulated
urban area reduction by 2020 for nutrients and
sediment (based on Maryland Department of the
Environments Watershed Implementation Plan)
Metric
~4300 acres of
Impervious Cover
9 12 and 20
respectively for TN TP
and TSS reductions
from baseline
conditions
18 34 and 37
respectively for TN TP
and TSS reductions
from baseline
conditions
2025
2030
Meet additional impervious cover treatment targets
associated with next MS4 Permit cycle (assumes
another 20 target)
Meet additional impervious cover treatment targets
associated with next MS4 Permit cycle (assumes
another 20 target)
Out year compliance with other watershed TMDLs
~3400 acres of
Impervious Cover (20
of impervious
remaining after 2015)
~2750 acres of
Impervious Cover (20
of impervious
remaining after 2020)
100 compliance with
MS4 Permit Area WLAs
021611
Montgomery County Coordinated Implementation Strategy - DRAFT
To meet the compliance targets outlined in Table 41 the following priorities were generally
followed
bull 100 implementation of completed high and low priority County projects in first five
years (by 2015)
bull Greater ESD focus in urban (as opposed to suburban and rural) watersheds initially Goal
for ESD in these watersheds on pUblic property in first five years is 10 and on private
property is 10 The level of implementation was largely driven by the 20 Countywide
impervious goal
bull 100 of Public Outreach Potential for all TIVIDl watersheds in first five years This was
pursued to address trash nutrient and bacteria loading which rely strongly on effective
outreach programs to modify behaviors
bull Generally limited strategies to the top four most cost effective per watershed
bull Habitat restoration (stream restoration and buffer reforestation) not pursued as priority
until after first five year period These programs emphasize greater pollutant reduction
efficiency rather than impervious cover treatment which is the primary focus for the
first permit cycle
The Strategy was informed by the individual watershed implementation plans for seven
watersheds which included the Clopper lake and Patuxent subwatersheds Therefore in order
to develop countywide estimates for pollutant load reduction (as is required by the Chesapeake
Bay TMDl) watershed area weighting was applied The process for developing the Countywide
strategy and individual watershed implementation plans was woven together Once the
restoration potential was determined from the individual plans the strategy and schedule was
compiled using the restoration potentials and the drivers listed above The final restoration
cost and schedule was then placed in the implementation plans
It is also worth noting that the high and low priority projects along with the other potential
projects strategies represent a static or fixed number of projects that have been identified by
the County For this analysiS this list of practices is not replenished and therefore once all
opportunities have been implemented other strategies are pursued In reality the County will
continue to develop and update its list of specific project opportunities and have these
available for implementation in future years
The output from this effort is presented in a series of tables ordered by target date in Appendix
D In addition Table 42 provides an overall summary of pollutant load reduction tracking
versus time Through inspection of Table 42 it can be seen that the Strategy meets the
021611
Montgomery County Coordinated Implementation Strategy - DRAFT
impervious cover treatment targets under the current MS4 permit (as well as projected targets
for 2020 and 2025 assuming a continued 20 treatment requirement) interim and final
Chesapeake Bay nutrient and sediment reduction targets by 2017 and 2020 respectively and
out year MS4 permit area WLA compliance for the majority of pollutants Exceptions include
meeting the bacteria WLA load reductions required for the Anacostia and Rock Creek
021611
Montgomery County Coordinated Implementation Strategy - DRAFT
Table 42 Projection by Phase for Watersheds and Pollutants PermitTMDL Targets
Watershed Fiscal Year 2015 2017 2020 2025 2030 2017 2020
Impervious Treated (acres) 1421 2393 3364 4272 4544
ESD ( Impervious) 26 44 61 69A 71
Cost (Million $) 160 307 486 732 820
E5D( Cost) 45 62 71 78 78
Anacostia Nitrogen 25 39 68 89A l00A 818 82
Phosphorus 27 42 77 100 100 812 81
i Sediment 47 72 100 l00A) l00A 875 88
Bacteria 21 33 46 59A 64 879 88
Trash 41 65 89 l00A) 100
Impervious Treated (acres) 1541 1961 2381 3625 3989
ESD ( Impervious) 17 28 36 57A 61
Cost (Million $) 87 172 262 566 658
ESD ( Cost) 7(JA 79 79A 89A 9(JA
Rock Creek Nitrogen 24 30 38 55 61
Phosphorus 25 3(JA 38 54 GfJA)
Sediment 38 50 92 l00A 100
Bacteria 21 27 33 5(JA 55 96(JA 96
Trash 17 24 31 5(JA) 55
Impervious Treated (acres) 187 380 570 1018 1018
ESD ( Impervious) 52 72 78 87A 87A
Cost (Million $) 23 65 114 215 219
ESD ( Cost) 92 91 86 90 88
Cabin John Nitrogen 21 27A 39A 55 58 Phosphorus 2(JA 26 35 49 51
Sediment 6 17 GfJA 91 100
Bacteria 16 22 27 4(JA) 40 31 31
Trash 6 12 19 34 34
Impervious Treated (acres) 237 237 237 237 237
ESD ( Impervious) 4 4 4 4 4
Cost (Million $) 6 8 19 25 31
ESD ( Cost) 32 27A 11 8 7
Muddy Watts Nitrogen 6 7 15 18 22
Phosphorus 6 7 10 12 13 Sediment 7 8 14 17 2(JA
Bacteria 0 (JA 0 (JA 0 i Trash 6 6 6 6 6
bull Impervious Treated (acres) 901 921 941 941 941 ESD ( Impervious) 2 2 2 2 2
Cost (Million $) 26 48 SO 51 52 ESD ( Cost) 15 8 8 8 8
Great Seneca Nitrogen 24 41 43 44 45
Phosphorus 24 32 34 34 34
i Sediment 26 41 43 44 44
I Bacteria (JA) 0 0 0 (JA
Trash 31 32 33 33 33
021611
Montgomery County Coordinated Implementation Strategy - DRAFT
Pe rmitTMDL Targets
Watershed Fiscal Year 2015 2017 2020 2025 2030 2017 2020
Clopper
Impervious Treated (acres) 0 6 12 22 22
ESD ( Impervious) 0 86 86 92 92
Cost (Million $) 0 0 1 2 2
ESD ( Cost) 0 72 73 84 84
Nitrogen 61 67 72 79 79
Phosphorus 30 36 41 48 48 45 45
Sediment 0 5 10 17 17
Bacteria 0 0 0 0 0
Trash 0 6 11 18 18
Lower Monocacy
Impervious Treated (acres) 1 16 32 58 58
ESD ( Impervious) 100 85 84 91 91
Cost (Million $) 0 4 11 18 20
ESD ( Cost) 100 85 54 63 58
Nitrogen 0 5 14 22 24
Phosphorus 0 5 16 26 28
Sediment 0 5 46 61 69 608 61
Bacteria 0 6 12 19 19
Trash 0 0 0 0 0
Rocky Gorge
Impervious Treated (acres) 11 88 165 307 307
ESD ( Impervious) 64 89 90 95 95
Cost (Million $) 3 17 40 70 75
ESD ( Cost) 55 82 64 73 68
Nitrogen 47 55 6710 82 85
Phosphorus 17 25 36 52 53 15 15
Sediment 10 19 45 7(J1o 79
Bacteria 14 23 32 47 47
Trash 15 30 46 68 68
Triadelphia
Impervious Treated (acres) 3 12 20 38 38
ESD ( Impervious) 100 98 97 99 99
Cost (Million $) 1 3 5 9 9
ESD ( Cost) 99 98 98 99 99
Nitrogen 24 27 29 34 34
Phosphorus 4 7 9 14 14 15 15
Sediment 1 4 6 12 12
Bacteria 1 4 6 12 12
Trash 2 6 11 21 21
Countywide
Impervious Treated (acres) 4302 6014 7722 10518 11154 6008 7723
ESD ( Impervious) 18 34 47 6(J1o 63
Cost (Million $) 305 622 987 1687 1884
ESD ( Cost) 53 66 7(J1o 8(J1o 80
Nitrogen 18 25 36 46 51 9 2(J1o
Phosphorus 17 23 34 44 46 12 34
Sediment 23 34 54 6(J1o 62 20 37
Bacteria 11 15 20 28 30
Trash 18 26 33 41 42
Assumptio~s
1 Does no~ includerepeated Outreach and Education costs beyond FY2015
2 Does not include ~n inflation multiplier
021611
Montgomery County Coordinated Implementation Strategy - DRAFT
Summary of Individual Implementation Plans
A summary of the general considerations and prioritization for each watershed implementation
plan is provided below
Anacostia - For the first permit cycle (through 2015) a priority was placed on full
implementation of completed high and low priority projects Next implementation of a third
of the other potential projects was targeted as a large number of these were identified in
conjunction with the USACEs Anacostia Watershed Restoration Plan efforts ESD was
emphasized on both public (10) and private property (10) Finally outreach (25) and
stream restoration (12) are targeted for pollutant load reduction but are not credited towards
impervious cover credit In future permit cycles the remainder of the other potential projects
are targeted along with ESD and a limited amount of riparian reforestation for impervious cover
and pollutant load reduction Outreach and stream restoration are significant strategies
pursued for load reduction benefits Nutrient and sediment MS4 permit area WLAs are met by
2030 but bacteria load reduction does not meet MS4 permit area WLA compliance The
remaining bacteria reduction is believed to be associated with urban wildlife sources Unless
intense urban wildlife management practices are implemented this remaining load reduction
will not be possible
Rock Creek- For the first permit cycle (through 2015) a priority was placed on full
implementation of complete high and low priority projects Next 25 implementation of
other potential projects was targeted ESD was emphasized on both public (10) and private
property (10) with private property implementation being linked to Rainscapes Program
success Finally outreach (100) and stream restoration (22) are targeted for pollutant load
reduction but are not credited towards impervious cover credit In future permit cycles the
remainder of the other potential projects are targeted along with ESD and riparian
reforestation for impervious cover and pollutant load reduction Stream restoration is a
significant strategy pursued for load reduction benefits The bacterial load reduction does not
meet MS4 permit area WLA compliance However the remaining bacterial load is believed to
be associated with urban wildlife sources Unless intense urban wildlife management practices
are implemented this remaining load reduction will not be possible
Cabin John Creek - Similar to the other two more urban watersheds in the County during the
first permit cycle (through 2015) a priority was placed on full implementation of complete high
and low priority projects Fewer opportunities exist overall compared to the Anacostia and Rock
Creek Next 25 implementation of other potential projects was targeted ESD was
emphasized on both public (10) and private property (10) Finally outreach (100) was
021611
Montgomery County Coordinated Implementation Strategy - DRAFT
targeted for pollutant load reduction but not credited towards impervious cover credit No
riparian reforestation or stream restoration was targeted due to limited or no opportunities In
future permit cycles the remainder of the other potential projects are targeted along with ESD
and some riparian reforestation for impervious cover and pollutant load reduction The
bacteria load reduction meets MS4 permit area WLA compliance by 2025
Muddy BranchWatts Branch - During the first permit cycle (through 2015) a priority was
placed on full implementation of complete high and low priority projects Fewer opportunities
exist overall compared to the Anacostia and Rock Creek Watersheds No other strategies were
pursued as there are no existing TMDLs in the Muddy BranchWatts Branch subwatersheds In
future permit cycles previously identified stream restoration projects are implemented for
pollutant load reduction
Great Seneca Creek - This watershed implementation plan is unique in that it includes the small
Clopper Lake subwatershed which has a TMDL for phosphorus Even with the TMDL there are
limited identified opportunities to pursue in the Clopper Lake subwatershed in part due to the
limited area of the subwatershed within the County MS4 permit area During the first permit
cycle (through 2015) a priority was placed on full implementation of complete high and low
priority projects within Great Seneca Creek subwatershed No opportunities exist for these
strategies in Clopper Lake However full outreach was applied in Clopper Lake in the first
permit cycle In future years other potential projects ESD on public and private property and a
small amount of riparian reforestation (in Clopper Lake) is pursued The Clopper Lake WLA for
phosphorus within the MS4 permit area is met
Patuxent - During the first permit cycle through 2015 a priority was placed on full
implementation of complete high and low priority projects Far fewer opportunities exist
overall compared to the Anacostia and Rock Creek A limited amount of ESD on private land
and stream restoration was pursued Finally outreach (100) was targeted for pollutant load
reduction (primarily nutrients) but not credited towards impervious cover credit No riparian
reforestation was targeted within the MS4 Permit area due to cost effectiveness in the Rocky
Gorge subwatershed and limited opportunities in the Triadelphia subwatershed In future
permit cycles ESD on private and public land is pursued more substantially as is stream
restoration A limited amount of riparian reforestation achieves some impervious cover and
pollutant load reduction The Rocky Gorge phosphorus WLA within the MS4 permit area is met
easily and the Tridelphia phosphorus WLA is also met but with a longer timeframe needed for
compliance
021611
Montgomery County Coordinated Implementation Strategy - DRAFT
Lower Monocacy Creek -lower Monocacy Creek is the most rural watershed in the County and
has the least amount of area subject to the County MS4 permit In addition there are no preshy
identified restoration projects within the watershed Therefore during the first permit cycle
(through 2015) only a very small amount (5) of private property ESD is pursued It is not until
the second permit cycle that more focus is placed on private and public ESD as well as stream
restoration and programmatic strategies such as street sweeping to target sediment loads
associated with the TM Dl In future permit cycles stream restoration is pursued for pollutant
load reduction The sediment WlA within the MS4 permit area is projected to be met around
2025
Countywide - The Countywide effort was driven by impervious cover treatment targets and
Chesapeake Bay TMDl2017 and 2020 reduction targets associated with sediment and nutrients
for urban MS4s For impervious cover it was assumed that a 20 target would be required for
each five-year permit cycle The Bay TMDl targets for urban MS4 areas were easily met for all
pollutants in 2017 and easily met for nitrogen and sediment but more difficult to meet for
phosphorus in 2020
Public Outreach and Stewardship
The County recognizes and is committed to the increasingly important role that public outreach
and stewardship will play if improved water quality conditions are going to be achieved
countywide While the County currently has a very active and layered outreach program the
model requires changes that will result in broader stakeholder groups serving as the leaders
and primary champions for clean water in their communities This includes greater participation
from minority and faith-based groups business consortiums schools neighborhood
associations and civic groups Additionally the new model requires revisiting current
initiatives carried out by the various County agencies to look for better and more efficient ways
to communicate messages cross-train and create synergies that result in greater engagement
greater awareness and sustained changes in behavior
Within each implementation plan specific suggestions for outreach and education
opportunities are identified In addition Appendix E of this Strategy contains practice sheets
which highlight targeted restoration activities for the County to develop and refine A total of
eight practices have been identified that can be adopted countywide or in more targeted
watershed areas where there are specific water quality issues to address Many of the
practices build upon existing County programs but require a much broader reach to new
partner groups Program start up costs are suggested and were used to for cost estimates
associated with Countywide strategy The highlighted practices include
021611
Montgomery County Coordinated Implementation Strategy - DRAFT
bull Pet Waste Pickup Education and Outreach Campaign
bull Lawn Stewardship Education and Outreach Campaign
bull Anti-littering Education and Outreach Campaign
bull Innovative Stormwater Management Awareness Campaign
bull Stream Stewards Education and Outreach Campaign
bull Riparian Reforestation Education and Outreach Campaign
bull Roof Runoff Reduction Education and Outreach Campaign
bull Parking Lot Recharge Value Education and Outreach Campaign
Start up costs by practice along with an overall five year cost estimate are provided in Table
43 Start up timeframes are assumed to be up to 18 months
Table 43 Outreach Start Up and 5-Year Cost Projections
Practice Practice Start Up Cost
Pet Waste Pickup $240500
Lawn Stewardship $301 600
Anti-Littering $175050
Stormwater Management Improvements Awareness $50450
Stream Stewards $74825
Riparian Reforestation $30575
Roof Runoff Reduction $101400
Parking Lot Recharge Value $41500
Estimated Start Up Total $744900
5-Year Outreach Budget Projection $2650000
These eight practice sheets provide specific costs and timelines for implementation They also
provide suggestions for measuring program success These practice sheets along with the
specific recommendations in the implementation plans make up the Public Outreach and
Education Campaign
Trash Reduction
Most of the implementation plans have to address trash loadings to meet requirements of the
Potomac Trash Treaty that is referenced in the County1s MS4 Permit In addition the Anacostia
Trash TMDL has recently been accepted by MDE and the EPA According to the Anacostia
021611
Montgomery County Coordinated Implementation Strategy - DRAFT
TMDl there is reasonable assurance that the goals of the Treaty and TMDl can be met with
proper watershed planning implementing pollution-reduction BMPs and using strong political
and financial mechanisms
Currently the County has a number of activities which target trash reduction They include the
following
bull Adopt-a-Road Program through DOT which focuses on public awareness and involvement in trash management There are 205 participants who adopted road segments and agreed to six major road cleanups per year
bull Storm Drain Marking through DOT bull Support for illegal dumping enforcement outreach and research and monitoring bull Partnership with DOT to conduct street sweeping covering about 2500 curb miles and
occurring once a year
bull Partnership with the Park Police to monitor illegal dumping which combined enforces 300-400 actions a year
bull Non-residential and residential recycling programs through Solid Waste Services (SWS) bull Transit stop trash management program at 600 bus stops countywide supported by DOT
Transit Services
In addition to continuing these efforts a number of trash good-housekeeping efforts have been
proposed as part of this Strategy A detailed description of the quantitative methods and
strategies applied can be found in Appendix E of the Guidance Document In general the
following six trash-reduction strategies are recommended
1 Significantly increase funding for trash reduction programs 2 Create and enhance regional partnerships and coordination among businesses
environmental groups individual citizens and government at all levels and in all jurisdictions
3 Improve peoples awareness knowledge and behavior relating to littering and illegal dumping
4 Promote the greater introduction and use of effective trash-reduction technologies and approaches
5 Improve enactment and enforcement of laws to reduce trash 6 Increase trash monitoring-related data collection generation and dissemination efforts
The Anacostia watershed implementation plan provides an outline of the actions that will be
taken through the first permit cycle to reduce trash The range of programs and practices
specially aimed at reducing trash inputs to roads and streams that will be targeted include
reduce reuse and recycle campaigns littering and illegal dumping enforcement stream
cleanups and street sweeping These measures are in addition to any trash trapped and
021611
Montgomery County Coordinated Implementation Strategy - DRAFT
removed by structural practices which are computed using the WTM The plan shows that the
trash TMDl can be met by 2025 at a cost of 732 million dollars
Adaptive Management Monitoring and Reporting
Sound implementation strategies require assessment and effective adaptation to respond to
new information changing conditions new technologies and lessons learned This will be the
basis of the plan that will be used when benchmarks are not met and the projected funding is
inadequate
Adaptive management requires monitoring of a variety of measures that can be used to
determine whether progress is being made towards meeting the Countywide water quality
objectives Ultimately it is the instream water quality and the loading limits with respect to the
TMDls that determine the success of implementation however there are many interim
measures that can also be correlated to success which are worthwhile pursuing
Surface water monitoring can be an expensive and time consuming undertaking Montgomery
County is fortunate to have an extensive Countywide stream monitoring network that can serve
as a foundation for providing spatial and temporal data to indicate stream health The Countys
MS4 Permit also outlines the required assessment of controls which includes chemical
biological and physical monitoring Specifically the permit calls for the County to continue
their watershed restoration monitoring of the lower Paint Branch subwatershed and physical
monitoring ofthe Clarksburg Special Protection area In addition to the existing monitoring
network the County will continue tracking and data reporting associated with levels of
implementation (eg acres of impervious cover treated areas of buffer planted miles of
stream restored miles of streets swept) For measuring effectiveness of outreach and
stewardship efforts other types of monitoring and reporting are planned that include before
and after attitude surveys frequency of website visits and information requests
For many restoration strategies it may be difficult to tease out their individual effectiveness in
terms of pollutant load reductions but collectively the monitoring that occurs should provide
adequate insight into the overall effectiveness of a layered implementation strategy
In addition to the monitoring and assessment the County will be reporting results on an annual
basis as part of their NPDES MS4 Permit annual report The MS4 Permit requires annual
reporting of the following
021611
Montgomery County Coordinated Implementation Strategy - DRAFT
bull The status of implementing the components of the stormwater management program
that are established as permit conditions
bull A narrative summary describing the results and analyses of data including monitoring
data that is accumulated throughout the reporting year
bull Expenditures for the reporting period and the proposed budget for the upcoming year
bull A summary describing the number and nature of enforcement actions inspections and
public education programs
bull The identification of water quality improvements and documentation of progress
toward meeting applicable WLAs developed under EPA approved TMDLs and
bull The identification of any proposed changes to the Countys program when WLAs are not
being met
The County will build upon annual reporting that has historically occurred to meet permit
requirements and will supplement this reporting with tracking table summaries that quantify
implementation activities for the range of strategies pursued during that year and the
associated treatment (eg impervious cover treated pollutant load reduced education and
outreach partners established etc) Cost will also be tracked in association with rates of
implementation This level of performance will then be compared with countywide strategy
targets (eg progress towards meeting WLAs) associated with key performance dates such as
those presented in Table 41 The level of progress achieved by the County will then feed into
the adaptive management approach described above
Organization Needs to Implement Strategy
Montgomery County DEP staff possesses substantial expertise and institutional knowledge that
yields many positive outcomes and efficient processes under the current pace of restoration
and permit compliance activities Under this strategy however the pace of implementation is
required to significantly increase Based on an increase in the level of implementation it is
reasonable to assume that additional capacity may be needed to provide sufficient oversight
and management of all the projects
Another critical element of this strategy is the recognition and commitment to pursuing
outreach initiatives that build community capacity by targeting new partner groups that
provide the necessary leadership oversight and sustained effort to change behaviors and
foster stewardship The County currently carries out many well established and managed
outreach programs but it may require additional focus across County agencies and
departments for these partnerships to become established and thrive
021611 G
Montgomery County Coordinated Implementation Strategy - DRAFT
Through the implementation process and the monitoring and reporting that is required large
amounts of data will be generated Technological advances happen so rapidly in this day and
age it will be important for the County to stay current with technology and methods so that
more efficient and cost-effective data management and reporting will be possible The County
currently relies on a detailed and sophisticated GIS to spatially locate projects and manage
tables of data related to projects The growth and development of this spatial database will be
a critical component of the reporting and tracking capability of the County These databases
generate the input data that are used to measure progress towards baseline loading targets
Regular review and upkeep of the data as well as routine summarization of progress (annually
at a minimum) will likely require additional dedication of staff This is especially the case during
periods where the implementation rate of structural practices in the ground is accelerated
021611
Montgomery County Coordinated Implementation Strategy - DRAFT
Appendix C - Restoration Potential by Watershed
021611
c-
04 03 02 01
a
_ Nitrogen Load Reduction
--shy TMDL WLA Target
_Cost
MONTGOMERY COUNTY URBAN WATERSHEDS POLLUTANTS _Bk)~Ibilats ~1~ l~ fjfsi --
Rank
1
2
3
4
5
6
7
8
9
10
11
Restoration Strategy TN reduction
Ibsyr
Pet Waste Education 15169
Retrofit of Underperforming BMPs 1769
Stream Restoration 72423
Completed Projects ~43 High Priority Projects 3260
Other Potential Projects 43276
Habitat Restoration 224
Public Property ESD Retrofits 18270
Priority Neighborhoods ESD Retrofits 9271
Private Non-residential ESD Retrofits 5594
Street Sweeping -
Incremental Cost Unit Cost
Million $ IbsMillion $ 088 17193
120 1475
9304 778
948 701
635 513
25430 170
141 158
23655 77
13278 70
8018 70
124 -
Qj c
Qj
nI CXI
o -f-
1 09 08 07 06 05
$900 $800 $700
~ $600 c $500 ~ $400 $300 0 u $200 $100
$shy
~~mf il_~IJrt~
MONTGOMERY COUNTY URBAN WATERSHEDS POLLUTANTS ItfiQ14lbilJts i~5 [i
1 $900 Qj
09 $8005 iii en 08 $700
~co 07 $600 co - til
06 $500 ~ 05- $400 ~ 04 en$300 003 u $20002
en $100I 01 o 0 $shys Q en o
s Q
Phosphorus Load Reduction
--- TMDL WLA Target
__Cost
I Rank I
1
2
3
4
5
6
7
8
9
Restoration Strategy
Pet Waste Education
Retrofit of Underperforming BMPs
Stream Restoration
Completed Projects
High Priority Projects
Habitat Restoration
Other Potential Projects
Public Property ESD Retrofits
Priority Neighborhoods ESD Retrofits
10 I Private Non-residential ESD Retrofits
11 Street Sweeping
TP reduction Incremental Cost Unit Cost
Ibsyr Million $ IbsMillion $ 1979 088 2243
247 120 206
13097 9304 141
915 948 96
451 635 71
37 141 26
6067 25430 24
2546 23655 11
1294 13278 10
781 8018 10
- 124 -
MONTGOMERY COUNTY URBAN WATERSHEDS POLLUTANTS IItQjQhabillt$middot
Cii 5 Cii 11 It CD
6 ~ r o ~ s
0 ltIIa r ltII e c ltII III
1 09 08 07 06 05 04 03 02 01
0
$900
$800 $700
v$600 r
0 $500 == $400 $300 11
0 u $200 $100
$shy
_ Sediment load Reduction
--- TMDl WlA Target
__Cost
Rank Restoration Strategy
Sediment reduction
Incremental Cost
Unit Cost
tonsyr Million $ tonsMillion $ 1 Street Sweeping 800 124 645
2 Stream Restoration 25057 9304 269
3 Retrofit of Underperforming BMPs 25 120 21
4 Completed Projects 97 948 10
5 High Priority Projects 47 635 7
6 Other Potential Projects 660 25430 3
7 I Public Property ESD Retrofits 272 23655 1
8 Priority Neighborhoods ESD Retrofits 139 13278 1
9 Private Non-residential ESD Retrofits 84 8018 1
10 Habitat Restoration 2 141 1
11 Pet Waste Education - 088 -
C-3
MONTGOMERY COUNTY URBAN WATERSHEDS POLLUTANTS
-QI5 5i ~
1 09 08 07 06 05 04 03 02 01
0
$900
$800
$700
$600 ~ 0
$500 == $400 $300 11
0 u $200
$100
$shy
--shy TMDL WLA Target
___ Cost
Rank Restoration Strategy
Enterrococci reduction
Incremental Cost
Unit Cost
Billion MPNyr Million $ Billion MPN Million $
1 Pet Waste Education 19643 088 22263
2 Retrofit of Underperforming BMPs 2781 120 2318
3 Completed Projects 10441 948 1101
4 High Priority Projects 5120 635 806
5 Other Potential Projects 69895 25430 275
6 Riparian Reforestation 310 141 219
7 Public Property ESD Retrofits 29025 23655 123
8 Priority Neighborhoods ESD Retrofits 14777 13278 111
9 Private Non-residential ESD Retrofits 8917 8018 111
10 Stream Restoration - 9304 -
11 Street Sweeping - 124 I -
~ I~~~i MONTGOMERY COUNTY URBAN WATERSHEDS POLLUTANTS 1tI2~mL ~ I~I
~$ I -~-- I
100 90 80 70 60 50 40 30 20 10
0
$900 $800 $700 $600 $500 $400 $300 $200 $100 $shy
vi c
~ 5 11 0 u
Implementation Phase
Potential Trash Incremental Unit Cost
I
Rank Restoration Strategy Reduction Cost
Ibsyear Million $ IbsMillion $ 1 Recycling Education and Investigations 51654 02 238837
2 Plastic Bag Ban and Misc Enforcement 63546 13 48882
3 Anti-litter Campaign Education 23J61 09 26930
4 Retrofit of Underperforming BMPs 1144 12 954
5 Completed Projects 6598 95 696
6 High Priority Projects 2786 64 439
7 Other Potential Projects 56341 2543 222
8 Habitat Restoration 266 14 188
9 Street Sweeping 204 12 164
10 Public Property ESD Retrofits 25348 2366 107
11 Priority lIeighborhoods ESD Retrofits 12529 1328 94
12 Private Non-residential ESD Retrofits 7547 802 94 ru Stream Restoration - 930 -14 Pet Waste Education - 09 -
C-5
MONTGOMERY COUNTY URBAN WATERSHEDS POLLUTANTS
CABIN JOHN
1 250
__CostImplementation Phase
09 08 07 06 05 04 03 02 01
0
200 ~ c
150 g E
100 - ltII 0 u
50
0
_E Coli
- - - Waste Load Allocation
Rank Restoration Strategy
E coli reduction
Incremental Cost
Unit Cost
Billion
MPNyr Million $
Billion MPN
Million $ 1 Pet Waste Education 4388 $05 9436
2 Underperforming BMP Retrofits 1892 $19 1022
3 High Priority Projects 1289 $16 800
4 Riparian Reforestation 1133 $78 146
5 Other Potential Projects 148 $17 86
6 Public Property ESD Retrofits 4AOO $860 Sl 7 Private Non-residential ESD Retrofits 1618 $392 41
8 Priority Neighborhoods ESD Retrofits 2633 $638 41
9 Completed Projects 112 $00 0
C-6
MONTGOMERY COUNTY URBAN WATERSHEDS POLLUTANTS 1Itf~~Jabitm
ROCK CREEK
1 $700 Qj5 09
o
_
$600 Qj 08
111 $500 ~ampl 07 c
t5 06 $400 ~ e 05 ~ $3005 04 - 111tl 03 $200 0 u-6 02
$100J 01 $-
Enterrococci
- - - Waste load Allocation Implementation Phase
__Cost
Rank Restoration Strategy
Enterrococci reduction
Incremental Cost
Unit Cost
Billion MPNyr Million $ Billion MPN Million $
Et Pet Waste Management 35734 118 30190
Underperforming BMP Upgrades
Other Potential Projects
28800
30239
577
1083
4995
2792
4 Completed Projects 12131 444 2734
5 High Priority Projects 14239 890 1600
6 Riparian Reforestation 18999 2384 797
7 County Property ESD Retrofits 54519 24136 226
8 Private Residential ESD Retrofits 35230 17737 199
9 Private Non-residential ESD Retrofits 32A86 16380 198
C-7
MONTGOMERY COUNTY URBAN WATERSHEDS POLLUTANTS _f~~pabitafS (fi~r ~~ l-middotshy
ROCK CREEK
100 $900 90 $800 80 $700 u70 $600 c 60 2$50050 -~$40040
lt1$300 030 $200 u
20 10 $100
0 $shy
Implementation Phase
Rank Restoration Strategy Trash Reduction
Incremental Cost
Unit Cost I
Ibsyear Million $ IbsMillion $ 1 Other Potential Projects 16038 1085 1478
2 Underperforming BMP Upgrades 6756 577 1172
3 Completed Projects 4217 444 950
4 High Priority Projects 6366 890 715
5 Riparian Reforestation 9237 2384 387
6 Public Property ESD Retrofits 24587 24136 102
7 Priority Neighborhoods ESD Retrofits 16155 17737 91
8 Private Non-residential ESD Retrofits 14793 16380 90
9 Pet Waste Education - 118 -
(-8
MONTGOMERY COUNTY RURAL WATERSHEDS POLLUTANTS
SENECA - CLOPPER LAKE -
100 Qi
90 iii 80VI to -CQ 70 0 60e 50I 0 40 u l 30
C QJ 20ex
C 10to 0
J 0
$18
$16
$14 n
$12 I
$10 sect $08 ~ $06 0
VI
U $04
$02
$shy
_TPRemoval - - - TMDL Reduction Target
Implementation Phase ___Cost
Rank Restoration Strategy TP
Reduction (Ibsyr)
Incremental Cost (Million $)
Unit Cost (IbsvrMillion $)
1 Residential Education 33 001 6246
2 Underperforming BMP Retrofits 13 004 341 3 Riparian Buffer Reforestation 19 023 99 4 Priority Neighborhood ESD Retrofits 15 051 35 5 Public Property ESD Retrofits 7 075 99
C-9
-pj[fti
MONTGOMERY COUNTY URBAN WATERSHEDS POLLUTANTS 1It[~~JIlbitIL f bull~
LOWER MONOCACY
1 09 08 07 06 05 04 03 02 01
0
Implementation Phase
25
20 ~ c
15 ~ ~
10 - 0 u
5
0
_TSS
- - - Waste load Allocation _Cost
Rank Restoration Strategy
Sediment reduction
Incremental
Cost Unit Cost
tonsyear Million $ tonMilli
1 Street Sweeping 22 $007 3121
2 Underperforming BMP Retrofits 4 $010 389
3 Stream Restoration 37 $734 51
4 Riparian Buffer Reforestation 3 $109 25
5 Other Structural BMPs and ESD Strategies 10 $851 12
6 Priority Neighborhoods ESD Retrofits 2 $160 10
7 Non-residential ESD Retrofits 1 $132 10
C-10
MONTGOMERY COUNTY RURAL WATERSHEDS POLLUTANTS 1tlj~lIbiIalSlt~~II
1 09 08 07 06 05 04 03 02 01
0
$70
$60
$50 ~ c
$40 ~ ~ $30 - UI
$20 0 v
$10
$0
_ Phosphorus Load Reduction
- - - Waste Load Allocation ___ CostImplementation Phase
Rank Restoration Strategy TP Incremental Cost
Million $ Unit Cost
Ibsyr Ibs Million $ 1 Lawn Care Education 3670 01 37394
2 Underperforming BMP Retrofits 3499 08 4338
3 Other Potential Projects 3524 33 1076
4 High Priority Projects 252 04 685
5 Riparian Reforestation 762 26 298
6 Public Property Retrofits 5854 345 169
7 Priority Neighborhoods ESD Retrofits 796 65 123
8 Private Non-residential ESD Retrofits 1941 168 116
9 Completed Projects 53 00 00
c- 11
MONTGOMERY COUNTY RURAL WATERSHEDS POLLUTANTSal12hdJilats ~I~ ~ [ -
1 10 ii 5 09 9 1 08 8 II al- 07 7 1ii o 06 6
c
~ ~ 1 o E IV
05 04 03
5 4
3
~ 11 0 u
0 11 02 2 J o 01 1
t a 0 0 11 o
t 0
_ Phosphorus Reduction
- - - Waste Load Allocation
-Cost
Rank Restoration Strategy TP Incremental Cost
Million $ Unit Cost
Ibsyr Ibs Million $ 1 Lawn Care Education 3670 01 37394
2 Underperforming BMP Retrofits 3499 08 4338
3 Other Potential Projects 3524 33 1076
4 High Priority Projects 252 04 685
5 Riparian Reforestation 762 26 298
6 Public Property Retrofits 5854 345 169
7 Priority Neighborhoods ESD Retrofits 796 65 123
8 Private Non-residential ESD Retrofits 1941 168 116
9 Completed Projects 53 00 00
C-12
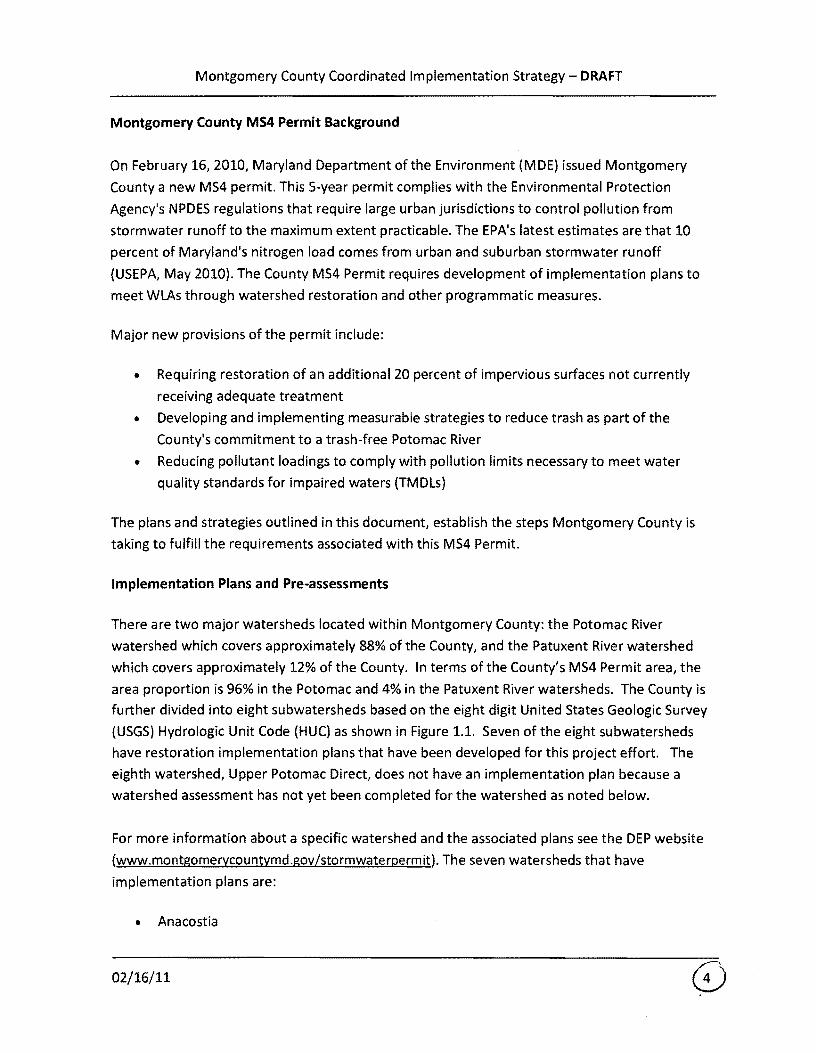
Montgomery County Coordinated Implementation Strategy - DRAFT
Montgomery County MS4 Permit Background
On February 16 2010 Maryland Department of the Environment (MOE) issued Montgomery
County a new MS4 permit This S-year permit complies with the Environmental Protection
Agencys NPDES regulations that require large urban jurisdictions to control pollution from
stormwater runoff to the maximum extent practicable The EPAs latest estimates are that 10
percent of Marylands nitrogen load comes from urban and suburban stormwater runoff
(USEPA May 2010) The County MS4 Permit requires development of implementation plans to
meet WLAs through watershed restoration and other programmatic measures
Major new provisions of the permit include
bull Requiring restoration of an additional 20 percent of impervious surfaces not currently
receiving adequate treatment
bull Developing and implementing measurable strategies to reduce trash as part of the
Countys commitment to a trash-free Potomac River
bull Reducing pollutant loadings to comply with pollution limits necessary to meet water
quality standards for impaired waters (TMDLs)
The plans and strategies outlined in this document establish the steps Montgomery County is
taking to fulfill the requirements associated with this MS4 Permit
Implementation Plans and Pre-assessments
There are two major watersheds located within Montgomery County the Potomac River
watershed which covers approximately 88 of the County and the Patuxent River watershed
which covers approximately 12 of the County In terms of the Countys MS4 Permit area the
area proportion is 96 in the Potomac and 4 in the Patuxent River watersheds The County is
further divided into eight subwatersheds based on the eight digit United States Geologic Survey
(USGS) Hydrologic Unit Code (HUC) as shown in Figure 11 Seven of the eight subwatersheds
have restoration implementation plans that have been developed for this project effort The
eighth watershed Upper Potomac Direct does not have an implementation plan because a
watershed assessment has not yet been completed for the watershed as noted below
For more information about a specific watershed and the associated plans see the DEP website
(wwwmontgomerycountymdgovstormwaterpermit) The seven watersheds that have
implementation plans are
bull Anacostia
021611
Montgomery County Coordinated Implementation Strategy - DRAFT
bull Cabin John Creek
bull Lower Monocacy
bull Lower Potomac Direct (Muddy Branch and Watts Branch)
bull Patuxent
bull Rock Creek
bull Seneca Creek (Great Seneca including Clopper Lake)
lEGeND
_ Stal N nfU 1 P r
M3or ~til~hd5
D Atgt~
o COIIlln Jchl
D La frloocKJ
o Law Pctamox Quo
Dpsa~ll l Rod ~(~
Figure 11 Map of Watersheds
The goals of the implementation plans are to
bull Identify feasible best management practices (BMPs)
bull Quantify the area they treat and the amount of pollutants they can remove from
stormwater runoff before entering into the Countys streams rivers and lakes
021611
Montgomery County Coordinated Implementation Strategy - DRAFT
bull Determine the restoration potential for each watershed or subwatershed and evaluate
the ability to meet applicable TMDLs
bull Provide a schedule and cost estimate for meeting the WLAs set by the TMDL
In addition to the seven implementation plans there are three watershed pre-assessments that
have been completed for watersheds that have not been previously assessed The preshy
assessments will be used by the County to develop watershed assessments and associated
implementation plans which will be completed this permit cycle They include
bull Seneca Creek Little Seneca and Dry Seneca
bull Lower Potomac Direct including Rock Run and Little Falls but excluding Muddy Branch
and Watts Branch
bull Upper Potomac Direct including Little Monocacy amp Broad Run
The seven implementation plans (Table 12) provided the input data for the development of
this Strategy
Table 12 Watershed Groupings and Plans
Pre-Assessment
x x
x x
lower Potomac Direct (East of Seneca Creek not described in any other grouping)
Muddy Branch and Watts Branch x All other subwatersheds x
Patuxent (TriadelphiaBrighton Dam and Rocky
Gorge)
x
Great Seneca (including Clopper Lake)
Dry Seneca and Little Seneca
lower Monocacy
Upper Potomac Direct (West of Seneca Creek not described in any other grouping)
Trash Free Potomac
The Alice Ferguson Foundation founded the Trash Free Potomac Watershed Initiative (TFPWI)
in 2005 to reduce trash and increase awareness of trash issues in the watershed TFPWI actions
021611
Montgomery County Coordinated Implementation Strategy - DRAFT
include the Potomac River Watershed Trash Treaty Annual Potomac River Watershed Trash
Summit Annual Potomac River Watershed Cleanup market-based approaches such as the
Trash Free Potomac Facility Program and a Regional Anti-Litter Campaign (Alice Ferguson
Foundation 2011) The MS4 permit requires Montgomery County to meet the commitments of
Potomac River Watershed Treaty The permit specifically requires that Montgomery County
1 Support and implement regional strategies to reduce trash
2 Develop a work plan to implement a public outreach and education campaign
3 Establish baseline conditions of trash being discharged and develop a reduction strategy
and work plan for the Montgomery County portion of the Anacostia Watershed
4 Implement approved control measures in accordance with the trash reduction work
plan
5 Conduct public participation in development of trash reduction strategy
6 Submit progress annually
Public Outreach and Stewardship
The Countys MS4 Permit requires significant opportunities for public participation in achieving
TMDls watershed restoration and trash management The permit specifically requires the
County to prepare a work plan to implement a public outreach and education campaign The
County recognizes that a successful strategy will require a significant increase in effective and
coordinated public outreach and public stewardship The implementation plans and this
Strategy describe how DEP plans to implement public outreach and education campaigns with
specific performance goals and deadlines
021611
Montgomery County Coordinated Implementation Strategy - DRAFT
2 EXISTING CONDITIONS
Watershed health is variable throughout the County and typically well correlated with intensity
and age of urbanization More specifically watershed health typically declines with increasing
density and older age of development Many of Montgomery Countys older urban and
suburban areas were developed in an era when runoff from paved surfaces (roads parking lots
driveways) was directed to storm drains which conveyed untreated runoff directly to streams
This large volume of water caused massive erosion of the stream banks and destroyed habitat
Stormwater treatment using stormwater ponds to receive detain and filter runoff before it
flowed into streams was either inadequate or non-existent The Anacostia Rock Creek and
Cabin John Creek watersheds are examples where these conditions are common Modern
stormwater techniques known as environmental site design or ESD encourage the reduction
of runoff by infiltrating the water into the ground near its source
Watershed health improves in more rural areas of the County but even in these areas stream
degradation can occur stemming from large lot development and poor agricultural
management practices
The County has conducted comprehensive water quality and biological sampling for more than
a decade which provides a representative snapshot of existing watershed health as well as the
ability to track watershed health over time Figure 21 shows countywide watershed resource
conditions based on monitoring that was conducted from 2000-2008 The area inside the
beltway in the more urban core has lower water quality (fair to poor) while the area outside the
beltway tends to have better water quality (fair to good to excellent)
021611
---- -
-----
Montgomery County Coordinated Implementation Strategy - DRAFT
Watershed Resource Conditions Montgomery County Maryland
LEGEND z fbn
G 0middot1 - -~UlIS
- tI)Jogtf~
UJJOf Wrw Ftns
Splaquo1lII PnreltbOrI NtH SPAl
3D~~ennHI
[=jji=---~~-
Figure 21 County Watershed Resource Conditions
County Statistics
The Strategy will benefit from the fact that the majority of county residents own the property
they reside on (nearly 70) and thus have control over that property Also nearly 70 of the
residences are single unit homes Moreover the average household income is roughly $90000
making the likelihood of financial capability to install BMPs an appropriate assumption Both of
these statistics make advocacy of BMPs on residential properties an imperative for the Strategy
Montgomery Countys robust business economy was also considered in the Strategy
development Despite the current economic volatility Montgomery Countys business
community is still profitable and still maintaining and improving existing facilities Moreover
the construction of the inter-county-connector (ICC) through much of Montgomery County will
provide opportunities to install demonstration BMPs on newly developing properties for
replication throughout stakeholder groups Also the presence of communication industry
leaders (ie Discovery Channel) in the County creates unique stewardship education
partnership possibilities with businesses The Strategy will include these stakeholders
021611
Montgomery County Coordinated Implementation Strategy - DRAFT
involvement opportunities to best harness the power of Montgomery Countys healthy
business economy
The county includes a fairly even split of males and females The majority of residents nearly
50 fall between the ages of 25 and 55 Only 15 of the population is aged 60 and above In
addition the majority of Montgomery County residents indicate their preferred language as
English however Spanish translations of stakeholder involvement opportunities will be
required in select watersheds to accommodate the 13 of county residents that indicate their
preferred language as Spanish Other potential target groups for translation for stakeholder
involvement include the Asian community as 11 of the countys population is Asian (mostly
Korean and Vietnamese) Because of this the Strategy and implementation plans will take
multilingual requirements into consideration for signage and other educational tools as well
MS4 Permit Coverage
The Countys most recent NPDES MS4 stormwater permit only covers runoff from
developments within the County area The following areas are excluded from the Countys MS4
permit area shown in Figure 22
bull Cities of Gaithersburg Rockville and Takoma Park
bull Maryland National Capital Park and Planning Commission (MNCPPC) lands
bull Washington Sanitary Sewer Commission (WSSC) land
bull Federal and State government owned land and facilities
bull Rural zoning
021611 G
Montgomery County Coordinated Implementation Strategy - DRAFT
MS4 Permit Area Montgomery County Maryland
(-i Gaithersbur9 ~
M Ro ckville
TkD m Parilt -Jr MNC PPC Lnds
0 5 3
Feder 1 and SI PropertyM i KbnelefS
M 0 I 2 ~- Federal and Sta1e Roads
~ i s Rural Zon ing
Figure 22 Areas outside the Montgomery County MS4 Permit Area
Impervious Surfaces
As previously mentioned the Countys MS4 Permit requires treatment of an additional 20 of
impervious cover not currently receiving treatment to the MEP Table 21 presents a summary
of the countywide impervious cover totals along with breakdowns by major land cover type
These land covers will be the focus of much of the Countys targeted effort to treat the 20
target
021611
Montgomery County Coordinated Implementation Strategy - DRAFT
Table 2llmpervious Surface Summary
Description
Total County Area 324552 100
Total Area of 1m ervious Surface 35965 _ _-----shy 11
County Area Subject to Stormwater Permit (1) 138649 43
Imllervious Cover Subject to Stormwater Permit 2) ~==5119====18o2 == ==== Areas of Impervious Surface (3)
Road 13607 38
Building 13073 36
Parking 22
Sidewalk 1069 3
Recreation (4) 347 1 1 Exclusions include Certain zoning codes parklands forests municipalities with own stormwater management
programs state and federal properties and state and federal maintained roads 2 Percent of County Jurisdictional Area subject to the Stormwater Permit 3 Impervious area within each category within the total County area 4 Recreation imperviousness excludes swimming pools
Implementation Plan Guidance Document
The Implementation Plan Guidance Document (revised October 252010) provides a road map
for how the implementation plans were created The primary sections of the Guidance
Document and a short description of each are provided in Appendix A
The Guidance Document divides BMPs into five classes or codes shown below The Guidance
Document also provides a list of BMPs and which code they fall under which is provided in
Appendix B
Code 0 Pretreatment Practices
Code 1 Non-performing BMPs No runoff reduction and no long term pollutant removal
Code 2 Under-performing BMPs Limited runoff reduction and low pollutant removal
Code 3 Effective BMPs No runoff reduction but moderate to high pollutant removal
Code 4 ESO BMPs High runoff reduction and moderate to high pollutant removal
Impervious Cover Accounting and Tracking
Montgomery County has GIS data layers that contain all the stormwater BMPs in the County
and their drainage areas In order to determine the 20 target for impervious cover treatment
021611
Montgomery County Coordinated Implementation Strategy - DRAFT
to the MEP the County analyzed their existing impervious cover and their existing BMP
database to determine how much impervious cover is currently being treated to the MEP
Several methods were considered based on a determination of the MEP standard compared to
existing treatment methods According to MDE guidance to be considered MEP a BMP must
capture at least the Water Quality Volume (WQv) (the first inch of rainfall) or the CPv volume
(26 inches of rainfall) The final method used for determining which BMPs are MEP and the
amount of impervious surface not treated to the MEP was as follows
1 All BMPs that were installed after 2002 or are classified as Code 4 were considered MEP
2 An analysis of typical Code 3 stormwater ponds installed after 1986 was performed to
determine if this class of BMPs met the definition of IVIEP Based on that analysis Code
3 BMPs constructed after 1986 are considered MEP
3 All other classes of BMPs not specified above are not considered MEP and are eligible
for retrofit
Table 22 below shows the breakdown of the impervious acres treated by BMP codes and era
(shaded areas are BMP codes treated to the MEP)
Table 22 Acres of Impervious Cover Treated by BMP Code and Design Era
Design Era Post2002 1986-2002 Pre1986 Blank Total
CIJ tl 0 u Q
~ co
0 28 711 24 132 895
1 33 555 1391 367 2346
2 41 299 12 23 375
3 75 2482 1437 267 4261
4 20 459 482 40 1001
Totals 198 4506 3345 828 8877
IC Credit 100 Code 3amp 4 Code 4 Total Acres treated to
MEP 198 2942 482 40 3661
Assuming a total countywide impervious acreage of 25119 acres and an impervious acreage
treated to the MEP of 3661 as shown in Table 22 there are currently 21458 acres of
untreated impervious area Twenty percent of 21458 equates to 4292 acres of impervious
area that must be restored over the current permit cycle
021611
Montgomery County Coordinated Implementation Strategy - DRAFT
Pollutant Load Tracking
In addition to tracking impervious cover it is necessary to compute existing pollutant loads and
projected reductions in loads as a result of applying storm water controls and BMPs The Center
for Watershed Protections (CWP) Watershed Treatment Model (WTM) version 20 (CWP 2001)
was the tool selected to conduct this analysis and track load reductions across a range of
implementation strategies
The WTM uses a spreadsheet model to calculate annual pollutant loads and runoff volumes
The model also accounts for the benefits contributed by a full suite of stormwater treatment
practices and programs The first step in the model calculates existing pollutant loads by adding
primary and secondary source loads then subtracting reductions according to existing
management practices The second step applies future management practices by subtracting
these calculated reductions from the existing loads Appendix B of the Guidance Document
provides a detailed explanation of the assumptions and steps in the modeling process
For each watershed the WTM was run under existing conditions with existing BMPs to
determine a baseline pollutant load for targeted pollutants The baseline period for non-TMDL
parameters was based on 2002 Maryland Department of Planning land useland cover data
coupled with the Countys existing urban BMP database Pollutants targeted included bacteria
Total Phosphorus (TP) Total Nitrogen (TN) Total Suspended Solids (TSS) and Trash Next a
series of model runs was developed for analyzing the pollutant load reduction effect that
various restoration strategies would have based on assumed levels of implementation for the
various strategies Individual restoration strategies that were sequentially modeled included
the following
bull Completed and High Priority Projects - these include projects already completed or high
priority structural BMPs scheduled for retrofit in the FYll-FY16 Capital Improvements
Program (CIP)
bull Low Priority Projects - these includes FY11-FY16 CIP projects that for various reasons
are considered a lower priority
bull Other Potential Projects - these include other projects in existing inventories that were
not listed in the previous two categories For the Anacostia they include projects in
Anacostia Restoration Plan (ARP) prepared by the Army Corp of Engineers
bull Public ESD Retrofits - These include small scale ESD practices applied to County-owned
buildings streets and parking lots and rights of way Examples include rainwater
harvesting green roofs upland reforestation soil compost amendments rooftop
disconnection green street retrofits and converting drainage ditches to dry swales
021611
Montgomery County Coordinated Implementation Strategy - DRAFT
These are Code 4 structures This category also includes other structural BMP upgrades
to existing County BMPs which were designated as under-performing or nonshy
performing
bull Private ESD Retrofits - These projects include ESD on commercial property and
residential property and include green roofs rain gardens and permeable pavement
bull Riparian Reforestation - Focuses primarily on tree planting for riparian buffer
restoration
bull Stream Restoration - Includes the use of natural materials such as rocks logs and native
vegetation to reduce pressure on eroded banks prevent down-cutting of the
streambed and restore the natural meander patterns and slope profiles found in stable
reference streams
bull Programmatic Practices - This category deals with potential pollutant reduction that can
be attributed and quantified through MS4 stormwater pollution prevention
improvements and better housekeeping on County land and facilities Also includes any
pollutant reductions due to product substitution (eg nitrogen and phosphorus limits in
fertilizer) operational programs (eg recycling) and enforcement This category also
deals with reduced pollutants that can be attributed and quantified through MS4
stormwater education (eg lawn care) and outreach aimed at pollution prevention
better housekeeping and increased stewardship
The naming convention applied for the model runs was WTM 10 (ie baseline) WTM 20 (Le
completed and high priority low priority and other potential projects) WTM 30 (Le public
and private ESD) WTM 40 (ie riparian reforestation and stream restoration) and WTM 50
(ie programmatic) Model runs were developed sequentially to yield incremental increases in
load reduction by strategy In practice however strategies can be applied in combination and
out of sequence to achieve targeted outcomes and the most cost-effective solutions A
summary of the scenarios is provided in Table 23 below
021611
Montgomery County Coordinated Implementation Strategy - DRAFT
Table 23 Summary of Watershed Treatment Model (WTM) Scenarios
Implementation Phase Description
The WTM was run under existing conditions approach
WTM Baseline Conditions with the MDP year 2002 land useland cover data and
existing BMPs
WTM 20 Completed as of
2009j High Priorityj Low
Priority and Other Potential
Projects
The WTM was run with a series of future management
practices which were proposed projects from the
County inventory of restoration sites These practices
cover new ponds retrofits of existing BMPs and some
ESD practices from the proposed projects list
The Countys inventory for other project types that
include public properties eg libraries and parkingWTM 30 ESD Strategies and
lots public schools and open section roads available Other Structural BMPs
for ESD retrofits was reviewed as were areas for
private property ESD retrofits
This category includes any pollutant reduction or volume
reduction that can be attributed to specific stream
WTM 40 Habitat rehabilitation wetland restoration and or riparian
Restoration reforestation projects planned for construction in the
watershed for the permit cycle
WTM 50 MS4 Programmatic See description above
Practices
TMDL Calibration and Tracking
Where TMDLs existed for individual watersheds the WTM was run under existing conditions
with existing BMPs based on the year in which the data was collected for TMDL development
The baseline pollutant load was then compared and normalized to the MDE-determined
baseline MS4 load for the TMDL pollutant Any BMPs with approved dates after the year in
which the data was collected for TMDL development were not included in the baseline
calculation but rather were counted towards meeting the TMDL reduction target
Once the normalized model was established reductions achieved through programs and
practices were tracked using the WTM scenarios based on the percent load reduction from
baseline toward meeting the TMDL required WLA The normalized baseline and WLA target are
determined and specified in the relevant TMDL documents developed by M DE
021611
Montgomery County Coordinated Implementation Strategy - DRAFT
3 WATERSHED IMPLEMENTATION PLANS AND RESTORATION POTENTIAL
The watershed implementation plans and pre-assessments developed in conjunction with the
Strategy are driven by regulatory requirements facing each watershed Table 31 summarizes
the drivers by watershed
Table 31 Restoration Objectives -
W~tershedSubwater~hed - Trash
4 bull - I _ _ -
Patuxent
Anacostia
Rock Creek
Great Seneca
Cabin John Creek
lower Monocacy
Watts BranchMuddy Branch
Dry and little Seneca
lower Potomac Direct
Table 32 presents the more detailed and quantitative aspects of the TMDl requirements for
the MS4 portion within each watershed The Strategy has been developed to meet the MS4
permit area WLA compliance targets presented in Tables 32
In addition to the individual watershed requirements there is a Countywide requirement to
comply with the wasteload allocations associated with urban areas under the Chesapeake Bay
TMDl which applies to nutrients and sediment There is an interim target established for 2017
where reductions from baseline conditions of 9 12 and 20 respectively for TN TP and
TSS are to occur Then by 2020 full compliance is required which correspond to reductions
from baseline conditions of 18 34 and 37 respectively for TN TP and TSS
021611
Montgomery County Coordinated Implementation Strategy - DRAFT
Table 32 TMDl Summary by Impairment
Watershed
Cabin John Creek
Rock 2007 Enterococci 970 453669 18195 Creek
Anacostia 2007 Enterococci 860 247809 29978 River
Aoacostia 2008 TN 788 206312 38959 River
Anacostia 2008 TP 797 20953 3947 Ibsyr River
Triadelphia 2008 TP 580 438 Reservoir
Rocky Gorge 2008 TP 480 4268 3628 Reservoir
Clopper Lake 2002 TP 393
Anacostia 2007 TSS 850 7682 River
Triadelphia 2008 TSS Reservoir Clopper 2002 TSS 00 13 13
Lake
Lower 2009 TSS 380010 172 Monocacy
River
Anacostia 2010 Trash 1000 228683 Ibsyr River
Adapted from 2010 Status of Approved Stormwater Waste load Allocations for NPDES Regulated Stormwater Entities in Montgomery County April 27 2010 by Jeff White MDE
Potential to Reduce Stormwater Pollutant loads
Within each of the implementation plans an analysis was developed that explored the
restoration potential for that watershed Cost was not a limiting factor for the analysis but
rather assumptions were made based on feasibility of implementation rates and consideration
of conflicts with typical site conditions with respect to site use utilities land ownership etc
For example it was assumed that 40 of large County-owned parking lots would be available
for stormwater retrofitting These assumptions are necessary for planning purposes where
detailed site investigations have not occurred However some level of implementation is
021611
Montgomery County Coordinated Implementation Strategy - DRAFT
reasonable to assume In addition all identified high priority and low priority County projects
that have the potential to be constructed were assumed to be implemented
Implementation cost and effectiveness (in terms of pollutant load reduced) was also tracked
through the process of determining watershed restoration potential which enables the
costbenefit evaluation of various strategies for a target parameter (eg tons of sediment per
dollar spent or billion MPN of bacteria per dollar etc) For example by tracking cost and
effectiveness it is possible to evaluate the relative costbenefit of a strategy like ESD versus a
non-structural programmatic practice Moreover the comparison of these two strategies is
going to be different depending on what parameter is being considered eg ESD may be more
cost effective for nutrient reduction but less cost effective for bacterial load reduction
The tables in Appendix C help to illustrate this point Specifically a series of summary charts
and tables have been developed that illustrate the cost effectiveness of the range of strategies
considered by watershed with respect to pollutant load reduction The summaries reflect the
full restoration potential developed for each watershed
It is also useful to compare strategy effectiveness and range of opportunity across watersheds
To facilitate this a series of tables were compiled that groups all watersheds together and
considers watershed restoration potential by strategy These summary tables are presented in
Tables 33 through 310
For this analysis stream restoration was treated as a special modeling case (Table 39) because
it was not tracked as a strategy that receives credit for impervious cover treatment and because
it requires a different pollutant load reduction tracking method based on linear feet of
implementation and the existing stream resource condition (good fair or poor IBI scores
received different pollutant removal credit) Further details on stream restoration modeling
are presented in the individual implementation plans and the Guidance Document
Not all WTM scenarios were modeled for all watersheds For example if there were no
previously identified completed high priority low priority or other potential projects within a
watershed they would appear as zeros for that individual watershed in Tables 33 through 36
Also for non-TMDl watersheds such as Great Seneca and Muddy Branch and Watts Branch
subwatersheds the public and private property ESD riparian reforestation and MS4
programmatic practices scenarios were not modeled due to the lack of regulatory drivers that
define pollutant removal targets
021611
Montgomery County Coordinated Implementation Strategy - DRAFT
Table 33 Cost and benefit summary for completed projects (WTM 20)
Watershed Total ESD PrOjects Incremental reduction from baseline ()
i Cost Numberof Impervious
Cost
I Impervious Trash control added TN TP TSS Bacteria
(million $) projects bullbull (ac)
(total) (total)
Anacostia 95 25 167 7 3 4 4 1 4 4
Cabin John 00 0 0 0 0 02 02 03 03 1
Rock Creek 44 6 212 13 1 2 2 3 3 2 i
I Triadelphia 00 0 0 0 0 0 0 0 0 0
Rocky Gorge 00 0 0 0 0 0 01 0 0 0
Lower Monocacy 00 0 0 0 0 0 0 0 0 0
Clopper lake 00 0 0 0 0 0 0 0 0 0
Great Seneca bull 06 2 11 0 0 1 1 I 1 0 2
MuddyWatts 00 0 0 0 0 0 0 0 0 0
Indudes Clopper lake Project count does not include stream restoration Pollutants with a TMDL are highlighted
Table 34 Cost and benefit summary for high priority projects (WTM 20)
Watershed I
I
Total ESD Projects Incremental reduction from baseline ()
Cost
(million $)
i Numberof
projects bullbull
Impervious
control added
(ac)
ICost (total)
Impervious
(total) TN
I TP TSS I TrashBacteria
Anacostia 64 33 148 65 16 2 2 06 2 2
Cabin John 16 6 88 19 2 3 3 3 3 1
Rock Creek 89 14 373 13 1 2 3 3 3 4
Triadelphia 00 0 0 04 0 0 0 0 0 0
I Rocky Gorge 04 2 5 77 27 06 06 07 06 1
Lower Monocacy 00 0 0 0 0 0 0 0 0 0
Clopper lake 00 0 0 0 010 0 0 0 0 0 Great Seneca bull 183 24 789 6 08 19 19 20 0 24
MuddyWatts 44 16 211 8 1 6 6 6 0 6
Indudes Clopper lake bullbull Project count does not indude stream restoration Pollutants with a TMDL are highlighted
Table 35 Cost and benefit summary for low priority projects (WTM 20)
I Watershed Total ESO Projects Incremental reduction from baseline ()
Numberof Impervious ICost 1m ~ i Cost Impervious
I (million $) projects bullbull
control added (total) (total)
TN TP Bacteria Trash
(ac)
I Anacostia 51 16 188 61 8 2 2 07 2 3
Cabin John 16 8 10 98 78 02 02 02 02 03
I Rock Creek 88 24 657 7 1 4 4 6 5 7
Triadelphia 040 1 20 100 100 05 05 06 05 1
Rocky Gorge 09 2 458 100 100 84 82 83 82 116 i
I Lower Monocacy 0 0 0 0 0 0 0 0 0 0 I Clopper lake 0 0 0 0 0 0 0 0 0 0
I Great Seneca bull 66 16 87 41 15 4 4 4 010 4
I MuddyWatts 20 6 26 84 33 0 0 1 0 0
Includes Clopper Lake Project count does not include stream restoration Pollutants wth a TMDL are highlighted
021611
Montgomery County Coordinated Implementation Strategy - DRAFT
Table 36 Cost and benefit summary for other potential projects (WTM 20)
I Watershed Total ESO Projects Incremental reduction from baseline ()
ICost Impervious I Cost
I I Trash INumber of
control added Impervious
TN TP TSS Bacteria (million $) projects bullbull
(ac) (total) (total)
i i
Anacostia 2492 497 2222 73 62 23 8 26 301
Cabin John 00840 1 5 0 010 01 01 01 01 01
Rock Creek 20 4 201 0 0 12 12 19 15 21
Triadelphia 00 0 0 010 0 00 00 00 00 00
Rocky Gorge 20 2 0 010 0 00 00 00 00 00
lower Monocacy 00 0 0 0( 0 00 00 00 00 0010
Clopper Lake 00 0 0 0 0 00 00 00 00 0010
Great Seneca bull 02 S S3 0 0 23 23 27 00 27
MuddyWatts 00 0 0 0 0( 00 00 00 00 0010
bull Includes Clopper Lake bullbull Project count does not include stream restoration Pollutants with a TMDL are highlighted
Table 37 Cost and benefit summary for ESO projects (WTM 30)
Watershed
I
Cost (million $) Impervious
control added
(ac)
Incremental reduction from baseline ()
ESDfor i ESO for private
public
property property
TN TP TSS Bacteria Trash
Anacostia 2378 21296 1813 20 21 7 22 27
Cabin John 878 10307 876 22 23 25 24 28
Rock Creek 2471 341 2427 30 30 33 32 35
Triadelphia 41 47 36 10 1010 11 11 20
Rocky Gorge 312 19 28S 26 27 32 30 46
lower Monocacy 86 29 53 14 15 15 15 010
Clopper lake 08 051 21 14 14 15 0 14
Great Seneca bull 00 0 0 010 0 0( 0( 010
MuddyWatts 00 a 0 0 01 010 0 0
bull Includes Clopper lake Pollutants with a TMDL are highlighted
Table 3B Cost and benefit summary for riparian reforestation (WTM 40)
IWatershed Cost (million $) Impervious
Incremental reduction from baseline ()
control added Habitat restoration (ac) TN TP TSS Bacteria Trash
Anacostia 1 6 0 0 0 01 02
Cabin John 777 39 1 2 lili
3
Rock Creek 24 119 2 2 2 5
Triadelphia 010 1 01 02 01 04 03
Rocky Gorge 25 12 1 2 2 3 8
lower Monocacy 11 S 3 3 3 4 0
Clopper Lake 023 2 4 4 2 010 4
Great Seneca bull 0 a 010 010 0 010 0
MuddyWatts 0 0 010 0 0 0 0
bull Includes Clopper lake Pallutonts with a TMDL are highlighted
021611
Montgomery County Coordinated Implementation Strategy - DRAFT
Table 57 Cost and benefit summary for stream restoration (WTM 40)
Watershed Stream Restoration Incremental reduction from baseline ()
Number of Impervious control
Cost (million $) added(ac) TN TP TSS Bacteria Trash projects
Anacostia 937 200 0 42 56 326 0 0
Cabinlohn 162 15 0 17 9 80 0 0
Rock Creek 201 30 a 9 710 100 0 0
Triadelphia 00 0 0 0 0 0 010 0
Rocky Gorge 191 18 I 0 10 7 36 0 O lower Monocacy 73 nla 0 7 10 32 010 0
Clopper Lake 00 a 0 0 0 0 0 0
Great Seneca It I 259 33 0 19 8 16 0 0
MuddyWatts 242 45 0 16 7 13 0 0
Includes Clopper Lake Pollutants with a TMDL are highlighted
Table 58 Cost and benefit summary for M54programmatlc practices (WTM 50)
Watershed Cost (million $) Incremental reduction from baseline ()
Programmatic
practices - M54
Impervious control
added (ac) TN TP TSS Bacteria Trash
Anacostia 36 0 9 9 10 8 82
Cabin John 047 0 15 14 0 10 0
Rockereek 12 0 11 11 0 7 0
Triadelphia 00056 a 23 3 0 0 0
Rocky Gorge 009 0 38 8 03 5 2
lower Monocacy 007 0 0 0 19 0 0
Clopper Lake 0Q1 0 61 30
~=r 0
Great Seneca 10 0 0 0 0 0Y0 0 0
MuddyWatts 0 0 0 0 0 0 0
bull Includes Clopper Lake Pollutants with a TMDL are highlighted
021611
Montgomery County Coordinated Implementation Strategy - DRAFT
4 COORDINATED IMPLEMENTATION STRATEGY
The Strategy has multiple objectives to accomplish whereby a challenging balance between
strategies and timeframe is required There isnt necessarily a correct answer in the process
but rather an optimized result that addresses an agreed upon suite of priorities The Strategy
presented here was primarily driven by known and established regulatory timeframes and
compliance endpoints Meeting these endpoints using the more cost effective approaches was
also given priority After this consideration was given to other known and important
approaches that stakeholders and the County have an interest in pursuing Specifically the
following compliance dates and objectives were conSidered in developing the Strategy over the
long-term (Table 41)
Table 41 Compliance Targets for Countywide Coordinated Implementation Strategy
Target Date
2015
2017
2020
Compliance Target
Meeting 20 impervious cover treatment requirement
within the MS4 Permit cycle
Meet the interim dates and targets for the Chesapeake
Bay TMDL which include specific regulated urban area
reductions by 2017 for nutrients and sediment (based
on Maryland Department of the Environments
Watershed Implementation Plan)
Meet the full compliance and targets for the
Chesapeake BayTIVIDL which include specific regulated
urban area reduction by 2020 for nutrients and
sediment (based on Maryland Department of the
Environments Watershed Implementation Plan)
Metric
~4300 acres of
Impervious Cover
9 12 and 20
respectively for TN TP
and TSS reductions
from baseline
conditions
18 34 and 37
respectively for TN TP
and TSS reductions
from baseline
conditions
2025
2030
Meet additional impervious cover treatment targets
associated with next MS4 Permit cycle (assumes
another 20 target)
Meet additional impervious cover treatment targets
associated with next MS4 Permit cycle (assumes
another 20 target)
Out year compliance with other watershed TMDLs
~3400 acres of
Impervious Cover (20
of impervious
remaining after 2015)
~2750 acres of
Impervious Cover (20
of impervious
remaining after 2020)
100 compliance with
MS4 Permit Area WLAs
021611
Montgomery County Coordinated Implementation Strategy - DRAFT
To meet the compliance targets outlined in Table 41 the following priorities were generally
followed
bull 100 implementation of completed high and low priority County projects in first five
years (by 2015)
bull Greater ESD focus in urban (as opposed to suburban and rural) watersheds initially Goal
for ESD in these watersheds on pUblic property in first five years is 10 and on private
property is 10 The level of implementation was largely driven by the 20 Countywide
impervious goal
bull 100 of Public Outreach Potential for all TIVIDl watersheds in first five years This was
pursued to address trash nutrient and bacteria loading which rely strongly on effective
outreach programs to modify behaviors
bull Generally limited strategies to the top four most cost effective per watershed
bull Habitat restoration (stream restoration and buffer reforestation) not pursued as priority
until after first five year period These programs emphasize greater pollutant reduction
efficiency rather than impervious cover treatment which is the primary focus for the
first permit cycle
The Strategy was informed by the individual watershed implementation plans for seven
watersheds which included the Clopper lake and Patuxent subwatersheds Therefore in order
to develop countywide estimates for pollutant load reduction (as is required by the Chesapeake
Bay TMDl) watershed area weighting was applied The process for developing the Countywide
strategy and individual watershed implementation plans was woven together Once the
restoration potential was determined from the individual plans the strategy and schedule was
compiled using the restoration potentials and the drivers listed above The final restoration
cost and schedule was then placed in the implementation plans
It is also worth noting that the high and low priority projects along with the other potential
projects strategies represent a static or fixed number of projects that have been identified by
the County For this analysiS this list of practices is not replenished and therefore once all
opportunities have been implemented other strategies are pursued In reality the County will
continue to develop and update its list of specific project opportunities and have these
available for implementation in future years
The output from this effort is presented in a series of tables ordered by target date in Appendix
D In addition Table 42 provides an overall summary of pollutant load reduction tracking
versus time Through inspection of Table 42 it can be seen that the Strategy meets the
021611
Montgomery County Coordinated Implementation Strategy - DRAFT
impervious cover treatment targets under the current MS4 permit (as well as projected targets
for 2020 and 2025 assuming a continued 20 treatment requirement) interim and final
Chesapeake Bay nutrient and sediment reduction targets by 2017 and 2020 respectively and
out year MS4 permit area WLA compliance for the majority of pollutants Exceptions include
meeting the bacteria WLA load reductions required for the Anacostia and Rock Creek
021611
Montgomery County Coordinated Implementation Strategy - DRAFT
Table 42 Projection by Phase for Watersheds and Pollutants PermitTMDL Targets
Watershed Fiscal Year 2015 2017 2020 2025 2030 2017 2020
Impervious Treated (acres) 1421 2393 3364 4272 4544
ESD ( Impervious) 26 44 61 69A 71
Cost (Million $) 160 307 486 732 820
E5D( Cost) 45 62 71 78 78
Anacostia Nitrogen 25 39 68 89A l00A 818 82
Phosphorus 27 42 77 100 100 812 81
i Sediment 47 72 100 l00A) l00A 875 88
Bacteria 21 33 46 59A 64 879 88
Trash 41 65 89 l00A) 100
Impervious Treated (acres) 1541 1961 2381 3625 3989
ESD ( Impervious) 17 28 36 57A 61
Cost (Million $) 87 172 262 566 658
ESD ( Cost) 7(JA 79 79A 89A 9(JA
Rock Creek Nitrogen 24 30 38 55 61
Phosphorus 25 3(JA 38 54 GfJA)
Sediment 38 50 92 l00A 100
Bacteria 21 27 33 5(JA 55 96(JA 96
Trash 17 24 31 5(JA) 55
Impervious Treated (acres) 187 380 570 1018 1018
ESD ( Impervious) 52 72 78 87A 87A
Cost (Million $) 23 65 114 215 219
ESD ( Cost) 92 91 86 90 88
Cabin John Nitrogen 21 27A 39A 55 58 Phosphorus 2(JA 26 35 49 51
Sediment 6 17 GfJA 91 100
Bacteria 16 22 27 4(JA) 40 31 31
Trash 6 12 19 34 34
Impervious Treated (acres) 237 237 237 237 237
ESD ( Impervious) 4 4 4 4 4
Cost (Million $) 6 8 19 25 31
ESD ( Cost) 32 27A 11 8 7
Muddy Watts Nitrogen 6 7 15 18 22
Phosphorus 6 7 10 12 13 Sediment 7 8 14 17 2(JA
Bacteria 0 (JA 0 (JA 0 i Trash 6 6 6 6 6
bull Impervious Treated (acres) 901 921 941 941 941 ESD ( Impervious) 2 2 2 2 2
Cost (Million $) 26 48 SO 51 52 ESD ( Cost) 15 8 8 8 8
Great Seneca Nitrogen 24 41 43 44 45
Phosphorus 24 32 34 34 34
i Sediment 26 41 43 44 44
I Bacteria (JA) 0 0 0 (JA
Trash 31 32 33 33 33
021611
Montgomery County Coordinated Implementation Strategy - DRAFT
Pe rmitTMDL Targets
Watershed Fiscal Year 2015 2017 2020 2025 2030 2017 2020
Clopper
Impervious Treated (acres) 0 6 12 22 22
ESD ( Impervious) 0 86 86 92 92
Cost (Million $) 0 0 1 2 2
ESD ( Cost) 0 72 73 84 84
Nitrogen 61 67 72 79 79
Phosphorus 30 36 41 48 48 45 45
Sediment 0 5 10 17 17
Bacteria 0 0 0 0 0
Trash 0 6 11 18 18
Lower Monocacy
Impervious Treated (acres) 1 16 32 58 58
ESD ( Impervious) 100 85 84 91 91
Cost (Million $) 0 4 11 18 20
ESD ( Cost) 100 85 54 63 58
Nitrogen 0 5 14 22 24
Phosphorus 0 5 16 26 28
Sediment 0 5 46 61 69 608 61
Bacteria 0 6 12 19 19
Trash 0 0 0 0 0
Rocky Gorge
Impervious Treated (acres) 11 88 165 307 307
ESD ( Impervious) 64 89 90 95 95
Cost (Million $) 3 17 40 70 75
ESD ( Cost) 55 82 64 73 68
Nitrogen 47 55 6710 82 85
Phosphorus 17 25 36 52 53 15 15
Sediment 10 19 45 7(J1o 79
Bacteria 14 23 32 47 47
Trash 15 30 46 68 68
Triadelphia
Impervious Treated (acres) 3 12 20 38 38
ESD ( Impervious) 100 98 97 99 99
Cost (Million $) 1 3 5 9 9
ESD ( Cost) 99 98 98 99 99
Nitrogen 24 27 29 34 34
Phosphorus 4 7 9 14 14 15 15
Sediment 1 4 6 12 12
Bacteria 1 4 6 12 12
Trash 2 6 11 21 21
Countywide
Impervious Treated (acres) 4302 6014 7722 10518 11154 6008 7723
ESD ( Impervious) 18 34 47 6(J1o 63
Cost (Million $) 305 622 987 1687 1884
ESD ( Cost) 53 66 7(J1o 8(J1o 80
Nitrogen 18 25 36 46 51 9 2(J1o
Phosphorus 17 23 34 44 46 12 34
Sediment 23 34 54 6(J1o 62 20 37
Bacteria 11 15 20 28 30
Trash 18 26 33 41 42
Assumptio~s
1 Does no~ includerepeated Outreach and Education costs beyond FY2015
2 Does not include ~n inflation multiplier
021611
Montgomery County Coordinated Implementation Strategy - DRAFT
Summary of Individual Implementation Plans
A summary of the general considerations and prioritization for each watershed implementation
plan is provided below
Anacostia - For the first permit cycle (through 2015) a priority was placed on full
implementation of completed high and low priority projects Next implementation of a third
of the other potential projects was targeted as a large number of these were identified in
conjunction with the USACEs Anacostia Watershed Restoration Plan efforts ESD was
emphasized on both public (10) and private property (10) Finally outreach (25) and
stream restoration (12) are targeted for pollutant load reduction but are not credited towards
impervious cover credit In future permit cycles the remainder of the other potential projects
are targeted along with ESD and a limited amount of riparian reforestation for impervious cover
and pollutant load reduction Outreach and stream restoration are significant strategies
pursued for load reduction benefits Nutrient and sediment MS4 permit area WLAs are met by
2030 but bacteria load reduction does not meet MS4 permit area WLA compliance The
remaining bacteria reduction is believed to be associated with urban wildlife sources Unless
intense urban wildlife management practices are implemented this remaining load reduction
will not be possible
Rock Creek- For the first permit cycle (through 2015) a priority was placed on full
implementation of complete high and low priority projects Next 25 implementation of
other potential projects was targeted ESD was emphasized on both public (10) and private
property (10) with private property implementation being linked to Rainscapes Program
success Finally outreach (100) and stream restoration (22) are targeted for pollutant load
reduction but are not credited towards impervious cover credit In future permit cycles the
remainder of the other potential projects are targeted along with ESD and riparian
reforestation for impervious cover and pollutant load reduction Stream restoration is a
significant strategy pursued for load reduction benefits The bacterial load reduction does not
meet MS4 permit area WLA compliance However the remaining bacterial load is believed to
be associated with urban wildlife sources Unless intense urban wildlife management practices
are implemented this remaining load reduction will not be possible
Cabin John Creek - Similar to the other two more urban watersheds in the County during the
first permit cycle (through 2015) a priority was placed on full implementation of complete high
and low priority projects Fewer opportunities exist overall compared to the Anacostia and Rock
Creek Next 25 implementation of other potential projects was targeted ESD was
emphasized on both public (10) and private property (10) Finally outreach (100) was
021611
Montgomery County Coordinated Implementation Strategy - DRAFT
targeted for pollutant load reduction but not credited towards impervious cover credit No
riparian reforestation or stream restoration was targeted due to limited or no opportunities In
future permit cycles the remainder of the other potential projects are targeted along with ESD
and some riparian reforestation for impervious cover and pollutant load reduction The
bacteria load reduction meets MS4 permit area WLA compliance by 2025
Muddy BranchWatts Branch - During the first permit cycle (through 2015) a priority was
placed on full implementation of complete high and low priority projects Fewer opportunities
exist overall compared to the Anacostia and Rock Creek Watersheds No other strategies were
pursued as there are no existing TMDLs in the Muddy BranchWatts Branch subwatersheds In
future permit cycles previously identified stream restoration projects are implemented for
pollutant load reduction
Great Seneca Creek - This watershed implementation plan is unique in that it includes the small
Clopper Lake subwatershed which has a TMDL for phosphorus Even with the TMDL there are
limited identified opportunities to pursue in the Clopper Lake subwatershed in part due to the
limited area of the subwatershed within the County MS4 permit area During the first permit
cycle (through 2015) a priority was placed on full implementation of complete high and low
priority projects within Great Seneca Creek subwatershed No opportunities exist for these
strategies in Clopper Lake However full outreach was applied in Clopper Lake in the first
permit cycle In future years other potential projects ESD on public and private property and a
small amount of riparian reforestation (in Clopper Lake) is pursued The Clopper Lake WLA for
phosphorus within the MS4 permit area is met
Patuxent - During the first permit cycle through 2015 a priority was placed on full
implementation of complete high and low priority projects Far fewer opportunities exist
overall compared to the Anacostia and Rock Creek A limited amount of ESD on private land
and stream restoration was pursued Finally outreach (100) was targeted for pollutant load
reduction (primarily nutrients) but not credited towards impervious cover credit No riparian
reforestation was targeted within the MS4 Permit area due to cost effectiveness in the Rocky
Gorge subwatershed and limited opportunities in the Triadelphia subwatershed In future
permit cycles ESD on private and public land is pursued more substantially as is stream
restoration A limited amount of riparian reforestation achieves some impervious cover and
pollutant load reduction The Rocky Gorge phosphorus WLA within the MS4 permit area is met
easily and the Tridelphia phosphorus WLA is also met but with a longer timeframe needed for
compliance
021611
Montgomery County Coordinated Implementation Strategy - DRAFT
Lower Monocacy Creek -lower Monocacy Creek is the most rural watershed in the County and
has the least amount of area subject to the County MS4 permit In addition there are no preshy
identified restoration projects within the watershed Therefore during the first permit cycle
(through 2015) only a very small amount (5) of private property ESD is pursued It is not until
the second permit cycle that more focus is placed on private and public ESD as well as stream
restoration and programmatic strategies such as street sweeping to target sediment loads
associated with the TM Dl In future permit cycles stream restoration is pursued for pollutant
load reduction The sediment WlA within the MS4 permit area is projected to be met around
2025
Countywide - The Countywide effort was driven by impervious cover treatment targets and
Chesapeake Bay TMDl2017 and 2020 reduction targets associated with sediment and nutrients
for urban MS4s For impervious cover it was assumed that a 20 target would be required for
each five-year permit cycle The Bay TMDl targets for urban MS4 areas were easily met for all
pollutants in 2017 and easily met for nitrogen and sediment but more difficult to meet for
phosphorus in 2020
Public Outreach and Stewardship
The County recognizes and is committed to the increasingly important role that public outreach
and stewardship will play if improved water quality conditions are going to be achieved
countywide While the County currently has a very active and layered outreach program the
model requires changes that will result in broader stakeholder groups serving as the leaders
and primary champions for clean water in their communities This includes greater participation
from minority and faith-based groups business consortiums schools neighborhood
associations and civic groups Additionally the new model requires revisiting current
initiatives carried out by the various County agencies to look for better and more efficient ways
to communicate messages cross-train and create synergies that result in greater engagement
greater awareness and sustained changes in behavior
Within each implementation plan specific suggestions for outreach and education
opportunities are identified In addition Appendix E of this Strategy contains practice sheets
which highlight targeted restoration activities for the County to develop and refine A total of
eight practices have been identified that can be adopted countywide or in more targeted
watershed areas where there are specific water quality issues to address Many of the
practices build upon existing County programs but require a much broader reach to new
partner groups Program start up costs are suggested and were used to for cost estimates
associated with Countywide strategy The highlighted practices include
021611
Montgomery County Coordinated Implementation Strategy - DRAFT
bull Pet Waste Pickup Education and Outreach Campaign
bull Lawn Stewardship Education and Outreach Campaign
bull Anti-littering Education and Outreach Campaign
bull Innovative Stormwater Management Awareness Campaign
bull Stream Stewards Education and Outreach Campaign
bull Riparian Reforestation Education and Outreach Campaign
bull Roof Runoff Reduction Education and Outreach Campaign
bull Parking Lot Recharge Value Education and Outreach Campaign
Start up costs by practice along with an overall five year cost estimate are provided in Table
43 Start up timeframes are assumed to be up to 18 months
Table 43 Outreach Start Up and 5-Year Cost Projections
Practice Practice Start Up Cost
Pet Waste Pickup $240500
Lawn Stewardship $301 600
Anti-Littering $175050
Stormwater Management Improvements Awareness $50450
Stream Stewards $74825
Riparian Reforestation $30575
Roof Runoff Reduction $101400
Parking Lot Recharge Value $41500
Estimated Start Up Total $744900
5-Year Outreach Budget Projection $2650000
These eight practice sheets provide specific costs and timelines for implementation They also
provide suggestions for measuring program success These practice sheets along with the
specific recommendations in the implementation plans make up the Public Outreach and
Education Campaign
Trash Reduction
Most of the implementation plans have to address trash loadings to meet requirements of the
Potomac Trash Treaty that is referenced in the County1s MS4 Permit In addition the Anacostia
Trash TMDL has recently been accepted by MDE and the EPA According to the Anacostia
021611
Montgomery County Coordinated Implementation Strategy - DRAFT
TMDl there is reasonable assurance that the goals of the Treaty and TMDl can be met with
proper watershed planning implementing pollution-reduction BMPs and using strong political
and financial mechanisms
Currently the County has a number of activities which target trash reduction They include the
following
bull Adopt-a-Road Program through DOT which focuses on public awareness and involvement in trash management There are 205 participants who adopted road segments and agreed to six major road cleanups per year
bull Storm Drain Marking through DOT bull Support for illegal dumping enforcement outreach and research and monitoring bull Partnership with DOT to conduct street sweeping covering about 2500 curb miles and
occurring once a year
bull Partnership with the Park Police to monitor illegal dumping which combined enforces 300-400 actions a year
bull Non-residential and residential recycling programs through Solid Waste Services (SWS) bull Transit stop trash management program at 600 bus stops countywide supported by DOT
Transit Services
In addition to continuing these efforts a number of trash good-housekeeping efforts have been
proposed as part of this Strategy A detailed description of the quantitative methods and
strategies applied can be found in Appendix E of the Guidance Document In general the
following six trash-reduction strategies are recommended
1 Significantly increase funding for trash reduction programs 2 Create and enhance regional partnerships and coordination among businesses
environmental groups individual citizens and government at all levels and in all jurisdictions
3 Improve peoples awareness knowledge and behavior relating to littering and illegal dumping
4 Promote the greater introduction and use of effective trash-reduction technologies and approaches
5 Improve enactment and enforcement of laws to reduce trash 6 Increase trash monitoring-related data collection generation and dissemination efforts
The Anacostia watershed implementation plan provides an outline of the actions that will be
taken through the first permit cycle to reduce trash The range of programs and practices
specially aimed at reducing trash inputs to roads and streams that will be targeted include
reduce reuse and recycle campaigns littering and illegal dumping enforcement stream
cleanups and street sweeping These measures are in addition to any trash trapped and
021611
Montgomery County Coordinated Implementation Strategy - DRAFT
removed by structural practices which are computed using the WTM The plan shows that the
trash TMDl can be met by 2025 at a cost of 732 million dollars
Adaptive Management Monitoring and Reporting
Sound implementation strategies require assessment and effective adaptation to respond to
new information changing conditions new technologies and lessons learned This will be the
basis of the plan that will be used when benchmarks are not met and the projected funding is
inadequate
Adaptive management requires monitoring of a variety of measures that can be used to
determine whether progress is being made towards meeting the Countywide water quality
objectives Ultimately it is the instream water quality and the loading limits with respect to the
TMDls that determine the success of implementation however there are many interim
measures that can also be correlated to success which are worthwhile pursuing
Surface water monitoring can be an expensive and time consuming undertaking Montgomery
County is fortunate to have an extensive Countywide stream monitoring network that can serve
as a foundation for providing spatial and temporal data to indicate stream health The Countys
MS4 Permit also outlines the required assessment of controls which includes chemical
biological and physical monitoring Specifically the permit calls for the County to continue
their watershed restoration monitoring of the lower Paint Branch subwatershed and physical
monitoring ofthe Clarksburg Special Protection area In addition to the existing monitoring
network the County will continue tracking and data reporting associated with levels of
implementation (eg acres of impervious cover treated areas of buffer planted miles of
stream restored miles of streets swept) For measuring effectiveness of outreach and
stewardship efforts other types of monitoring and reporting are planned that include before
and after attitude surveys frequency of website visits and information requests
For many restoration strategies it may be difficult to tease out their individual effectiveness in
terms of pollutant load reductions but collectively the monitoring that occurs should provide
adequate insight into the overall effectiveness of a layered implementation strategy
In addition to the monitoring and assessment the County will be reporting results on an annual
basis as part of their NPDES MS4 Permit annual report The MS4 Permit requires annual
reporting of the following
021611
Montgomery County Coordinated Implementation Strategy - DRAFT
bull The status of implementing the components of the stormwater management program
that are established as permit conditions
bull A narrative summary describing the results and analyses of data including monitoring
data that is accumulated throughout the reporting year
bull Expenditures for the reporting period and the proposed budget for the upcoming year
bull A summary describing the number and nature of enforcement actions inspections and
public education programs
bull The identification of water quality improvements and documentation of progress
toward meeting applicable WLAs developed under EPA approved TMDLs and
bull The identification of any proposed changes to the Countys program when WLAs are not
being met
The County will build upon annual reporting that has historically occurred to meet permit
requirements and will supplement this reporting with tracking table summaries that quantify
implementation activities for the range of strategies pursued during that year and the
associated treatment (eg impervious cover treated pollutant load reduced education and
outreach partners established etc) Cost will also be tracked in association with rates of
implementation This level of performance will then be compared with countywide strategy
targets (eg progress towards meeting WLAs) associated with key performance dates such as
those presented in Table 41 The level of progress achieved by the County will then feed into
the adaptive management approach described above
Organization Needs to Implement Strategy
Montgomery County DEP staff possesses substantial expertise and institutional knowledge that
yields many positive outcomes and efficient processes under the current pace of restoration
and permit compliance activities Under this strategy however the pace of implementation is
required to significantly increase Based on an increase in the level of implementation it is
reasonable to assume that additional capacity may be needed to provide sufficient oversight
and management of all the projects
Another critical element of this strategy is the recognition and commitment to pursuing
outreach initiatives that build community capacity by targeting new partner groups that
provide the necessary leadership oversight and sustained effort to change behaviors and
foster stewardship The County currently carries out many well established and managed
outreach programs but it may require additional focus across County agencies and
departments for these partnerships to become established and thrive
021611 G
Montgomery County Coordinated Implementation Strategy - DRAFT
Through the implementation process and the monitoring and reporting that is required large
amounts of data will be generated Technological advances happen so rapidly in this day and
age it will be important for the County to stay current with technology and methods so that
more efficient and cost-effective data management and reporting will be possible The County
currently relies on a detailed and sophisticated GIS to spatially locate projects and manage
tables of data related to projects The growth and development of this spatial database will be
a critical component of the reporting and tracking capability of the County These databases
generate the input data that are used to measure progress towards baseline loading targets
Regular review and upkeep of the data as well as routine summarization of progress (annually
at a minimum) will likely require additional dedication of staff This is especially the case during
periods where the implementation rate of structural practices in the ground is accelerated
021611
Montgomery County Coordinated Implementation Strategy - DRAFT
Appendix C - Restoration Potential by Watershed
021611
c-
04 03 02 01
a
_ Nitrogen Load Reduction
--shy TMDL WLA Target
_Cost
MONTGOMERY COUNTY URBAN WATERSHEDS POLLUTANTS _Bk)~Ibilats ~1~ l~ fjfsi --
Rank
1
2
3
4
5
6
7
8
9
10
11
Restoration Strategy TN reduction
Ibsyr
Pet Waste Education 15169
Retrofit of Underperforming BMPs 1769
Stream Restoration 72423
Completed Projects ~43 High Priority Projects 3260
Other Potential Projects 43276
Habitat Restoration 224
Public Property ESD Retrofits 18270
Priority Neighborhoods ESD Retrofits 9271
Private Non-residential ESD Retrofits 5594
Street Sweeping -
Incremental Cost Unit Cost
Million $ IbsMillion $ 088 17193
120 1475
9304 778
948 701
635 513
25430 170
141 158
23655 77
13278 70
8018 70
124 -
Qj c
Qj
nI CXI
o -f-
1 09 08 07 06 05
$900 $800 $700
~ $600 c $500 ~ $400 $300 0 u $200 $100
$shy
~~mf il_~IJrt~
MONTGOMERY COUNTY URBAN WATERSHEDS POLLUTANTS ItfiQ14lbilJts i~5 [i
1 $900 Qj
09 $8005 iii en 08 $700
~co 07 $600 co - til
06 $500 ~ 05- $400 ~ 04 en$300 003 u $20002
en $100I 01 o 0 $shys Q en o
s Q
Phosphorus Load Reduction
--- TMDL WLA Target
__Cost
I Rank I
1
2
3
4
5
6
7
8
9
Restoration Strategy
Pet Waste Education
Retrofit of Underperforming BMPs
Stream Restoration
Completed Projects
High Priority Projects
Habitat Restoration
Other Potential Projects
Public Property ESD Retrofits
Priority Neighborhoods ESD Retrofits
10 I Private Non-residential ESD Retrofits
11 Street Sweeping
TP reduction Incremental Cost Unit Cost
Ibsyr Million $ IbsMillion $ 1979 088 2243
247 120 206
13097 9304 141
915 948 96
451 635 71
37 141 26
6067 25430 24
2546 23655 11
1294 13278 10
781 8018 10
- 124 -
MONTGOMERY COUNTY URBAN WATERSHEDS POLLUTANTS IItQjQhabillt$middot
Cii 5 Cii 11 It CD
6 ~ r o ~ s
0 ltIIa r ltII e c ltII III
1 09 08 07 06 05 04 03 02 01
0
$900
$800 $700
v$600 r
0 $500 == $400 $300 11
0 u $200 $100
$shy
_ Sediment load Reduction
--- TMDl WlA Target
__Cost
Rank Restoration Strategy
Sediment reduction
Incremental Cost
Unit Cost
tonsyr Million $ tonsMillion $ 1 Street Sweeping 800 124 645
2 Stream Restoration 25057 9304 269
3 Retrofit of Underperforming BMPs 25 120 21
4 Completed Projects 97 948 10
5 High Priority Projects 47 635 7
6 Other Potential Projects 660 25430 3
7 I Public Property ESD Retrofits 272 23655 1
8 Priority Neighborhoods ESD Retrofits 139 13278 1
9 Private Non-residential ESD Retrofits 84 8018 1
10 Habitat Restoration 2 141 1
11 Pet Waste Education - 088 -
C-3
MONTGOMERY COUNTY URBAN WATERSHEDS POLLUTANTS
-QI5 5i ~
1 09 08 07 06 05 04 03 02 01
0
$900
$800
$700
$600 ~ 0
$500 == $400 $300 11
0 u $200
$100
$shy
--shy TMDL WLA Target
___ Cost
Rank Restoration Strategy
Enterrococci reduction
Incremental Cost
Unit Cost
Billion MPNyr Million $ Billion MPN Million $
1 Pet Waste Education 19643 088 22263
2 Retrofit of Underperforming BMPs 2781 120 2318
3 Completed Projects 10441 948 1101
4 High Priority Projects 5120 635 806
5 Other Potential Projects 69895 25430 275
6 Riparian Reforestation 310 141 219
7 Public Property ESD Retrofits 29025 23655 123
8 Priority Neighborhoods ESD Retrofits 14777 13278 111
9 Private Non-residential ESD Retrofits 8917 8018 111
10 Stream Restoration - 9304 -
11 Street Sweeping - 124 I -
~ I~~~i MONTGOMERY COUNTY URBAN WATERSHEDS POLLUTANTS 1tI2~mL ~ I~I
~$ I -~-- I
100 90 80 70 60 50 40 30 20 10
0
$900 $800 $700 $600 $500 $400 $300 $200 $100 $shy
vi c
~ 5 11 0 u
Implementation Phase
Potential Trash Incremental Unit Cost
I
Rank Restoration Strategy Reduction Cost
Ibsyear Million $ IbsMillion $ 1 Recycling Education and Investigations 51654 02 238837
2 Plastic Bag Ban and Misc Enforcement 63546 13 48882
3 Anti-litter Campaign Education 23J61 09 26930
4 Retrofit of Underperforming BMPs 1144 12 954
5 Completed Projects 6598 95 696
6 High Priority Projects 2786 64 439
7 Other Potential Projects 56341 2543 222
8 Habitat Restoration 266 14 188
9 Street Sweeping 204 12 164
10 Public Property ESD Retrofits 25348 2366 107
11 Priority lIeighborhoods ESD Retrofits 12529 1328 94
12 Private Non-residential ESD Retrofits 7547 802 94 ru Stream Restoration - 930 -14 Pet Waste Education - 09 -
C-5
MONTGOMERY COUNTY URBAN WATERSHEDS POLLUTANTS
CABIN JOHN
1 250
__CostImplementation Phase
09 08 07 06 05 04 03 02 01
0
200 ~ c
150 g E
100 - ltII 0 u
50
0
_E Coli
- - - Waste Load Allocation
Rank Restoration Strategy
E coli reduction
Incremental Cost
Unit Cost
Billion
MPNyr Million $
Billion MPN
Million $ 1 Pet Waste Education 4388 $05 9436
2 Underperforming BMP Retrofits 1892 $19 1022
3 High Priority Projects 1289 $16 800
4 Riparian Reforestation 1133 $78 146
5 Other Potential Projects 148 $17 86
6 Public Property ESD Retrofits 4AOO $860 Sl 7 Private Non-residential ESD Retrofits 1618 $392 41
8 Priority Neighborhoods ESD Retrofits 2633 $638 41
9 Completed Projects 112 $00 0
C-6
MONTGOMERY COUNTY URBAN WATERSHEDS POLLUTANTS 1Itf~~Jabitm
ROCK CREEK
1 $700 Qj5 09
o
_
$600 Qj 08
111 $500 ~ampl 07 c
t5 06 $400 ~ e 05 ~ $3005 04 - 111tl 03 $200 0 u-6 02
$100J 01 $-
Enterrococci
- - - Waste load Allocation Implementation Phase
__Cost
Rank Restoration Strategy
Enterrococci reduction
Incremental Cost
Unit Cost
Billion MPNyr Million $ Billion MPN Million $
Et Pet Waste Management 35734 118 30190
Underperforming BMP Upgrades
Other Potential Projects
28800
30239
577
1083
4995
2792
4 Completed Projects 12131 444 2734
5 High Priority Projects 14239 890 1600
6 Riparian Reforestation 18999 2384 797
7 County Property ESD Retrofits 54519 24136 226
8 Private Residential ESD Retrofits 35230 17737 199
9 Private Non-residential ESD Retrofits 32A86 16380 198
C-7
MONTGOMERY COUNTY URBAN WATERSHEDS POLLUTANTS _f~~pabitafS (fi~r ~~ l-middotshy
ROCK CREEK
100 $900 90 $800 80 $700 u70 $600 c 60 2$50050 -~$40040
lt1$300 030 $200 u
20 10 $100
0 $shy
Implementation Phase
Rank Restoration Strategy Trash Reduction
Incremental Cost
Unit Cost I
Ibsyear Million $ IbsMillion $ 1 Other Potential Projects 16038 1085 1478
2 Underperforming BMP Upgrades 6756 577 1172
3 Completed Projects 4217 444 950
4 High Priority Projects 6366 890 715
5 Riparian Reforestation 9237 2384 387
6 Public Property ESD Retrofits 24587 24136 102
7 Priority Neighborhoods ESD Retrofits 16155 17737 91
8 Private Non-residential ESD Retrofits 14793 16380 90
9 Pet Waste Education - 118 -
(-8
MONTGOMERY COUNTY RURAL WATERSHEDS POLLUTANTS
SENECA - CLOPPER LAKE -
100 Qi
90 iii 80VI to -CQ 70 0 60e 50I 0 40 u l 30
C QJ 20ex
C 10to 0
J 0
$18
$16
$14 n
$12 I
$10 sect $08 ~ $06 0
VI
U $04
$02
$shy
_TPRemoval - - - TMDL Reduction Target
Implementation Phase ___Cost
Rank Restoration Strategy TP
Reduction (Ibsyr)
Incremental Cost (Million $)
Unit Cost (IbsvrMillion $)
1 Residential Education 33 001 6246
2 Underperforming BMP Retrofits 13 004 341 3 Riparian Buffer Reforestation 19 023 99 4 Priority Neighborhood ESD Retrofits 15 051 35 5 Public Property ESD Retrofits 7 075 99
C-9
-pj[fti
MONTGOMERY COUNTY URBAN WATERSHEDS POLLUTANTS 1It[~~JIlbitIL f bull~
LOWER MONOCACY
1 09 08 07 06 05 04 03 02 01
0
Implementation Phase
25
20 ~ c
15 ~ ~
10 - 0 u
5
0
_TSS
- - - Waste load Allocation _Cost
Rank Restoration Strategy
Sediment reduction
Incremental
Cost Unit Cost
tonsyear Million $ tonMilli
1 Street Sweeping 22 $007 3121
2 Underperforming BMP Retrofits 4 $010 389
3 Stream Restoration 37 $734 51
4 Riparian Buffer Reforestation 3 $109 25
5 Other Structural BMPs and ESD Strategies 10 $851 12
6 Priority Neighborhoods ESD Retrofits 2 $160 10
7 Non-residential ESD Retrofits 1 $132 10
C-10
MONTGOMERY COUNTY RURAL WATERSHEDS POLLUTANTS 1tlj~lIbiIalSlt~~II
1 09 08 07 06 05 04 03 02 01
0
$70
$60
$50 ~ c
$40 ~ ~ $30 - UI
$20 0 v
$10
$0
_ Phosphorus Load Reduction
- - - Waste Load Allocation ___ CostImplementation Phase
Rank Restoration Strategy TP Incremental Cost
Million $ Unit Cost
Ibsyr Ibs Million $ 1 Lawn Care Education 3670 01 37394
2 Underperforming BMP Retrofits 3499 08 4338
3 Other Potential Projects 3524 33 1076
4 High Priority Projects 252 04 685
5 Riparian Reforestation 762 26 298
6 Public Property Retrofits 5854 345 169
7 Priority Neighborhoods ESD Retrofits 796 65 123
8 Private Non-residential ESD Retrofits 1941 168 116
9 Completed Projects 53 00 00
c- 11
MONTGOMERY COUNTY RURAL WATERSHEDS POLLUTANTSal12hdJilats ~I~ ~ [ -
1 10 ii 5 09 9 1 08 8 II al- 07 7 1ii o 06 6
c
~ ~ 1 o E IV
05 04 03
5 4
3
~ 11 0 u
0 11 02 2 J o 01 1
t a 0 0 11 o
t 0
_ Phosphorus Reduction
- - - Waste Load Allocation
-Cost
Rank Restoration Strategy TP Incremental Cost
Million $ Unit Cost
Ibsyr Ibs Million $ 1 Lawn Care Education 3670 01 37394
2 Underperforming BMP Retrofits 3499 08 4338
3 Other Potential Projects 3524 33 1076
4 High Priority Projects 252 04 685
5 Riparian Reforestation 762 26 298
6 Public Property Retrofits 5854 345 169
7 Priority Neighborhoods ESD Retrofits 796 65 123
8 Private Non-residential ESD Retrofits 1941 168 116
9 Completed Projects 53 00 00
C-12
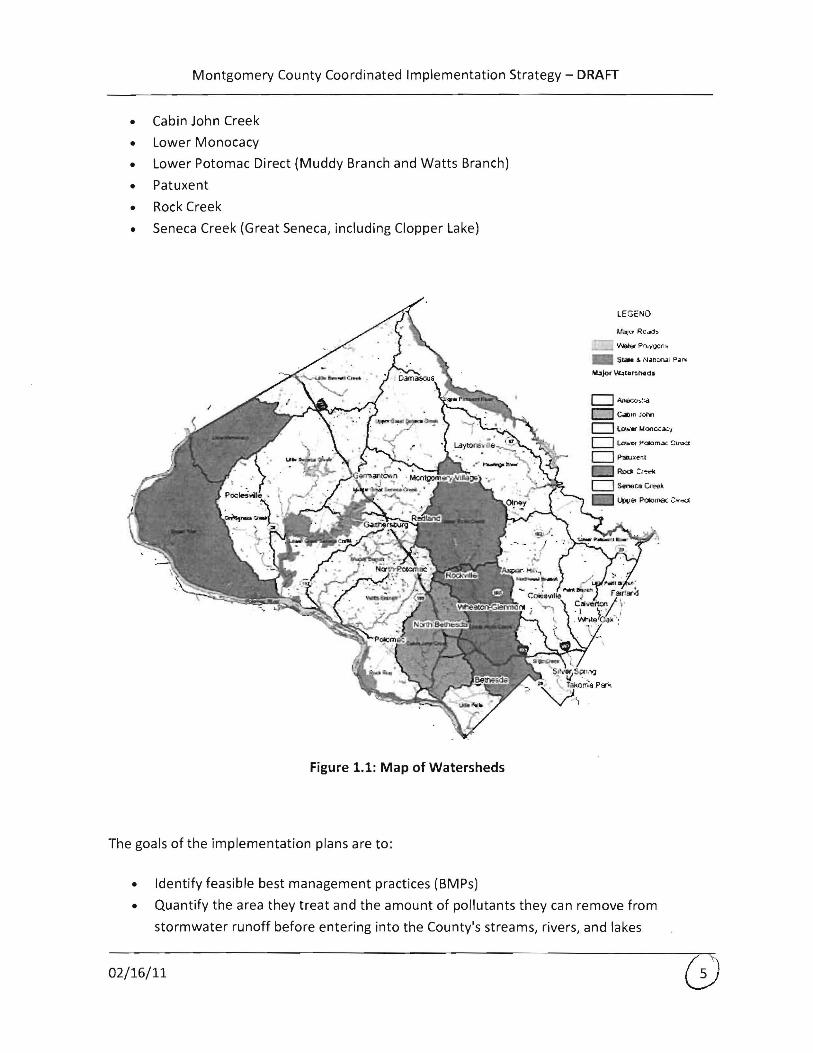
Montgomery County Coordinated Implementation Strategy - DRAFT
bull Determine the restoration potential for each watershed or subwatershed and evaluate
the ability to meet applicable TMDLs
bull Provide a schedule and cost estimate for meeting the WLAs set by the TMDL
In addition to the seven implementation plans there are three watershed pre-assessments that
have been completed for watersheds that have not been previously assessed The preshy
assessments will be used by the County to develop watershed assessments and associated
implementation plans which will be completed this permit cycle They include
bull Seneca Creek Little Seneca and Dry Seneca
bull Lower Potomac Direct including Rock Run and Little Falls but excluding Muddy Branch
and Watts Branch
bull Upper Potomac Direct including Little Monocacy amp Broad Run
The seven implementation plans (Table 12) provided the input data for the development of
this Strategy
Table 12 Watershed Groupings and Plans
Pre-Assessment
x x
x x
lower Potomac Direct (East of Seneca Creek not described in any other grouping)
Muddy Branch and Watts Branch x All other subwatersheds x
Patuxent (TriadelphiaBrighton Dam and Rocky
Gorge)
x
Great Seneca (including Clopper Lake)
Dry Seneca and Little Seneca
lower Monocacy
Upper Potomac Direct (West of Seneca Creek not described in any other grouping)
Trash Free Potomac
The Alice Ferguson Foundation founded the Trash Free Potomac Watershed Initiative (TFPWI)
in 2005 to reduce trash and increase awareness of trash issues in the watershed TFPWI actions
021611
Montgomery County Coordinated Implementation Strategy - DRAFT
include the Potomac River Watershed Trash Treaty Annual Potomac River Watershed Trash
Summit Annual Potomac River Watershed Cleanup market-based approaches such as the
Trash Free Potomac Facility Program and a Regional Anti-Litter Campaign (Alice Ferguson
Foundation 2011) The MS4 permit requires Montgomery County to meet the commitments of
Potomac River Watershed Treaty The permit specifically requires that Montgomery County
1 Support and implement regional strategies to reduce trash
2 Develop a work plan to implement a public outreach and education campaign
3 Establish baseline conditions of trash being discharged and develop a reduction strategy
and work plan for the Montgomery County portion of the Anacostia Watershed
4 Implement approved control measures in accordance with the trash reduction work
plan
5 Conduct public participation in development of trash reduction strategy
6 Submit progress annually
Public Outreach and Stewardship
The Countys MS4 Permit requires significant opportunities for public participation in achieving
TMDls watershed restoration and trash management The permit specifically requires the
County to prepare a work plan to implement a public outreach and education campaign The
County recognizes that a successful strategy will require a significant increase in effective and
coordinated public outreach and public stewardship The implementation plans and this
Strategy describe how DEP plans to implement public outreach and education campaigns with
specific performance goals and deadlines
021611
Montgomery County Coordinated Implementation Strategy - DRAFT
2 EXISTING CONDITIONS
Watershed health is variable throughout the County and typically well correlated with intensity
and age of urbanization More specifically watershed health typically declines with increasing
density and older age of development Many of Montgomery Countys older urban and
suburban areas were developed in an era when runoff from paved surfaces (roads parking lots
driveways) was directed to storm drains which conveyed untreated runoff directly to streams
This large volume of water caused massive erosion of the stream banks and destroyed habitat
Stormwater treatment using stormwater ponds to receive detain and filter runoff before it
flowed into streams was either inadequate or non-existent The Anacostia Rock Creek and
Cabin John Creek watersheds are examples where these conditions are common Modern
stormwater techniques known as environmental site design or ESD encourage the reduction
of runoff by infiltrating the water into the ground near its source
Watershed health improves in more rural areas of the County but even in these areas stream
degradation can occur stemming from large lot development and poor agricultural
management practices
The County has conducted comprehensive water quality and biological sampling for more than
a decade which provides a representative snapshot of existing watershed health as well as the
ability to track watershed health over time Figure 21 shows countywide watershed resource
conditions based on monitoring that was conducted from 2000-2008 The area inside the
beltway in the more urban core has lower water quality (fair to poor) while the area outside the
beltway tends to have better water quality (fair to good to excellent)
021611
---- -
-----
Montgomery County Coordinated Implementation Strategy - DRAFT
Watershed Resource Conditions Montgomery County Maryland
LEGEND z fbn
G 0middot1 - -~UlIS
- tI)Jogtf~
UJJOf Wrw Ftns
Splaquo1lII PnreltbOrI NtH SPAl
3D~~ennHI
[=jji=---~~-
Figure 21 County Watershed Resource Conditions
County Statistics
The Strategy will benefit from the fact that the majority of county residents own the property
they reside on (nearly 70) and thus have control over that property Also nearly 70 of the
residences are single unit homes Moreover the average household income is roughly $90000
making the likelihood of financial capability to install BMPs an appropriate assumption Both of
these statistics make advocacy of BMPs on residential properties an imperative for the Strategy
Montgomery Countys robust business economy was also considered in the Strategy
development Despite the current economic volatility Montgomery Countys business
community is still profitable and still maintaining and improving existing facilities Moreover
the construction of the inter-county-connector (ICC) through much of Montgomery County will
provide opportunities to install demonstration BMPs on newly developing properties for
replication throughout stakeholder groups Also the presence of communication industry
leaders (ie Discovery Channel) in the County creates unique stewardship education
partnership possibilities with businesses The Strategy will include these stakeholders
021611
Montgomery County Coordinated Implementation Strategy - DRAFT
involvement opportunities to best harness the power of Montgomery Countys healthy
business economy
The county includes a fairly even split of males and females The majority of residents nearly
50 fall between the ages of 25 and 55 Only 15 of the population is aged 60 and above In
addition the majority of Montgomery County residents indicate their preferred language as
English however Spanish translations of stakeholder involvement opportunities will be
required in select watersheds to accommodate the 13 of county residents that indicate their
preferred language as Spanish Other potential target groups for translation for stakeholder
involvement include the Asian community as 11 of the countys population is Asian (mostly
Korean and Vietnamese) Because of this the Strategy and implementation plans will take
multilingual requirements into consideration for signage and other educational tools as well
MS4 Permit Coverage
The Countys most recent NPDES MS4 stormwater permit only covers runoff from
developments within the County area The following areas are excluded from the Countys MS4
permit area shown in Figure 22
bull Cities of Gaithersburg Rockville and Takoma Park
bull Maryland National Capital Park and Planning Commission (MNCPPC) lands
bull Washington Sanitary Sewer Commission (WSSC) land
bull Federal and State government owned land and facilities
bull Rural zoning
021611 G
Montgomery County Coordinated Implementation Strategy - DRAFT
MS4 Permit Area Montgomery County Maryland
(-i Gaithersbur9 ~
M Ro ckville
TkD m Parilt -Jr MNC PPC Lnds
0 5 3
Feder 1 and SI PropertyM i KbnelefS
M 0 I 2 ~- Federal and Sta1e Roads
~ i s Rural Zon ing
Figure 22 Areas outside the Montgomery County MS4 Permit Area
Impervious Surfaces
As previously mentioned the Countys MS4 Permit requires treatment of an additional 20 of
impervious cover not currently receiving treatment to the MEP Table 21 presents a summary
of the countywide impervious cover totals along with breakdowns by major land cover type
These land covers will be the focus of much of the Countys targeted effort to treat the 20
target
021611
Montgomery County Coordinated Implementation Strategy - DRAFT
Table 2llmpervious Surface Summary
Description
Total County Area 324552 100
Total Area of 1m ervious Surface 35965 _ _-----shy 11
County Area Subject to Stormwater Permit (1) 138649 43
Imllervious Cover Subject to Stormwater Permit 2) ~==5119====18o2 == ==== Areas of Impervious Surface (3)
Road 13607 38
Building 13073 36
Parking 22
Sidewalk 1069 3
Recreation (4) 347 1 1 Exclusions include Certain zoning codes parklands forests municipalities with own stormwater management
programs state and federal properties and state and federal maintained roads 2 Percent of County Jurisdictional Area subject to the Stormwater Permit 3 Impervious area within each category within the total County area 4 Recreation imperviousness excludes swimming pools
Implementation Plan Guidance Document
The Implementation Plan Guidance Document (revised October 252010) provides a road map
for how the implementation plans were created The primary sections of the Guidance
Document and a short description of each are provided in Appendix A
The Guidance Document divides BMPs into five classes or codes shown below The Guidance
Document also provides a list of BMPs and which code they fall under which is provided in
Appendix B
Code 0 Pretreatment Practices
Code 1 Non-performing BMPs No runoff reduction and no long term pollutant removal
Code 2 Under-performing BMPs Limited runoff reduction and low pollutant removal
Code 3 Effective BMPs No runoff reduction but moderate to high pollutant removal
Code 4 ESO BMPs High runoff reduction and moderate to high pollutant removal
Impervious Cover Accounting and Tracking
Montgomery County has GIS data layers that contain all the stormwater BMPs in the County
and their drainage areas In order to determine the 20 target for impervious cover treatment
021611
Montgomery County Coordinated Implementation Strategy - DRAFT
to the MEP the County analyzed their existing impervious cover and their existing BMP
database to determine how much impervious cover is currently being treated to the MEP
Several methods were considered based on a determination of the MEP standard compared to
existing treatment methods According to MDE guidance to be considered MEP a BMP must
capture at least the Water Quality Volume (WQv) (the first inch of rainfall) or the CPv volume
(26 inches of rainfall) The final method used for determining which BMPs are MEP and the
amount of impervious surface not treated to the MEP was as follows
1 All BMPs that were installed after 2002 or are classified as Code 4 were considered MEP
2 An analysis of typical Code 3 stormwater ponds installed after 1986 was performed to
determine if this class of BMPs met the definition of IVIEP Based on that analysis Code
3 BMPs constructed after 1986 are considered MEP
3 All other classes of BMPs not specified above are not considered MEP and are eligible
for retrofit
Table 22 below shows the breakdown of the impervious acres treated by BMP codes and era
(shaded areas are BMP codes treated to the MEP)
Table 22 Acres of Impervious Cover Treated by BMP Code and Design Era
Design Era Post2002 1986-2002 Pre1986 Blank Total
CIJ tl 0 u Q
~ co
0 28 711 24 132 895
1 33 555 1391 367 2346
2 41 299 12 23 375
3 75 2482 1437 267 4261
4 20 459 482 40 1001
Totals 198 4506 3345 828 8877
IC Credit 100 Code 3amp 4 Code 4 Total Acres treated to
MEP 198 2942 482 40 3661
Assuming a total countywide impervious acreage of 25119 acres and an impervious acreage
treated to the MEP of 3661 as shown in Table 22 there are currently 21458 acres of
untreated impervious area Twenty percent of 21458 equates to 4292 acres of impervious
area that must be restored over the current permit cycle
021611
Montgomery County Coordinated Implementation Strategy - DRAFT
Pollutant Load Tracking
In addition to tracking impervious cover it is necessary to compute existing pollutant loads and
projected reductions in loads as a result of applying storm water controls and BMPs The Center
for Watershed Protections (CWP) Watershed Treatment Model (WTM) version 20 (CWP 2001)
was the tool selected to conduct this analysis and track load reductions across a range of
implementation strategies
The WTM uses a spreadsheet model to calculate annual pollutant loads and runoff volumes
The model also accounts for the benefits contributed by a full suite of stormwater treatment
practices and programs The first step in the model calculates existing pollutant loads by adding
primary and secondary source loads then subtracting reductions according to existing
management practices The second step applies future management practices by subtracting
these calculated reductions from the existing loads Appendix B of the Guidance Document
provides a detailed explanation of the assumptions and steps in the modeling process
For each watershed the WTM was run under existing conditions with existing BMPs to
determine a baseline pollutant load for targeted pollutants The baseline period for non-TMDL
parameters was based on 2002 Maryland Department of Planning land useland cover data
coupled with the Countys existing urban BMP database Pollutants targeted included bacteria
Total Phosphorus (TP) Total Nitrogen (TN) Total Suspended Solids (TSS) and Trash Next a
series of model runs was developed for analyzing the pollutant load reduction effect that
various restoration strategies would have based on assumed levels of implementation for the
various strategies Individual restoration strategies that were sequentially modeled included
the following
bull Completed and High Priority Projects - these include projects already completed or high
priority structural BMPs scheduled for retrofit in the FYll-FY16 Capital Improvements
Program (CIP)
bull Low Priority Projects - these includes FY11-FY16 CIP projects that for various reasons
are considered a lower priority
bull Other Potential Projects - these include other projects in existing inventories that were
not listed in the previous two categories For the Anacostia they include projects in
Anacostia Restoration Plan (ARP) prepared by the Army Corp of Engineers
bull Public ESD Retrofits - These include small scale ESD practices applied to County-owned
buildings streets and parking lots and rights of way Examples include rainwater
harvesting green roofs upland reforestation soil compost amendments rooftop
disconnection green street retrofits and converting drainage ditches to dry swales
021611
Montgomery County Coordinated Implementation Strategy - DRAFT
These are Code 4 structures This category also includes other structural BMP upgrades
to existing County BMPs which were designated as under-performing or nonshy
performing
bull Private ESD Retrofits - These projects include ESD on commercial property and
residential property and include green roofs rain gardens and permeable pavement
bull Riparian Reforestation - Focuses primarily on tree planting for riparian buffer
restoration
bull Stream Restoration - Includes the use of natural materials such as rocks logs and native
vegetation to reduce pressure on eroded banks prevent down-cutting of the
streambed and restore the natural meander patterns and slope profiles found in stable
reference streams
bull Programmatic Practices - This category deals with potential pollutant reduction that can
be attributed and quantified through MS4 stormwater pollution prevention
improvements and better housekeeping on County land and facilities Also includes any
pollutant reductions due to product substitution (eg nitrogen and phosphorus limits in
fertilizer) operational programs (eg recycling) and enforcement This category also
deals with reduced pollutants that can be attributed and quantified through MS4
stormwater education (eg lawn care) and outreach aimed at pollution prevention
better housekeeping and increased stewardship
The naming convention applied for the model runs was WTM 10 (ie baseline) WTM 20 (Le
completed and high priority low priority and other potential projects) WTM 30 (Le public
and private ESD) WTM 40 (ie riparian reforestation and stream restoration) and WTM 50
(ie programmatic) Model runs were developed sequentially to yield incremental increases in
load reduction by strategy In practice however strategies can be applied in combination and
out of sequence to achieve targeted outcomes and the most cost-effective solutions A
summary of the scenarios is provided in Table 23 below
021611
Montgomery County Coordinated Implementation Strategy - DRAFT
Table 23 Summary of Watershed Treatment Model (WTM) Scenarios
Implementation Phase Description
The WTM was run under existing conditions approach
WTM Baseline Conditions with the MDP year 2002 land useland cover data and
existing BMPs
WTM 20 Completed as of
2009j High Priorityj Low
Priority and Other Potential
Projects
The WTM was run with a series of future management
practices which were proposed projects from the
County inventory of restoration sites These practices
cover new ponds retrofits of existing BMPs and some
ESD practices from the proposed projects list
The Countys inventory for other project types that
include public properties eg libraries and parkingWTM 30 ESD Strategies and
lots public schools and open section roads available Other Structural BMPs
for ESD retrofits was reviewed as were areas for
private property ESD retrofits
This category includes any pollutant reduction or volume
reduction that can be attributed to specific stream
WTM 40 Habitat rehabilitation wetland restoration and or riparian
Restoration reforestation projects planned for construction in the
watershed for the permit cycle
WTM 50 MS4 Programmatic See description above
Practices
TMDL Calibration and Tracking
Where TMDLs existed for individual watersheds the WTM was run under existing conditions
with existing BMPs based on the year in which the data was collected for TMDL development
The baseline pollutant load was then compared and normalized to the MDE-determined
baseline MS4 load for the TMDL pollutant Any BMPs with approved dates after the year in
which the data was collected for TMDL development were not included in the baseline
calculation but rather were counted towards meeting the TMDL reduction target
Once the normalized model was established reductions achieved through programs and
practices were tracked using the WTM scenarios based on the percent load reduction from
baseline toward meeting the TMDL required WLA The normalized baseline and WLA target are
determined and specified in the relevant TMDL documents developed by M DE
021611
Montgomery County Coordinated Implementation Strategy - DRAFT
3 WATERSHED IMPLEMENTATION PLANS AND RESTORATION POTENTIAL
The watershed implementation plans and pre-assessments developed in conjunction with the
Strategy are driven by regulatory requirements facing each watershed Table 31 summarizes
the drivers by watershed
Table 31 Restoration Objectives -
W~tershedSubwater~hed - Trash
4 bull - I _ _ -
Patuxent
Anacostia
Rock Creek
Great Seneca
Cabin John Creek
lower Monocacy
Watts BranchMuddy Branch
Dry and little Seneca
lower Potomac Direct
Table 32 presents the more detailed and quantitative aspects of the TMDl requirements for
the MS4 portion within each watershed The Strategy has been developed to meet the MS4
permit area WLA compliance targets presented in Tables 32
In addition to the individual watershed requirements there is a Countywide requirement to
comply with the wasteload allocations associated with urban areas under the Chesapeake Bay
TMDl which applies to nutrients and sediment There is an interim target established for 2017
where reductions from baseline conditions of 9 12 and 20 respectively for TN TP and
TSS are to occur Then by 2020 full compliance is required which correspond to reductions
from baseline conditions of 18 34 and 37 respectively for TN TP and TSS
021611
Montgomery County Coordinated Implementation Strategy - DRAFT
Table 32 TMDl Summary by Impairment
Watershed
Cabin John Creek
Rock 2007 Enterococci 970 453669 18195 Creek
Anacostia 2007 Enterococci 860 247809 29978 River
Aoacostia 2008 TN 788 206312 38959 River
Anacostia 2008 TP 797 20953 3947 Ibsyr River
Triadelphia 2008 TP 580 438 Reservoir
Rocky Gorge 2008 TP 480 4268 3628 Reservoir
Clopper Lake 2002 TP 393
Anacostia 2007 TSS 850 7682 River
Triadelphia 2008 TSS Reservoir Clopper 2002 TSS 00 13 13
Lake
Lower 2009 TSS 380010 172 Monocacy
River
Anacostia 2010 Trash 1000 228683 Ibsyr River
Adapted from 2010 Status of Approved Stormwater Waste load Allocations for NPDES Regulated Stormwater Entities in Montgomery County April 27 2010 by Jeff White MDE
Potential to Reduce Stormwater Pollutant loads
Within each of the implementation plans an analysis was developed that explored the
restoration potential for that watershed Cost was not a limiting factor for the analysis but
rather assumptions were made based on feasibility of implementation rates and consideration
of conflicts with typical site conditions with respect to site use utilities land ownership etc
For example it was assumed that 40 of large County-owned parking lots would be available
for stormwater retrofitting These assumptions are necessary for planning purposes where
detailed site investigations have not occurred However some level of implementation is
021611
Montgomery County Coordinated Implementation Strategy - DRAFT
reasonable to assume In addition all identified high priority and low priority County projects
that have the potential to be constructed were assumed to be implemented
Implementation cost and effectiveness (in terms of pollutant load reduced) was also tracked
through the process of determining watershed restoration potential which enables the
costbenefit evaluation of various strategies for a target parameter (eg tons of sediment per
dollar spent or billion MPN of bacteria per dollar etc) For example by tracking cost and
effectiveness it is possible to evaluate the relative costbenefit of a strategy like ESD versus a
non-structural programmatic practice Moreover the comparison of these two strategies is
going to be different depending on what parameter is being considered eg ESD may be more
cost effective for nutrient reduction but less cost effective for bacterial load reduction
The tables in Appendix C help to illustrate this point Specifically a series of summary charts
and tables have been developed that illustrate the cost effectiveness of the range of strategies
considered by watershed with respect to pollutant load reduction The summaries reflect the
full restoration potential developed for each watershed
It is also useful to compare strategy effectiveness and range of opportunity across watersheds
To facilitate this a series of tables were compiled that groups all watersheds together and
considers watershed restoration potential by strategy These summary tables are presented in
Tables 33 through 310
For this analysis stream restoration was treated as a special modeling case (Table 39) because
it was not tracked as a strategy that receives credit for impervious cover treatment and because
it requires a different pollutant load reduction tracking method based on linear feet of
implementation and the existing stream resource condition (good fair or poor IBI scores
received different pollutant removal credit) Further details on stream restoration modeling
are presented in the individual implementation plans and the Guidance Document
Not all WTM scenarios were modeled for all watersheds For example if there were no
previously identified completed high priority low priority or other potential projects within a
watershed they would appear as zeros for that individual watershed in Tables 33 through 36
Also for non-TMDl watersheds such as Great Seneca and Muddy Branch and Watts Branch
subwatersheds the public and private property ESD riparian reforestation and MS4
programmatic practices scenarios were not modeled due to the lack of regulatory drivers that
define pollutant removal targets
021611
Montgomery County Coordinated Implementation Strategy - DRAFT
Table 33 Cost and benefit summary for completed projects (WTM 20)
Watershed Total ESD PrOjects Incremental reduction from baseline ()
i Cost Numberof Impervious
Cost
I Impervious Trash control added TN TP TSS Bacteria
(million $) projects bullbull (ac)
(total) (total)
Anacostia 95 25 167 7 3 4 4 1 4 4
Cabin John 00 0 0 0 0 02 02 03 03 1
Rock Creek 44 6 212 13 1 2 2 3 3 2 i
I Triadelphia 00 0 0 0 0 0 0 0 0 0
Rocky Gorge 00 0 0 0 0 0 01 0 0 0
Lower Monocacy 00 0 0 0 0 0 0 0 0 0
Clopper lake 00 0 0 0 0 0 0 0 0 0
Great Seneca bull 06 2 11 0 0 1 1 I 1 0 2
MuddyWatts 00 0 0 0 0 0 0 0 0 0
Indudes Clopper lake Project count does not include stream restoration Pollutants with a TMDL are highlighted
Table 34 Cost and benefit summary for high priority projects (WTM 20)
Watershed I
I
Total ESD Projects Incremental reduction from baseline ()
Cost
(million $)
i Numberof
projects bullbull
Impervious
control added
(ac)
ICost (total)
Impervious
(total) TN
I TP TSS I TrashBacteria
Anacostia 64 33 148 65 16 2 2 06 2 2
Cabin John 16 6 88 19 2 3 3 3 3 1
Rock Creek 89 14 373 13 1 2 3 3 3 4
Triadelphia 00 0 0 04 0 0 0 0 0 0
I Rocky Gorge 04 2 5 77 27 06 06 07 06 1
Lower Monocacy 00 0 0 0 0 0 0 0 0 0
Clopper lake 00 0 0 0 010 0 0 0 0 0 Great Seneca bull 183 24 789 6 08 19 19 20 0 24
MuddyWatts 44 16 211 8 1 6 6 6 0 6
Indudes Clopper lake bullbull Project count does not indude stream restoration Pollutants with a TMDL are highlighted
Table 35 Cost and benefit summary for low priority projects (WTM 20)
I Watershed Total ESO Projects Incremental reduction from baseline ()
Numberof Impervious ICost 1m ~ i Cost Impervious
I (million $) projects bullbull
control added (total) (total)
TN TP Bacteria Trash
(ac)
I Anacostia 51 16 188 61 8 2 2 07 2 3
Cabin John 16 8 10 98 78 02 02 02 02 03
I Rock Creek 88 24 657 7 1 4 4 6 5 7
Triadelphia 040 1 20 100 100 05 05 06 05 1
Rocky Gorge 09 2 458 100 100 84 82 83 82 116 i
I Lower Monocacy 0 0 0 0 0 0 0 0 0 0 I Clopper lake 0 0 0 0 0 0 0 0 0 0
I Great Seneca bull 66 16 87 41 15 4 4 4 010 4
I MuddyWatts 20 6 26 84 33 0 0 1 0 0
Includes Clopper Lake Project count does not include stream restoration Pollutants wth a TMDL are highlighted
021611
Montgomery County Coordinated Implementation Strategy - DRAFT
Table 36 Cost and benefit summary for other potential projects (WTM 20)
I Watershed Total ESO Projects Incremental reduction from baseline ()
ICost Impervious I Cost
I I Trash INumber of
control added Impervious
TN TP TSS Bacteria (million $) projects bullbull
(ac) (total) (total)
i i
Anacostia 2492 497 2222 73 62 23 8 26 301
Cabin John 00840 1 5 0 010 01 01 01 01 01
Rock Creek 20 4 201 0 0 12 12 19 15 21
Triadelphia 00 0 0 010 0 00 00 00 00 00
Rocky Gorge 20 2 0 010 0 00 00 00 00 00
lower Monocacy 00 0 0 0( 0 00 00 00 00 0010
Clopper Lake 00 0 0 0 0 00 00 00 00 0010
Great Seneca bull 02 S S3 0 0 23 23 27 00 27
MuddyWatts 00 0 0 0 0( 00 00 00 00 0010
bull Includes Clopper Lake bullbull Project count does not include stream restoration Pollutants with a TMDL are highlighted
Table 37 Cost and benefit summary for ESO projects (WTM 30)
Watershed
I
Cost (million $) Impervious
control added
(ac)
Incremental reduction from baseline ()
ESDfor i ESO for private
public
property property
TN TP TSS Bacteria Trash
Anacostia 2378 21296 1813 20 21 7 22 27
Cabin John 878 10307 876 22 23 25 24 28
Rock Creek 2471 341 2427 30 30 33 32 35
Triadelphia 41 47 36 10 1010 11 11 20
Rocky Gorge 312 19 28S 26 27 32 30 46
lower Monocacy 86 29 53 14 15 15 15 010
Clopper lake 08 051 21 14 14 15 0 14
Great Seneca bull 00 0 0 010 0 0( 0( 010
MuddyWatts 00 a 0 0 01 010 0 0
bull Includes Clopper lake Pollutants with a TMDL are highlighted
Table 3B Cost and benefit summary for riparian reforestation (WTM 40)
IWatershed Cost (million $) Impervious
Incremental reduction from baseline ()
control added Habitat restoration (ac) TN TP TSS Bacteria Trash
Anacostia 1 6 0 0 0 01 02
Cabin John 777 39 1 2 lili
3
Rock Creek 24 119 2 2 2 5
Triadelphia 010 1 01 02 01 04 03
Rocky Gorge 25 12 1 2 2 3 8
lower Monocacy 11 S 3 3 3 4 0
Clopper Lake 023 2 4 4 2 010 4
Great Seneca bull 0 a 010 010 0 010 0
MuddyWatts 0 0 010 0 0 0 0
bull Includes Clopper lake Pallutonts with a TMDL are highlighted
021611
Montgomery County Coordinated Implementation Strategy - DRAFT
Table 57 Cost and benefit summary for stream restoration (WTM 40)
Watershed Stream Restoration Incremental reduction from baseline ()
Number of Impervious control
Cost (million $) added(ac) TN TP TSS Bacteria Trash projects
Anacostia 937 200 0 42 56 326 0 0
Cabinlohn 162 15 0 17 9 80 0 0
Rock Creek 201 30 a 9 710 100 0 0
Triadelphia 00 0 0 0 0 0 010 0
Rocky Gorge 191 18 I 0 10 7 36 0 O lower Monocacy 73 nla 0 7 10 32 010 0
Clopper Lake 00 a 0 0 0 0 0 0
Great Seneca It I 259 33 0 19 8 16 0 0
MuddyWatts 242 45 0 16 7 13 0 0
Includes Clopper Lake Pollutants with a TMDL are highlighted
Table 58 Cost and benefit summary for M54programmatlc practices (WTM 50)
Watershed Cost (million $) Incremental reduction from baseline ()
Programmatic
practices - M54
Impervious control
added (ac) TN TP TSS Bacteria Trash
Anacostia 36 0 9 9 10 8 82
Cabin John 047 0 15 14 0 10 0
Rockereek 12 0 11 11 0 7 0
Triadelphia 00056 a 23 3 0 0 0
Rocky Gorge 009 0 38 8 03 5 2
lower Monocacy 007 0 0 0 19 0 0
Clopper Lake 0Q1 0 61 30
~=r 0
Great Seneca 10 0 0 0 0 0Y0 0 0
MuddyWatts 0 0 0 0 0 0 0
bull Includes Clopper Lake Pollutants with a TMDL are highlighted
021611
Montgomery County Coordinated Implementation Strategy - DRAFT
4 COORDINATED IMPLEMENTATION STRATEGY
The Strategy has multiple objectives to accomplish whereby a challenging balance between
strategies and timeframe is required There isnt necessarily a correct answer in the process
but rather an optimized result that addresses an agreed upon suite of priorities The Strategy
presented here was primarily driven by known and established regulatory timeframes and
compliance endpoints Meeting these endpoints using the more cost effective approaches was
also given priority After this consideration was given to other known and important
approaches that stakeholders and the County have an interest in pursuing Specifically the
following compliance dates and objectives were conSidered in developing the Strategy over the
long-term (Table 41)
Table 41 Compliance Targets for Countywide Coordinated Implementation Strategy
Target Date
2015
2017
2020
Compliance Target
Meeting 20 impervious cover treatment requirement
within the MS4 Permit cycle
Meet the interim dates and targets for the Chesapeake
Bay TMDL which include specific regulated urban area
reductions by 2017 for nutrients and sediment (based
on Maryland Department of the Environments
Watershed Implementation Plan)
Meet the full compliance and targets for the
Chesapeake BayTIVIDL which include specific regulated
urban area reduction by 2020 for nutrients and
sediment (based on Maryland Department of the
Environments Watershed Implementation Plan)
Metric
~4300 acres of
Impervious Cover
9 12 and 20
respectively for TN TP
and TSS reductions
from baseline
conditions
18 34 and 37
respectively for TN TP
and TSS reductions
from baseline
conditions
2025
2030
Meet additional impervious cover treatment targets
associated with next MS4 Permit cycle (assumes
another 20 target)
Meet additional impervious cover treatment targets
associated with next MS4 Permit cycle (assumes
another 20 target)
Out year compliance with other watershed TMDLs
~3400 acres of
Impervious Cover (20
of impervious
remaining after 2015)
~2750 acres of
Impervious Cover (20
of impervious
remaining after 2020)
100 compliance with
MS4 Permit Area WLAs
021611
Montgomery County Coordinated Implementation Strategy - DRAFT
To meet the compliance targets outlined in Table 41 the following priorities were generally
followed
bull 100 implementation of completed high and low priority County projects in first five
years (by 2015)
bull Greater ESD focus in urban (as opposed to suburban and rural) watersheds initially Goal
for ESD in these watersheds on pUblic property in first five years is 10 and on private
property is 10 The level of implementation was largely driven by the 20 Countywide
impervious goal
bull 100 of Public Outreach Potential for all TIVIDl watersheds in first five years This was
pursued to address trash nutrient and bacteria loading which rely strongly on effective
outreach programs to modify behaviors
bull Generally limited strategies to the top four most cost effective per watershed
bull Habitat restoration (stream restoration and buffer reforestation) not pursued as priority
until after first five year period These programs emphasize greater pollutant reduction
efficiency rather than impervious cover treatment which is the primary focus for the
first permit cycle
The Strategy was informed by the individual watershed implementation plans for seven
watersheds which included the Clopper lake and Patuxent subwatersheds Therefore in order
to develop countywide estimates for pollutant load reduction (as is required by the Chesapeake
Bay TMDl) watershed area weighting was applied The process for developing the Countywide
strategy and individual watershed implementation plans was woven together Once the
restoration potential was determined from the individual plans the strategy and schedule was
compiled using the restoration potentials and the drivers listed above The final restoration
cost and schedule was then placed in the implementation plans
It is also worth noting that the high and low priority projects along with the other potential
projects strategies represent a static or fixed number of projects that have been identified by
the County For this analysiS this list of practices is not replenished and therefore once all
opportunities have been implemented other strategies are pursued In reality the County will
continue to develop and update its list of specific project opportunities and have these
available for implementation in future years
The output from this effort is presented in a series of tables ordered by target date in Appendix
D In addition Table 42 provides an overall summary of pollutant load reduction tracking
versus time Through inspection of Table 42 it can be seen that the Strategy meets the
021611
Montgomery County Coordinated Implementation Strategy - DRAFT
impervious cover treatment targets under the current MS4 permit (as well as projected targets
for 2020 and 2025 assuming a continued 20 treatment requirement) interim and final
Chesapeake Bay nutrient and sediment reduction targets by 2017 and 2020 respectively and
out year MS4 permit area WLA compliance for the majority of pollutants Exceptions include
meeting the bacteria WLA load reductions required for the Anacostia and Rock Creek
021611
Montgomery County Coordinated Implementation Strategy - DRAFT
Table 42 Projection by Phase for Watersheds and Pollutants PermitTMDL Targets
Watershed Fiscal Year 2015 2017 2020 2025 2030 2017 2020
Impervious Treated (acres) 1421 2393 3364 4272 4544
ESD ( Impervious) 26 44 61 69A 71
Cost (Million $) 160 307 486 732 820
E5D( Cost) 45 62 71 78 78
Anacostia Nitrogen 25 39 68 89A l00A 818 82
Phosphorus 27 42 77 100 100 812 81
i Sediment 47 72 100 l00A) l00A 875 88
Bacteria 21 33 46 59A 64 879 88
Trash 41 65 89 l00A) 100
Impervious Treated (acres) 1541 1961 2381 3625 3989
ESD ( Impervious) 17 28 36 57A 61
Cost (Million $) 87 172 262 566 658
ESD ( Cost) 7(JA 79 79A 89A 9(JA
Rock Creek Nitrogen 24 30 38 55 61
Phosphorus 25 3(JA 38 54 GfJA)
Sediment 38 50 92 l00A 100
Bacteria 21 27 33 5(JA 55 96(JA 96
Trash 17 24 31 5(JA) 55
Impervious Treated (acres) 187 380 570 1018 1018
ESD ( Impervious) 52 72 78 87A 87A
Cost (Million $) 23 65 114 215 219
ESD ( Cost) 92 91 86 90 88
Cabin John Nitrogen 21 27A 39A 55 58 Phosphorus 2(JA 26 35 49 51
Sediment 6 17 GfJA 91 100
Bacteria 16 22 27 4(JA) 40 31 31
Trash 6 12 19 34 34
Impervious Treated (acres) 237 237 237 237 237
ESD ( Impervious) 4 4 4 4 4
Cost (Million $) 6 8 19 25 31
ESD ( Cost) 32 27A 11 8 7
Muddy Watts Nitrogen 6 7 15 18 22
Phosphorus 6 7 10 12 13 Sediment 7 8 14 17 2(JA
Bacteria 0 (JA 0 (JA 0 i Trash 6 6 6 6 6
bull Impervious Treated (acres) 901 921 941 941 941 ESD ( Impervious) 2 2 2 2 2
Cost (Million $) 26 48 SO 51 52 ESD ( Cost) 15 8 8 8 8
Great Seneca Nitrogen 24 41 43 44 45
Phosphorus 24 32 34 34 34
i Sediment 26 41 43 44 44
I Bacteria (JA) 0 0 0 (JA
Trash 31 32 33 33 33
021611
Montgomery County Coordinated Implementation Strategy - DRAFT
Pe rmitTMDL Targets
Watershed Fiscal Year 2015 2017 2020 2025 2030 2017 2020
Clopper
Impervious Treated (acres) 0 6 12 22 22
ESD ( Impervious) 0 86 86 92 92
Cost (Million $) 0 0 1 2 2
ESD ( Cost) 0 72 73 84 84
Nitrogen 61 67 72 79 79
Phosphorus 30 36 41 48 48 45 45
Sediment 0 5 10 17 17
Bacteria 0 0 0 0 0
Trash 0 6 11 18 18
Lower Monocacy
Impervious Treated (acres) 1 16 32 58 58
ESD ( Impervious) 100 85 84 91 91
Cost (Million $) 0 4 11 18 20
ESD ( Cost) 100 85 54 63 58
Nitrogen 0 5 14 22 24
Phosphorus 0 5 16 26 28
Sediment 0 5 46 61 69 608 61
Bacteria 0 6 12 19 19
Trash 0 0 0 0 0
Rocky Gorge
Impervious Treated (acres) 11 88 165 307 307
ESD ( Impervious) 64 89 90 95 95
Cost (Million $) 3 17 40 70 75
ESD ( Cost) 55 82 64 73 68
Nitrogen 47 55 6710 82 85
Phosphorus 17 25 36 52 53 15 15
Sediment 10 19 45 7(J1o 79
Bacteria 14 23 32 47 47
Trash 15 30 46 68 68
Triadelphia
Impervious Treated (acres) 3 12 20 38 38
ESD ( Impervious) 100 98 97 99 99
Cost (Million $) 1 3 5 9 9
ESD ( Cost) 99 98 98 99 99
Nitrogen 24 27 29 34 34
Phosphorus 4 7 9 14 14 15 15
Sediment 1 4 6 12 12
Bacteria 1 4 6 12 12
Trash 2 6 11 21 21
Countywide
Impervious Treated (acres) 4302 6014 7722 10518 11154 6008 7723
ESD ( Impervious) 18 34 47 6(J1o 63
Cost (Million $) 305 622 987 1687 1884
ESD ( Cost) 53 66 7(J1o 8(J1o 80
Nitrogen 18 25 36 46 51 9 2(J1o
Phosphorus 17 23 34 44 46 12 34
Sediment 23 34 54 6(J1o 62 20 37
Bacteria 11 15 20 28 30
Trash 18 26 33 41 42
Assumptio~s
1 Does no~ includerepeated Outreach and Education costs beyond FY2015
2 Does not include ~n inflation multiplier
021611
Montgomery County Coordinated Implementation Strategy - DRAFT
Summary of Individual Implementation Plans
A summary of the general considerations and prioritization for each watershed implementation
plan is provided below
Anacostia - For the first permit cycle (through 2015) a priority was placed on full
implementation of completed high and low priority projects Next implementation of a third
of the other potential projects was targeted as a large number of these were identified in
conjunction with the USACEs Anacostia Watershed Restoration Plan efforts ESD was
emphasized on both public (10) and private property (10) Finally outreach (25) and
stream restoration (12) are targeted for pollutant load reduction but are not credited towards
impervious cover credit In future permit cycles the remainder of the other potential projects
are targeted along with ESD and a limited amount of riparian reforestation for impervious cover
and pollutant load reduction Outreach and stream restoration are significant strategies
pursued for load reduction benefits Nutrient and sediment MS4 permit area WLAs are met by
2030 but bacteria load reduction does not meet MS4 permit area WLA compliance The
remaining bacteria reduction is believed to be associated with urban wildlife sources Unless
intense urban wildlife management practices are implemented this remaining load reduction
will not be possible
Rock Creek- For the first permit cycle (through 2015) a priority was placed on full
implementation of complete high and low priority projects Next 25 implementation of
other potential projects was targeted ESD was emphasized on both public (10) and private
property (10) with private property implementation being linked to Rainscapes Program
success Finally outreach (100) and stream restoration (22) are targeted for pollutant load
reduction but are not credited towards impervious cover credit In future permit cycles the
remainder of the other potential projects are targeted along with ESD and riparian
reforestation for impervious cover and pollutant load reduction Stream restoration is a
significant strategy pursued for load reduction benefits The bacterial load reduction does not
meet MS4 permit area WLA compliance However the remaining bacterial load is believed to
be associated with urban wildlife sources Unless intense urban wildlife management practices
are implemented this remaining load reduction will not be possible
Cabin John Creek - Similar to the other two more urban watersheds in the County during the
first permit cycle (through 2015) a priority was placed on full implementation of complete high
and low priority projects Fewer opportunities exist overall compared to the Anacostia and Rock
Creek Next 25 implementation of other potential projects was targeted ESD was
emphasized on both public (10) and private property (10) Finally outreach (100) was
021611
Montgomery County Coordinated Implementation Strategy - DRAFT
targeted for pollutant load reduction but not credited towards impervious cover credit No
riparian reforestation or stream restoration was targeted due to limited or no opportunities In
future permit cycles the remainder of the other potential projects are targeted along with ESD
and some riparian reforestation for impervious cover and pollutant load reduction The
bacteria load reduction meets MS4 permit area WLA compliance by 2025
Muddy BranchWatts Branch - During the first permit cycle (through 2015) a priority was
placed on full implementation of complete high and low priority projects Fewer opportunities
exist overall compared to the Anacostia and Rock Creek Watersheds No other strategies were
pursued as there are no existing TMDLs in the Muddy BranchWatts Branch subwatersheds In
future permit cycles previously identified stream restoration projects are implemented for
pollutant load reduction
Great Seneca Creek - This watershed implementation plan is unique in that it includes the small
Clopper Lake subwatershed which has a TMDL for phosphorus Even with the TMDL there are
limited identified opportunities to pursue in the Clopper Lake subwatershed in part due to the
limited area of the subwatershed within the County MS4 permit area During the first permit
cycle (through 2015) a priority was placed on full implementation of complete high and low
priority projects within Great Seneca Creek subwatershed No opportunities exist for these
strategies in Clopper Lake However full outreach was applied in Clopper Lake in the first
permit cycle In future years other potential projects ESD on public and private property and a
small amount of riparian reforestation (in Clopper Lake) is pursued The Clopper Lake WLA for
phosphorus within the MS4 permit area is met
Patuxent - During the first permit cycle through 2015 a priority was placed on full
implementation of complete high and low priority projects Far fewer opportunities exist
overall compared to the Anacostia and Rock Creek A limited amount of ESD on private land
and stream restoration was pursued Finally outreach (100) was targeted for pollutant load
reduction (primarily nutrients) but not credited towards impervious cover credit No riparian
reforestation was targeted within the MS4 Permit area due to cost effectiveness in the Rocky
Gorge subwatershed and limited opportunities in the Triadelphia subwatershed In future
permit cycles ESD on private and public land is pursued more substantially as is stream
restoration A limited amount of riparian reforestation achieves some impervious cover and
pollutant load reduction The Rocky Gorge phosphorus WLA within the MS4 permit area is met
easily and the Tridelphia phosphorus WLA is also met but with a longer timeframe needed for
compliance
021611
Montgomery County Coordinated Implementation Strategy - DRAFT
Lower Monocacy Creek -lower Monocacy Creek is the most rural watershed in the County and
has the least amount of area subject to the County MS4 permit In addition there are no preshy
identified restoration projects within the watershed Therefore during the first permit cycle
(through 2015) only a very small amount (5) of private property ESD is pursued It is not until
the second permit cycle that more focus is placed on private and public ESD as well as stream
restoration and programmatic strategies such as street sweeping to target sediment loads
associated with the TM Dl In future permit cycles stream restoration is pursued for pollutant
load reduction The sediment WlA within the MS4 permit area is projected to be met around
2025
Countywide - The Countywide effort was driven by impervious cover treatment targets and
Chesapeake Bay TMDl2017 and 2020 reduction targets associated with sediment and nutrients
for urban MS4s For impervious cover it was assumed that a 20 target would be required for
each five-year permit cycle The Bay TMDl targets for urban MS4 areas were easily met for all
pollutants in 2017 and easily met for nitrogen and sediment but more difficult to meet for
phosphorus in 2020
Public Outreach and Stewardship
The County recognizes and is committed to the increasingly important role that public outreach
and stewardship will play if improved water quality conditions are going to be achieved
countywide While the County currently has a very active and layered outreach program the
model requires changes that will result in broader stakeholder groups serving as the leaders
and primary champions for clean water in their communities This includes greater participation
from minority and faith-based groups business consortiums schools neighborhood
associations and civic groups Additionally the new model requires revisiting current
initiatives carried out by the various County agencies to look for better and more efficient ways
to communicate messages cross-train and create synergies that result in greater engagement
greater awareness and sustained changes in behavior
Within each implementation plan specific suggestions for outreach and education
opportunities are identified In addition Appendix E of this Strategy contains practice sheets
which highlight targeted restoration activities for the County to develop and refine A total of
eight practices have been identified that can be adopted countywide or in more targeted
watershed areas where there are specific water quality issues to address Many of the
practices build upon existing County programs but require a much broader reach to new
partner groups Program start up costs are suggested and were used to for cost estimates
associated with Countywide strategy The highlighted practices include
021611
Montgomery County Coordinated Implementation Strategy - DRAFT
bull Pet Waste Pickup Education and Outreach Campaign
bull Lawn Stewardship Education and Outreach Campaign
bull Anti-littering Education and Outreach Campaign
bull Innovative Stormwater Management Awareness Campaign
bull Stream Stewards Education and Outreach Campaign
bull Riparian Reforestation Education and Outreach Campaign
bull Roof Runoff Reduction Education and Outreach Campaign
bull Parking Lot Recharge Value Education and Outreach Campaign
Start up costs by practice along with an overall five year cost estimate are provided in Table
43 Start up timeframes are assumed to be up to 18 months
Table 43 Outreach Start Up and 5-Year Cost Projections
Practice Practice Start Up Cost
Pet Waste Pickup $240500
Lawn Stewardship $301 600
Anti-Littering $175050
Stormwater Management Improvements Awareness $50450
Stream Stewards $74825
Riparian Reforestation $30575
Roof Runoff Reduction $101400
Parking Lot Recharge Value $41500
Estimated Start Up Total $744900
5-Year Outreach Budget Projection $2650000
These eight practice sheets provide specific costs and timelines for implementation They also
provide suggestions for measuring program success These practice sheets along with the
specific recommendations in the implementation plans make up the Public Outreach and
Education Campaign
Trash Reduction
Most of the implementation plans have to address trash loadings to meet requirements of the
Potomac Trash Treaty that is referenced in the County1s MS4 Permit In addition the Anacostia
Trash TMDL has recently been accepted by MDE and the EPA According to the Anacostia
021611
Montgomery County Coordinated Implementation Strategy - DRAFT
TMDl there is reasonable assurance that the goals of the Treaty and TMDl can be met with
proper watershed planning implementing pollution-reduction BMPs and using strong political
and financial mechanisms
Currently the County has a number of activities which target trash reduction They include the
following
bull Adopt-a-Road Program through DOT which focuses on public awareness and involvement in trash management There are 205 participants who adopted road segments and agreed to six major road cleanups per year
bull Storm Drain Marking through DOT bull Support for illegal dumping enforcement outreach and research and monitoring bull Partnership with DOT to conduct street sweeping covering about 2500 curb miles and
occurring once a year
bull Partnership with the Park Police to monitor illegal dumping which combined enforces 300-400 actions a year
bull Non-residential and residential recycling programs through Solid Waste Services (SWS) bull Transit stop trash management program at 600 bus stops countywide supported by DOT
Transit Services
In addition to continuing these efforts a number of trash good-housekeeping efforts have been
proposed as part of this Strategy A detailed description of the quantitative methods and
strategies applied can be found in Appendix E of the Guidance Document In general the
following six trash-reduction strategies are recommended
1 Significantly increase funding for trash reduction programs 2 Create and enhance regional partnerships and coordination among businesses
environmental groups individual citizens and government at all levels and in all jurisdictions
3 Improve peoples awareness knowledge and behavior relating to littering and illegal dumping
4 Promote the greater introduction and use of effective trash-reduction technologies and approaches
5 Improve enactment and enforcement of laws to reduce trash 6 Increase trash monitoring-related data collection generation and dissemination efforts
The Anacostia watershed implementation plan provides an outline of the actions that will be
taken through the first permit cycle to reduce trash The range of programs and practices
specially aimed at reducing trash inputs to roads and streams that will be targeted include
reduce reuse and recycle campaigns littering and illegal dumping enforcement stream
cleanups and street sweeping These measures are in addition to any trash trapped and
021611
Montgomery County Coordinated Implementation Strategy - DRAFT
removed by structural practices which are computed using the WTM The plan shows that the
trash TMDl can be met by 2025 at a cost of 732 million dollars
Adaptive Management Monitoring and Reporting
Sound implementation strategies require assessment and effective adaptation to respond to
new information changing conditions new technologies and lessons learned This will be the
basis of the plan that will be used when benchmarks are not met and the projected funding is
inadequate
Adaptive management requires monitoring of a variety of measures that can be used to
determine whether progress is being made towards meeting the Countywide water quality
objectives Ultimately it is the instream water quality and the loading limits with respect to the
TMDls that determine the success of implementation however there are many interim
measures that can also be correlated to success which are worthwhile pursuing
Surface water monitoring can be an expensive and time consuming undertaking Montgomery
County is fortunate to have an extensive Countywide stream monitoring network that can serve
as a foundation for providing spatial and temporal data to indicate stream health The Countys
MS4 Permit also outlines the required assessment of controls which includes chemical
biological and physical monitoring Specifically the permit calls for the County to continue
their watershed restoration monitoring of the lower Paint Branch subwatershed and physical
monitoring ofthe Clarksburg Special Protection area In addition to the existing monitoring
network the County will continue tracking and data reporting associated with levels of
implementation (eg acres of impervious cover treated areas of buffer planted miles of
stream restored miles of streets swept) For measuring effectiveness of outreach and
stewardship efforts other types of monitoring and reporting are planned that include before
and after attitude surveys frequency of website visits and information requests
For many restoration strategies it may be difficult to tease out their individual effectiveness in
terms of pollutant load reductions but collectively the monitoring that occurs should provide
adequate insight into the overall effectiveness of a layered implementation strategy
In addition to the monitoring and assessment the County will be reporting results on an annual
basis as part of their NPDES MS4 Permit annual report The MS4 Permit requires annual
reporting of the following
021611
Montgomery County Coordinated Implementation Strategy - DRAFT
bull The status of implementing the components of the stormwater management program
that are established as permit conditions
bull A narrative summary describing the results and analyses of data including monitoring
data that is accumulated throughout the reporting year
bull Expenditures for the reporting period and the proposed budget for the upcoming year
bull A summary describing the number and nature of enforcement actions inspections and
public education programs
bull The identification of water quality improvements and documentation of progress
toward meeting applicable WLAs developed under EPA approved TMDLs and
bull The identification of any proposed changes to the Countys program when WLAs are not
being met
The County will build upon annual reporting that has historically occurred to meet permit
requirements and will supplement this reporting with tracking table summaries that quantify
implementation activities for the range of strategies pursued during that year and the
associated treatment (eg impervious cover treated pollutant load reduced education and
outreach partners established etc) Cost will also be tracked in association with rates of
implementation This level of performance will then be compared with countywide strategy
targets (eg progress towards meeting WLAs) associated with key performance dates such as
those presented in Table 41 The level of progress achieved by the County will then feed into
the adaptive management approach described above
Organization Needs to Implement Strategy
Montgomery County DEP staff possesses substantial expertise and institutional knowledge that
yields many positive outcomes and efficient processes under the current pace of restoration
and permit compliance activities Under this strategy however the pace of implementation is
required to significantly increase Based on an increase in the level of implementation it is
reasonable to assume that additional capacity may be needed to provide sufficient oversight
and management of all the projects
Another critical element of this strategy is the recognition and commitment to pursuing
outreach initiatives that build community capacity by targeting new partner groups that
provide the necessary leadership oversight and sustained effort to change behaviors and
foster stewardship The County currently carries out many well established and managed
outreach programs but it may require additional focus across County agencies and
departments for these partnerships to become established and thrive
021611 G
Montgomery County Coordinated Implementation Strategy - DRAFT
Through the implementation process and the monitoring and reporting that is required large
amounts of data will be generated Technological advances happen so rapidly in this day and
age it will be important for the County to stay current with technology and methods so that
more efficient and cost-effective data management and reporting will be possible The County
currently relies on a detailed and sophisticated GIS to spatially locate projects and manage
tables of data related to projects The growth and development of this spatial database will be
a critical component of the reporting and tracking capability of the County These databases
generate the input data that are used to measure progress towards baseline loading targets
Regular review and upkeep of the data as well as routine summarization of progress (annually
at a minimum) will likely require additional dedication of staff This is especially the case during
periods where the implementation rate of structural practices in the ground is accelerated
021611
Montgomery County Coordinated Implementation Strategy - DRAFT
Appendix C - Restoration Potential by Watershed
021611
c-
04 03 02 01
a
_ Nitrogen Load Reduction
--shy TMDL WLA Target
_Cost
MONTGOMERY COUNTY URBAN WATERSHEDS POLLUTANTS _Bk)~Ibilats ~1~ l~ fjfsi --
Rank
1
2
3
4
5
6
7
8
9
10
11
Restoration Strategy TN reduction
Ibsyr
Pet Waste Education 15169
Retrofit of Underperforming BMPs 1769
Stream Restoration 72423
Completed Projects ~43 High Priority Projects 3260
Other Potential Projects 43276
Habitat Restoration 224
Public Property ESD Retrofits 18270
Priority Neighborhoods ESD Retrofits 9271
Private Non-residential ESD Retrofits 5594
Street Sweeping -
Incremental Cost Unit Cost
Million $ IbsMillion $ 088 17193
120 1475
9304 778
948 701
635 513
25430 170
141 158
23655 77
13278 70
8018 70
124 -
Qj c
Qj
nI CXI
o -f-
1 09 08 07 06 05
$900 $800 $700
~ $600 c $500 ~ $400 $300 0 u $200 $100
$shy
~~mf il_~IJrt~
MONTGOMERY COUNTY URBAN WATERSHEDS POLLUTANTS ItfiQ14lbilJts i~5 [i
1 $900 Qj
09 $8005 iii en 08 $700
~co 07 $600 co - til
06 $500 ~ 05- $400 ~ 04 en$300 003 u $20002
en $100I 01 o 0 $shys Q en o
s Q
Phosphorus Load Reduction
--- TMDL WLA Target
__Cost
I Rank I
1
2
3
4
5
6
7
8
9
Restoration Strategy
Pet Waste Education
Retrofit of Underperforming BMPs
Stream Restoration
Completed Projects
High Priority Projects
Habitat Restoration
Other Potential Projects
Public Property ESD Retrofits
Priority Neighborhoods ESD Retrofits
10 I Private Non-residential ESD Retrofits
11 Street Sweeping
TP reduction Incremental Cost Unit Cost
Ibsyr Million $ IbsMillion $ 1979 088 2243
247 120 206
13097 9304 141
915 948 96
451 635 71
37 141 26
6067 25430 24
2546 23655 11
1294 13278 10
781 8018 10
- 124 -
MONTGOMERY COUNTY URBAN WATERSHEDS POLLUTANTS IItQjQhabillt$middot
Cii 5 Cii 11 It CD
6 ~ r o ~ s
0 ltIIa r ltII e c ltII III
1 09 08 07 06 05 04 03 02 01
0
$900
$800 $700
v$600 r
0 $500 == $400 $300 11
0 u $200 $100
$shy
_ Sediment load Reduction
--- TMDl WlA Target
__Cost
Rank Restoration Strategy
Sediment reduction
Incremental Cost
Unit Cost
tonsyr Million $ tonsMillion $ 1 Street Sweeping 800 124 645
2 Stream Restoration 25057 9304 269
3 Retrofit of Underperforming BMPs 25 120 21
4 Completed Projects 97 948 10
5 High Priority Projects 47 635 7
6 Other Potential Projects 660 25430 3
7 I Public Property ESD Retrofits 272 23655 1
8 Priority Neighborhoods ESD Retrofits 139 13278 1
9 Private Non-residential ESD Retrofits 84 8018 1
10 Habitat Restoration 2 141 1
11 Pet Waste Education - 088 -
C-3
MONTGOMERY COUNTY URBAN WATERSHEDS POLLUTANTS
-QI5 5i ~
1 09 08 07 06 05 04 03 02 01
0
$900
$800
$700
$600 ~ 0
$500 == $400 $300 11
0 u $200
$100
$shy
--shy TMDL WLA Target
___ Cost
Rank Restoration Strategy
Enterrococci reduction
Incremental Cost
Unit Cost
Billion MPNyr Million $ Billion MPN Million $
1 Pet Waste Education 19643 088 22263
2 Retrofit of Underperforming BMPs 2781 120 2318
3 Completed Projects 10441 948 1101
4 High Priority Projects 5120 635 806
5 Other Potential Projects 69895 25430 275
6 Riparian Reforestation 310 141 219
7 Public Property ESD Retrofits 29025 23655 123
8 Priority Neighborhoods ESD Retrofits 14777 13278 111
9 Private Non-residential ESD Retrofits 8917 8018 111
10 Stream Restoration - 9304 -
11 Street Sweeping - 124 I -
~ I~~~i MONTGOMERY COUNTY URBAN WATERSHEDS POLLUTANTS 1tI2~mL ~ I~I
~$ I -~-- I
100 90 80 70 60 50 40 30 20 10
0
$900 $800 $700 $600 $500 $400 $300 $200 $100 $shy
vi c
~ 5 11 0 u
Implementation Phase
Potential Trash Incremental Unit Cost
I
Rank Restoration Strategy Reduction Cost
Ibsyear Million $ IbsMillion $ 1 Recycling Education and Investigations 51654 02 238837
2 Plastic Bag Ban and Misc Enforcement 63546 13 48882
3 Anti-litter Campaign Education 23J61 09 26930
4 Retrofit of Underperforming BMPs 1144 12 954
5 Completed Projects 6598 95 696
6 High Priority Projects 2786 64 439
7 Other Potential Projects 56341 2543 222
8 Habitat Restoration 266 14 188
9 Street Sweeping 204 12 164
10 Public Property ESD Retrofits 25348 2366 107
11 Priority lIeighborhoods ESD Retrofits 12529 1328 94
12 Private Non-residential ESD Retrofits 7547 802 94 ru Stream Restoration - 930 -14 Pet Waste Education - 09 -
C-5
MONTGOMERY COUNTY URBAN WATERSHEDS POLLUTANTS
CABIN JOHN
1 250
__CostImplementation Phase
09 08 07 06 05 04 03 02 01
0
200 ~ c
150 g E
100 - ltII 0 u
50
0
_E Coli
- - - Waste Load Allocation
Rank Restoration Strategy
E coli reduction
Incremental Cost
Unit Cost
Billion
MPNyr Million $
Billion MPN
Million $ 1 Pet Waste Education 4388 $05 9436
2 Underperforming BMP Retrofits 1892 $19 1022
3 High Priority Projects 1289 $16 800
4 Riparian Reforestation 1133 $78 146
5 Other Potential Projects 148 $17 86
6 Public Property ESD Retrofits 4AOO $860 Sl 7 Private Non-residential ESD Retrofits 1618 $392 41
8 Priority Neighborhoods ESD Retrofits 2633 $638 41
9 Completed Projects 112 $00 0
C-6
MONTGOMERY COUNTY URBAN WATERSHEDS POLLUTANTS 1Itf~~Jabitm
ROCK CREEK
1 $700 Qj5 09
o
_
$600 Qj 08
111 $500 ~ampl 07 c
t5 06 $400 ~ e 05 ~ $3005 04 - 111tl 03 $200 0 u-6 02
$100J 01 $-
Enterrococci
- - - Waste load Allocation Implementation Phase
__Cost
Rank Restoration Strategy
Enterrococci reduction
Incremental Cost
Unit Cost
Billion MPNyr Million $ Billion MPN Million $
Et Pet Waste Management 35734 118 30190
Underperforming BMP Upgrades
Other Potential Projects
28800
30239
577
1083
4995
2792
4 Completed Projects 12131 444 2734
5 High Priority Projects 14239 890 1600
6 Riparian Reforestation 18999 2384 797
7 County Property ESD Retrofits 54519 24136 226
8 Private Residential ESD Retrofits 35230 17737 199
9 Private Non-residential ESD Retrofits 32A86 16380 198
C-7
MONTGOMERY COUNTY URBAN WATERSHEDS POLLUTANTS _f~~pabitafS (fi~r ~~ l-middotshy
ROCK CREEK
100 $900 90 $800 80 $700 u70 $600 c 60 2$50050 -~$40040
lt1$300 030 $200 u
20 10 $100
0 $shy
Implementation Phase
Rank Restoration Strategy Trash Reduction
Incremental Cost
Unit Cost I
Ibsyear Million $ IbsMillion $ 1 Other Potential Projects 16038 1085 1478
2 Underperforming BMP Upgrades 6756 577 1172
3 Completed Projects 4217 444 950
4 High Priority Projects 6366 890 715
5 Riparian Reforestation 9237 2384 387
6 Public Property ESD Retrofits 24587 24136 102
7 Priority Neighborhoods ESD Retrofits 16155 17737 91
8 Private Non-residential ESD Retrofits 14793 16380 90
9 Pet Waste Education - 118 -
(-8
MONTGOMERY COUNTY RURAL WATERSHEDS POLLUTANTS
SENECA - CLOPPER LAKE -
100 Qi
90 iii 80VI to -CQ 70 0 60e 50I 0 40 u l 30
C QJ 20ex
C 10to 0
J 0
$18
$16
$14 n
$12 I
$10 sect $08 ~ $06 0
VI
U $04
$02
$shy
_TPRemoval - - - TMDL Reduction Target
Implementation Phase ___Cost
Rank Restoration Strategy TP
Reduction (Ibsyr)
Incremental Cost (Million $)
Unit Cost (IbsvrMillion $)
1 Residential Education 33 001 6246
2 Underperforming BMP Retrofits 13 004 341 3 Riparian Buffer Reforestation 19 023 99 4 Priority Neighborhood ESD Retrofits 15 051 35 5 Public Property ESD Retrofits 7 075 99
C-9
-pj[fti
MONTGOMERY COUNTY URBAN WATERSHEDS POLLUTANTS 1It[~~JIlbitIL f bull~
LOWER MONOCACY
1 09 08 07 06 05 04 03 02 01
0
Implementation Phase
25
20 ~ c
15 ~ ~
10 - 0 u
5
0
_TSS
- - - Waste load Allocation _Cost
Rank Restoration Strategy
Sediment reduction
Incremental
Cost Unit Cost
tonsyear Million $ tonMilli
1 Street Sweeping 22 $007 3121
2 Underperforming BMP Retrofits 4 $010 389
3 Stream Restoration 37 $734 51
4 Riparian Buffer Reforestation 3 $109 25
5 Other Structural BMPs and ESD Strategies 10 $851 12
6 Priority Neighborhoods ESD Retrofits 2 $160 10
7 Non-residential ESD Retrofits 1 $132 10
C-10
MONTGOMERY COUNTY RURAL WATERSHEDS POLLUTANTS 1tlj~lIbiIalSlt~~II
1 09 08 07 06 05 04 03 02 01
0
$70
$60
$50 ~ c
$40 ~ ~ $30 - UI
$20 0 v
$10
$0
_ Phosphorus Load Reduction
- - - Waste Load Allocation ___ CostImplementation Phase
Rank Restoration Strategy TP Incremental Cost
Million $ Unit Cost
Ibsyr Ibs Million $ 1 Lawn Care Education 3670 01 37394
2 Underperforming BMP Retrofits 3499 08 4338
3 Other Potential Projects 3524 33 1076
4 High Priority Projects 252 04 685
5 Riparian Reforestation 762 26 298
6 Public Property Retrofits 5854 345 169
7 Priority Neighborhoods ESD Retrofits 796 65 123
8 Private Non-residential ESD Retrofits 1941 168 116
9 Completed Projects 53 00 00
c- 11
MONTGOMERY COUNTY RURAL WATERSHEDS POLLUTANTSal12hdJilats ~I~ ~ [ -
1 10 ii 5 09 9 1 08 8 II al- 07 7 1ii o 06 6
c
~ ~ 1 o E IV
05 04 03
5 4
3
~ 11 0 u
0 11 02 2 J o 01 1
t a 0 0 11 o
t 0
_ Phosphorus Reduction
- - - Waste Load Allocation
-Cost
Rank Restoration Strategy TP Incremental Cost
Million $ Unit Cost
Ibsyr Ibs Million $ 1 Lawn Care Education 3670 01 37394
2 Underperforming BMP Retrofits 3499 08 4338
3 Other Potential Projects 3524 33 1076
4 High Priority Projects 252 04 685
5 Riparian Reforestation 762 26 298
6 Public Property Retrofits 5854 345 169
7 Priority Neighborhoods ESD Retrofits 796 65 123
8 Private Non-residential ESD Retrofits 1941 168 116
9 Completed Projects 53 00 00
C-12
Montgomery County Coordinated Implementation Strategy - DRAFT
include the Potomac River Watershed Trash Treaty Annual Potomac River Watershed Trash
Summit Annual Potomac River Watershed Cleanup market-based approaches such as the
Trash Free Potomac Facility Program and a Regional Anti-Litter Campaign (Alice Ferguson
Foundation 2011) The MS4 permit requires Montgomery County to meet the commitments of
Potomac River Watershed Treaty The permit specifically requires that Montgomery County
1 Support and implement regional strategies to reduce trash
2 Develop a work plan to implement a public outreach and education campaign
3 Establish baseline conditions of trash being discharged and develop a reduction strategy
and work plan for the Montgomery County portion of the Anacostia Watershed
4 Implement approved control measures in accordance with the trash reduction work
plan
5 Conduct public participation in development of trash reduction strategy
6 Submit progress annually
Public Outreach and Stewardship
The Countys MS4 Permit requires significant opportunities for public participation in achieving
TMDls watershed restoration and trash management The permit specifically requires the
County to prepare a work plan to implement a public outreach and education campaign The
County recognizes that a successful strategy will require a significant increase in effective and
coordinated public outreach and public stewardship The implementation plans and this
Strategy describe how DEP plans to implement public outreach and education campaigns with
specific performance goals and deadlines
021611
Montgomery County Coordinated Implementation Strategy - DRAFT
2 EXISTING CONDITIONS
Watershed health is variable throughout the County and typically well correlated with intensity
and age of urbanization More specifically watershed health typically declines with increasing
density and older age of development Many of Montgomery Countys older urban and
suburban areas were developed in an era when runoff from paved surfaces (roads parking lots
driveways) was directed to storm drains which conveyed untreated runoff directly to streams
This large volume of water caused massive erosion of the stream banks and destroyed habitat
Stormwater treatment using stormwater ponds to receive detain and filter runoff before it
flowed into streams was either inadequate or non-existent The Anacostia Rock Creek and
Cabin John Creek watersheds are examples where these conditions are common Modern
stormwater techniques known as environmental site design or ESD encourage the reduction
of runoff by infiltrating the water into the ground near its source
Watershed health improves in more rural areas of the County but even in these areas stream
degradation can occur stemming from large lot development and poor agricultural
management practices
The County has conducted comprehensive water quality and biological sampling for more than
a decade which provides a representative snapshot of existing watershed health as well as the
ability to track watershed health over time Figure 21 shows countywide watershed resource
conditions based on monitoring that was conducted from 2000-2008 The area inside the
beltway in the more urban core has lower water quality (fair to poor) while the area outside the
beltway tends to have better water quality (fair to good to excellent)
021611
---- -
-----
Montgomery County Coordinated Implementation Strategy - DRAFT
Watershed Resource Conditions Montgomery County Maryland
LEGEND z fbn
G 0middot1 - -~UlIS
- tI)Jogtf~
UJJOf Wrw Ftns
Splaquo1lII PnreltbOrI NtH SPAl
3D~~ennHI
[=jji=---~~-
Figure 21 County Watershed Resource Conditions
County Statistics
The Strategy will benefit from the fact that the majority of county residents own the property
they reside on (nearly 70) and thus have control over that property Also nearly 70 of the
residences are single unit homes Moreover the average household income is roughly $90000
making the likelihood of financial capability to install BMPs an appropriate assumption Both of
these statistics make advocacy of BMPs on residential properties an imperative for the Strategy
Montgomery Countys robust business economy was also considered in the Strategy
development Despite the current economic volatility Montgomery Countys business
community is still profitable and still maintaining and improving existing facilities Moreover
the construction of the inter-county-connector (ICC) through much of Montgomery County will
provide opportunities to install demonstration BMPs on newly developing properties for
replication throughout stakeholder groups Also the presence of communication industry
leaders (ie Discovery Channel) in the County creates unique stewardship education
partnership possibilities with businesses The Strategy will include these stakeholders
021611
Montgomery County Coordinated Implementation Strategy - DRAFT
involvement opportunities to best harness the power of Montgomery Countys healthy
business economy
The county includes a fairly even split of males and females The majority of residents nearly
50 fall between the ages of 25 and 55 Only 15 of the population is aged 60 and above In
addition the majority of Montgomery County residents indicate their preferred language as
English however Spanish translations of stakeholder involvement opportunities will be
required in select watersheds to accommodate the 13 of county residents that indicate their
preferred language as Spanish Other potential target groups for translation for stakeholder
involvement include the Asian community as 11 of the countys population is Asian (mostly
Korean and Vietnamese) Because of this the Strategy and implementation plans will take
multilingual requirements into consideration for signage and other educational tools as well
MS4 Permit Coverage
The Countys most recent NPDES MS4 stormwater permit only covers runoff from
developments within the County area The following areas are excluded from the Countys MS4
permit area shown in Figure 22
bull Cities of Gaithersburg Rockville and Takoma Park
bull Maryland National Capital Park and Planning Commission (MNCPPC) lands
bull Washington Sanitary Sewer Commission (WSSC) land
bull Federal and State government owned land and facilities
bull Rural zoning
021611 G
Montgomery County Coordinated Implementation Strategy - DRAFT
MS4 Permit Area Montgomery County Maryland
(-i Gaithersbur9 ~
M Ro ckville
TkD m Parilt -Jr MNC PPC Lnds
0 5 3
Feder 1 and SI PropertyM i KbnelefS
M 0 I 2 ~- Federal and Sta1e Roads
~ i s Rural Zon ing
Figure 22 Areas outside the Montgomery County MS4 Permit Area
Impervious Surfaces
As previously mentioned the Countys MS4 Permit requires treatment of an additional 20 of
impervious cover not currently receiving treatment to the MEP Table 21 presents a summary
of the countywide impervious cover totals along with breakdowns by major land cover type
These land covers will be the focus of much of the Countys targeted effort to treat the 20
target
021611
Montgomery County Coordinated Implementation Strategy - DRAFT
Table 2llmpervious Surface Summary
Description
Total County Area 324552 100
Total Area of 1m ervious Surface 35965 _ _-----shy 11
County Area Subject to Stormwater Permit (1) 138649 43
Imllervious Cover Subject to Stormwater Permit 2) ~==5119====18o2 == ==== Areas of Impervious Surface (3)
Road 13607 38
Building 13073 36
Parking 22
Sidewalk 1069 3
Recreation (4) 347 1 1 Exclusions include Certain zoning codes parklands forests municipalities with own stormwater management
programs state and federal properties and state and federal maintained roads 2 Percent of County Jurisdictional Area subject to the Stormwater Permit 3 Impervious area within each category within the total County area 4 Recreation imperviousness excludes swimming pools
Implementation Plan Guidance Document
The Implementation Plan Guidance Document (revised October 252010) provides a road map
for how the implementation plans were created The primary sections of the Guidance
Document and a short description of each are provided in Appendix A
The Guidance Document divides BMPs into five classes or codes shown below The Guidance
Document also provides a list of BMPs and which code they fall under which is provided in
Appendix B
Code 0 Pretreatment Practices
Code 1 Non-performing BMPs No runoff reduction and no long term pollutant removal
Code 2 Under-performing BMPs Limited runoff reduction and low pollutant removal
Code 3 Effective BMPs No runoff reduction but moderate to high pollutant removal
Code 4 ESO BMPs High runoff reduction and moderate to high pollutant removal
Impervious Cover Accounting and Tracking
Montgomery County has GIS data layers that contain all the stormwater BMPs in the County
and their drainage areas In order to determine the 20 target for impervious cover treatment
021611
Montgomery County Coordinated Implementation Strategy - DRAFT
to the MEP the County analyzed their existing impervious cover and their existing BMP
database to determine how much impervious cover is currently being treated to the MEP
Several methods were considered based on a determination of the MEP standard compared to
existing treatment methods According to MDE guidance to be considered MEP a BMP must
capture at least the Water Quality Volume (WQv) (the first inch of rainfall) or the CPv volume
(26 inches of rainfall) The final method used for determining which BMPs are MEP and the
amount of impervious surface not treated to the MEP was as follows
1 All BMPs that were installed after 2002 or are classified as Code 4 were considered MEP
2 An analysis of typical Code 3 stormwater ponds installed after 1986 was performed to
determine if this class of BMPs met the definition of IVIEP Based on that analysis Code
3 BMPs constructed after 1986 are considered MEP
3 All other classes of BMPs not specified above are not considered MEP and are eligible
for retrofit
Table 22 below shows the breakdown of the impervious acres treated by BMP codes and era
(shaded areas are BMP codes treated to the MEP)
Table 22 Acres of Impervious Cover Treated by BMP Code and Design Era
Design Era Post2002 1986-2002 Pre1986 Blank Total
CIJ tl 0 u Q
~ co
0 28 711 24 132 895
1 33 555 1391 367 2346
2 41 299 12 23 375
3 75 2482 1437 267 4261
4 20 459 482 40 1001
Totals 198 4506 3345 828 8877
IC Credit 100 Code 3amp 4 Code 4 Total Acres treated to
MEP 198 2942 482 40 3661
Assuming a total countywide impervious acreage of 25119 acres and an impervious acreage
treated to the MEP of 3661 as shown in Table 22 there are currently 21458 acres of
untreated impervious area Twenty percent of 21458 equates to 4292 acres of impervious
area that must be restored over the current permit cycle
021611
Montgomery County Coordinated Implementation Strategy - DRAFT
Pollutant Load Tracking
In addition to tracking impervious cover it is necessary to compute existing pollutant loads and
projected reductions in loads as a result of applying storm water controls and BMPs The Center
for Watershed Protections (CWP) Watershed Treatment Model (WTM) version 20 (CWP 2001)
was the tool selected to conduct this analysis and track load reductions across a range of
implementation strategies
The WTM uses a spreadsheet model to calculate annual pollutant loads and runoff volumes
The model also accounts for the benefits contributed by a full suite of stormwater treatment
practices and programs The first step in the model calculates existing pollutant loads by adding
primary and secondary source loads then subtracting reductions according to existing
management practices The second step applies future management practices by subtracting
these calculated reductions from the existing loads Appendix B of the Guidance Document
provides a detailed explanation of the assumptions and steps in the modeling process
For each watershed the WTM was run under existing conditions with existing BMPs to
determine a baseline pollutant load for targeted pollutants The baseline period for non-TMDL
parameters was based on 2002 Maryland Department of Planning land useland cover data
coupled with the Countys existing urban BMP database Pollutants targeted included bacteria
Total Phosphorus (TP) Total Nitrogen (TN) Total Suspended Solids (TSS) and Trash Next a
series of model runs was developed for analyzing the pollutant load reduction effect that
various restoration strategies would have based on assumed levels of implementation for the
various strategies Individual restoration strategies that were sequentially modeled included
the following
bull Completed and High Priority Projects - these include projects already completed or high
priority structural BMPs scheduled for retrofit in the FYll-FY16 Capital Improvements
Program (CIP)
bull Low Priority Projects - these includes FY11-FY16 CIP projects that for various reasons
are considered a lower priority
bull Other Potential Projects - these include other projects in existing inventories that were
not listed in the previous two categories For the Anacostia they include projects in
Anacostia Restoration Plan (ARP) prepared by the Army Corp of Engineers
bull Public ESD Retrofits - These include small scale ESD practices applied to County-owned
buildings streets and parking lots and rights of way Examples include rainwater
harvesting green roofs upland reforestation soil compost amendments rooftop
disconnection green street retrofits and converting drainage ditches to dry swales
021611
Montgomery County Coordinated Implementation Strategy - DRAFT
These are Code 4 structures This category also includes other structural BMP upgrades
to existing County BMPs which were designated as under-performing or nonshy
performing
bull Private ESD Retrofits - These projects include ESD on commercial property and
residential property and include green roofs rain gardens and permeable pavement
bull Riparian Reforestation - Focuses primarily on tree planting for riparian buffer
restoration
bull Stream Restoration - Includes the use of natural materials such as rocks logs and native
vegetation to reduce pressure on eroded banks prevent down-cutting of the
streambed and restore the natural meander patterns and slope profiles found in stable
reference streams
bull Programmatic Practices - This category deals with potential pollutant reduction that can
be attributed and quantified through MS4 stormwater pollution prevention
improvements and better housekeeping on County land and facilities Also includes any
pollutant reductions due to product substitution (eg nitrogen and phosphorus limits in
fertilizer) operational programs (eg recycling) and enforcement This category also
deals with reduced pollutants that can be attributed and quantified through MS4
stormwater education (eg lawn care) and outreach aimed at pollution prevention
better housekeeping and increased stewardship
The naming convention applied for the model runs was WTM 10 (ie baseline) WTM 20 (Le
completed and high priority low priority and other potential projects) WTM 30 (Le public
and private ESD) WTM 40 (ie riparian reforestation and stream restoration) and WTM 50
(ie programmatic) Model runs were developed sequentially to yield incremental increases in
load reduction by strategy In practice however strategies can be applied in combination and
out of sequence to achieve targeted outcomes and the most cost-effective solutions A
summary of the scenarios is provided in Table 23 below
021611
Montgomery County Coordinated Implementation Strategy - DRAFT
Table 23 Summary of Watershed Treatment Model (WTM) Scenarios
Implementation Phase Description
The WTM was run under existing conditions approach
WTM Baseline Conditions with the MDP year 2002 land useland cover data and
existing BMPs
WTM 20 Completed as of
2009j High Priorityj Low
Priority and Other Potential
Projects
The WTM was run with a series of future management
practices which were proposed projects from the
County inventory of restoration sites These practices
cover new ponds retrofits of existing BMPs and some
ESD practices from the proposed projects list
The Countys inventory for other project types that
include public properties eg libraries and parkingWTM 30 ESD Strategies and
lots public schools and open section roads available Other Structural BMPs
for ESD retrofits was reviewed as were areas for
private property ESD retrofits
This category includes any pollutant reduction or volume
reduction that can be attributed to specific stream
WTM 40 Habitat rehabilitation wetland restoration and or riparian
Restoration reforestation projects planned for construction in the
watershed for the permit cycle
WTM 50 MS4 Programmatic See description above
Practices
TMDL Calibration and Tracking
Where TMDLs existed for individual watersheds the WTM was run under existing conditions
with existing BMPs based on the year in which the data was collected for TMDL development
The baseline pollutant load was then compared and normalized to the MDE-determined
baseline MS4 load for the TMDL pollutant Any BMPs with approved dates after the year in
which the data was collected for TMDL development were not included in the baseline
calculation but rather were counted towards meeting the TMDL reduction target
Once the normalized model was established reductions achieved through programs and
practices were tracked using the WTM scenarios based on the percent load reduction from
baseline toward meeting the TMDL required WLA The normalized baseline and WLA target are
determined and specified in the relevant TMDL documents developed by M DE
021611
Montgomery County Coordinated Implementation Strategy - DRAFT
3 WATERSHED IMPLEMENTATION PLANS AND RESTORATION POTENTIAL
The watershed implementation plans and pre-assessments developed in conjunction with the
Strategy are driven by regulatory requirements facing each watershed Table 31 summarizes
the drivers by watershed
Table 31 Restoration Objectives -
W~tershedSubwater~hed - Trash
4 bull - I _ _ -
Patuxent
Anacostia
Rock Creek
Great Seneca
Cabin John Creek
lower Monocacy
Watts BranchMuddy Branch
Dry and little Seneca
lower Potomac Direct
Table 32 presents the more detailed and quantitative aspects of the TMDl requirements for
the MS4 portion within each watershed The Strategy has been developed to meet the MS4
permit area WLA compliance targets presented in Tables 32
In addition to the individual watershed requirements there is a Countywide requirement to
comply with the wasteload allocations associated with urban areas under the Chesapeake Bay
TMDl which applies to nutrients and sediment There is an interim target established for 2017
where reductions from baseline conditions of 9 12 and 20 respectively for TN TP and
TSS are to occur Then by 2020 full compliance is required which correspond to reductions
from baseline conditions of 18 34 and 37 respectively for TN TP and TSS
021611
Montgomery County Coordinated Implementation Strategy - DRAFT
Table 32 TMDl Summary by Impairment
Watershed
Cabin John Creek
Rock 2007 Enterococci 970 453669 18195 Creek
Anacostia 2007 Enterococci 860 247809 29978 River
Aoacostia 2008 TN 788 206312 38959 River
Anacostia 2008 TP 797 20953 3947 Ibsyr River
Triadelphia 2008 TP 580 438 Reservoir
Rocky Gorge 2008 TP 480 4268 3628 Reservoir
Clopper Lake 2002 TP 393
Anacostia 2007 TSS 850 7682 River
Triadelphia 2008 TSS Reservoir Clopper 2002 TSS 00 13 13
Lake
Lower 2009 TSS 380010 172 Monocacy
River
Anacostia 2010 Trash 1000 228683 Ibsyr River
Adapted from 2010 Status of Approved Stormwater Waste load Allocations for NPDES Regulated Stormwater Entities in Montgomery County April 27 2010 by Jeff White MDE
Potential to Reduce Stormwater Pollutant loads
Within each of the implementation plans an analysis was developed that explored the
restoration potential for that watershed Cost was not a limiting factor for the analysis but
rather assumptions were made based on feasibility of implementation rates and consideration
of conflicts with typical site conditions with respect to site use utilities land ownership etc
For example it was assumed that 40 of large County-owned parking lots would be available
for stormwater retrofitting These assumptions are necessary for planning purposes where
detailed site investigations have not occurred However some level of implementation is
021611
Montgomery County Coordinated Implementation Strategy - DRAFT
reasonable to assume In addition all identified high priority and low priority County projects
that have the potential to be constructed were assumed to be implemented
Implementation cost and effectiveness (in terms of pollutant load reduced) was also tracked
through the process of determining watershed restoration potential which enables the
costbenefit evaluation of various strategies for a target parameter (eg tons of sediment per
dollar spent or billion MPN of bacteria per dollar etc) For example by tracking cost and
effectiveness it is possible to evaluate the relative costbenefit of a strategy like ESD versus a
non-structural programmatic practice Moreover the comparison of these two strategies is
going to be different depending on what parameter is being considered eg ESD may be more
cost effective for nutrient reduction but less cost effective for bacterial load reduction
The tables in Appendix C help to illustrate this point Specifically a series of summary charts
and tables have been developed that illustrate the cost effectiveness of the range of strategies
considered by watershed with respect to pollutant load reduction The summaries reflect the
full restoration potential developed for each watershed
It is also useful to compare strategy effectiveness and range of opportunity across watersheds
To facilitate this a series of tables were compiled that groups all watersheds together and
considers watershed restoration potential by strategy These summary tables are presented in
Tables 33 through 310
For this analysis stream restoration was treated as a special modeling case (Table 39) because
it was not tracked as a strategy that receives credit for impervious cover treatment and because
it requires a different pollutant load reduction tracking method based on linear feet of
implementation and the existing stream resource condition (good fair or poor IBI scores
received different pollutant removal credit) Further details on stream restoration modeling
are presented in the individual implementation plans and the Guidance Document
Not all WTM scenarios were modeled for all watersheds For example if there were no
previously identified completed high priority low priority or other potential projects within a
watershed they would appear as zeros for that individual watershed in Tables 33 through 36
Also for non-TMDl watersheds such as Great Seneca and Muddy Branch and Watts Branch
subwatersheds the public and private property ESD riparian reforestation and MS4
programmatic practices scenarios were not modeled due to the lack of regulatory drivers that
define pollutant removal targets
021611
Montgomery County Coordinated Implementation Strategy - DRAFT
Table 33 Cost and benefit summary for completed projects (WTM 20)
Watershed Total ESD PrOjects Incremental reduction from baseline ()
i Cost Numberof Impervious
Cost
I Impervious Trash control added TN TP TSS Bacteria
(million $) projects bullbull (ac)
(total) (total)
Anacostia 95 25 167 7 3 4 4 1 4 4
Cabin John 00 0 0 0 0 02 02 03 03 1
Rock Creek 44 6 212 13 1 2 2 3 3 2 i
I Triadelphia 00 0 0 0 0 0 0 0 0 0
Rocky Gorge 00 0 0 0 0 0 01 0 0 0
Lower Monocacy 00 0 0 0 0 0 0 0 0 0
Clopper lake 00 0 0 0 0 0 0 0 0 0
Great Seneca bull 06 2 11 0 0 1 1 I 1 0 2
MuddyWatts 00 0 0 0 0 0 0 0 0 0
Indudes Clopper lake Project count does not include stream restoration Pollutants with a TMDL are highlighted
Table 34 Cost and benefit summary for high priority projects (WTM 20)
Watershed I
I
Total ESD Projects Incremental reduction from baseline ()
Cost
(million $)
i Numberof
projects bullbull
Impervious
control added
(ac)
ICost (total)
Impervious
(total) TN
I TP TSS I TrashBacteria
Anacostia 64 33 148 65 16 2 2 06 2 2
Cabin John 16 6 88 19 2 3 3 3 3 1
Rock Creek 89 14 373 13 1 2 3 3 3 4
Triadelphia 00 0 0 04 0 0 0 0 0 0
I Rocky Gorge 04 2 5 77 27 06 06 07 06 1
Lower Monocacy 00 0 0 0 0 0 0 0 0 0
Clopper lake 00 0 0 0 010 0 0 0 0 0 Great Seneca bull 183 24 789 6 08 19 19 20 0 24
MuddyWatts 44 16 211 8 1 6 6 6 0 6
Indudes Clopper lake bullbull Project count does not indude stream restoration Pollutants with a TMDL are highlighted
Table 35 Cost and benefit summary for low priority projects (WTM 20)
I Watershed Total ESO Projects Incremental reduction from baseline ()
Numberof Impervious ICost 1m ~ i Cost Impervious
I (million $) projects bullbull
control added (total) (total)
TN TP Bacteria Trash
(ac)
I Anacostia 51 16 188 61 8 2 2 07 2 3
Cabin John 16 8 10 98 78 02 02 02 02 03
I Rock Creek 88 24 657 7 1 4 4 6 5 7
Triadelphia 040 1 20 100 100 05 05 06 05 1
Rocky Gorge 09 2 458 100 100 84 82 83 82 116 i
I Lower Monocacy 0 0 0 0 0 0 0 0 0 0 I Clopper lake 0 0 0 0 0 0 0 0 0 0
I Great Seneca bull 66 16 87 41 15 4 4 4 010 4
I MuddyWatts 20 6 26 84 33 0 0 1 0 0
Includes Clopper Lake Project count does not include stream restoration Pollutants wth a TMDL are highlighted
021611
Montgomery County Coordinated Implementation Strategy - DRAFT
Table 36 Cost and benefit summary for other potential projects (WTM 20)
I Watershed Total ESO Projects Incremental reduction from baseline ()
ICost Impervious I Cost
I I Trash INumber of
control added Impervious
TN TP TSS Bacteria (million $) projects bullbull
(ac) (total) (total)
i i
Anacostia 2492 497 2222 73 62 23 8 26 301
Cabin John 00840 1 5 0 010 01 01 01 01 01
Rock Creek 20 4 201 0 0 12 12 19 15 21
Triadelphia 00 0 0 010 0 00 00 00 00 00
Rocky Gorge 20 2 0 010 0 00 00 00 00 00
lower Monocacy 00 0 0 0( 0 00 00 00 00 0010
Clopper Lake 00 0 0 0 0 00 00 00 00 0010
Great Seneca bull 02 S S3 0 0 23 23 27 00 27
MuddyWatts 00 0 0 0 0( 00 00 00 00 0010
bull Includes Clopper Lake bullbull Project count does not include stream restoration Pollutants with a TMDL are highlighted
Table 37 Cost and benefit summary for ESO projects (WTM 30)
Watershed
I
Cost (million $) Impervious
control added
(ac)
Incremental reduction from baseline ()
ESDfor i ESO for private
public
property property
TN TP TSS Bacteria Trash
Anacostia 2378 21296 1813 20 21 7 22 27
Cabin John 878 10307 876 22 23 25 24 28
Rock Creek 2471 341 2427 30 30 33 32 35
Triadelphia 41 47 36 10 1010 11 11 20
Rocky Gorge 312 19 28S 26 27 32 30 46
lower Monocacy 86 29 53 14 15 15 15 010
Clopper lake 08 051 21 14 14 15 0 14
Great Seneca bull 00 0 0 010 0 0( 0( 010
MuddyWatts 00 a 0 0 01 010 0 0
bull Includes Clopper lake Pollutants with a TMDL are highlighted
Table 3B Cost and benefit summary for riparian reforestation (WTM 40)
IWatershed Cost (million $) Impervious
Incremental reduction from baseline ()
control added Habitat restoration (ac) TN TP TSS Bacteria Trash
Anacostia 1 6 0 0 0 01 02
Cabin John 777 39 1 2 lili
3
Rock Creek 24 119 2 2 2 5
Triadelphia 010 1 01 02 01 04 03
Rocky Gorge 25 12 1 2 2 3 8
lower Monocacy 11 S 3 3 3 4 0
Clopper Lake 023 2 4 4 2 010 4
Great Seneca bull 0 a 010 010 0 010 0
MuddyWatts 0 0 010 0 0 0 0
bull Includes Clopper lake Pallutonts with a TMDL are highlighted
021611
Montgomery County Coordinated Implementation Strategy - DRAFT
Table 57 Cost and benefit summary for stream restoration (WTM 40)
Watershed Stream Restoration Incremental reduction from baseline ()
Number of Impervious control
Cost (million $) added(ac) TN TP TSS Bacteria Trash projects
Anacostia 937 200 0 42 56 326 0 0
Cabinlohn 162 15 0 17 9 80 0 0
Rock Creek 201 30 a 9 710 100 0 0
Triadelphia 00 0 0 0 0 0 010 0
Rocky Gorge 191 18 I 0 10 7 36 0 O lower Monocacy 73 nla 0 7 10 32 010 0
Clopper Lake 00 a 0 0 0 0 0 0
Great Seneca It I 259 33 0 19 8 16 0 0
MuddyWatts 242 45 0 16 7 13 0 0
Includes Clopper Lake Pollutants with a TMDL are highlighted
Table 58 Cost and benefit summary for M54programmatlc practices (WTM 50)
Watershed Cost (million $) Incremental reduction from baseline ()
Programmatic
practices - M54
Impervious control
added (ac) TN TP TSS Bacteria Trash
Anacostia 36 0 9 9 10 8 82
Cabin John 047 0 15 14 0 10 0
Rockereek 12 0 11 11 0 7 0
Triadelphia 00056 a 23 3 0 0 0
Rocky Gorge 009 0 38 8 03 5 2
lower Monocacy 007 0 0 0 19 0 0
Clopper Lake 0Q1 0 61 30
~=r 0
Great Seneca 10 0 0 0 0 0Y0 0 0
MuddyWatts 0 0 0 0 0 0 0
bull Includes Clopper Lake Pollutants with a TMDL are highlighted
021611
Montgomery County Coordinated Implementation Strategy - DRAFT
4 COORDINATED IMPLEMENTATION STRATEGY
The Strategy has multiple objectives to accomplish whereby a challenging balance between
strategies and timeframe is required There isnt necessarily a correct answer in the process
but rather an optimized result that addresses an agreed upon suite of priorities The Strategy
presented here was primarily driven by known and established regulatory timeframes and
compliance endpoints Meeting these endpoints using the more cost effective approaches was
also given priority After this consideration was given to other known and important
approaches that stakeholders and the County have an interest in pursuing Specifically the
following compliance dates and objectives were conSidered in developing the Strategy over the
long-term (Table 41)
Table 41 Compliance Targets for Countywide Coordinated Implementation Strategy
Target Date
2015
2017
2020
Compliance Target
Meeting 20 impervious cover treatment requirement
within the MS4 Permit cycle
Meet the interim dates and targets for the Chesapeake
Bay TMDL which include specific regulated urban area
reductions by 2017 for nutrients and sediment (based
on Maryland Department of the Environments
Watershed Implementation Plan)
Meet the full compliance and targets for the
Chesapeake BayTIVIDL which include specific regulated
urban area reduction by 2020 for nutrients and
sediment (based on Maryland Department of the
Environments Watershed Implementation Plan)
Metric
~4300 acres of
Impervious Cover
9 12 and 20
respectively for TN TP
and TSS reductions
from baseline
conditions
18 34 and 37
respectively for TN TP
and TSS reductions
from baseline
conditions
2025
2030
Meet additional impervious cover treatment targets
associated with next MS4 Permit cycle (assumes
another 20 target)
Meet additional impervious cover treatment targets
associated with next MS4 Permit cycle (assumes
another 20 target)
Out year compliance with other watershed TMDLs
~3400 acres of
Impervious Cover (20
of impervious
remaining after 2015)
~2750 acres of
Impervious Cover (20
of impervious
remaining after 2020)
100 compliance with
MS4 Permit Area WLAs
021611
Montgomery County Coordinated Implementation Strategy - DRAFT
To meet the compliance targets outlined in Table 41 the following priorities were generally
followed
bull 100 implementation of completed high and low priority County projects in first five
years (by 2015)
bull Greater ESD focus in urban (as opposed to suburban and rural) watersheds initially Goal
for ESD in these watersheds on pUblic property in first five years is 10 and on private
property is 10 The level of implementation was largely driven by the 20 Countywide
impervious goal
bull 100 of Public Outreach Potential for all TIVIDl watersheds in first five years This was
pursued to address trash nutrient and bacteria loading which rely strongly on effective
outreach programs to modify behaviors
bull Generally limited strategies to the top four most cost effective per watershed
bull Habitat restoration (stream restoration and buffer reforestation) not pursued as priority
until after first five year period These programs emphasize greater pollutant reduction
efficiency rather than impervious cover treatment which is the primary focus for the
first permit cycle
The Strategy was informed by the individual watershed implementation plans for seven
watersheds which included the Clopper lake and Patuxent subwatersheds Therefore in order
to develop countywide estimates for pollutant load reduction (as is required by the Chesapeake
Bay TMDl) watershed area weighting was applied The process for developing the Countywide
strategy and individual watershed implementation plans was woven together Once the
restoration potential was determined from the individual plans the strategy and schedule was
compiled using the restoration potentials and the drivers listed above The final restoration
cost and schedule was then placed in the implementation plans
It is also worth noting that the high and low priority projects along with the other potential
projects strategies represent a static or fixed number of projects that have been identified by
the County For this analysiS this list of practices is not replenished and therefore once all
opportunities have been implemented other strategies are pursued In reality the County will
continue to develop and update its list of specific project opportunities and have these
available for implementation in future years
The output from this effort is presented in a series of tables ordered by target date in Appendix
D In addition Table 42 provides an overall summary of pollutant load reduction tracking
versus time Through inspection of Table 42 it can be seen that the Strategy meets the
021611
Montgomery County Coordinated Implementation Strategy - DRAFT
impervious cover treatment targets under the current MS4 permit (as well as projected targets
for 2020 and 2025 assuming a continued 20 treatment requirement) interim and final
Chesapeake Bay nutrient and sediment reduction targets by 2017 and 2020 respectively and
out year MS4 permit area WLA compliance for the majority of pollutants Exceptions include
meeting the bacteria WLA load reductions required for the Anacostia and Rock Creek
021611
Montgomery County Coordinated Implementation Strategy - DRAFT
Table 42 Projection by Phase for Watersheds and Pollutants PermitTMDL Targets
Watershed Fiscal Year 2015 2017 2020 2025 2030 2017 2020
Impervious Treated (acres) 1421 2393 3364 4272 4544
ESD ( Impervious) 26 44 61 69A 71
Cost (Million $) 160 307 486 732 820
E5D( Cost) 45 62 71 78 78
Anacostia Nitrogen 25 39 68 89A l00A 818 82
Phosphorus 27 42 77 100 100 812 81
i Sediment 47 72 100 l00A) l00A 875 88
Bacteria 21 33 46 59A 64 879 88
Trash 41 65 89 l00A) 100
Impervious Treated (acres) 1541 1961 2381 3625 3989
ESD ( Impervious) 17 28 36 57A 61
Cost (Million $) 87 172 262 566 658
ESD ( Cost) 7(JA 79 79A 89A 9(JA
Rock Creek Nitrogen 24 30 38 55 61
Phosphorus 25 3(JA 38 54 GfJA)
Sediment 38 50 92 l00A 100
Bacteria 21 27 33 5(JA 55 96(JA 96
Trash 17 24 31 5(JA) 55
Impervious Treated (acres) 187 380 570 1018 1018
ESD ( Impervious) 52 72 78 87A 87A
Cost (Million $) 23 65 114 215 219
ESD ( Cost) 92 91 86 90 88
Cabin John Nitrogen 21 27A 39A 55 58 Phosphorus 2(JA 26 35 49 51
Sediment 6 17 GfJA 91 100
Bacteria 16 22 27 4(JA) 40 31 31
Trash 6 12 19 34 34
Impervious Treated (acres) 237 237 237 237 237
ESD ( Impervious) 4 4 4 4 4
Cost (Million $) 6 8 19 25 31
ESD ( Cost) 32 27A 11 8 7
Muddy Watts Nitrogen 6 7 15 18 22
Phosphorus 6 7 10 12 13 Sediment 7 8 14 17 2(JA
Bacteria 0 (JA 0 (JA 0 i Trash 6 6 6 6 6
bull Impervious Treated (acres) 901 921 941 941 941 ESD ( Impervious) 2 2 2 2 2
Cost (Million $) 26 48 SO 51 52 ESD ( Cost) 15 8 8 8 8
Great Seneca Nitrogen 24 41 43 44 45
Phosphorus 24 32 34 34 34
i Sediment 26 41 43 44 44
I Bacteria (JA) 0 0 0 (JA
Trash 31 32 33 33 33
021611
Montgomery County Coordinated Implementation Strategy - DRAFT
Pe rmitTMDL Targets
Watershed Fiscal Year 2015 2017 2020 2025 2030 2017 2020
Clopper
Impervious Treated (acres) 0 6 12 22 22
ESD ( Impervious) 0 86 86 92 92
Cost (Million $) 0 0 1 2 2
ESD ( Cost) 0 72 73 84 84
Nitrogen 61 67 72 79 79
Phosphorus 30 36 41 48 48 45 45
Sediment 0 5 10 17 17
Bacteria 0 0 0 0 0
Trash 0 6 11 18 18
Lower Monocacy
Impervious Treated (acres) 1 16 32 58 58
ESD ( Impervious) 100 85 84 91 91
Cost (Million $) 0 4 11 18 20
ESD ( Cost) 100 85 54 63 58
Nitrogen 0 5 14 22 24
Phosphorus 0 5 16 26 28
Sediment 0 5 46 61 69 608 61
Bacteria 0 6 12 19 19
Trash 0 0 0 0 0
Rocky Gorge
Impervious Treated (acres) 11 88 165 307 307
ESD ( Impervious) 64 89 90 95 95
Cost (Million $) 3 17 40 70 75
ESD ( Cost) 55 82 64 73 68
Nitrogen 47 55 6710 82 85
Phosphorus 17 25 36 52 53 15 15
Sediment 10 19 45 7(J1o 79
Bacteria 14 23 32 47 47
Trash 15 30 46 68 68
Triadelphia
Impervious Treated (acres) 3 12 20 38 38
ESD ( Impervious) 100 98 97 99 99
Cost (Million $) 1 3 5 9 9
ESD ( Cost) 99 98 98 99 99
Nitrogen 24 27 29 34 34
Phosphorus 4 7 9 14 14 15 15
Sediment 1 4 6 12 12
Bacteria 1 4 6 12 12
Trash 2 6 11 21 21
Countywide
Impervious Treated (acres) 4302 6014 7722 10518 11154 6008 7723
ESD ( Impervious) 18 34 47 6(J1o 63
Cost (Million $) 305 622 987 1687 1884
ESD ( Cost) 53 66 7(J1o 8(J1o 80
Nitrogen 18 25 36 46 51 9 2(J1o
Phosphorus 17 23 34 44 46 12 34
Sediment 23 34 54 6(J1o 62 20 37
Bacteria 11 15 20 28 30
Trash 18 26 33 41 42
Assumptio~s
1 Does no~ includerepeated Outreach and Education costs beyond FY2015
2 Does not include ~n inflation multiplier
021611
Montgomery County Coordinated Implementation Strategy - DRAFT
Summary of Individual Implementation Plans
A summary of the general considerations and prioritization for each watershed implementation
plan is provided below
Anacostia - For the first permit cycle (through 2015) a priority was placed on full
implementation of completed high and low priority projects Next implementation of a third
of the other potential projects was targeted as a large number of these were identified in
conjunction with the USACEs Anacostia Watershed Restoration Plan efforts ESD was
emphasized on both public (10) and private property (10) Finally outreach (25) and
stream restoration (12) are targeted for pollutant load reduction but are not credited towards
impervious cover credit In future permit cycles the remainder of the other potential projects
are targeted along with ESD and a limited amount of riparian reforestation for impervious cover
and pollutant load reduction Outreach and stream restoration are significant strategies
pursued for load reduction benefits Nutrient and sediment MS4 permit area WLAs are met by
2030 but bacteria load reduction does not meet MS4 permit area WLA compliance The
remaining bacteria reduction is believed to be associated with urban wildlife sources Unless
intense urban wildlife management practices are implemented this remaining load reduction
will not be possible
Rock Creek- For the first permit cycle (through 2015) a priority was placed on full
implementation of complete high and low priority projects Next 25 implementation of
other potential projects was targeted ESD was emphasized on both public (10) and private
property (10) with private property implementation being linked to Rainscapes Program
success Finally outreach (100) and stream restoration (22) are targeted for pollutant load
reduction but are not credited towards impervious cover credit In future permit cycles the
remainder of the other potential projects are targeted along with ESD and riparian
reforestation for impervious cover and pollutant load reduction Stream restoration is a
significant strategy pursued for load reduction benefits The bacterial load reduction does not
meet MS4 permit area WLA compliance However the remaining bacterial load is believed to
be associated with urban wildlife sources Unless intense urban wildlife management practices
are implemented this remaining load reduction will not be possible
Cabin John Creek - Similar to the other two more urban watersheds in the County during the
first permit cycle (through 2015) a priority was placed on full implementation of complete high
and low priority projects Fewer opportunities exist overall compared to the Anacostia and Rock
Creek Next 25 implementation of other potential projects was targeted ESD was
emphasized on both public (10) and private property (10) Finally outreach (100) was
021611
Montgomery County Coordinated Implementation Strategy - DRAFT
targeted for pollutant load reduction but not credited towards impervious cover credit No
riparian reforestation or stream restoration was targeted due to limited or no opportunities In
future permit cycles the remainder of the other potential projects are targeted along with ESD
and some riparian reforestation for impervious cover and pollutant load reduction The
bacteria load reduction meets MS4 permit area WLA compliance by 2025
Muddy BranchWatts Branch - During the first permit cycle (through 2015) a priority was
placed on full implementation of complete high and low priority projects Fewer opportunities
exist overall compared to the Anacostia and Rock Creek Watersheds No other strategies were
pursued as there are no existing TMDLs in the Muddy BranchWatts Branch subwatersheds In
future permit cycles previously identified stream restoration projects are implemented for
pollutant load reduction
Great Seneca Creek - This watershed implementation plan is unique in that it includes the small
Clopper Lake subwatershed which has a TMDL for phosphorus Even with the TMDL there are
limited identified opportunities to pursue in the Clopper Lake subwatershed in part due to the
limited area of the subwatershed within the County MS4 permit area During the first permit
cycle (through 2015) a priority was placed on full implementation of complete high and low
priority projects within Great Seneca Creek subwatershed No opportunities exist for these
strategies in Clopper Lake However full outreach was applied in Clopper Lake in the first
permit cycle In future years other potential projects ESD on public and private property and a
small amount of riparian reforestation (in Clopper Lake) is pursued The Clopper Lake WLA for
phosphorus within the MS4 permit area is met
Patuxent - During the first permit cycle through 2015 a priority was placed on full
implementation of complete high and low priority projects Far fewer opportunities exist
overall compared to the Anacostia and Rock Creek A limited amount of ESD on private land
and stream restoration was pursued Finally outreach (100) was targeted for pollutant load
reduction (primarily nutrients) but not credited towards impervious cover credit No riparian
reforestation was targeted within the MS4 Permit area due to cost effectiveness in the Rocky
Gorge subwatershed and limited opportunities in the Triadelphia subwatershed In future
permit cycles ESD on private and public land is pursued more substantially as is stream
restoration A limited amount of riparian reforestation achieves some impervious cover and
pollutant load reduction The Rocky Gorge phosphorus WLA within the MS4 permit area is met
easily and the Tridelphia phosphorus WLA is also met but with a longer timeframe needed for
compliance
021611
Montgomery County Coordinated Implementation Strategy - DRAFT
Lower Monocacy Creek -lower Monocacy Creek is the most rural watershed in the County and
has the least amount of area subject to the County MS4 permit In addition there are no preshy
identified restoration projects within the watershed Therefore during the first permit cycle
(through 2015) only a very small amount (5) of private property ESD is pursued It is not until
the second permit cycle that more focus is placed on private and public ESD as well as stream
restoration and programmatic strategies such as street sweeping to target sediment loads
associated with the TM Dl In future permit cycles stream restoration is pursued for pollutant
load reduction The sediment WlA within the MS4 permit area is projected to be met around
2025
Countywide - The Countywide effort was driven by impervious cover treatment targets and
Chesapeake Bay TMDl2017 and 2020 reduction targets associated with sediment and nutrients
for urban MS4s For impervious cover it was assumed that a 20 target would be required for
each five-year permit cycle The Bay TMDl targets for urban MS4 areas were easily met for all
pollutants in 2017 and easily met for nitrogen and sediment but more difficult to meet for
phosphorus in 2020
Public Outreach and Stewardship
The County recognizes and is committed to the increasingly important role that public outreach
and stewardship will play if improved water quality conditions are going to be achieved
countywide While the County currently has a very active and layered outreach program the
model requires changes that will result in broader stakeholder groups serving as the leaders
and primary champions for clean water in their communities This includes greater participation
from minority and faith-based groups business consortiums schools neighborhood
associations and civic groups Additionally the new model requires revisiting current
initiatives carried out by the various County agencies to look for better and more efficient ways
to communicate messages cross-train and create synergies that result in greater engagement
greater awareness and sustained changes in behavior
Within each implementation plan specific suggestions for outreach and education
opportunities are identified In addition Appendix E of this Strategy contains practice sheets
which highlight targeted restoration activities for the County to develop and refine A total of
eight practices have been identified that can be adopted countywide or in more targeted
watershed areas where there are specific water quality issues to address Many of the
practices build upon existing County programs but require a much broader reach to new
partner groups Program start up costs are suggested and were used to for cost estimates
associated with Countywide strategy The highlighted practices include
021611
Montgomery County Coordinated Implementation Strategy - DRAFT
bull Pet Waste Pickup Education and Outreach Campaign
bull Lawn Stewardship Education and Outreach Campaign
bull Anti-littering Education and Outreach Campaign
bull Innovative Stormwater Management Awareness Campaign
bull Stream Stewards Education and Outreach Campaign
bull Riparian Reforestation Education and Outreach Campaign
bull Roof Runoff Reduction Education and Outreach Campaign
bull Parking Lot Recharge Value Education and Outreach Campaign
Start up costs by practice along with an overall five year cost estimate are provided in Table
43 Start up timeframes are assumed to be up to 18 months
Table 43 Outreach Start Up and 5-Year Cost Projections
Practice Practice Start Up Cost
Pet Waste Pickup $240500
Lawn Stewardship $301 600
Anti-Littering $175050
Stormwater Management Improvements Awareness $50450
Stream Stewards $74825
Riparian Reforestation $30575
Roof Runoff Reduction $101400
Parking Lot Recharge Value $41500
Estimated Start Up Total $744900
5-Year Outreach Budget Projection $2650000
These eight practice sheets provide specific costs and timelines for implementation They also
provide suggestions for measuring program success These practice sheets along with the
specific recommendations in the implementation plans make up the Public Outreach and
Education Campaign
Trash Reduction
Most of the implementation plans have to address trash loadings to meet requirements of the
Potomac Trash Treaty that is referenced in the County1s MS4 Permit In addition the Anacostia
Trash TMDL has recently been accepted by MDE and the EPA According to the Anacostia
021611
Montgomery County Coordinated Implementation Strategy - DRAFT
TMDl there is reasonable assurance that the goals of the Treaty and TMDl can be met with
proper watershed planning implementing pollution-reduction BMPs and using strong political
and financial mechanisms
Currently the County has a number of activities which target trash reduction They include the
following
bull Adopt-a-Road Program through DOT which focuses on public awareness and involvement in trash management There are 205 participants who adopted road segments and agreed to six major road cleanups per year
bull Storm Drain Marking through DOT bull Support for illegal dumping enforcement outreach and research and monitoring bull Partnership with DOT to conduct street sweeping covering about 2500 curb miles and
occurring once a year
bull Partnership with the Park Police to monitor illegal dumping which combined enforces 300-400 actions a year
bull Non-residential and residential recycling programs through Solid Waste Services (SWS) bull Transit stop trash management program at 600 bus stops countywide supported by DOT
Transit Services
In addition to continuing these efforts a number of trash good-housekeeping efforts have been
proposed as part of this Strategy A detailed description of the quantitative methods and
strategies applied can be found in Appendix E of the Guidance Document In general the
following six trash-reduction strategies are recommended
1 Significantly increase funding for trash reduction programs 2 Create and enhance regional partnerships and coordination among businesses
environmental groups individual citizens and government at all levels and in all jurisdictions
3 Improve peoples awareness knowledge and behavior relating to littering and illegal dumping
4 Promote the greater introduction and use of effective trash-reduction technologies and approaches
5 Improve enactment and enforcement of laws to reduce trash 6 Increase trash monitoring-related data collection generation and dissemination efforts
The Anacostia watershed implementation plan provides an outline of the actions that will be
taken through the first permit cycle to reduce trash The range of programs and practices
specially aimed at reducing trash inputs to roads and streams that will be targeted include
reduce reuse and recycle campaigns littering and illegal dumping enforcement stream
cleanups and street sweeping These measures are in addition to any trash trapped and
021611
Montgomery County Coordinated Implementation Strategy - DRAFT
removed by structural practices which are computed using the WTM The plan shows that the
trash TMDl can be met by 2025 at a cost of 732 million dollars
Adaptive Management Monitoring and Reporting
Sound implementation strategies require assessment and effective adaptation to respond to
new information changing conditions new technologies and lessons learned This will be the
basis of the plan that will be used when benchmarks are not met and the projected funding is
inadequate
Adaptive management requires monitoring of a variety of measures that can be used to
determine whether progress is being made towards meeting the Countywide water quality
objectives Ultimately it is the instream water quality and the loading limits with respect to the
TMDls that determine the success of implementation however there are many interim
measures that can also be correlated to success which are worthwhile pursuing
Surface water monitoring can be an expensive and time consuming undertaking Montgomery
County is fortunate to have an extensive Countywide stream monitoring network that can serve
as a foundation for providing spatial and temporal data to indicate stream health The Countys
MS4 Permit also outlines the required assessment of controls which includes chemical
biological and physical monitoring Specifically the permit calls for the County to continue
their watershed restoration monitoring of the lower Paint Branch subwatershed and physical
monitoring ofthe Clarksburg Special Protection area In addition to the existing monitoring
network the County will continue tracking and data reporting associated with levels of
implementation (eg acres of impervious cover treated areas of buffer planted miles of
stream restored miles of streets swept) For measuring effectiveness of outreach and
stewardship efforts other types of monitoring and reporting are planned that include before
and after attitude surveys frequency of website visits and information requests
For many restoration strategies it may be difficult to tease out their individual effectiveness in
terms of pollutant load reductions but collectively the monitoring that occurs should provide
adequate insight into the overall effectiveness of a layered implementation strategy
In addition to the monitoring and assessment the County will be reporting results on an annual
basis as part of their NPDES MS4 Permit annual report The MS4 Permit requires annual
reporting of the following
021611
Montgomery County Coordinated Implementation Strategy - DRAFT
bull The status of implementing the components of the stormwater management program
that are established as permit conditions
bull A narrative summary describing the results and analyses of data including monitoring
data that is accumulated throughout the reporting year
bull Expenditures for the reporting period and the proposed budget for the upcoming year
bull A summary describing the number and nature of enforcement actions inspections and
public education programs
bull The identification of water quality improvements and documentation of progress
toward meeting applicable WLAs developed under EPA approved TMDLs and
bull The identification of any proposed changes to the Countys program when WLAs are not
being met
The County will build upon annual reporting that has historically occurred to meet permit
requirements and will supplement this reporting with tracking table summaries that quantify
implementation activities for the range of strategies pursued during that year and the
associated treatment (eg impervious cover treated pollutant load reduced education and
outreach partners established etc) Cost will also be tracked in association with rates of
implementation This level of performance will then be compared with countywide strategy
targets (eg progress towards meeting WLAs) associated with key performance dates such as
those presented in Table 41 The level of progress achieved by the County will then feed into
the adaptive management approach described above
Organization Needs to Implement Strategy
Montgomery County DEP staff possesses substantial expertise and institutional knowledge that
yields many positive outcomes and efficient processes under the current pace of restoration
and permit compliance activities Under this strategy however the pace of implementation is
required to significantly increase Based on an increase in the level of implementation it is
reasonable to assume that additional capacity may be needed to provide sufficient oversight
and management of all the projects
Another critical element of this strategy is the recognition and commitment to pursuing
outreach initiatives that build community capacity by targeting new partner groups that
provide the necessary leadership oversight and sustained effort to change behaviors and
foster stewardship The County currently carries out many well established and managed
outreach programs but it may require additional focus across County agencies and
departments for these partnerships to become established and thrive
021611 G
Montgomery County Coordinated Implementation Strategy - DRAFT
Through the implementation process and the monitoring and reporting that is required large
amounts of data will be generated Technological advances happen so rapidly in this day and
age it will be important for the County to stay current with technology and methods so that
more efficient and cost-effective data management and reporting will be possible The County
currently relies on a detailed and sophisticated GIS to spatially locate projects and manage
tables of data related to projects The growth and development of this spatial database will be
a critical component of the reporting and tracking capability of the County These databases
generate the input data that are used to measure progress towards baseline loading targets
Regular review and upkeep of the data as well as routine summarization of progress (annually
at a minimum) will likely require additional dedication of staff This is especially the case during
periods where the implementation rate of structural practices in the ground is accelerated
021611
Montgomery County Coordinated Implementation Strategy - DRAFT
Appendix C - Restoration Potential by Watershed
021611
c-
04 03 02 01
a
_ Nitrogen Load Reduction
--shy TMDL WLA Target
_Cost
MONTGOMERY COUNTY URBAN WATERSHEDS POLLUTANTS _Bk)~Ibilats ~1~ l~ fjfsi --
Rank
1
2
3
4
5
6
7
8
9
10
11
Restoration Strategy TN reduction
Ibsyr
Pet Waste Education 15169
Retrofit of Underperforming BMPs 1769
Stream Restoration 72423
Completed Projects ~43 High Priority Projects 3260
Other Potential Projects 43276
Habitat Restoration 224
Public Property ESD Retrofits 18270
Priority Neighborhoods ESD Retrofits 9271
Private Non-residential ESD Retrofits 5594
Street Sweeping -
Incremental Cost Unit Cost
Million $ IbsMillion $ 088 17193
120 1475
9304 778
948 701
635 513
25430 170
141 158
23655 77
13278 70
8018 70
124 -
Qj c
Qj
nI CXI
o -f-
1 09 08 07 06 05
$900 $800 $700
~ $600 c $500 ~ $400 $300 0 u $200 $100
$shy
~~mf il_~IJrt~
MONTGOMERY COUNTY URBAN WATERSHEDS POLLUTANTS ItfiQ14lbilJts i~5 [i
1 $900 Qj
09 $8005 iii en 08 $700
~co 07 $600 co - til
06 $500 ~ 05- $400 ~ 04 en$300 003 u $20002
en $100I 01 o 0 $shys Q en o
s Q
Phosphorus Load Reduction
--- TMDL WLA Target
__Cost
I Rank I
1
2
3
4
5
6
7
8
9
Restoration Strategy
Pet Waste Education
Retrofit of Underperforming BMPs
Stream Restoration
Completed Projects
High Priority Projects
Habitat Restoration
Other Potential Projects
Public Property ESD Retrofits
Priority Neighborhoods ESD Retrofits
10 I Private Non-residential ESD Retrofits
11 Street Sweeping
TP reduction Incremental Cost Unit Cost
Ibsyr Million $ IbsMillion $ 1979 088 2243
247 120 206
13097 9304 141
915 948 96
451 635 71
37 141 26
6067 25430 24
2546 23655 11
1294 13278 10
781 8018 10
- 124 -
MONTGOMERY COUNTY URBAN WATERSHEDS POLLUTANTS IItQjQhabillt$middot
Cii 5 Cii 11 It CD
6 ~ r o ~ s
0 ltIIa r ltII e c ltII III
1 09 08 07 06 05 04 03 02 01
0
$900
$800 $700
v$600 r
0 $500 == $400 $300 11
0 u $200 $100
$shy
_ Sediment load Reduction
--- TMDl WlA Target
__Cost
Rank Restoration Strategy
Sediment reduction
Incremental Cost
Unit Cost
tonsyr Million $ tonsMillion $ 1 Street Sweeping 800 124 645
2 Stream Restoration 25057 9304 269
3 Retrofit of Underperforming BMPs 25 120 21
4 Completed Projects 97 948 10
5 High Priority Projects 47 635 7
6 Other Potential Projects 660 25430 3
7 I Public Property ESD Retrofits 272 23655 1
8 Priority Neighborhoods ESD Retrofits 139 13278 1
9 Private Non-residential ESD Retrofits 84 8018 1
10 Habitat Restoration 2 141 1
11 Pet Waste Education - 088 -
C-3
MONTGOMERY COUNTY URBAN WATERSHEDS POLLUTANTS
-QI5 5i ~
1 09 08 07 06 05 04 03 02 01
0
$900
$800
$700
$600 ~ 0
$500 == $400 $300 11
0 u $200
$100
$shy
--shy TMDL WLA Target
___ Cost
Rank Restoration Strategy
Enterrococci reduction
Incremental Cost
Unit Cost
Billion MPNyr Million $ Billion MPN Million $
1 Pet Waste Education 19643 088 22263
2 Retrofit of Underperforming BMPs 2781 120 2318
3 Completed Projects 10441 948 1101
4 High Priority Projects 5120 635 806
5 Other Potential Projects 69895 25430 275
6 Riparian Reforestation 310 141 219
7 Public Property ESD Retrofits 29025 23655 123
8 Priority Neighborhoods ESD Retrofits 14777 13278 111
9 Private Non-residential ESD Retrofits 8917 8018 111
10 Stream Restoration - 9304 -
11 Street Sweeping - 124 I -
~ I~~~i MONTGOMERY COUNTY URBAN WATERSHEDS POLLUTANTS 1tI2~mL ~ I~I
~$ I -~-- I
100 90 80 70 60 50 40 30 20 10
0
$900 $800 $700 $600 $500 $400 $300 $200 $100 $shy
vi c
~ 5 11 0 u
Implementation Phase
Potential Trash Incremental Unit Cost
I
Rank Restoration Strategy Reduction Cost
Ibsyear Million $ IbsMillion $ 1 Recycling Education and Investigations 51654 02 238837
2 Plastic Bag Ban and Misc Enforcement 63546 13 48882
3 Anti-litter Campaign Education 23J61 09 26930
4 Retrofit of Underperforming BMPs 1144 12 954
5 Completed Projects 6598 95 696
6 High Priority Projects 2786 64 439
7 Other Potential Projects 56341 2543 222
8 Habitat Restoration 266 14 188
9 Street Sweeping 204 12 164
10 Public Property ESD Retrofits 25348 2366 107
11 Priority lIeighborhoods ESD Retrofits 12529 1328 94
12 Private Non-residential ESD Retrofits 7547 802 94 ru Stream Restoration - 930 -14 Pet Waste Education - 09 -
C-5
MONTGOMERY COUNTY URBAN WATERSHEDS POLLUTANTS
CABIN JOHN
1 250
__CostImplementation Phase
09 08 07 06 05 04 03 02 01
0
200 ~ c
150 g E
100 - ltII 0 u
50
0
_E Coli
- - - Waste Load Allocation
Rank Restoration Strategy
E coli reduction
Incremental Cost
Unit Cost
Billion
MPNyr Million $
Billion MPN
Million $ 1 Pet Waste Education 4388 $05 9436
2 Underperforming BMP Retrofits 1892 $19 1022
3 High Priority Projects 1289 $16 800
4 Riparian Reforestation 1133 $78 146
5 Other Potential Projects 148 $17 86
6 Public Property ESD Retrofits 4AOO $860 Sl 7 Private Non-residential ESD Retrofits 1618 $392 41
8 Priority Neighborhoods ESD Retrofits 2633 $638 41
9 Completed Projects 112 $00 0
C-6
MONTGOMERY COUNTY URBAN WATERSHEDS POLLUTANTS 1Itf~~Jabitm
ROCK CREEK
1 $700 Qj5 09
o
_
$600 Qj 08
111 $500 ~ampl 07 c
t5 06 $400 ~ e 05 ~ $3005 04 - 111tl 03 $200 0 u-6 02
$100J 01 $-
Enterrococci
- - - Waste load Allocation Implementation Phase
__Cost
Rank Restoration Strategy
Enterrococci reduction
Incremental Cost
Unit Cost
Billion MPNyr Million $ Billion MPN Million $
Et Pet Waste Management 35734 118 30190
Underperforming BMP Upgrades
Other Potential Projects
28800
30239
577
1083
4995
2792
4 Completed Projects 12131 444 2734
5 High Priority Projects 14239 890 1600
6 Riparian Reforestation 18999 2384 797
7 County Property ESD Retrofits 54519 24136 226
8 Private Residential ESD Retrofits 35230 17737 199
9 Private Non-residential ESD Retrofits 32A86 16380 198
C-7
MONTGOMERY COUNTY URBAN WATERSHEDS POLLUTANTS _f~~pabitafS (fi~r ~~ l-middotshy
ROCK CREEK
100 $900 90 $800 80 $700 u70 $600 c 60 2$50050 -~$40040
lt1$300 030 $200 u
20 10 $100
0 $shy
Implementation Phase
Rank Restoration Strategy Trash Reduction
Incremental Cost
Unit Cost I
Ibsyear Million $ IbsMillion $ 1 Other Potential Projects 16038 1085 1478
2 Underperforming BMP Upgrades 6756 577 1172
3 Completed Projects 4217 444 950
4 High Priority Projects 6366 890 715
5 Riparian Reforestation 9237 2384 387
6 Public Property ESD Retrofits 24587 24136 102
7 Priority Neighborhoods ESD Retrofits 16155 17737 91
8 Private Non-residential ESD Retrofits 14793 16380 90
9 Pet Waste Education - 118 -
(-8
MONTGOMERY COUNTY RURAL WATERSHEDS POLLUTANTS
SENECA - CLOPPER LAKE -
100 Qi
90 iii 80VI to -CQ 70 0 60e 50I 0 40 u l 30
C QJ 20ex
C 10to 0
J 0
$18
$16
$14 n
$12 I
$10 sect $08 ~ $06 0
VI
U $04
$02
$shy
_TPRemoval - - - TMDL Reduction Target
Implementation Phase ___Cost
Rank Restoration Strategy TP
Reduction (Ibsyr)
Incremental Cost (Million $)
Unit Cost (IbsvrMillion $)
1 Residential Education 33 001 6246
2 Underperforming BMP Retrofits 13 004 341 3 Riparian Buffer Reforestation 19 023 99 4 Priority Neighborhood ESD Retrofits 15 051 35 5 Public Property ESD Retrofits 7 075 99
C-9
-pj[fti
MONTGOMERY COUNTY URBAN WATERSHEDS POLLUTANTS 1It[~~JIlbitIL f bull~
LOWER MONOCACY
1 09 08 07 06 05 04 03 02 01
0
Implementation Phase
25
20 ~ c
15 ~ ~
10 - 0 u
5
0
_TSS
- - - Waste load Allocation _Cost
Rank Restoration Strategy
Sediment reduction
Incremental
Cost Unit Cost
tonsyear Million $ tonMilli
1 Street Sweeping 22 $007 3121
2 Underperforming BMP Retrofits 4 $010 389
3 Stream Restoration 37 $734 51
4 Riparian Buffer Reforestation 3 $109 25
5 Other Structural BMPs and ESD Strategies 10 $851 12
6 Priority Neighborhoods ESD Retrofits 2 $160 10
7 Non-residential ESD Retrofits 1 $132 10
C-10
MONTGOMERY COUNTY RURAL WATERSHEDS POLLUTANTS 1tlj~lIbiIalSlt~~II
1 09 08 07 06 05 04 03 02 01
0
$70
$60
$50 ~ c
$40 ~ ~ $30 - UI
$20 0 v
$10
$0
_ Phosphorus Load Reduction
- - - Waste Load Allocation ___ CostImplementation Phase
Rank Restoration Strategy TP Incremental Cost
Million $ Unit Cost
Ibsyr Ibs Million $ 1 Lawn Care Education 3670 01 37394
2 Underperforming BMP Retrofits 3499 08 4338
3 Other Potential Projects 3524 33 1076
4 High Priority Projects 252 04 685
5 Riparian Reforestation 762 26 298
6 Public Property Retrofits 5854 345 169
7 Priority Neighborhoods ESD Retrofits 796 65 123
8 Private Non-residential ESD Retrofits 1941 168 116
9 Completed Projects 53 00 00
c- 11
MONTGOMERY COUNTY RURAL WATERSHEDS POLLUTANTSal12hdJilats ~I~ ~ [ -
1 10 ii 5 09 9 1 08 8 II al- 07 7 1ii o 06 6
c
~ ~ 1 o E IV
05 04 03
5 4
3
~ 11 0 u
0 11 02 2 J o 01 1
t a 0 0 11 o
t 0
_ Phosphorus Reduction
- - - Waste Load Allocation
-Cost
Rank Restoration Strategy TP Incremental Cost
Million $ Unit Cost
Ibsyr Ibs Million $ 1 Lawn Care Education 3670 01 37394
2 Underperforming BMP Retrofits 3499 08 4338
3 Other Potential Projects 3524 33 1076
4 High Priority Projects 252 04 685
5 Riparian Reforestation 762 26 298
6 Public Property Retrofits 5854 345 169
7 Priority Neighborhoods ESD Retrofits 796 65 123
8 Private Non-residential ESD Retrofits 1941 168 116
9 Completed Projects 53 00 00
C-12
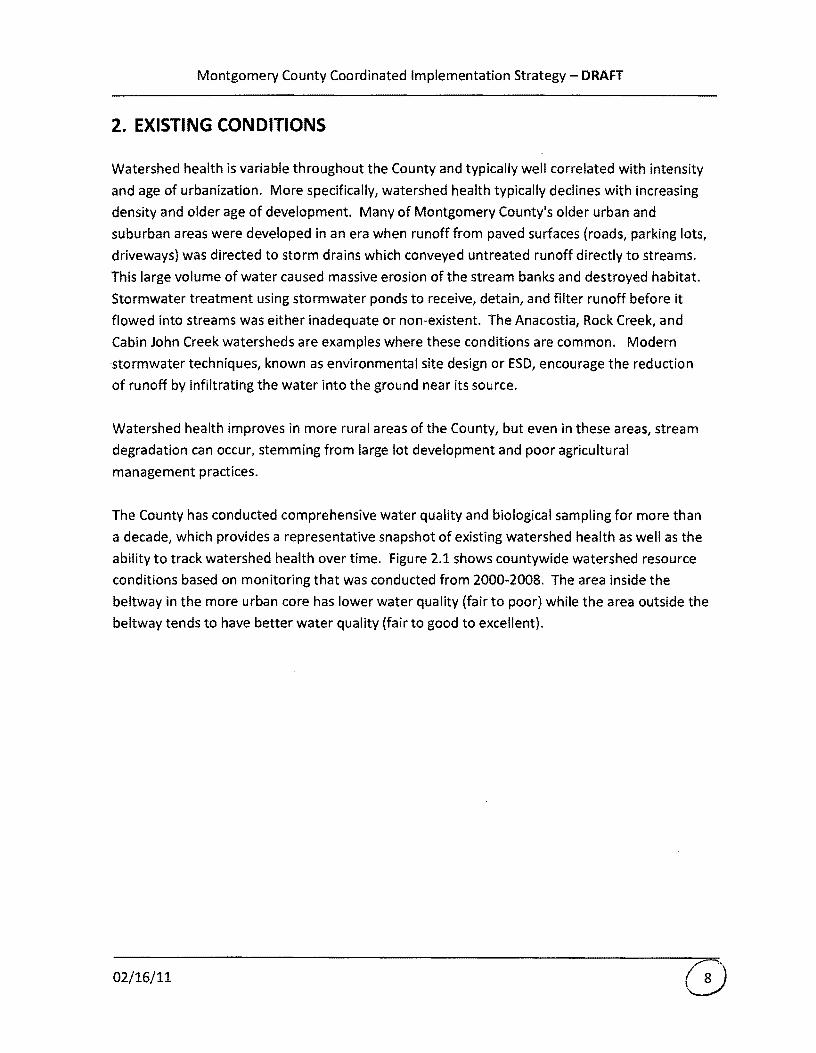
Montgomery County Coordinated Implementation Strategy - DRAFT
2 EXISTING CONDITIONS
Watershed health is variable throughout the County and typically well correlated with intensity
and age of urbanization More specifically watershed health typically declines with increasing
density and older age of development Many of Montgomery Countys older urban and
suburban areas were developed in an era when runoff from paved surfaces (roads parking lots
driveways) was directed to storm drains which conveyed untreated runoff directly to streams
This large volume of water caused massive erosion of the stream banks and destroyed habitat
Stormwater treatment using stormwater ponds to receive detain and filter runoff before it
flowed into streams was either inadequate or non-existent The Anacostia Rock Creek and
Cabin John Creek watersheds are examples where these conditions are common Modern
stormwater techniques known as environmental site design or ESD encourage the reduction
of runoff by infiltrating the water into the ground near its source
Watershed health improves in more rural areas of the County but even in these areas stream
degradation can occur stemming from large lot development and poor agricultural
management practices
The County has conducted comprehensive water quality and biological sampling for more than
a decade which provides a representative snapshot of existing watershed health as well as the
ability to track watershed health over time Figure 21 shows countywide watershed resource
conditions based on monitoring that was conducted from 2000-2008 The area inside the
beltway in the more urban core has lower water quality (fair to poor) while the area outside the
beltway tends to have better water quality (fair to good to excellent)
021611
---- -
-----
Montgomery County Coordinated Implementation Strategy - DRAFT
Watershed Resource Conditions Montgomery County Maryland
LEGEND z fbn
G 0middot1 - -~UlIS
- tI)Jogtf~
UJJOf Wrw Ftns
Splaquo1lII PnreltbOrI NtH SPAl
3D~~ennHI
[=jji=---~~-
Figure 21 County Watershed Resource Conditions
County Statistics
The Strategy will benefit from the fact that the majority of county residents own the property
they reside on (nearly 70) and thus have control over that property Also nearly 70 of the
residences are single unit homes Moreover the average household income is roughly $90000
making the likelihood of financial capability to install BMPs an appropriate assumption Both of
these statistics make advocacy of BMPs on residential properties an imperative for the Strategy
Montgomery Countys robust business economy was also considered in the Strategy
development Despite the current economic volatility Montgomery Countys business
community is still profitable and still maintaining and improving existing facilities Moreover
the construction of the inter-county-connector (ICC) through much of Montgomery County will
provide opportunities to install demonstration BMPs on newly developing properties for
replication throughout stakeholder groups Also the presence of communication industry
leaders (ie Discovery Channel) in the County creates unique stewardship education
partnership possibilities with businesses The Strategy will include these stakeholders
021611
Montgomery County Coordinated Implementation Strategy - DRAFT
involvement opportunities to best harness the power of Montgomery Countys healthy
business economy
The county includes a fairly even split of males and females The majority of residents nearly
50 fall between the ages of 25 and 55 Only 15 of the population is aged 60 and above In
addition the majority of Montgomery County residents indicate their preferred language as
English however Spanish translations of stakeholder involvement opportunities will be
required in select watersheds to accommodate the 13 of county residents that indicate their
preferred language as Spanish Other potential target groups for translation for stakeholder
involvement include the Asian community as 11 of the countys population is Asian (mostly
Korean and Vietnamese) Because of this the Strategy and implementation plans will take
multilingual requirements into consideration for signage and other educational tools as well
MS4 Permit Coverage
The Countys most recent NPDES MS4 stormwater permit only covers runoff from
developments within the County area The following areas are excluded from the Countys MS4
permit area shown in Figure 22
bull Cities of Gaithersburg Rockville and Takoma Park
bull Maryland National Capital Park and Planning Commission (MNCPPC) lands
bull Washington Sanitary Sewer Commission (WSSC) land
bull Federal and State government owned land and facilities
bull Rural zoning
021611 G
Montgomery County Coordinated Implementation Strategy - DRAFT
MS4 Permit Area Montgomery County Maryland
(-i Gaithersbur9 ~
M Ro ckville
TkD m Parilt -Jr MNC PPC Lnds
0 5 3
Feder 1 and SI PropertyM i KbnelefS
M 0 I 2 ~- Federal and Sta1e Roads
~ i s Rural Zon ing
Figure 22 Areas outside the Montgomery County MS4 Permit Area
Impervious Surfaces
As previously mentioned the Countys MS4 Permit requires treatment of an additional 20 of
impervious cover not currently receiving treatment to the MEP Table 21 presents a summary
of the countywide impervious cover totals along with breakdowns by major land cover type
These land covers will be the focus of much of the Countys targeted effort to treat the 20
target
021611
Montgomery County Coordinated Implementation Strategy - DRAFT
Table 2llmpervious Surface Summary
Description
Total County Area 324552 100
Total Area of 1m ervious Surface 35965 _ _-----shy 11
County Area Subject to Stormwater Permit (1) 138649 43
Imllervious Cover Subject to Stormwater Permit 2) ~==5119====18o2 == ==== Areas of Impervious Surface (3)
Road 13607 38
Building 13073 36
Parking 22
Sidewalk 1069 3
Recreation (4) 347 1 1 Exclusions include Certain zoning codes parklands forests municipalities with own stormwater management
programs state and federal properties and state and federal maintained roads 2 Percent of County Jurisdictional Area subject to the Stormwater Permit 3 Impervious area within each category within the total County area 4 Recreation imperviousness excludes swimming pools
Implementation Plan Guidance Document
The Implementation Plan Guidance Document (revised October 252010) provides a road map
for how the implementation plans were created The primary sections of the Guidance
Document and a short description of each are provided in Appendix A
The Guidance Document divides BMPs into five classes or codes shown below The Guidance
Document also provides a list of BMPs and which code they fall under which is provided in
Appendix B
Code 0 Pretreatment Practices
Code 1 Non-performing BMPs No runoff reduction and no long term pollutant removal
Code 2 Under-performing BMPs Limited runoff reduction and low pollutant removal
Code 3 Effective BMPs No runoff reduction but moderate to high pollutant removal
Code 4 ESO BMPs High runoff reduction and moderate to high pollutant removal
Impervious Cover Accounting and Tracking
Montgomery County has GIS data layers that contain all the stormwater BMPs in the County
and their drainage areas In order to determine the 20 target for impervious cover treatment
021611
Montgomery County Coordinated Implementation Strategy - DRAFT
to the MEP the County analyzed their existing impervious cover and their existing BMP
database to determine how much impervious cover is currently being treated to the MEP
Several methods were considered based on a determination of the MEP standard compared to
existing treatment methods According to MDE guidance to be considered MEP a BMP must
capture at least the Water Quality Volume (WQv) (the first inch of rainfall) or the CPv volume
(26 inches of rainfall) The final method used for determining which BMPs are MEP and the
amount of impervious surface not treated to the MEP was as follows
1 All BMPs that were installed after 2002 or are classified as Code 4 were considered MEP
2 An analysis of typical Code 3 stormwater ponds installed after 1986 was performed to
determine if this class of BMPs met the definition of IVIEP Based on that analysis Code
3 BMPs constructed after 1986 are considered MEP
3 All other classes of BMPs not specified above are not considered MEP and are eligible
for retrofit
Table 22 below shows the breakdown of the impervious acres treated by BMP codes and era
(shaded areas are BMP codes treated to the MEP)
Table 22 Acres of Impervious Cover Treated by BMP Code and Design Era
Design Era Post2002 1986-2002 Pre1986 Blank Total
CIJ tl 0 u Q
~ co
0 28 711 24 132 895
1 33 555 1391 367 2346
2 41 299 12 23 375
3 75 2482 1437 267 4261
4 20 459 482 40 1001
Totals 198 4506 3345 828 8877
IC Credit 100 Code 3amp 4 Code 4 Total Acres treated to
MEP 198 2942 482 40 3661
Assuming a total countywide impervious acreage of 25119 acres and an impervious acreage
treated to the MEP of 3661 as shown in Table 22 there are currently 21458 acres of
untreated impervious area Twenty percent of 21458 equates to 4292 acres of impervious
area that must be restored over the current permit cycle
021611
Montgomery County Coordinated Implementation Strategy - DRAFT
Pollutant Load Tracking
In addition to tracking impervious cover it is necessary to compute existing pollutant loads and
projected reductions in loads as a result of applying storm water controls and BMPs The Center
for Watershed Protections (CWP) Watershed Treatment Model (WTM) version 20 (CWP 2001)
was the tool selected to conduct this analysis and track load reductions across a range of
implementation strategies
The WTM uses a spreadsheet model to calculate annual pollutant loads and runoff volumes
The model also accounts for the benefits contributed by a full suite of stormwater treatment
practices and programs The first step in the model calculates existing pollutant loads by adding
primary and secondary source loads then subtracting reductions according to existing
management practices The second step applies future management practices by subtracting
these calculated reductions from the existing loads Appendix B of the Guidance Document
provides a detailed explanation of the assumptions and steps in the modeling process
For each watershed the WTM was run under existing conditions with existing BMPs to
determine a baseline pollutant load for targeted pollutants The baseline period for non-TMDL
parameters was based on 2002 Maryland Department of Planning land useland cover data
coupled with the Countys existing urban BMP database Pollutants targeted included bacteria
Total Phosphorus (TP) Total Nitrogen (TN) Total Suspended Solids (TSS) and Trash Next a
series of model runs was developed for analyzing the pollutant load reduction effect that
various restoration strategies would have based on assumed levels of implementation for the
various strategies Individual restoration strategies that were sequentially modeled included
the following
bull Completed and High Priority Projects - these include projects already completed or high
priority structural BMPs scheduled for retrofit in the FYll-FY16 Capital Improvements
Program (CIP)
bull Low Priority Projects - these includes FY11-FY16 CIP projects that for various reasons
are considered a lower priority
bull Other Potential Projects - these include other projects in existing inventories that were
not listed in the previous two categories For the Anacostia they include projects in
Anacostia Restoration Plan (ARP) prepared by the Army Corp of Engineers
bull Public ESD Retrofits - These include small scale ESD practices applied to County-owned
buildings streets and parking lots and rights of way Examples include rainwater
harvesting green roofs upland reforestation soil compost amendments rooftop
disconnection green street retrofits and converting drainage ditches to dry swales
021611
Montgomery County Coordinated Implementation Strategy - DRAFT
These are Code 4 structures This category also includes other structural BMP upgrades
to existing County BMPs which were designated as under-performing or nonshy
performing
bull Private ESD Retrofits - These projects include ESD on commercial property and
residential property and include green roofs rain gardens and permeable pavement
bull Riparian Reforestation - Focuses primarily on tree planting for riparian buffer
restoration
bull Stream Restoration - Includes the use of natural materials such as rocks logs and native
vegetation to reduce pressure on eroded banks prevent down-cutting of the
streambed and restore the natural meander patterns and slope profiles found in stable
reference streams
bull Programmatic Practices - This category deals with potential pollutant reduction that can
be attributed and quantified through MS4 stormwater pollution prevention
improvements and better housekeeping on County land and facilities Also includes any
pollutant reductions due to product substitution (eg nitrogen and phosphorus limits in
fertilizer) operational programs (eg recycling) and enforcement This category also
deals with reduced pollutants that can be attributed and quantified through MS4
stormwater education (eg lawn care) and outreach aimed at pollution prevention
better housekeeping and increased stewardship
The naming convention applied for the model runs was WTM 10 (ie baseline) WTM 20 (Le
completed and high priority low priority and other potential projects) WTM 30 (Le public
and private ESD) WTM 40 (ie riparian reforestation and stream restoration) and WTM 50
(ie programmatic) Model runs were developed sequentially to yield incremental increases in
load reduction by strategy In practice however strategies can be applied in combination and
out of sequence to achieve targeted outcomes and the most cost-effective solutions A
summary of the scenarios is provided in Table 23 below
021611
Montgomery County Coordinated Implementation Strategy - DRAFT
Table 23 Summary of Watershed Treatment Model (WTM) Scenarios
Implementation Phase Description
The WTM was run under existing conditions approach
WTM Baseline Conditions with the MDP year 2002 land useland cover data and
existing BMPs
WTM 20 Completed as of
2009j High Priorityj Low
Priority and Other Potential
Projects
The WTM was run with a series of future management
practices which were proposed projects from the
County inventory of restoration sites These practices
cover new ponds retrofits of existing BMPs and some
ESD practices from the proposed projects list
The Countys inventory for other project types that
include public properties eg libraries and parkingWTM 30 ESD Strategies and
lots public schools and open section roads available Other Structural BMPs
for ESD retrofits was reviewed as were areas for
private property ESD retrofits
This category includes any pollutant reduction or volume
reduction that can be attributed to specific stream
WTM 40 Habitat rehabilitation wetland restoration and or riparian
Restoration reforestation projects planned for construction in the
watershed for the permit cycle
WTM 50 MS4 Programmatic See description above
Practices
TMDL Calibration and Tracking
Where TMDLs existed for individual watersheds the WTM was run under existing conditions
with existing BMPs based on the year in which the data was collected for TMDL development
The baseline pollutant load was then compared and normalized to the MDE-determined
baseline MS4 load for the TMDL pollutant Any BMPs with approved dates after the year in
which the data was collected for TMDL development were not included in the baseline
calculation but rather were counted towards meeting the TMDL reduction target
Once the normalized model was established reductions achieved through programs and
practices were tracked using the WTM scenarios based on the percent load reduction from
baseline toward meeting the TMDL required WLA The normalized baseline and WLA target are
determined and specified in the relevant TMDL documents developed by M DE
021611
Montgomery County Coordinated Implementation Strategy - DRAFT
3 WATERSHED IMPLEMENTATION PLANS AND RESTORATION POTENTIAL
The watershed implementation plans and pre-assessments developed in conjunction with the
Strategy are driven by regulatory requirements facing each watershed Table 31 summarizes
the drivers by watershed
Table 31 Restoration Objectives -
W~tershedSubwater~hed - Trash
4 bull - I _ _ -
Patuxent
Anacostia
Rock Creek
Great Seneca
Cabin John Creek
lower Monocacy
Watts BranchMuddy Branch
Dry and little Seneca
lower Potomac Direct
Table 32 presents the more detailed and quantitative aspects of the TMDl requirements for
the MS4 portion within each watershed The Strategy has been developed to meet the MS4
permit area WLA compliance targets presented in Tables 32
In addition to the individual watershed requirements there is a Countywide requirement to
comply with the wasteload allocations associated with urban areas under the Chesapeake Bay
TMDl which applies to nutrients and sediment There is an interim target established for 2017
where reductions from baseline conditions of 9 12 and 20 respectively for TN TP and
TSS are to occur Then by 2020 full compliance is required which correspond to reductions
from baseline conditions of 18 34 and 37 respectively for TN TP and TSS
021611
Montgomery County Coordinated Implementation Strategy - DRAFT
Table 32 TMDl Summary by Impairment
Watershed
Cabin John Creek
Rock 2007 Enterococci 970 453669 18195 Creek
Anacostia 2007 Enterococci 860 247809 29978 River
Aoacostia 2008 TN 788 206312 38959 River
Anacostia 2008 TP 797 20953 3947 Ibsyr River
Triadelphia 2008 TP 580 438 Reservoir
Rocky Gorge 2008 TP 480 4268 3628 Reservoir
Clopper Lake 2002 TP 393
Anacostia 2007 TSS 850 7682 River
Triadelphia 2008 TSS Reservoir Clopper 2002 TSS 00 13 13
Lake
Lower 2009 TSS 380010 172 Monocacy
River
Anacostia 2010 Trash 1000 228683 Ibsyr River
Adapted from 2010 Status of Approved Stormwater Waste load Allocations for NPDES Regulated Stormwater Entities in Montgomery County April 27 2010 by Jeff White MDE
Potential to Reduce Stormwater Pollutant loads
Within each of the implementation plans an analysis was developed that explored the
restoration potential for that watershed Cost was not a limiting factor for the analysis but
rather assumptions were made based on feasibility of implementation rates and consideration
of conflicts with typical site conditions with respect to site use utilities land ownership etc
For example it was assumed that 40 of large County-owned parking lots would be available
for stormwater retrofitting These assumptions are necessary for planning purposes where
detailed site investigations have not occurred However some level of implementation is
021611
Montgomery County Coordinated Implementation Strategy - DRAFT
reasonable to assume In addition all identified high priority and low priority County projects
that have the potential to be constructed were assumed to be implemented
Implementation cost and effectiveness (in terms of pollutant load reduced) was also tracked
through the process of determining watershed restoration potential which enables the
costbenefit evaluation of various strategies for a target parameter (eg tons of sediment per
dollar spent or billion MPN of bacteria per dollar etc) For example by tracking cost and
effectiveness it is possible to evaluate the relative costbenefit of a strategy like ESD versus a
non-structural programmatic practice Moreover the comparison of these two strategies is
going to be different depending on what parameter is being considered eg ESD may be more
cost effective for nutrient reduction but less cost effective for bacterial load reduction
The tables in Appendix C help to illustrate this point Specifically a series of summary charts
and tables have been developed that illustrate the cost effectiveness of the range of strategies
considered by watershed with respect to pollutant load reduction The summaries reflect the
full restoration potential developed for each watershed
It is also useful to compare strategy effectiveness and range of opportunity across watersheds
To facilitate this a series of tables were compiled that groups all watersheds together and
considers watershed restoration potential by strategy These summary tables are presented in
Tables 33 through 310
For this analysis stream restoration was treated as a special modeling case (Table 39) because
it was not tracked as a strategy that receives credit for impervious cover treatment and because
it requires a different pollutant load reduction tracking method based on linear feet of
implementation and the existing stream resource condition (good fair or poor IBI scores
received different pollutant removal credit) Further details on stream restoration modeling
are presented in the individual implementation plans and the Guidance Document
Not all WTM scenarios were modeled for all watersheds For example if there were no
previously identified completed high priority low priority or other potential projects within a
watershed they would appear as zeros for that individual watershed in Tables 33 through 36
Also for non-TMDl watersheds such as Great Seneca and Muddy Branch and Watts Branch
subwatersheds the public and private property ESD riparian reforestation and MS4
programmatic practices scenarios were not modeled due to the lack of regulatory drivers that
define pollutant removal targets
021611
Montgomery County Coordinated Implementation Strategy - DRAFT
Table 33 Cost and benefit summary for completed projects (WTM 20)
Watershed Total ESD PrOjects Incremental reduction from baseline ()
i Cost Numberof Impervious
Cost
I Impervious Trash control added TN TP TSS Bacteria
(million $) projects bullbull (ac)
(total) (total)
Anacostia 95 25 167 7 3 4 4 1 4 4
Cabin John 00 0 0 0 0 02 02 03 03 1
Rock Creek 44 6 212 13 1 2 2 3 3 2 i
I Triadelphia 00 0 0 0 0 0 0 0 0 0
Rocky Gorge 00 0 0 0 0 0 01 0 0 0
Lower Monocacy 00 0 0 0 0 0 0 0 0 0
Clopper lake 00 0 0 0 0 0 0 0 0 0
Great Seneca bull 06 2 11 0 0 1 1 I 1 0 2
MuddyWatts 00 0 0 0 0 0 0 0 0 0
Indudes Clopper lake Project count does not include stream restoration Pollutants with a TMDL are highlighted
Table 34 Cost and benefit summary for high priority projects (WTM 20)
Watershed I
I
Total ESD Projects Incremental reduction from baseline ()
Cost
(million $)
i Numberof
projects bullbull
Impervious
control added
(ac)
ICost (total)
Impervious
(total) TN
I TP TSS I TrashBacteria
Anacostia 64 33 148 65 16 2 2 06 2 2
Cabin John 16 6 88 19 2 3 3 3 3 1
Rock Creek 89 14 373 13 1 2 3 3 3 4
Triadelphia 00 0 0 04 0 0 0 0 0 0
I Rocky Gorge 04 2 5 77 27 06 06 07 06 1
Lower Monocacy 00 0 0 0 0 0 0 0 0 0
Clopper lake 00 0 0 0 010 0 0 0 0 0 Great Seneca bull 183 24 789 6 08 19 19 20 0 24
MuddyWatts 44 16 211 8 1 6 6 6 0 6
Indudes Clopper lake bullbull Project count does not indude stream restoration Pollutants with a TMDL are highlighted
Table 35 Cost and benefit summary for low priority projects (WTM 20)
I Watershed Total ESO Projects Incremental reduction from baseline ()
Numberof Impervious ICost 1m ~ i Cost Impervious
I (million $) projects bullbull
control added (total) (total)
TN TP Bacteria Trash
(ac)
I Anacostia 51 16 188 61 8 2 2 07 2 3
Cabin John 16 8 10 98 78 02 02 02 02 03
I Rock Creek 88 24 657 7 1 4 4 6 5 7
Triadelphia 040 1 20 100 100 05 05 06 05 1
Rocky Gorge 09 2 458 100 100 84 82 83 82 116 i
I Lower Monocacy 0 0 0 0 0 0 0 0 0 0 I Clopper lake 0 0 0 0 0 0 0 0 0 0
I Great Seneca bull 66 16 87 41 15 4 4 4 010 4
I MuddyWatts 20 6 26 84 33 0 0 1 0 0
Includes Clopper Lake Project count does not include stream restoration Pollutants wth a TMDL are highlighted
021611
Montgomery County Coordinated Implementation Strategy - DRAFT
Table 36 Cost and benefit summary for other potential projects (WTM 20)
I Watershed Total ESO Projects Incremental reduction from baseline ()
ICost Impervious I Cost
I I Trash INumber of
control added Impervious
TN TP TSS Bacteria (million $) projects bullbull
(ac) (total) (total)
i i
Anacostia 2492 497 2222 73 62 23 8 26 301
Cabin John 00840 1 5 0 010 01 01 01 01 01
Rock Creek 20 4 201 0 0 12 12 19 15 21
Triadelphia 00 0 0 010 0 00 00 00 00 00
Rocky Gorge 20 2 0 010 0 00 00 00 00 00
lower Monocacy 00 0 0 0( 0 00 00 00 00 0010
Clopper Lake 00 0 0 0 0 00 00 00 00 0010
Great Seneca bull 02 S S3 0 0 23 23 27 00 27
MuddyWatts 00 0 0 0 0( 00 00 00 00 0010
bull Includes Clopper Lake bullbull Project count does not include stream restoration Pollutants with a TMDL are highlighted
Table 37 Cost and benefit summary for ESO projects (WTM 30)
Watershed
I
Cost (million $) Impervious
control added
(ac)
Incremental reduction from baseline ()
ESDfor i ESO for private
public
property property
TN TP TSS Bacteria Trash
Anacostia 2378 21296 1813 20 21 7 22 27
Cabin John 878 10307 876 22 23 25 24 28
Rock Creek 2471 341 2427 30 30 33 32 35
Triadelphia 41 47 36 10 1010 11 11 20
Rocky Gorge 312 19 28S 26 27 32 30 46
lower Monocacy 86 29 53 14 15 15 15 010
Clopper lake 08 051 21 14 14 15 0 14
Great Seneca bull 00 0 0 010 0 0( 0( 010
MuddyWatts 00 a 0 0 01 010 0 0
bull Includes Clopper lake Pollutants with a TMDL are highlighted
Table 3B Cost and benefit summary for riparian reforestation (WTM 40)
IWatershed Cost (million $) Impervious
Incremental reduction from baseline ()
control added Habitat restoration (ac) TN TP TSS Bacteria Trash
Anacostia 1 6 0 0 0 01 02
Cabin John 777 39 1 2 lili
3
Rock Creek 24 119 2 2 2 5
Triadelphia 010 1 01 02 01 04 03
Rocky Gorge 25 12 1 2 2 3 8
lower Monocacy 11 S 3 3 3 4 0
Clopper Lake 023 2 4 4 2 010 4
Great Seneca bull 0 a 010 010 0 010 0
MuddyWatts 0 0 010 0 0 0 0
bull Includes Clopper lake Pallutonts with a TMDL are highlighted
021611
Montgomery County Coordinated Implementation Strategy - DRAFT
Table 57 Cost and benefit summary for stream restoration (WTM 40)
Watershed Stream Restoration Incremental reduction from baseline ()
Number of Impervious control
Cost (million $) added(ac) TN TP TSS Bacteria Trash projects
Anacostia 937 200 0 42 56 326 0 0
Cabinlohn 162 15 0 17 9 80 0 0
Rock Creek 201 30 a 9 710 100 0 0
Triadelphia 00 0 0 0 0 0 010 0
Rocky Gorge 191 18 I 0 10 7 36 0 O lower Monocacy 73 nla 0 7 10 32 010 0
Clopper Lake 00 a 0 0 0 0 0 0
Great Seneca It I 259 33 0 19 8 16 0 0
MuddyWatts 242 45 0 16 7 13 0 0
Includes Clopper Lake Pollutants with a TMDL are highlighted
Table 58 Cost and benefit summary for M54programmatlc practices (WTM 50)
Watershed Cost (million $) Incremental reduction from baseline ()
Programmatic
practices - M54
Impervious control
added (ac) TN TP TSS Bacteria Trash
Anacostia 36 0 9 9 10 8 82
Cabin John 047 0 15 14 0 10 0
Rockereek 12 0 11 11 0 7 0
Triadelphia 00056 a 23 3 0 0 0
Rocky Gorge 009 0 38 8 03 5 2
lower Monocacy 007 0 0 0 19 0 0
Clopper Lake 0Q1 0 61 30
~=r 0
Great Seneca 10 0 0 0 0 0Y0 0 0
MuddyWatts 0 0 0 0 0 0 0
bull Includes Clopper Lake Pollutants with a TMDL are highlighted
021611
Montgomery County Coordinated Implementation Strategy - DRAFT
4 COORDINATED IMPLEMENTATION STRATEGY
The Strategy has multiple objectives to accomplish whereby a challenging balance between
strategies and timeframe is required There isnt necessarily a correct answer in the process
but rather an optimized result that addresses an agreed upon suite of priorities The Strategy
presented here was primarily driven by known and established regulatory timeframes and
compliance endpoints Meeting these endpoints using the more cost effective approaches was
also given priority After this consideration was given to other known and important
approaches that stakeholders and the County have an interest in pursuing Specifically the
following compliance dates and objectives were conSidered in developing the Strategy over the
long-term (Table 41)
Table 41 Compliance Targets for Countywide Coordinated Implementation Strategy
Target Date
2015
2017
2020
Compliance Target
Meeting 20 impervious cover treatment requirement
within the MS4 Permit cycle
Meet the interim dates and targets for the Chesapeake
Bay TMDL which include specific regulated urban area
reductions by 2017 for nutrients and sediment (based
on Maryland Department of the Environments
Watershed Implementation Plan)
Meet the full compliance and targets for the
Chesapeake BayTIVIDL which include specific regulated
urban area reduction by 2020 for nutrients and
sediment (based on Maryland Department of the
Environments Watershed Implementation Plan)
Metric
~4300 acres of
Impervious Cover
9 12 and 20
respectively for TN TP
and TSS reductions
from baseline
conditions
18 34 and 37
respectively for TN TP
and TSS reductions
from baseline
conditions
2025
2030
Meet additional impervious cover treatment targets
associated with next MS4 Permit cycle (assumes
another 20 target)
Meet additional impervious cover treatment targets
associated with next MS4 Permit cycle (assumes
another 20 target)
Out year compliance with other watershed TMDLs
~3400 acres of
Impervious Cover (20
of impervious
remaining after 2015)
~2750 acres of
Impervious Cover (20
of impervious
remaining after 2020)
100 compliance with
MS4 Permit Area WLAs
021611
Montgomery County Coordinated Implementation Strategy - DRAFT
To meet the compliance targets outlined in Table 41 the following priorities were generally
followed
bull 100 implementation of completed high and low priority County projects in first five
years (by 2015)
bull Greater ESD focus in urban (as opposed to suburban and rural) watersheds initially Goal
for ESD in these watersheds on pUblic property in first five years is 10 and on private
property is 10 The level of implementation was largely driven by the 20 Countywide
impervious goal
bull 100 of Public Outreach Potential for all TIVIDl watersheds in first five years This was
pursued to address trash nutrient and bacteria loading which rely strongly on effective
outreach programs to modify behaviors
bull Generally limited strategies to the top four most cost effective per watershed
bull Habitat restoration (stream restoration and buffer reforestation) not pursued as priority
until after first five year period These programs emphasize greater pollutant reduction
efficiency rather than impervious cover treatment which is the primary focus for the
first permit cycle
The Strategy was informed by the individual watershed implementation plans for seven
watersheds which included the Clopper lake and Patuxent subwatersheds Therefore in order
to develop countywide estimates for pollutant load reduction (as is required by the Chesapeake
Bay TMDl) watershed area weighting was applied The process for developing the Countywide
strategy and individual watershed implementation plans was woven together Once the
restoration potential was determined from the individual plans the strategy and schedule was
compiled using the restoration potentials and the drivers listed above The final restoration
cost and schedule was then placed in the implementation plans
It is also worth noting that the high and low priority projects along with the other potential
projects strategies represent a static or fixed number of projects that have been identified by
the County For this analysiS this list of practices is not replenished and therefore once all
opportunities have been implemented other strategies are pursued In reality the County will
continue to develop and update its list of specific project opportunities and have these
available for implementation in future years
The output from this effort is presented in a series of tables ordered by target date in Appendix
D In addition Table 42 provides an overall summary of pollutant load reduction tracking
versus time Through inspection of Table 42 it can be seen that the Strategy meets the
021611
Montgomery County Coordinated Implementation Strategy - DRAFT
impervious cover treatment targets under the current MS4 permit (as well as projected targets
for 2020 and 2025 assuming a continued 20 treatment requirement) interim and final
Chesapeake Bay nutrient and sediment reduction targets by 2017 and 2020 respectively and
out year MS4 permit area WLA compliance for the majority of pollutants Exceptions include
meeting the bacteria WLA load reductions required for the Anacostia and Rock Creek
021611
Montgomery County Coordinated Implementation Strategy - DRAFT
Table 42 Projection by Phase for Watersheds and Pollutants PermitTMDL Targets
Watershed Fiscal Year 2015 2017 2020 2025 2030 2017 2020
Impervious Treated (acres) 1421 2393 3364 4272 4544
ESD ( Impervious) 26 44 61 69A 71
Cost (Million $) 160 307 486 732 820
E5D( Cost) 45 62 71 78 78
Anacostia Nitrogen 25 39 68 89A l00A 818 82
Phosphorus 27 42 77 100 100 812 81
i Sediment 47 72 100 l00A) l00A 875 88
Bacteria 21 33 46 59A 64 879 88
Trash 41 65 89 l00A) 100
Impervious Treated (acres) 1541 1961 2381 3625 3989
ESD ( Impervious) 17 28 36 57A 61
Cost (Million $) 87 172 262 566 658
ESD ( Cost) 7(JA 79 79A 89A 9(JA
Rock Creek Nitrogen 24 30 38 55 61
Phosphorus 25 3(JA 38 54 GfJA)
Sediment 38 50 92 l00A 100
Bacteria 21 27 33 5(JA 55 96(JA 96
Trash 17 24 31 5(JA) 55
Impervious Treated (acres) 187 380 570 1018 1018
ESD ( Impervious) 52 72 78 87A 87A
Cost (Million $) 23 65 114 215 219
ESD ( Cost) 92 91 86 90 88
Cabin John Nitrogen 21 27A 39A 55 58 Phosphorus 2(JA 26 35 49 51
Sediment 6 17 GfJA 91 100
Bacteria 16 22 27 4(JA) 40 31 31
Trash 6 12 19 34 34
Impervious Treated (acres) 237 237 237 237 237
ESD ( Impervious) 4 4 4 4 4
Cost (Million $) 6 8 19 25 31
ESD ( Cost) 32 27A 11 8 7
Muddy Watts Nitrogen 6 7 15 18 22
Phosphorus 6 7 10 12 13 Sediment 7 8 14 17 2(JA
Bacteria 0 (JA 0 (JA 0 i Trash 6 6 6 6 6
bull Impervious Treated (acres) 901 921 941 941 941 ESD ( Impervious) 2 2 2 2 2
Cost (Million $) 26 48 SO 51 52 ESD ( Cost) 15 8 8 8 8
Great Seneca Nitrogen 24 41 43 44 45
Phosphorus 24 32 34 34 34
i Sediment 26 41 43 44 44
I Bacteria (JA) 0 0 0 (JA
Trash 31 32 33 33 33
021611
Montgomery County Coordinated Implementation Strategy - DRAFT
Pe rmitTMDL Targets
Watershed Fiscal Year 2015 2017 2020 2025 2030 2017 2020
Clopper
Impervious Treated (acres) 0 6 12 22 22
ESD ( Impervious) 0 86 86 92 92
Cost (Million $) 0 0 1 2 2
ESD ( Cost) 0 72 73 84 84
Nitrogen 61 67 72 79 79
Phosphorus 30 36 41 48 48 45 45
Sediment 0 5 10 17 17
Bacteria 0 0 0 0 0
Trash 0 6 11 18 18
Lower Monocacy
Impervious Treated (acres) 1 16 32 58 58
ESD ( Impervious) 100 85 84 91 91
Cost (Million $) 0 4 11 18 20
ESD ( Cost) 100 85 54 63 58
Nitrogen 0 5 14 22 24
Phosphorus 0 5 16 26 28
Sediment 0 5 46 61 69 608 61
Bacteria 0 6 12 19 19
Trash 0 0 0 0 0
Rocky Gorge
Impervious Treated (acres) 11 88 165 307 307
ESD ( Impervious) 64 89 90 95 95
Cost (Million $) 3 17 40 70 75
ESD ( Cost) 55 82 64 73 68
Nitrogen 47 55 6710 82 85
Phosphorus 17 25 36 52 53 15 15
Sediment 10 19 45 7(J1o 79
Bacteria 14 23 32 47 47
Trash 15 30 46 68 68
Triadelphia
Impervious Treated (acres) 3 12 20 38 38
ESD ( Impervious) 100 98 97 99 99
Cost (Million $) 1 3 5 9 9
ESD ( Cost) 99 98 98 99 99
Nitrogen 24 27 29 34 34
Phosphorus 4 7 9 14 14 15 15
Sediment 1 4 6 12 12
Bacteria 1 4 6 12 12
Trash 2 6 11 21 21
Countywide
Impervious Treated (acres) 4302 6014 7722 10518 11154 6008 7723
ESD ( Impervious) 18 34 47 6(J1o 63
Cost (Million $) 305 622 987 1687 1884
ESD ( Cost) 53 66 7(J1o 8(J1o 80
Nitrogen 18 25 36 46 51 9 2(J1o
Phosphorus 17 23 34 44 46 12 34
Sediment 23 34 54 6(J1o 62 20 37
Bacteria 11 15 20 28 30
Trash 18 26 33 41 42
Assumptio~s
1 Does no~ includerepeated Outreach and Education costs beyond FY2015
2 Does not include ~n inflation multiplier
021611
Montgomery County Coordinated Implementation Strategy - DRAFT
Summary of Individual Implementation Plans
A summary of the general considerations and prioritization for each watershed implementation
plan is provided below
Anacostia - For the first permit cycle (through 2015) a priority was placed on full
implementation of completed high and low priority projects Next implementation of a third
of the other potential projects was targeted as a large number of these were identified in
conjunction with the USACEs Anacostia Watershed Restoration Plan efforts ESD was
emphasized on both public (10) and private property (10) Finally outreach (25) and
stream restoration (12) are targeted for pollutant load reduction but are not credited towards
impervious cover credit In future permit cycles the remainder of the other potential projects
are targeted along with ESD and a limited amount of riparian reforestation for impervious cover
and pollutant load reduction Outreach and stream restoration are significant strategies
pursued for load reduction benefits Nutrient and sediment MS4 permit area WLAs are met by
2030 but bacteria load reduction does not meet MS4 permit area WLA compliance The
remaining bacteria reduction is believed to be associated with urban wildlife sources Unless
intense urban wildlife management practices are implemented this remaining load reduction
will not be possible
Rock Creek- For the first permit cycle (through 2015) a priority was placed on full
implementation of complete high and low priority projects Next 25 implementation of
other potential projects was targeted ESD was emphasized on both public (10) and private
property (10) with private property implementation being linked to Rainscapes Program
success Finally outreach (100) and stream restoration (22) are targeted for pollutant load
reduction but are not credited towards impervious cover credit In future permit cycles the
remainder of the other potential projects are targeted along with ESD and riparian
reforestation for impervious cover and pollutant load reduction Stream restoration is a
significant strategy pursued for load reduction benefits The bacterial load reduction does not
meet MS4 permit area WLA compliance However the remaining bacterial load is believed to
be associated with urban wildlife sources Unless intense urban wildlife management practices
are implemented this remaining load reduction will not be possible
Cabin John Creek - Similar to the other two more urban watersheds in the County during the
first permit cycle (through 2015) a priority was placed on full implementation of complete high
and low priority projects Fewer opportunities exist overall compared to the Anacostia and Rock
Creek Next 25 implementation of other potential projects was targeted ESD was
emphasized on both public (10) and private property (10) Finally outreach (100) was
021611
Montgomery County Coordinated Implementation Strategy - DRAFT
targeted for pollutant load reduction but not credited towards impervious cover credit No
riparian reforestation or stream restoration was targeted due to limited or no opportunities In
future permit cycles the remainder of the other potential projects are targeted along with ESD
and some riparian reforestation for impervious cover and pollutant load reduction The
bacteria load reduction meets MS4 permit area WLA compliance by 2025
Muddy BranchWatts Branch - During the first permit cycle (through 2015) a priority was
placed on full implementation of complete high and low priority projects Fewer opportunities
exist overall compared to the Anacostia and Rock Creek Watersheds No other strategies were
pursued as there are no existing TMDLs in the Muddy BranchWatts Branch subwatersheds In
future permit cycles previously identified stream restoration projects are implemented for
pollutant load reduction
Great Seneca Creek - This watershed implementation plan is unique in that it includes the small
Clopper Lake subwatershed which has a TMDL for phosphorus Even with the TMDL there are
limited identified opportunities to pursue in the Clopper Lake subwatershed in part due to the
limited area of the subwatershed within the County MS4 permit area During the first permit
cycle (through 2015) a priority was placed on full implementation of complete high and low
priority projects within Great Seneca Creek subwatershed No opportunities exist for these
strategies in Clopper Lake However full outreach was applied in Clopper Lake in the first
permit cycle In future years other potential projects ESD on public and private property and a
small amount of riparian reforestation (in Clopper Lake) is pursued The Clopper Lake WLA for
phosphorus within the MS4 permit area is met
Patuxent - During the first permit cycle through 2015 a priority was placed on full
implementation of complete high and low priority projects Far fewer opportunities exist
overall compared to the Anacostia and Rock Creek A limited amount of ESD on private land
and stream restoration was pursued Finally outreach (100) was targeted for pollutant load
reduction (primarily nutrients) but not credited towards impervious cover credit No riparian
reforestation was targeted within the MS4 Permit area due to cost effectiveness in the Rocky
Gorge subwatershed and limited opportunities in the Triadelphia subwatershed In future
permit cycles ESD on private and public land is pursued more substantially as is stream
restoration A limited amount of riparian reforestation achieves some impervious cover and
pollutant load reduction The Rocky Gorge phosphorus WLA within the MS4 permit area is met
easily and the Tridelphia phosphorus WLA is also met but with a longer timeframe needed for
compliance
021611
Montgomery County Coordinated Implementation Strategy - DRAFT
Lower Monocacy Creek -lower Monocacy Creek is the most rural watershed in the County and
has the least amount of area subject to the County MS4 permit In addition there are no preshy
identified restoration projects within the watershed Therefore during the first permit cycle
(through 2015) only a very small amount (5) of private property ESD is pursued It is not until
the second permit cycle that more focus is placed on private and public ESD as well as stream
restoration and programmatic strategies such as street sweeping to target sediment loads
associated with the TM Dl In future permit cycles stream restoration is pursued for pollutant
load reduction The sediment WlA within the MS4 permit area is projected to be met around
2025
Countywide - The Countywide effort was driven by impervious cover treatment targets and
Chesapeake Bay TMDl2017 and 2020 reduction targets associated with sediment and nutrients
for urban MS4s For impervious cover it was assumed that a 20 target would be required for
each five-year permit cycle The Bay TMDl targets for urban MS4 areas were easily met for all
pollutants in 2017 and easily met for nitrogen and sediment but more difficult to meet for
phosphorus in 2020
Public Outreach and Stewardship
The County recognizes and is committed to the increasingly important role that public outreach
and stewardship will play if improved water quality conditions are going to be achieved
countywide While the County currently has a very active and layered outreach program the
model requires changes that will result in broader stakeholder groups serving as the leaders
and primary champions for clean water in their communities This includes greater participation
from minority and faith-based groups business consortiums schools neighborhood
associations and civic groups Additionally the new model requires revisiting current
initiatives carried out by the various County agencies to look for better and more efficient ways
to communicate messages cross-train and create synergies that result in greater engagement
greater awareness and sustained changes in behavior
Within each implementation plan specific suggestions for outreach and education
opportunities are identified In addition Appendix E of this Strategy contains practice sheets
which highlight targeted restoration activities for the County to develop and refine A total of
eight practices have been identified that can be adopted countywide or in more targeted
watershed areas where there are specific water quality issues to address Many of the
practices build upon existing County programs but require a much broader reach to new
partner groups Program start up costs are suggested and were used to for cost estimates
associated with Countywide strategy The highlighted practices include
021611
Montgomery County Coordinated Implementation Strategy - DRAFT
bull Pet Waste Pickup Education and Outreach Campaign
bull Lawn Stewardship Education and Outreach Campaign
bull Anti-littering Education and Outreach Campaign
bull Innovative Stormwater Management Awareness Campaign
bull Stream Stewards Education and Outreach Campaign
bull Riparian Reforestation Education and Outreach Campaign
bull Roof Runoff Reduction Education and Outreach Campaign
bull Parking Lot Recharge Value Education and Outreach Campaign
Start up costs by practice along with an overall five year cost estimate are provided in Table
43 Start up timeframes are assumed to be up to 18 months
Table 43 Outreach Start Up and 5-Year Cost Projections
Practice Practice Start Up Cost
Pet Waste Pickup $240500
Lawn Stewardship $301 600
Anti-Littering $175050
Stormwater Management Improvements Awareness $50450
Stream Stewards $74825
Riparian Reforestation $30575
Roof Runoff Reduction $101400
Parking Lot Recharge Value $41500
Estimated Start Up Total $744900
5-Year Outreach Budget Projection $2650000
These eight practice sheets provide specific costs and timelines for implementation They also
provide suggestions for measuring program success These practice sheets along with the
specific recommendations in the implementation plans make up the Public Outreach and
Education Campaign
Trash Reduction
Most of the implementation plans have to address trash loadings to meet requirements of the
Potomac Trash Treaty that is referenced in the County1s MS4 Permit In addition the Anacostia
Trash TMDL has recently been accepted by MDE and the EPA According to the Anacostia
021611
Montgomery County Coordinated Implementation Strategy - DRAFT
TMDl there is reasonable assurance that the goals of the Treaty and TMDl can be met with
proper watershed planning implementing pollution-reduction BMPs and using strong political
and financial mechanisms
Currently the County has a number of activities which target trash reduction They include the
following
bull Adopt-a-Road Program through DOT which focuses on public awareness and involvement in trash management There are 205 participants who adopted road segments and agreed to six major road cleanups per year
bull Storm Drain Marking through DOT bull Support for illegal dumping enforcement outreach and research and monitoring bull Partnership with DOT to conduct street sweeping covering about 2500 curb miles and
occurring once a year
bull Partnership with the Park Police to monitor illegal dumping which combined enforces 300-400 actions a year
bull Non-residential and residential recycling programs through Solid Waste Services (SWS) bull Transit stop trash management program at 600 bus stops countywide supported by DOT
Transit Services
In addition to continuing these efforts a number of trash good-housekeeping efforts have been
proposed as part of this Strategy A detailed description of the quantitative methods and
strategies applied can be found in Appendix E of the Guidance Document In general the
following six trash-reduction strategies are recommended
1 Significantly increase funding for trash reduction programs 2 Create and enhance regional partnerships and coordination among businesses
environmental groups individual citizens and government at all levels and in all jurisdictions
3 Improve peoples awareness knowledge and behavior relating to littering and illegal dumping
4 Promote the greater introduction and use of effective trash-reduction technologies and approaches
5 Improve enactment and enforcement of laws to reduce trash 6 Increase trash monitoring-related data collection generation and dissemination efforts
The Anacostia watershed implementation plan provides an outline of the actions that will be
taken through the first permit cycle to reduce trash The range of programs and practices
specially aimed at reducing trash inputs to roads and streams that will be targeted include
reduce reuse and recycle campaigns littering and illegal dumping enforcement stream
cleanups and street sweeping These measures are in addition to any trash trapped and
021611
Montgomery County Coordinated Implementation Strategy - DRAFT
removed by structural practices which are computed using the WTM The plan shows that the
trash TMDl can be met by 2025 at a cost of 732 million dollars
Adaptive Management Monitoring and Reporting
Sound implementation strategies require assessment and effective adaptation to respond to
new information changing conditions new technologies and lessons learned This will be the
basis of the plan that will be used when benchmarks are not met and the projected funding is
inadequate
Adaptive management requires monitoring of a variety of measures that can be used to
determine whether progress is being made towards meeting the Countywide water quality
objectives Ultimately it is the instream water quality and the loading limits with respect to the
TMDls that determine the success of implementation however there are many interim
measures that can also be correlated to success which are worthwhile pursuing
Surface water monitoring can be an expensive and time consuming undertaking Montgomery
County is fortunate to have an extensive Countywide stream monitoring network that can serve
as a foundation for providing spatial and temporal data to indicate stream health The Countys
MS4 Permit also outlines the required assessment of controls which includes chemical
biological and physical monitoring Specifically the permit calls for the County to continue
their watershed restoration monitoring of the lower Paint Branch subwatershed and physical
monitoring ofthe Clarksburg Special Protection area In addition to the existing monitoring
network the County will continue tracking and data reporting associated with levels of
implementation (eg acres of impervious cover treated areas of buffer planted miles of
stream restored miles of streets swept) For measuring effectiveness of outreach and
stewardship efforts other types of monitoring and reporting are planned that include before
and after attitude surveys frequency of website visits and information requests
For many restoration strategies it may be difficult to tease out their individual effectiveness in
terms of pollutant load reductions but collectively the monitoring that occurs should provide
adequate insight into the overall effectiveness of a layered implementation strategy
In addition to the monitoring and assessment the County will be reporting results on an annual
basis as part of their NPDES MS4 Permit annual report The MS4 Permit requires annual
reporting of the following
021611
Montgomery County Coordinated Implementation Strategy - DRAFT
bull The status of implementing the components of the stormwater management program
that are established as permit conditions
bull A narrative summary describing the results and analyses of data including monitoring
data that is accumulated throughout the reporting year
bull Expenditures for the reporting period and the proposed budget for the upcoming year
bull A summary describing the number and nature of enforcement actions inspections and
public education programs
bull The identification of water quality improvements and documentation of progress
toward meeting applicable WLAs developed under EPA approved TMDLs and
bull The identification of any proposed changes to the Countys program when WLAs are not
being met
The County will build upon annual reporting that has historically occurred to meet permit
requirements and will supplement this reporting with tracking table summaries that quantify
implementation activities for the range of strategies pursued during that year and the
associated treatment (eg impervious cover treated pollutant load reduced education and
outreach partners established etc) Cost will also be tracked in association with rates of
implementation This level of performance will then be compared with countywide strategy
targets (eg progress towards meeting WLAs) associated with key performance dates such as
those presented in Table 41 The level of progress achieved by the County will then feed into
the adaptive management approach described above
Organization Needs to Implement Strategy
Montgomery County DEP staff possesses substantial expertise and institutional knowledge that
yields many positive outcomes and efficient processes under the current pace of restoration
and permit compliance activities Under this strategy however the pace of implementation is
required to significantly increase Based on an increase in the level of implementation it is
reasonable to assume that additional capacity may be needed to provide sufficient oversight
and management of all the projects
Another critical element of this strategy is the recognition and commitment to pursuing
outreach initiatives that build community capacity by targeting new partner groups that
provide the necessary leadership oversight and sustained effort to change behaviors and
foster stewardship The County currently carries out many well established and managed
outreach programs but it may require additional focus across County agencies and
departments for these partnerships to become established and thrive
021611 G
Montgomery County Coordinated Implementation Strategy - DRAFT
Through the implementation process and the monitoring and reporting that is required large
amounts of data will be generated Technological advances happen so rapidly in this day and
age it will be important for the County to stay current with technology and methods so that
more efficient and cost-effective data management and reporting will be possible The County
currently relies on a detailed and sophisticated GIS to spatially locate projects and manage
tables of data related to projects The growth and development of this spatial database will be
a critical component of the reporting and tracking capability of the County These databases
generate the input data that are used to measure progress towards baseline loading targets
Regular review and upkeep of the data as well as routine summarization of progress (annually
at a minimum) will likely require additional dedication of staff This is especially the case during
periods where the implementation rate of structural practices in the ground is accelerated
021611
Montgomery County Coordinated Implementation Strategy - DRAFT
Appendix C - Restoration Potential by Watershed
021611
c-
04 03 02 01
a
_ Nitrogen Load Reduction
--shy TMDL WLA Target
_Cost
MONTGOMERY COUNTY URBAN WATERSHEDS POLLUTANTS _Bk)~Ibilats ~1~ l~ fjfsi --
Rank
1
2
3
4
5
6
7
8
9
10
11
Restoration Strategy TN reduction
Ibsyr
Pet Waste Education 15169
Retrofit of Underperforming BMPs 1769
Stream Restoration 72423
Completed Projects ~43 High Priority Projects 3260
Other Potential Projects 43276
Habitat Restoration 224
Public Property ESD Retrofits 18270
Priority Neighborhoods ESD Retrofits 9271
Private Non-residential ESD Retrofits 5594
Street Sweeping -
Incremental Cost Unit Cost
Million $ IbsMillion $ 088 17193
120 1475
9304 778
948 701
635 513
25430 170
141 158
23655 77
13278 70
8018 70
124 -
Qj c
Qj
nI CXI
o -f-
1 09 08 07 06 05
$900 $800 $700
~ $600 c $500 ~ $400 $300 0 u $200 $100
$shy
~~mf il_~IJrt~
MONTGOMERY COUNTY URBAN WATERSHEDS POLLUTANTS ItfiQ14lbilJts i~5 [i
1 $900 Qj
09 $8005 iii en 08 $700
~co 07 $600 co - til
06 $500 ~ 05- $400 ~ 04 en$300 003 u $20002
en $100I 01 o 0 $shys Q en o
s Q
Phosphorus Load Reduction
--- TMDL WLA Target
__Cost
I Rank I
1
2
3
4
5
6
7
8
9
Restoration Strategy
Pet Waste Education
Retrofit of Underperforming BMPs
Stream Restoration
Completed Projects
High Priority Projects
Habitat Restoration
Other Potential Projects
Public Property ESD Retrofits
Priority Neighborhoods ESD Retrofits
10 I Private Non-residential ESD Retrofits
11 Street Sweeping
TP reduction Incremental Cost Unit Cost
Ibsyr Million $ IbsMillion $ 1979 088 2243
247 120 206
13097 9304 141
915 948 96
451 635 71
37 141 26
6067 25430 24
2546 23655 11
1294 13278 10
781 8018 10
- 124 -
MONTGOMERY COUNTY URBAN WATERSHEDS POLLUTANTS IItQjQhabillt$middot
Cii 5 Cii 11 It CD
6 ~ r o ~ s
0 ltIIa r ltII e c ltII III
1 09 08 07 06 05 04 03 02 01
0
$900
$800 $700
v$600 r
0 $500 == $400 $300 11
0 u $200 $100
$shy
_ Sediment load Reduction
--- TMDl WlA Target
__Cost
Rank Restoration Strategy
Sediment reduction
Incremental Cost
Unit Cost
tonsyr Million $ tonsMillion $ 1 Street Sweeping 800 124 645
2 Stream Restoration 25057 9304 269
3 Retrofit of Underperforming BMPs 25 120 21
4 Completed Projects 97 948 10
5 High Priority Projects 47 635 7
6 Other Potential Projects 660 25430 3
7 I Public Property ESD Retrofits 272 23655 1
8 Priority Neighborhoods ESD Retrofits 139 13278 1
9 Private Non-residential ESD Retrofits 84 8018 1
10 Habitat Restoration 2 141 1
11 Pet Waste Education - 088 -
C-3
MONTGOMERY COUNTY URBAN WATERSHEDS POLLUTANTS
-QI5 5i ~
1 09 08 07 06 05 04 03 02 01
0
$900
$800
$700
$600 ~ 0
$500 == $400 $300 11
0 u $200
$100
$shy
--shy TMDL WLA Target
___ Cost
Rank Restoration Strategy
Enterrococci reduction
Incremental Cost
Unit Cost
Billion MPNyr Million $ Billion MPN Million $
1 Pet Waste Education 19643 088 22263
2 Retrofit of Underperforming BMPs 2781 120 2318
3 Completed Projects 10441 948 1101
4 High Priority Projects 5120 635 806
5 Other Potential Projects 69895 25430 275
6 Riparian Reforestation 310 141 219
7 Public Property ESD Retrofits 29025 23655 123
8 Priority Neighborhoods ESD Retrofits 14777 13278 111
9 Private Non-residential ESD Retrofits 8917 8018 111
10 Stream Restoration - 9304 -
11 Street Sweeping - 124 I -
~ I~~~i MONTGOMERY COUNTY URBAN WATERSHEDS POLLUTANTS 1tI2~mL ~ I~I
~$ I -~-- I
100 90 80 70 60 50 40 30 20 10
0
$900 $800 $700 $600 $500 $400 $300 $200 $100 $shy
vi c
~ 5 11 0 u
Implementation Phase
Potential Trash Incremental Unit Cost
I
Rank Restoration Strategy Reduction Cost
Ibsyear Million $ IbsMillion $ 1 Recycling Education and Investigations 51654 02 238837
2 Plastic Bag Ban and Misc Enforcement 63546 13 48882
3 Anti-litter Campaign Education 23J61 09 26930
4 Retrofit of Underperforming BMPs 1144 12 954
5 Completed Projects 6598 95 696
6 High Priority Projects 2786 64 439
7 Other Potential Projects 56341 2543 222
8 Habitat Restoration 266 14 188
9 Street Sweeping 204 12 164
10 Public Property ESD Retrofits 25348 2366 107
11 Priority lIeighborhoods ESD Retrofits 12529 1328 94
12 Private Non-residential ESD Retrofits 7547 802 94 ru Stream Restoration - 930 -14 Pet Waste Education - 09 -
C-5
MONTGOMERY COUNTY URBAN WATERSHEDS POLLUTANTS
CABIN JOHN
1 250
__CostImplementation Phase
09 08 07 06 05 04 03 02 01
0
200 ~ c
150 g E
100 - ltII 0 u
50
0
_E Coli
- - - Waste Load Allocation
Rank Restoration Strategy
E coli reduction
Incremental Cost
Unit Cost
Billion
MPNyr Million $
Billion MPN
Million $ 1 Pet Waste Education 4388 $05 9436
2 Underperforming BMP Retrofits 1892 $19 1022
3 High Priority Projects 1289 $16 800
4 Riparian Reforestation 1133 $78 146
5 Other Potential Projects 148 $17 86
6 Public Property ESD Retrofits 4AOO $860 Sl 7 Private Non-residential ESD Retrofits 1618 $392 41
8 Priority Neighborhoods ESD Retrofits 2633 $638 41
9 Completed Projects 112 $00 0
C-6
MONTGOMERY COUNTY URBAN WATERSHEDS POLLUTANTS 1Itf~~Jabitm
ROCK CREEK
1 $700 Qj5 09
o
_
$600 Qj 08
111 $500 ~ampl 07 c
t5 06 $400 ~ e 05 ~ $3005 04 - 111tl 03 $200 0 u-6 02
$100J 01 $-
Enterrococci
- - - Waste load Allocation Implementation Phase
__Cost
Rank Restoration Strategy
Enterrococci reduction
Incremental Cost
Unit Cost
Billion MPNyr Million $ Billion MPN Million $
Et Pet Waste Management 35734 118 30190
Underperforming BMP Upgrades
Other Potential Projects
28800
30239
577
1083
4995
2792
4 Completed Projects 12131 444 2734
5 High Priority Projects 14239 890 1600
6 Riparian Reforestation 18999 2384 797
7 County Property ESD Retrofits 54519 24136 226
8 Private Residential ESD Retrofits 35230 17737 199
9 Private Non-residential ESD Retrofits 32A86 16380 198
C-7
MONTGOMERY COUNTY URBAN WATERSHEDS POLLUTANTS _f~~pabitafS (fi~r ~~ l-middotshy
ROCK CREEK
100 $900 90 $800 80 $700 u70 $600 c 60 2$50050 -~$40040
lt1$300 030 $200 u
20 10 $100
0 $shy
Implementation Phase
Rank Restoration Strategy Trash Reduction
Incremental Cost
Unit Cost I
Ibsyear Million $ IbsMillion $ 1 Other Potential Projects 16038 1085 1478
2 Underperforming BMP Upgrades 6756 577 1172
3 Completed Projects 4217 444 950
4 High Priority Projects 6366 890 715
5 Riparian Reforestation 9237 2384 387
6 Public Property ESD Retrofits 24587 24136 102
7 Priority Neighborhoods ESD Retrofits 16155 17737 91
8 Private Non-residential ESD Retrofits 14793 16380 90
9 Pet Waste Education - 118 -
(-8
MONTGOMERY COUNTY RURAL WATERSHEDS POLLUTANTS
SENECA - CLOPPER LAKE -
100 Qi
90 iii 80VI to -CQ 70 0 60e 50I 0 40 u l 30
C QJ 20ex
C 10to 0
J 0
$18
$16
$14 n
$12 I
$10 sect $08 ~ $06 0
VI
U $04
$02
$shy
_TPRemoval - - - TMDL Reduction Target
Implementation Phase ___Cost
Rank Restoration Strategy TP
Reduction (Ibsyr)
Incremental Cost (Million $)
Unit Cost (IbsvrMillion $)
1 Residential Education 33 001 6246
2 Underperforming BMP Retrofits 13 004 341 3 Riparian Buffer Reforestation 19 023 99 4 Priority Neighborhood ESD Retrofits 15 051 35 5 Public Property ESD Retrofits 7 075 99
C-9
-pj[fti
MONTGOMERY COUNTY URBAN WATERSHEDS POLLUTANTS 1It[~~JIlbitIL f bull~
LOWER MONOCACY
1 09 08 07 06 05 04 03 02 01
0
Implementation Phase
25
20 ~ c
15 ~ ~
10 - 0 u
5
0
_TSS
- - - Waste load Allocation _Cost
Rank Restoration Strategy
Sediment reduction
Incremental
Cost Unit Cost
tonsyear Million $ tonMilli
1 Street Sweeping 22 $007 3121
2 Underperforming BMP Retrofits 4 $010 389
3 Stream Restoration 37 $734 51
4 Riparian Buffer Reforestation 3 $109 25
5 Other Structural BMPs and ESD Strategies 10 $851 12
6 Priority Neighborhoods ESD Retrofits 2 $160 10
7 Non-residential ESD Retrofits 1 $132 10
C-10
MONTGOMERY COUNTY RURAL WATERSHEDS POLLUTANTS 1tlj~lIbiIalSlt~~II
1 09 08 07 06 05 04 03 02 01
0
$70
$60
$50 ~ c
$40 ~ ~ $30 - UI
$20 0 v
$10
$0
_ Phosphorus Load Reduction
- - - Waste Load Allocation ___ CostImplementation Phase
Rank Restoration Strategy TP Incremental Cost
Million $ Unit Cost
Ibsyr Ibs Million $ 1 Lawn Care Education 3670 01 37394
2 Underperforming BMP Retrofits 3499 08 4338
3 Other Potential Projects 3524 33 1076
4 High Priority Projects 252 04 685
5 Riparian Reforestation 762 26 298
6 Public Property Retrofits 5854 345 169
7 Priority Neighborhoods ESD Retrofits 796 65 123
8 Private Non-residential ESD Retrofits 1941 168 116
9 Completed Projects 53 00 00
c- 11
MONTGOMERY COUNTY RURAL WATERSHEDS POLLUTANTSal12hdJilats ~I~ ~ [ -
1 10 ii 5 09 9 1 08 8 II al- 07 7 1ii o 06 6
c
~ ~ 1 o E IV
05 04 03
5 4
3
~ 11 0 u
0 11 02 2 J o 01 1
t a 0 0 11 o
t 0
_ Phosphorus Reduction
- - - Waste Load Allocation
-Cost
Rank Restoration Strategy TP Incremental Cost
Million $ Unit Cost
Ibsyr Ibs Million $ 1 Lawn Care Education 3670 01 37394
2 Underperforming BMP Retrofits 3499 08 4338
3 Other Potential Projects 3524 33 1076
4 High Priority Projects 252 04 685
5 Riparian Reforestation 762 26 298
6 Public Property Retrofits 5854 345 169
7 Priority Neighborhoods ESD Retrofits 796 65 123
8 Private Non-residential ESD Retrofits 1941 168 116
9 Completed Projects 53 00 00
C-12

Montgomery County Coordinated Implementation Strategy - DRAFT
involvement opportunities to best harness the power of Montgomery Countys healthy
business economy
The county includes a fairly even split of males and females The majority of residents nearly
50 fall between the ages of 25 and 55 Only 15 of the population is aged 60 and above In
addition the majority of Montgomery County residents indicate their preferred language as
English however Spanish translations of stakeholder involvement opportunities will be
required in select watersheds to accommodate the 13 of county residents that indicate their
preferred language as Spanish Other potential target groups for translation for stakeholder
involvement include the Asian community as 11 of the countys population is Asian (mostly
Korean and Vietnamese) Because of this the Strategy and implementation plans will take
multilingual requirements into consideration for signage and other educational tools as well
MS4 Permit Coverage
The Countys most recent NPDES MS4 stormwater permit only covers runoff from
developments within the County area The following areas are excluded from the Countys MS4
permit area shown in Figure 22
bull Cities of Gaithersburg Rockville and Takoma Park
bull Maryland National Capital Park and Planning Commission (MNCPPC) lands
bull Washington Sanitary Sewer Commission (WSSC) land
bull Federal and State government owned land and facilities
bull Rural zoning
021611 G
Montgomery County Coordinated Implementation Strategy - DRAFT
MS4 Permit Area Montgomery County Maryland
(-i Gaithersbur9 ~
M Ro ckville
TkD m Parilt -Jr MNC PPC Lnds
0 5 3
Feder 1 and SI PropertyM i KbnelefS
M 0 I 2 ~- Federal and Sta1e Roads
~ i s Rural Zon ing
Figure 22 Areas outside the Montgomery County MS4 Permit Area
Impervious Surfaces
As previously mentioned the Countys MS4 Permit requires treatment of an additional 20 of
impervious cover not currently receiving treatment to the MEP Table 21 presents a summary
of the countywide impervious cover totals along with breakdowns by major land cover type
These land covers will be the focus of much of the Countys targeted effort to treat the 20
target
021611
Montgomery County Coordinated Implementation Strategy - DRAFT
Table 2llmpervious Surface Summary
Description
Total County Area 324552 100
Total Area of 1m ervious Surface 35965 _ _-----shy 11
County Area Subject to Stormwater Permit (1) 138649 43
Imllervious Cover Subject to Stormwater Permit 2) ~==5119====18o2 == ==== Areas of Impervious Surface (3)
Road 13607 38
Building 13073 36
Parking 22
Sidewalk 1069 3
Recreation (4) 347 1 1 Exclusions include Certain zoning codes parklands forests municipalities with own stormwater management
programs state and federal properties and state and federal maintained roads 2 Percent of County Jurisdictional Area subject to the Stormwater Permit 3 Impervious area within each category within the total County area 4 Recreation imperviousness excludes swimming pools
Implementation Plan Guidance Document
The Implementation Plan Guidance Document (revised October 252010) provides a road map
for how the implementation plans were created The primary sections of the Guidance
Document and a short description of each are provided in Appendix A
The Guidance Document divides BMPs into five classes or codes shown below The Guidance
Document also provides a list of BMPs and which code they fall under which is provided in
Appendix B
Code 0 Pretreatment Practices
Code 1 Non-performing BMPs No runoff reduction and no long term pollutant removal
Code 2 Under-performing BMPs Limited runoff reduction and low pollutant removal
Code 3 Effective BMPs No runoff reduction but moderate to high pollutant removal
Code 4 ESO BMPs High runoff reduction and moderate to high pollutant removal
Impervious Cover Accounting and Tracking
Montgomery County has GIS data layers that contain all the stormwater BMPs in the County
and their drainage areas In order to determine the 20 target for impervious cover treatment
021611
Montgomery County Coordinated Implementation Strategy - DRAFT
to the MEP the County analyzed their existing impervious cover and their existing BMP
database to determine how much impervious cover is currently being treated to the MEP
Several methods were considered based on a determination of the MEP standard compared to
existing treatment methods According to MDE guidance to be considered MEP a BMP must
capture at least the Water Quality Volume (WQv) (the first inch of rainfall) or the CPv volume
(26 inches of rainfall) The final method used for determining which BMPs are MEP and the
amount of impervious surface not treated to the MEP was as follows
1 All BMPs that were installed after 2002 or are classified as Code 4 were considered MEP
2 An analysis of typical Code 3 stormwater ponds installed after 1986 was performed to
determine if this class of BMPs met the definition of IVIEP Based on that analysis Code
3 BMPs constructed after 1986 are considered MEP
3 All other classes of BMPs not specified above are not considered MEP and are eligible
for retrofit
Table 22 below shows the breakdown of the impervious acres treated by BMP codes and era
(shaded areas are BMP codes treated to the MEP)
Table 22 Acres of Impervious Cover Treated by BMP Code and Design Era
Design Era Post2002 1986-2002 Pre1986 Blank Total
CIJ tl 0 u Q
~ co
0 28 711 24 132 895
1 33 555 1391 367 2346
2 41 299 12 23 375
3 75 2482 1437 267 4261
4 20 459 482 40 1001
Totals 198 4506 3345 828 8877
IC Credit 100 Code 3amp 4 Code 4 Total Acres treated to
MEP 198 2942 482 40 3661
Assuming a total countywide impervious acreage of 25119 acres and an impervious acreage
treated to the MEP of 3661 as shown in Table 22 there are currently 21458 acres of
untreated impervious area Twenty percent of 21458 equates to 4292 acres of impervious
area that must be restored over the current permit cycle
021611
Montgomery County Coordinated Implementation Strategy - DRAFT
Pollutant Load Tracking
In addition to tracking impervious cover it is necessary to compute existing pollutant loads and
projected reductions in loads as a result of applying storm water controls and BMPs The Center
for Watershed Protections (CWP) Watershed Treatment Model (WTM) version 20 (CWP 2001)
was the tool selected to conduct this analysis and track load reductions across a range of
implementation strategies
The WTM uses a spreadsheet model to calculate annual pollutant loads and runoff volumes
The model also accounts for the benefits contributed by a full suite of stormwater treatment
practices and programs The first step in the model calculates existing pollutant loads by adding
primary and secondary source loads then subtracting reductions according to existing
management practices The second step applies future management practices by subtracting
these calculated reductions from the existing loads Appendix B of the Guidance Document
provides a detailed explanation of the assumptions and steps in the modeling process
For each watershed the WTM was run under existing conditions with existing BMPs to
determine a baseline pollutant load for targeted pollutants The baseline period for non-TMDL
parameters was based on 2002 Maryland Department of Planning land useland cover data
coupled with the Countys existing urban BMP database Pollutants targeted included bacteria
Total Phosphorus (TP) Total Nitrogen (TN) Total Suspended Solids (TSS) and Trash Next a
series of model runs was developed for analyzing the pollutant load reduction effect that
various restoration strategies would have based on assumed levels of implementation for the
various strategies Individual restoration strategies that were sequentially modeled included
the following
bull Completed and High Priority Projects - these include projects already completed or high
priority structural BMPs scheduled for retrofit in the FYll-FY16 Capital Improvements
Program (CIP)
bull Low Priority Projects - these includes FY11-FY16 CIP projects that for various reasons
are considered a lower priority
bull Other Potential Projects - these include other projects in existing inventories that were
not listed in the previous two categories For the Anacostia they include projects in
Anacostia Restoration Plan (ARP) prepared by the Army Corp of Engineers
bull Public ESD Retrofits - These include small scale ESD practices applied to County-owned
buildings streets and parking lots and rights of way Examples include rainwater
harvesting green roofs upland reforestation soil compost amendments rooftop
disconnection green street retrofits and converting drainage ditches to dry swales
021611
Montgomery County Coordinated Implementation Strategy - DRAFT
These are Code 4 structures This category also includes other structural BMP upgrades
to existing County BMPs which were designated as under-performing or nonshy
performing
bull Private ESD Retrofits - These projects include ESD on commercial property and
residential property and include green roofs rain gardens and permeable pavement
bull Riparian Reforestation - Focuses primarily on tree planting for riparian buffer
restoration
bull Stream Restoration - Includes the use of natural materials such as rocks logs and native
vegetation to reduce pressure on eroded banks prevent down-cutting of the
streambed and restore the natural meander patterns and slope profiles found in stable
reference streams
bull Programmatic Practices - This category deals with potential pollutant reduction that can
be attributed and quantified through MS4 stormwater pollution prevention
improvements and better housekeeping on County land and facilities Also includes any
pollutant reductions due to product substitution (eg nitrogen and phosphorus limits in
fertilizer) operational programs (eg recycling) and enforcement This category also
deals with reduced pollutants that can be attributed and quantified through MS4
stormwater education (eg lawn care) and outreach aimed at pollution prevention
better housekeeping and increased stewardship
The naming convention applied for the model runs was WTM 10 (ie baseline) WTM 20 (Le
completed and high priority low priority and other potential projects) WTM 30 (Le public
and private ESD) WTM 40 (ie riparian reforestation and stream restoration) and WTM 50
(ie programmatic) Model runs were developed sequentially to yield incremental increases in
load reduction by strategy In practice however strategies can be applied in combination and
out of sequence to achieve targeted outcomes and the most cost-effective solutions A
summary of the scenarios is provided in Table 23 below
021611
Montgomery County Coordinated Implementation Strategy - DRAFT
Table 23 Summary of Watershed Treatment Model (WTM) Scenarios
Implementation Phase Description
The WTM was run under existing conditions approach
WTM Baseline Conditions with the MDP year 2002 land useland cover data and
existing BMPs
WTM 20 Completed as of
2009j High Priorityj Low
Priority and Other Potential
Projects
The WTM was run with a series of future management
practices which were proposed projects from the
County inventory of restoration sites These practices
cover new ponds retrofits of existing BMPs and some
ESD practices from the proposed projects list
The Countys inventory for other project types that
include public properties eg libraries and parkingWTM 30 ESD Strategies and
lots public schools and open section roads available Other Structural BMPs
for ESD retrofits was reviewed as were areas for
private property ESD retrofits
This category includes any pollutant reduction or volume
reduction that can be attributed to specific stream
WTM 40 Habitat rehabilitation wetland restoration and or riparian
Restoration reforestation projects planned for construction in the
watershed for the permit cycle
WTM 50 MS4 Programmatic See description above
Practices
TMDL Calibration and Tracking
Where TMDLs existed for individual watersheds the WTM was run under existing conditions
with existing BMPs based on the year in which the data was collected for TMDL development
The baseline pollutant load was then compared and normalized to the MDE-determined
baseline MS4 load for the TMDL pollutant Any BMPs with approved dates after the year in
which the data was collected for TMDL development were not included in the baseline
calculation but rather were counted towards meeting the TMDL reduction target
Once the normalized model was established reductions achieved through programs and
practices were tracked using the WTM scenarios based on the percent load reduction from
baseline toward meeting the TMDL required WLA The normalized baseline and WLA target are
determined and specified in the relevant TMDL documents developed by M DE
021611
Montgomery County Coordinated Implementation Strategy - DRAFT
3 WATERSHED IMPLEMENTATION PLANS AND RESTORATION POTENTIAL
The watershed implementation plans and pre-assessments developed in conjunction with the
Strategy are driven by regulatory requirements facing each watershed Table 31 summarizes
the drivers by watershed
Table 31 Restoration Objectives -
W~tershedSubwater~hed - Trash
4 bull - I _ _ -
Patuxent
Anacostia
Rock Creek
Great Seneca
Cabin John Creek
lower Monocacy
Watts BranchMuddy Branch
Dry and little Seneca
lower Potomac Direct
Table 32 presents the more detailed and quantitative aspects of the TMDl requirements for
the MS4 portion within each watershed The Strategy has been developed to meet the MS4
permit area WLA compliance targets presented in Tables 32
In addition to the individual watershed requirements there is a Countywide requirement to
comply with the wasteload allocations associated with urban areas under the Chesapeake Bay
TMDl which applies to nutrients and sediment There is an interim target established for 2017
where reductions from baseline conditions of 9 12 and 20 respectively for TN TP and
TSS are to occur Then by 2020 full compliance is required which correspond to reductions
from baseline conditions of 18 34 and 37 respectively for TN TP and TSS
021611
Montgomery County Coordinated Implementation Strategy - DRAFT
Table 32 TMDl Summary by Impairment
Watershed
Cabin John Creek
Rock 2007 Enterococci 970 453669 18195 Creek
Anacostia 2007 Enterococci 860 247809 29978 River
Aoacostia 2008 TN 788 206312 38959 River
Anacostia 2008 TP 797 20953 3947 Ibsyr River
Triadelphia 2008 TP 580 438 Reservoir
Rocky Gorge 2008 TP 480 4268 3628 Reservoir
Clopper Lake 2002 TP 393
Anacostia 2007 TSS 850 7682 River
Triadelphia 2008 TSS Reservoir Clopper 2002 TSS 00 13 13
Lake
Lower 2009 TSS 380010 172 Monocacy
River
Anacostia 2010 Trash 1000 228683 Ibsyr River
Adapted from 2010 Status of Approved Stormwater Waste load Allocations for NPDES Regulated Stormwater Entities in Montgomery County April 27 2010 by Jeff White MDE
Potential to Reduce Stormwater Pollutant loads
Within each of the implementation plans an analysis was developed that explored the
restoration potential for that watershed Cost was not a limiting factor for the analysis but
rather assumptions were made based on feasibility of implementation rates and consideration
of conflicts with typical site conditions with respect to site use utilities land ownership etc
For example it was assumed that 40 of large County-owned parking lots would be available
for stormwater retrofitting These assumptions are necessary for planning purposes where
detailed site investigations have not occurred However some level of implementation is
021611
Montgomery County Coordinated Implementation Strategy - DRAFT
reasonable to assume In addition all identified high priority and low priority County projects
that have the potential to be constructed were assumed to be implemented
Implementation cost and effectiveness (in terms of pollutant load reduced) was also tracked
through the process of determining watershed restoration potential which enables the
costbenefit evaluation of various strategies for a target parameter (eg tons of sediment per
dollar spent or billion MPN of bacteria per dollar etc) For example by tracking cost and
effectiveness it is possible to evaluate the relative costbenefit of a strategy like ESD versus a
non-structural programmatic practice Moreover the comparison of these two strategies is
going to be different depending on what parameter is being considered eg ESD may be more
cost effective for nutrient reduction but less cost effective for bacterial load reduction
The tables in Appendix C help to illustrate this point Specifically a series of summary charts
and tables have been developed that illustrate the cost effectiveness of the range of strategies
considered by watershed with respect to pollutant load reduction The summaries reflect the
full restoration potential developed for each watershed
It is also useful to compare strategy effectiveness and range of opportunity across watersheds
To facilitate this a series of tables were compiled that groups all watersheds together and
considers watershed restoration potential by strategy These summary tables are presented in
Tables 33 through 310
For this analysis stream restoration was treated as a special modeling case (Table 39) because
it was not tracked as a strategy that receives credit for impervious cover treatment and because
it requires a different pollutant load reduction tracking method based on linear feet of
implementation and the existing stream resource condition (good fair or poor IBI scores
received different pollutant removal credit) Further details on stream restoration modeling
are presented in the individual implementation plans and the Guidance Document
Not all WTM scenarios were modeled for all watersheds For example if there were no
previously identified completed high priority low priority or other potential projects within a
watershed they would appear as zeros for that individual watershed in Tables 33 through 36
Also for non-TMDl watersheds such as Great Seneca and Muddy Branch and Watts Branch
subwatersheds the public and private property ESD riparian reforestation and MS4
programmatic practices scenarios were not modeled due to the lack of regulatory drivers that
define pollutant removal targets
021611
Montgomery County Coordinated Implementation Strategy - DRAFT
Table 33 Cost and benefit summary for completed projects (WTM 20)
Watershed Total ESD PrOjects Incremental reduction from baseline ()
i Cost Numberof Impervious
Cost
I Impervious Trash control added TN TP TSS Bacteria
(million $) projects bullbull (ac)
(total) (total)
Anacostia 95 25 167 7 3 4 4 1 4 4
Cabin John 00 0 0 0 0 02 02 03 03 1
Rock Creek 44 6 212 13 1 2 2 3 3 2 i
I Triadelphia 00 0 0 0 0 0 0 0 0 0
Rocky Gorge 00 0 0 0 0 0 01 0 0 0
Lower Monocacy 00 0 0 0 0 0 0 0 0 0
Clopper lake 00 0 0 0 0 0 0 0 0 0
Great Seneca bull 06 2 11 0 0 1 1 I 1 0 2
MuddyWatts 00 0 0 0 0 0 0 0 0 0
Indudes Clopper lake Project count does not include stream restoration Pollutants with a TMDL are highlighted
Table 34 Cost and benefit summary for high priority projects (WTM 20)
Watershed I
I
Total ESD Projects Incremental reduction from baseline ()
Cost
(million $)
i Numberof
projects bullbull
Impervious
control added
(ac)
ICost (total)
Impervious
(total) TN
I TP TSS I TrashBacteria
Anacostia 64 33 148 65 16 2 2 06 2 2
Cabin John 16 6 88 19 2 3 3 3 3 1
Rock Creek 89 14 373 13 1 2 3 3 3 4
Triadelphia 00 0 0 04 0 0 0 0 0 0
I Rocky Gorge 04 2 5 77 27 06 06 07 06 1
Lower Monocacy 00 0 0 0 0 0 0 0 0 0
Clopper lake 00 0 0 0 010 0 0 0 0 0 Great Seneca bull 183 24 789 6 08 19 19 20 0 24
MuddyWatts 44 16 211 8 1 6 6 6 0 6
Indudes Clopper lake bullbull Project count does not indude stream restoration Pollutants with a TMDL are highlighted
Table 35 Cost and benefit summary for low priority projects (WTM 20)
I Watershed Total ESO Projects Incremental reduction from baseline ()
Numberof Impervious ICost 1m ~ i Cost Impervious
I (million $) projects bullbull
control added (total) (total)
TN TP Bacteria Trash
(ac)
I Anacostia 51 16 188 61 8 2 2 07 2 3
Cabin John 16 8 10 98 78 02 02 02 02 03
I Rock Creek 88 24 657 7 1 4 4 6 5 7
Triadelphia 040 1 20 100 100 05 05 06 05 1
Rocky Gorge 09 2 458 100 100 84 82 83 82 116 i
I Lower Monocacy 0 0 0 0 0 0 0 0 0 0 I Clopper lake 0 0 0 0 0 0 0 0 0 0
I Great Seneca bull 66 16 87 41 15 4 4 4 010 4
I MuddyWatts 20 6 26 84 33 0 0 1 0 0
Includes Clopper Lake Project count does not include stream restoration Pollutants wth a TMDL are highlighted
021611
Montgomery County Coordinated Implementation Strategy - DRAFT
Table 36 Cost and benefit summary for other potential projects (WTM 20)
I Watershed Total ESO Projects Incremental reduction from baseline ()
ICost Impervious I Cost
I I Trash INumber of
control added Impervious
TN TP TSS Bacteria (million $) projects bullbull
(ac) (total) (total)
i i
Anacostia 2492 497 2222 73 62 23 8 26 301
Cabin John 00840 1 5 0 010 01 01 01 01 01
Rock Creek 20 4 201 0 0 12 12 19 15 21
Triadelphia 00 0 0 010 0 00 00 00 00 00
Rocky Gorge 20 2 0 010 0 00 00 00 00 00
lower Monocacy 00 0 0 0( 0 00 00 00 00 0010
Clopper Lake 00 0 0 0 0 00 00 00 00 0010
Great Seneca bull 02 S S3 0 0 23 23 27 00 27
MuddyWatts 00 0 0 0 0( 00 00 00 00 0010
bull Includes Clopper Lake bullbull Project count does not include stream restoration Pollutants with a TMDL are highlighted
Table 37 Cost and benefit summary for ESO projects (WTM 30)
Watershed
I
Cost (million $) Impervious
control added
(ac)
Incremental reduction from baseline ()
ESDfor i ESO for private
public
property property
TN TP TSS Bacteria Trash
Anacostia 2378 21296 1813 20 21 7 22 27
Cabin John 878 10307 876 22 23 25 24 28
Rock Creek 2471 341 2427 30 30 33 32 35
Triadelphia 41 47 36 10 1010 11 11 20
Rocky Gorge 312 19 28S 26 27 32 30 46
lower Monocacy 86 29 53 14 15 15 15 010
Clopper lake 08 051 21 14 14 15 0 14
Great Seneca bull 00 0 0 010 0 0( 0( 010
MuddyWatts 00 a 0 0 01 010 0 0
bull Includes Clopper lake Pollutants with a TMDL are highlighted
Table 3B Cost and benefit summary for riparian reforestation (WTM 40)
IWatershed Cost (million $) Impervious
Incremental reduction from baseline ()
control added Habitat restoration (ac) TN TP TSS Bacteria Trash
Anacostia 1 6 0 0 0 01 02
Cabin John 777 39 1 2 lili
3
Rock Creek 24 119 2 2 2 5
Triadelphia 010 1 01 02 01 04 03
Rocky Gorge 25 12 1 2 2 3 8
lower Monocacy 11 S 3 3 3 4 0
Clopper Lake 023 2 4 4 2 010 4
Great Seneca bull 0 a 010 010 0 010 0
MuddyWatts 0 0 010 0 0 0 0
bull Includes Clopper lake Pallutonts with a TMDL are highlighted
021611
Montgomery County Coordinated Implementation Strategy - DRAFT
Table 57 Cost and benefit summary for stream restoration (WTM 40)
Watershed Stream Restoration Incremental reduction from baseline ()
Number of Impervious control
Cost (million $) added(ac) TN TP TSS Bacteria Trash projects
Anacostia 937 200 0 42 56 326 0 0
Cabinlohn 162 15 0 17 9 80 0 0
Rock Creek 201 30 a 9 710 100 0 0
Triadelphia 00 0 0 0 0 0 010 0
Rocky Gorge 191 18 I 0 10 7 36 0 O lower Monocacy 73 nla 0 7 10 32 010 0
Clopper Lake 00 a 0 0 0 0 0 0
Great Seneca It I 259 33 0 19 8 16 0 0
MuddyWatts 242 45 0 16 7 13 0 0
Includes Clopper Lake Pollutants with a TMDL are highlighted
Table 58 Cost and benefit summary for M54programmatlc practices (WTM 50)
Watershed Cost (million $) Incremental reduction from baseline ()
Programmatic
practices - M54
Impervious control
added (ac) TN TP TSS Bacteria Trash
Anacostia 36 0 9 9 10 8 82
Cabin John 047 0 15 14 0 10 0
Rockereek 12 0 11 11 0 7 0
Triadelphia 00056 a 23 3 0 0 0
Rocky Gorge 009 0 38 8 03 5 2
lower Monocacy 007 0 0 0 19 0 0
Clopper Lake 0Q1 0 61 30
~=r 0
Great Seneca 10 0 0 0 0 0Y0 0 0
MuddyWatts 0 0 0 0 0 0 0
bull Includes Clopper Lake Pollutants with a TMDL are highlighted
021611
Montgomery County Coordinated Implementation Strategy - DRAFT
4 COORDINATED IMPLEMENTATION STRATEGY
The Strategy has multiple objectives to accomplish whereby a challenging balance between
strategies and timeframe is required There isnt necessarily a correct answer in the process
but rather an optimized result that addresses an agreed upon suite of priorities The Strategy
presented here was primarily driven by known and established regulatory timeframes and
compliance endpoints Meeting these endpoints using the more cost effective approaches was
also given priority After this consideration was given to other known and important
approaches that stakeholders and the County have an interest in pursuing Specifically the
following compliance dates and objectives were conSidered in developing the Strategy over the
long-term (Table 41)
Table 41 Compliance Targets for Countywide Coordinated Implementation Strategy
Target Date
2015
2017
2020
Compliance Target
Meeting 20 impervious cover treatment requirement
within the MS4 Permit cycle
Meet the interim dates and targets for the Chesapeake
Bay TMDL which include specific regulated urban area
reductions by 2017 for nutrients and sediment (based
on Maryland Department of the Environments
Watershed Implementation Plan)
Meet the full compliance and targets for the
Chesapeake BayTIVIDL which include specific regulated
urban area reduction by 2020 for nutrients and
sediment (based on Maryland Department of the
Environments Watershed Implementation Plan)
Metric
~4300 acres of
Impervious Cover
9 12 and 20
respectively for TN TP
and TSS reductions
from baseline
conditions
18 34 and 37
respectively for TN TP
and TSS reductions
from baseline
conditions
2025
2030
Meet additional impervious cover treatment targets
associated with next MS4 Permit cycle (assumes
another 20 target)
Meet additional impervious cover treatment targets
associated with next MS4 Permit cycle (assumes
another 20 target)
Out year compliance with other watershed TMDLs
~3400 acres of
Impervious Cover (20
of impervious
remaining after 2015)
~2750 acres of
Impervious Cover (20
of impervious
remaining after 2020)
100 compliance with
MS4 Permit Area WLAs
021611
Montgomery County Coordinated Implementation Strategy - DRAFT
To meet the compliance targets outlined in Table 41 the following priorities were generally
followed
bull 100 implementation of completed high and low priority County projects in first five
years (by 2015)
bull Greater ESD focus in urban (as opposed to suburban and rural) watersheds initially Goal
for ESD in these watersheds on pUblic property in first five years is 10 and on private
property is 10 The level of implementation was largely driven by the 20 Countywide
impervious goal
bull 100 of Public Outreach Potential for all TIVIDl watersheds in first five years This was
pursued to address trash nutrient and bacteria loading which rely strongly on effective
outreach programs to modify behaviors
bull Generally limited strategies to the top four most cost effective per watershed
bull Habitat restoration (stream restoration and buffer reforestation) not pursued as priority
until after first five year period These programs emphasize greater pollutant reduction
efficiency rather than impervious cover treatment which is the primary focus for the
first permit cycle
The Strategy was informed by the individual watershed implementation plans for seven
watersheds which included the Clopper lake and Patuxent subwatersheds Therefore in order
to develop countywide estimates for pollutant load reduction (as is required by the Chesapeake
Bay TMDl) watershed area weighting was applied The process for developing the Countywide
strategy and individual watershed implementation plans was woven together Once the
restoration potential was determined from the individual plans the strategy and schedule was
compiled using the restoration potentials and the drivers listed above The final restoration
cost and schedule was then placed in the implementation plans
It is also worth noting that the high and low priority projects along with the other potential
projects strategies represent a static or fixed number of projects that have been identified by
the County For this analysiS this list of practices is not replenished and therefore once all
opportunities have been implemented other strategies are pursued In reality the County will
continue to develop and update its list of specific project opportunities and have these
available for implementation in future years
The output from this effort is presented in a series of tables ordered by target date in Appendix
D In addition Table 42 provides an overall summary of pollutant load reduction tracking
versus time Through inspection of Table 42 it can be seen that the Strategy meets the
021611
Montgomery County Coordinated Implementation Strategy - DRAFT
impervious cover treatment targets under the current MS4 permit (as well as projected targets
for 2020 and 2025 assuming a continued 20 treatment requirement) interim and final
Chesapeake Bay nutrient and sediment reduction targets by 2017 and 2020 respectively and
out year MS4 permit area WLA compliance for the majority of pollutants Exceptions include
meeting the bacteria WLA load reductions required for the Anacostia and Rock Creek
021611
Montgomery County Coordinated Implementation Strategy - DRAFT
Table 42 Projection by Phase for Watersheds and Pollutants PermitTMDL Targets
Watershed Fiscal Year 2015 2017 2020 2025 2030 2017 2020
Impervious Treated (acres) 1421 2393 3364 4272 4544
ESD ( Impervious) 26 44 61 69A 71
Cost (Million $) 160 307 486 732 820
E5D( Cost) 45 62 71 78 78
Anacostia Nitrogen 25 39 68 89A l00A 818 82
Phosphorus 27 42 77 100 100 812 81
i Sediment 47 72 100 l00A) l00A 875 88
Bacteria 21 33 46 59A 64 879 88
Trash 41 65 89 l00A) 100
Impervious Treated (acres) 1541 1961 2381 3625 3989
ESD ( Impervious) 17 28 36 57A 61
Cost (Million $) 87 172 262 566 658
ESD ( Cost) 7(JA 79 79A 89A 9(JA
Rock Creek Nitrogen 24 30 38 55 61
Phosphorus 25 3(JA 38 54 GfJA)
Sediment 38 50 92 l00A 100
Bacteria 21 27 33 5(JA 55 96(JA 96
Trash 17 24 31 5(JA) 55
Impervious Treated (acres) 187 380 570 1018 1018
ESD ( Impervious) 52 72 78 87A 87A
Cost (Million $) 23 65 114 215 219
ESD ( Cost) 92 91 86 90 88
Cabin John Nitrogen 21 27A 39A 55 58 Phosphorus 2(JA 26 35 49 51
Sediment 6 17 GfJA 91 100
Bacteria 16 22 27 4(JA) 40 31 31
Trash 6 12 19 34 34
Impervious Treated (acres) 237 237 237 237 237
ESD ( Impervious) 4 4 4 4 4
Cost (Million $) 6 8 19 25 31
ESD ( Cost) 32 27A 11 8 7
Muddy Watts Nitrogen 6 7 15 18 22
Phosphorus 6 7 10 12 13 Sediment 7 8 14 17 2(JA
Bacteria 0 (JA 0 (JA 0 i Trash 6 6 6 6 6
bull Impervious Treated (acres) 901 921 941 941 941 ESD ( Impervious) 2 2 2 2 2
Cost (Million $) 26 48 SO 51 52 ESD ( Cost) 15 8 8 8 8
Great Seneca Nitrogen 24 41 43 44 45
Phosphorus 24 32 34 34 34
i Sediment 26 41 43 44 44
I Bacteria (JA) 0 0 0 (JA
Trash 31 32 33 33 33
021611
Montgomery County Coordinated Implementation Strategy - DRAFT
Pe rmitTMDL Targets
Watershed Fiscal Year 2015 2017 2020 2025 2030 2017 2020
Clopper
Impervious Treated (acres) 0 6 12 22 22
ESD ( Impervious) 0 86 86 92 92
Cost (Million $) 0 0 1 2 2
ESD ( Cost) 0 72 73 84 84
Nitrogen 61 67 72 79 79
Phosphorus 30 36 41 48 48 45 45
Sediment 0 5 10 17 17
Bacteria 0 0 0 0 0
Trash 0 6 11 18 18
Lower Monocacy
Impervious Treated (acres) 1 16 32 58 58
ESD ( Impervious) 100 85 84 91 91
Cost (Million $) 0 4 11 18 20
ESD ( Cost) 100 85 54 63 58
Nitrogen 0 5 14 22 24
Phosphorus 0 5 16 26 28
Sediment 0 5 46 61 69 608 61
Bacteria 0 6 12 19 19
Trash 0 0 0 0 0
Rocky Gorge
Impervious Treated (acres) 11 88 165 307 307
ESD ( Impervious) 64 89 90 95 95
Cost (Million $) 3 17 40 70 75
ESD ( Cost) 55 82 64 73 68
Nitrogen 47 55 6710 82 85
Phosphorus 17 25 36 52 53 15 15
Sediment 10 19 45 7(J1o 79
Bacteria 14 23 32 47 47
Trash 15 30 46 68 68
Triadelphia
Impervious Treated (acres) 3 12 20 38 38
ESD ( Impervious) 100 98 97 99 99
Cost (Million $) 1 3 5 9 9
ESD ( Cost) 99 98 98 99 99
Nitrogen 24 27 29 34 34
Phosphorus 4 7 9 14 14 15 15
Sediment 1 4 6 12 12
Bacteria 1 4 6 12 12
Trash 2 6 11 21 21
Countywide
Impervious Treated (acres) 4302 6014 7722 10518 11154 6008 7723
ESD ( Impervious) 18 34 47 6(J1o 63
Cost (Million $) 305 622 987 1687 1884
ESD ( Cost) 53 66 7(J1o 8(J1o 80
Nitrogen 18 25 36 46 51 9 2(J1o
Phosphorus 17 23 34 44 46 12 34
Sediment 23 34 54 6(J1o 62 20 37
Bacteria 11 15 20 28 30
Trash 18 26 33 41 42
Assumptio~s
1 Does no~ includerepeated Outreach and Education costs beyond FY2015
2 Does not include ~n inflation multiplier
021611
Montgomery County Coordinated Implementation Strategy - DRAFT
Summary of Individual Implementation Plans
A summary of the general considerations and prioritization for each watershed implementation
plan is provided below
Anacostia - For the first permit cycle (through 2015) a priority was placed on full
implementation of completed high and low priority projects Next implementation of a third
of the other potential projects was targeted as a large number of these were identified in
conjunction with the USACEs Anacostia Watershed Restoration Plan efforts ESD was
emphasized on both public (10) and private property (10) Finally outreach (25) and
stream restoration (12) are targeted for pollutant load reduction but are not credited towards
impervious cover credit In future permit cycles the remainder of the other potential projects
are targeted along with ESD and a limited amount of riparian reforestation for impervious cover
and pollutant load reduction Outreach and stream restoration are significant strategies
pursued for load reduction benefits Nutrient and sediment MS4 permit area WLAs are met by
2030 but bacteria load reduction does not meet MS4 permit area WLA compliance The
remaining bacteria reduction is believed to be associated with urban wildlife sources Unless
intense urban wildlife management practices are implemented this remaining load reduction
will not be possible
Rock Creek- For the first permit cycle (through 2015) a priority was placed on full
implementation of complete high and low priority projects Next 25 implementation of
other potential projects was targeted ESD was emphasized on both public (10) and private
property (10) with private property implementation being linked to Rainscapes Program
success Finally outreach (100) and stream restoration (22) are targeted for pollutant load
reduction but are not credited towards impervious cover credit In future permit cycles the
remainder of the other potential projects are targeted along with ESD and riparian
reforestation for impervious cover and pollutant load reduction Stream restoration is a
significant strategy pursued for load reduction benefits The bacterial load reduction does not
meet MS4 permit area WLA compliance However the remaining bacterial load is believed to
be associated with urban wildlife sources Unless intense urban wildlife management practices
are implemented this remaining load reduction will not be possible
Cabin John Creek - Similar to the other two more urban watersheds in the County during the
first permit cycle (through 2015) a priority was placed on full implementation of complete high
and low priority projects Fewer opportunities exist overall compared to the Anacostia and Rock
Creek Next 25 implementation of other potential projects was targeted ESD was
emphasized on both public (10) and private property (10) Finally outreach (100) was
021611
Montgomery County Coordinated Implementation Strategy - DRAFT
targeted for pollutant load reduction but not credited towards impervious cover credit No
riparian reforestation or stream restoration was targeted due to limited or no opportunities In
future permit cycles the remainder of the other potential projects are targeted along with ESD
and some riparian reforestation for impervious cover and pollutant load reduction The
bacteria load reduction meets MS4 permit area WLA compliance by 2025
Muddy BranchWatts Branch - During the first permit cycle (through 2015) a priority was
placed on full implementation of complete high and low priority projects Fewer opportunities
exist overall compared to the Anacostia and Rock Creek Watersheds No other strategies were
pursued as there are no existing TMDLs in the Muddy BranchWatts Branch subwatersheds In
future permit cycles previously identified stream restoration projects are implemented for
pollutant load reduction
Great Seneca Creek - This watershed implementation plan is unique in that it includes the small
Clopper Lake subwatershed which has a TMDL for phosphorus Even with the TMDL there are
limited identified opportunities to pursue in the Clopper Lake subwatershed in part due to the
limited area of the subwatershed within the County MS4 permit area During the first permit
cycle (through 2015) a priority was placed on full implementation of complete high and low
priority projects within Great Seneca Creek subwatershed No opportunities exist for these
strategies in Clopper Lake However full outreach was applied in Clopper Lake in the first
permit cycle In future years other potential projects ESD on public and private property and a
small amount of riparian reforestation (in Clopper Lake) is pursued The Clopper Lake WLA for
phosphorus within the MS4 permit area is met
Patuxent - During the first permit cycle through 2015 a priority was placed on full
implementation of complete high and low priority projects Far fewer opportunities exist
overall compared to the Anacostia and Rock Creek A limited amount of ESD on private land
and stream restoration was pursued Finally outreach (100) was targeted for pollutant load
reduction (primarily nutrients) but not credited towards impervious cover credit No riparian
reforestation was targeted within the MS4 Permit area due to cost effectiveness in the Rocky
Gorge subwatershed and limited opportunities in the Triadelphia subwatershed In future
permit cycles ESD on private and public land is pursued more substantially as is stream
restoration A limited amount of riparian reforestation achieves some impervious cover and
pollutant load reduction The Rocky Gorge phosphorus WLA within the MS4 permit area is met
easily and the Tridelphia phosphorus WLA is also met but with a longer timeframe needed for
compliance
021611
Montgomery County Coordinated Implementation Strategy - DRAFT
Lower Monocacy Creek -lower Monocacy Creek is the most rural watershed in the County and
has the least amount of area subject to the County MS4 permit In addition there are no preshy
identified restoration projects within the watershed Therefore during the first permit cycle
(through 2015) only a very small amount (5) of private property ESD is pursued It is not until
the second permit cycle that more focus is placed on private and public ESD as well as stream
restoration and programmatic strategies such as street sweeping to target sediment loads
associated with the TM Dl In future permit cycles stream restoration is pursued for pollutant
load reduction The sediment WlA within the MS4 permit area is projected to be met around
2025
Countywide - The Countywide effort was driven by impervious cover treatment targets and
Chesapeake Bay TMDl2017 and 2020 reduction targets associated with sediment and nutrients
for urban MS4s For impervious cover it was assumed that a 20 target would be required for
each five-year permit cycle The Bay TMDl targets for urban MS4 areas were easily met for all
pollutants in 2017 and easily met for nitrogen and sediment but more difficult to meet for
phosphorus in 2020
Public Outreach and Stewardship
The County recognizes and is committed to the increasingly important role that public outreach
and stewardship will play if improved water quality conditions are going to be achieved
countywide While the County currently has a very active and layered outreach program the
model requires changes that will result in broader stakeholder groups serving as the leaders
and primary champions for clean water in their communities This includes greater participation
from minority and faith-based groups business consortiums schools neighborhood
associations and civic groups Additionally the new model requires revisiting current
initiatives carried out by the various County agencies to look for better and more efficient ways
to communicate messages cross-train and create synergies that result in greater engagement
greater awareness and sustained changes in behavior
Within each implementation plan specific suggestions for outreach and education
opportunities are identified In addition Appendix E of this Strategy contains practice sheets
which highlight targeted restoration activities for the County to develop and refine A total of
eight practices have been identified that can be adopted countywide or in more targeted
watershed areas where there are specific water quality issues to address Many of the
practices build upon existing County programs but require a much broader reach to new
partner groups Program start up costs are suggested and were used to for cost estimates
associated with Countywide strategy The highlighted practices include
021611
Montgomery County Coordinated Implementation Strategy - DRAFT
bull Pet Waste Pickup Education and Outreach Campaign
bull Lawn Stewardship Education and Outreach Campaign
bull Anti-littering Education and Outreach Campaign
bull Innovative Stormwater Management Awareness Campaign
bull Stream Stewards Education and Outreach Campaign
bull Riparian Reforestation Education and Outreach Campaign
bull Roof Runoff Reduction Education and Outreach Campaign
bull Parking Lot Recharge Value Education and Outreach Campaign
Start up costs by practice along with an overall five year cost estimate are provided in Table
43 Start up timeframes are assumed to be up to 18 months
Table 43 Outreach Start Up and 5-Year Cost Projections
Practice Practice Start Up Cost
Pet Waste Pickup $240500
Lawn Stewardship $301 600
Anti-Littering $175050
Stormwater Management Improvements Awareness $50450
Stream Stewards $74825
Riparian Reforestation $30575
Roof Runoff Reduction $101400
Parking Lot Recharge Value $41500
Estimated Start Up Total $744900
5-Year Outreach Budget Projection $2650000
These eight practice sheets provide specific costs and timelines for implementation They also
provide suggestions for measuring program success These practice sheets along with the
specific recommendations in the implementation plans make up the Public Outreach and
Education Campaign
Trash Reduction
Most of the implementation plans have to address trash loadings to meet requirements of the
Potomac Trash Treaty that is referenced in the County1s MS4 Permit In addition the Anacostia
Trash TMDL has recently been accepted by MDE and the EPA According to the Anacostia
021611
Montgomery County Coordinated Implementation Strategy - DRAFT
TMDl there is reasonable assurance that the goals of the Treaty and TMDl can be met with
proper watershed planning implementing pollution-reduction BMPs and using strong political
and financial mechanisms
Currently the County has a number of activities which target trash reduction They include the
following
bull Adopt-a-Road Program through DOT which focuses on public awareness and involvement in trash management There are 205 participants who adopted road segments and agreed to six major road cleanups per year
bull Storm Drain Marking through DOT bull Support for illegal dumping enforcement outreach and research and monitoring bull Partnership with DOT to conduct street sweeping covering about 2500 curb miles and
occurring once a year
bull Partnership with the Park Police to monitor illegal dumping which combined enforces 300-400 actions a year
bull Non-residential and residential recycling programs through Solid Waste Services (SWS) bull Transit stop trash management program at 600 bus stops countywide supported by DOT
Transit Services
In addition to continuing these efforts a number of trash good-housekeeping efforts have been
proposed as part of this Strategy A detailed description of the quantitative methods and
strategies applied can be found in Appendix E of the Guidance Document In general the
following six trash-reduction strategies are recommended
1 Significantly increase funding for trash reduction programs 2 Create and enhance regional partnerships and coordination among businesses
environmental groups individual citizens and government at all levels and in all jurisdictions
3 Improve peoples awareness knowledge and behavior relating to littering and illegal dumping
4 Promote the greater introduction and use of effective trash-reduction technologies and approaches
5 Improve enactment and enforcement of laws to reduce trash 6 Increase trash monitoring-related data collection generation and dissemination efforts
The Anacostia watershed implementation plan provides an outline of the actions that will be
taken through the first permit cycle to reduce trash The range of programs and practices
specially aimed at reducing trash inputs to roads and streams that will be targeted include
reduce reuse and recycle campaigns littering and illegal dumping enforcement stream
cleanups and street sweeping These measures are in addition to any trash trapped and
021611
Montgomery County Coordinated Implementation Strategy - DRAFT
removed by structural practices which are computed using the WTM The plan shows that the
trash TMDl can be met by 2025 at a cost of 732 million dollars
Adaptive Management Monitoring and Reporting
Sound implementation strategies require assessment and effective adaptation to respond to
new information changing conditions new technologies and lessons learned This will be the
basis of the plan that will be used when benchmarks are not met and the projected funding is
inadequate
Adaptive management requires monitoring of a variety of measures that can be used to
determine whether progress is being made towards meeting the Countywide water quality
objectives Ultimately it is the instream water quality and the loading limits with respect to the
TMDls that determine the success of implementation however there are many interim
measures that can also be correlated to success which are worthwhile pursuing
Surface water monitoring can be an expensive and time consuming undertaking Montgomery
County is fortunate to have an extensive Countywide stream monitoring network that can serve
as a foundation for providing spatial and temporal data to indicate stream health The Countys
MS4 Permit also outlines the required assessment of controls which includes chemical
biological and physical monitoring Specifically the permit calls for the County to continue
their watershed restoration monitoring of the lower Paint Branch subwatershed and physical
monitoring ofthe Clarksburg Special Protection area In addition to the existing monitoring
network the County will continue tracking and data reporting associated with levels of
implementation (eg acres of impervious cover treated areas of buffer planted miles of
stream restored miles of streets swept) For measuring effectiveness of outreach and
stewardship efforts other types of monitoring and reporting are planned that include before
and after attitude surveys frequency of website visits and information requests
For many restoration strategies it may be difficult to tease out their individual effectiveness in
terms of pollutant load reductions but collectively the monitoring that occurs should provide
adequate insight into the overall effectiveness of a layered implementation strategy
In addition to the monitoring and assessment the County will be reporting results on an annual
basis as part of their NPDES MS4 Permit annual report The MS4 Permit requires annual
reporting of the following
021611
Montgomery County Coordinated Implementation Strategy - DRAFT
bull The status of implementing the components of the stormwater management program
that are established as permit conditions
bull A narrative summary describing the results and analyses of data including monitoring
data that is accumulated throughout the reporting year
bull Expenditures for the reporting period and the proposed budget for the upcoming year
bull A summary describing the number and nature of enforcement actions inspections and
public education programs
bull The identification of water quality improvements and documentation of progress
toward meeting applicable WLAs developed under EPA approved TMDLs and
bull The identification of any proposed changes to the Countys program when WLAs are not
being met
The County will build upon annual reporting that has historically occurred to meet permit
requirements and will supplement this reporting with tracking table summaries that quantify
implementation activities for the range of strategies pursued during that year and the
associated treatment (eg impervious cover treated pollutant load reduced education and
outreach partners established etc) Cost will also be tracked in association with rates of
implementation This level of performance will then be compared with countywide strategy
targets (eg progress towards meeting WLAs) associated with key performance dates such as
those presented in Table 41 The level of progress achieved by the County will then feed into
the adaptive management approach described above
Organization Needs to Implement Strategy
Montgomery County DEP staff possesses substantial expertise and institutional knowledge that
yields many positive outcomes and efficient processes under the current pace of restoration
and permit compliance activities Under this strategy however the pace of implementation is
required to significantly increase Based on an increase in the level of implementation it is
reasonable to assume that additional capacity may be needed to provide sufficient oversight
and management of all the projects
Another critical element of this strategy is the recognition and commitment to pursuing
outreach initiatives that build community capacity by targeting new partner groups that
provide the necessary leadership oversight and sustained effort to change behaviors and
foster stewardship The County currently carries out many well established and managed
outreach programs but it may require additional focus across County agencies and
departments for these partnerships to become established and thrive
021611 G
Montgomery County Coordinated Implementation Strategy - DRAFT
Through the implementation process and the monitoring and reporting that is required large
amounts of data will be generated Technological advances happen so rapidly in this day and
age it will be important for the County to stay current with technology and methods so that
more efficient and cost-effective data management and reporting will be possible The County
currently relies on a detailed and sophisticated GIS to spatially locate projects and manage
tables of data related to projects The growth and development of this spatial database will be
a critical component of the reporting and tracking capability of the County These databases
generate the input data that are used to measure progress towards baseline loading targets
Regular review and upkeep of the data as well as routine summarization of progress (annually
at a minimum) will likely require additional dedication of staff This is especially the case during
periods where the implementation rate of structural practices in the ground is accelerated
021611
Montgomery County Coordinated Implementation Strategy - DRAFT
Appendix C - Restoration Potential by Watershed
021611
c-
04 03 02 01
a
_ Nitrogen Load Reduction
--shy TMDL WLA Target
_Cost
MONTGOMERY COUNTY URBAN WATERSHEDS POLLUTANTS _Bk)~Ibilats ~1~ l~ fjfsi --
Rank
1
2
3
4
5
6
7
8
9
10
11
Restoration Strategy TN reduction
Ibsyr
Pet Waste Education 15169
Retrofit of Underperforming BMPs 1769
Stream Restoration 72423
Completed Projects ~43 High Priority Projects 3260
Other Potential Projects 43276
Habitat Restoration 224
Public Property ESD Retrofits 18270
Priority Neighborhoods ESD Retrofits 9271
Private Non-residential ESD Retrofits 5594
Street Sweeping -
Incremental Cost Unit Cost
Million $ IbsMillion $ 088 17193
120 1475
9304 778
948 701
635 513
25430 170
141 158
23655 77
13278 70
8018 70
124 -
Qj c
Qj
nI CXI
o -f-
1 09 08 07 06 05
$900 $800 $700
~ $600 c $500 ~ $400 $300 0 u $200 $100
$shy
~~mf il_~IJrt~
MONTGOMERY COUNTY URBAN WATERSHEDS POLLUTANTS ItfiQ14lbilJts i~5 [i
1 $900 Qj
09 $8005 iii en 08 $700
~co 07 $600 co - til
06 $500 ~ 05- $400 ~ 04 en$300 003 u $20002
en $100I 01 o 0 $shys Q en o
s Q
Phosphorus Load Reduction
--- TMDL WLA Target
__Cost
I Rank I
1
2
3
4
5
6
7
8
9
Restoration Strategy
Pet Waste Education
Retrofit of Underperforming BMPs
Stream Restoration
Completed Projects
High Priority Projects
Habitat Restoration
Other Potential Projects
Public Property ESD Retrofits
Priority Neighborhoods ESD Retrofits
10 I Private Non-residential ESD Retrofits
11 Street Sweeping
TP reduction Incremental Cost Unit Cost
Ibsyr Million $ IbsMillion $ 1979 088 2243
247 120 206
13097 9304 141
915 948 96
451 635 71
37 141 26
6067 25430 24
2546 23655 11
1294 13278 10
781 8018 10
- 124 -
MONTGOMERY COUNTY URBAN WATERSHEDS POLLUTANTS IItQjQhabillt$middot
Cii 5 Cii 11 It CD
6 ~ r o ~ s
0 ltIIa r ltII e c ltII III
1 09 08 07 06 05 04 03 02 01
0
$900
$800 $700
v$600 r
0 $500 == $400 $300 11
0 u $200 $100
$shy
_ Sediment load Reduction
--- TMDl WlA Target
__Cost
Rank Restoration Strategy
Sediment reduction
Incremental Cost
Unit Cost
tonsyr Million $ tonsMillion $ 1 Street Sweeping 800 124 645
2 Stream Restoration 25057 9304 269
3 Retrofit of Underperforming BMPs 25 120 21
4 Completed Projects 97 948 10
5 High Priority Projects 47 635 7
6 Other Potential Projects 660 25430 3
7 I Public Property ESD Retrofits 272 23655 1
8 Priority Neighborhoods ESD Retrofits 139 13278 1
9 Private Non-residential ESD Retrofits 84 8018 1
10 Habitat Restoration 2 141 1
11 Pet Waste Education - 088 -
C-3
MONTGOMERY COUNTY URBAN WATERSHEDS POLLUTANTS
-QI5 5i ~
1 09 08 07 06 05 04 03 02 01
0
$900
$800
$700
$600 ~ 0
$500 == $400 $300 11
0 u $200
$100
$shy
--shy TMDL WLA Target
___ Cost
Rank Restoration Strategy
Enterrococci reduction
Incremental Cost
Unit Cost
Billion MPNyr Million $ Billion MPN Million $
1 Pet Waste Education 19643 088 22263
2 Retrofit of Underperforming BMPs 2781 120 2318
3 Completed Projects 10441 948 1101
4 High Priority Projects 5120 635 806
5 Other Potential Projects 69895 25430 275
6 Riparian Reforestation 310 141 219
7 Public Property ESD Retrofits 29025 23655 123
8 Priority Neighborhoods ESD Retrofits 14777 13278 111
9 Private Non-residential ESD Retrofits 8917 8018 111
10 Stream Restoration - 9304 -
11 Street Sweeping - 124 I -
~ I~~~i MONTGOMERY COUNTY URBAN WATERSHEDS POLLUTANTS 1tI2~mL ~ I~I
~$ I -~-- I
100 90 80 70 60 50 40 30 20 10
0
$900 $800 $700 $600 $500 $400 $300 $200 $100 $shy
vi c
~ 5 11 0 u
Implementation Phase
Potential Trash Incremental Unit Cost
I
Rank Restoration Strategy Reduction Cost
Ibsyear Million $ IbsMillion $ 1 Recycling Education and Investigations 51654 02 238837
2 Plastic Bag Ban and Misc Enforcement 63546 13 48882
3 Anti-litter Campaign Education 23J61 09 26930
4 Retrofit of Underperforming BMPs 1144 12 954
5 Completed Projects 6598 95 696
6 High Priority Projects 2786 64 439
7 Other Potential Projects 56341 2543 222
8 Habitat Restoration 266 14 188
9 Street Sweeping 204 12 164
10 Public Property ESD Retrofits 25348 2366 107
11 Priority lIeighborhoods ESD Retrofits 12529 1328 94
12 Private Non-residential ESD Retrofits 7547 802 94 ru Stream Restoration - 930 -14 Pet Waste Education - 09 -
C-5
MONTGOMERY COUNTY URBAN WATERSHEDS POLLUTANTS
CABIN JOHN
1 250
__CostImplementation Phase
09 08 07 06 05 04 03 02 01
0
200 ~ c
150 g E
100 - ltII 0 u
50
0
_E Coli
- - - Waste Load Allocation
Rank Restoration Strategy
E coli reduction
Incremental Cost
Unit Cost
Billion
MPNyr Million $
Billion MPN
Million $ 1 Pet Waste Education 4388 $05 9436
2 Underperforming BMP Retrofits 1892 $19 1022
3 High Priority Projects 1289 $16 800
4 Riparian Reforestation 1133 $78 146
5 Other Potential Projects 148 $17 86
6 Public Property ESD Retrofits 4AOO $860 Sl 7 Private Non-residential ESD Retrofits 1618 $392 41
8 Priority Neighborhoods ESD Retrofits 2633 $638 41
9 Completed Projects 112 $00 0
C-6
MONTGOMERY COUNTY URBAN WATERSHEDS POLLUTANTS 1Itf~~Jabitm
ROCK CREEK
1 $700 Qj5 09
o
_
$600 Qj 08
111 $500 ~ampl 07 c
t5 06 $400 ~ e 05 ~ $3005 04 - 111tl 03 $200 0 u-6 02
$100J 01 $-
Enterrococci
- - - Waste load Allocation Implementation Phase
__Cost
Rank Restoration Strategy
Enterrococci reduction
Incremental Cost
Unit Cost
Billion MPNyr Million $ Billion MPN Million $
Et Pet Waste Management 35734 118 30190
Underperforming BMP Upgrades
Other Potential Projects
28800
30239
577
1083
4995
2792
4 Completed Projects 12131 444 2734
5 High Priority Projects 14239 890 1600
6 Riparian Reforestation 18999 2384 797
7 County Property ESD Retrofits 54519 24136 226
8 Private Residential ESD Retrofits 35230 17737 199
9 Private Non-residential ESD Retrofits 32A86 16380 198
C-7
MONTGOMERY COUNTY URBAN WATERSHEDS POLLUTANTS _f~~pabitafS (fi~r ~~ l-middotshy
ROCK CREEK
100 $900 90 $800 80 $700 u70 $600 c 60 2$50050 -~$40040
lt1$300 030 $200 u
20 10 $100
0 $shy
Implementation Phase
Rank Restoration Strategy Trash Reduction
Incremental Cost
Unit Cost I
Ibsyear Million $ IbsMillion $ 1 Other Potential Projects 16038 1085 1478
2 Underperforming BMP Upgrades 6756 577 1172
3 Completed Projects 4217 444 950
4 High Priority Projects 6366 890 715
5 Riparian Reforestation 9237 2384 387
6 Public Property ESD Retrofits 24587 24136 102
7 Priority Neighborhoods ESD Retrofits 16155 17737 91
8 Private Non-residential ESD Retrofits 14793 16380 90
9 Pet Waste Education - 118 -
(-8
MONTGOMERY COUNTY RURAL WATERSHEDS POLLUTANTS
SENECA - CLOPPER LAKE -
100 Qi
90 iii 80VI to -CQ 70 0 60e 50I 0 40 u l 30
C QJ 20ex
C 10to 0
J 0
$18
$16
$14 n
$12 I
$10 sect $08 ~ $06 0
VI
U $04
$02
$shy
_TPRemoval - - - TMDL Reduction Target
Implementation Phase ___Cost
Rank Restoration Strategy TP
Reduction (Ibsyr)
Incremental Cost (Million $)
Unit Cost (IbsvrMillion $)
1 Residential Education 33 001 6246
2 Underperforming BMP Retrofits 13 004 341 3 Riparian Buffer Reforestation 19 023 99 4 Priority Neighborhood ESD Retrofits 15 051 35 5 Public Property ESD Retrofits 7 075 99
C-9
-pj[fti
MONTGOMERY COUNTY URBAN WATERSHEDS POLLUTANTS 1It[~~JIlbitIL f bull~
LOWER MONOCACY
1 09 08 07 06 05 04 03 02 01
0
Implementation Phase
25
20 ~ c
15 ~ ~
10 - 0 u
5
0
_TSS
- - - Waste load Allocation _Cost
Rank Restoration Strategy
Sediment reduction
Incremental
Cost Unit Cost
tonsyear Million $ tonMilli
1 Street Sweeping 22 $007 3121
2 Underperforming BMP Retrofits 4 $010 389
3 Stream Restoration 37 $734 51
4 Riparian Buffer Reforestation 3 $109 25
5 Other Structural BMPs and ESD Strategies 10 $851 12
6 Priority Neighborhoods ESD Retrofits 2 $160 10
7 Non-residential ESD Retrofits 1 $132 10
C-10
MONTGOMERY COUNTY RURAL WATERSHEDS POLLUTANTS 1tlj~lIbiIalSlt~~II
1 09 08 07 06 05 04 03 02 01
0
$70
$60
$50 ~ c
$40 ~ ~ $30 - UI
$20 0 v
$10
$0
_ Phosphorus Load Reduction
- - - Waste Load Allocation ___ CostImplementation Phase
Rank Restoration Strategy TP Incremental Cost
Million $ Unit Cost
Ibsyr Ibs Million $ 1 Lawn Care Education 3670 01 37394
2 Underperforming BMP Retrofits 3499 08 4338
3 Other Potential Projects 3524 33 1076
4 High Priority Projects 252 04 685
5 Riparian Reforestation 762 26 298
6 Public Property Retrofits 5854 345 169
7 Priority Neighborhoods ESD Retrofits 796 65 123
8 Private Non-residential ESD Retrofits 1941 168 116
9 Completed Projects 53 00 00
c- 11
MONTGOMERY COUNTY RURAL WATERSHEDS POLLUTANTSal12hdJilats ~I~ ~ [ -
1 10 ii 5 09 9 1 08 8 II al- 07 7 1ii o 06 6
c
~ ~ 1 o E IV
05 04 03
5 4
3
~ 11 0 u
0 11 02 2 J o 01 1
t a 0 0 11 o
t 0
_ Phosphorus Reduction
- - - Waste Load Allocation
-Cost
Rank Restoration Strategy TP Incremental Cost
Million $ Unit Cost
Ibsyr Ibs Million $ 1 Lawn Care Education 3670 01 37394
2 Underperforming BMP Retrofits 3499 08 4338
3 Other Potential Projects 3524 33 1076
4 High Priority Projects 252 04 685
5 Riparian Reforestation 762 26 298
6 Public Property Retrofits 5854 345 169
7 Priority Neighborhoods ESD Retrofits 796 65 123
8 Private Non-residential ESD Retrofits 1941 168 116
9 Completed Projects 53 00 00
C-12
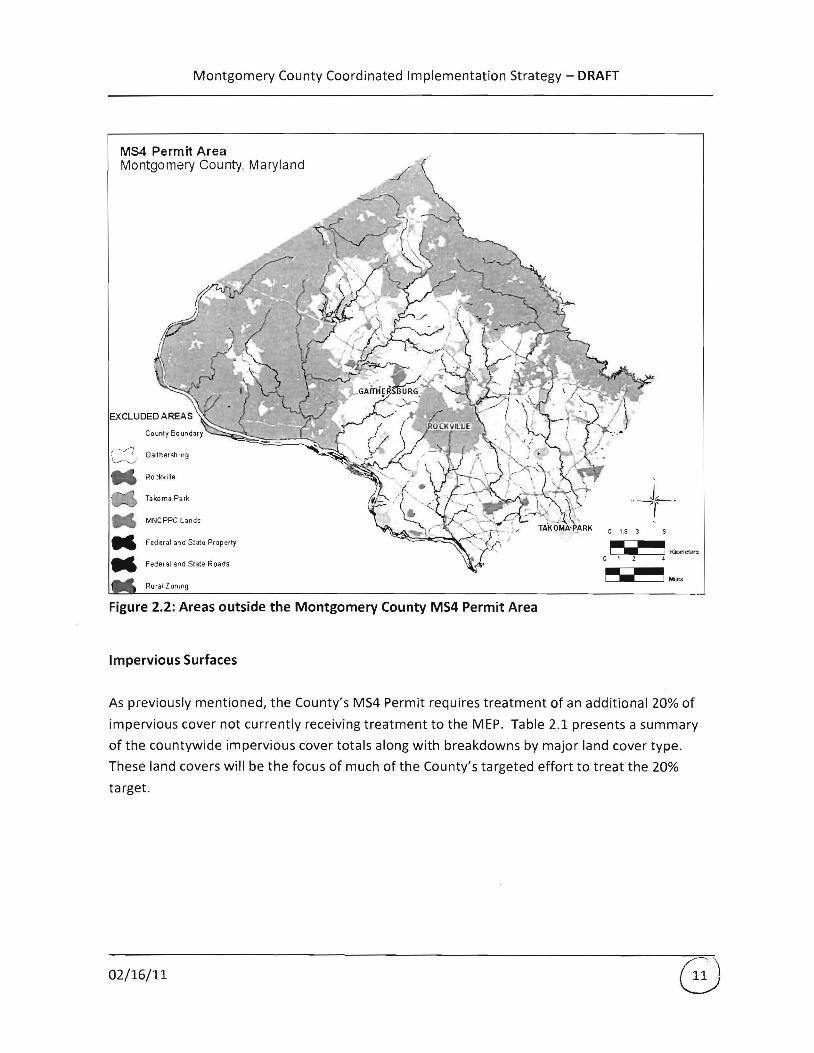
Montgomery County Coordinated Implementation Strategy - DRAFT
Table 2llmpervious Surface Summary
Description
Total County Area 324552 100
Total Area of 1m ervious Surface 35965 _ _-----shy 11
County Area Subject to Stormwater Permit (1) 138649 43
Imllervious Cover Subject to Stormwater Permit 2) ~==5119====18o2 == ==== Areas of Impervious Surface (3)
Road 13607 38
Building 13073 36
Parking 22
Sidewalk 1069 3
Recreation (4) 347 1 1 Exclusions include Certain zoning codes parklands forests municipalities with own stormwater management
programs state and federal properties and state and federal maintained roads 2 Percent of County Jurisdictional Area subject to the Stormwater Permit 3 Impervious area within each category within the total County area 4 Recreation imperviousness excludes swimming pools
Implementation Plan Guidance Document
The Implementation Plan Guidance Document (revised October 252010) provides a road map
for how the implementation plans were created The primary sections of the Guidance
Document and a short description of each are provided in Appendix A
The Guidance Document divides BMPs into five classes or codes shown below The Guidance
Document also provides a list of BMPs and which code they fall under which is provided in
Appendix B
Code 0 Pretreatment Practices
Code 1 Non-performing BMPs No runoff reduction and no long term pollutant removal
Code 2 Under-performing BMPs Limited runoff reduction and low pollutant removal
Code 3 Effective BMPs No runoff reduction but moderate to high pollutant removal
Code 4 ESO BMPs High runoff reduction and moderate to high pollutant removal
Impervious Cover Accounting and Tracking
Montgomery County has GIS data layers that contain all the stormwater BMPs in the County
and their drainage areas In order to determine the 20 target for impervious cover treatment
021611
Montgomery County Coordinated Implementation Strategy - DRAFT
to the MEP the County analyzed their existing impervious cover and their existing BMP
database to determine how much impervious cover is currently being treated to the MEP
Several methods were considered based on a determination of the MEP standard compared to
existing treatment methods According to MDE guidance to be considered MEP a BMP must
capture at least the Water Quality Volume (WQv) (the first inch of rainfall) or the CPv volume
(26 inches of rainfall) The final method used for determining which BMPs are MEP and the
amount of impervious surface not treated to the MEP was as follows
1 All BMPs that were installed after 2002 or are classified as Code 4 were considered MEP
2 An analysis of typical Code 3 stormwater ponds installed after 1986 was performed to
determine if this class of BMPs met the definition of IVIEP Based on that analysis Code
3 BMPs constructed after 1986 are considered MEP
3 All other classes of BMPs not specified above are not considered MEP and are eligible
for retrofit
Table 22 below shows the breakdown of the impervious acres treated by BMP codes and era
(shaded areas are BMP codes treated to the MEP)
Table 22 Acres of Impervious Cover Treated by BMP Code and Design Era
Design Era Post2002 1986-2002 Pre1986 Blank Total
CIJ tl 0 u Q
~ co
0 28 711 24 132 895
1 33 555 1391 367 2346
2 41 299 12 23 375
3 75 2482 1437 267 4261
4 20 459 482 40 1001
Totals 198 4506 3345 828 8877
IC Credit 100 Code 3amp 4 Code 4 Total Acres treated to
MEP 198 2942 482 40 3661
Assuming a total countywide impervious acreage of 25119 acres and an impervious acreage
treated to the MEP of 3661 as shown in Table 22 there are currently 21458 acres of
untreated impervious area Twenty percent of 21458 equates to 4292 acres of impervious
area that must be restored over the current permit cycle
021611
Montgomery County Coordinated Implementation Strategy - DRAFT
Pollutant Load Tracking
In addition to tracking impervious cover it is necessary to compute existing pollutant loads and
projected reductions in loads as a result of applying storm water controls and BMPs The Center
for Watershed Protections (CWP) Watershed Treatment Model (WTM) version 20 (CWP 2001)
was the tool selected to conduct this analysis and track load reductions across a range of
implementation strategies
The WTM uses a spreadsheet model to calculate annual pollutant loads and runoff volumes
The model also accounts for the benefits contributed by a full suite of stormwater treatment
practices and programs The first step in the model calculates existing pollutant loads by adding
primary and secondary source loads then subtracting reductions according to existing
management practices The second step applies future management practices by subtracting
these calculated reductions from the existing loads Appendix B of the Guidance Document
provides a detailed explanation of the assumptions and steps in the modeling process
For each watershed the WTM was run under existing conditions with existing BMPs to
determine a baseline pollutant load for targeted pollutants The baseline period for non-TMDL
parameters was based on 2002 Maryland Department of Planning land useland cover data
coupled with the Countys existing urban BMP database Pollutants targeted included bacteria
Total Phosphorus (TP) Total Nitrogen (TN) Total Suspended Solids (TSS) and Trash Next a
series of model runs was developed for analyzing the pollutant load reduction effect that
various restoration strategies would have based on assumed levels of implementation for the
various strategies Individual restoration strategies that were sequentially modeled included
the following
bull Completed and High Priority Projects - these include projects already completed or high
priority structural BMPs scheduled for retrofit in the FYll-FY16 Capital Improvements
Program (CIP)
bull Low Priority Projects - these includes FY11-FY16 CIP projects that for various reasons
are considered a lower priority
bull Other Potential Projects - these include other projects in existing inventories that were
not listed in the previous two categories For the Anacostia they include projects in
Anacostia Restoration Plan (ARP) prepared by the Army Corp of Engineers
bull Public ESD Retrofits - These include small scale ESD practices applied to County-owned
buildings streets and parking lots and rights of way Examples include rainwater
harvesting green roofs upland reforestation soil compost amendments rooftop
disconnection green street retrofits and converting drainage ditches to dry swales
021611
Montgomery County Coordinated Implementation Strategy - DRAFT
These are Code 4 structures This category also includes other structural BMP upgrades
to existing County BMPs which were designated as under-performing or nonshy
performing
bull Private ESD Retrofits - These projects include ESD on commercial property and
residential property and include green roofs rain gardens and permeable pavement
bull Riparian Reforestation - Focuses primarily on tree planting for riparian buffer
restoration
bull Stream Restoration - Includes the use of natural materials such as rocks logs and native
vegetation to reduce pressure on eroded banks prevent down-cutting of the
streambed and restore the natural meander patterns and slope profiles found in stable
reference streams
bull Programmatic Practices - This category deals with potential pollutant reduction that can
be attributed and quantified through MS4 stormwater pollution prevention
improvements and better housekeeping on County land and facilities Also includes any
pollutant reductions due to product substitution (eg nitrogen and phosphorus limits in
fertilizer) operational programs (eg recycling) and enforcement This category also
deals with reduced pollutants that can be attributed and quantified through MS4
stormwater education (eg lawn care) and outreach aimed at pollution prevention
better housekeeping and increased stewardship
The naming convention applied for the model runs was WTM 10 (ie baseline) WTM 20 (Le
completed and high priority low priority and other potential projects) WTM 30 (Le public
and private ESD) WTM 40 (ie riparian reforestation and stream restoration) and WTM 50
(ie programmatic) Model runs were developed sequentially to yield incremental increases in
load reduction by strategy In practice however strategies can be applied in combination and
out of sequence to achieve targeted outcomes and the most cost-effective solutions A
summary of the scenarios is provided in Table 23 below
021611
Montgomery County Coordinated Implementation Strategy - DRAFT
Table 23 Summary of Watershed Treatment Model (WTM) Scenarios
Implementation Phase Description
The WTM was run under existing conditions approach
WTM Baseline Conditions with the MDP year 2002 land useland cover data and
existing BMPs
WTM 20 Completed as of
2009j High Priorityj Low
Priority and Other Potential
Projects
The WTM was run with a series of future management
practices which were proposed projects from the
County inventory of restoration sites These practices
cover new ponds retrofits of existing BMPs and some
ESD practices from the proposed projects list
The Countys inventory for other project types that
include public properties eg libraries and parkingWTM 30 ESD Strategies and
lots public schools and open section roads available Other Structural BMPs
for ESD retrofits was reviewed as were areas for
private property ESD retrofits
This category includes any pollutant reduction or volume
reduction that can be attributed to specific stream
WTM 40 Habitat rehabilitation wetland restoration and or riparian
Restoration reforestation projects planned for construction in the
watershed for the permit cycle
WTM 50 MS4 Programmatic See description above
Practices
TMDL Calibration and Tracking
Where TMDLs existed for individual watersheds the WTM was run under existing conditions
with existing BMPs based on the year in which the data was collected for TMDL development
The baseline pollutant load was then compared and normalized to the MDE-determined
baseline MS4 load for the TMDL pollutant Any BMPs with approved dates after the year in
which the data was collected for TMDL development were not included in the baseline
calculation but rather were counted towards meeting the TMDL reduction target
Once the normalized model was established reductions achieved through programs and
practices were tracked using the WTM scenarios based on the percent load reduction from
baseline toward meeting the TMDL required WLA The normalized baseline and WLA target are
determined and specified in the relevant TMDL documents developed by M DE
021611
Montgomery County Coordinated Implementation Strategy - DRAFT
3 WATERSHED IMPLEMENTATION PLANS AND RESTORATION POTENTIAL
The watershed implementation plans and pre-assessments developed in conjunction with the
Strategy are driven by regulatory requirements facing each watershed Table 31 summarizes
the drivers by watershed
Table 31 Restoration Objectives -
W~tershedSubwater~hed - Trash
4 bull - I _ _ -
Patuxent
Anacostia
Rock Creek
Great Seneca
Cabin John Creek
lower Monocacy
Watts BranchMuddy Branch
Dry and little Seneca
lower Potomac Direct
Table 32 presents the more detailed and quantitative aspects of the TMDl requirements for
the MS4 portion within each watershed The Strategy has been developed to meet the MS4
permit area WLA compliance targets presented in Tables 32
In addition to the individual watershed requirements there is a Countywide requirement to
comply with the wasteload allocations associated with urban areas under the Chesapeake Bay
TMDl which applies to nutrients and sediment There is an interim target established for 2017
where reductions from baseline conditions of 9 12 and 20 respectively for TN TP and
TSS are to occur Then by 2020 full compliance is required which correspond to reductions
from baseline conditions of 18 34 and 37 respectively for TN TP and TSS
021611
Montgomery County Coordinated Implementation Strategy - DRAFT
Table 32 TMDl Summary by Impairment
Watershed
Cabin John Creek
Rock 2007 Enterococci 970 453669 18195 Creek
Anacostia 2007 Enterococci 860 247809 29978 River
Aoacostia 2008 TN 788 206312 38959 River
Anacostia 2008 TP 797 20953 3947 Ibsyr River
Triadelphia 2008 TP 580 438 Reservoir
Rocky Gorge 2008 TP 480 4268 3628 Reservoir
Clopper Lake 2002 TP 393
Anacostia 2007 TSS 850 7682 River
Triadelphia 2008 TSS Reservoir Clopper 2002 TSS 00 13 13
Lake
Lower 2009 TSS 380010 172 Monocacy
River
Anacostia 2010 Trash 1000 228683 Ibsyr River
Adapted from 2010 Status of Approved Stormwater Waste load Allocations for NPDES Regulated Stormwater Entities in Montgomery County April 27 2010 by Jeff White MDE
Potential to Reduce Stormwater Pollutant loads
Within each of the implementation plans an analysis was developed that explored the
restoration potential for that watershed Cost was not a limiting factor for the analysis but
rather assumptions were made based on feasibility of implementation rates and consideration
of conflicts with typical site conditions with respect to site use utilities land ownership etc
For example it was assumed that 40 of large County-owned parking lots would be available
for stormwater retrofitting These assumptions are necessary for planning purposes where
detailed site investigations have not occurred However some level of implementation is
021611
Montgomery County Coordinated Implementation Strategy - DRAFT
reasonable to assume In addition all identified high priority and low priority County projects
that have the potential to be constructed were assumed to be implemented
Implementation cost and effectiveness (in terms of pollutant load reduced) was also tracked
through the process of determining watershed restoration potential which enables the
costbenefit evaluation of various strategies for a target parameter (eg tons of sediment per
dollar spent or billion MPN of bacteria per dollar etc) For example by tracking cost and
effectiveness it is possible to evaluate the relative costbenefit of a strategy like ESD versus a
non-structural programmatic practice Moreover the comparison of these two strategies is
going to be different depending on what parameter is being considered eg ESD may be more
cost effective for nutrient reduction but less cost effective for bacterial load reduction
The tables in Appendix C help to illustrate this point Specifically a series of summary charts
and tables have been developed that illustrate the cost effectiveness of the range of strategies
considered by watershed with respect to pollutant load reduction The summaries reflect the
full restoration potential developed for each watershed
It is also useful to compare strategy effectiveness and range of opportunity across watersheds
To facilitate this a series of tables were compiled that groups all watersheds together and
considers watershed restoration potential by strategy These summary tables are presented in
Tables 33 through 310
For this analysis stream restoration was treated as a special modeling case (Table 39) because
it was not tracked as a strategy that receives credit for impervious cover treatment and because
it requires a different pollutant load reduction tracking method based on linear feet of
implementation and the existing stream resource condition (good fair or poor IBI scores
received different pollutant removal credit) Further details on stream restoration modeling
are presented in the individual implementation plans and the Guidance Document
Not all WTM scenarios were modeled for all watersheds For example if there were no
previously identified completed high priority low priority or other potential projects within a
watershed they would appear as zeros for that individual watershed in Tables 33 through 36
Also for non-TMDl watersheds such as Great Seneca and Muddy Branch and Watts Branch
subwatersheds the public and private property ESD riparian reforestation and MS4
programmatic practices scenarios were not modeled due to the lack of regulatory drivers that
define pollutant removal targets
021611
Montgomery County Coordinated Implementation Strategy - DRAFT
Table 33 Cost and benefit summary for completed projects (WTM 20)
Watershed Total ESD PrOjects Incremental reduction from baseline ()
i Cost Numberof Impervious
Cost
I Impervious Trash control added TN TP TSS Bacteria
(million $) projects bullbull (ac)
(total) (total)
Anacostia 95 25 167 7 3 4 4 1 4 4
Cabin John 00 0 0 0 0 02 02 03 03 1
Rock Creek 44 6 212 13 1 2 2 3 3 2 i
I Triadelphia 00 0 0 0 0 0 0 0 0 0
Rocky Gorge 00 0 0 0 0 0 01 0 0 0
Lower Monocacy 00 0 0 0 0 0 0 0 0 0
Clopper lake 00 0 0 0 0 0 0 0 0 0
Great Seneca bull 06 2 11 0 0 1 1 I 1 0 2
MuddyWatts 00 0 0 0 0 0 0 0 0 0
Indudes Clopper lake Project count does not include stream restoration Pollutants with a TMDL are highlighted
Table 34 Cost and benefit summary for high priority projects (WTM 20)
Watershed I
I
Total ESD Projects Incremental reduction from baseline ()
Cost
(million $)
i Numberof
projects bullbull
Impervious
control added
(ac)
ICost (total)
Impervious
(total) TN
I TP TSS I TrashBacteria
Anacostia 64 33 148 65 16 2 2 06 2 2
Cabin John 16 6 88 19 2 3 3 3 3 1
Rock Creek 89 14 373 13 1 2 3 3 3 4
Triadelphia 00 0 0 04 0 0 0 0 0 0
I Rocky Gorge 04 2 5 77 27 06 06 07 06 1
Lower Monocacy 00 0 0 0 0 0 0 0 0 0
Clopper lake 00 0 0 0 010 0 0 0 0 0 Great Seneca bull 183 24 789 6 08 19 19 20 0 24
MuddyWatts 44 16 211 8 1 6 6 6 0 6
Indudes Clopper lake bullbull Project count does not indude stream restoration Pollutants with a TMDL are highlighted
Table 35 Cost and benefit summary for low priority projects (WTM 20)
I Watershed Total ESO Projects Incremental reduction from baseline ()
Numberof Impervious ICost 1m ~ i Cost Impervious
I (million $) projects bullbull
control added (total) (total)
TN TP Bacteria Trash
(ac)
I Anacostia 51 16 188 61 8 2 2 07 2 3
Cabin John 16 8 10 98 78 02 02 02 02 03
I Rock Creek 88 24 657 7 1 4 4 6 5 7
Triadelphia 040 1 20 100 100 05 05 06 05 1
Rocky Gorge 09 2 458 100 100 84 82 83 82 116 i
I Lower Monocacy 0 0 0 0 0 0 0 0 0 0 I Clopper lake 0 0 0 0 0 0 0 0 0 0
I Great Seneca bull 66 16 87 41 15 4 4 4 010 4
I MuddyWatts 20 6 26 84 33 0 0 1 0 0
Includes Clopper Lake Project count does not include stream restoration Pollutants wth a TMDL are highlighted
021611
Montgomery County Coordinated Implementation Strategy - DRAFT
Table 36 Cost and benefit summary for other potential projects (WTM 20)
I Watershed Total ESO Projects Incremental reduction from baseline ()
ICost Impervious I Cost
I I Trash INumber of
control added Impervious
TN TP TSS Bacteria (million $) projects bullbull
(ac) (total) (total)
i i
Anacostia 2492 497 2222 73 62 23 8 26 301
Cabin John 00840 1 5 0 010 01 01 01 01 01
Rock Creek 20 4 201 0 0 12 12 19 15 21
Triadelphia 00 0 0 010 0 00 00 00 00 00
Rocky Gorge 20 2 0 010 0 00 00 00 00 00
lower Monocacy 00 0 0 0( 0 00 00 00 00 0010
Clopper Lake 00 0 0 0 0 00 00 00 00 0010
Great Seneca bull 02 S S3 0 0 23 23 27 00 27
MuddyWatts 00 0 0 0 0( 00 00 00 00 0010
bull Includes Clopper Lake bullbull Project count does not include stream restoration Pollutants with a TMDL are highlighted
Table 37 Cost and benefit summary for ESO projects (WTM 30)
Watershed
I
Cost (million $) Impervious
control added
(ac)
Incremental reduction from baseline ()
ESDfor i ESO for private
public
property property
TN TP TSS Bacteria Trash
Anacostia 2378 21296 1813 20 21 7 22 27
Cabin John 878 10307 876 22 23 25 24 28
Rock Creek 2471 341 2427 30 30 33 32 35
Triadelphia 41 47 36 10 1010 11 11 20
Rocky Gorge 312 19 28S 26 27 32 30 46
lower Monocacy 86 29 53 14 15 15 15 010
Clopper lake 08 051 21 14 14 15 0 14
Great Seneca bull 00 0 0 010 0 0( 0( 010
MuddyWatts 00 a 0 0 01 010 0 0
bull Includes Clopper lake Pollutants with a TMDL are highlighted
Table 3B Cost and benefit summary for riparian reforestation (WTM 40)
IWatershed Cost (million $) Impervious
Incremental reduction from baseline ()
control added Habitat restoration (ac) TN TP TSS Bacteria Trash
Anacostia 1 6 0 0 0 01 02
Cabin John 777 39 1 2 lili
3
Rock Creek 24 119 2 2 2 5
Triadelphia 010 1 01 02 01 04 03
Rocky Gorge 25 12 1 2 2 3 8
lower Monocacy 11 S 3 3 3 4 0
Clopper Lake 023 2 4 4 2 010 4
Great Seneca bull 0 a 010 010 0 010 0
MuddyWatts 0 0 010 0 0 0 0
bull Includes Clopper lake Pallutonts with a TMDL are highlighted
021611
Montgomery County Coordinated Implementation Strategy - DRAFT
Table 57 Cost and benefit summary for stream restoration (WTM 40)
Watershed Stream Restoration Incremental reduction from baseline ()
Number of Impervious control
Cost (million $) added(ac) TN TP TSS Bacteria Trash projects
Anacostia 937 200 0 42 56 326 0 0
Cabinlohn 162 15 0 17 9 80 0 0
Rock Creek 201 30 a 9 710 100 0 0
Triadelphia 00 0 0 0 0 0 010 0
Rocky Gorge 191 18 I 0 10 7 36 0 O lower Monocacy 73 nla 0 7 10 32 010 0
Clopper Lake 00 a 0 0 0 0 0 0
Great Seneca It I 259 33 0 19 8 16 0 0
MuddyWatts 242 45 0 16 7 13 0 0
Includes Clopper Lake Pollutants with a TMDL are highlighted
Table 58 Cost and benefit summary for M54programmatlc practices (WTM 50)
Watershed Cost (million $) Incremental reduction from baseline ()
Programmatic
practices - M54
Impervious control
added (ac) TN TP TSS Bacteria Trash
Anacostia 36 0 9 9 10 8 82
Cabin John 047 0 15 14 0 10 0
Rockereek 12 0 11 11 0 7 0
Triadelphia 00056 a 23 3 0 0 0
Rocky Gorge 009 0 38 8 03 5 2
lower Monocacy 007 0 0 0 19 0 0
Clopper Lake 0Q1 0 61 30
~=r 0
Great Seneca 10 0 0 0 0 0Y0 0 0
MuddyWatts 0 0 0 0 0 0 0
bull Includes Clopper Lake Pollutants with a TMDL are highlighted
021611
Montgomery County Coordinated Implementation Strategy - DRAFT
4 COORDINATED IMPLEMENTATION STRATEGY
The Strategy has multiple objectives to accomplish whereby a challenging balance between
strategies and timeframe is required There isnt necessarily a correct answer in the process
but rather an optimized result that addresses an agreed upon suite of priorities The Strategy
presented here was primarily driven by known and established regulatory timeframes and
compliance endpoints Meeting these endpoints using the more cost effective approaches was
also given priority After this consideration was given to other known and important
approaches that stakeholders and the County have an interest in pursuing Specifically the
following compliance dates and objectives were conSidered in developing the Strategy over the
long-term (Table 41)
Table 41 Compliance Targets for Countywide Coordinated Implementation Strategy
Target Date
2015
2017
2020
Compliance Target
Meeting 20 impervious cover treatment requirement
within the MS4 Permit cycle
Meet the interim dates and targets for the Chesapeake
Bay TMDL which include specific regulated urban area
reductions by 2017 for nutrients and sediment (based
on Maryland Department of the Environments
Watershed Implementation Plan)
Meet the full compliance and targets for the
Chesapeake BayTIVIDL which include specific regulated
urban area reduction by 2020 for nutrients and
sediment (based on Maryland Department of the
Environments Watershed Implementation Plan)
Metric
~4300 acres of
Impervious Cover
9 12 and 20
respectively for TN TP
and TSS reductions
from baseline
conditions
18 34 and 37
respectively for TN TP
and TSS reductions
from baseline
conditions
2025
2030
Meet additional impervious cover treatment targets
associated with next MS4 Permit cycle (assumes
another 20 target)
Meet additional impervious cover treatment targets
associated with next MS4 Permit cycle (assumes
another 20 target)
Out year compliance with other watershed TMDLs
~3400 acres of
Impervious Cover (20
of impervious
remaining after 2015)
~2750 acres of
Impervious Cover (20
of impervious
remaining after 2020)
100 compliance with
MS4 Permit Area WLAs
021611
Montgomery County Coordinated Implementation Strategy - DRAFT
To meet the compliance targets outlined in Table 41 the following priorities were generally
followed
bull 100 implementation of completed high and low priority County projects in first five
years (by 2015)
bull Greater ESD focus in urban (as opposed to suburban and rural) watersheds initially Goal
for ESD in these watersheds on pUblic property in first five years is 10 and on private
property is 10 The level of implementation was largely driven by the 20 Countywide
impervious goal
bull 100 of Public Outreach Potential for all TIVIDl watersheds in first five years This was
pursued to address trash nutrient and bacteria loading which rely strongly on effective
outreach programs to modify behaviors
bull Generally limited strategies to the top four most cost effective per watershed
bull Habitat restoration (stream restoration and buffer reforestation) not pursued as priority
until after first five year period These programs emphasize greater pollutant reduction
efficiency rather than impervious cover treatment which is the primary focus for the
first permit cycle
The Strategy was informed by the individual watershed implementation plans for seven
watersheds which included the Clopper lake and Patuxent subwatersheds Therefore in order
to develop countywide estimates for pollutant load reduction (as is required by the Chesapeake
Bay TMDl) watershed area weighting was applied The process for developing the Countywide
strategy and individual watershed implementation plans was woven together Once the
restoration potential was determined from the individual plans the strategy and schedule was
compiled using the restoration potentials and the drivers listed above The final restoration
cost and schedule was then placed in the implementation plans
It is also worth noting that the high and low priority projects along with the other potential
projects strategies represent a static or fixed number of projects that have been identified by
the County For this analysiS this list of practices is not replenished and therefore once all
opportunities have been implemented other strategies are pursued In reality the County will
continue to develop and update its list of specific project opportunities and have these
available for implementation in future years
The output from this effort is presented in a series of tables ordered by target date in Appendix
D In addition Table 42 provides an overall summary of pollutant load reduction tracking
versus time Through inspection of Table 42 it can be seen that the Strategy meets the
021611
Montgomery County Coordinated Implementation Strategy - DRAFT
impervious cover treatment targets under the current MS4 permit (as well as projected targets
for 2020 and 2025 assuming a continued 20 treatment requirement) interim and final
Chesapeake Bay nutrient and sediment reduction targets by 2017 and 2020 respectively and
out year MS4 permit area WLA compliance for the majority of pollutants Exceptions include
meeting the bacteria WLA load reductions required for the Anacostia and Rock Creek
021611
Montgomery County Coordinated Implementation Strategy - DRAFT
Table 42 Projection by Phase for Watersheds and Pollutants PermitTMDL Targets
Watershed Fiscal Year 2015 2017 2020 2025 2030 2017 2020
Impervious Treated (acres) 1421 2393 3364 4272 4544
ESD ( Impervious) 26 44 61 69A 71
Cost (Million $) 160 307 486 732 820
E5D( Cost) 45 62 71 78 78
Anacostia Nitrogen 25 39 68 89A l00A 818 82
Phosphorus 27 42 77 100 100 812 81
i Sediment 47 72 100 l00A) l00A 875 88
Bacteria 21 33 46 59A 64 879 88
Trash 41 65 89 l00A) 100
Impervious Treated (acres) 1541 1961 2381 3625 3989
ESD ( Impervious) 17 28 36 57A 61
Cost (Million $) 87 172 262 566 658
ESD ( Cost) 7(JA 79 79A 89A 9(JA
Rock Creek Nitrogen 24 30 38 55 61
Phosphorus 25 3(JA 38 54 GfJA)
Sediment 38 50 92 l00A 100
Bacteria 21 27 33 5(JA 55 96(JA 96
Trash 17 24 31 5(JA) 55
Impervious Treated (acres) 187 380 570 1018 1018
ESD ( Impervious) 52 72 78 87A 87A
Cost (Million $) 23 65 114 215 219
ESD ( Cost) 92 91 86 90 88
Cabin John Nitrogen 21 27A 39A 55 58 Phosphorus 2(JA 26 35 49 51
Sediment 6 17 GfJA 91 100
Bacteria 16 22 27 4(JA) 40 31 31
Trash 6 12 19 34 34
Impervious Treated (acres) 237 237 237 237 237
ESD ( Impervious) 4 4 4 4 4
Cost (Million $) 6 8 19 25 31
ESD ( Cost) 32 27A 11 8 7
Muddy Watts Nitrogen 6 7 15 18 22
Phosphorus 6 7 10 12 13 Sediment 7 8 14 17 2(JA
Bacteria 0 (JA 0 (JA 0 i Trash 6 6 6 6 6
bull Impervious Treated (acres) 901 921 941 941 941 ESD ( Impervious) 2 2 2 2 2
Cost (Million $) 26 48 SO 51 52 ESD ( Cost) 15 8 8 8 8
Great Seneca Nitrogen 24 41 43 44 45
Phosphorus 24 32 34 34 34
i Sediment 26 41 43 44 44
I Bacteria (JA) 0 0 0 (JA
Trash 31 32 33 33 33
021611
Montgomery County Coordinated Implementation Strategy - DRAFT
Pe rmitTMDL Targets
Watershed Fiscal Year 2015 2017 2020 2025 2030 2017 2020
Clopper
Impervious Treated (acres) 0 6 12 22 22
ESD ( Impervious) 0 86 86 92 92
Cost (Million $) 0 0 1 2 2
ESD ( Cost) 0 72 73 84 84
Nitrogen 61 67 72 79 79
Phosphorus 30 36 41 48 48 45 45
Sediment 0 5 10 17 17
Bacteria 0 0 0 0 0
Trash 0 6 11 18 18
Lower Monocacy
Impervious Treated (acres) 1 16 32 58 58
ESD ( Impervious) 100 85 84 91 91
Cost (Million $) 0 4 11 18 20
ESD ( Cost) 100 85 54 63 58
Nitrogen 0 5 14 22 24
Phosphorus 0 5 16 26 28
Sediment 0 5 46 61 69 608 61
Bacteria 0 6 12 19 19
Trash 0 0 0 0 0
Rocky Gorge
Impervious Treated (acres) 11 88 165 307 307
ESD ( Impervious) 64 89 90 95 95
Cost (Million $) 3 17 40 70 75
ESD ( Cost) 55 82 64 73 68
Nitrogen 47 55 6710 82 85
Phosphorus 17 25 36 52 53 15 15
Sediment 10 19 45 7(J1o 79
Bacteria 14 23 32 47 47
Trash 15 30 46 68 68
Triadelphia
Impervious Treated (acres) 3 12 20 38 38
ESD ( Impervious) 100 98 97 99 99
Cost (Million $) 1 3 5 9 9
ESD ( Cost) 99 98 98 99 99
Nitrogen 24 27 29 34 34
Phosphorus 4 7 9 14 14 15 15
Sediment 1 4 6 12 12
Bacteria 1 4 6 12 12
Trash 2 6 11 21 21
Countywide
Impervious Treated (acres) 4302 6014 7722 10518 11154 6008 7723
ESD ( Impervious) 18 34 47 6(J1o 63
Cost (Million $) 305 622 987 1687 1884
ESD ( Cost) 53 66 7(J1o 8(J1o 80
Nitrogen 18 25 36 46 51 9 2(J1o
Phosphorus 17 23 34 44 46 12 34
Sediment 23 34 54 6(J1o 62 20 37
Bacteria 11 15 20 28 30
Trash 18 26 33 41 42
Assumptio~s
1 Does no~ includerepeated Outreach and Education costs beyond FY2015
2 Does not include ~n inflation multiplier
021611
Montgomery County Coordinated Implementation Strategy - DRAFT
Summary of Individual Implementation Plans
A summary of the general considerations and prioritization for each watershed implementation
plan is provided below
Anacostia - For the first permit cycle (through 2015) a priority was placed on full
implementation of completed high and low priority projects Next implementation of a third
of the other potential projects was targeted as a large number of these were identified in
conjunction with the USACEs Anacostia Watershed Restoration Plan efforts ESD was
emphasized on both public (10) and private property (10) Finally outreach (25) and
stream restoration (12) are targeted for pollutant load reduction but are not credited towards
impervious cover credit In future permit cycles the remainder of the other potential projects
are targeted along with ESD and a limited amount of riparian reforestation for impervious cover
and pollutant load reduction Outreach and stream restoration are significant strategies
pursued for load reduction benefits Nutrient and sediment MS4 permit area WLAs are met by
2030 but bacteria load reduction does not meet MS4 permit area WLA compliance The
remaining bacteria reduction is believed to be associated with urban wildlife sources Unless
intense urban wildlife management practices are implemented this remaining load reduction
will not be possible
Rock Creek- For the first permit cycle (through 2015) a priority was placed on full
implementation of complete high and low priority projects Next 25 implementation of
other potential projects was targeted ESD was emphasized on both public (10) and private
property (10) with private property implementation being linked to Rainscapes Program
success Finally outreach (100) and stream restoration (22) are targeted for pollutant load
reduction but are not credited towards impervious cover credit In future permit cycles the
remainder of the other potential projects are targeted along with ESD and riparian
reforestation for impervious cover and pollutant load reduction Stream restoration is a
significant strategy pursued for load reduction benefits The bacterial load reduction does not
meet MS4 permit area WLA compliance However the remaining bacterial load is believed to
be associated with urban wildlife sources Unless intense urban wildlife management practices
are implemented this remaining load reduction will not be possible
Cabin John Creek - Similar to the other two more urban watersheds in the County during the
first permit cycle (through 2015) a priority was placed on full implementation of complete high
and low priority projects Fewer opportunities exist overall compared to the Anacostia and Rock
Creek Next 25 implementation of other potential projects was targeted ESD was
emphasized on both public (10) and private property (10) Finally outreach (100) was
021611
Montgomery County Coordinated Implementation Strategy - DRAFT
targeted for pollutant load reduction but not credited towards impervious cover credit No
riparian reforestation or stream restoration was targeted due to limited or no opportunities In
future permit cycles the remainder of the other potential projects are targeted along with ESD
and some riparian reforestation for impervious cover and pollutant load reduction The
bacteria load reduction meets MS4 permit area WLA compliance by 2025
Muddy BranchWatts Branch - During the first permit cycle (through 2015) a priority was
placed on full implementation of complete high and low priority projects Fewer opportunities
exist overall compared to the Anacostia and Rock Creek Watersheds No other strategies were
pursued as there are no existing TMDLs in the Muddy BranchWatts Branch subwatersheds In
future permit cycles previously identified stream restoration projects are implemented for
pollutant load reduction
Great Seneca Creek - This watershed implementation plan is unique in that it includes the small
Clopper Lake subwatershed which has a TMDL for phosphorus Even with the TMDL there are
limited identified opportunities to pursue in the Clopper Lake subwatershed in part due to the
limited area of the subwatershed within the County MS4 permit area During the first permit
cycle (through 2015) a priority was placed on full implementation of complete high and low
priority projects within Great Seneca Creek subwatershed No opportunities exist for these
strategies in Clopper Lake However full outreach was applied in Clopper Lake in the first
permit cycle In future years other potential projects ESD on public and private property and a
small amount of riparian reforestation (in Clopper Lake) is pursued The Clopper Lake WLA for
phosphorus within the MS4 permit area is met
Patuxent - During the first permit cycle through 2015 a priority was placed on full
implementation of complete high and low priority projects Far fewer opportunities exist
overall compared to the Anacostia and Rock Creek A limited amount of ESD on private land
and stream restoration was pursued Finally outreach (100) was targeted for pollutant load
reduction (primarily nutrients) but not credited towards impervious cover credit No riparian
reforestation was targeted within the MS4 Permit area due to cost effectiveness in the Rocky
Gorge subwatershed and limited opportunities in the Triadelphia subwatershed In future
permit cycles ESD on private and public land is pursued more substantially as is stream
restoration A limited amount of riparian reforestation achieves some impervious cover and
pollutant load reduction The Rocky Gorge phosphorus WLA within the MS4 permit area is met
easily and the Tridelphia phosphorus WLA is also met but with a longer timeframe needed for
compliance
021611
Montgomery County Coordinated Implementation Strategy - DRAFT
Lower Monocacy Creek -lower Monocacy Creek is the most rural watershed in the County and
has the least amount of area subject to the County MS4 permit In addition there are no preshy
identified restoration projects within the watershed Therefore during the first permit cycle
(through 2015) only a very small amount (5) of private property ESD is pursued It is not until
the second permit cycle that more focus is placed on private and public ESD as well as stream
restoration and programmatic strategies such as street sweeping to target sediment loads
associated with the TM Dl In future permit cycles stream restoration is pursued for pollutant
load reduction The sediment WlA within the MS4 permit area is projected to be met around
2025
Countywide - The Countywide effort was driven by impervious cover treatment targets and
Chesapeake Bay TMDl2017 and 2020 reduction targets associated with sediment and nutrients
for urban MS4s For impervious cover it was assumed that a 20 target would be required for
each five-year permit cycle The Bay TMDl targets for urban MS4 areas were easily met for all
pollutants in 2017 and easily met for nitrogen and sediment but more difficult to meet for
phosphorus in 2020
Public Outreach and Stewardship
The County recognizes and is committed to the increasingly important role that public outreach
and stewardship will play if improved water quality conditions are going to be achieved
countywide While the County currently has a very active and layered outreach program the
model requires changes that will result in broader stakeholder groups serving as the leaders
and primary champions for clean water in their communities This includes greater participation
from minority and faith-based groups business consortiums schools neighborhood
associations and civic groups Additionally the new model requires revisiting current
initiatives carried out by the various County agencies to look for better and more efficient ways
to communicate messages cross-train and create synergies that result in greater engagement
greater awareness and sustained changes in behavior
Within each implementation plan specific suggestions for outreach and education
opportunities are identified In addition Appendix E of this Strategy contains practice sheets
which highlight targeted restoration activities for the County to develop and refine A total of
eight practices have been identified that can be adopted countywide or in more targeted
watershed areas where there are specific water quality issues to address Many of the
practices build upon existing County programs but require a much broader reach to new
partner groups Program start up costs are suggested and were used to for cost estimates
associated with Countywide strategy The highlighted practices include
021611
Montgomery County Coordinated Implementation Strategy - DRAFT
bull Pet Waste Pickup Education and Outreach Campaign
bull Lawn Stewardship Education and Outreach Campaign
bull Anti-littering Education and Outreach Campaign
bull Innovative Stormwater Management Awareness Campaign
bull Stream Stewards Education and Outreach Campaign
bull Riparian Reforestation Education and Outreach Campaign
bull Roof Runoff Reduction Education and Outreach Campaign
bull Parking Lot Recharge Value Education and Outreach Campaign
Start up costs by practice along with an overall five year cost estimate are provided in Table
43 Start up timeframes are assumed to be up to 18 months
Table 43 Outreach Start Up and 5-Year Cost Projections
Practice Practice Start Up Cost
Pet Waste Pickup $240500
Lawn Stewardship $301 600
Anti-Littering $175050
Stormwater Management Improvements Awareness $50450
Stream Stewards $74825
Riparian Reforestation $30575
Roof Runoff Reduction $101400
Parking Lot Recharge Value $41500
Estimated Start Up Total $744900
5-Year Outreach Budget Projection $2650000
These eight practice sheets provide specific costs and timelines for implementation They also
provide suggestions for measuring program success These practice sheets along with the
specific recommendations in the implementation plans make up the Public Outreach and
Education Campaign
Trash Reduction
Most of the implementation plans have to address trash loadings to meet requirements of the
Potomac Trash Treaty that is referenced in the County1s MS4 Permit In addition the Anacostia
Trash TMDL has recently been accepted by MDE and the EPA According to the Anacostia
021611
Montgomery County Coordinated Implementation Strategy - DRAFT
TMDl there is reasonable assurance that the goals of the Treaty and TMDl can be met with
proper watershed planning implementing pollution-reduction BMPs and using strong political
and financial mechanisms
Currently the County has a number of activities which target trash reduction They include the
following
bull Adopt-a-Road Program through DOT which focuses on public awareness and involvement in trash management There are 205 participants who adopted road segments and agreed to six major road cleanups per year
bull Storm Drain Marking through DOT bull Support for illegal dumping enforcement outreach and research and monitoring bull Partnership with DOT to conduct street sweeping covering about 2500 curb miles and
occurring once a year
bull Partnership with the Park Police to monitor illegal dumping which combined enforces 300-400 actions a year
bull Non-residential and residential recycling programs through Solid Waste Services (SWS) bull Transit stop trash management program at 600 bus stops countywide supported by DOT
Transit Services
In addition to continuing these efforts a number of trash good-housekeeping efforts have been
proposed as part of this Strategy A detailed description of the quantitative methods and
strategies applied can be found in Appendix E of the Guidance Document In general the
following six trash-reduction strategies are recommended
1 Significantly increase funding for trash reduction programs 2 Create and enhance regional partnerships and coordination among businesses
environmental groups individual citizens and government at all levels and in all jurisdictions
3 Improve peoples awareness knowledge and behavior relating to littering and illegal dumping
4 Promote the greater introduction and use of effective trash-reduction technologies and approaches
5 Improve enactment and enforcement of laws to reduce trash 6 Increase trash monitoring-related data collection generation and dissemination efforts
The Anacostia watershed implementation plan provides an outline of the actions that will be
taken through the first permit cycle to reduce trash The range of programs and practices
specially aimed at reducing trash inputs to roads and streams that will be targeted include
reduce reuse and recycle campaigns littering and illegal dumping enforcement stream
cleanups and street sweeping These measures are in addition to any trash trapped and
021611
Montgomery County Coordinated Implementation Strategy - DRAFT
removed by structural practices which are computed using the WTM The plan shows that the
trash TMDl can be met by 2025 at a cost of 732 million dollars
Adaptive Management Monitoring and Reporting
Sound implementation strategies require assessment and effective adaptation to respond to
new information changing conditions new technologies and lessons learned This will be the
basis of the plan that will be used when benchmarks are not met and the projected funding is
inadequate
Adaptive management requires monitoring of a variety of measures that can be used to
determine whether progress is being made towards meeting the Countywide water quality
objectives Ultimately it is the instream water quality and the loading limits with respect to the
TMDls that determine the success of implementation however there are many interim
measures that can also be correlated to success which are worthwhile pursuing
Surface water monitoring can be an expensive and time consuming undertaking Montgomery
County is fortunate to have an extensive Countywide stream monitoring network that can serve
as a foundation for providing spatial and temporal data to indicate stream health The Countys
MS4 Permit also outlines the required assessment of controls which includes chemical
biological and physical monitoring Specifically the permit calls for the County to continue
their watershed restoration monitoring of the lower Paint Branch subwatershed and physical
monitoring ofthe Clarksburg Special Protection area In addition to the existing monitoring
network the County will continue tracking and data reporting associated with levels of
implementation (eg acres of impervious cover treated areas of buffer planted miles of
stream restored miles of streets swept) For measuring effectiveness of outreach and
stewardship efforts other types of monitoring and reporting are planned that include before
and after attitude surveys frequency of website visits and information requests
For many restoration strategies it may be difficult to tease out their individual effectiveness in
terms of pollutant load reductions but collectively the monitoring that occurs should provide
adequate insight into the overall effectiveness of a layered implementation strategy
In addition to the monitoring and assessment the County will be reporting results on an annual
basis as part of their NPDES MS4 Permit annual report The MS4 Permit requires annual
reporting of the following
021611
Montgomery County Coordinated Implementation Strategy - DRAFT
bull The status of implementing the components of the stormwater management program
that are established as permit conditions
bull A narrative summary describing the results and analyses of data including monitoring
data that is accumulated throughout the reporting year
bull Expenditures for the reporting period and the proposed budget for the upcoming year
bull A summary describing the number and nature of enforcement actions inspections and
public education programs
bull The identification of water quality improvements and documentation of progress
toward meeting applicable WLAs developed under EPA approved TMDLs and
bull The identification of any proposed changes to the Countys program when WLAs are not
being met
The County will build upon annual reporting that has historically occurred to meet permit
requirements and will supplement this reporting with tracking table summaries that quantify
implementation activities for the range of strategies pursued during that year and the
associated treatment (eg impervious cover treated pollutant load reduced education and
outreach partners established etc) Cost will also be tracked in association with rates of
implementation This level of performance will then be compared with countywide strategy
targets (eg progress towards meeting WLAs) associated with key performance dates such as
those presented in Table 41 The level of progress achieved by the County will then feed into
the adaptive management approach described above
Organization Needs to Implement Strategy
Montgomery County DEP staff possesses substantial expertise and institutional knowledge that
yields many positive outcomes and efficient processes under the current pace of restoration
and permit compliance activities Under this strategy however the pace of implementation is
required to significantly increase Based on an increase in the level of implementation it is
reasonable to assume that additional capacity may be needed to provide sufficient oversight
and management of all the projects
Another critical element of this strategy is the recognition and commitment to pursuing
outreach initiatives that build community capacity by targeting new partner groups that
provide the necessary leadership oversight and sustained effort to change behaviors and
foster stewardship The County currently carries out many well established and managed
outreach programs but it may require additional focus across County agencies and
departments for these partnerships to become established and thrive
021611 G
Montgomery County Coordinated Implementation Strategy - DRAFT
Through the implementation process and the monitoring and reporting that is required large
amounts of data will be generated Technological advances happen so rapidly in this day and
age it will be important for the County to stay current with technology and methods so that
more efficient and cost-effective data management and reporting will be possible The County
currently relies on a detailed and sophisticated GIS to spatially locate projects and manage
tables of data related to projects The growth and development of this spatial database will be
a critical component of the reporting and tracking capability of the County These databases
generate the input data that are used to measure progress towards baseline loading targets
Regular review and upkeep of the data as well as routine summarization of progress (annually
at a minimum) will likely require additional dedication of staff This is especially the case during
periods where the implementation rate of structural practices in the ground is accelerated
021611
Montgomery County Coordinated Implementation Strategy - DRAFT
Appendix C - Restoration Potential by Watershed
021611
c-
04 03 02 01
a
_ Nitrogen Load Reduction
--shy TMDL WLA Target
_Cost
MONTGOMERY COUNTY URBAN WATERSHEDS POLLUTANTS _Bk)~Ibilats ~1~ l~ fjfsi --
Rank
1
2
3
4
5
6
7
8
9
10
11
Restoration Strategy TN reduction
Ibsyr
Pet Waste Education 15169
Retrofit of Underperforming BMPs 1769
Stream Restoration 72423
Completed Projects ~43 High Priority Projects 3260
Other Potential Projects 43276
Habitat Restoration 224
Public Property ESD Retrofits 18270
Priority Neighborhoods ESD Retrofits 9271
Private Non-residential ESD Retrofits 5594
Street Sweeping -
Incremental Cost Unit Cost
Million $ IbsMillion $ 088 17193
120 1475
9304 778
948 701
635 513
25430 170
141 158
23655 77
13278 70
8018 70
124 -
Qj c
Qj
nI CXI
o -f-
1 09 08 07 06 05
$900 $800 $700
~ $600 c $500 ~ $400 $300 0 u $200 $100
$shy
~~mf il_~IJrt~
MONTGOMERY COUNTY URBAN WATERSHEDS POLLUTANTS ItfiQ14lbilJts i~5 [i
1 $900 Qj
09 $8005 iii en 08 $700
~co 07 $600 co - til
06 $500 ~ 05- $400 ~ 04 en$300 003 u $20002
en $100I 01 o 0 $shys Q en o
s Q
Phosphorus Load Reduction
--- TMDL WLA Target
__Cost
I Rank I
1
2
3
4
5
6
7
8
9
Restoration Strategy
Pet Waste Education
Retrofit of Underperforming BMPs
Stream Restoration
Completed Projects
High Priority Projects
Habitat Restoration
Other Potential Projects
Public Property ESD Retrofits
Priority Neighborhoods ESD Retrofits
10 I Private Non-residential ESD Retrofits
11 Street Sweeping
TP reduction Incremental Cost Unit Cost
Ibsyr Million $ IbsMillion $ 1979 088 2243
247 120 206
13097 9304 141
915 948 96
451 635 71
37 141 26
6067 25430 24
2546 23655 11
1294 13278 10
781 8018 10
- 124 -
MONTGOMERY COUNTY URBAN WATERSHEDS POLLUTANTS IItQjQhabillt$middot
Cii 5 Cii 11 It CD
6 ~ r o ~ s
0 ltIIa r ltII e c ltII III
1 09 08 07 06 05 04 03 02 01
0
$900
$800 $700
v$600 r
0 $500 == $400 $300 11
0 u $200 $100
$shy
_ Sediment load Reduction
--- TMDl WlA Target
__Cost
Rank Restoration Strategy
Sediment reduction
Incremental Cost
Unit Cost
tonsyr Million $ tonsMillion $ 1 Street Sweeping 800 124 645
2 Stream Restoration 25057 9304 269
3 Retrofit of Underperforming BMPs 25 120 21
4 Completed Projects 97 948 10
5 High Priority Projects 47 635 7
6 Other Potential Projects 660 25430 3
7 I Public Property ESD Retrofits 272 23655 1
8 Priority Neighborhoods ESD Retrofits 139 13278 1
9 Private Non-residential ESD Retrofits 84 8018 1
10 Habitat Restoration 2 141 1
11 Pet Waste Education - 088 -
C-3
MONTGOMERY COUNTY URBAN WATERSHEDS POLLUTANTS
-QI5 5i ~
1 09 08 07 06 05 04 03 02 01
0
$900
$800
$700
$600 ~ 0
$500 == $400 $300 11
0 u $200
$100
$shy
--shy TMDL WLA Target
___ Cost
Rank Restoration Strategy
Enterrococci reduction
Incremental Cost
Unit Cost
Billion MPNyr Million $ Billion MPN Million $
1 Pet Waste Education 19643 088 22263
2 Retrofit of Underperforming BMPs 2781 120 2318
3 Completed Projects 10441 948 1101
4 High Priority Projects 5120 635 806
5 Other Potential Projects 69895 25430 275
6 Riparian Reforestation 310 141 219
7 Public Property ESD Retrofits 29025 23655 123
8 Priority Neighborhoods ESD Retrofits 14777 13278 111
9 Private Non-residential ESD Retrofits 8917 8018 111
10 Stream Restoration - 9304 -
11 Street Sweeping - 124 I -
~ I~~~i MONTGOMERY COUNTY URBAN WATERSHEDS POLLUTANTS 1tI2~mL ~ I~I
~$ I -~-- I
100 90 80 70 60 50 40 30 20 10
0
$900 $800 $700 $600 $500 $400 $300 $200 $100 $shy
vi c
~ 5 11 0 u
Implementation Phase
Potential Trash Incremental Unit Cost
I
Rank Restoration Strategy Reduction Cost
Ibsyear Million $ IbsMillion $ 1 Recycling Education and Investigations 51654 02 238837
2 Plastic Bag Ban and Misc Enforcement 63546 13 48882
3 Anti-litter Campaign Education 23J61 09 26930
4 Retrofit of Underperforming BMPs 1144 12 954
5 Completed Projects 6598 95 696
6 High Priority Projects 2786 64 439
7 Other Potential Projects 56341 2543 222
8 Habitat Restoration 266 14 188
9 Street Sweeping 204 12 164
10 Public Property ESD Retrofits 25348 2366 107
11 Priority lIeighborhoods ESD Retrofits 12529 1328 94
12 Private Non-residential ESD Retrofits 7547 802 94 ru Stream Restoration - 930 -14 Pet Waste Education - 09 -
C-5
MONTGOMERY COUNTY URBAN WATERSHEDS POLLUTANTS
CABIN JOHN
1 250
__CostImplementation Phase
09 08 07 06 05 04 03 02 01
0
200 ~ c
150 g E
100 - ltII 0 u
50
0
_E Coli
- - - Waste Load Allocation
Rank Restoration Strategy
E coli reduction
Incremental Cost
Unit Cost
Billion
MPNyr Million $
Billion MPN
Million $ 1 Pet Waste Education 4388 $05 9436
2 Underperforming BMP Retrofits 1892 $19 1022
3 High Priority Projects 1289 $16 800
4 Riparian Reforestation 1133 $78 146
5 Other Potential Projects 148 $17 86
6 Public Property ESD Retrofits 4AOO $860 Sl 7 Private Non-residential ESD Retrofits 1618 $392 41
8 Priority Neighborhoods ESD Retrofits 2633 $638 41
9 Completed Projects 112 $00 0
C-6
MONTGOMERY COUNTY URBAN WATERSHEDS POLLUTANTS 1Itf~~Jabitm
ROCK CREEK
1 $700 Qj5 09
o
_
$600 Qj 08
111 $500 ~ampl 07 c
t5 06 $400 ~ e 05 ~ $3005 04 - 111tl 03 $200 0 u-6 02
$100J 01 $-
Enterrococci
- - - Waste load Allocation Implementation Phase
__Cost
Rank Restoration Strategy
Enterrococci reduction
Incremental Cost
Unit Cost
Billion MPNyr Million $ Billion MPN Million $
Et Pet Waste Management 35734 118 30190
Underperforming BMP Upgrades
Other Potential Projects
28800
30239
577
1083
4995
2792
4 Completed Projects 12131 444 2734
5 High Priority Projects 14239 890 1600
6 Riparian Reforestation 18999 2384 797
7 County Property ESD Retrofits 54519 24136 226
8 Private Residential ESD Retrofits 35230 17737 199
9 Private Non-residential ESD Retrofits 32A86 16380 198
C-7
MONTGOMERY COUNTY URBAN WATERSHEDS POLLUTANTS _f~~pabitafS (fi~r ~~ l-middotshy
ROCK CREEK
100 $900 90 $800 80 $700 u70 $600 c 60 2$50050 -~$40040
lt1$300 030 $200 u
20 10 $100
0 $shy
Implementation Phase
Rank Restoration Strategy Trash Reduction
Incremental Cost
Unit Cost I
Ibsyear Million $ IbsMillion $ 1 Other Potential Projects 16038 1085 1478
2 Underperforming BMP Upgrades 6756 577 1172
3 Completed Projects 4217 444 950
4 High Priority Projects 6366 890 715
5 Riparian Reforestation 9237 2384 387
6 Public Property ESD Retrofits 24587 24136 102
7 Priority Neighborhoods ESD Retrofits 16155 17737 91
8 Private Non-residential ESD Retrofits 14793 16380 90
9 Pet Waste Education - 118 -
(-8
MONTGOMERY COUNTY RURAL WATERSHEDS POLLUTANTS
SENECA - CLOPPER LAKE -
100 Qi
90 iii 80VI to -CQ 70 0 60e 50I 0 40 u l 30
C QJ 20ex
C 10to 0
J 0
$18
$16
$14 n
$12 I
$10 sect $08 ~ $06 0
VI
U $04
$02
$shy
_TPRemoval - - - TMDL Reduction Target
Implementation Phase ___Cost
Rank Restoration Strategy TP
Reduction (Ibsyr)
Incremental Cost (Million $)
Unit Cost (IbsvrMillion $)
1 Residential Education 33 001 6246
2 Underperforming BMP Retrofits 13 004 341 3 Riparian Buffer Reforestation 19 023 99 4 Priority Neighborhood ESD Retrofits 15 051 35 5 Public Property ESD Retrofits 7 075 99
C-9
-pj[fti
MONTGOMERY COUNTY URBAN WATERSHEDS POLLUTANTS 1It[~~JIlbitIL f bull~
LOWER MONOCACY
1 09 08 07 06 05 04 03 02 01
0
Implementation Phase
25
20 ~ c
15 ~ ~
10 - 0 u
5
0
_TSS
- - - Waste load Allocation _Cost
Rank Restoration Strategy
Sediment reduction
Incremental
Cost Unit Cost
tonsyear Million $ tonMilli
1 Street Sweeping 22 $007 3121
2 Underperforming BMP Retrofits 4 $010 389
3 Stream Restoration 37 $734 51
4 Riparian Buffer Reforestation 3 $109 25
5 Other Structural BMPs and ESD Strategies 10 $851 12
6 Priority Neighborhoods ESD Retrofits 2 $160 10
7 Non-residential ESD Retrofits 1 $132 10
C-10
MONTGOMERY COUNTY RURAL WATERSHEDS POLLUTANTS 1tlj~lIbiIalSlt~~II
1 09 08 07 06 05 04 03 02 01
0
$70
$60
$50 ~ c
$40 ~ ~ $30 - UI
$20 0 v
$10
$0
_ Phosphorus Load Reduction
- - - Waste Load Allocation ___ CostImplementation Phase
Rank Restoration Strategy TP Incremental Cost
Million $ Unit Cost
Ibsyr Ibs Million $ 1 Lawn Care Education 3670 01 37394
2 Underperforming BMP Retrofits 3499 08 4338
3 Other Potential Projects 3524 33 1076
4 High Priority Projects 252 04 685
5 Riparian Reforestation 762 26 298
6 Public Property Retrofits 5854 345 169
7 Priority Neighborhoods ESD Retrofits 796 65 123
8 Private Non-residential ESD Retrofits 1941 168 116
9 Completed Projects 53 00 00
c- 11
MONTGOMERY COUNTY RURAL WATERSHEDS POLLUTANTSal12hdJilats ~I~ ~ [ -
1 10 ii 5 09 9 1 08 8 II al- 07 7 1ii o 06 6
c
~ ~ 1 o E IV
05 04 03
5 4
3
~ 11 0 u
0 11 02 2 J o 01 1
t a 0 0 11 o
t 0
_ Phosphorus Reduction
- - - Waste Load Allocation
-Cost
Rank Restoration Strategy TP Incremental Cost
Million $ Unit Cost
Ibsyr Ibs Million $ 1 Lawn Care Education 3670 01 37394
2 Underperforming BMP Retrofits 3499 08 4338
3 Other Potential Projects 3524 33 1076
4 High Priority Projects 252 04 685
5 Riparian Reforestation 762 26 298
6 Public Property Retrofits 5854 345 169
7 Priority Neighborhoods ESD Retrofits 796 65 123
8 Private Non-residential ESD Retrofits 1941 168 116
9 Completed Projects 53 00 00
C-12
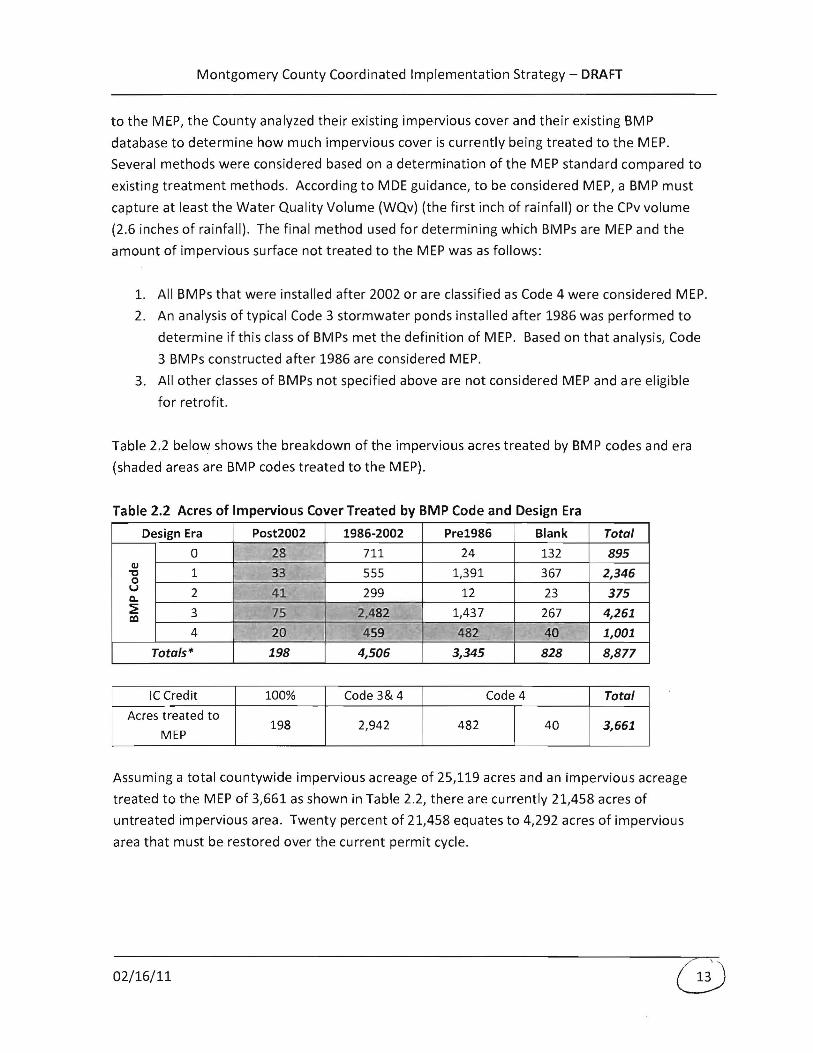
Montgomery County Coordinated Implementation Strategy - DRAFT
to the MEP the County analyzed their existing impervious cover and their existing BMP
database to determine how much impervious cover is currently being treated to the MEP
Several methods were considered based on a determination of the MEP standard compared to
existing treatment methods According to MDE guidance to be considered MEP a BMP must
capture at least the Water Quality Volume (WQv) (the first inch of rainfall) or the CPv volume
(26 inches of rainfall) The final method used for determining which BMPs are MEP and the
amount of impervious surface not treated to the MEP was as follows
1 All BMPs that were installed after 2002 or are classified as Code 4 were considered MEP
2 An analysis of typical Code 3 stormwater ponds installed after 1986 was performed to
determine if this class of BMPs met the definition of IVIEP Based on that analysis Code
3 BMPs constructed after 1986 are considered MEP
3 All other classes of BMPs not specified above are not considered MEP and are eligible
for retrofit
Table 22 below shows the breakdown of the impervious acres treated by BMP codes and era
(shaded areas are BMP codes treated to the MEP)
Table 22 Acres of Impervious Cover Treated by BMP Code and Design Era
Design Era Post2002 1986-2002 Pre1986 Blank Total
CIJ tl 0 u Q
~ co
0 28 711 24 132 895
1 33 555 1391 367 2346
2 41 299 12 23 375
3 75 2482 1437 267 4261
4 20 459 482 40 1001
Totals 198 4506 3345 828 8877
IC Credit 100 Code 3amp 4 Code 4 Total Acres treated to
MEP 198 2942 482 40 3661
Assuming a total countywide impervious acreage of 25119 acres and an impervious acreage
treated to the MEP of 3661 as shown in Table 22 there are currently 21458 acres of
untreated impervious area Twenty percent of 21458 equates to 4292 acres of impervious
area that must be restored over the current permit cycle
021611
Montgomery County Coordinated Implementation Strategy - DRAFT
Pollutant Load Tracking
In addition to tracking impervious cover it is necessary to compute existing pollutant loads and
projected reductions in loads as a result of applying storm water controls and BMPs The Center
for Watershed Protections (CWP) Watershed Treatment Model (WTM) version 20 (CWP 2001)
was the tool selected to conduct this analysis and track load reductions across a range of
implementation strategies
The WTM uses a spreadsheet model to calculate annual pollutant loads and runoff volumes
The model also accounts for the benefits contributed by a full suite of stormwater treatment
practices and programs The first step in the model calculates existing pollutant loads by adding
primary and secondary source loads then subtracting reductions according to existing
management practices The second step applies future management practices by subtracting
these calculated reductions from the existing loads Appendix B of the Guidance Document
provides a detailed explanation of the assumptions and steps in the modeling process
For each watershed the WTM was run under existing conditions with existing BMPs to
determine a baseline pollutant load for targeted pollutants The baseline period for non-TMDL
parameters was based on 2002 Maryland Department of Planning land useland cover data
coupled with the Countys existing urban BMP database Pollutants targeted included bacteria
Total Phosphorus (TP) Total Nitrogen (TN) Total Suspended Solids (TSS) and Trash Next a
series of model runs was developed for analyzing the pollutant load reduction effect that
various restoration strategies would have based on assumed levels of implementation for the
various strategies Individual restoration strategies that were sequentially modeled included
the following
bull Completed and High Priority Projects - these include projects already completed or high
priority structural BMPs scheduled for retrofit in the FYll-FY16 Capital Improvements
Program (CIP)
bull Low Priority Projects - these includes FY11-FY16 CIP projects that for various reasons
are considered a lower priority
bull Other Potential Projects - these include other projects in existing inventories that were
not listed in the previous two categories For the Anacostia they include projects in
Anacostia Restoration Plan (ARP) prepared by the Army Corp of Engineers
bull Public ESD Retrofits - These include small scale ESD practices applied to County-owned
buildings streets and parking lots and rights of way Examples include rainwater
harvesting green roofs upland reforestation soil compost amendments rooftop
disconnection green street retrofits and converting drainage ditches to dry swales
021611
Montgomery County Coordinated Implementation Strategy - DRAFT
These are Code 4 structures This category also includes other structural BMP upgrades
to existing County BMPs which were designated as under-performing or nonshy
performing
bull Private ESD Retrofits - These projects include ESD on commercial property and
residential property and include green roofs rain gardens and permeable pavement
bull Riparian Reforestation - Focuses primarily on tree planting for riparian buffer
restoration
bull Stream Restoration - Includes the use of natural materials such as rocks logs and native
vegetation to reduce pressure on eroded banks prevent down-cutting of the
streambed and restore the natural meander patterns and slope profiles found in stable
reference streams
bull Programmatic Practices - This category deals with potential pollutant reduction that can
be attributed and quantified through MS4 stormwater pollution prevention
improvements and better housekeeping on County land and facilities Also includes any
pollutant reductions due to product substitution (eg nitrogen and phosphorus limits in
fertilizer) operational programs (eg recycling) and enforcement This category also
deals with reduced pollutants that can be attributed and quantified through MS4
stormwater education (eg lawn care) and outreach aimed at pollution prevention
better housekeeping and increased stewardship
The naming convention applied for the model runs was WTM 10 (ie baseline) WTM 20 (Le
completed and high priority low priority and other potential projects) WTM 30 (Le public
and private ESD) WTM 40 (ie riparian reforestation and stream restoration) and WTM 50
(ie programmatic) Model runs were developed sequentially to yield incremental increases in
load reduction by strategy In practice however strategies can be applied in combination and
out of sequence to achieve targeted outcomes and the most cost-effective solutions A
summary of the scenarios is provided in Table 23 below
021611
Montgomery County Coordinated Implementation Strategy - DRAFT
Table 23 Summary of Watershed Treatment Model (WTM) Scenarios
Implementation Phase Description
The WTM was run under existing conditions approach
WTM Baseline Conditions with the MDP year 2002 land useland cover data and
existing BMPs
WTM 20 Completed as of
2009j High Priorityj Low
Priority and Other Potential
Projects
The WTM was run with a series of future management
practices which were proposed projects from the
County inventory of restoration sites These practices
cover new ponds retrofits of existing BMPs and some
ESD practices from the proposed projects list
The Countys inventory for other project types that
include public properties eg libraries and parkingWTM 30 ESD Strategies and
lots public schools and open section roads available Other Structural BMPs
for ESD retrofits was reviewed as were areas for
private property ESD retrofits
This category includes any pollutant reduction or volume
reduction that can be attributed to specific stream
WTM 40 Habitat rehabilitation wetland restoration and or riparian
Restoration reforestation projects planned for construction in the
watershed for the permit cycle
WTM 50 MS4 Programmatic See description above
Practices
TMDL Calibration and Tracking
Where TMDLs existed for individual watersheds the WTM was run under existing conditions
with existing BMPs based on the year in which the data was collected for TMDL development
The baseline pollutant load was then compared and normalized to the MDE-determined
baseline MS4 load for the TMDL pollutant Any BMPs with approved dates after the year in
which the data was collected for TMDL development were not included in the baseline
calculation but rather were counted towards meeting the TMDL reduction target
Once the normalized model was established reductions achieved through programs and
practices were tracked using the WTM scenarios based on the percent load reduction from
baseline toward meeting the TMDL required WLA The normalized baseline and WLA target are
determined and specified in the relevant TMDL documents developed by M DE
021611
Montgomery County Coordinated Implementation Strategy - DRAFT
3 WATERSHED IMPLEMENTATION PLANS AND RESTORATION POTENTIAL
The watershed implementation plans and pre-assessments developed in conjunction with the
Strategy are driven by regulatory requirements facing each watershed Table 31 summarizes
the drivers by watershed
Table 31 Restoration Objectives -
W~tershedSubwater~hed - Trash
4 bull - I _ _ -
Patuxent
Anacostia
Rock Creek
Great Seneca
Cabin John Creek
lower Monocacy
Watts BranchMuddy Branch
Dry and little Seneca
lower Potomac Direct
Table 32 presents the more detailed and quantitative aspects of the TMDl requirements for
the MS4 portion within each watershed The Strategy has been developed to meet the MS4
permit area WLA compliance targets presented in Tables 32
In addition to the individual watershed requirements there is a Countywide requirement to
comply with the wasteload allocations associated with urban areas under the Chesapeake Bay
TMDl which applies to nutrients and sediment There is an interim target established for 2017
where reductions from baseline conditions of 9 12 and 20 respectively for TN TP and
TSS are to occur Then by 2020 full compliance is required which correspond to reductions
from baseline conditions of 18 34 and 37 respectively for TN TP and TSS
021611
Montgomery County Coordinated Implementation Strategy - DRAFT
Table 32 TMDl Summary by Impairment
Watershed
Cabin John Creek
Rock 2007 Enterococci 970 453669 18195 Creek
Anacostia 2007 Enterococci 860 247809 29978 River
Aoacostia 2008 TN 788 206312 38959 River
Anacostia 2008 TP 797 20953 3947 Ibsyr River
Triadelphia 2008 TP 580 438 Reservoir
Rocky Gorge 2008 TP 480 4268 3628 Reservoir
Clopper Lake 2002 TP 393
Anacostia 2007 TSS 850 7682 River
Triadelphia 2008 TSS Reservoir Clopper 2002 TSS 00 13 13
Lake
Lower 2009 TSS 380010 172 Monocacy
River
Anacostia 2010 Trash 1000 228683 Ibsyr River
Adapted from 2010 Status of Approved Stormwater Waste load Allocations for NPDES Regulated Stormwater Entities in Montgomery County April 27 2010 by Jeff White MDE
Potential to Reduce Stormwater Pollutant loads
Within each of the implementation plans an analysis was developed that explored the
restoration potential for that watershed Cost was not a limiting factor for the analysis but
rather assumptions were made based on feasibility of implementation rates and consideration
of conflicts with typical site conditions with respect to site use utilities land ownership etc
For example it was assumed that 40 of large County-owned parking lots would be available
for stormwater retrofitting These assumptions are necessary for planning purposes where
detailed site investigations have not occurred However some level of implementation is
021611
Montgomery County Coordinated Implementation Strategy - DRAFT
reasonable to assume In addition all identified high priority and low priority County projects
that have the potential to be constructed were assumed to be implemented
Implementation cost and effectiveness (in terms of pollutant load reduced) was also tracked
through the process of determining watershed restoration potential which enables the
costbenefit evaluation of various strategies for a target parameter (eg tons of sediment per
dollar spent or billion MPN of bacteria per dollar etc) For example by tracking cost and
effectiveness it is possible to evaluate the relative costbenefit of a strategy like ESD versus a
non-structural programmatic practice Moreover the comparison of these two strategies is
going to be different depending on what parameter is being considered eg ESD may be more
cost effective for nutrient reduction but less cost effective for bacterial load reduction
The tables in Appendix C help to illustrate this point Specifically a series of summary charts
and tables have been developed that illustrate the cost effectiveness of the range of strategies
considered by watershed with respect to pollutant load reduction The summaries reflect the
full restoration potential developed for each watershed
It is also useful to compare strategy effectiveness and range of opportunity across watersheds
To facilitate this a series of tables were compiled that groups all watersheds together and
considers watershed restoration potential by strategy These summary tables are presented in
Tables 33 through 310
For this analysis stream restoration was treated as a special modeling case (Table 39) because
it was not tracked as a strategy that receives credit for impervious cover treatment and because
it requires a different pollutant load reduction tracking method based on linear feet of
implementation and the existing stream resource condition (good fair or poor IBI scores
received different pollutant removal credit) Further details on stream restoration modeling
are presented in the individual implementation plans and the Guidance Document
Not all WTM scenarios were modeled for all watersheds For example if there were no
previously identified completed high priority low priority or other potential projects within a
watershed they would appear as zeros for that individual watershed in Tables 33 through 36
Also for non-TMDl watersheds such as Great Seneca and Muddy Branch and Watts Branch
subwatersheds the public and private property ESD riparian reforestation and MS4
programmatic practices scenarios were not modeled due to the lack of regulatory drivers that
define pollutant removal targets
021611
Montgomery County Coordinated Implementation Strategy - DRAFT
Table 33 Cost and benefit summary for completed projects (WTM 20)
Watershed Total ESD PrOjects Incremental reduction from baseline ()
i Cost Numberof Impervious
Cost
I Impervious Trash control added TN TP TSS Bacteria
(million $) projects bullbull (ac)
(total) (total)
Anacostia 95 25 167 7 3 4 4 1 4 4
Cabin John 00 0 0 0 0 02 02 03 03 1
Rock Creek 44 6 212 13 1 2 2 3 3 2 i
I Triadelphia 00 0 0 0 0 0 0 0 0 0
Rocky Gorge 00 0 0 0 0 0 01 0 0 0
Lower Monocacy 00 0 0 0 0 0 0 0 0 0
Clopper lake 00 0 0 0 0 0 0 0 0 0
Great Seneca bull 06 2 11 0 0 1 1 I 1 0 2
MuddyWatts 00 0 0 0 0 0 0 0 0 0
Indudes Clopper lake Project count does not include stream restoration Pollutants with a TMDL are highlighted
Table 34 Cost and benefit summary for high priority projects (WTM 20)
Watershed I
I
Total ESD Projects Incremental reduction from baseline ()
Cost
(million $)
i Numberof
projects bullbull
Impervious
control added
(ac)
ICost (total)
Impervious
(total) TN
I TP TSS I TrashBacteria
Anacostia 64 33 148 65 16 2 2 06 2 2
Cabin John 16 6 88 19 2 3 3 3 3 1
Rock Creek 89 14 373 13 1 2 3 3 3 4
Triadelphia 00 0 0 04 0 0 0 0 0 0
I Rocky Gorge 04 2 5 77 27 06 06 07 06 1
Lower Monocacy 00 0 0 0 0 0 0 0 0 0
Clopper lake 00 0 0 0 010 0 0 0 0 0 Great Seneca bull 183 24 789 6 08 19 19 20 0 24
MuddyWatts 44 16 211 8 1 6 6 6 0 6
Indudes Clopper lake bullbull Project count does not indude stream restoration Pollutants with a TMDL are highlighted
Table 35 Cost and benefit summary for low priority projects (WTM 20)
I Watershed Total ESO Projects Incremental reduction from baseline ()
Numberof Impervious ICost 1m ~ i Cost Impervious
I (million $) projects bullbull
control added (total) (total)
TN TP Bacteria Trash
(ac)
I Anacostia 51 16 188 61 8 2 2 07 2 3
Cabin John 16 8 10 98 78 02 02 02 02 03
I Rock Creek 88 24 657 7 1 4 4 6 5 7
Triadelphia 040 1 20 100 100 05 05 06 05 1
Rocky Gorge 09 2 458 100 100 84 82 83 82 116 i
I Lower Monocacy 0 0 0 0 0 0 0 0 0 0 I Clopper lake 0 0 0 0 0 0 0 0 0 0
I Great Seneca bull 66 16 87 41 15 4 4 4 010 4
I MuddyWatts 20 6 26 84 33 0 0 1 0 0
Includes Clopper Lake Project count does not include stream restoration Pollutants wth a TMDL are highlighted
021611
Montgomery County Coordinated Implementation Strategy - DRAFT
Table 36 Cost and benefit summary for other potential projects (WTM 20)
I Watershed Total ESO Projects Incremental reduction from baseline ()
ICost Impervious I Cost
I I Trash INumber of
control added Impervious
TN TP TSS Bacteria (million $) projects bullbull
(ac) (total) (total)
i i
Anacostia 2492 497 2222 73 62 23 8 26 301
Cabin John 00840 1 5 0 010 01 01 01 01 01
Rock Creek 20 4 201 0 0 12 12 19 15 21
Triadelphia 00 0 0 010 0 00 00 00 00 00
Rocky Gorge 20 2 0 010 0 00 00 00 00 00
lower Monocacy 00 0 0 0( 0 00 00 00 00 0010
Clopper Lake 00 0 0 0 0 00 00 00 00 0010
Great Seneca bull 02 S S3 0 0 23 23 27 00 27
MuddyWatts 00 0 0 0 0( 00 00 00 00 0010
bull Includes Clopper Lake bullbull Project count does not include stream restoration Pollutants with a TMDL are highlighted
Table 37 Cost and benefit summary for ESO projects (WTM 30)
Watershed
I
Cost (million $) Impervious
control added
(ac)
Incremental reduction from baseline ()
ESDfor i ESO for private
public
property property
TN TP TSS Bacteria Trash
Anacostia 2378 21296 1813 20 21 7 22 27
Cabin John 878 10307 876 22 23 25 24 28
Rock Creek 2471 341 2427 30 30 33 32 35
Triadelphia 41 47 36 10 1010 11 11 20
Rocky Gorge 312 19 28S 26 27 32 30 46
lower Monocacy 86 29 53 14 15 15 15 010
Clopper lake 08 051 21 14 14 15 0 14
Great Seneca bull 00 0 0 010 0 0( 0( 010
MuddyWatts 00 a 0 0 01 010 0 0
bull Includes Clopper lake Pollutants with a TMDL are highlighted
Table 3B Cost and benefit summary for riparian reforestation (WTM 40)
IWatershed Cost (million $) Impervious
Incremental reduction from baseline ()
control added Habitat restoration (ac) TN TP TSS Bacteria Trash
Anacostia 1 6 0 0 0 01 02
Cabin John 777 39 1 2 lili
3
Rock Creek 24 119 2 2 2 5
Triadelphia 010 1 01 02 01 04 03
Rocky Gorge 25 12 1 2 2 3 8
lower Monocacy 11 S 3 3 3 4 0
Clopper Lake 023 2 4 4 2 010 4
Great Seneca bull 0 a 010 010 0 010 0
MuddyWatts 0 0 010 0 0 0 0
bull Includes Clopper lake Pallutonts with a TMDL are highlighted
021611
Montgomery County Coordinated Implementation Strategy - DRAFT
Table 57 Cost and benefit summary for stream restoration (WTM 40)
Watershed Stream Restoration Incremental reduction from baseline ()
Number of Impervious control
Cost (million $) added(ac) TN TP TSS Bacteria Trash projects
Anacostia 937 200 0 42 56 326 0 0
Cabinlohn 162 15 0 17 9 80 0 0
Rock Creek 201 30 a 9 710 100 0 0
Triadelphia 00 0 0 0 0 0 010 0
Rocky Gorge 191 18 I 0 10 7 36 0 O lower Monocacy 73 nla 0 7 10 32 010 0
Clopper Lake 00 a 0 0 0 0 0 0
Great Seneca It I 259 33 0 19 8 16 0 0
MuddyWatts 242 45 0 16 7 13 0 0
Includes Clopper Lake Pollutants with a TMDL are highlighted
Table 58 Cost and benefit summary for M54programmatlc practices (WTM 50)
Watershed Cost (million $) Incremental reduction from baseline ()
Programmatic
practices - M54
Impervious control
added (ac) TN TP TSS Bacteria Trash
Anacostia 36 0 9 9 10 8 82
Cabin John 047 0 15 14 0 10 0
Rockereek 12 0 11 11 0 7 0
Triadelphia 00056 a 23 3 0 0 0
Rocky Gorge 009 0 38 8 03 5 2
lower Monocacy 007 0 0 0 19 0 0
Clopper Lake 0Q1 0 61 30
~=r 0
Great Seneca 10 0 0 0 0 0Y0 0 0
MuddyWatts 0 0 0 0 0 0 0
bull Includes Clopper Lake Pollutants with a TMDL are highlighted
021611
Montgomery County Coordinated Implementation Strategy - DRAFT
4 COORDINATED IMPLEMENTATION STRATEGY
The Strategy has multiple objectives to accomplish whereby a challenging balance between
strategies and timeframe is required There isnt necessarily a correct answer in the process
but rather an optimized result that addresses an agreed upon suite of priorities The Strategy
presented here was primarily driven by known and established regulatory timeframes and
compliance endpoints Meeting these endpoints using the more cost effective approaches was
also given priority After this consideration was given to other known and important
approaches that stakeholders and the County have an interest in pursuing Specifically the
following compliance dates and objectives were conSidered in developing the Strategy over the
long-term (Table 41)
Table 41 Compliance Targets for Countywide Coordinated Implementation Strategy
Target Date
2015
2017
2020
Compliance Target
Meeting 20 impervious cover treatment requirement
within the MS4 Permit cycle
Meet the interim dates and targets for the Chesapeake
Bay TMDL which include specific regulated urban area
reductions by 2017 for nutrients and sediment (based
on Maryland Department of the Environments
Watershed Implementation Plan)
Meet the full compliance and targets for the
Chesapeake BayTIVIDL which include specific regulated
urban area reduction by 2020 for nutrients and
sediment (based on Maryland Department of the
Environments Watershed Implementation Plan)
Metric
~4300 acres of
Impervious Cover
9 12 and 20
respectively for TN TP
and TSS reductions
from baseline
conditions
18 34 and 37
respectively for TN TP
and TSS reductions
from baseline
conditions
2025
2030
Meet additional impervious cover treatment targets
associated with next MS4 Permit cycle (assumes
another 20 target)
Meet additional impervious cover treatment targets
associated with next MS4 Permit cycle (assumes
another 20 target)
Out year compliance with other watershed TMDLs
~3400 acres of
Impervious Cover (20
of impervious
remaining after 2015)
~2750 acres of
Impervious Cover (20
of impervious
remaining after 2020)
100 compliance with
MS4 Permit Area WLAs
021611
Montgomery County Coordinated Implementation Strategy - DRAFT
To meet the compliance targets outlined in Table 41 the following priorities were generally
followed
bull 100 implementation of completed high and low priority County projects in first five
years (by 2015)
bull Greater ESD focus in urban (as opposed to suburban and rural) watersheds initially Goal
for ESD in these watersheds on pUblic property in first five years is 10 and on private
property is 10 The level of implementation was largely driven by the 20 Countywide
impervious goal
bull 100 of Public Outreach Potential for all TIVIDl watersheds in first five years This was
pursued to address trash nutrient and bacteria loading which rely strongly on effective
outreach programs to modify behaviors
bull Generally limited strategies to the top four most cost effective per watershed
bull Habitat restoration (stream restoration and buffer reforestation) not pursued as priority
until after first five year period These programs emphasize greater pollutant reduction
efficiency rather than impervious cover treatment which is the primary focus for the
first permit cycle
The Strategy was informed by the individual watershed implementation plans for seven
watersheds which included the Clopper lake and Patuxent subwatersheds Therefore in order
to develop countywide estimates for pollutant load reduction (as is required by the Chesapeake
Bay TMDl) watershed area weighting was applied The process for developing the Countywide
strategy and individual watershed implementation plans was woven together Once the
restoration potential was determined from the individual plans the strategy and schedule was
compiled using the restoration potentials and the drivers listed above The final restoration
cost and schedule was then placed in the implementation plans
It is also worth noting that the high and low priority projects along with the other potential
projects strategies represent a static or fixed number of projects that have been identified by
the County For this analysiS this list of practices is not replenished and therefore once all
opportunities have been implemented other strategies are pursued In reality the County will
continue to develop and update its list of specific project opportunities and have these
available for implementation in future years
The output from this effort is presented in a series of tables ordered by target date in Appendix
D In addition Table 42 provides an overall summary of pollutant load reduction tracking
versus time Through inspection of Table 42 it can be seen that the Strategy meets the
021611
Montgomery County Coordinated Implementation Strategy - DRAFT
impervious cover treatment targets under the current MS4 permit (as well as projected targets
for 2020 and 2025 assuming a continued 20 treatment requirement) interim and final
Chesapeake Bay nutrient and sediment reduction targets by 2017 and 2020 respectively and
out year MS4 permit area WLA compliance for the majority of pollutants Exceptions include
meeting the bacteria WLA load reductions required for the Anacostia and Rock Creek
021611
Montgomery County Coordinated Implementation Strategy - DRAFT
Table 42 Projection by Phase for Watersheds and Pollutants PermitTMDL Targets
Watershed Fiscal Year 2015 2017 2020 2025 2030 2017 2020
Impervious Treated (acres) 1421 2393 3364 4272 4544
ESD ( Impervious) 26 44 61 69A 71
Cost (Million $) 160 307 486 732 820
E5D( Cost) 45 62 71 78 78
Anacostia Nitrogen 25 39 68 89A l00A 818 82
Phosphorus 27 42 77 100 100 812 81
i Sediment 47 72 100 l00A) l00A 875 88
Bacteria 21 33 46 59A 64 879 88
Trash 41 65 89 l00A) 100
Impervious Treated (acres) 1541 1961 2381 3625 3989
ESD ( Impervious) 17 28 36 57A 61
Cost (Million $) 87 172 262 566 658
ESD ( Cost) 7(JA 79 79A 89A 9(JA
Rock Creek Nitrogen 24 30 38 55 61
Phosphorus 25 3(JA 38 54 GfJA)
Sediment 38 50 92 l00A 100
Bacteria 21 27 33 5(JA 55 96(JA 96
Trash 17 24 31 5(JA) 55
Impervious Treated (acres) 187 380 570 1018 1018
ESD ( Impervious) 52 72 78 87A 87A
Cost (Million $) 23 65 114 215 219
ESD ( Cost) 92 91 86 90 88
Cabin John Nitrogen 21 27A 39A 55 58 Phosphorus 2(JA 26 35 49 51
Sediment 6 17 GfJA 91 100
Bacteria 16 22 27 4(JA) 40 31 31
Trash 6 12 19 34 34
Impervious Treated (acres) 237 237 237 237 237
ESD ( Impervious) 4 4 4 4 4
Cost (Million $) 6 8 19 25 31
ESD ( Cost) 32 27A 11 8 7
Muddy Watts Nitrogen 6 7 15 18 22
Phosphorus 6 7 10 12 13 Sediment 7 8 14 17 2(JA
Bacteria 0 (JA 0 (JA 0 i Trash 6 6 6 6 6
bull Impervious Treated (acres) 901 921 941 941 941 ESD ( Impervious) 2 2 2 2 2
Cost (Million $) 26 48 SO 51 52 ESD ( Cost) 15 8 8 8 8
Great Seneca Nitrogen 24 41 43 44 45
Phosphorus 24 32 34 34 34
i Sediment 26 41 43 44 44
I Bacteria (JA) 0 0 0 (JA
Trash 31 32 33 33 33
021611
Montgomery County Coordinated Implementation Strategy - DRAFT
Pe rmitTMDL Targets
Watershed Fiscal Year 2015 2017 2020 2025 2030 2017 2020
Clopper
Impervious Treated (acres) 0 6 12 22 22
ESD ( Impervious) 0 86 86 92 92
Cost (Million $) 0 0 1 2 2
ESD ( Cost) 0 72 73 84 84
Nitrogen 61 67 72 79 79
Phosphorus 30 36 41 48 48 45 45
Sediment 0 5 10 17 17
Bacteria 0 0 0 0 0
Trash 0 6 11 18 18
Lower Monocacy
Impervious Treated (acres) 1 16 32 58 58
ESD ( Impervious) 100 85 84 91 91
Cost (Million $) 0 4 11 18 20
ESD ( Cost) 100 85 54 63 58
Nitrogen 0 5 14 22 24
Phosphorus 0 5 16 26 28
Sediment 0 5 46 61 69 608 61
Bacteria 0 6 12 19 19
Trash 0 0 0 0 0
Rocky Gorge
Impervious Treated (acres) 11 88 165 307 307
ESD ( Impervious) 64 89 90 95 95
Cost (Million $) 3 17 40 70 75
ESD ( Cost) 55 82 64 73 68
Nitrogen 47 55 6710 82 85
Phosphorus 17 25 36 52 53 15 15
Sediment 10 19 45 7(J1o 79
Bacteria 14 23 32 47 47
Trash 15 30 46 68 68
Triadelphia
Impervious Treated (acres) 3 12 20 38 38
ESD ( Impervious) 100 98 97 99 99
Cost (Million $) 1 3 5 9 9
ESD ( Cost) 99 98 98 99 99
Nitrogen 24 27 29 34 34
Phosphorus 4 7 9 14 14 15 15
Sediment 1 4 6 12 12
Bacteria 1 4 6 12 12
Trash 2 6 11 21 21
Countywide
Impervious Treated (acres) 4302 6014 7722 10518 11154 6008 7723
ESD ( Impervious) 18 34 47 6(J1o 63
Cost (Million $) 305 622 987 1687 1884
ESD ( Cost) 53 66 7(J1o 8(J1o 80
Nitrogen 18 25 36 46 51 9 2(J1o
Phosphorus 17 23 34 44 46 12 34
Sediment 23 34 54 6(J1o 62 20 37
Bacteria 11 15 20 28 30
Trash 18 26 33 41 42
Assumptio~s
1 Does no~ includerepeated Outreach and Education costs beyond FY2015
2 Does not include ~n inflation multiplier
021611
Montgomery County Coordinated Implementation Strategy - DRAFT
Summary of Individual Implementation Plans
A summary of the general considerations and prioritization for each watershed implementation
plan is provided below
Anacostia - For the first permit cycle (through 2015) a priority was placed on full
implementation of completed high and low priority projects Next implementation of a third
of the other potential projects was targeted as a large number of these were identified in
conjunction with the USACEs Anacostia Watershed Restoration Plan efforts ESD was
emphasized on both public (10) and private property (10) Finally outreach (25) and
stream restoration (12) are targeted for pollutant load reduction but are not credited towards
impervious cover credit In future permit cycles the remainder of the other potential projects
are targeted along with ESD and a limited amount of riparian reforestation for impervious cover
and pollutant load reduction Outreach and stream restoration are significant strategies
pursued for load reduction benefits Nutrient and sediment MS4 permit area WLAs are met by
2030 but bacteria load reduction does not meet MS4 permit area WLA compliance The
remaining bacteria reduction is believed to be associated with urban wildlife sources Unless
intense urban wildlife management practices are implemented this remaining load reduction
will not be possible
Rock Creek- For the first permit cycle (through 2015) a priority was placed on full
implementation of complete high and low priority projects Next 25 implementation of
other potential projects was targeted ESD was emphasized on both public (10) and private
property (10) with private property implementation being linked to Rainscapes Program
success Finally outreach (100) and stream restoration (22) are targeted for pollutant load
reduction but are not credited towards impervious cover credit In future permit cycles the
remainder of the other potential projects are targeted along with ESD and riparian
reforestation for impervious cover and pollutant load reduction Stream restoration is a
significant strategy pursued for load reduction benefits The bacterial load reduction does not
meet MS4 permit area WLA compliance However the remaining bacterial load is believed to
be associated with urban wildlife sources Unless intense urban wildlife management practices
are implemented this remaining load reduction will not be possible
Cabin John Creek - Similar to the other two more urban watersheds in the County during the
first permit cycle (through 2015) a priority was placed on full implementation of complete high
and low priority projects Fewer opportunities exist overall compared to the Anacostia and Rock
Creek Next 25 implementation of other potential projects was targeted ESD was
emphasized on both public (10) and private property (10) Finally outreach (100) was
021611
Montgomery County Coordinated Implementation Strategy - DRAFT
targeted for pollutant load reduction but not credited towards impervious cover credit No
riparian reforestation or stream restoration was targeted due to limited or no opportunities In
future permit cycles the remainder of the other potential projects are targeted along with ESD
and some riparian reforestation for impervious cover and pollutant load reduction The
bacteria load reduction meets MS4 permit area WLA compliance by 2025
Muddy BranchWatts Branch - During the first permit cycle (through 2015) a priority was
placed on full implementation of complete high and low priority projects Fewer opportunities
exist overall compared to the Anacostia and Rock Creek Watersheds No other strategies were
pursued as there are no existing TMDLs in the Muddy BranchWatts Branch subwatersheds In
future permit cycles previously identified stream restoration projects are implemented for
pollutant load reduction
Great Seneca Creek - This watershed implementation plan is unique in that it includes the small
Clopper Lake subwatershed which has a TMDL for phosphorus Even with the TMDL there are
limited identified opportunities to pursue in the Clopper Lake subwatershed in part due to the
limited area of the subwatershed within the County MS4 permit area During the first permit
cycle (through 2015) a priority was placed on full implementation of complete high and low
priority projects within Great Seneca Creek subwatershed No opportunities exist for these
strategies in Clopper Lake However full outreach was applied in Clopper Lake in the first
permit cycle In future years other potential projects ESD on public and private property and a
small amount of riparian reforestation (in Clopper Lake) is pursued The Clopper Lake WLA for
phosphorus within the MS4 permit area is met
Patuxent - During the first permit cycle through 2015 a priority was placed on full
implementation of complete high and low priority projects Far fewer opportunities exist
overall compared to the Anacostia and Rock Creek A limited amount of ESD on private land
and stream restoration was pursued Finally outreach (100) was targeted for pollutant load
reduction (primarily nutrients) but not credited towards impervious cover credit No riparian
reforestation was targeted within the MS4 Permit area due to cost effectiveness in the Rocky
Gorge subwatershed and limited opportunities in the Triadelphia subwatershed In future
permit cycles ESD on private and public land is pursued more substantially as is stream
restoration A limited amount of riparian reforestation achieves some impervious cover and
pollutant load reduction The Rocky Gorge phosphorus WLA within the MS4 permit area is met
easily and the Tridelphia phosphorus WLA is also met but with a longer timeframe needed for
compliance
021611
Montgomery County Coordinated Implementation Strategy - DRAFT
Lower Monocacy Creek -lower Monocacy Creek is the most rural watershed in the County and
has the least amount of area subject to the County MS4 permit In addition there are no preshy
identified restoration projects within the watershed Therefore during the first permit cycle
(through 2015) only a very small amount (5) of private property ESD is pursued It is not until
the second permit cycle that more focus is placed on private and public ESD as well as stream
restoration and programmatic strategies such as street sweeping to target sediment loads
associated with the TM Dl In future permit cycles stream restoration is pursued for pollutant
load reduction The sediment WlA within the MS4 permit area is projected to be met around
2025
Countywide - The Countywide effort was driven by impervious cover treatment targets and
Chesapeake Bay TMDl2017 and 2020 reduction targets associated with sediment and nutrients
for urban MS4s For impervious cover it was assumed that a 20 target would be required for
each five-year permit cycle The Bay TMDl targets for urban MS4 areas were easily met for all
pollutants in 2017 and easily met for nitrogen and sediment but more difficult to meet for
phosphorus in 2020
Public Outreach and Stewardship
The County recognizes and is committed to the increasingly important role that public outreach
and stewardship will play if improved water quality conditions are going to be achieved
countywide While the County currently has a very active and layered outreach program the
model requires changes that will result in broader stakeholder groups serving as the leaders
and primary champions for clean water in their communities This includes greater participation
from minority and faith-based groups business consortiums schools neighborhood
associations and civic groups Additionally the new model requires revisiting current
initiatives carried out by the various County agencies to look for better and more efficient ways
to communicate messages cross-train and create synergies that result in greater engagement
greater awareness and sustained changes in behavior
Within each implementation plan specific suggestions for outreach and education
opportunities are identified In addition Appendix E of this Strategy contains practice sheets
which highlight targeted restoration activities for the County to develop and refine A total of
eight practices have been identified that can be adopted countywide or in more targeted
watershed areas where there are specific water quality issues to address Many of the
practices build upon existing County programs but require a much broader reach to new
partner groups Program start up costs are suggested and were used to for cost estimates
associated with Countywide strategy The highlighted practices include
021611
Montgomery County Coordinated Implementation Strategy - DRAFT
bull Pet Waste Pickup Education and Outreach Campaign
bull Lawn Stewardship Education and Outreach Campaign
bull Anti-littering Education and Outreach Campaign
bull Innovative Stormwater Management Awareness Campaign
bull Stream Stewards Education and Outreach Campaign
bull Riparian Reforestation Education and Outreach Campaign
bull Roof Runoff Reduction Education and Outreach Campaign
bull Parking Lot Recharge Value Education and Outreach Campaign
Start up costs by practice along with an overall five year cost estimate are provided in Table
43 Start up timeframes are assumed to be up to 18 months
Table 43 Outreach Start Up and 5-Year Cost Projections
Practice Practice Start Up Cost
Pet Waste Pickup $240500
Lawn Stewardship $301 600
Anti-Littering $175050
Stormwater Management Improvements Awareness $50450
Stream Stewards $74825
Riparian Reforestation $30575
Roof Runoff Reduction $101400
Parking Lot Recharge Value $41500
Estimated Start Up Total $744900
5-Year Outreach Budget Projection $2650000
These eight practice sheets provide specific costs and timelines for implementation They also
provide suggestions for measuring program success These practice sheets along with the
specific recommendations in the implementation plans make up the Public Outreach and
Education Campaign
Trash Reduction
Most of the implementation plans have to address trash loadings to meet requirements of the
Potomac Trash Treaty that is referenced in the County1s MS4 Permit In addition the Anacostia
Trash TMDL has recently been accepted by MDE and the EPA According to the Anacostia
021611
Montgomery County Coordinated Implementation Strategy - DRAFT
TMDl there is reasonable assurance that the goals of the Treaty and TMDl can be met with
proper watershed planning implementing pollution-reduction BMPs and using strong political
and financial mechanisms
Currently the County has a number of activities which target trash reduction They include the
following
bull Adopt-a-Road Program through DOT which focuses on public awareness and involvement in trash management There are 205 participants who adopted road segments and agreed to six major road cleanups per year
bull Storm Drain Marking through DOT bull Support for illegal dumping enforcement outreach and research and monitoring bull Partnership with DOT to conduct street sweeping covering about 2500 curb miles and
occurring once a year
bull Partnership with the Park Police to monitor illegal dumping which combined enforces 300-400 actions a year
bull Non-residential and residential recycling programs through Solid Waste Services (SWS) bull Transit stop trash management program at 600 bus stops countywide supported by DOT
Transit Services
In addition to continuing these efforts a number of trash good-housekeeping efforts have been
proposed as part of this Strategy A detailed description of the quantitative methods and
strategies applied can be found in Appendix E of the Guidance Document In general the
following six trash-reduction strategies are recommended
1 Significantly increase funding for trash reduction programs 2 Create and enhance regional partnerships and coordination among businesses
environmental groups individual citizens and government at all levels and in all jurisdictions
3 Improve peoples awareness knowledge and behavior relating to littering and illegal dumping
4 Promote the greater introduction and use of effective trash-reduction technologies and approaches
5 Improve enactment and enforcement of laws to reduce trash 6 Increase trash monitoring-related data collection generation and dissemination efforts
The Anacostia watershed implementation plan provides an outline of the actions that will be
taken through the first permit cycle to reduce trash The range of programs and practices
specially aimed at reducing trash inputs to roads and streams that will be targeted include
reduce reuse and recycle campaigns littering and illegal dumping enforcement stream
cleanups and street sweeping These measures are in addition to any trash trapped and
021611
Montgomery County Coordinated Implementation Strategy - DRAFT
removed by structural practices which are computed using the WTM The plan shows that the
trash TMDl can be met by 2025 at a cost of 732 million dollars
Adaptive Management Monitoring and Reporting
Sound implementation strategies require assessment and effective adaptation to respond to
new information changing conditions new technologies and lessons learned This will be the
basis of the plan that will be used when benchmarks are not met and the projected funding is
inadequate
Adaptive management requires monitoring of a variety of measures that can be used to
determine whether progress is being made towards meeting the Countywide water quality
objectives Ultimately it is the instream water quality and the loading limits with respect to the
TMDls that determine the success of implementation however there are many interim
measures that can also be correlated to success which are worthwhile pursuing
Surface water monitoring can be an expensive and time consuming undertaking Montgomery
County is fortunate to have an extensive Countywide stream monitoring network that can serve
as a foundation for providing spatial and temporal data to indicate stream health The Countys
MS4 Permit also outlines the required assessment of controls which includes chemical
biological and physical monitoring Specifically the permit calls for the County to continue
their watershed restoration monitoring of the lower Paint Branch subwatershed and physical
monitoring ofthe Clarksburg Special Protection area In addition to the existing monitoring
network the County will continue tracking and data reporting associated with levels of
implementation (eg acres of impervious cover treated areas of buffer planted miles of
stream restored miles of streets swept) For measuring effectiveness of outreach and
stewardship efforts other types of monitoring and reporting are planned that include before
and after attitude surveys frequency of website visits and information requests
For many restoration strategies it may be difficult to tease out their individual effectiveness in
terms of pollutant load reductions but collectively the monitoring that occurs should provide
adequate insight into the overall effectiveness of a layered implementation strategy
In addition to the monitoring and assessment the County will be reporting results on an annual
basis as part of their NPDES MS4 Permit annual report The MS4 Permit requires annual
reporting of the following
021611
Montgomery County Coordinated Implementation Strategy - DRAFT
bull The status of implementing the components of the stormwater management program
that are established as permit conditions
bull A narrative summary describing the results and analyses of data including monitoring
data that is accumulated throughout the reporting year
bull Expenditures for the reporting period and the proposed budget for the upcoming year
bull A summary describing the number and nature of enforcement actions inspections and
public education programs
bull The identification of water quality improvements and documentation of progress
toward meeting applicable WLAs developed under EPA approved TMDLs and
bull The identification of any proposed changes to the Countys program when WLAs are not
being met
The County will build upon annual reporting that has historically occurred to meet permit
requirements and will supplement this reporting with tracking table summaries that quantify
implementation activities for the range of strategies pursued during that year and the
associated treatment (eg impervious cover treated pollutant load reduced education and
outreach partners established etc) Cost will also be tracked in association with rates of
implementation This level of performance will then be compared with countywide strategy
targets (eg progress towards meeting WLAs) associated with key performance dates such as
those presented in Table 41 The level of progress achieved by the County will then feed into
the adaptive management approach described above
Organization Needs to Implement Strategy
Montgomery County DEP staff possesses substantial expertise and institutional knowledge that
yields many positive outcomes and efficient processes under the current pace of restoration
and permit compliance activities Under this strategy however the pace of implementation is
required to significantly increase Based on an increase in the level of implementation it is
reasonable to assume that additional capacity may be needed to provide sufficient oversight
and management of all the projects
Another critical element of this strategy is the recognition and commitment to pursuing
outreach initiatives that build community capacity by targeting new partner groups that
provide the necessary leadership oversight and sustained effort to change behaviors and
foster stewardship The County currently carries out many well established and managed
outreach programs but it may require additional focus across County agencies and
departments for these partnerships to become established and thrive
021611 G
Montgomery County Coordinated Implementation Strategy - DRAFT
Through the implementation process and the monitoring and reporting that is required large
amounts of data will be generated Technological advances happen so rapidly in this day and
age it will be important for the County to stay current with technology and methods so that
more efficient and cost-effective data management and reporting will be possible The County
currently relies on a detailed and sophisticated GIS to spatially locate projects and manage
tables of data related to projects The growth and development of this spatial database will be
a critical component of the reporting and tracking capability of the County These databases
generate the input data that are used to measure progress towards baseline loading targets
Regular review and upkeep of the data as well as routine summarization of progress (annually
at a minimum) will likely require additional dedication of staff This is especially the case during
periods where the implementation rate of structural practices in the ground is accelerated
021611
Montgomery County Coordinated Implementation Strategy - DRAFT
Appendix C - Restoration Potential by Watershed
021611
c-
04 03 02 01
a
_ Nitrogen Load Reduction
--shy TMDL WLA Target
_Cost
MONTGOMERY COUNTY URBAN WATERSHEDS POLLUTANTS _Bk)~Ibilats ~1~ l~ fjfsi --
Rank
1
2
3
4
5
6
7
8
9
10
11
Restoration Strategy TN reduction
Ibsyr
Pet Waste Education 15169
Retrofit of Underperforming BMPs 1769
Stream Restoration 72423
Completed Projects ~43 High Priority Projects 3260
Other Potential Projects 43276
Habitat Restoration 224
Public Property ESD Retrofits 18270
Priority Neighborhoods ESD Retrofits 9271
Private Non-residential ESD Retrofits 5594
Street Sweeping -
Incremental Cost Unit Cost
Million $ IbsMillion $ 088 17193
120 1475
9304 778
948 701
635 513
25430 170
141 158
23655 77
13278 70
8018 70
124 -
Qj c
Qj
nI CXI
o -f-
1 09 08 07 06 05
$900 $800 $700
~ $600 c $500 ~ $400 $300 0 u $200 $100
$shy
~~mf il_~IJrt~
MONTGOMERY COUNTY URBAN WATERSHEDS POLLUTANTS ItfiQ14lbilJts i~5 [i
1 $900 Qj
09 $8005 iii en 08 $700
~co 07 $600 co - til
06 $500 ~ 05- $400 ~ 04 en$300 003 u $20002
en $100I 01 o 0 $shys Q en o
s Q
Phosphorus Load Reduction
--- TMDL WLA Target
__Cost
I Rank I
1
2
3
4
5
6
7
8
9
Restoration Strategy
Pet Waste Education
Retrofit of Underperforming BMPs
Stream Restoration
Completed Projects
High Priority Projects
Habitat Restoration
Other Potential Projects
Public Property ESD Retrofits
Priority Neighborhoods ESD Retrofits
10 I Private Non-residential ESD Retrofits
11 Street Sweeping
TP reduction Incremental Cost Unit Cost
Ibsyr Million $ IbsMillion $ 1979 088 2243
247 120 206
13097 9304 141
915 948 96
451 635 71
37 141 26
6067 25430 24
2546 23655 11
1294 13278 10
781 8018 10
- 124 -
MONTGOMERY COUNTY URBAN WATERSHEDS POLLUTANTS IItQjQhabillt$middot
Cii 5 Cii 11 It CD
6 ~ r o ~ s
0 ltIIa r ltII e c ltII III
1 09 08 07 06 05 04 03 02 01
0
$900
$800 $700
v$600 r
0 $500 == $400 $300 11
0 u $200 $100
$shy
_ Sediment load Reduction
--- TMDl WlA Target
__Cost
Rank Restoration Strategy
Sediment reduction
Incremental Cost
Unit Cost
tonsyr Million $ tonsMillion $ 1 Street Sweeping 800 124 645
2 Stream Restoration 25057 9304 269
3 Retrofit of Underperforming BMPs 25 120 21
4 Completed Projects 97 948 10
5 High Priority Projects 47 635 7
6 Other Potential Projects 660 25430 3
7 I Public Property ESD Retrofits 272 23655 1
8 Priority Neighborhoods ESD Retrofits 139 13278 1
9 Private Non-residential ESD Retrofits 84 8018 1
10 Habitat Restoration 2 141 1
11 Pet Waste Education - 088 -
C-3
MONTGOMERY COUNTY URBAN WATERSHEDS POLLUTANTS
-QI5 5i ~
1 09 08 07 06 05 04 03 02 01
0
$900
$800
$700
$600 ~ 0
$500 == $400 $300 11
0 u $200
$100
$shy
--shy TMDL WLA Target
___ Cost
Rank Restoration Strategy
Enterrococci reduction
Incremental Cost
Unit Cost
Billion MPNyr Million $ Billion MPN Million $
1 Pet Waste Education 19643 088 22263
2 Retrofit of Underperforming BMPs 2781 120 2318
3 Completed Projects 10441 948 1101
4 High Priority Projects 5120 635 806
5 Other Potential Projects 69895 25430 275
6 Riparian Reforestation 310 141 219
7 Public Property ESD Retrofits 29025 23655 123
8 Priority Neighborhoods ESD Retrofits 14777 13278 111
9 Private Non-residential ESD Retrofits 8917 8018 111
10 Stream Restoration - 9304 -
11 Street Sweeping - 124 I -
~ I~~~i MONTGOMERY COUNTY URBAN WATERSHEDS POLLUTANTS 1tI2~mL ~ I~I
~$ I -~-- I
100 90 80 70 60 50 40 30 20 10
0
$900 $800 $700 $600 $500 $400 $300 $200 $100 $shy
vi c
~ 5 11 0 u
Implementation Phase
Potential Trash Incremental Unit Cost
I
Rank Restoration Strategy Reduction Cost
Ibsyear Million $ IbsMillion $ 1 Recycling Education and Investigations 51654 02 238837
2 Plastic Bag Ban and Misc Enforcement 63546 13 48882
3 Anti-litter Campaign Education 23J61 09 26930
4 Retrofit of Underperforming BMPs 1144 12 954
5 Completed Projects 6598 95 696
6 High Priority Projects 2786 64 439
7 Other Potential Projects 56341 2543 222
8 Habitat Restoration 266 14 188
9 Street Sweeping 204 12 164
10 Public Property ESD Retrofits 25348 2366 107
11 Priority lIeighborhoods ESD Retrofits 12529 1328 94
12 Private Non-residential ESD Retrofits 7547 802 94 ru Stream Restoration - 930 -14 Pet Waste Education - 09 -
C-5
MONTGOMERY COUNTY URBAN WATERSHEDS POLLUTANTS
CABIN JOHN
1 250
__CostImplementation Phase
09 08 07 06 05 04 03 02 01
0
200 ~ c
150 g E
100 - ltII 0 u
50
0
_E Coli
- - - Waste Load Allocation
Rank Restoration Strategy
E coli reduction
Incremental Cost
Unit Cost
Billion
MPNyr Million $
Billion MPN
Million $ 1 Pet Waste Education 4388 $05 9436
2 Underperforming BMP Retrofits 1892 $19 1022
3 High Priority Projects 1289 $16 800
4 Riparian Reforestation 1133 $78 146
5 Other Potential Projects 148 $17 86
6 Public Property ESD Retrofits 4AOO $860 Sl 7 Private Non-residential ESD Retrofits 1618 $392 41
8 Priority Neighborhoods ESD Retrofits 2633 $638 41
9 Completed Projects 112 $00 0
C-6
MONTGOMERY COUNTY URBAN WATERSHEDS POLLUTANTS 1Itf~~Jabitm
ROCK CREEK
1 $700 Qj5 09
o
_
$600 Qj 08
111 $500 ~ampl 07 c
t5 06 $400 ~ e 05 ~ $3005 04 - 111tl 03 $200 0 u-6 02
$100J 01 $-
Enterrococci
- - - Waste load Allocation Implementation Phase
__Cost
Rank Restoration Strategy
Enterrococci reduction
Incremental Cost
Unit Cost
Billion MPNyr Million $ Billion MPN Million $
Et Pet Waste Management 35734 118 30190
Underperforming BMP Upgrades
Other Potential Projects
28800
30239
577
1083
4995
2792
4 Completed Projects 12131 444 2734
5 High Priority Projects 14239 890 1600
6 Riparian Reforestation 18999 2384 797
7 County Property ESD Retrofits 54519 24136 226
8 Private Residential ESD Retrofits 35230 17737 199
9 Private Non-residential ESD Retrofits 32A86 16380 198
C-7
MONTGOMERY COUNTY URBAN WATERSHEDS POLLUTANTS _f~~pabitafS (fi~r ~~ l-middotshy
ROCK CREEK
100 $900 90 $800 80 $700 u70 $600 c 60 2$50050 -~$40040
lt1$300 030 $200 u
20 10 $100
0 $shy
Implementation Phase
Rank Restoration Strategy Trash Reduction
Incremental Cost
Unit Cost I
Ibsyear Million $ IbsMillion $ 1 Other Potential Projects 16038 1085 1478
2 Underperforming BMP Upgrades 6756 577 1172
3 Completed Projects 4217 444 950
4 High Priority Projects 6366 890 715
5 Riparian Reforestation 9237 2384 387
6 Public Property ESD Retrofits 24587 24136 102
7 Priority Neighborhoods ESD Retrofits 16155 17737 91
8 Private Non-residential ESD Retrofits 14793 16380 90
9 Pet Waste Education - 118 -
(-8
MONTGOMERY COUNTY RURAL WATERSHEDS POLLUTANTS
SENECA - CLOPPER LAKE -
100 Qi
90 iii 80VI to -CQ 70 0 60e 50I 0 40 u l 30
C QJ 20ex
C 10to 0
J 0
$18
$16
$14 n
$12 I
$10 sect $08 ~ $06 0
VI
U $04
$02
$shy
_TPRemoval - - - TMDL Reduction Target
Implementation Phase ___Cost
Rank Restoration Strategy TP
Reduction (Ibsyr)
Incremental Cost (Million $)
Unit Cost (IbsvrMillion $)
1 Residential Education 33 001 6246
2 Underperforming BMP Retrofits 13 004 341 3 Riparian Buffer Reforestation 19 023 99 4 Priority Neighborhood ESD Retrofits 15 051 35 5 Public Property ESD Retrofits 7 075 99
C-9
-pj[fti
MONTGOMERY COUNTY URBAN WATERSHEDS POLLUTANTS 1It[~~JIlbitIL f bull~
LOWER MONOCACY
1 09 08 07 06 05 04 03 02 01
0
Implementation Phase
25
20 ~ c
15 ~ ~
10 - 0 u
5
0
_TSS
- - - Waste load Allocation _Cost
Rank Restoration Strategy
Sediment reduction
Incremental
Cost Unit Cost
tonsyear Million $ tonMilli
1 Street Sweeping 22 $007 3121
2 Underperforming BMP Retrofits 4 $010 389
3 Stream Restoration 37 $734 51
4 Riparian Buffer Reforestation 3 $109 25
5 Other Structural BMPs and ESD Strategies 10 $851 12
6 Priority Neighborhoods ESD Retrofits 2 $160 10
7 Non-residential ESD Retrofits 1 $132 10
C-10
MONTGOMERY COUNTY RURAL WATERSHEDS POLLUTANTS 1tlj~lIbiIalSlt~~II
1 09 08 07 06 05 04 03 02 01
0
$70
$60
$50 ~ c
$40 ~ ~ $30 - UI
$20 0 v
$10
$0
_ Phosphorus Load Reduction
- - - Waste Load Allocation ___ CostImplementation Phase
Rank Restoration Strategy TP Incremental Cost
Million $ Unit Cost
Ibsyr Ibs Million $ 1 Lawn Care Education 3670 01 37394
2 Underperforming BMP Retrofits 3499 08 4338
3 Other Potential Projects 3524 33 1076
4 High Priority Projects 252 04 685
5 Riparian Reforestation 762 26 298
6 Public Property Retrofits 5854 345 169
7 Priority Neighborhoods ESD Retrofits 796 65 123
8 Private Non-residential ESD Retrofits 1941 168 116
9 Completed Projects 53 00 00
c- 11
MONTGOMERY COUNTY RURAL WATERSHEDS POLLUTANTSal12hdJilats ~I~ ~ [ -
1 10 ii 5 09 9 1 08 8 II al- 07 7 1ii o 06 6
c
~ ~ 1 o E IV
05 04 03
5 4
3
~ 11 0 u
0 11 02 2 J o 01 1
t a 0 0 11 o
t 0
_ Phosphorus Reduction
- - - Waste Load Allocation
-Cost
Rank Restoration Strategy TP Incremental Cost
Million $ Unit Cost
Ibsyr Ibs Million $ 1 Lawn Care Education 3670 01 37394
2 Underperforming BMP Retrofits 3499 08 4338
3 Other Potential Projects 3524 33 1076
4 High Priority Projects 252 04 685
5 Riparian Reforestation 762 26 298
6 Public Property Retrofits 5854 345 169
7 Priority Neighborhoods ESD Retrofits 796 65 123
8 Private Non-residential ESD Retrofits 1941 168 116
9 Completed Projects 53 00 00
C-12
Montgomery County Coordinated Implementation Strategy - DRAFT
These are Code 4 structures This category also includes other structural BMP upgrades
to existing County BMPs which were designated as under-performing or nonshy
performing
bull Private ESD Retrofits - These projects include ESD on commercial property and
residential property and include green roofs rain gardens and permeable pavement
bull Riparian Reforestation - Focuses primarily on tree planting for riparian buffer
restoration
bull Stream Restoration - Includes the use of natural materials such as rocks logs and native
vegetation to reduce pressure on eroded banks prevent down-cutting of the
streambed and restore the natural meander patterns and slope profiles found in stable
reference streams
bull Programmatic Practices - This category deals with potential pollutant reduction that can
be attributed and quantified through MS4 stormwater pollution prevention
improvements and better housekeeping on County land and facilities Also includes any
pollutant reductions due to product substitution (eg nitrogen and phosphorus limits in
fertilizer) operational programs (eg recycling) and enforcement This category also
deals with reduced pollutants that can be attributed and quantified through MS4
stormwater education (eg lawn care) and outreach aimed at pollution prevention
better housekeeping and increased stewardship
The naming convention applied for the model runs was WTM 10 (ie baseline) WTM 20 (Le
completed and high priority low priority and other potential projects) WTM 30 (Le public
and private ESD) WTM 40 (ie riparian reforestation and stream restoration) and WTM 50
(ie programmatic) Model runs were developed sequentially to yield incremental increases in
load reduction by strategy In practice however strategies can be applied in combination and
out of sequence to achieve targeted outcomes and the most cost-effective solutions A
summary of the scenarios is provided in Table 23 below
021611
Montgomery County Coordinated Implementation Strategy - DRAFT
Table 23 Summary of Watershed Treatment Model (WTM) Scenarios
Implementation Phase Description
The WTM was run under existing conditions approach
WTM Baseline Conditions with the MDP year 2002 land useland cover data and
existing BMPs
WTM 20 Completed as of
2009j High Priorityj Low
Priority and Other Potential
Projects
The WTM was run with a series of future management
practices which were proposed projects from the
County inventory of restoration sites These practices
cover new ponds retrofits of existing BMPs and some
ESD practices from the proposed projects list
The Countys inventory for other project types that
include public properties eg libraries and parkingWTM 30 ESD Strategies and
lots public schools and open section roads available Other Structural BMPs
for ESD retrofits was reviewed as were areas for
private property ESD retrofits
This category includes any pollutant reduction or volume
reduction that can be attributed to specific stream
WTM 40 Habitat rehabilitation wetland restoration and or riparian
Restoration reforestation projects planned for construction in the
watershed for the permit cycle
WTM 50 MS4 Programmatic See description above
Practices
TMDL Calibration and Tracking
Where TMDLs existed for individual watersheds the WTM was run under existing conditions
with existing BMPs based on the year in which the data was collected for TMDL development
The baseline pollutant load was then compared and normalized to the MDE-determined
baseline MS4 load for the TMDL pollutant Any BMPs with approved dates after the year in
which the data was collected for TMDL development were not included in the baseline
calculation but rather were counted towards meeting the TMDL reduction target
Once the normalized model was established reductions achieved through programs and
practices were tracked using the WTM scenarios based on the percent load reduction from
baseline toward meeting the TMDL required WLA The normalized baseline and WLA target are
determined and specified in the relevant TMDL documents developed by M DE
021611
Montgomery County Coordinated Implementation Strategy - DRAFT
3 WATERSHED IMPLEMENTATION PLANS AND RESTORATION POTENTIAL
The watershed implementation plans and pre-assessments developed in conjunction with the
Strategy are driven by regulatory requirements facing each watershed Table 31 summarizes
the drivers by watershed
Table 31 Restoration Objectives -
W~tershedSubwater~hed - Trash
4 bull - I _ _ -
Patuxent
Anacostia
Rock Creek
Great Seneca
Cabin John Creek
lower Monocacy
Watts BranchMuddy Branch
Dry and little Seneca
lower Potomac Direct
Table 32 presents the more detailed and quantitative aspects of the TMDl requirements for
the MS4 portion within each watershed The Strategy has been developed to meet the MS4
permit area WLA compliance targets presented in Tables 32
In addition to the individual watershed requirements there is a Countywide requirement to
comply with the wasteload allocations associated with urban areas under the Chesapeake Bay
TMDl which applies to nutrients and sediment There is an interim target established for 2017
where reductions from baseline conditions of 9 12 and 20 respectively for TN TP and
TSS are to occur Then by 2020 full compliance is required which correspond to reductions
from baseline conditions of 18 34 and 37 respectively for TN TP and TSS
021611
Montgomery County Coordinated Implementation Strategy - DRAFT
Table 32 TMDl Summary by Impairment
Watershed
Cabin John Creek
Rock 2007 Enterococci 970 453669 18195 Creek
Anacostia 2007 Enterococci 860 247809 29978 River
Aoacostia 2008 TN 788 206312 38959 River
Anacostia 2008 TP 797 20953 3947 Ibsyr River
Triadelphia 2008 TP 580 438 Reservoir
Rocky Gorge 2008 TP 480 4268 3628 Reservoir
Clopper Lake 2002 TP 393
Anacostia 2007 TSS 850 7682 River
Triadelphia 2008 TSS Reservoir Clopper 2002 TSS 00 13 13
Lake
Lower 2009 TSS 380010 172 Monocacy
River
Anacostia 2010 Trash 1000 228683 Ibsyr River
Adapted from 2010 Status of Approved Stormwater Waste load Allocations for NPDES Regulated Stormwater Entities in Montgomery County April 27 2010 by Jeff White MDE
Potential to Reduce Stormwater Pollutant loads
Within each of the implementation plans an analysis was developed that explored the
restoration potential for that watershed Cost was not a limiting factor for the analysis but
rather assumptions were made based on feasibility of implementation rates and consideration
of conflicts with typical site conditions with respect to site use utilities land ownership etc
For example it was assumed that 40 of large County-owned parking lots would be available
for stormwater retrofitting These assumptions are necessary for planning purposes where
detailed site investigations have not occurred However some level of implementation is
021611
Montgomery County Coordinated Implementation Strategy - DRAFT
reasonable to assume In addition all identified high priority and low priority County projects
that have the potential to be constructed were assumed to be implemented
Implementation cost and effectiveness (in terms of pollutant load reduced) was also tracked
through the process of determining watershed restoration potential which enables the
costbenefit evaluation of various strategies for a target parameter (eg tons of sediment per
dollar spent or billion MPN of bacteria per dollar etc) For example by tracking cost and
effectiveness it is possible to evaluate the relative costbenefit of a strategy like ESD versus a
non-structural programmatic practice Moreover the comparison of these two strategies is
going to be different depending on what parameter is being considered eg ESD may be more
cost effective for nutrient reduction but less cost effective for bacterial load reduction
The tables in Appendix C help to illustrate this point Specifically a series of summary charts
and tables have been developed that illustrate the cost effectiveness of the range of strategies
considered by watershed with respect to pollutant load reduction The summaries reflect the
full restoration potential developed for each watershed
It is also useful to compare strategy effectiveness and range of opportunity across watersheds
To facilitate this a series of tables were compiled that groups all watersheds together and
considers watershed restoration potential by strategy These summary tables are presented in
Tables 33 through 310
For this analysis stream restoration was treated as a special modeling case (Table 39) because
it was not tracked as a strategy that receives credit for impervious cover treatment and because
it requires a different pollutant load reduction tracking method based on linear feet of
implementation and the existing stream resource condition (good fair or poor IBI scores
received different pollutant removal credit) Further details on stream restoration modeling
are presented in the individual implementation plans and the Guidance Document
Not all WTM scenarios were modeled for all watersheds For example if there were no
previously identified completed high priority low priority or other potential projects within a
watershed they would appear as zeros for that individual watershed in Tables 33 through 36
Also for non-TMDl watersheds such as Great Seneca and Muddy Branch and Watts Branch
subwatersheds the public and private property ESD riparian reforestation and MS4
programmatic practices scenarios were not modeled due to the lack of regulatory drivers that
define pollutant removal targets
021611
Montgomery County Coordinated Implementation Strategy - DRAFT
Table 33 Cost and benefit summary for completed projects (WTM 20)
Watershed Total ESD PrOjects Incremental reduction from baseline ()
i Cost Numberof Impervious
Cost
I Impervious Trash control added TN TP TSS Bacteria
(million $) projects bullbull (ac)
(total) (total)
Anacostia 95 25 167 7 3 4 4 1 4 4
Cabin John 00 0 0 0 0 02 02 03 03 1
Rock Creek 44 6 212 13 1 2 2 3 3 2 i
I Triadelphia 00 0 0 0 0 0 0 0 0 0
Rocky Gorge 00 0 0 0 0 0 01 0 0 0
Lower Monocacy 00 0 0 0 0 0 0 0 0 0
Clopper lake 00 0 0 0 0 0 0 0 0 0
Great Seneca bull 06 2 11 0 0 1 1 I 1 0 2
MuddyWatts 00 0 0 0 0 0 0 0 0 0
Indudes Clopper lake Project count does not include stream restoration Pollutants with a TMDL are highlighted
Table 34 Cost and benefit summary for high priority projects (WTM 20)
Watershed I
I
Total ESD Projects Incremental reduction from baseline ()
Cost
(million $)
i Numberof
projects bullbull
Impervious
control added
(ac)
ICost (total)
Impervious
(total) TN
I TP TSS I TrashBacteria
Anacostia 64 33 148 65 16 2 2 06 2 2
Cabin John 16 6 88 19 2 3 3 3 3 1
Rock Creek 89 14 373 13 1 2 3 3 3 4
Triadelphia 00 0 0 04 0 0 0 0 0 0
I Rocky Gorge 04 2 5 77 27 06 06 07 06 1
Lower Monocacy 00 0 0 0 0 0 0 0 0 0
Clopper lake 00 0 0 0 010 0 0 0 0 0 Great Seneca bull 183 24 789 6 08 19 19 20 0 24
MuddyWatts 44 16 211 8 1 6 6 6 0 6
Indudes Clopper lake bullbull Project count does not indude stream restoration Pollutants with a TMDL are highlighted
Table 35 Cost and benefit summary for low priority projects (WTM 20)
I Watershed Total ESO Projects Incremental reduction from baseline ()
Numberof Impervious ICost 1m ~ i Cost Impervious
I (million $) projects bullbull
control added (total) (total)
TN TP Bacteria Trash
(ac)
I Anacostia 51 16 188 61 8 2 2 07 2 3
Cabin John 16 8 10 98 78 02 02 02 02 03
I Rock Creek 88 24 657 7 1 4 4 6 5 7
Triadelphia 040 1 20 100 100 05 05 06 05 1
Rocky Gorge 09 2 458 100 100 84 82 83 82 116 i
I Lower Monocacy 0 0 0 0 0 0 0 0 0 0 I Clopper lake 0 0 0 0 0 0 0 0 0 0
I Great Seneca bull 66 16 87 41 15 4 4 4 010 4
I MuddyWatts 20 6 26 84 33 0 0 1 0 0
Includes Clopper Lake Project count does not include stream restoration Pollutants wth a TMDL are highlighted
021611
Montgomery County Coordinated Implementation Strategy - DRAFT
Table 36 Cost and benefit summary for other potential projects (WTM 20)
I Watershed Total ESO Projects Incremental reduction from baseline ()
ICost Impervious I Cost
I I Trash INumber of
control added Impervious
TN TP TSS Bacteria (million $) projects bullbull
(ac) (total) (total)
i i
Anacostia 2492 497 2222 73 62 23 8 26 301
Cabin John 00840 1 5 0 010 01 01 01 01 01
Rock Creek 20 4 201 0 0 12 12 19 15 21
Triadelphia 00 0 0 010 0 00 00 00 00 00
Rocky Gorge 20 2 0 010 0 00 00 00 00 00
lower Monocacy 00 0 0 0( 0 00 00 00 00 0010
Clopper Lake 00 0 0 0 0 00 00 00 00 0010
Great Seneca bull 02 S S3 0 0 23 23 27 00 27
MuddyWatts 00 0 0 0 0( 00 00 00 00 0010
bull Includes Clopper Lake bullbull Project count does not include stream restoration Pollutants with a TMDL are highlighted
Table 37 Cost and benefit summary for ESO projects (WTM 30)
Watershed
I
Cost (million $) Impervious
control added
(ac)
Incremental reduction from baseline ()
ESDfor i ESO for private
public
property property
TN TP TSS Bacteria Trash
Anacostia 2378 21296 1813 20 21 7 22 27
Cabin John 878 10307 876 22 23 25 24 28
Rock Creek 2471 341 2427 30 30 33 32 35
Triadelphia 41 47 36 10 1010 11 11 20
Rocky Gorge 312 19 28S 26 27 32 30 46
lower Monocacy 86 29 53 14 15 15 15 010
Clopper lake 08 051 21 14 14 15 0 14
Great Seneca bull 00 0 0 010 0 0( 0( 010
MuddyWatts 00 a 0 0 01 010 0 0
bull Includes Clopper lake Pollutants with a TMDL are highlighted
Table 3B Cost and benefit summary for riparian reforestation (WTM 40)
IWatershed Cost (million $) Impervious
Incremental reduction from baseline ()
control added Habitat restoration (ac) TN TP TSS Bacteria Trash
Anacostia 1 6 0 0 0 01 02
Cabin John 777 39 1 2 lili
3
Rock Creek 24 119 2 2 2 5
Triadelphia 010 1 01 02 01 04 03
Rocky Gorge 25 12 1 2 2 3 8
lower Monocacy 11 S 3 3 3 4 0
Clopper Lake 023 2 4 4 2 010 4
Great Seneca bull 0 a 010 010 0 010 0
MuddyWatts 0 0 010 0 0 0 0
bull Includes Clopper lake Pallutonts with a TMDL are highlighted
021611
Montgomery County Coordinated Implementation Strategy - DRAFT
Table 57 Cost and benefit summary for stream restoration (WTM 40)
Watershed Stream Restoration Incremental reduction from baseline ()
Number of Impervious control
Cost (million $) added(ac) TN TP TSS Bacteria Trash projects
Anacostia 937 200 0 42 56 326 0 0
Cabinlohn 162 15 0 17 9 80 0 0
Rock Creek 201 30 a 9 710 100 0 0
Triadelphia 00 0 0 0 0 0 010 0
Rocky Gorge 191 18 I 0 10 7 36 0 O lower Monocacy 73 nla 0 7 10 32 010 0
Clopper Lake 00 a 0 0 0 0 0 0
Great Seneca It I 259 33 0 19 8 16 0 0
MuddyWatts 242 45 0 16 7 13 0 0
Includes Clopper Lake Pollutants with a TMDL are highlighted
Table 58 Cost and benefit summary for M54programmatlc practices (WTM 50)
Watershed Cost (million $) Incremental reduction from baseline ()
Programmatic
practices - M54
Impervious control
added (ac) TN TP TSS Bacteria Trash
Anacostia 36 0 9 9 10 8 82
Cabin John 047 0 15 14 0 10 0
Rockereek 12 0 11 11 0 7 0
Triadelphia 00056 a 23 3 0 0 0
Rocky Gorge 009 0 38 8 03 5 2
lower Monocacy 007 0 0 0 19 0 0
Clopper Lake 0Q1 0 61 30
~=r 0
Great Seneca 10 0 0 0 0 0Y0 0 0
MuddyWatts 0 0 0 0 0 0 0
bull Includes Clopper Lake Pollutants with a TMDL are highlighted
021611
Montgomery County Coordinated Implementation Strategy - DRAFT
4 COORDINATED IMPLEMENTATION STRATEGY
The Strategy has multiple objectives to accomplish whereby a challenging balance between
strategies and timeframe is required There isnt necessarily a correct answer in the process
but rather an optimized result that addresses an agreed upon suite of priorities The Strategy
presented here was primarily driven by known and established regulatory timeframes and
compliance endpoints Meeting these endpoints using the more cost effective approaches was
also given priority After this consideration was given to other known and important
approaches that stakeholders and the County have an interest in pursuing Specifically the
following compliance dates and objectives were conSidered in developing the Strategy over the
long-term (Table 41)
Table 41 Compliance Targets for Countywide Coordinated Implementation Strategy
Target Date
2015
2017
2020
Compliance Target
Meeting 20 impervious cover treatment requirement
within the MS4 Permit cycle
Meet the interim dates and targets for the Chesapeake
Bay TMDL which include specific regulated urban area
reductions by 2017 for nutrients and sediment (based
on Maryland Department of the Environments
Watershed Implementation Plan)
Meet the full compliance and targets for the
Chesapeake BayTIVIDL which include specific regulated
urban area reduction by 2020 for nutrients and
sediment (based on Maryland Department of the
Environments Watershed Implementation Plan)
Metric
~4300 acres of
Impervious Cover
9 12 and 20
respectively for TN TP
and TSS reductions
from baseline
conditions
18 34 and 37
respectively for TN TP
and TSS reductions
from baseline
conditions
2025
2030
Meet additional impervious cover treatment targets
associated with next MS4 Permit cycle (assumes
another 20 target)
Meet additional impervious cover treatment targets
associated with next MS4 Permit cycle (assumes
another 20 target)
Out year compliance with other watershed TMDLs
~3400 acres of
Impervious Cover (20
of impervious
remaining after 2015)
~2750 acres of
Impervious Cover (20
of impervious
remaining after 2020)
100 compliance with
MS4 Permit Area WLAs
021611
Montgomery County Coordinated Implementation Strategy - DRAFT
To meet the compliance targets outlined in Table 41 the following priorities were generally
followed
bull 100 implementation of completed high and low priority County projects in first five
years (by 2015)
bull Greater ESD focus in urban (as opposed to suburban and rural) watersheds initially Goal
for ESD in these watersheds on pUblic property in first five years is 10 and on private
property is 10 The level of implementation was largely driven by the 20 Countywide
impervious goal
bull 100 of Public Outreach Potential for all TIVIDl watersheds in first five years This was
pursued to address trash nutrient and bacteria loading which rely strongly on effective
outreach programs to modify behaviors
bull Generally limited strategies to the top four most cost effective per watershed
bull Habitat restoration (stream restoration and buffer reforestation) not pursued as priority
until after first five year period These programs emphasize greater pollutant reduction
efficiency rather than impervious cover treatment which is the primary focus for the
first permit cycle
The Strategy was informed by the individual watershed implementation plans for seven
watersheds which included the Clopper lake and Patuxent subwatersheds Therefore in order
to develop countywide estimates for pollutant load reduction (as is required by the Chesapeake
Bay TMDl) watershed area weighting was applied The process for developing the Countywide
strategy and individual watershed implementation plans was woven together Once the
restoration potential was determined from the individual plans the strategy and schedule was
compiled using the restoration potentials and the drivers listed above The final restoration
cost and schedule was then placed in the implementation plans
It is also worth noting that the high and low priority projects along with the other potential
projects strategies represent a static or fixed number of projects that have been identified by
the County For this analysiS this list of practices is not replenished and therefore once all
opportunities have been implemented other strategies are pursued In reality the County will
continue to develop and update its list of specific project opportunities and have these
available for implementation in future years
The output from this effort is presented in a series of tables ordered by target date in Appendix
D In addition Table 42 provides an overall summary of pollutant load reduction tracking
versus time Through inspection of Table 42 it can be seen that the Strategy meets the
021611
Montgomery County Coordinated Implementation Strategy - DRAFT
impervious cover treatment targets under the current MS4 permit (as well as projected targets
for 2020 and 2025 assuming a continued 20 treatment requirement) interim and final
Chesapeake Bay nutrient and sediment reduction targets by 2017 and 2020 respectively and
out year MS4 permit area WLA compliance for the majority of pollutants Exceptions include
meeting the bacteria WLA load reductions required for the Anacostia and Rock Creek
021611
Montgomery County Coordinated Implementation Strategy - DRAFT
Table 42 Projection by Phase for Watersheds and Pollutants PermitTMDL Targets
Watershed Fiscal Year 2015 2017 2020 2025 2030 2017 2020
Impervious Treated (acres) 1421 2393 3364 4272 4544
ESD ( Impervious) 26 44 61 69A 71
Cost (Million $) 160 307 486 732 820
E5D( Cost) 45 62 71 78 78
Anacostia Nitrogen 25 39 68 89A l00A 818 82
Phosphorus 27 42 77 100 100 812 81
i Sediment 47 72 100 l00A) l00A 875 88
Bacteria 21 33 46 59A 64 879 88
Trash 41 65 89 l00A) 100
Impervious Treated (acres) 1541 1961 2381 3625 3989
ESD ( Impervious) 17 28 36 57A 61
Cost (Million $) 87 172 262 566 658
ESD ( Cost) 7(JA 79 79A 89A 9(JA
Rock Creek Nitrogen 24 30 38 55 61
Phosphorus 25 3(JA 38 54 GfJA)
Sediment 38 50 92 l00A 100
Bacteria 21 27 33 5(JA 55 96(JA 96
Trash 17 24 31 5(JA) 55
Impervious Treated (acres) 187 380 570 1018 1018
ESD ( Impervious) 52 72 78 87A 87A
Cost (Million $) 23 65 114 215 219
ESD ( Cost) 92 91 86 90 88
Cabin John Nitrogen 21 27A 39A 55 58 Phosphorus 2(JA 26 35 49 51
Sediment 6 17 GfJA 91 100
Bacteria 16 22 27 4(JA) 40 31 31
Trash 6 12 19 34 34
Impervious Treated (acres) 237 237 237 237 237
ESD ( Impervious) 4 4 4 4 4
Cost (Million $) 6 8 19 25 31
ESD ( Cost) 32 27A 11 8 7
Muddy Watts Nitrogen 6 7 15 18 22
Phosphorus 6 7 10 12 13 Sediment 7 8 14 17 2(JA
Bacteria 0 (JA 0 (JA 0 i Trash 6 6 6 6 6
bull Impervious Treated (acres) 901 921 941 941 941 ESD ( Impervious) 2 2 2 2 2
Cost (Million $) 26 48 SO 51 52 ESD ( Cost) 15 8 8 8 8
Great Seneca Nitrogen 24 41 43 44 45
Phosphorus 24 32 34 34 34
i Sediment 26 41 43 44 44
I Bacteria (JA) 0 0 0 (JA
Trash 31 32 33 33 33
021611
Montgomery County Coordinated Implementation Strategy - DRAFT
Pe rmitTMDL Targets
Watershed Fiscal Year 2015 2017 2020 2025 2030 2017 2020
Clopper
Impervious Treated (acres) 0 6 12 22 22
ESD ( Impervious) 0 86 86 92 92
Cost (Million $) 0 0 1 2 2
ESD ( Cost) 0 72 73 84 84
Nitrogen 61 67 72 79 79
Phosphorus 30 36 41 48 48 45 45
Sediment 0 5 10 17 17
Bacteria 0 0 0 0 0
Trash 0 6 11 18 18
Lower Monocacy
Impervious Treated (acres) 1 16 32 58 58
ESD ( Impervious) 100 85 84 91 91
Cost (Million $) 0 4 11 18 20
ESD ( Cost) 100 85 54 63 58
Nitrogen 0 5 14 22 24
Phosphorus 0 5 16 26 28
Sediment 0 5 46 61 69 608 61
Bacteria 0 6 12 19 19
Trash 0 0 0 0 0
Rocky Gorge
Impervious Treated (acres) 11 88 165 307 307
ESD ( Impervious) 64 89 90 95 95
Cost (Million $) 3 17 40 70 75
ESD ( Cost) 55 82 64 73 68
Nitrogen 47 55 6710 82 85
Phosphorus 17 25 36 52 53 15 15
Sediment 10 19 45 7(J1o 79
Bacteria 14 23 32 47 47
Trash 15 30 46 68 68
Triadelphia
Impervious Treated (acres) 3 12 20 38 38
ESD ( Impervious) 100 98 97 99 99
Cost (Million $) 1 3 5 9 9
ESD ( Cost) 99 98 98 99 99
Nitrogen 24 27 29 34 34
Phosphorus 4 7 9 14 14 15 15
Sediment 1 4 6 12 12
Bacteria 1 4 6 12 12
Trash 2 6 11 21 21
Countywide
Impervious Treated (acres) 4302 6014 7722 10518 11154 6008 7723
ESD ( Impervious) 18 34 47 6(J1o 63
Cost (Million $) 305 622 987 1687 1884
ESD ( Cost) 53 66 7(J1o 8(J1o 80
Nitrogen 18 25 36 46 51 9 2(J1o
Phosphorus 17 23 34 44 46 12 34
Sediment 23 34 54 6(J1o 62 20 37
Bacteria 11 15 20 28 30
Trash 18 26 33 41 42
Assumptio~s
1 Does no~ includerepeated Outreach and Education costs beyond FY2015
2 Does not include ~n inflation multiplier
021611
Montgomery County Coordinated Implementation Strategy - DRAFT
Summary of Individual Implementation Plans
A summary of the general considerations and prioritization for each watershed implementation
plan is provided below
Anacostia - For the first permit cycle (through 2015) a priority was placed on full
implementation of completed high and low priority projects Next implementation of a third
of the other potential projects was targeted as a large number of these were identified in
conjunction with the USACEs Anacostia Watershed Restoration Plan efforts ESD was
emphasized on both public (10) and private property (10) Finally outreach (25) and
stream restoration (12) are targeted for pollutant load reduction but are not credited towards
impervious cover credit In future permit cycles the remainder of the other potential projects
are targeted along with ESD and a limited amount of riparian reforestation for impervious cover
and pollutant load reduction Outreach and stream restoration are significant strategies
pursued for load reduction benefits Nutrient and sediment MS4 permit area WLAs are met by
2030 but bacteria load reduction does not meet MS4 permit area WLA compliance The
remaining bacteria reduction is believed to be associated with urban wildlife sources Unless
intense urban wildlife management practices are implemented this remaining load reduction
will not be possible
Rock Creek- For the first permit cycle (through 2015) a priority was placed on full
implementation of complete high and low priority projects Next 25 implementation of
other potential projects was targeted ESD was emphasized on both public (10) and private
property (10) with private property implementation being linked to Rainscapes Program
success Finally outreach (100) and stream restoration (22) are targeted for pollutant load
reduction but are not credited towards impervious cover credit In future permit cycles the
remainder of the other potential projects are targeted along with ESD and riparian
reforestation for impervious cover and pollutant load reduction Stream restoration is a
significant strategy pursued for load reduction benefits The bacterial load reduction does not
meet MS4 permit area WLA compliance However the remaining bacterial load is believed to
be associated with urban wildlife sources Unless intense urban wildlife management practices
are implemented this remaining load reduction will not be possible
Cabin John Creek - Similar to the other two more urban watersheds in the County during the
first permit cycle (through 2015) a priority was placed on full implementation of complete high
and low priority projects Fewer opportunities exist overall compared to the Anacostia and Rock
Creek Next 25 implementation of other potential projects was targeted ESD was
emphasized on both public (10) and private property (10) Finally outreach (100) was
021611
Montgomery County Coordinated Implementation Strategy - DRAFT
targeted for pollutant load reduction but not credited towards impervious cover credit No
riparian reforestation or stream restoration was targeted due to limited or no opportunities In
future permit cycles the remainder of the other potential projects are targeted along with ESD
and some riparian reforestation for impervious cover and pollutant load reduction The
bacteria load reduction meets MS4 permit area WLA compliance by 2025
Muddy BranchWatts Branch - During the first permit cycle (through 2015) a priority was
placed on full implementation of complete high and low priority projects Fewer opportunities
exist overall compared to the Anacostia and Rock Creek Watersheds No other strategies were
pursued as there are no existing TMDLs in the Muddy BranchWatts Branch subwatersheds In
future permit cycles previously identified stream restoration projects are implemented for
pollutant load reduction
Great Seneca Creek - This watershed implementation plan is unique in that it includes the small
Clopper Lake subwatershed which has a TMDL for phosphorus Even with the TMDL there are
limited identified opportunities to pursue in the Clopper Lake subwatershed in part due to the
limited area of the subwatershed within the County MS4 permit area During the first permit
cycle (through 2015) a priority was placed on full implementation of complete high and low
priority projects within Great Seneca Creek subwatershed No opportunities exist for these
strategies in Clopper Lake However full outreach was applied in Clopper Lake in the first
permit cycle In future years other potential projects ESD on public and private property and a
small amount of riparian reforestation (in Clopper Lake) is pursued The Clopper Lake WLA for
phosphorus within the MS4 permit area is met
Patuxent - During the first permit cycle through 2015 a priority was placed on full
implementation of complete high and low priority projects Far fewer opportunities exist
overall compared to the Anacostia and Rock Creek A limited amount of ESD on private land
and stream restoration was pursued Finally outreach (100) was targeted for pollutant load
reduction (primarily nutrients) but not credited towards impervious cover credit No riparian
reforestation was targeted within the MS4 Permit area due to cost effectiveness in the Rocky
Gorge subwatershed and limited opportunities in the Triadelphia subwatershed In future
permit cycles ESD on private and public land is pursued more substantially as is stream
restoration A limited amount of riparian reforestation achieves some impervious cover and
pollutant load reduction The Rocky Gorge phosphorus WLA within the MS4 permit area is met
easily and the Tridelphia phosphorus WLA is also met but with a longer timeframe needed for
compliance
021611
Montgomery County Coordinated Implementation Strategy - DRAFT
Lower Monocacy Creek -lower Monocacy Creek is the most rural watershed in the County and
has the least amount of area subject to the County MS4 permit In addition there are no preshy
identified restoration projects within the watershed Therefore during the first permit cycle
(through 2015) only a very small amount (5) of private property ESD is pursued It is not until
the second permit cycle that more focus is placed on private and public ESD as well as stream
restoration and programmatic strategies such as street sweeping to target sediment loads
associated with the TM Dl In future permit cycles stream restoration is pursued for pollutant
load reduction The sediment WlA within the MS4 permit area is projected to be met around
2025
Countywide - The Countywide effort was driven by impervious cover treatment targets and
Chesapeake Bay TMDl2017 and 2020 reduction targets associated with sediment and nutrients
for urban MS4s For impervious cover it was assumed that a 20 target would be required for
each five-year permit cycle The Bay TMDl targets for urban MS4 areas were easily met for all
pollutants in 2017 and easily met for nitrogen and sediment but more difficult to meet for
phosphorus in 2020
Public Outreach and Stewardship
The County recognizes and is committed to the increasingly important role that public outreach
and stewardship will play if improved water quality conditions are going to be achieved
countywide While the County currently has a very active and layered outreach program the
model requires changes that will result in broader stakeholder groups serving as the leaders
and primary champions for clean water in their communities This includes greater participation
from minority and faith-based groups business consortiums schools neighborhood
associations and civic groups Additionally the new model requires revisiting current
initiatives carried out by the various County agencies to look for better and more efficient ways
to communicate messages cross-train and create synergies that result in greater engagement
greater awareness and sustained changes in behavior
Within each implementation plan specific suggestions for outreach and education
opportunities are identified In addition Appendix E of this Strategy contains practice sheets
which highlight targeted restoration activities for the County to develop and refine A total of
eight practices have been identified that can be adopted countywide or in more targeted
watershed areas where there are specific water quality issues to address Many of the
practices build upon existing County programs but require a much broader reach to new
partner groups Program start up costs are suggested and were used to for cost estimates
associated with Countywide strategy The highlighted practices include
021611
Montgomery County Coordinated Implementation Strategy - DRAFT
bull Pet Waste Pickup Education and Outreach Campaign
bull Lawn Stewardship Education and Outreach Campaign
bull Anti-littering Education and Outreach Campaign
bull Innovative Stormwater Management Awareness Campaign
bull Stream Stewards Education and Outreach Campaign
bull Riparian Reforestation Education and Outreach Campaign
bull Roof Runoff Reduction Education and Outreach Campaign
bull Parking Lot Recharge Value Education and Outreach Campaign
Start up costs by practice along with an overall five year cost estimate are provided in Table
43 Start up timeframes are assumed to be up to 18 months
Table 43 Outreach Start Up and 5-Year Cost Projections
Practice Practice Start Up Cost
Pet Waste Pickup $240500
Lawn Stewardship $301 600
Anti-Littering $175050
Stormwater Management Improvements Awareness $50450
Stream Stewards $74825
Riparian Reforestation $30575
Roof Runoff Reduction $101400
Parking Lot Recharge Value $41500
Estimated Start Up Total $744900
5-Year Outreach Budget Projection $2650000
These eight practice sheets provide specific costs and timelines for implementation They also
provide suggestions for measuring program success These practice sheets along with the
specific recommendations in the implementation plans make up the Public Outreach and
Education Campaign
Trash Reduction
Most of the implementation plans have to address trash loadings to meet requirements of the
Potomac Trash Treaty that is referenced in the County1s MS4 Permit In addition the Anacostia
Trash TMDL has recently been accepted by MDE and the EPA According to the Anacostia
021611
Montgomery County Coordinated Implementation Strategy - DRAFT
TMDl there is reasonable assurance that the goals of the Treaty and TMDl can be met with
proper watershed planning implementing pollution-reduction BMPs and using strong political
and financial mechanisms
Currently the County has a number of activities which target trash reduction They include the
following
bull Adopt-a-Road Program through DOT which focuses on public awareness and involvement in trash management There are 205 participants who adopted road segments and agreed to six major road cleanups per year
bull Storm Drain Marking through DOT bull Support for illegal dumping enforcement outreach and research and monitoring bull Partnership with DOT to conduct street sweeping covering about 2500 curb miles and
occurring once a year
bull Partnership with the Park Police to monitor illegal dumping which combined enforces 300-400 actions a year
bull Non-residential and residential recycling programs through Solid Waste Services (SWS) bull Transit stop trash management program at 600 bus stops countywide supported by DOT
Transit Services
In addition to continuing these efforts a number of trash good-housekeeping efforts have been
proposed as part of this Strategy A detailed description of the quantitative methods and
strategies applied can be found in Appendix E of the Guidance Document In general the
following six trash-reduction strategies are recommended
1 Significantly increase funding for trash reduction programs 2 Create and enhance regional partnerships and coordination among businesses
environmental groups individual citizens and government at all levels and in all jurisdictions
3 Improve peoples awareness knowledge and behavior relating to littering and illegal dumping
4 Promote the greater introduction and use of effective trash-reduction technologies and approaches
5 Improve enactment and enforcement of laws to reduce trash 6 Increase trash monitoring-related data collection generation and dissemination efforts
The Anacostia watershed implementation plan provides an outline of the actions that will be
taken through the first permit cycle to reduce trash The range of programs and practices
specially aimed at reducing trash inputs to roads and streams that will be targeted include
reduce reuse and recycle campaigns littering and illegal dumping enforcement stream
cleanups and street sweeping These measures are in addition to any trash trapped and
021611
Montgomery County Coordinated Implementation Strategy - DRAFT
removed by structural practices which are computed using the WTM The plan shows that the
trash TMDl can be met by 2025 at a cost of 732 million dollars
Adaptive Management Monitoring and Reporting
Sound implementation strategies require assessment and effective adaptation to respond to
new information changing conditions new technologies and lessons learned This will be the
basis of the plan that will be used when benchmarks are not met and the projected funding is
inadequate
Adaptive management requires monitoring of a variety of measures that can be used to
determine whether progress is being made towards meeting the Countywide water quality
objectives Ultimately it is the instream water quality and the loading limits with respect to the
TMDls that determine the success of implementation however there are many interim
measures that can also be correlated to success which are worthwhile pursuing
Surface water monitoring can be an expensive and time consuming undertaking Montgomery
County is fortunate to have an extensive Countywide stream monitoring network that can serve
as a foundation for providing spatial and temporal data to indicate stream health The Countys
MS4 Permit also outlines the required assessment of controls which includes chemical
biological and physical monitoring Specifically the permit calls for the County to continue
their watershed restoration monitoring of the lower Paint Branch subwatershed and physical
monitoring ofthe Clarksburg Special Protection area In addition to the existing monitoring
network the County will continue tracking and data reporting associated with levels of
implementation (eg acres of impervious cover treated areas of buffer planted miles of
stream restored miles of streets swept) For measuring effectiveness of outreach and
stewardship efforts other types of monitoring and reporting are planned that include before
and after attitude surveys frequency of website visits and information requests
For many restoration strategies it may be difficult to tease out their individual effectiveness in
terms of pollutant load reductions but collectively the monitoring that occurs should provide
adequate insight into the overall effectiveness of a layered implementation strategy
In addition to the monitoring and assessment the County will be reporting results on an annual
basis as part of their NPDES MS4 Permit annual report The MS4 Permit requires annual
reporting of the following
021611
Montgomery County Coordinated Implementation Strategy - DRAFT
bull The status of implementing the components of the stormwater management program
that are established as permit conditions
bull A narrative summary describing the results and analyses of data including monitoring
data that is accumulated throughout the reporting year
bull Expenditures for the reporting period and the proposed budget for the upcoming year
bull A summary describing the number and nature of enforcement actions inspections and
public education programs
bull The identification of water quality improvements and documentation of progress
toward meeting applicable WLAs developed under EPA approved TMDLs and
bull The identification of any proposed changes to the Countys program when WLAs are not
being met
The County will build upon annual reporting that has historically occurred to meet permit
requirements and will supplement this reporting with tracking table summaries that quantify
implementation activities for the range of strategies pursued during that year and the
associated treatment (eg impervious cover treated pollutant load reduced education and
outreach partners established etc) Cost will also be tracked in association with rates of
implementation This level of performance will then be compared with countywide strategy
targets (eg progress towards meeting WLAs) associated with key performance dates such as
those presented in Table 41 The level of progress achieved by the County will then feed into
the adaptive management approach described above
Organization Needs to Implement Strategy
Montgomery County DEP staff possesses substantial expertise and institutional knowledge that
yields many positive outcomes and efficient processes under the current pace of restoration
and permit compliance activities Under this strategy however the pace of implementation is
required to significantly increase Based on an increase in the level of implementation it is
reasonable to assume that additional capacity may be needed to provide sufficient oversight
and management of all the projects
Another critical element of this strategy is the recognition and commitment to pursuing
outreach initiatives that build community capacity by targeting new partner groups that
provide the necessary leadership oversight and sustained effort to change behaviors and
foster stewardship The County currently carries out many well established and managed
outreach programs but it may require additional focus across County agencies and
departments for these partnerships to become established and thrive
021611 G
Montgomery County Coordinated Implementation Strategy - DRAFT
Through the implementation process and the monitoring and reporting that is required large
amounts of data will be generated Technological advances happen so rapidly in this day and
age it will be important for the County to stay current with technology and methods so that
more efficient and cost-effective data management and reporting will be possible The County
currently relies on a detailed and sophisticated GIS to spatially locate projects and manage
tables of data related to projects The growth and development of this spatial database will be
a critical component of the reporting and tracking capability of the County These databases
generate the input data that are used to measure progress towards baseline loading targets
Regular review and upkeep of the data as well as routine summarization of progress (annually
at a minimum) will likely require additional dedication of staff This is especially the case during
periods where the implementation rate of structural practices in the ground is accelerated
021611
Montgomery County Coordinated Implementation Strategy - DRAFT
Appendix C - Restoration Potential by Watershed
021611
c-
04 03 02 01
a
_ Nitrogen Load Reduction
--shy TMDL WLA Target
_Cost
MONTGOMERY COUNTY URBAN WATERSHEDS POLLUTANTS _Bk)~Ibilats ~1~ l~ fjfsi --
Rank
1
2
3
4
5
6
7
8
9
10
11
Restoration Strategy TN reduction
Ibsyr
Pet Waste Education 15169
Retrofit of Underperforming BMPs 1769
Stream Restoration 72423
Completed Projects ~43 High Priority Projects 3260
Other Potential Projects 43276
Habitat Restoration 224
Public Property ESD Retrofits 18270
Priority Neighborhoods ESD Retrofits 9271
Private Non-residential ESD Retrofits 5594
Street Sweeping -
Incremental Cost Unit Cost
Million $ IbsMillion $ 088 17193
120 1475
9304 778
948 701
635 513
25430 170
141 158
23655 77
13278 70
8018 70
124 -
Qj c
Qj
nI CXI
o -f-
1 09 08 07 06 05
$900 $800 $700
~ $600 c $500 ~ $400 $300 0 u $200 $100
$shy
~~mf il_~IJrt~
MONTGOMERY COUNTY URBAN WATERSHEDS POLLUTANTS ItfiQ14lbilJts i~5 [i
1 $900 Qj
09 $8005 iii en 08 $700
~co 07 $600 co - til
06 $500 ~ 05- $400 ~ 04 en$300 003 u $20002
en $100I 01 o 0 $shys Q en o
s Q
Phosphorus Load Reduction
--- TMDL WLA Target
__Cost
I Rank I
1
2
3
4
5
6
7
8
9
Restoration Strategy
Pet Waste Education
Retrofit of Underperforming BMPs
Stream Restoration
Completed Projects
High Priority Projects
Habitat Restoration
Other Potential Projects
Public Property ESD Retrofits
Priority Neighborhoods ESD Retrofits
10 I Private Non-residential ESD Retrofits
11 Street Sweeping
TP reduction Incremental Cost Unit Cost
Ibsyr Million $ IbsMillion $ 1979 088 2243
247 120 206
13097 9304 141
915 948 96
451 635 71
37 141 26
6067 25430 24
2546 23655 11
1294 13278 10
781 8018 10
- 124 -
MONTGOMERY COUNTY URBAN WATERSHEDS POLLUTANTS IItQjQhabillt$middot
Cii 5 Cii 11 It CD
6 ~ r o ~ s
0 ltIIa r ltII e c ltII III
1 09 08 07 06 05 04 03 02 01
0
$900
$800 $700
v$600 r
0 $500 == $400 $300 11
0 u $200 $100
$shy
_ Sediment load Reduction
--- TMDl WlA Target
__Cost
Rank Restoration Strategy
Sediment reduction
Incremental Cost
Unit Cost
tonsyr Million $ tonsMillion $ 1 Street Sweeping 800 124 645
2 Stream Restoration 25057 9304 269
3 Retrofit of Underperforming BMPs 25 120 21
4 Completed Projects 97 948 10
5 High Priority Projects 47 635 7
6 Other Potential Projects 660 25430 3
7 I Public Property ESD Retrofits 272 23655 1
8 Priority Neighborhoods ESD Retrofits 139 13278 1
9 Private Non-residential ESD Retrofits 84 8018 1
10 Habitat Restoration 2 141 1
11 Pet Waste Education - 088 -
C-3
MONTGOMERY COUNTY URBAN WATERSHEDS POLLUTANTS
-QI5 5i ~
1 09 08 07 06 05 04 03 02 01
0
$900
$800
$700
$600 ~ 0
$500 == $400 $300 11
0 u $200
$100
$shy
--shy TMDL WLA Target
___ Cost
Rank Restoration Strategy
Enterrococci reduction
Incremental Cost
Unit Cost
Billion MPNyr Million $ Billion MPN Million $
1 Pet Waste Education 19643 088 22263
2 Retrofit of Underperforming BMPs 2781 120 2318
3 Completed Projects 10441 948 1101
4 High Priority Projects 5120 635 806
5 Other Potential Projects 69895 25430 275
6 Riparian Reforestation 310 141 219
7 Public Property ESD Retrofits 29025 23655 123
8 Priority Neighborhoods ESD Retrofits 14777 13278 111
9 Private Non-residential ESD Retrofits 8917 8018 111
10 Stream Restoration - 9304 -
11 Street Sweeping - 124 I -
~ I~~~i MONTGOMERY COUNTY URBAN WATERSHEDS POLLUTANTS 1tI2~mL ~ I~I
~$ I -~-- I
100 90 80 70 60 50 40 30 20 10
0
$900 $800 $700 $600 $500 $400 $300 $200 $100 $shy
vi c
~ 5 11 0 u
Implementation Phase
Potential Trash Incremental Unit Cost
I
Rank Restoration Strategy Reduction Cost
Ibsyear Million $ IbsMillion $ 1 Recycling Education and Investigations 51654 02 238837
2 Plastic Bag Ban and Misc Enforcement 63546 13 48882
3 Anti-litter Campaign Education 23J61 09 26930
4 Retrofit of Underperforming BMPs 1144 12 954
5 Completed Projects 6598 95 696
6 High Priority Projects 2786 64 439
7 Other Potential Projects 56341 2543 222
8 Habitat Restoration 266 14 188
9 Street Sweeping 204 12 164
10 Public Property ESD Retrofits 25348 2366 107
11 Priority lIeighborhoods ESD Retrofits 12529 1328 94
12 Private Non-residential ESD Retrofits 7547 802 94 ru Stream Restoration - 930 -14 Pet Waste Education - 09 -
C-5
MONTGOMERY COUNTY URBAN WATERSHEDS POLLUTANTS
CABIN JOHN
1 250
__CostImplementation Phase
09 08 07 06 05 04 03 02 01
0
200 ~ c
150 g E
100 - ltII 0 u
50
0
_E Coli
- - - Waste Load Allocation
Rank Restoration Strategy
E coli reduction
Incremental Cost
Unit Cost
Billion
MPNyr Million $
Billion MPN
Million $ 1 Pet Waste Education 4388 $05 9436
2 Underperforming BMP Retrofits 1892 $19 1022
3 High Priority Projects 1289 $16 800
4 Riparian Reforestation 1133 $78 146
5 Other Potential Projects 148 $17 86
6 Public Property ESD Retrofits 4AOO $860 Sl 7 Private Non-residential ESD Retrofits 1618 $392 41
8 Priority Neighborhoods ESD Retrofits 2633 $638 41
9 Completed Projects 112 $00 0
C-6
MONTGOMERY COUNTY URBAN WATERSHEDS POLLUTANTS 1Itf~~Jabitm
ROCK CREEK
1 $700 Qj5 09
o
_
$600 Qj 08
111 $500 ~ampl 07 c
t5 06 $400 ~ e 05 ~ $3005 04 - 111tl 03 $200 0 u-6 02
$100J 01 $-
Enterrococci
- - - Waste load Allocation Implementation Phase
__Cost
Rank Restoration Strategy
Enterrococci reduction
Incremental Cost
Unit Cost
Billion MPNyr Million $ Billion MPN Million $
Et Pet Waste Management 35734 118 30190
Underperforming BMP Upgrades
Other Potential Projects
28800
30239
577
1083
4995
2792
4 Completed Projects 12131 444 2734
5 High Priority Projects 14239 890 1600
6 Riparian Reforestation 18999 2384 797
7 County Property ESD Retrofits 54519 24136 226
8 Private Residential ESD Retrofits 35230 17737 199
9 Private Non-residential ESD Retrofits 32A86 16380 198
C-7
MONTGOMERY COUNTY URBAN WATERSHEDS POLLUTANTS _f~~pabitafS (fi~r ~~ l-middotshy
ROCK CREEK
100 $900 90 $800 80 $700 u70 $600 c 60 2$50050 -~$40040
lt1$300 030 $200 u
20 10 $100
0 $shy
Implementation Phase
Rank Restoration Strategy Trash Reduction
Incremental Cost
Unit Cost I
Ibsyear Million $ IbsMillion $ 1 Other Potential Projects 16038 1085 1478
2 Underperforming BMP Upgrades 6756 577 1172
3 Completed Projects 4217 444 950
4 High Priority Projects 6366 890 715
5 Riparian Reforestation 9237 2384 387
6 Public Property ESD Retrofits 24587 24136 102
7 Priority Neighborhoods ESD Retrofits 16155 17737 91
8 Private Non-residential ESD Retrofits 14793 16380 90
9 Pet Waste Education - 118 -
(-8
MONTGOMERY COUNTY RURAL WATERSHEDS POLLUTANTS
SENECA - CLOPPER LAKE -
100 Qi
90 iii 80VI to -CQ 70 0 60e 50I 0 40 u l 30
C QJ 20ex
C 10to 0
J 0
$18
$16
$14 n
$12 I
$10 sect $08 ~ $06 0
VI
U $04
$02
$shy
_TPRemoval - - - TMDL Reduction Target
Implementation Phase ___Cost
Rank Restoration Strategy TP
Reduction (Ibsyr)
Incremental Cost (Million $)
Unit Cost (IbsvrMillion $)
1 Residential Education 33 001 6246
2 Underperforming BMP Retrofits 13 004 341 3 Riparian Buffer Reforestation 19 023 99 4 Priority Neighborhood ESD Retrofits 15 051 35 5 Public Property ESD Retrofits 7 075 99
C-9
-pj[fti
MONTGOMERY COUNTY URBAN WATERSHEDS POLLUTANTS 1It[~~JIlbitIL f bull~
LOWER MONOCACY
1 09 08 07 06 05 04 03 02 01
0
Implementation Phase
25
20 ~ c
15 ~ ~
10 - 0 u
5
0
_TSS
- - - Waste load Allocation _Cost
Rank Restoration Strategy
Sediment reduction
Incremental
Cost Unit Cost
tonsyear Million $ tonMilli
1 Street Sweeping 22 $007 3121
2 Underperforming BMP Retrofits 4 $010 389
3 Stream Restoration 37 $734 51
4 Riparian Buffer Reforestation 3 $109 25
5 Other Structural BMPs and ESD Strategies 10 $851 12
6 Priority Neighborhoods ESD Retrofits 2 $160 10
7 Non-residential ESD Retrofits 1 $132 10
C-10
MONTGOMERY COUNTY RURAL WATERSHEDS POLLUTANTS 1tlj~lIbiIalSlt~~II
1 09 08 07 06 05 04 03 02 01
0
$70
$60
$50 ~ c
$40 ~ ~ $30 - UI
$20 0 v
$10
$0
_ Phosphorus Load Reduction
- - - Waste Load Allocation ___ CostImplementation Phase
Rank Restoration Strategy TP Incremental Cost
Million $ Unit Cost
Ibsyr Ibs Million $ 1 Lawn Care Education 3670 01 37394
2 Underperforming BMP Retrofits 3499 08 4338
3 Other Potential Projects 3524 33 1076
4 High Priority Projects 252 04 685
5 Riparian Reforestation 762 26 298
6 Public Property Retrofits 5854 345 169
7 Priority Neighborhoods ESD Retrofits 796 65 123
8 Private Non-residential ESD Retrofits 1941 168 116
9 Completed Projects 53 00 00
c- 11
MONTGOMERY COUNTY RURAL WATERSHEDS POLLUTANTSal12hdJilats ~I~ ~ [ -
1 10 ii 5 09 9 1 08 8 II al- 07 7 1ii o 06 6
c
~ ~ 1 o E IV
05 04 03
5 4
3
~ 11 0 u
0 11 02 2 J o 01 1
t a 0 0 11 o
t 0
_ Phosphorus Reduction
- - - Waste Load Allocation
-Cost
Rank Restoration Strategy TP Incremental Cost
Million $ Unit Cost
Ibsyr Ibs Million $ 1 Lawn Care Education 3670 01 37394
2 Underperforming BMP Retrofits 3499 08 4338
3 Other Potential Projects 3524 33 1076
4 High Priority Projects 252 04 685
5 Riparian Reforestation 762 26 298
6 Public Property Retrofits 5854 345 169
7 Priority Neighborhoods ESD Retrofits 796 65 123
8 Private Non-residential ESD Retrofits 1941 168 116
9 Completed Projects 53 00 00
C-12

Montgomery County Coordinated Implementation Strategy - DRAFT
Table 23 Summary of Watershed Treatment Model (WTM) Scenarios
Implementation Phase Description
The WTM was run under existing conditions approach
WTM Baseline Conditions with the MDP year 2002 land useland cover data and
existing BMPs
WTM 20 Completed as of
2009j High Priorityj Low
Priority and Other Potential
Projects
The WTM was run with a series of future management
practices which were proposed projects from the
County inventory of restoration sites These practices
cover new ponds retrofits of existing BMPs and some
ESD practices from the proposed projects list
The Countys inventory for other project types that
include public properties eg libraries and parkingWTM 30 ESD Strategies and
lots public schools and open section roads available Other Structural BMPs
for ESD retrofits was reviewed as were areas for
private property ESD retrofits
This category includes any pollutant reduction or volume
reduction that can be attributed to specific stream
WTM 40 Habitat rehabilitation wetland restoration and or riparian
Restoration reforestation projects planned for construction in the
watershed for the permit cycle
WTM 50 MS4 Programmatic See description above
Practices
TMDL Calibration and Tracking
Where TMDLs existed for individual watersheds the WTM was run under existing conditions
with existing BMPs based on the year in which the data was collected for TMDL development
The baseline pollutant load was then compared and normalized to the MDE-determined
baseline MS4 load for the TMDL pollutant Any BMPs with approved dates after the year in
which the data was collected for TMDL development were not included in the baseline
calculation but rather were counted towards meeting the TMDL reduction target
Once the normalized model was established reductions achieved through programs and
practices were tracked using the WTM scenarios based on the percent load reduction from
baseline toward meeting the TMDL required WLA The normalized baseline and WLA target are
determined and specified in the relevant TMDL documents developed by M DE
021611
Montgomery County Coordinated Implementation Strategy - DRAFT
3 WATERSHED IMPLEMENTATION PLANS AND RESTORATION POTENTIAL
The watershed implementation plans and pre-assessments developed in conjunction with the
Strategy are driven by regulatory requirements facing each watershed Table 31 summarizes
the drivers by watershed
Table 31 Restoration Objectives -
W~tershedSubwater~hed - Trash
4 bull - I _ _ -
Patuxent
Anacostia
Rock Creek
Great Seneca
Cabin John Creek
lower Monocacy
Watts BranchMuddy Branch
Dry and little Seneca
lower Potomac Direct
Table 32 presents the more detailed and quantitative aspects of the TMDl requirements for
the MS4 portion within each watershed The Strategy has been developed to meet the MS4
permit area WLA compliance targets presented in Tables 32
In addition to the individual watershed requirements there is a Countywide requirement to
comply with the wasteload allocations associated with urban areas under the Chesapeake Bay
TMDl which applies to nutrients and sediment There is an interim target established for 2017
where reductions from baseline conditions of 9 12 and 20 respectively for TN TP and
TSS are to occur Then by 2020 full compliance is required which correspond to reductions
from baseline conditions of 18 34 and 37 respectively for TN TP and TSS
021611
Montgomery County Coordinated Implementation Strategy - DRAFT
Table 32 TMDl Summary by Impairment
Watershed
Cabin John Creek
Rock 2007 Enterococci 970 453669 18195 Creek
Anacostia 2007 Enterococci 860 247809 29978 River
Aoacostia 2008 TN 788 206312 38959 River
Anacostia 2008 TP 797 20953 3947 Ibsyr River
Triadelphia 2008 TP 580 438 Reservoir
Rocky Gorge 2008 TP 480 4268 3628 Reservoir
Clopper Lake 2002 TP 393
Anacostia 2007 TSS 850 7682 River
Triadelphia 2008 TSS Reservoir Clopper 2002 TSS 00 13 13
Lake
Lower 2009 TSS 380010 172 Monocacy
River
Anacostia 2010 Trash 1000 228683 Ibsyr River
Adapted from 2010 Status of Approved Stormwater Waste load Allocations for NPDES Regulated Stormwater Entities in Montgomery County April 27 2010 by Jeff White MDE
Potential to Reduce Stormwater Pollutant loads
Within each of the implementation plans an analysis was developed that explored the
restoration potential for that watershed Cost was not a limiting factor for the analysis but
rather assumptions were made based on feasibility of implementation rates and consideration
of conflicts with typical site conditions with respect to site use utilities land ownership etc
For example it was assumed that 40 of large County-owned parking lots would be available
for stormwater retrofitting These assumptions are necessary for planning purposes where
detailed site investigations have not occurred However some level of implementation is
021611
Montgomery County Coordinated Implementation Strategy - DRAFT
reasonable to assume In addition all identified high priority and low priority County projects
that have the potential to be constructed were assumed to be implemented
Implementation cost and effectiveness (in terms of pollutant load reduced) was also tracked
through the process of determining watershed restoration potential which enables the
costbenefit evaluation of various strategies for a target parameter (eg tons of sediment per
dollar spent or billion MPN of bacteria per dollar etc) For example by tracking cost and
effectiveness it is possible to evaluate the relative costbenefit of a strategy like ESD versus a
non-structural programmatic practice Moreover the comparison of these two strategies is
going to be different depending on what parameter is being considered eg ESD may be more
cost effective for nutrient reduction but less cost effective for bacterial load reduction
The tables in Appendix C help to illustrate this point Specifically a series of summary charts
and tables have been developed that illustrate the cost effectiveness of the range of strategies
considered by watershed with respect to pollutant load reduction The summaries reflect the
full restoration potential developed for each watershed
It is also useful to compare strategy effectiveness and range of opportunity across watersheds
To facilitate this a series of tables were compiled that groups all watersheds together and
considers watershed restoration potential by strategy These summary tables are presented in
Tables 33 through 310
For this analysis stream restoration was treated as a special modeling case (Table 39) because
it was not tracked as a strategy that receives credit for impervious cover treatment and because
it requires a different pollutant load reduction tracking method based on linear feet of
implementation and the existing stream resource condition (good fair or poor IBI scores
received different pollutant removal credit) Further details on stream restoration modeling
are presented in the individual implementation plans and the Guidance Document
Not all WTM scenarios were modeled for all watersheds For example if there were no
previously identified completed high priority low priority or other potential projects within a
watershed they would appear as zeros for that individual watershed in Tables 33 through 36
Also for non-TMDl watersheds such as Great Seneca and Muddy Branch and Watts Branch
subwatersheds the public and private property ESD riparian reforestation and MS4
programmatic practices scenarios were not modeled due to the lack of regulatory drivers that
define pollutant removal targets
021611
Montgomery County Coordinated Implementation Strategy - DRAFT
Table 33 Cost and benefit summary for completed projects (WTM 20)
Watershed Total ESD PrOjects Incremental reduction from baseline ()
i Cost Numberof Impervious
Cost
I Impervious Trash control added TN TP TSS Bacteria
(million $) projects bullbull (ac)
(total) (total)
Anacostia 95 25 167 7 3 4 4 1 4 4
Cabin John 00 0 0 0 0 02 02 03 03 1
Rock Creek 44 6 212 13 1 2 2 3 3 2 i
I Triadelphia 00 0 0 0 0 0 0 0 0 0
Rocky Gorge 00 0 0 0 0 0 01 0 0 0
Lower Monocacy 00 0 0 0 0 0 0 0 0 0
Clopper lake 00 0 0 0 0 0 0 0 0 0
Great Seneca bull 06 2 11 0 0 1 1 I 1 0 2
MuddyWatts 00 0 0 0 0 0 0 0 0 0
Indudes Clopper lake Project count does not include stream restoration Pollutants with a TMDL are highlighted
Table 34 Cost and benefit summary for high priority projects (WTM 20)
Watershed I
I
Total ESD Projects Incremental reduction from baseline ()
Cost
(million $)
i Numberof
projects bullbull
Impervious
control added
(ac)
ICost (total)
Impervious
(total) TN
I TP TSS I TrashBacteria
Anacostia 64 33 148 65 16 2 2 06 2 2
Cabin John 16 6 88 19 2 3 3 3 3 1
Rock Creek 89 14 373 13 1 2 3 3 3 4
Triadelphia 00 0 0 04 0 0 0 0 0 0
I Rocky Gorge 04 2 5 77 27 06 06 07 06 1
Lower Monocacy 00 0 0 0 0 0 0 0 0 0
Clopper lake 00 0 0 0 010 0 0 0 0 0 Great Seneca bull 183 24 789 6 08 19 19 20 0 24
MuddyWatts 44 16 211 8 1 6 6 6 0 6
Indudes Clopper lake bullbull Project count does not indude stream restoration Pollutants with a TMDL are highlighted
Table 35 Cost and benefit summary for low priority projects (WTM 20)
I Watershed Total ESO Projects Incremental reduction from baseline ()
Numberof Impervious ICost 1m ~ i Cost Impervious
I (million $) projects bullbull
control added (total) (total)
TN TP Bacteria Trash
(ac)
I Anacostia 51 16 188 61 8 2 2 07 2 3
Cabin John 16 8 10 98 78 02 02 02 02 03
I Rock Creek 88 24 657 7 1 4 4 6 5 7
Triadelphia 040 1 20 100 100 05 05 06 05 1
Rocky Gorge 09 2 458 100 100 84 82 83 82 116 i
I Lower Monocacy 0 0 0 0 0 0 0 0 0 0 I Clopper lake 0 0 0 0 0 0 0 0 0 0
I Great Seneca bull 66 16 87 41 15 4 4 4 010 4
I MuddyWatts 20 6 26 84 33 0 0 1 0 0
Includes Clopper Lake Project count does not include stream restoration Pollutants wth a TMDL are highlighted
021611
Montgomery County Coordinated Implementation Strategy - DRAFT
Table 36 Cost and benefit summary for other potential projects (WTM 20)
I Watershed Total ESO Projects Incremental reduction from baseline ()
ICost Impervious I Cost
I I Trash INumber of
control added Impervious
TN TP TSS Bacteria (million $) projects bullbull
(ac) (total) (total)
i i
Anacostia 2492 497 2222 73 62 23 8 26 301
Cabin John 00840 1 5 0 010 01 01 01 01 01
Rock Creek 20 4 201 0 0 12 12 19 15 21
Triadelphia 00 0 0 010 0 00 00 00 00 00
Rocky Gorge 20 2 0 010 0 00 00 00 00 00
lower Monocacy 00 0 0 0( 0 00 00 00 00 0010
Clopper Lake 00 0 0 0 0 00 00 00 00 0010
Great Seneca bull 02 S S3 0 0 23 23 27 00 27
MuddyWatts 00 0 0 0 0( 00 00 00 00 0010
bull Includes Clopper Lake bullbull Project count does not include stream restoration Pollutants with a TMDL are highlighted
Table 37 Cost and benefit summary for ESO projects (WTM 30)
Watershed
I
Cost (million $) Impervious
control added
(ac)
Incremental reduction from baseline ()
ESDfor i ESO for private
public
property property
TN TP TSS Bacteria Trash
Anacostia 2378 21296 1813 20 21 7 22 27
Cabin John 878 10307 876 22 23 25 24 28
Rock Creek 2471 341 2427 30 30 33 32 35
Triadelphia 41 47 36 10 1010 11 11 20
Rocky Gorge 312 19 28S 26 27 32 30 46
lower Monocacy 86 29 53 14 15 15 15 010
Clopper lake 08 051 21 14 14 15 0 14
Great Seneca bull 00 0 0 010 0 0( 0( 010
MuddyWatts 00 a 0 0 01 010 0 0
bull Includes Clopper lake Pollutants with a TMDL are highlighted
Table 3B Cost and benefit summary for riparian reforestation (WTM 40)
IWatershed Cost (million $) Impervious
Incremental reduction from baseline ()
control added Habitat restoration (ac) TN TP TSS Bacteria Trash
Anacostia 1 6 0 0 0 01 02
Cabin John 777 39 1 2 lili
3
Rock Creek 24 119 2 2 2 5
Triadelphia 010 1 01 02 01 04 03
Rocky Gorge 25 12 1 2 2 3 8
lower Monocacy 11 S 3 3 3 4 0
Clopper Lake 023 2 4 4 2 010 4
Great Seneca bull 0 a 010 010 0 010 0
MuddyWatts 0 0 010 0 0 0 0
bull Includes Clopper lake Pallutonts with a TMDL are highlighted
021611
Montgomery County Coordinated Implementation Strategy - DRAFT
Table 57 Cost and benefit summary for stream restoration (WTM 40)
Watershed Stream Restoration Incremental reduction from baseline ()
Number of Impervious control
Cost (million $) added(ac) TN TP TSS Bacteria Trash projects
Anacostia 937 200 0 42 56 326 0 0
Cabinlohn 162 15 0 17 9 80 0 0
Rock Creek 201 30 a 9 710 100 0 0
Triadelphia 00 0 0 0 0 0 010 0
Rocky Gorge 191 18 I 0 10 7 36 0 O lower Monocacy 73 nla 0 7 10 32 010 0
Clopper Lake 00 a 0 0 0 0 0 0
Great Seneca It I 259 33 0 19 8 16 0 0
MuddyWatts 242 45 0 16 7 13 0 0
Includes Clopper Lake Pollutants with a TMDL are highlighted
Table 58 Cost and benefit summary for M54programmatlc practices (WTM 50)
Watershed Cost (million $) Incremental reduction from baseline ()
Programmatic
practices - M54
Impervious control
added (ac) TN TP TSS Bacteria Trash
Anacostia 36 0 9 9 10 8 82
Cabin John 047 0 15 14 0 10 0
Rockereek 12 0 11 11 0 7 0
Triadelphia 00056 a 23 3 0 0 0
Rocky Gorge 009 0 38 8 03 5 2
lower Monocacy 007 0 0 0 19 0 0
Clopper Lake 0Q1 0 61 30
~=r 0
Great Seneca 10 0 0 0 0 0Y0 0 0
MuddyWatts 0 0 0 0 0 0 0
bull Includes Clopper Lake Pollutants with a TMDL are highlighted
021611
Montgomery County Coordinated Implementation Strategy - DRAFT
4 COORDINATED IMPLEMENTATION STRATEGY
The Strategy has multiple objectives to accomplish whereby a challenging balance between
strategies and timeframe is required There isnt necessarily a correct answer in the process
but rather an optimized result that addresses an agreed upon suite of priorities The Strategy
presented here was primarily driven by known and established regulatory timeframes and
compliance endpoints Meeting these endpoints using the more cost effective approaches was
also given priority After this consideration was given to other known and important
approaches that stakeholders and the County have an interest in pursuing Specifically the
following compliance dates and objectives were conSidered in developing the Strategy over the
long-term (Table 41)
Table 41 Compliance Targets for Countywide Coordinated Implementation Strategy
Target Date
2015
2017
2020
Compliance Target
Meeting 20 impervious cover treatment requirement
within the MS4 Permit cycle
Meet the interim dates and targets for the Chesapeake
Bay TMDL which include specific regulated urban area
reductions by 2017 for nutrients and sediment (based
on Maryland Department of the Environments
Watershed Implementation Plan)
Meet the full compliance and targets for the
Chesapeake BayTIVIDL which include specific regulated
urban area reduction by 2020 for nutrients and
sediment (based on Maryland Department of the
Environments Watershed Implementation Plan)
Metric
~4300 acres of
Impervious Cover
9 12 and 20
respectively for TN TP
and TSS reductions
from baseline
conditions
18 34 and 37
respectively for TN TP
and TSS reductions
from baseline
conditions
2025
2030
Meet additional impervious cover treatment targets
associated with next MS4 Permit cycle (assumes
another 20 target)
Meet additional impervious cover treatment targets
associated with next MS4 Permit cycle (assumes
another 20 target)
Out year compliance with other watershed TMDLs
~3400 acres of
Impervious Cover (20
of impervious
remaining after 2015)
~2750 acres of
Impervious Cover (20
of impervious
remaining after 2020)
100 compliance with
MS4 Permit Area WLAs
021611
Montgomery County Coordinated Implementation Strategy - DRAFT
To meet the compliance targets outlined in Table 41 the following priorities were generally
followed
bull 100 implementation of completed high and low priority County projects in first five
years (by 2015)
bull Greater ESD focus in urban (as opposed to suburban and rural) watersheds initially Goal
for ESD in these watersheds on pUblic property in first five years is 10 and on private
property is 10 The level of implementation was largely driven by the 20 Countywide
impervious goal
bull 100 of Public Outreach Potential for all TIVIDl watersheds in first five years This was
pursued to address trash nutrient and bacteria loading which rely strongly on effective
outreach programs to modify behaviors
bull Generally limited strategies to the top four most cost effective per watershed
bull Habitat restoration (stream restoration and buffer reforestation) not pursued as priority
until after first five year period These programs emphasize greater pollutant reduction
efficiency rather than impervious cover treatment which is the primary focus for the
first permit cycle
The Strategy was informed by the individual watershed implementation plans for seven
watersheds which included the Clopper lake and Patuxent subwatersheds Therefore in order
to develop countywide estimates for pollutant load reduction (as is required by the Chesapeake
Bay TMDl) watershed area weighting was applied The process for developing the Countywide
strategy and individual watershed implementation plans was woven together Once the
restoration potential was determined from the individual plans the strategy and schedule was
compiled using the restoration potentials and the drivers listed above The final restoration
cost and schedule was then placed in the implementation plans
It is also worth noting that the high and low priority projects along with the other potential
projects strategies represent a static or fixed number of projects that have been identified by
the County For this analysiS this list of practices is not replenished and therefore once all
opportunities have been implemented other strategies are pursued In reality the County will
continue to develop and update its list of specific project opportunities and have these
available for implementation in future years
The output from this effort is presented in a series of tables ordered by target date in Appendix
D In addition Table 42 provides an overall summary of pollutant load reduction tracking
versus time Through inspection of Table 42 it can be seen that the Strategy meets the
021611
Montgomery County Coordinated Implementation Strategy - DRAFT
impervious cover treatment targets under the current MS4 permit (as well as projected targets
for 2020 and 2025 assuming a continued 20 treatment requirement) interim and final
Chesapeake Bay nutrient and sediment reduction targets by 2017 and 2020 respectively and
out year MS4 permit area WLA compliance for the majority of pollutants Exceptions include
meeting the bacteria WLA load reductions required for the Anacostia and Rock Creek
021611
Montgomery County Coordinated Implementation Strategy - DRAFT
Table 42 Projection by Phase for Watersheds and Pollutants PermitTMDL Targets
Watershed Fiscal Year 2015 2017 2020 2025 2030 2017 2020
Impervious Treated (acres) 1421 2393 3364 4272 4544
ESD ( Impervious) 26 44 61 69A 71
Cost (Million $) 160 307 486 732 820
E5D( Cost) 45 62 71 78 78
Anacostia Nitrogen 25 39 68 89A l00A 818 82
Phosphorus 27 42 77 100 100 812 81
i Sediment 47 72 100 l00A) l00A 875 88
Bacteria 21 33 46 59A 64 879 88
Trash 41 65 89 l00A) 100
Impervious Treated (acres) 1541 1961 2381 3625 3989
ESD ( Impervious) 17 28 36 57A 61
Cost (Million $) 87 172 262 566 658
ESD ( Cost) 7(JA 79 79A 89A 9(JA
Rock Creek Nitrogen 24 30 38 55 61
Phosphorus 25 3(JA 38 54 GfJA)
Sediment 38 50 92 l00A 100
Bacteria 21 27 33 5(JA 55 96(JA 96
Trash 17 24 31 5(JA) 55
Impervious Treated (acres) 187 380 570 1018 1018
ESD ( Impervious) 52 72 78 87A 87A
Cost (Million $) 23 65 114 215 219
ESD ( Cost) 92 91 86 90 88
Cabin John Nitrogen 21 27A 39A 55 58 Phosphorus 2(JA 26 35 49 51
Sediment 6 17 GfJA 91 100
Bacteria 16 22 27 4(JA) 40 31 31
Trash 6 12 19 34 34
Impervious Treated (acres) 237 237 237 237 237
ESD ( Impervious) 4 4 4 4 4
Cost (Million $) 6 8 19 25 31
ESD ( Cost) 32 27A 11 8 7
Muddy Watts Nitrogen 6 7 15 18 22
Phosphorus 6 7 10 12 13 Sediment 7 8 14 17 2(JA
Bacteria 0 (JA 0 (JA 0 i Trash 6 6 6 6 6
bull Impervious Treated (acres) 901 921 941 941 941 ESD ( Impervious) 2 2 2 2 2
Cost (Million $) 26 48 SO 51 52 ESD ( Cost) 15 8 8 8 8
Great Seneca Nitrogen 24 41 43 44 45
Phosphorus 24 32 34 34 34
i Sediment 26 41 43 44 44
I Bacteria (JA) 0 0 0 (JA
Trash 31 32 33 33 33
021611
Montgomery County Coordinated Implementation Strategy - DRAFT
Pe rmitTMDL Targets
Watershed Fiscal Year 2015 2017 2020 2025 2030 2017 2020
Clopper
Impervious Treated (acres) 0 6 12 22 22
ESD ( Impervious) 0 86 86 92 92
Cost (Million $) 0 0 1 2 2
ESD ( Cost) 0 72 73 84 84
Nitrogen 61 67 72 79 79
Phosphorus 30 36 41 48 48 45 45
Sediment 0 5 10 17 17
Bacteria 0 0 0 0 0
Trash 0 6 11 18 18
Lower Monocacy
Impervious Treated (acres) 1 16 32 58 58
ESD ( Impervious) 100 85 84 91 91
Cost (Million $) 0 4 11 18 20
ESD ( Cost) 100 85 54 63 58
Nitrogen 0 5 14 22 24
Phosphorus 0 5 16 26 28
Sediment 0 5 46 61 69 608 61
Bacteria 0 6 12 19 19
Trash 0 0 0 0 0
Rocky Gorge
Impervious Treated (acres) 11 88 165 307 307
ESD ( Impervious) 64 89 90 95 95
Cost (Million $) 3 17 40 70 75
ESD ( Cost) 55 82 64 73 68
Nitrogen 47 55 6710 82 85
Phosphorus 17 25 36 52 53 15 15
Sediment 10 19 45 7(J1o 79
Bacteria 14 23 32 47 47
Trash 15 30 46 68 68
Triadelphia
Impervious Treated (acres) 3 12 20 38 38
ESD ( Impervious) 100 98 97 99 99
Cost (Million $) 1 3 5 9 9
ESD ( Cost) 99 98 98 99 99
Nitrogen 24 27 29 34 34
Phosphorus 4 7 9 14 14 15 15
Sediment 1 4 6 12 12
Bacteria 1 4 6 12 12
Trash 2 6 11 21 21
Countywide
Impervious Treated (acres) 4302 6014 7722 10518 11154 6008 7723
ESD ( Impervious) 18 34 47 6(J1o 63
Cost (Million $) 305 622 987 1687 1884
ESD ( Cost) 53 66 7(J1o 8(J1o 80
Nitrogen 18 25 36 46 51 9 2(J1o
Phosphorus 17 23 34 44 46 12 34
Sediment 23 34 54 6(J1o 62 20 37
Bacteria 11 15 20 28 30
Trash 18 26 33 41 42
Assumptio~s
1 Does no~ includerepeated Outreach and Education costs beyond FY2015
2 Does not include ~n inflation multiplier
021611
Montgomery County Coordinated Implementation Strategy - DRAFT
Summary of Individual Implementation Plans
A summary of the general considerations and prioritization for each watershed implementation
plan is provided below
Anacostia - For the first permit cycle (through 2015) a priority was placed on full
implementation of completed high and low priority projects Next implementation of a third
of the other potential projects was targeted as a large number of these were identified in
conjunction with the USACEs Anacostia Watershed Restoration Plan efforts ESD was
emphasized on both public (10) and private property (10) Finally outreach (25) and
stream restoration (12) are targeted for pollutant load reduction but are not credited towards
impervious cover credit In future permit cycles the remainder of the other potential projects
are targeted along with ESD and a limited amount of riparian reforestation for impervious cover
and pollutant load reduction Outreach and stream restoration are significant strategies
pursued for load reduction benefits Nutrient and sediment MS4 permit area WLAs are met by
2030 but bacteria load reduction does not meet MS4 permit area WLA compliance The
remaining bacteria reduction is believed to be associated with urban wildlife sources Unless
intense urban wildlife management practices are implemented this remaining load reduction
will not be possible
Rock Creek- For the first permit cycle (through 2015) a priority was placed on full
implementation of complete high and low priority projects Next 25 implementation of
other potential projects was targeted ESD was emphasized on both public (10) and private
property (10) with private property implementation being linked to Rainscapes Program
success Finally outreach (100) and stream restoration (22) are targeted for pollutant load
reduction but are not credited towards impervious cover credit In future permit cycles the
remainder of the other potential projects are targeted along with ESD and riparian
reforestation for impervious cover and pollutant load reduction Stream restoration is a
significant strategy pursued for load reduction benefits The bacterial load reduction does not
meet MS4 permit area WLA compliance However the remaining bacterial load is believed to
be associated with urban wildlife sources Unless intense urban wildlife management practices
are implemented this remaining load reduction will not be possible
Cabin John Creek - Similar to the other two more urban watersheds in the County during the
first permit cycle (through 2015) a priority was placed on full implementation of complete high
and low priority projects Fewer opportunities exist overall compared to the Anacostia and Rock
Creek Next 25 implementation of other potential projects was targeted ESD was
emphasized on both public (10) and private property (10) Finally outreach (100) was
021611
Montgomery County Coordinated Implementation Strategy - DRAFT
targeted for pollutant load reduction but not credited towards impervious cover credit No
riparian reforestation or stream restoration was targeted due to limited or no opportunities In
future permit cycles the remainder of the other potential projects are targeted along with ESD
and some riparian reforestation for impervious cover and pollutant load reduction The
bacteria load reduction meets MS4 permit area WLA compliance by 2025
Muddy BranchWatts Branch - During the first permit cycle (through 2015) a priority was
placed on full implementation of complete high and low priority projects Fewer opportunities
exist overall compared to the Anacostia and Rock Creek Watersheds No other strategies were
pursued as there are no existing TMDLs in the Muddy BranchWatts Branch subwatersheds In
future permit cycles previously identified stream restoration projects are implemented for
pollutant load reduction
Great Seneca Creek - This watershed implementation plan is unique in that it includes the small
Clopper Lake subwatershed which has a TMDL for phosphorus Even with the TMDL there are
limited identified opportunities to pursue in the Clopper Lake subwatershed in part due to the
limited area of the subwatershed within the County MS4 permit area During the first permit
cycle (through 2015) a priority was placed on full implementation of complete high and low
priority projects within Great Seneca Creek subwatershed No opportunities exist for these
strategies in Clopper Lake However full outreach was applied in Clopper Lake in the first
permit cycle In future years other potential projects ESD on public and private property and a
small amount of riparian reforestation (in Clopper Lake) is pursued The Clopper Lake WLA for
phosphorus within the MS4 permit area is met
Patuxent - During the first permit cycle through 2015 a priority was placed on full
implementation of complete high and low priority projects Far fewer opportunities exist
overall compared to the Anacostia and Rock Creek A limited amount of ESD on private land
and stream restoration was pursued Finally outreach (100) was targeted for pollutant load
reduction (primarily nutrients) but not credited towards impervious cover credit No riparian
reforestation was targeted within the MS4 Permit area due to cost effectiveness in the Rocky
Gorge subwatershed and limited opportunities in the Triadelphia subwatershed In future
permit cycles ESD on private and public land is pursued more substantially as is stream
restoration A limited amount of riparian reforestation achieves some impervious cover and
pollutant load reduction The Rocky Gorge phosphorus WLA within the MS4 permit area is met
easily and the Tridelphia phosphorus WLA is also met but with a longer timeframe needed for
compliance
021611
Montgomery County Coordinated Implementation Strategy - DRAFT
Lower Monocacy Creek -lower Monocacy Creek is the most rural watershed in the County and
has the least amount of area subject to the County MS4 permit In addition there are no preshy
identified restoration projects within the watershed Therefore during the first permit cycle
(through 2015) only a very small amount (5) of private property ESD is pursued It is not until
the second permit cycle that more focus is placed on private and public ESD as well as stream
restoration and programmatic strategies such as street sweeping to target sediment loads
associated with the TM Dl In future permit cycles stream restoration is pursued for pollutant
load reduction The sediment WlA within the MS4 permit area is projected to be met around
2025
Countywide - The Countywide effort was driven by impervious cover treatment targets and
Chesapeake Bay TMDl2017 and 2020 reduction targets associated with sediment and nutrients
for urban MS4s For impervious cover it was assumed that a 20 target would be required for
each five-year permit cycle The Bay TMDl targets for urban MS4 areas were easily met for all
pollutants in 2017 and easily met for nitrogen and sediment but more difficult to meet for
phosphorus in 2020
Public Outreach and Stewardship
The County recognizes and is committed to the increasingly important role that public outreach
and stewardship will play if improved water quality conditions are going to be achieved
countywide While the County currently has a very active and layered outreach program the
model requires changes that will result in broader stakeholder groups serving as the leaders
and primary champions for clean water in their communities This includes greater participation
from minority and faith-based groups business consortiums schools neighborhood
associations and civic groups Additionally the new model requires revisiting current
initiatives carried out by the various County agencies to look for better and more efficient ways
to communicate messages cross-train and create synergies that result in greater engagement
greater awareness and sustained changes in behavior
Within each implementation plan specific suggestions for outreach and education
opportunities are identified In addition Appendix E of this Strategy contains practice sheets
which highlight targeted restoration activities for the County to develop and refine A total of
eight practices have been identified that can be adopted countywide or in more targeted
watershed areas where there are specific water quality issues to address Many of the
practices build upon existing County programs but require a much broader reach to new
partner groups Program start up costs are suggested and were used to for cost estimates
associated with Countywide strategy The highlighted practices include
021611
Montgomery County Coordinated Implementation Strategy - DRAFT
bull Pet Waste Pickup Education and Outreach Campaign
bull Lawn Stewardship Education and Outreach Campaign
bull Anti-littering Education and Outreach Campaign
bull Innovative Stormwater Management Awareness Campaign
bull Stream Stewards Education and Outreach Campaign
bull Riparian Reforestation Education and Outreach Campaign
bull Roof Runoff Reduction Education and Outreach Campaign
bull Parking Lot Recharge Value Education and Outreach Campaign
Start up costs by practice along with an overall five year cost estimate are provided in Table
43 Start up timeframes are assumed to be up to 18 months
Table 43 Outreach Start Up and 5-Year Cost Projections
Practice Practice Start Up Cost
Pet Waste Pickup $240500
Lawn Stewardship $301 600
Anti-Littering $175050
Stormwater Management Improvements Awareness $50450
Stream Stewards $74825
Riparian Reforestation $30575
Roof Runoff Reduction $101400
Parking Lot Recharge Value $41500
Estimated Start Up Total $744900
5-Year Outreach Budget Projection $2650000
These eight practice sheets provide specific costs and timelines for implementation They also
provide suggestions for measuring program success These practice sheets along with the
specific recommendations in the implementation plans make up the Public Outreach and
Education Campaign
Trash Reduction
Most of the implementation plans have to address trash loadings to meet requirements of the
Potomac Trash Treaty that is referenced in the County1s MS4 Permit In addition the Anacostia
Trash TMDL has recently been accepted by MDE and the EPA According to the Anacostia
021611
Montgomery County Coordinated Implementation Strategy - DRAFT
TMDl there is reasonable assurance that the goals of the Treaty and TMDl can be met with
proper watershed planning implementing pollution-reduction BMPs and using strong political
and financial mechanisms
Currently the County has a number of activities which target trash reduction They include the
following
bull Adopt-a-Road Program through DOT which focuses on public awareness and involvement in trash management There are 205 participants who adopted road segments and agreed to six major road cleanups per year
bull Storm Drain Marking through DOT bull Support for illegal dumping enforcement outreach and research and monitoring bull Partnership with DOT to conduct street sweeping covering about 2500 curb miles and
occurring once a year
bull Partnership with the Park Police to monitor illegal dumping which combined enforces 300-400 actions a year
bull Non-residential and residential recycling programs through Solid Waste Services (SWS) bull Transit stop trash management program at 600 bus stops countywide supported by DOT
Transit Services
In addition to continuing these efforts a number of trash good-housekeeping efforts have been
proposed as part of this Strategy A detailed description of the quantitative methods and
strategies applied can be found in Appendix E of the Guidance Document In general the
following six trash-reduction strategies are recommended
1 Significantly increase funding for trash reduction programs 2 Create and enhance regional partnerships and coordination among businesses
environmental groups individual citizens and government at all levels and in all jurisdictions
3 Improve peoples awareness knowledge and behavior relating to littering and illegal dumping
4 Promote the greater introduction and use of effective trash-reduction technologies and approaches
5 Improve enactment and enforcement of laws to reduce trash 6 Increase trash monitoring-related data collection generation and dissemination efforts
The Anacostia watershed implementation plan provides an outline of the actions that will be
taken through the first permit cycle to reduce trash The range of programs and practices
specially aimed at reducing trash inputs to roads and streams that will be targeted include
reduce reuse and recycle campaigns littering and illegal dumping enforcement stream
cleanups and street sweeping These measures are in addition to any trash trapped and
021611
Montgomery County Coordinated Implementation Strategy - DRAFT
removed by structural practices which are computed using the WTM The plan shows that the
trash TMDl can be met by 2025 at a cost of 732 million dollars
Adaptive Management Monitoring and Reporting
Sound implementation strategies require assessment and effective adaptation to respond to
new information changing conditions new technologies and lessons learned This will be the
basis of the plan that will be used when benchmarks are not met and the projected funding is
inadequate
Adaptive management requires monitoring of a variety of measures that can be used to
determine whether progress is being made towards meeting the Countywide water quality
objectives Ultimately it is the instream water quality and the loading limits with respect to the
TMDls that determine the success of implementation however there are many interim
measures that can also be correlated to success which are worthwhile pursuing
Surface water monitoring can be an expensive and time consuming undertaking Montgomery
County is fortunate to have an extensive Countywide stream monitoring network that can serve
as a foundation for providing spatial and temporal data to indicate stream health The Countys
MS4 Permit also outlines the required assessment of controls which includes chemical
biological and physical monitoring Specifically the permit calls for the County to continue
their watershed restoration monitoring of the lower Paint Branch subwatershed and physical
monitoring ofthe Clarksburg Special Protection area In addition to the existing monitoring
network the County will continue tracking and data reporting associated with levels of
implementation (eg acres of impervious cover treated areas of buffer planted miles of
stream restored miles of streets swept) For measuring effectiveness of outreach and
stewardship efforts other types of monitoring and reporting are planned that include before
and after attitude surveys frequency of website visits and information requests
For many restoration strategies it may be difficult to tease out their individual effectiveness in
terms of pollutant load reductions but collectively the monitoring that occurs should provide
adequate insight into the overall effectiveness of a layered implementation strategy
In addition to the monitoring and assessment the County will be reporting results on an annual
basis as part of their NPDES MS4 Permit annual report The MS4 Permit requires annual
reporting of the following
021611
Montgomery County Coordinated Implementation Strategy - DRAFT
bull The status of implementing the components of the stormwater management program
that are established as permit conditions
bull A narrative summary describing the results and analyses of data including monitoring
data that is accumulated throughout the reporting year
bull Expenditures for the reporting period and the proposed budget for the upcoming year
bull A summary describing the number and nature of enforcement actions inspections and
public education programs
bull The identification of water quality improvements and documentation of progress
toward meeting applicable WLAs developed under EPA approved TMDLs and
bull The identification of any proposed changes to the Countys program when WLAs are not
being met
The County will build upon annual reporting that has historically occurred to meet permit
requirements and will supplement this reporting with tracking table summaries that quantify
implementation activities for the range of strategies pursued during that year and the
associated treatment (eg impervious cover treated pollutant load reduced education and
outreach partners established etc) Cost will also be tracked in association with rates of
implementation This level of performance will then be compared with countywide strategy
targets (eg progress towards meeting WLAs) associated with key performance dates such as
those presented in Table 41 The level of progress achieved by the County will then feed into
the adaptive management approach described above
Organization Needs to Implement Strategy
Montgomery County DEP staff possesses substantial expertise and institutional knowledge that
yields many positive outcomes and efficient processes under the current pace of restoration
and permit compliance activities Under this strategy however the pace of implementation is
required to significantly increase Based on an increase in the level of implementation it is
reasonable to assume that additional capacity may be needed to provide sufficient oversight
and management of all the projects
Another critical element of this strategy is the recognition and commitment to pursuing
outreach initiatives that build community capacity by targeting new partner groups that
provide the necessary leadership oversight and sustained effort to change behaviors and
foster stewardship The County currently carries out many well established and managed
outreach programs but it may require additional focus across County agencies and
departments for these partnerships to become established and thrive
021611 G
Montgomery County Coordinated Implementation Strategy - DRAFT
Through the implementation process and the monitoring and reporting that is required large
amounts of data will be generated Technological advances happen so rapidly in this day and
age it will be important for the County to stay current with technology and methods so that
more efficient and cost-effective data management and reporting will be possible The County
currently relies on a detailed and sophisticated GIS to spatially locate projects and manage
tables of data related to projects The growth and development of this spatial database will be
a critical component of the reporting and tracking capability of the County These databases
generate the input data that are used to measure progress towards baseline loading targets
Regular review and upkeep of the data as well as routine summarization of progress (annually
at a minimum) will likely require additional dedication of staff This is especially the case during
periods where the implementation rate of structural practices in the ground is accelerated
021611
Montgomery County Coordinated Implementation Strategy - DRAFT
Appendix C - Restoration Potential by Watershed
021611
c-
04 03 02 01
a
_ Nitrogen Load Reduction
--shy TMDL WLA Target
_Cost
MONTGOMERY COUNTY URBAN WATERSHEDS POLLUTANTS _Bk)~Ibilats ~1~ l~ fjfsi --
Rank
1
2
3
4
5
6
7
8
9
10
11
Restoration Strategy TN reduction
Ibsyr
Pet Waste Education 15169
Retrofit of Underperforming BMPs 1769
Stream Restoration 72423
Completed Projects ~43 High Priority Projects 3260
Other Potential Projects 43276
Habitat Restoration 224
Public Property ESD Retrofits 18270
Priority Neighborhoods ESD Retrofits 9271
Private Non-residential ESD Retrofits 5594
Street Sweeping -
Incremental Cost Unit Cost
Million $ IbsMillion $ 088 17193
120 1475
9304 778
948 701
635 513
25430 170
141 158
23655 77
13278 70
8018 70
124 -
Qj c
Qj
nI CXI
o -f-
1 09 08 07 06 05
$900 $800 $700
~ $600 c $500 ~ $400 $300 0 u $200 $100
$shy
~~mf il_~IJrt~
MONTGOMERY COUNTY URBAN WATERSHEDS POLLUTANTS ItfiQ14lbilJts i~5 [i
1 $900 Qj
09 $8005 iii en 08 $700
~co 07 $600 co - til
06 $500 ~ 05- $400 ~ 04 en$300 003 u $20002
en $100I 01 o 0 $shys Q en o
s Q
Phosphorus Load Reduction
--- TMDL WLA Target
__Cost
I Rank I
1
2
3
4
5
6
7
8
9
Restoration Strategy
Pet Waste Education
Retrofit of Underperforming BMPs
Stream Restoration
Completed Projects
High Priority Projects
Habitat Restoration
Other Potential Projects
Public Property ESD Retrofits
Priority Neighborhoods ESD Retrofits
10 I Private Non-residential ESD Retrofits
11 Street Sweeping
TP reduction Incremental Cost Unit Cost
Ibsyr Million $ IbsMillion $ 1979 088 2243
247 120 206
13097 9304 141
915 948 96
451 635 71
37 141 26
6067 25430 24
2546 23655 11
1294 13278 10
781 8018 10
- 124 -
MONTGOMERY COUNTY URBAN WATERSHEDS POLLUTANTS IItQjQhabillt$middot
Cii 5 Cii 11 It CD
6 ~ r o ~ s
0 ltIIa r ltII e c ltII III
1 09 08 07 06 05 04 03 02 01
0
$900
$800 $700
v$600 r
0 $500 == $400 $300 11
0 u $200 $100
$shy
_ Sediment load Reduction
--- TMDl WlA Target
__Cost
Rank Restoration Strategy
Sediment reduction
Incremental Cost
Unit Cost
tonsyr Million $ tonsMillion $ 1 Street Sweeping 800 124 645
2 Stream Restoration 25057 9304 269
3 Retrofit of Underperforming BMPs 25 120 21
4 Completed Projects 97 948 10
5 High Priority Projects 47 635 7
6 Other Potential Projects 660 25430 3
7 I Public Property ESD Retrofits 272 23655 1
8 Priority Neighborhoods ESD Retrofits 139 13278 1
9 Private Non-residential ESD Retrofits 84 8018 1
10 Habitat Restoration 2 141 1
11 Pet Waste Education - 088 -
C-3
MONTGOMERY COUNTY URBAN WATERSHEDS POLLUTANTS
-QI5 5i ~
1 09 08 07 06 05 04 03 02 01
0
$900
$800
$700
$600 ~ 0
$500 == $400 $300 11
0 u $200
$100
$shy
--shy TMDL WLA Target
___ Cost
Rank Restoration Strategy
Enterrococci reduction
Incremental Cost
Unit Cost
Billion MPNyr Million $ Billion MPN Million $
1 Pet Waste Education 19643 088 22263
2 Retrofit of Underperforming BMPs 2781 120 2318
3 Completed Projects 10441 948 1101
4 High Priority Projects 5120 635 806
5 Other Potential Projects 69895 25430 275
6 Riparian Reforestation 310 141 219
7 Public Property ESD Retrofits 29025 23655 123
8 Priority Neighborhoods ESD Retrofits 14777 13278 111
9 Private Non-residential ESD Retrofits 8917 8018 111
10 Stream Restoration - 9304 -
11 Street Sweeping - 124 I -
~ I~~~i MONTGOMERY COUNTY URBAN WATERSHEDS POLLUTANTS 1tI2~mL ~ I~I
~$ I -~-- I
100 90 80 70 60 50 40 30 20 10
0
$900 $800 $700 $600 $500 $400 $300 $200 $100 $shy
vi c
~ 5 11 0 u
Implementation Phase
Potential Trash Incremental Unit Cost
I
Rank Restoration Strategy Reduction Cost
Ibsyear Million $ IbsMillion $ 1 Recycling Education and Investigations 51654 02 238837
2 Plastic Bag Ban and Misc Enforcement 63546 13 48882
3 Anti-litter Campaign Education 23J61 09 26930
4 Retrofit of Underperforming BMPs 1144 12 954
5 Completed Projects 6598 95 696
6 High Priority Projects 2786 64 439
7 Other Potential Projects 56341 2543 222
8 Habitat Restoration 266 14 188
9 Street Sweeping 204 12 164
10 Public Property ESD Retrofits 25348 2366 107
11 Priority lIeighborhoods ESD Retrofits 12529 1328 94
12 Private Non-residential ESD Retrofits 7547 802 94 ru Stream Restoration - 930 -14 Pet Waste Education - 09 -
C-5
MONTGOMERY COUNTY URBAN WATERSHEDS POLLUTANTS
CABIN JOHN
1 250
__CostImplementation Phase
09 08 07 06 05 04 03 02 01
0
200 ~ c
150 g E
100 - ltII 0 u
50
0
_E Coli
- - - Waste Load Allocation
Rank Restoration Strategy
E coli reduction
Incremental Cost
Unit Cost
Billion
MPNyr Million $
Billion MPN
Million $ 1 Pet Waste Education 4388 $05 9436
2 Underperforming BMP Retrofits 1892 $19 1022
3 High Priority Projects 1289 $16 800
4 Riparian Reforestation 1133 $78 146
5 Other Potential Projects 148 $17 86
6 Public Property ESD Retrofits 4AOO $860 Sl 7 Private Non-residential ESD Retrofits 1618 $392 41
8 Priority Neighborhoods ESD Retrofits 2633 $638 41
9 Completed Projects 112 $00 0
C-6
MONTGOMERY COUNTY URBAN WATERSHEDS POLLUTANTS 1Itf~~Jabitm
ROCK CREEK
1 $700 Qj5 09
o
_
$600 Qj 08
111 $500 ~ampl 07 c
t5 06 $400 ~ e 05 ~ $3005 04 - 111tl 03 $200 0 u-6 02
$100J 01 $-
Enterrococci
- - - Waste load Allocation Implementation Phase
__Cost
Rank Restoration Strategy
Enterrococci reduction
Incremental Cost
Unit Cost
Billion MPNyr Million $ Billion MPN Million $
Et Pet Waste Management 35734 118 30190
Underperforming BMP Upgrades
Other Potential Projects
28800
30239
577
1083
4995
2792
4 Completed Projects 12131 444 2734
5 High Priority Projects 14239 890 1600
6 Riparian Reforestation 18999 2384 797
7 County Property ESD Retrofits 54519 24136 226
8 Private Residential ESD Retrofits 35230 17737 199
9 Private Non-residential ESD Retrofits 32A86 16380 198
C-7
MONTGOMERY COUNTY URBAN WATERSHEDS POLLUTANTS _f~~pabitafS (fi~r ~~ l-middotshy
ROCK CREEK
100 $900 90 $800 80 $700 u70 $600 c 60 2$50050 -~$40040
lt1$300 030 $200 u
20 10 $100
0 $shy
Implementation Phase
Rank Restoration Strategy Trash Reduction
Incremental Cost
Unit Cost I
Ibsyear Million $ IbsMillion $ 1 Other Potential Projects 16038 1085 1478
2 Underperforming BMP Upgrades 6756 577 1172
3 Completed Projects 4217 444 950
4 High Priority Projects 6366 890 715
5 Riparian Reforestation 9237 2384 387
6 Public Property ESD Retrofits 24587 24136 102
7 Priority Neighborhoods ESD Retrofits 16155 17737 91
8 Private Non-residential ESD Retrofits 14793 16380 90
9 Pet Waste Education - 118 -
(-8
MONTGOMERY COUNTY RURAL WATERSHEDS POLLUTANTS
SENECA - CLOPPER LAKE -
100 Qi
90 iii 80VI to -CQ 70 0 60e 50I 0 40 u l 30
C QJ 20ex
C 10to 0
J 0
$18
$16
$14 n
$12 I
$10 sect $08 ~ $06 0
VI
U $04
$02
$shy
_TPRemoval - - - TMDL Reduction Target
Implementation Phase ___Cost
Rank Restoration Strategy TP
Reduction (Ibsyr)
Incremental Cost (Million $)
Unit Cost (IbsvrMillion $)
1 Residential Education 33 001 6246
2 Underperforming BMP Retrofits 13 004 341 3 Riparian Buffer Reforestation 19 023 99 4 Priority Neighborhood ESD Retrofits 15 051 35 5 Public Property ESD Retrofits 7 075 99
C-9
-pj[fti
MONTGOMERY COUNTY URBAN WATERSHEDS POLLUTANTS 1It[~~JIlbitIL f bull~
LOWER MONOCACY
1 09 08 07 06 05 04 03 02 01
0
Implementation Phase
25
20 ~ c
15 ~ ~
10 - 0 u
5
0
_TSS
- - - Waste load Allocation _Cost
Rank Restoration Strategy
Sediment reduction
Incremental
Cost Unit Cost
tonsyear Million $ tonMilli
1 Street Sweeping 22 $007 3121
2 Underperforming BMP Retrofits 4 $010 389
3 Stream Restoration 37 $734 51
4 Riparian Buffer Reforestation 3 $109 25
5 Other Structural BMPs and ESD Strategies 10 $851 12
6 Priority Neighborhoods ESD Retrofits 2 $160 10
7 Non-residential ESD Retrofits 1 $132 10
C-10
MONTGOMERY COUNTY RURAL WATERSHEDS POLLUTANTS 1tlj~lIbiIalSlt~~II
1 09 08 07 06 05 04 03 02 01
0
$70
$60
$50 ~ c
$40 ~ ~ $30 - UI
$20 0 v
$10
$0
_ Phosphorus Load Reduction
- - - Waste Load Allocation ___ CostImplementation Phase
Rank Restoration Strategy TP Incremental Cost
Million $ Unit Cost
Ibsyr Ibs Million $ 1 Lawn Care Education 3670 01 37394
2 Underperforming BMP Retrofits 3499 08 4338
3 Other Potential Projects 3524 33 1076
4 High Priority Projects 252 04 685
5 Riparian Reforestation 762 26 298
6 Public Property Retrofits 5854 345 169
7 Priority Neighborhoods ESD Retrofits 796 65 123
8 Private Non-residential ESD Retrofits 1941 168 116
9 Completed Projects 53 00 00
c- 11
MONTGOMERY COUNTY RURAL WATERSHEDS POLLUTANTSal12hdJilats ~I~ ~ [ -
1 10 ii 5 09 9 1 08 8 II al- 07 7 1ii o 06 6
c
~ ~ 1 o E IV
05 04 03
5 4
3
~ 11 0 u
0 11 02 2 J o 01 1
t a 0 0 11 o
t 0
_ Phosphorus Reduction
- - - Waste Load Allocation
-Cost
Rank Restoration Strategy TP Incremental Cost
Million $ Unit Cost
Ibsyr Ibs Million $ 1 Lawn Care Education 3670 01 37394
2 Underperforming BMP Retrofits 3499 08 4338
3 Other Potential Projects 3524 33 1076
4 High Priority Projects 252 04 685
5 Riparian Reforestation 762 26 298
6 Public Property Retrofits 5854 345 169
7 Priority Neighborhoods ESD Retrofits 796 65 123
8 Private Non-residential ESD Retrofits 1941 168 116
9 Completed Projects 53 00 00
C-12
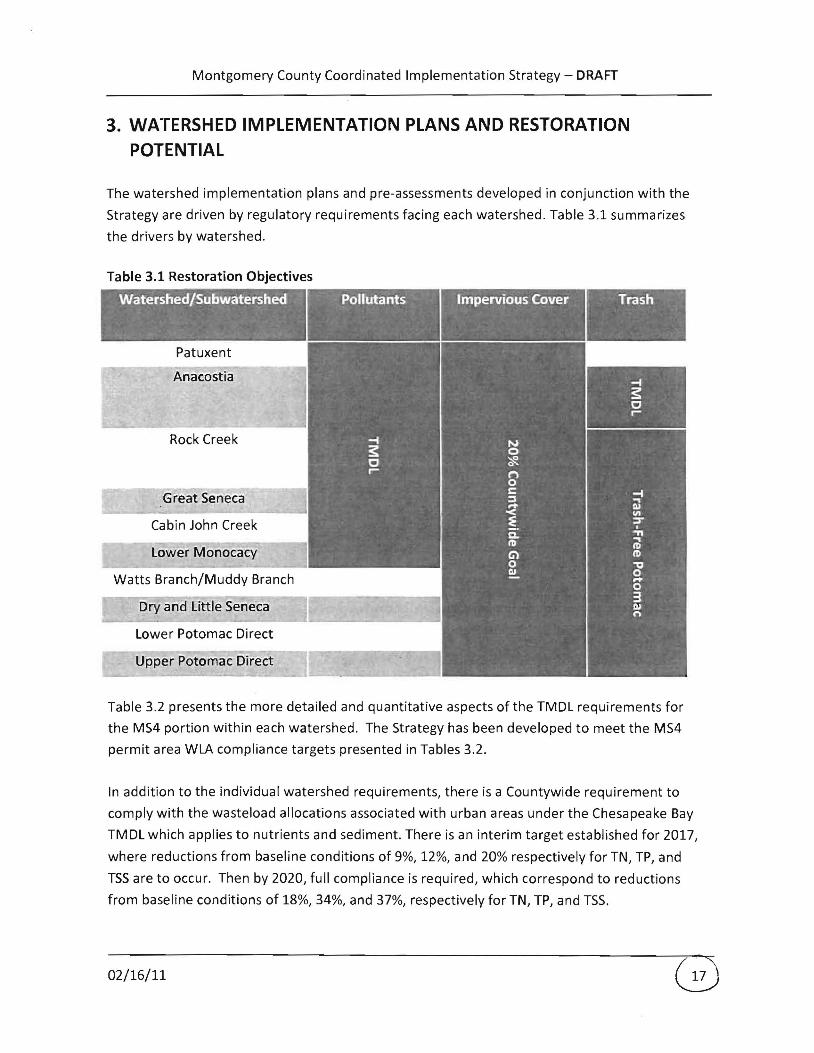
Montgomery County Coordinated Implementation Strategy - DRAFT
3 WATERSHED IMPLEMENTATION PLANS AND RESTORATION POTENTIAL
The watershed implementation plans and pre-assessments developed in conjunction with the
Strategy are driven by regulatory requirements facing each watershed Table 31 summarizes
the drivers by watershed
Table 31 Restoration Objectives -
W~tershedSubwater~hed - Trash
4 bull - I _ _ -
Patuxent
Anacostia
Rock Creek
Great Seneca
Cabin John Creek
lower Monocacy
Watts BranchMuddy Branch
Dry and little Seneca
lower Potomac Direct
Table 32 presents the more detailed and quantitative aspects of the TMDl requirements for
the MS4 portion within each watershed The Strategy has been developed to meet the MS4
permit area WLA compliance targets presented in Tables 32
In addition to the individual watershed requirements there is a Countywide requirement to
comply with the wasteload allocations associated with urban areas under the Chesapeake Bay
TMDl which applies to nutrients and sediment There is an interim target established for 2017
where reductions from baseline conditions of 9 12 and 20 respectively for TN TP and
TSS are to occur Then by 2020 full compliance is required which correspond to reductions
from baseline conditions of 18 34 and 37 respectively for TN TP and TSS
021611
Montgomery County Coordinated Implementation Strategy - DRAFT
Table 32 TMDl Summary by Impairment
Watershed
Cabin John Creek
Rock 2007 Enterococci 970 453669 18195 Creek
Anacostia 2007 Enterococci 860 247809 29978 River
Aoacostia 2008 TN 788 206312 38959 River
Anacostia 2008 TP 797 20953 3947 Ibsyr River
Triadelphia 2008 TP 580 438 Reservoir
Rocky Gorge 2008 TP 480 4268 3628 Reservoir
Clopper Lake 2002 TP 393
Anacostia 2007 TSS 850 7682 River
Triadelphia 2008 TSS Reservoir Clopper 2002 TSS 00 13 13
Lake
Lower 2009 TSS 380010 172 Monocacy
River
Anacostia 2010 Trash 1000 228683 Ibsyr River
Adapted from 2010 Status of Approved Stormwater Waste load Allocations for NPDES Regulated Stormwater Entities in Montgomery County April 27 2010 by Jeff White MDE
Potential to Reduce Stormwater Pollutant loads
Within each of the implementation plans an analysis was developed that explored the
restoration potential for that watershed Cost was not a limiting factor for the analysis but
rather assumptions were made based on feasibility of implementation rates and consideration
of conflicts with typical site conditions with respect to site use utilities land ownership etc
For example it was assumed that 40 of large County-owned parking lots would be available
for stormwater retrofitting These assumptions are necessary for planning purposes where
detailed site investigations have not occurred However some level of implementation is
021611
Montgomery County Coordinated Implementation Strategy - DRAFT
reasonable to assume In addition all identified high priority and low priority County projects
that have the potential to be constructed were assumed to be implemented
Implementation cost and effectiveness (in terms of pollutant load reduced) was also tracked
through the process of determining watershed restoration potential which enables the
costbenefit evaluation of various strategies for a target parameter (eg tons of sediment per
dollar spent or billion MPN of bacteria per dollar etc) For example by tracking cost and
effectiveness it is possible to evaluate the relative costbenefit of a strategy like ESD versus a
non-structural programmatic practice Moreover the comparison of these two strategies is
going to be different depending on what parameter is being considered eg ESD may be more
cost effective for nutrient reduction but less cost effective for bacterial load reduction
The tables in Appendix C help to illustrate this point Specifically a series of summary charts
and tables have been developed that illustrate the cost effectiveness of the range of strategies
considered by watershed with respect to pollutant load reduction The summaries reflect the
full restoration potential developed for each watershed
It is also useful to compare strategy effectiveness and range of opportunity across watersheds
To facilitate this a series of tables were compiled that groups all watersheds together and
considers watershed restoration potential by strategy These summary tables are presented in
Tables 33 through 310
For this analysis stream restoration was treated as a special modeling case (Table 39) because
it was not tracked as a strategy that receives credit for impervious cover treatment and because
it requires a different pollutant load reduction tracking method based on linear feet of
implementation and the existing stream resource condition (good fair or poor IBI scores
received different pollutant removal credit) Further details on stream restoration modeling
are presented in the individual implementation plans and the Guidance Document
Not all WTM scenarios were modeled for all watersheds For example if there were no
previously identified completed high priority low priority or other potential projects within a
watershed they would appear as zeros for that individual watershed in Tables 33 through 36
Also for non-TMDl watersheds such as Great Seneca and Muddy Branch and Watts Branch
subwatersheds the public and private property ESD riparian reforestation and MS4
programmatic practices scenarios were not modeled due to the lack of regulatory drivers that
define pollutant removal targets
021611
Montgomery County Coordinated Implementation Strategy - DRAFT
Table 33 Cost and benefit summary for completed projects (WTM 20)
Watershed Total ESD PrOjects Incremental reduction from baseline ()
i Cost Numberof Impervious
Cost
I Impervious Trash control added TN TP TSS Bacteria
(million $) projects bullbull (ac)
(total) (total)
Anacostia 95 25 167 7 3 4 4 1 4 4
Cabin John 00 0 0 0 0 02 02 03 03 1
Rock Creek 44 6 212 13 1 2 2 3 3 2 i
I Triadelphia 00 0 0 0 0 0 0 0 0 0
Rocky Gorge 00 0 0 0 0 0 01 0 0 0
Lower Monocacy 00 0 0 0 0 0 0 0 0 0
Clopper lake 00 0 0 0 0 0 0 0 0 0
Great Seneca bull 06 2 11 0 0 1 1 I 1 0 2
MuddyWatts 00 0 0 0 0 0 0 0 0 0
Indudes Clopper lake Project count does not include stream restoration Pollutants with a TMDL are highlighted
Table 34 Cost and benefit summary for high priority projects (WTM 20)
Watershed I
I
Total ESD Projects Incremental reduction from baseline ()
Cost
(million $)
i Numberof
projects bullbull
Impervious
control added
(ac)
ICost (total)
Impervious
(total) TN
I TP TSS I TrashBacteria
Anacostia 64 33 148 65 16 2 2 06 2 2
Cabin John 16 6 88 19 2 3 3 3 3 1
Rock Creek 89 14 373 13 1 2 3 3 3 4
Triadelphia 00 0 0 04 0 0 0 0 0 0
I Rocky Gorge 04 2 5 77 27 06 06 07 06 1
Lower Monocacy 00 0 0 0 0 0 0 0 0 0
Clopper lake 00 0 0 0 010 0 0 0 0 0 Great Seneca bull 183 24 789 6 08 19 19 20 0 24
MuddyWatts 44 16 211 8 1 6 6 6 0 6
Indudes Clopper lake bullbull Project count does not indude stream restoration Pollutants with a TMDL are highlighted
Table 35 Cost and benefit summary for low priority projects (WTM 20)
I Watershed Total ESO Projects Incremental reduction from baseline ()
Numberof Impervious ICost 1m ~ i Cost Impervious
I (million $) projects bullbull
control added (total) (total)
TN TP Bacteria Trash
(ac)
I Anacostia 51 16 188 61 8 2 2 07 2 3
Cabin John 16 8 10 98 78 02 02 02 02 03
I Rock Creek 88 24 657 7 1 4 4 6 5 7
Triadelphia 040 1 20 100 100 05 05 06 05 1
Rocky Gorge 09 2 458 100 100 84 82 83 82 116 i
I Lower Monocacy 0 0 0 0 0 0 0 0 0 0 I Clopper lake 0 0 0 0 0 0 0 0 0 0
I Great Seneca bull 66 16 87 41 15 4 4 4 010 4
I MuddyWatts 20 6 26 84 33 0 0 1 0 0
Includes Clopper Lake Project count does not include stream restoration Pollutants wth a TMDL are highlighted
021611
Montgomery County Coordinated Implementation Strategy - DRAFT
Table 36 Cost and benefit summary for other potential projects (WTM 20)
I Watershed Total ESO Projects Incremental reduction from baseline ()
ICost Impervious I Cost
I I Trash INumber of
control added Impervious
TN TP TSS Bacteria (million $) projects bullbull
(ac) (total) (total)
i i
Anacostia 2492 497 2222 73 62 23 8 26 301
Cabin John 00840 1 5 0 010 01 01 01 01 01
Rock Creek 20 4 201 0 0 12 12 19 15 21
Triadelphia 00 0 0 010 0 00 00 00 00 00
Rocky Gorge 20 2 0 010 0 00 00 00 00 00
lower Monocacy 00 0 0 0( 0 00 00 00 00 0010
Clopper Lake 00 0 0 0 0 00 00 00 00 0010
Great Seneca bull 02 S S3 0 0 23 23 27 00 27
MuddyWatts 00 0 0 0 0( 00 00 00 00 0010
bull Includes Clopper Lake bullbull Project count does not include stream restoration Pollutants with a TMDL are highlighted
Table 37 Cost and benefit summary for ESO projects (WTM 30)
Watershed
I
Cost (million $) Impervious
control added
(ac)
Incremental reduction from baseline ()
ESDfor i ESO for private
public
property property
TN TP TSS Bacteria Trash
Anacostia 2378 21296 1813 20 21 7 22 27
Cabin John 878 10307 876 22 23 25 24 28
Rock Creek 2471 341 2427 30 30 33 32 35
Triadelphia 41 47 36 10 1010 11 11 20
Rocky Gorge 312 19 28S 26 27 32 30 46
lower Monocacy 86 29 53 14 15 15 15 010
Clopper lake 08 051 21 14 14 15 0 14
Great Seneca bull 00 0 0 010 0 0( 0( 010
MuddyWatts 00 a 0 0 01 010 0 0
bull Includes Clopper lake Pollutants with a TMDL are highlighted
Table 3B Cost and benefit summary for riparian reforestation (WTM 40)
IWatershed Cost (million $) Impervious
Incremental reduction from baseline ()
control added Habitat restoration (ac) TN TP TSS Bacteria Trash
Anacostia 1 6 0 0 0 01 02
Cabin John 777 39 1 2 lili
3
Rock Creek 24 119 2 2 2 5
Triadelphia 010 1 01 02 01 04 03
Rocky Gorge 25 12 1 2 2 3 8
lower Monocacy 11 S 3 3 3 4 0
Clopper Lake 023 2 4 4 2 010 4
Great Seneca bull 0 a 010 010 0 010 0
MuddyWatts 0 0 010 0 0 0 0
bull Includes Clopper lake Pallutonts with a TMDL are highlighted
021611
Montgomery County Coordinated Implementation Strategy - DRAFT
Table 57 Cost and benefit summary for stream restoration (WTM 40)
Watershed Stream Restoration Incremental reduction from baseline ()
Number of Impervious control
Cost (million $) added(ac) TN TP TSS Bacteria Trash projects
Anacostia 937 200 0 42 56 326 0 0
Cabinlohn 162 15 0 17 9 80 0 0
Rock Creek 201 30 a 9 710 100 0 0
Triadelphia 00 0 0 0 0 0 010 0
Rocky Gorge 191 18 I 0 10 7 36 0 O lower Monocacy 73 nla 0 7 10 32 010 0
Clopper Lake 00 a 0 0 0 0 0 0
Great Seneca It I 259 33 0 19 8 16 0 0
MuddyWatts 242 45 0 16 7 13 0 0
Includes Clopper Lake Pollutants with a TMDL are highlighted
Table 58 Cost and benefit summary for M54programmatlc practices (WTM 50)
Watershed Cost (million $) Incremental reduction from baseline ()
Programmatic
practices - M54
Impervious control
added (ac) TN TP TSS Bacteria Trash
Anacostia 36 0 9 9 10 8 82
Cabin John 047 0 15 14 0 10 0
Rockereek 12 0 11 11 0 7 0
Triadelphia 00056 a 23 3 0 0 0
Rocky Gorge 009 0 38 8 03 5 2
lower Monocacy 007 0 0 0 19 0 0
Clopper Lake 0Q1 0 61 30
~=r 0
Great Seneca 10 0 0 0 0 0Y0 0 0
MuddyWatts 0 0 0 0 0 0 0
bull Includes Clopper Lake Pollutants with a TMDL are highlighted
021611
Montgomery County Coordinated Implementation Strategy - DRAFT
4 COORDINATED IMPLEMENTATION STRATEGY
The Strategy has multiple objectives to accomplish whereby a challenging balance between
strategies and timeframe is required There isnt necessarily a correct answer in the process
but rather an optimized result that addresses an agreed upon suite of priorities The Strategy
presented here was primarily driven by known and established regulatory timeframes and
compliance endpoints Meeting these endpoints using the more cost effective approaches was
also given priority After this consideration was given to other known and important
approaches that stakeholders and the County have an interest in pursuing Specifically the
following compliance dates and objectives were conSidered in developing the Strategy over the
long-term (Table 41)
Table 41 Compliance Targets for Countywide Coordinated Implementation Strategy
Target Date
2015
2017
2020
Compliance Target
Meeting 20 impervious cover treatment requirement
within the MS4 Permit cycle
Meet the interim dates and targets for the Chesapeake
Bay TMDL which include specific regulated urban area
reductions by 2017 for nutrients and sediment (based
on Maryland Department of the Environments
Watershed Implementation Plan)
Meet the full compliance and targets for the
Chesapeake BayTIVIDL which include specific regulated
urban area reduction by 2020 for nutrients and
sediment (based on Maryland Department of the
Environments Watershed Implementation Plan)
Metric
~4300 acres of
Impervious Cover
9 12 and 20
respectively for TN TP
and TSS reductions
from baseline
conditions
18 34 and 37
respectively for TN TP
and TSS reductions
from baseline
conditions
2025
2030
Meet additional impervious cover treatment targets
associated with next MS4 Permit cycle (assumes
another 20 target)
Meet additional impervious cover treatment targets
associated with next MS4 Permit cycle (assumes
another 20 target)
Out year compliance with other watershed TMDLs
~3400 acres of
Impervious Cover (20
of impervious
remaining after 2015)
~2750 acres of
Impervious Cover (20
of impervious
remaining after 2020)
100 compliance with
MS4 Permit Area WLAs
021611
Montgomery County Coordinated Implementation Strategy - DRAFT
To meet the compliance targets outlined in Table 41 the following priorities were generally
followed
bull 100 implementation of completed high and low priority County projects in first five
years (by 2015)
bull Greater ESD focus in urban (as opposed to suburban and rural) watersheds initially Goal
for ESD in these watersheds on pUblic property in first five years is 10 and on private
property is 10 The level of implementation was largely driven by the 20 Countywide
impervious goal
bull 100 of Public Outreach Potential for all TIVIDl watersheds in first five years This was
pursued to address trash nutrient and bacteria loading which rely strongly on effective
outreach programs to modify behaviors
bull Generally limited strategies to the top four most cost effective per watershed
bull Habitat restoration (stream restoration and buffer reforestation) not pursued as priority
until after first five year period These programs emphasize greater pollutant reduction
efficiency rather than impervious cover treatment which is the primary focus for the
first permit cycle
The Strategy was informed by the individual watershed implementation plans for seven
watersheds which included the Clopper lake and Patuxent subwatersheds Therefore in order
to develop countywide estimates for pollutant load reduction (as is required by the Chesapeake
Bay TMDl) watershed area weighting was applied The process for developing the Countywide
strategy and individual watershed implementation plans was woven together Once the
restoration potential was determined from the individual plans the strategy and schedule was
compiled using the restoration potentials and the drivers listed above The final restoration
cost and schedule was then placed in the implementation plans
It is also worth noting that the high and low priority projects along with the other potential
projects strategies represent a static or fixed number of projects that have been identified by
the County For this analysiS this list of practices is not replenished and therefore once all
opportunities have been implemented other strategies are pursued In reality the County will
continue to develop and update its list of specific project opportunities and have these
available for implementation in future years
The output from this effort is presented in a series of tables ordered by target date in Appendix
D In addition Table 42 provides an overall summary of pollutant load reduction tracking
versus time Through inspection of Table 42 it can be seen that the Strategy meets the
021611
Montgomery County Coordinated Implementation Strategy - DRAFT
impervious cover treatment targets under the current MS4 permit (as well as projected targets
for 2020 and 2025 assuming a continued 20 treatment requirement) interim and final
Chesapeake Bay nutrient and sediment reduction targets by 2017 and 2020 respectively and
out year MS4 permit area WLA compliance for the majority of pollutants Exceptions include
meeting the bacteria WLA load reductions required for the Anacostia and Rock Creek
021611
Montgomery County Coordinated Implementation Strategy - DRAFT
Table 42 Projection by Phase for Watersheds and Pollutants PermitTMDL Targets
Watershed Fiscal Year 2015 2017 2020 2025 2030 2017 2020
Impervious Treated (acres) 1421 2393 3364 4272 4544
ESD ( Impervious) 26 44 61 69A 71
Cost (Million $) 160 307 486 732 820
E5D( Cost) 45 62 71 78 78
Anacostia Nitrogen 25 39 68 89A l00A 818 82
Phosphorus 27 42 77 100 100 812 81
i Sediment 47 72 100 l00A) l00A 875 88
Bacteria 21 33 46 59A 64 879 88
Trash 41 65 89 l00A) 100
Impervious Treated (acres) 1541 1961 2381 3625 3989
ESD ( Impervious) 17 28 36 57A 61
Cost (Million $) 87 172 262 566 658
ESD ( Cost) 7(JA 79 79A 89A 9(JA
Rock Creek Nitrogen 24 30 38 55 61
Phosphorus 25 3(JA 38 54 GfJA)
Sediment 38 50 92 l00A 100
Bacteria 21 27 33 5(JA 55 96(JA 96
Trash 17 24 31 5(JA) 55
Impervious Treated (acres) 187 380 570 1018 1018
ESD ( Impervious) 52 72 78 87A 87A
Cost (Million $) 23 65 114 215 219
ESD ( Cost) 92 91 86 90 88
Cabin John Nitrogen 21 27A 39A 55 58 Phosphorus 2(JA 26 35 49 51
Sediment 6 17 GfJA 91 100
Bacteria 16 22 27 4(JA) 40 31 31
Trash 6 12 19 34 34
Impervious Treated (acres) 237 237 237 237 237
ESD ( Impervious) 4 4 4 4 4
Cost (Million $) 6 8 19 25 31
ESD ( Cost) 32 27A 11 8 7
Muddy Watts Nitrogen 6 7 15 18 22
Phosphorus 6 7 10 12 13 Sediment 7 8 14 17 2(JA
Bacteria 0 (JA 0 (JA 0 i Trash 6 6 6 6 6
bull Impervious Treated (acres) 901 921 941 941 941 ESD ( Impervious) 2 2 2 2 2
Cost (Million $) 26 48 SO 51 52 ESD ( Cost) 15 8 8 8 8
Great Seneca Nitrogen 24 41 43 44 45
Phosphorus 24 32 34 34 34
i Sediment 26 41 43 44 44
I Bacteria (JA) 0 0 0 (JA
Trash 31 32 33 33 33
021611
Montgomery County Coordinated Implementation Strategy - DRAFT
Pe rmitTMDL Targets
Watershed Fiscal Year 2015 2017 2020 2025 2030 2017 2020
Clopper
Impervious Treated (acres) 0 6 12 22 22
ESD ( Impervious) 0 86 86 92 92
Cost (Million $) 0 0 1 2 2
ESD ( Cost) 0 72 73 84 84
Nitrogen 61 67 72 79 79
Phosphorus 30 36 41 48 48 45 45
Sediment 0 5 10 17 17
Bacteria 0 0 0 0 0
Trash 0 6 11 18 18
Lower Monocacy
Impervious Treated (acres) 1 16 32 58 58
ESD ( Impervious) 100 85 84 91 91
Cost (Million $) 0 4 11 18 20
ESD ( Cost) 100 85 54 63 58
Nitrogen 0 5 14 22 24
Phosphorus 0 5 16 26 28
Sediment 0 5 46 61 69 608 61
Bacteria 0 6 12 19 19
Trash 0 0 0 0 0
Rocky Gorge
Impervious Treated (acres) 11 88 165 307 307
ESD ( Impervious) 64 89 90 95 95
Cost (Million $) 3 17 40 70 75
ESD ( Cost) 55 82 64 73 68
Nitrogen 47 55 6710 82 85
Phosphorus 17 25 36 52 53 15 15
Sediment 10 19 45 7(J1o 79
Bacteria 14 23 32 47 47
Trash 15 30 46 68 68
Triadelphia
Impervious Treated (acres) 3 12 20 38 38
ESD ( Impervious) 100 98 97 99 99
Cost (Million $) 1 3 5 9 9
ESD ( Cost) 99 98 98 99 99
Nitrogen 24 27 29 34 34
Phosphorus 4 7 9 14 14 15 15
Sediment 1 4 6 12 12
Bacteria 1 4 6 12 12
Trash 2 6 11 21 21
Countywide
Impervious Treated (acres) 4302 6014 7722 10518 11154 6008 7723
ESD ( Impervious) 18 34 47 6(J1o 63
Cost (Million $) 305 622 987 1687 1884
ESD ( Cost) 53 66 7(J1o 8(J1o 80
Nitrogen 18 25 36 46 51 9 2(J1o
Phosphorus 17 23 34 44 46 12 34
Sediment 23 34 54 6(J1o 62 20 37
Bacteria 11 15 20 28 30
Trash 18 26 33 41 42
Assumptio~s
1 Does no~ includerepeated Outreach and Education costs beyond FY2015
2 Does not include ~n inflation multiplier
021611
Montgomery County Coordinated Implementation Strategy - DRAFT
Summary of Individual Implementation Plans
A summary of the general considerations and prioritization for each watershed implementation
plan is provided below
Anacostia - For the first permit cycle (through 2015) a priority was placed on full
implementation of completed high and low priority projects Next implementation of a third
of the other potential projects was targeted as a large number of these were identified in
conjunction with the USACEs Anacostia Watershed Restoration Plan efforts ESD was
emphasized on both public (10) and private property (10) Finally outreach (25) and
stream restoration (12) are targeted for pollutant load reduction but are not credited towards
impervious cover credit In future permit cycles the remainder of the other potential projects
are targeted along with ESD and a limited amount of riparian reforestation for impervious cover
and pollutant load reduction Outreach and stream restoration are significant strategies
pursued for load reduction benefits Nutrient and sediment MS4 permit area WLAs are met by
2030 but bacteria load reduction does not meet MS4 permit area WLA compliance The
remaining bacteria reduction is believed to be associated with urban wildlife sources Unless
intense urban wildlife management practices are implemented this remaining load reduction
will not be possible
Rock Creek- For the first permit cycle (through 2015) a priority was placed on full
implementation of complete high and low priority projects Next 25 implementation of
other potential projects was targeted ESD was emphasized on both public (10) and private
property (10) with private property implementation being linked to Rainscapes Program
success Finally outreach (100) and stream restoration (22) are targeted for pollutant load
reduction but are not credited towards impervious cover credit In future permit cycles the
remainder of the other potential projects are targeted along with ESD and riparian
reforestation for impervious cover and pollutant load reduction Stream restoration is a
significant strategy pursued for load reduction benefits The bacterial load reduction does not
meet MS4 permit area WLA compliance However the remaining bacterial load is believed to
be associated with urban wildlife sources Unless intense urban wildlife management practices
are implemented this remaining load reduction will not be possible
Cabin John Creek - Similar to the other two more urban watersheds in the County during the
first permit cycle (through 2015) a priority was placed on full implementation of complete high
and low priority projects Fewer opportunities exist overall compared to the Anacostia and Rock
Creek Next 25 implementation of other potential projects was targeted ESD was
emphasized on both public (10) and private property (10) Finally outreach (100) was
021611
Montgomery County Coordinated Implementation Strategy - DRAFT
targeted for pollutant load reduction but not credited towards impervious cover credit No
riparian reforestation or stream restoration was targeted due to limited or no opportunities In
future permit cycles the remainder of the other potential projects are targeted along with ESD
and some riparian reforestation for impervious cover and pollutant load reduction The
bacteria load reduction meets MS4 permit area WLA compliance by 2025
Muddy BranchWatts Branch - During the first permit cycle (through 2015) a priority was
placed on full implementation of complete high and low priority projects Fewer opportunities
exist overall compared to the Anacostia and Rock Creek Watersheds No other strategies were
pursued as there are no existing TMDLs in the Muddy BranchWatts Branch subwatersheds In
future permit cycles previously identified stream restoration projects are implemented for
pollutant load reduction
Great Seneca Creek - This watershed implementation plan is unique in that it includes the small
Clopper Lake subwatershed which has a TMDL for phosphorus Even with the TMDL there are
limited identified opportunities to pursue in the Clopper Lake subwatershed in part due to the
limited area of the subwatershed within the County MS4 permit area During the first permit
cycle (through 2015) a priority was placed on full implementation of complete high and low
priority projects within Great Seneca Creek subwatershed No opportunities exist for these
strategies in Clopper Lake However full outreach was applied in Clopper Lake in the first
permit cycle In future years other potential projects ESD on public and private property and a
small amount of riparian reforestation (in Clopper Lake) is pursued The Clopper Lake WLA for
phosphorus within the MS4 permit area is met
Patuxent - During the first permit cycle through 2015 a priority was placed on full
implementation of complete high and low priority projects Far fewer opportunities exist
overall compared to the Anacostia and Rock Creek A limited amount of ESD on private land
and stream restoration was pursued Finally outreach (100) was targeted for pollutant load
reduction (primarily nutrients) but not credited towards impervious cover credit No riparian
reforestation was targeted within the MS4 Permit area due to cost effectiveness in the Rocky
Gorge subwatershed and limited opportunities in the Triadelphia subwatershed In future
permit cycles ESD on private and public land is pursued more substantially as is stream
restoration A limited amount of riparian reforestation achieves some impervious cover and
pollutant load reduction The Rocky Gorge phosphorus WLA within the MS4 permit area is met
easily and the Tridelphia phosphorus WLA is also met but with a longer timeframe needed for
compliance
021611
Montgomery County Coordinated Implementation Strategy - DRAFT
Lower Monocacy Creek -lower Monocacy Creek is the most rural watershed in the County and
has the least amount of area subject to the County MS4 permit In addition there are no preshy
identified restoration projects within the watershed Therefore during the first permit cycle
(through 2015) only a very small amount (5) of private property ESD is pursued It is not until
the second permit cycle that more focus is placed on private and public ESD as well as stream
restoration and programmatic strategies such as street sweeping to target sediment loads
associated with the TM Dl In future permit cycles stream restoration is pursued for pollutant
load reduction The sediment WlA within the MS4 permit area is projected to be met around
2025
Countywide - The Countywide effort was driven by impervious cover treatment targets and
Chesapeake Bay TMDl2017 and 2020 reduction targets associated with sediment and nutrients
for urban MS4s For impervious cover it was assumed that a 20 target would be required for
each five-year permit cycle The Bay TMDl targets for urban MS4 areas were easily met for all
pollutants in 2017 and easily met for nitrogen and sediment but more difficult to meet for
phosphorus in 2020
Public Outreach and Stewardship
The County recognizes and is committed to the increasingly important role that public outreach
and stewardship will play if improved water quality conditions are going to be achieved
countywide While the County currently has a very active and layered outreach program the
model requires changes that will result in broader stakeholder groups serving as the leaders
and primary champions for clean water in their communities This includes greater participation
from minority and faith-based groups business consortiums schools neighborhood
associations and civic groups Additionally the new model requires revisiting current
initiatives carried out by the various County agencies to look for better and more efficient ways
to communicate messages cross-train and create synergies that result in greater engagement
greater awareness and sustained changes in behavior
Within each implementation plan specific suggestions for outreach and education
opportunities are identified In addition Appendix E of this Strategy contains practice sheets
which highlight targeted restoration activities for the County to develop and refine A total of
eight practices have been identified that can be adopted countywide or in more targeted
watershed areas where there are specific water quality issues to address Many of the
practices build upon existing County programs but require a much broader reach to new
partner groups Program start up costs are suggested and were used to for cost estimates
associated with Countywide strategy The highlighted practices include
021611
Montgomery County Coordinated Implementation Strategy - DRAFT
bull Pet Waste Pickup Education and Outreach Campaign
bull Lawn Stewardship Education and Outreach Campaign
bull Anti-littering Education and Outreach Campaign
bull Innovative Stormwater Management Awareness Campaign
bull Stream Stewards Education and Outreach Campaign
bull Riparian Reforestation Education and Outreach Campaign
bull Roof Runoff Reduction Education and Outreach Campaign
bull Parking Lot Recharge Value Education and Outreach Campaign
Start up costs by practice along with an overall five year cost estimate are provided in Table
43 Start up timeframes are assumed to be up to 18 months
Table 43 Outreach Start Up and 5-Year Cost Projections
Practice Practice Start Up Cost
Pet Waste Pickup $240500
Lawn Stewardship $301 600
Anti-Littering $175050
Stormwater Management Improvements Awareness $50450
Stream Stewards $74825
Riparian Reforestation $30575
Roof Runoff Reduction $101400
Parking Lot Recharge Value $41500
Estimated Start Up Total $744900
5-Year Outreach Budget Projection $2650000
These eight practice sheets provide specific costs and timelines for implementation They also
provide suggestions for measuring program success These practice sheets along with the
specific recommendations in the implementation plans make up the Public Outreach and
Education Campaign
Trash Reduction
Most of the implementation plans have to address trash loadings to meet requirements of the
Potomac Trash Treaty that is referenced in the County1s MS4 Permit In addition the Anacostia
Trash TMDL has recently been accepted by MDE and the EPA According to the Anacostia
021611
Montgomery County Coordinated Implementation Strategy - DRAFT
TMDl there is reasonable assurance that the goals of the Treaty and TMDl can be met with
proper watershed planning implementing pollution-reduction BMPs and using strong political
and financial mechanisms
Currently the County has a number of activities which target trash reduction They include the
following
bull Adopt-a-Road Program through DOT which focuses on public awareness and involvement in trash management There are 205 participants who adopted road segments and agreed to six major road cleanups per year
bull Storm Drain Marking through DOT bull Support for illegal dumping enforcement outreach and research and monitoring bull Partnership with DOT to conduct street sweeping covering about 2500 curb miles and
occurring once a year
bull Partnership with the Park Police to monitor illegal dumping which combined enforces 300-400 actions a year
bull Non-residential and residential recycling programs through Solid Waste Services (SWS) bull Transit stop trash management program at 600 bus stops countywide supported by DOT
Transit Services
In addition to continuing these efforts a number of trash good-housekeeping efforts have been
proposed as part of this Strategy A detailed description of the quantitative methods and
strategies applied can be found in Appendix E of the Guidance Document In general the
following six trash-reduction strategies are recommended
1 Significantly increase funding for trash reduction programs 2 Create and enhance regional partnerships and coordination among businesses
environmental groups individual citizens and government at all levels and in all jurisdictions
3 Improve peoples awareness knowledge and behavior relating to littering and illegal dumping
4 Promote the greater introduction and use of effective trash-reduction technologies and approaches
5 Improve enactment and enforcement of laws to reduce trash 6 Increase trash monitoring-related data collection generation and dissemination efforts
The Anacostia watershed implementation plan provides an outline of the actions that will be
taken through the first permit cycle to reduce trash The range of programs and practices
specially aimed at reducing trash inputs to roads and streams that will be targeted include
reduce reuse and recycle campaigns littering and illegal dumping enforcement stream
cleanups and street sweeping These measures are in addition to any trash trapped and
021611
Montgomery County Coordinated Implementation Strategy - DRAFT
removed by structural practices which are computed using the WTM The plan shows that the
trash TMDl can be met by 2025 at a cost of 732 million dollars
Adaptive Management Monitoring and Reporting
Sound implementation strategies require assessment and effective adaptation to respond to
new information changing conditions new technologies and lessons learned This will be the
basis of the plan that will be used when benchmarks are not met and the projected funding is
inadequate
Adaptive management requires monitoring of a variety of measures that can be used to
determine whether progress is being made towards meeting the Countywide water quality
objectives Ultimately it is the instream water quality and the loading limits with respect to the
TMDls that determine the success of implementation however there are many interim
measures that can also be correlated to success which are worthwhile pursuing
Surface water monitoring can be an expensive and time consuming undertaking Montgomery
County is fortunate to have an extensive Countywide stream monitoring network that can serve
as a foundation for providing spatial and temporal data to indicate stream health The Countys
MS4 Permit also outlines the required assessment of controls which includes chemical
biological and physical monitoring Specifically the permit calls for the County to continue
their watershed restoration monitoring of the lower Paint Branch subwatershed and physical
monitoring ofthe Clarksburg Special Protection area In addition to the existing monitoring
network the County will continue tracking and data reporting associated with levels of
implementation (eg acres of impervious cover treated areas of buffer planted miles of
stream restored miles of streets swept) For measuring effectiveness of outreach and
stewardship efforts other types of monitoring and reporting are planned that include before
and after attitude surveys frequency of website visits and information requests
For many restoration strategies it may be difficult to tease out their individual effectiveness in
terms of pollutant load reductions but collectively the monitoring that occurs should provide
adequate insight into the overall effectiveness of a layered implementation strategy
In addition to the monitoring and assessment the County will be reporting results on an annual
basis as part of their NPDES MS4 Permit annual report The MS4 Permit requires annual
reporting of the following
021611
Montgomery County Coordinated Implementation Strategy - DRAFT
bull The status of implementing the components of the stormwater management program
that are established as permit conditions
bull A narrative summary describing the results and analyses of data including monitoring
data that is accumulated throughout the reporting year
bull Expenditures for the reporting period and the proposed budget for the upcoming year
bull A summary describing the number and nature of enforcement actions inspections and
public education programs
bull The identification of water quality improvements and documentation of progress
toward meeting applicable WLAs developed under EPA approved TMDLs and
bull The identification of any proposed changes to the Countys program when WLAs are not
being met
The County will build upon annual reporting that has historically occurred to meet permit
requirements and will supplement this reporting with tracking table summaries that quantify
implementation activities for the range of strategies pursued during that year and the
associated treatment (eg impervious cover treated pollutant load reduced education and
outreach partners established etc) Cost will also be tracked in association with rates of
implementation This level of performance will then be compared with countywide strategy
targets (eg progress towards meeting WLAs) associated with key performance dates such as
those presented in Table 41 The level of progress achieved by the County will then feed into
the adaptive management approach described above
Organization Needs to Implement Strategy
Montgomery County DEP staff possesses substantial expertise and institutional knowledge that
yields many positive outcomes and efficient processes under the current pace of restoration
and permit compliance activities Under this strategy however the pace of implementation is
required to significantly increase Based on an increase in the level of implementation it is
reasonable to assume that additional capacity may be needed to provide sufficient oversight
and management of all the projects
Another critical element of this strategy is the recognition and commitment to pursuing
outreach initiatives that build community capacity by targeting new partner groups that
provide the necessary leadership oversight and sustained effort to change behaviors and
foster stewardship The County currently carries out many well established and managed
outreach programs but it may require additional focus across County agencies and
departments for these partnerships to become established and thrive
021611 G
Montgomery County Coordinated Implementation Strategy - DRAFT
Through the implementation process and the monitoring and reporting that is required large
amounts of data will be generated Technological advances happen so rapidly in this day and
age it will be important for the County to stay current with technology and methods so that
more efficient and cost-effective data management and reporting will be possible The County
currently relies on a detailed and sophisticated GIS to spatially locate projects and manage
tables of data related to projects The growth and development of this spatial database will be
a critical component of the reporting and tracking capability of the County These databases
generate the input data that are used to measure progress towards baseline loading targets
Regular review and upkeep of the data as well as routine summarization of progress (annually
at a minimum) will likely require additional dedication of staff This is especially the case during
periods where the implementation rate of structural practices in the ground is accelerated
021611
Montgomery County Coordinated Implementation Strategy - DRAFT
Appendix C - Restoration Potential by Watershed
021611
c-
04 03 02 01
a
_ Nitrogen Load Reduction
--shy TMDL WLA Target
_Cost
MONTGOMERY COUNTY URBAN WATERSHEDS POLLUTANTS _Bk)~Ibilats ~1~ l~ fjfsi --
Rank
1
2
3
4
5
6
7
8
9
10
11
Restoration Strategy TN reduction
Ibsyr
Pet Waste Education 15169
Retrofit of Underperforming BMPs 1769
Stream Restoration 72423
Completed Projects ~43 High Priority Projects 3260
Other Potential Projects 43276
Habitat Restoration 224
Public Property ESD Retrofits 18270
Priority Neighborhoods ESD Retrofits 9271
Private Non-residential ESD Retrofits 5594
Street Sweeping -
Incremental Cost Unit Cost
Million $ IbsMillion $ 088 17193
120 1475
9304 778
948 701
635 513
25430 170
141 158
23655 77
13278 70
8018 70
124 -
Qj c
Qj
nI CXI
o -f-
1 09 08 07 06 05
$900 $800 $700
~ $600 c $500 ~ $400 $300 0 u $200 $100
$shy
~~mf il_~IJrt~
MONTGOMERY COUNTY URBAN WATERSHEDS POLLUTANTS ItfiQ14lbilJts i~5 [i
1 $900 Qj
09 $8005 iii en 08 $700
~co 07 $600 co - til
06 $500 ~ 05- $400 ~ 04 en$300 003 u $20002
en $100I 01 o 0 $shys Q en o
s Q
Phosphorus Load Reduction
--- TMDL WLA Target
__Cost
I Rank I
1
2
3
4
5
6
7
8
9
Restoration Strategy
Pet Waste Education
Retrofit of Underperforming BMPs
Stream Restoration
Completed Projects
High Priority Projects
Habitat Restoration
Other Potential Projects
Public Property ESD Retrofits
Priority Neighborhoods ESD Retrofits
10 I Private Non-residential ESD Retrofits
11 Street Sweeping
TP reduction Incremental Cost Unit Cost
Ibsyr Million $ IbsMillion $ 1979 088 2243
247 120 206
13097 9304 141
915 948 96
451 635 71
37 141 26
6067 25430 24
2546 23655 11
1294 13278 10
781 8018 10
- 124 -
MONTGOMERY COUNTY URBAN WATERSHEDS POLLUTANTS IItQjQhabillt$middot
Cii 5 Cii 11 It CD
6 ~ r o ~ s
0 ltIIa r ltII e c ltII III
1 09 08 07 06 05 04 03 02 01
0
$900
$800 $700
v$600 r
0 $500 == $400 $300 11
0 u $200 $100
$shy
_ Sediment load Reduction
--- TMDl WlA Target
__Cost
Rank Restoration Strategy
Sediment reduction
Incremental Cost
Unit Cost
tonsyr Million $ tonsMillion $ 1 Street Sweeping 800 124 645
2 Stream Restoration 25057 9304 269
3 Retrofit of Underperforming BMPs 25 120 21
4 Completed Projects 97 948 10
5 High Priority Projects 47 635 7
6 Other Potential Projects 660 25430 3
7 I Public Property ESD Retrofits 272 23655 1
8 Priority Neighborhoods ESD Retrofits 139 13278 1
9 Private Non-residential ESD Retrofits 84 8018 1
10 Habitat Restoration 2 141 1
11 Pet Waste Education - 088 -
C-3
MONTGOMERY COUNTY URBAN WATERSHEDS POLLUTANTS
-QI5 5i ~
1 09 08 07 06 05 04 03 02 01
0
$900
$800
$700
$600 ~ 0
$500 == $400 $300 11
0 u $200
$100
$shy
--shy TMDL WLA Target
___ Cost
Rank Restoration Strategy
Enterrococci reduction
Incremental Cost
Unit Cost
Billion MPNyr Million $ Billion MPN Million $
1 Pet Waste Education 19643 088 22263
2 Retrofit of Underperforming BMPs 2781 120 2318
3 Completed Projects 10441 948 1101
4 High Priority Projects 5120 635 806
5 Other Potential Projects 69895 25430 275
6 Riparian Reforestation 310 141 219
7 Public Property ESD Retrofits 29025 23655 123
8 Priority Neighborhoods ESD Retrofits 14777 13278 111
9 Private Non-residential ESD Retrofits 8917 8018 111
10 Stream Restoration - 9304 -
11 Street Sweeping - 124 I -
~ I~~~i MONTGOMERY COUNTY URBAN WATERSHEDS POLLUTANTS 1tI2~mL ~ I~I
~$ I -~-- I
100 90 80 70 60 50 40 30 20 10
0
$900 $800 $700 $600 $500 $400 $300 $200 $100 $shy
vi c
~ 5 11 0 u
Implementation Phase
Potential Trash Incremental Unit Cost
I
Rank Restoration Strategy Reduction Cost
Ibsyear Million $ IbsMillion $ 1 Recycling Education and Investigations 51654 02 238837
2 Plastic Bag Ban and Misc Enforcement 63546 13 48882
3 Anti-litter Campaign Education 23J61 09 26930
4 Retrofit of Underperforming BMPs 1144 12 954
5 Completed Projects 6598 95 696
6 High Priority Projects 2786 64 439
7 Other Potential Projects 56341 2543 222
8 Habitat Restoration 266 14 188
9 Street Sweeping 204 12 164
10 Public Property ESD Retrofits 25348 2366 107
11 Priority lIeighborhoods ESD Retrofits 12529 1328 94
12 Private Non-residential ESD Retrofits 7547 802 94 ru Stream Restoration - 930 -14 Pet Waste Education - 09 -
C-5
MONTGOMERY COUNTY URBAN WATERSHEDS POLLUTANTS
CABIN JOHN
1 250
__CostImplementation Phase
09 08 07 06 05 04 03 02 01
0
200 ~ c
150 g E
100 - ltII 0 u
50
0
_E Coli
- - - Waste Load Allocation
Rank Restoration Strategy
E coli reduction
Incremental Cost
Unit Cost
Billion
MPNyr Million $
Billion MPN
Million $ 1 Pet Waste Education 4388 $05 9436
2 Underperforming BMP Retrofits 1892 $19 1022
3 High Priority Projects 1289 $16 800
4 Riparian Reforestation 1133 $78 146
5 Other Potential Projects 148 $17 86
6 Public Property ESD Retrofits 4AOO $860 Sl 7 Private Non-residential ESD Retrofits 1618 $392 41
8 Priority Neighborhoods ESD Retrofits 2633 $638 41
9 Completed Projects 112 $00 0
C-6
MONTGOMERY COUNTY URBAN WATERSHEDS POLLUTANTS 1Itf~~Jabitm
ROCK CREEK
1 $700 Qj5 09
o
_
$600 Qj 08
111 $500 ~ampl 07 c
t5 06 $400 ~ e 05 ~ $3005 04 - 111tl 03 $200 0 u-6 02
$100J 01 $-
Enterrococci
- - - Waste load Allocation Implementation Phase
__Cost
Rank Restoration Strategy
Enterrococci reduction
Incremental Cost
Unit Cost
Billion MPNyr Million $ Billion MPN Million $
Et Pet Waste Management 35734 118 30190
Underperforming BMP Upgrades
Other Potential Projects
28800
30239
577
1083
4995
2792
4 Completed Projects 12131 444 2734
5 High Priority Projects 14239 890 1600
6 Riparian Reforestation 18999 2384 797
7 County Property ESD Retrofits 54519 24136 226
8 Private Residential ESD Retrofits 35230 17737 199
9 Private Non-residential ESD Retrofits 32A86 16380 198
C-7
MONTGOMERY COUNTY URBAN WATERSHEDS POLLUTANTS _f~~pabitafS (fi~r ~~ l-middotshy
ROCK CREEK
100 $900 90 $800 80 $700 u70 $600 c 60 2$50050 -~$40040
lt1$300 030 $200 u
20 10 $100
0 $shy
Implementation Phase
Rank Restoration Strategy Trash Reduction
Incremental Cost
Unit Cost I
Ibsyear Million $ IbsMillion $ 1 Other Potential Projects 16038 1085 1478
2 Underperforming BMP Upgrades 6756 577 1172
3 Completed Projects 4217 444 950
4 High Priority Projects 6366 890 715
5 Riparian Reforestation 9237 2384 387
6 Public Property ESD Retrofits 24587 24136 102
7 Priority Neighborhoods ESD Retrofits 16155 17737 91
8 Private Non-residential ESD Retrofits 14793 16380 90
9 Pet Waste Education - 118 -
(-8
MONTGOMERY COUNTY RURAL WATERSHEDS POLLUTANTS
SENECA - CLOPPER LAKE -
100 Qi
90 iii 80VI to -CQ 70 0 60e 50I 0 40 u l 30
C QJ 20ex
C 10to 0
J 0
$18
$16
$14 n
$12 I
$10 sect $08 ~ $06 0
VI
U $04
$02
$shy
_TPRemoval - - - TMDL Reduction Target
Implementation Phase ___Cost
Rank Restoration Strategy TP
Reduction (Ibsyr)
Incremental Cost (Million $)
Unit Cost (IbsvrMillion $)
1 Residential Education 33 001 6246
2 Underperforming BMP Retrofits 13 004 341 3 Riparian Buffer Reforestation 19 023 99 4 Priority Neighborhood ESD Retrofits 15 051 35 5 Public Property ESD Retrofits 7 075 99
C-9
-pj[fti
MONTGOMERY COUNTY URBAN WATERSHEDS POLLUTANTS 1It[~~JIlbitIL f bull~
LOWER MONOCACY
1 09 08 07 06 05 04 03 02 01
0
Implementation Phase
25
20 ~ c
15 ~ ~
10 - 0 u
5
0
_TSS
- - - Waste load Allocation _Cost
Rank Restoration Strategy
Sediment reduction
Incremental
Cost Unit Cost
tonsyear Million $ tonMilli
1 Street Sweeping 22 $007 3121
2 Underperforming BMP Retrofits 4 $010 389
3 Stream Restoration 37 $734 51
4 Riparian Buffer Reforestation 3 $109 25
5 Other Structural BMPs and ESD Strategies 10 $851 12
6 Priority Neighborhoods ESD Retrofits 2 $160 10
7 Non-residential ESD Retrofits 1 $132 10
C-10
MONTGOMERY COUNTY RURAL WATERSHEDS POLLUTANTS 1tlj~lIbiIalSlt~~II
1 09 08 07 06 05 04 03 02 01
0
$70
$60
$50 ~ c
$40 ~ ~ $30 - UI
$20 0 v
$10
$0
_ Phosphorus Load Reduction
- - - Waste Load Allocation ___ CostImplementation Phase
Rank Restoration Strategy TP Incremental Cost
Million $ Unit Cost
Ibsyr Ibs Million $ 1 Lawn Care Education 3670 01 37394
2 Underperforming BMP Retrofits 3499 08 4338
3 Other Potential Projects 3524 33 1076
4 High Priority Projects 252 04 685
5 Riparian Reforestation 762 26 298
6 Public Property Retrofits 5854 345 169
7 Priority Neighborhoods ESD Retrofits 796 65 123
8 Private Non-residential ESD Retrofits 1941 168 116
9 Completed Projects 53 00 00
c- 11
MONTGOMERY COUNTY RURAL WATERSHEDS POLLUTANTSal12hdJilats ~I~ ~ [ -
1 10 ii 5 09 9 1 08 8 II al- 07 7 1ii o 06 6
c
~ ~ 1 o E IV
05 04 03
5 4
3
~ 11 0 u
0 11 02 2 J o 01 1
t a 0 0 11 o
t 0
_ Phosphorus Reduction
- - - Waste Load Allocation
-Cost
Rank Restoration Strategy TP Incremental Cost
Million $ Unit Cost
Ibsyr Ibs Million $ 1 Lawn Care Education 3670 01 37394
2 Underperforming BMP Retrofits 3499 08 4338
3 Other Potential Projects 3524 33 1076
4 High Priority Projects 252 04 685
5 Riparian Reforestation 762 26 298
6 Public Property Retrofits 5854 345 169
7 Priority Neighborhoods ESD Retrofits 796 65 123
8 Private Non-residential ESD Retrofits 1941 168 116
9 Completed Projects 53 00 00
C-12
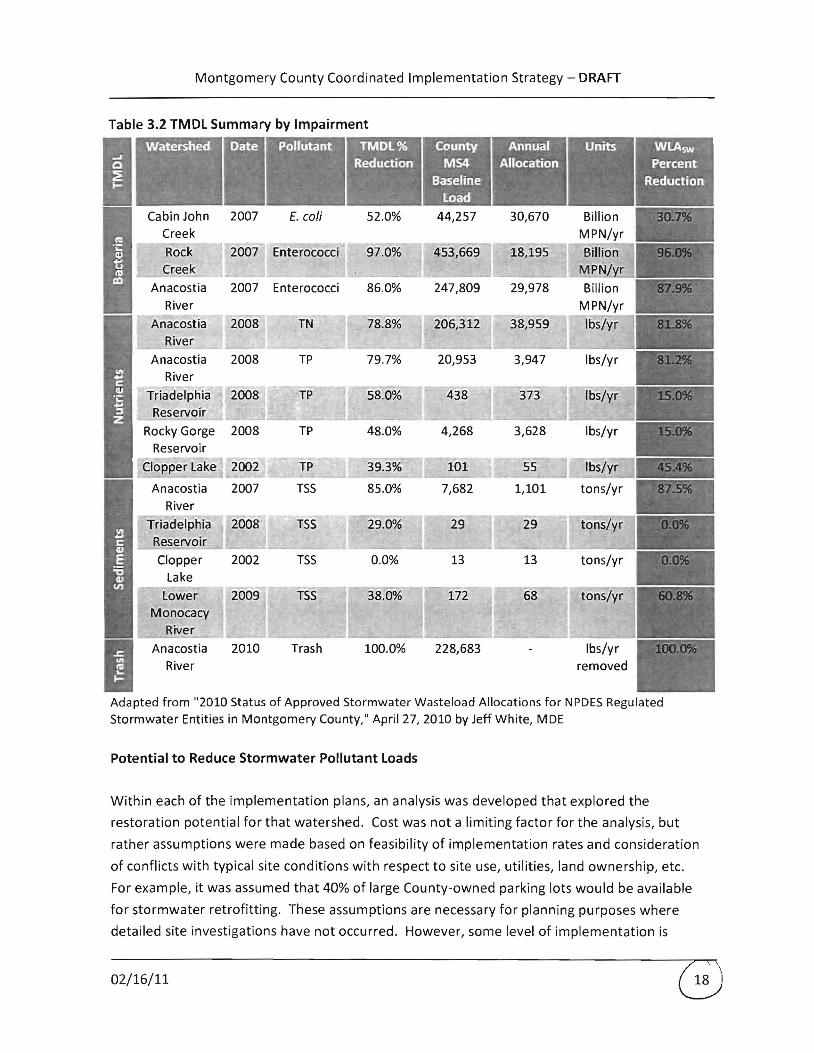
Montgomery County Coordinated Implementation Strategy - DRAFT
reasonable to assume In addition all identified high priority and low priority County projects
that have the potential to be constructed were assumed to be implemented
Implementation cost and effectiveness (in terms of pollutant load reduced) was also tracked
through the process of determining watershed restoration potential which enables the
costbenefit evaluation of various strategies for a target parameter (eg tons of sediment per
dollar spent or billion MPN of bacteria per dollar etc) For example by tracking cost and
effectiveness it is possible to evaluate the relative costbenefit of a strategy like ESD versus a
non-structural programmatic practice Moreover the comparison of these two strategies is
going to be different depending on what parameter is being considered eg ESD may be more
cost effective for nutrient reduction but less cost effective for bacterial load reduction
The tables in Appendix C help to illustrate this point Specifically a series of summary charts
and tables have been developed that illustrate the cost effectiveness of the range of strategies
considered by watershed with respect to pollutant load reduction The summaries reflect the
full restoration potential developed for each watershed
It is also useful to compare strategy effectiveness and range of opportunity across watersheds
To facilitate this a series of tables were compiled that groups all watersheds together and
considers watershed restoration potential by strategy These summary tables are presented in
Tables 33 through 310
For this analysis stream restoration was treated as a special modeling case (Table 39) because
it was not tracked as a strategy that receives credit for impervious cover treatment and because
it requires a different pollutant load reduction tracking method based on linear feet of
implementation and the existing stream resource condition (good fair or poor IBI scores
received different pollutant removal credit) Further details on stream restoration modeling
are presented in the individual implementation plans and the Guidance Document
Not all WTM scenarios were modeled for all watersheds For example if there were no
previously identified completed high priority low priority or other potential projects within a
watershed they would appear as zeros for that individual watershed in Tables 33 through 36
Also for non-TMDl watersheds such as Great Seneca and Muddy Branch and Watts Branch
subwatersheds the public and private property ESD riparian reforestation and MS4
programmatic practices scenarios were not modeled due to the lack of regulatory drivers that
define pollutant removal targets
021611
Montgomery County Coordinated Implementation Strategy - DRAFT
Table 33 Cost and benefit summary for completed projects (WTM 20)
Watershed Total ESD PrOjects Incremental reduction from baseline ()
i Cost Numberof Impervious
Cost
I Impervious Trash control added TN TP TSS Bacteria
(million $) projects bullbull (ac)
(total) (total)
Anacostia 95 25 167 7 3 4 4 1 4 4
Cabin John 00 0 0 0 0 02 02 03 03 1
Rock Creek 44 6 212 13 1 2 2 3 3 2 i
I Triadelphia 00 0 0 0 0 0 0 0 0 0
Rocky Gorge 00 0 0 0 0 0 01 0 0 0
Lower Monocacy 00 0 0 0 0 0 0 0 0 0
Clopper lake 00 0 0 0 0 0 0 0 0 0
Great Seneca bull 06 2 11 0 0 1 1 I 1 0 2
MuddyWatts 00 0 0 0 0 0 0 0 0 0
Indudes Clopper lake Project count does not include stream restoration Pollutants with a TMDL are highlighted
Table 34 Cost and benefit summary for high priority projects (WTM 20)
Watershed I
I
Total ESD Projects Incremental reduction from baseline ()
Cost
(million $)
i Numberof
projects bullbull
Impervious
control added
(ac)
ICost (total)
Impervious
(total) TN
I TP TSS I TrashBacteria
Anacostia 64 33 148 65 16 2 2 06 2 2
Cabin John 16 6 88 19 2 3 3 3 3 1
Rock Creek 89 14 373 13 1 2 3 3 3 4
Triadelphia 00 0 0 04 0 0 0 0 0 0
I Rocky Gorge 04 2 5 77 27 06 06 07 06 1
Lower Monocacy 00 0 0 0 0 0 0 0 0 0
Clopper lake 00 0 0 0 010 0 0 0 0 0 Great Seneca bull 183 24 789 6 08 19 19 20 0 24
MuddyWatts 44 16 211 8 1 6 6 6 0 6
Indudes Clopper lake bullbull Project count does not indude stream restoration Pollutants with a TMDL are highlighted
Table 35 Cost and benefit summary for low priority projects (WTM 20)
I Watershed Total ESO Projects Incremental reduction from baseline ()
Numberof Impervious ICost 1m ~ i Cost Impervious
I (million $) projects bullbull
control added (total) (total)
TN TP Bacteria Trash
(ac)
I Anacostia 51 16 188 61 8 2 2 07 2 3
Cabin John 16 8 10 98 78 02 02 02 02 03
I Rock Creek 88 24 657 7 1 4 4 6 5 7
Triadelphia 040 1 20 100 100 05 05 06 05 1
Rocky Gorge 09 2 458 100 100 84 82 83 82 116 i
I Lower Monocacy 0 0 0 0 0 0 0 0 0 0 I Clopper lake 0 0 0 0 0 0 0 0 0 0
I Great Seneca bull 66 16 87 41 15 4 4 4 010 4
I MuddyWatts 20 6 26 84 33 0 0 1 0 0
Includes Clopper Lake Project count does not include stream restoration Pollutants wth a TMDL are highlighted
021611
Montgomery County Coordinated Implementation Strategy - DRAFT
Table 36 Cost and benefit summary for other potential projects (WTM 20)
I Watershed Total ESO Projects Incremental reduction from baseline ()
ICost Impervious I Cost
I I Trash INumber of
control added Impervious
TN TP TSS Bacteria (million $) projects bullbull
(ac) (total) (total)
i i
Anacostia 2492 497 2222 73 62 23 8 26 301
Cabin John 00840 1 5 0 010 01 01 01 01 01
Rock Creek 20 4 201 0 0 12 12 19 15 21
Triadelphia 00 0 0 010 0 00 00 00 00 00
Rocky Gorge 20 2 0 010 0 00 00 00 00 00
lower Monocacy 00 0 0 0( 0 00 00 00 00 0010
Clopper Lake 00 0 0 0 0 00 00 00 00 0010
Great Seneca bull 02 S S3 0 0 23 23 27 00 27
MuddyWatts 00 0 0 0 0( 00 00 00 00 0010
bull Includes Clopper Lake bullbull Project count does not include stream restoration Pollutants with a TMDL are highlighted
Table 37 Cost and benefit summary for ESO projects (WTM 30)
Watershed
I
Cost (million $) Impervious
control added
(ac)
Incremental reduction from baseline ()
ESDfor i ESO for private
public
property property
TN TP TSS Bacteria Trash
Anacostia 2378 21296 1813 20 21 7 22 27
Cabin John 878 10307 876 22 23 25 24 28
Rock Creek 2471 341 2427 30 30 33 32 35
Triadelphia 41 47 36 10 1010 11 11 20
Rocky Gorge 312 19 28S 26 27 32 30 46
lower Monocacy 86 29 53 14 15 15 15 010
Clopper lake 08 051 21 14 14 15 0 14
Great Seneca bull 00 0 0 010 0 0( 0( 010
MuddyWatts 00 a 0 0 01 010 0 0
bull Includes Clopper lake Pollutants with a TMDL are highlighted
Table 3B Cost and benefit summary for riparian reforestation (WTM 40)
IWatershed Cost (million $) Impervious
Incremental reduction from baseline ()
control added Habitat restoration (ac) TN TP TSS Bacteria Trash
Anacostia 1 6 0 0 0 01 02
Cabin John 777 39 1 2 lili
3
Rock Creek 24 119 2 2 2 5
Triadelphia 010 1 01 02 01 04 03
Rocky Gorge 25 12 1 2 2 3 8
lower Monocacy 11 S 3 3 3 4 0
Clopper Lake 023 2 4 4 2 010 4
Great Seneca bull 0 a 010 010 0 010 0
MuddyWatts 0 0 010 0 0 0 0
bull Includes Clopper lake Pallutonts with a TMDL are highlighted
021611
Montgomery County Coordinated Implementation Strategy - DRAFT
Table 57 Cost and benefit summary for stream restoration (WTM 40)
Watershed Stream Restoration Incremental reduction from baseline ()
Number of Impervious control
Cost (million $) added(ac) TN TP TSS Bacteria Trash projects
Anacostia 937 200 0 42 56 326 0 0
Cabinlohn 162 15 0 17 9 80 0 0
Rock Creek 201 30 a 9 710 100 0 0
Triadelphia 00 0 0 0 0 0 010 0
Rocky Gorge 191 18 I 0 10 7 36 0 O lower Monocacy 73 nla 0 7 10 32 010 0
Clopper Lake 00 a 0 0 0 0 0 0
Great Seneca It I 259 33 0 19 8 16 0 0
MuddyWatts 242 45 0 16 7 13 0 0
Includes Clopper Lake Pollutants with a TMDL are highlighted
Table 58 Cost and benefit summary for M54programmatlc practices (WTM 50)
Watershed Cost (million $) Incremental reduction from baseline ()
Programmatic
practices - M54
Impervious control
added (ac) TN TP TSS Bacteria Trash
Anacostia 36 0 9 9 10 8 82
Cabin John 047 0 15 14 0 10 0
Rockereek 12 0 11 11 0 7 0
Triadelphia 00056 a 23 3 0 0 0
Rocky Gorge 009 0 38 8 03 5 2
lower Monocacy 007 0 0 0 19 0 0
Clopper Lake 0Q1 0 61 30
~=r 0
Great Seneca 10 0 0 0 0 0Y0 0 0
MuddyWatts 0 0 0 0 0 0 0
bull Includes Clopper Lake Pollutants with a TMDL are highlighted
021611
Montgomery County Coordinated Implementation Strategy - DRAFT
4 COORDINATED IMPLEMENTATION STRATEGY
The Strategy has multiple objectives to accomplish whereby a challenging balance between
strategies and timeframe is required There isnt necessarily a correct answer in the process
but rather an optimized result that addresses an agreed upon suite of priorities The Strategy
presented here was primarily driven by known and established regulatory timeframes and
compliance endpoints Meeting these endpoints using the more cost effective approaches was
also given priority After this consideration was given to other known and important
approaches that stakeholders and the County have an interest in pursuing Specifically the
following compliance dates and objectives were conSidered in developing the Strategy over the
long-term (Table 41)
Table 41 Compliance Targets for Countywide Coordinated Implementation Strategy
Target Date
2015
2017
2020
Compliance Target
Meeting 20 impervious cover treatment requirement
within the MS4 Permit cycle
Meet the interim dates and targets for the Chesapeake
Bay TMDL which include specific regulated urban area
reductions by 2017 for nutrients and sediment (based
on Maryland Department of the Environments
Watershed Implementation Plan)
Meet the full compliance and targets for the
Chesapeake BayTIVIDL which include specific regulated
urban area reduction by 2020 for nutrients and
sediment (based on Maryland Department of the
Environments Watershed Implementation Plan)
Metric
~4300 acres of
Impervious Cover
9 12 and 20
respectively for TN TP
and TSS reductions
from baseline
conditions
18 34 and 37
respectively for TN TP
and TSS reductions
from baseline
conditions
2025
2030
Meet additional impervious cover treatment targets
associated with next MS4 Permit cycle (assumes
another 20 target)
Meet additional impervious cover treatment targets
associated with next MS4 Permit cycle (assumes
another 20 target)
Out year compliance with other watershed TMDLs
~3400 acres of
Impervious Cover (20
of impervious
remaining after 2015)
~2750 acres of
Impervious Cover (20
of impervious
remaining after 2020)
100 compliance with
MS4 Permit Area WLAs
021611
Montgomery County Coordinated Implementation Strategy - DRAFT
To meet the compliance targets outlined in Table 41 the following priorities were generally
followed
bull 100 implementation of completed high and low priority County projects in first five
years (by 2015)
bull Greater ESD focus in urban (as opposed to suburban and rural) watersheds initially Goal
for ESD in these watersheds on pUblic property in first five years is 10 and on private
property is 10 The level of implementation was largely driven by the 20 Countywide
impervious goal
bull 100 of Public Outreach Potential for all TIVIDl watersheds in first five years This was
pursued to address trash nutrient and bacteria loading which rely strongly on effective
outreach programs to modify behaviors
bull Generally limited strategies to the top four most cost effective per watershed
bull Habitat restoration (stream restoration and buffer reforestation) not pursued as priority
until after first five year period These programs emphasize greater pollutant reduction
efficiency rather than impervious cover treatment which is the primary focus for the
first permit cycle
The Strategy was informed by the individual watershed implementation plans for seven
watersheds which included the Clopper lake and Patuxent subwatersheds Therefore in order
to develop countywide estimates for pollutant load reduction (as is required by the Chesapeake
Bay TMDl) watershed area weighting was applied The process for developing the Countywide
strategy and individual watershed implementation plans was woven together Once the
restoration potential was determined from the individual plans the strategy and schedule was
compiled using the restoration potentials and the drivers listed above The final restoration
cost and schedule was then placed in the implementation plans
It is also worth noting that the high and low priority projects along with the other potential
projects strategies represent a static or fixed number of projects that have been identified by
the County For this analysiS this list of practices is not replenished and therefore once all
opportunities have been implemented other strategies are pursued In reality the County will
continue to develop and update its list of specific project opportunities and have these
available for implementation in future years
The output from this effort is presented in a series of tables ordered by target date in Appendix
D In addition Table 42 provides an overall summary of pollutant load reduction tracking
versus time Through inspection of Table 42 it can be seen that the Strategy meets the
021611
Montgomery County Coordinated Implementation Strategy - DRAFT
impervious cover treatment targets under the current MS4 permit (as well as projected targets
for 2020 and 2025 assuming a continued 20 treatment requirement) interim and final
Chesapeake Bay nutrient and sediment reduction targets by 2017 and 2020 respectively and
out year MS4 permit area WLA compliance for the majority of pollutants Exceptions include
meeting the bacteria WLA load reductions required for the Anacostia and Rock Creek
021611
Montgomery County Coordinated Implementation Strategy - DRAFT
Table 42 Projection by Phase for Watersheds and Pollutants PermitTMDL Targets
Watershed Fiscal Year 2015 2017 2020 2025 2030 2017 2020
Impervious Treated (acres) 1421 2393 3364 4272 4544
ESD ( Impervious) 26 44 61 69A 71
Cost (Million $) 160 307 486 732 820
E5D( Cost) 45 62 71 78 78
Anacostia Nitrogen 25 39 68 89A l00A 818 82
Phosphorus 27 42 77 100 100 812 81
i Sediment 47 72 100 l00A) l00A 875 88
Bacteria 21 33 46 59A 64 879 88
Trash 41 65 89 l00A) 100
Impervious Treated (acres) 1541 1961 2381 3625 3989
ESD ( Impervious) 17 28 36 57A 61
Cost (Million $) 87 172 262 566 658
ESD ( Cost) 7(JA 79 79A 89A 9(JA
Rock Creek Nitrogen 24 30 38 55 61
Phosphorus 25 3(JA 38 54 GfJA)
Sediment 38 50 92 l00A 100
Bacteria 21 27 33 5(JA 55 96(JA 96
Trash 17 24 31 5(JA) 55
Impervious Treated (acres) 187 380 570 1018 1018
ESD ( Impervious) 52 72 78 87A 87A
Cost (Million $) 23 65 114 215 219
ESD ( Cost) 92 91 86 90 88
Cabin John Nitrogen 21 27A 39A 55 58 Phosphorus 2(JA 26 35 49 51
Sediment 6 17 GfJA 91 100
Bacteria 16 22 27 4(JA) 40 31 31
Trash 6 12 19 34 34
Impervious Treated (acres) 237 237 237 237 237
ESD ( Impervious) 4 4 4 4 4
Cost (Million $) 6 8 19 25 31
ESD ( Cost) 32 27A 11 8 7
Muddy Watts Nitrogen 6 7 15 18 22
Phosphorus 6 7 10 12 13 Sediment 7 8 14 17 2(JA
Bacteria 0 (JA 0 (JA 0 i Trash 6 6 6 6 6
bull Impervious Treated (acres) 901 921 941 941 941 ESD ( Impervious) 2 2 2 2 2
Cost (Million $) 26 48 SO 51 52 ESD ( Cost) 15 8 8 8 8
Great Seneca Nitrogen 24 41 43 44 45
Phosphorus 24 32 34 34 34
i Sediment 26 41 43 44 44
I Bacteria (JA) 0 0 0 (JA
Trash 31 32 33 33 33
021611
Montgomery County Coordinated Implementation Strategy - DRAFT
Pe rmitTMDL Targets
Watershed Fiscal Year 2015 2017 2020 2025 2030 2017 2020
Clopper
Impervious Treated (acres) 0 6 12 22 22
ESD ( Impervious) 0 86 86 92 92
Cost (Million $) 0 0 1 2 2
ESD ( Cost) 0 72 73 84 84
Nitrogen 61 67 72 79 79
Phosphorus 30 36 41 48 48 45 45
Sediment 0 5 10 17 17
Bacteria 0 0 0 0 0
Trash 0 6 11 18 18
Lower Monocacy
Impervious Treated (acres) 1 16 32 58 58
ESD ( Impervious) 100 85 84 91 91
Cost (Million $) 0 4 11 18 20
ESD ( Cost) 100 85 54 63 58
Nitrogen 0 5 14 22 24
Phosphorus 0 5 16 26 28
Sediment 0 5 46 61 69 608 61
Bacteria 0 6 12 19 19
Trash 0 0 0 0 0
Rocky Gorge
Impervious Treated (acres) 11 88 165 307 307
ESD ( Impervious) 64 89 90 95 95
Cost (Million $) 3 17 40 70 75
ESD ( Cost) 55 82 64 73 68
Nitrogen 47 55 6710 82 85
Phosphorus 17 25 36 52 53 15 15
Sediment 10 19 45 7(J1o 79
Bacteria 14 23 32 47 47
Trash 15 30 46 68 68
Triadelphia
Impervious Treated (acres) 3 12 20 38 38
ESD ( Impervious) 100 98 97 99 99
Cost (Million $) 1 3 5 9 9
ESD ( Cost) 99 98 98 99 99
Nitrogen 24 27 29 34 34
Phosphorus 4 7 9 14 14 15 15
Sediment 1 4 6 12 12
Bacteria 1 4 6 12 12
Trash 2 6 11 21 21
Countywide
Impervious Treated (acres) 4302 6014 7722 10518 11154 6008 7723
ESD ( Impervious) 18 34 47 6(J1o 63
Cost (Million $) 305 622 987 1687 1884
ESD ( Cost) 53 66 7(J1o 8(J1o 80
Nitrogen 18 25 36 46 51 9 2(J1o
Phosphorus 17 23 34 44 46 12 34
Sediment 23 34 54 6(J1o 62 20 37
Bacteria 11 15 20 28 30
Trash 18 26 33 41 42
Assumptio~s
1 Does no~ includerepeated Outreach and Education costs beyond FY2015
2 Does not include ~n inflation multiplier
021611
Montgomery County Coordinated Implementation Strategy - DRAFT
Summary of Individual Implementation Plans
A summary of the general considerations and prioritization for each watershed implementation
plan is provided below
Anacostia - For the first permit cycle (through 2015) a priority was placed on full
implementation of completed high and low priority projects Next implementation of a third
of the other potential projects was targeted as a large number of these were identified in
conjunction with the USACEs Anacostia Watershed Restoration Plan efforts ESD was
emphasized on both public (10) and private property (10) Finally outreach (25) and
stream restoration (12) are targeted for pollutant load reduction but are not credited towards
impervious cover credit In future permit cycles the remainder of the other potential projects
are targeted along with ESD and a limited amount of riparian reforestation for impervious cover
and pollutant load reduction Outreach and stream restoration are significant strategies
pursued for load reduction benefits Nutrient and sediment MS4 permit area WLAs are met by
2030 but bacteria load reduction does not meet MS4 permit area WLA compliance The
remaining bacteria reduction is believed to be associated with urban wildlife sources Unless
intense urban wildlife management practices are implemented this remaining load reduction
will not be possible
Rock Creek- For the first permit cycle (through 2015) a priority was placed on full
implementation of complete high and low priority projects Next 25 implementation of
other potential projects was targeted ESD was emphasized on both public (10) and private
property (10) with private property implementation being linked to Rainscapes Program
success Finally outreach (100) and stream restoration (22) are targeted for pollutant load
reduction but are not credited towards impervious cover credit In future permit cycles the
remainder of the other potential projects are targeted along with ESD and riparian
reforestation for impervious cover and pollutant load reduction Stream restoration is a
significant strategy pursued for load reduction benefits The bacterial load reduction does not
meet MS4 permit area WLA compliance However the remaining bacterial load is believed to
be associated with urban wildlife sources Unless intense urban wildlife management practices
are implemented this remaining load reduction will not be possible
Cabin John Creek - Similar to the other two more urban watersheds in the County during the
first permit cycle (through 2015) a priority was placed on full implementation of complete high
and low priority projects Fewer opportunities exist overall compared to the Anacostia and Rock
Creek Next 25 implementation of other potential projects was targeted ESD was
emphasized on both public (10) and private property (10) Finally outreach (100) was
021611
Montgomery County Coordinated Implementation Strategy - DRAFT
targeted for pollutant load reduction but not credited towards impervious cover credit No
riparian reforestation or stream restoration was targeted due to limited or no opportunities In
future permit cycles the remainder of the other potential projects are targeted along with ESD
and some riparian reforestation for impervious cover and pollutant load reduction The
bacteria load reduction meets MS4 permit area WLA compliance by 2025
Muddy BranchWatts Branch - During the first permit cycle (through 2015) a priority was
placed on full implementation of complete high and low priority projects Fewer opportunities
exist overall compared to the Anacostia and Rock Creek Watersheds No other strategies were
pursued as there are no existing TMDLs in the Muddy BranchWatts Branch subwatersheds In
future permit cycles previously identified stream restoration projects are implemented for
pollutant load reduction
Great Seneca Creek - This watershed implementation plan is unique in that it includes the small
Clopper Lake subwatershed which has a TMDL for phosphorus Even with the TMDL there are
limited identified opportunities to pursue in the Clopper Lake subwatershed in part due to the
limited area of the subwatershed within the County MS4 permit area During the first permit
cycle (through 2015) a priority was placed on full implementation of complete high and low
priority projects within Great Seneca Creek subwatershed No opportunities exist for these
strategies in Clopper Lake However full outreach was applied in Clopper Lake in the first
permit cycle In future years other potential projects ESD on public and private property and a
small amount of riparian reforestation (in Clopper Lake) is pursued The Clopper Lake WLA for
phosphorus within the MS4 permit area is met
Patuxent - During the first permit cycle through 2015 a priority was placed on full
implementation of complete high and low priority projects Far fewer opportunities exist
overall compared to the Anacostia and Rock Creek A limited amount of ESD on private land
and stream restoration was pursued Finally outreach (100) was targeted for pollutant load
reduction (primarily nutrients) but not credited towards impervious cover credit No riparian
reforestation was targeted within the MS4 Permit area due to cost effectiveness in the Rocky
Gorge subwatershed and limited opportunities in the Triadelphia subwatershed In future
permit cycles ESD on private and public land is pursued more substantially as is stream
restoration A limited amount of riparian reforestation achieves some impervious cover and
pollutant load reduction The Rocky Gorge phosphorus WLA within the MS4 permit area is met
easily and the Tridelphia phosphorus WLA is also met but with a longer timeframe needed for
compliance
021611
Montgomery County Coordinated Implementation Strategy - DRAFT
Lower Monocacy Creek -lower Monocacy Creek is the most rural watershed in the County and
has the least amount of area subject to the County MS4 permit In addition there are no preshy
identified restoration projects within the watershed Therefore during the first permit cycle
(through 2015) only a very small amount (5) of private property ESD is pursued It is not until
the second permit cycle that more focus is placed on private and public ESD as well as stream
restoration and programmatic strategies such as street sweeping to target sediment loads
associated with the TM Dl In future permit cycles stream restoration is pursued for pollutant
load reduction The sediment WlA within the MS4 permit area is projected to be met around
2025
Countywide - The Countywide effort was driven by impervious cover treatment targets and
Chesapeake Bay TMDl2017 and 2020 reduction targets associated with sediment and nutrients
for urban MS4s For impervious cover it was assumed that a 20 target would be required for
each five-year permit cycle The Bay TMDl targets for urban MS4 areas were easily met for all
pollutants in 2017 and easily met for nitrogen and sediment but more difficult to meet for
phosphorus in 2020
Public Outreach and Stewardship
The County recognizes and is committed to the increasingly important role that public outreach
and stewardship will play if improved water quality conditions are going to be achieved
countywide While the County currently has a very active and layered outreach program the
model requires changes that will result in broader stakeholder groups serving as the leaders
and primary champions for clean water in their communities This includes greater participation
from minority and faith-based groups business consortiums schools neighborhood
associations and civic groups Additionally the new model requires revisiting current
initiatives carried out by the various County agencies to look for better and more efficient ways
to communicate messages cross-train and create synergies that result in greater engagement
greater awareness and sustained changes in behavior
Within each implementation plan specific suggestions for outreach and education
opportunities are identified In addition Appendix E of this Strategy contains practice sheets
which highlight targeted restoration activities for the County to develop and refine A total of
eight practices have been identified that can be adopted countywide or in more targeted
watershed areas where there are specific water quality issues to address Many of the
practices build upon existing County programs but require a much broader reach to new
partner groups Program start up costs are suggested and were used to for cost estimates
associated with Countywide strategy The highlighted practices include
021611
Montgomery County Coordinated Implementation Strategy - DRAFT
bull Pet Waste Pickup Education and Outreach Campaign
bull Lawn Stewardship Education and Outreach Campaign
bull Anti-littering Education and Outreach Campaign
bull Innovative Stormwater Management Awareness Campaign
bull Stream Stewards Education and Outreach Campaign
bull Riparian Reforestation Education and Outreach Campaign
bull Roof Runoff Reduction Education and Outreach Campaign
bull Parking Lot Recharge Value Education and Outreach Campaign
Start up costs by practice along with an overall five year cost estimate are provided in Table
43 Start up timeframes are assumed to be up to 18 months
Table 43 Outreach Start Up and 5-Year Cost Projections
Practice Practice Start Up Cost
Pet Waste Pickup $240500
Lawn Stewardship $301 600
Anti-Littering $175050
Stormwater Management Improvements Awareness $50450
Stream Stewards $74825
Riparian Reforestation $30575
Roof Runoff Reduction $101400
Parking Lot Recharge Value $41500
Estimated Start Up Total $744900
5-Year Outreach Budget Projection $2650000
These eight practice sheets provide specific costs and timelines for implementation They also
provide suggestions for measuring program success These practice sheets along with the
specific recommendations in the implementation plans make up the Public Outreach and
Education Campaign
Trash Reduction
Most of the implementation plans have to address trash loadings to meet requirements of the
Potomac Trash Treaty that is referenced in the County1s MS4 Permit In addition the Anacostia
Trash TMDL has recently been accepted by MDE and the EPA According to the Anacostia
021611
Montgomery County Coordinated Implementation Strategy - DRAFT
TMDl there is reasonable assurance that the goals of the Treaty and TMDl can be met with
proper watershed planning implementing pollution-reduction BMPs and using strong political
and financial mechanisms
Currently the County has a number of activities which target trash reduction They include the
following
bull Adopt-a-Road Program through DOT which focuses on public awareness and involvement in trash management There are 205 participants who adopted road segments and agreed to six major road cleanups per year
bull Storm Drain Marking through DOT bull Support for illegal dumping enforcement outreach and research and monitoring bull Partnership with DOT to conduct street sweeping covering about 2500 curb miles and
occurring once a year
bull Partnership with the Park Police to monitor illegal dumping which combined enforces 300-400 actions a year
bull Non-residential and residential recycling programs through Solid Waste Services (SWS) bull Transit stop trash management program at 600 bus stops countywide supported by DOT
Transit Services
In addition to continuing these efforts a number of trash good-housekeeping efforts have been
proposed as part of this Strategy A detailed description of the quantitative methods and
strategies applied can be found in Appendix E of the Guidance Document In general the
following six trash-reduction strategies are recommended
1 Significantly increase funding for trash reduction programs 2 Create and enhance regional partnerships and coordination among businesses
environmental groups individual citizens and government at all levels and in all jurisdictions
3 Improve peoples awareness knowledge and behavior relating to littering and illegal dumping
4 Promote the greater introduction and use of effective trash-reduction technologies and approaches
5 Improve enactment and enforcement of laws to reduce trash 6 Increase trash monitoring-related data collection generation and dissemination efforts
The Anacostia watershed implementation plan provides an outline of the actions that will be
taken through the first permit cycle to reduce trash The range of programs and practices
specially aimed at reducing trash inputs to roads and streams that will be targeted include
reduce reuse and recycle campaigns littering and illegal dumping enforcement stream
cleanups and street sweeping These measures are in addition to any trash trapped and
021611
Montgomery County Coordinated Implementation Strategy - DRAFT
removed by structural practices which are computed using the WTM The plan shows that the
trash TMDl can be met by 2025 at a cost of 732 million dollars
Adaptive Management Monitoring and Reporting
Sound implementation strategies require assessment and effective adaptation to respond to
new information changing conditions new technologies and lessons learned This will be the
basis of the plan that will be used when benchmarks are not met and the projected funding is
inadequate
Adaptive management requires monitoring of a variety of measures that can be used to
determine whether progress is being made towards meeting the Countywide water quality
objectives Ultimately it is the instream water quality and the loading limits with respect to the
TMDls that determine the success of implementation however there are many interim
measures that can also be correlated to success which are worthwhile pursuing
Surface water monitoring can be an expensive and time consuming undertaking Montgomery
County is fortunate to have an extensive Countywide stream monitoring network that can serve
as a foundation for providing spatial and temporal data to indicate stream health The Countys
MS4 Permit also outlines the required assessment of controls which includes chemical
biological and physical monitoring Specifically the permit calls for the County to continue
their watershed restoration monitoring of the lower Paint Branch subwatershed and physical
monitoring ofthe Clarksburg Special Protection area In addition to the existing monitoring
network the County will continue tracking and data reporting associated with levels of
implementation (eg acres of impervious cover treated areas of buffer planted miles of
stream restored miles of streets swept) For measuring effectiveness of outreach and
stewardship efforts other types of monitoring and reporting are planned that include before
and after attitude surveys frequency of website visits and information requests
For many restoration strategies it may be difficult to tease out their individual effectiveness in
terms of pollutant load reductions but collectively the monitoring that occurs should provide
adequate insight into the overall effectiveness of a layered implementation strategy
In addition to the monitoring and assessment the County will be reporting results on an annual
basis as part of their NPDES MS4 Permit annual report The MS4 Permit requires annual
reporting of the following
021611
Montgomery County Coordinated Implementation Strategy - DRAFT
bull The status of implementing the components of the stormwater management program
that are established as permit conditions
bull A narrative summary describing the results and analyses of data including monitoring
data that is accumulated throughout the reporting year
bull Expenditures for the reporting period and the proposed budget for the upcoming year
bull A summary describing the number and nature of enforcement actions inspections and
public education programs
bull The identification of water quality improvements and documentation of progress
toward meeting applicable WLAs developed under EPA approved TMDLs and
bull The identification of any proposed changes to the Countys program when WLAs are not
being met
The County will build upon annual reporting that has historically occurred to meet permit
requirements and will supplement this reporting with tracking table summaries that quantify
implementation activities for the range of strategies pursued during that year and the
associated treatment (eg impervious cover treated pollutant load reduced education and
outreach partners established etc) Cost will also be tracked in association with rates of
implementation This level of performance will then be compared with countywide strategy
targets (eg progress towards meeting WLAs) associated with key performance dates such as
those presented in Table 41 The level of progress achieved by the County will then feed into
the adaptive management approach described above
Organization Needs to Implement Strategy
Montgomery County DEP staff possesses substantial expertise and institutional knowledge that
yields many positive outcomes and efficient processes under the current pace of restoration
and permit compliance activities Under this strategy however the pace of implementation is
required to significantly increase Based on an increase in the level of implementation it is
reasonable to assume that additional capacity may be needed to provide sufficient oversight
and management of all the projects
Another critical element of this strategy is the recognition and commitment to pursuing
outreach initiatives that build community capacity by targeting new partner groups that
provide the necessary leadership oversight and sustained effort to change behaviors and
foster stewardship The County currently carries out many well established and managed
outreach programs but it may require additional focus across County agencies and
departments for these partnerships to become established and thrive
021611 G
Montgomery County Coordinated Implementation Strategy - DRAFT
Through the implementation process and the monitoring and reporting that is required large
amounts of data will be generated Technological advances happen so rapidly in this day and
age it will be important for the County to stay current with technology and methods so that
more efficient and cost-effective data management and reporting will be possible The County
currently relies on a detailed and sophisticated GIS to spatially locate projects and manage
tables of data related to projects The growth and development of this spatial database will be
a critical component of the reporting and tracking capability of the County These databases
generate the input data that are used to measure progress towards baseline loading targets
Regular review and upkeep of the data as well as routine summarization of progress (annually
at a minimum) will likely require additional dedication of staff This is especially the case during
periods where the implementation rate of structural practices in the ground is accelerated
021611
Montgomery County Coordinated Implementation Strategy - DRAFT
Appendix C - Restoration Potential by Watershed
021611
c-
04 03 02 01
a
_ Nitrogen Load Reduction
--shy TMDL WLA Target
_Cost
MONTGOMERY COUNTY URBAN WATERSHEDS POLLUTANTS _Bk)~Ibilats ~1~ l~ fjfsi --
Rank
1
2
3
4
5
6
7
8
9
10
11
Restoration Strategy TN reduction
Ibsyr
Pet Waste Education 15169
Retrofit of Underperforming BMPs 1769
Stream Restoration 72423
Completed Projects ~43 High Priority Projects 3260
Other Potential Projects 43276
Habitat Restoration 224
Public Property ESD Retrofits 18270
Priority Neighborhoods ESD Retrofits 9271
Private Non-residential ESD Retrofits 5594
Street Sweeping -
Incremental Cost Unit Cost
Million $ IbsMillion $ 088 17193
120 1475
9304 778
948 701
635 513
25430 170
141 158
23655 77
13278 70
8018 70
124 -
Qj c
Qj
nI CXI
o -f-
1 09 08 07 06 05
$900 $800 $700
~ $600 c $500 ~ $400 $300 0 u $200 $100
$shy
~~mf il_~IJrt~
MONTGOMERY COUNTY URBAN WATERSHEDS POLLUTANTS ItfiQ14lbilJts i~5 [i
1 $900 Qj
09 $8005 iii en 08 $700
~co 07 $600 co - til
06 $500 ~ 05- $400 ~ 04 en$300 003 u $20002
en $100I 01 o 0 $shys Q en o
s Q
Phosphorus Load Reduction
--- TMDL WLA Target
__Cost
I Rank I
1
2
3
4
5
6
7
8
9
Restoration Strategy
Pet Waste Education
Retrofit of Underperforming BMPs
Stream Restoration
Completed Projects
High Priority Projects
Habitat Restoration
Other Potential Projects
Public Property ESD Retrofits
Priority Neighborhoods ESD Retrofits
10 I Private Non-residential ESD Retrofits
11 Street Sweeping
TP reduction Incremental Cost Unit Cost
Ibsyr Million $ IbsMillion $ 1979 088 2243
247 120 206
13097 9304 141
915 948 96
451 635 71
37 141 26
6067 25430 24
2546 23655 11
1294 13278 10
781 8018 10
- 124 -
MONTGOMERY COUNTY URBAN WATERSHEDS POLLUTANTS IItQjQhabillt$middot
Cii 5 Cii 11 It CD
6 ~ r o ~ s
0 ltIIa r ltII e c ltII III
1 09 08 07 06 05 04 03 02 01
0
$900
$800 $700
v$600 r
0 $500 == $400 $300 11
0 u $200 $100
$shy
_ Sediment load Reduction
--- TMDl WlA Target
__Cost
Rank Restoration Strategy
Sediment reduction
Incremental Cost
Unit Cost
tonsyr Million $ tonsMillion $ 1 Street Sweeping 800 124 645
2 Stream Restoration 25057 9304 269
3 Retrofit of Underperforming BMPs 25 120 21
4 Completed Projects 97 948 10
5 High Priority Projects 47 635 7
6 Other Potential Projects 660 25430 3
7 I Public Property ESD Retrofits 272 23655 1
8 Priority Neighborhoods ESD Retrofits 139 13278 1
9 Private Non-residential ESD Retrofits 84 8018 1
10 Habitat Restoration 2 141 1
11 Pet Waste Education - 088 -
C-3
MONTGOMERY COUNTY URBAN WATERSHEDS POLLUTANTS
-QI5 5i ~
1 09 08 07 06 05 04 03 02 01
0
$900
$800
$700
$600 ~ 0
$500 == $400 $300 11
0 u $200
$100
$shy
--shy TMDL WLA Target
___ Cost
Rank Restoration Strategy
Enterrococci reduction
Incremental Cost
Unit Cost
Billion MPNyr Million $ Billion MPN Million $
1 Pet Waste Education 19643 088 22263
2 Retrofit of Underperforming BMPs 2781 120 2318
3 Completed Projects 10441 948 1101
4 High Priority Projects 5120 635 806
5 Other Potential Projects 69895 25430 275
6 Riparian Reforestation 310 141 219
7 Public Property ESD Retrofits 29025 23655 123
8 Priority Neighborhoods ESD Retrofits 14777 13278 111
9 Private Non-residential ESD Retrofits 8917 8018 111
10 Stream Restoration - 9304 -
11 Street Sweeping - 124 I -
~ I~~~i MONTGOMERY COUNTY URBAN WATERSHEDS POLLUTANTS 1tI2~mL ~ I~I
~$ I -~-- I
100 90 80 70 60 50 40 30 20 10
0
$900 $800 $700 $600 $500 $400 $300 $200 $100 $shy
vi c
~ 5 11 0 u
Implementation Phase
Potential Trash Incremental Unit Cost
I
Rank Restoration Strategy Reduction Cost
Ibsyear Million $ IbsMillion $ 1 Recycling Education and Investigations 51654 02 238837
2 Plastic Bag Ban and Misc Enforcement 63546 13 48882
3 Anti-litter Campaign Education 23J61 09 26930
4 Retrofit of Underperforming BMPs 1144 12 954
5 Completed Projects 6598 95 696
6 High Priority Projects 2786 64 439
7 Other Potential Projects 56341 2543 222
8 Habitat Restoration 266 14 188
9 Street Sweeping 204 12 164
10 Public Property ESD Retrofits 25348 2366 107
11 Priority lIeighborhoods ESD Retrofits 12529 1328 94
12 Private Non-residential ESD Retrofits 7547 802 94 ru Stream Restoration - 930 -14 Pet Waste Education - 09 -
C-5
MONTGOMERY COUNTY URBAN WATERSHEDS POLLUTANTS
CABIN JOHN
1 250
__CostImplementation Phase
09 08 07 06 05 04 03 02 01
0
200 ~ c
150 g E
100 - ltII 0 u
50
0
_E Coli
- - - Waste Load Allocation
Rank Restoration Strategy
E coli reduction
Incremental Cost
Unit Cost
Billion
MPNyr Million $
Billion MPN
Million $ 1 Pet Waste Education 4388 $05 9436
2 Underperforming BMP Retrofits 1892 $19 1022
3 High Priority Projects 1289 $16 800
4 Riparian Reforestation 1133 $78 146
5 Other Potential Projects 148 $17 86
6 Public Property ESD Retrofits 4AOO $860 Sl 7 Private Non-residential ESD Retrofits 1618 $392 41
8 Priority Neighborhoods ESD Retrofits 2633 $638 41
9 Completed Projects 112 $00 0
C-6
MONTGOMERY COUNTY URBAN WATERSHEDS POLLUTANTS 1Itf~~Jabitm
ROCK CREEK
1 $700 Qj5 09
o
_
$600 Qj 08
111 $500 ~ampl 07 c
t5 06 $400 ~ e 05 ~ $3005 04 - 111tl 03 $200 0 u-6 02
$100J 01 $-
Enterrococci
- - - Waste load Allocation Implementation Phase
__Cost
Rank Restoration Strategy
Enterrococci reduction
Incremental Cost
Unit Cost
Billion MPNyr Million $ Billion MPN Million $
Et Pet Waste Management 35734 118 30190
Underperforming BMP Upgrades
Other Potential Projects
28800
30239
577
1083
4995
2792
4 Completed Projects 12131 444 2734
5 High Priority Projects 14239 890 1600
6 Riparian Reforestation 18999 2384 797
7 County Property ESD Retrofits 54519 24136 226
8 Private Residential ESD Retrofits 35230 17737 199
9 Private Non-residential ESD Retrofits 32A86 16380 198
C-7
MONTGOMERY COUNTY URBAN WATERSHEDS POLLUTANTS _f~~pabitafS (fi~r ~~ l-middotshy
ROCK CREEK
100 $900 90 $800 80 $700 u70 $600 c 60 2$50050 -~$40040
lt1$300 030 $200 u
20 10 $100
0 $shy
Implementation Phase
Rank Restoration Strategy Trash Reduction
Incremental Cost
Unit Cost I
Ibsyear Million $ IbsMillion $ 1 Other Potential Projects 16038 1085 1478
2 Underperforming BMP Upgrades 6756 577 1172
3 Completed Projects 4217 444 950
4 High Priority Projects 6366 890 715
5 Riparian Reforestation 9237 2384 387
6 Public Property ESD Retrofits 24587 24136 102
7 Priority Neighborhoods ESD Retrofits 16155 17737 91
8 Private Non-residential ESD Retrofits 14793 16380 90
9 Pet Waste Education - 118 -
(-8
MONTGOMERY COUNTY RURAL WATERSHEDS POLLUTANTS
SENECA - CLOPPER LAKE -
100 Qi
90 iii 80VI to -CQ 70 0 60e 50I 0 40 u l 30
C QJ 20ex
C 10to 0
J 0
$18
$16
$14 n
$12 I
$10 sect $08 ~ $06 0
VI
U $04
$02
$shy
_TPRemoval - - - TMDL Reduction Target
Implementation Phase ___Cost
Rank Restoration Strategy TP
Reduction (Ibsyr)
Incremental Cost (Million $)
Unit Cost (IbsvrMillion $)
1 Residential Education 33 001 6246
2 Underperforming BMP Retrofits 13 004 341 3 Riparian Buffer Reforestation 19 023 99 4 Priority Neighborhood ESD Retrofits 15 051 35 5 Public Property ESD Retrofits 7 075 99
C-9
-pj[fti
MONTGOMERY COUNTY URBAN WATERSHEDS POLLUTANTS 1It[~~JIlbitIL f bull~
LOWER MONOCACY
1 09 08 07 06 05 04 03 02 01
0
Implementation Phase
25
20 ~ c
15 ~ ~
10 - 0 u
5
0
_TSS
- - - Waste load Allocation _Cost
Rank Restoration Strategy
Sediment reduction
Incremental
Cost Unit Cost
tonsyear Million $ tonMilli
1 Street Sweeping 22 $007 3121
2 Underperforming BMP Retrofits 4 $010 389
3 Stream Restoration 37 $734 51
4 Riparian Buffer Reforestation 3 $109 25
5 Other Structural BMPs and ESD Strategies 10 $851 12
6 Priority Neighborhoods ESD Retrofits 2 $160 10
7 Non-residential ESD Retrofits 1 $132 10
C-10
MONTGOMERY COUNTY RURAL WATERSHEDS POLLUTANTS 1tlj~lIbiIalSlt~~II
1 09 08 07 06 05 04 03 02 01
0
$70
$60
$50 ~ c
$40 ~ ~ $30 - UI
$20 0 v
$10
$0
_ Phosphorus Load Reduction
- - - Waste Load Allocation ___ CostImplementation Phase
Rank Restoration Strategy TP Incremental Cost
Million $ Unit Cost
Ibsyr Ibs Million $ 1 Lawn Care Education 3670 01 37394
2 Underperforming BMP Retrofits 3499 08 4338
3 Other Potential Projects 3524 33 1076
4 High Priority Projects 252 04 685
5 Riparian Reforestation 762 26 298
6 Public Property Retrofits 5854 345 169
7 Priority Neighborhoods ESD Retrofits 796 65 123
8 Private Non-residential ESD Retrofits 1941 168 116
9 Completed Projects 53 00 00
c- 11
MONTGOMERY COUNTY RURAL WATERSHEDS POLLUTANTSal12hdJilats ~I~ ~ [ -
1 10 ii 5 09 9 1 08 8 II al- 07 7 1ii o 06 6
c
~ ~ 1 o E IV
05 04 03
5 4
3
~ 11 0 u
0 11 02 2 J o 01 1
t a 0 0 11 o
t 0
_ Phosphorus Reduction
- - - Waste Load Allocation
-Cost
Rank Restoration Strategy TP Incremental Cost
Million $ Unit Cost
Ibsyr Ibs Million $ 1 Lawn Care Education 3670 01 37394
2 Underperforming BMP Retrofits 3499 08 4338
3 Other Potential Projects 3524 33 1076
4 High Priority Projects 252 04 685
5 Riparian Reforestation 762 26 298
6 Public Property Retrofits 5854 345 169
7 Priority Neighborhoods ESD Retrofits 796 65 123
8 Private Non-residential ESD Retrofits 1941 168 116
9 Completed Projects 53 00 00
C-12
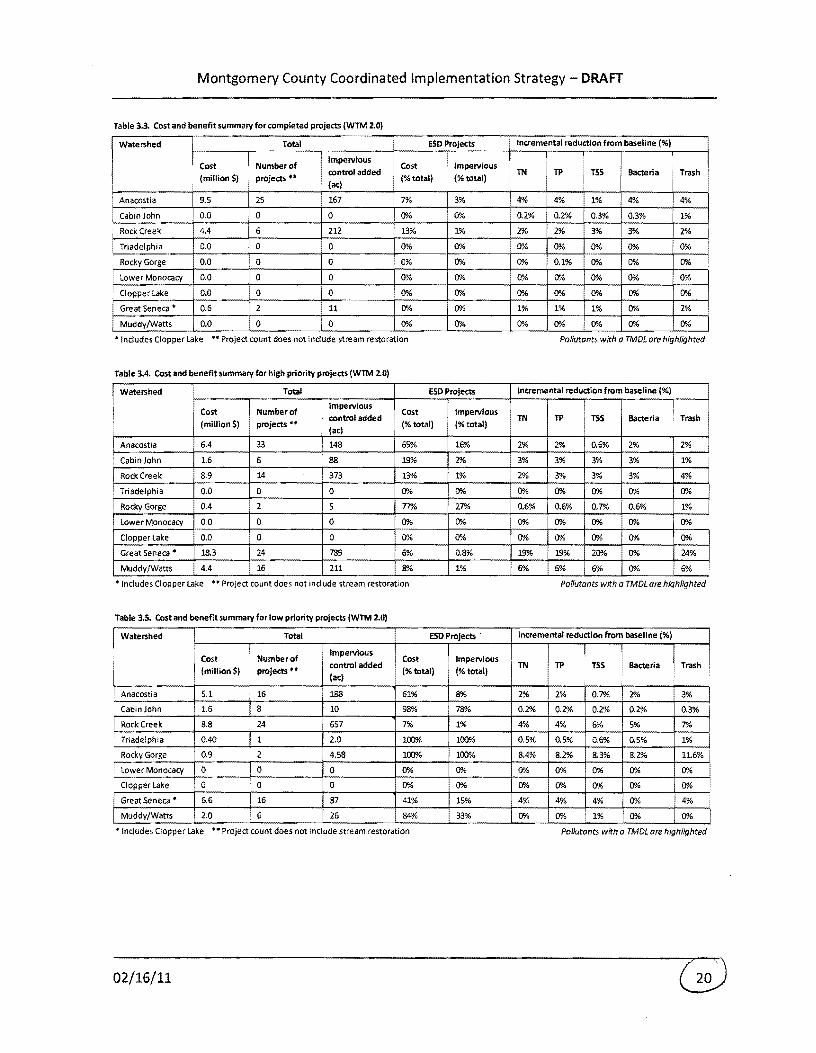
Montgomery County Coordinated Implementation Strategy - DRAFT
Table 36 Cost and benefit summary for other potential projects (WTM 20)
I Watershed Total ESO Projects Incremental reduction from baseline ()
ICost Impervious I Cost
I I Trash INumber of
control added Impervious
TN TP TSS Bacteria (million $) projects bullbull
(ac) (total) (total)
i i
Anacostia 2492 497 2222 73 62 23 8 26 301
Cabin John 00840 1 5 0 010 01 01 01 01 01
Rock Creek 20 4 201 0 0 12 12 19 15 21
Triadelphia 00 0 0 010 0 00 00 00 00 00
Rocky Gorge 20 2 0 010 0 00 00 00 00 00
lower Monocacy 00 0 0 0( 0 00 00 00 00 0010
Clopper Lake 00 0 0 0 0 00 00 00 00 0010
Great Seneca bull 02 S S3 0 0 23 23 27 00 27
MuddyWatts 00 0 0 0 0( 00 00 00 00 0010
bull Includes Clopper Lake bullbull Project count does not include stream restoration Pollutants with a TMDL are highlighted
Table 37 Cost and benefit summary for ESO projects (WTM 30)
Watershed
I
Cost (million $) Impervious
control added
(ac)
Incremental reduction from baseline ()
ESDfor i ESO for private
public
property property
TN TP TSS Bacteria Trash
Anacostia 2378 21296 1813 20 21 7 22 27
Cabin John 878 10307 876 22 23 25 24 28
Rock Creek 2471 341 2427 30 30 33 32 35
Triadelphia 41 47 36 10 1010 11 11 20
Rocky Gorge 312 19 28S 26 27 32 30 46
lower Monocacy 86 29 53 14 15 15 15 010
Clopper lake 08 051 21 14 14 15 0 14
Great Seneca bull 00 0 0 010 0 0( 0( 010
MuddyWatts 00 a 0 0 01 010 0 0
bull Includes Clopper lake Pollutants with a TMDL are highlighted
Table 3B Cost and benefit summary for riparian reforestation (WTM 40)
IWatershed Cost (million $) Impervious
Incremental reduction from baseline ()
control added Habitat restoration (ac) TN TP TSS Bacteria Trash
Anacostia 1 6 0 0 0 01 02
Cabin John 777 39 1 2 lili
3
Rock Creek 24 119 2 2 2 5
Triadelphia 010 1 01 02 01 04 03
Rocky Gorge 25 12 1 2 2 3 8
lower Monocacy 11 S 3 3 3 4 0
Clopper Lake 023 2 4 4 2 010 4
Great Seneca bull 0 a 010 010 0 010 0
MuddyWatts 0 0 010 0 0 0 0
bull Includes Clopper lake Pallutonts with a TMDL are highlighted
021611
Montgomery County Coordinated Implementation Strategy - DRAFT
Table 57 Cost and benefit summary for stream restoration (WTM 40)
Watershed Stream Restoration Incremental reduction from baseline ()
Number of Impervious control
Cost (million $) added(ac) TN TP TSS Bacteria Trash projects
Anacostia 937 200 0 42 56 326 0 0
Cabinlohn 162 15 0 17 9 80 0 0
Rock Creek 201 30 a 9 710 100 0 0
Triadelphia 00 0 0 0 0 0 010 0
Rocky Gorge 191 18 I 0 10 7 36 0 O lower Monocacy 73 nla 0 7 10 32 010 0
Clopper Lake 00 a 0 0 0 0 0 0
Great Seneca It I 259 33 0 19 8 16 0 0
MuddyWatts 242 45 0 16 7 13 0 0
Includes Clopper Lake Pollutants with a TMDL are highlighted
Table 58 Cost and benefit summary for M54programmatlc practices (WTM 50)
Watershed Cost (million $) Incremental reduction from baseline ()
Programmatic
practices - M54
Impervious control
added (ac) TN TP TSS Bacteria Trash
Anacostia 36 0 9 9 10 8 82
Cabin John 047 0 15 14 0 10 0
Rockereek 12 0 11 11 0 7 0
Triadelphia 00056 a 23 3 0 0 0
Rocky Gorge 009 0 38 8 03 5 2
lower Monocacy 007 0 0 0 19 0 0
Clopper Lake 0Q1 0 61 30
~=r 0
Great Seneca 10 0 0 0 0 0Y0 0 0
MuddyWatts 0 0 0 0 0 0 0
bull Includes Clopper Lake Pollutants with a TMDL are highlighted
021611
Montgomery County Coordinated Implementation Strategy - DRAFT
4 COORDINATED IMPLEMENTATION STRATEGY
The Strategy has multiple objectives to accomplish whereby a challenging balance between
strategies and timeframe is required There isnt necessarily a correct answer in the process
but rather an optimized result that addresses an agreed upon suite of priorities The Strategy
presented here was primarily driven by known and established regulatory timeframes and
compliance endpoints Meeting these endpoints using the more cost effective approaches was
also given priority After this consideration was given to other known and important
approaches that stakeholders and the County have an interest in pursuing Specifically the
following compliance dates and objectives were conSidered in developing the Strategy over the
long-term (Table 41)
Table 41 Compliance Targets for Countywide Coordinated Implementation Strategy
Target Date
2015
2017
2020
Compliance Target
Meeting 20 impervious cover treatment requirement
within the MS4 Permit cycle
Meet the interim dates and targets for the Chesapeake
Bay TMDL which include specific regulated urban area
reductions by 2017 for nutrients and sediment (based
on Maryland Department of the Environments
Watershed Implementation Plan)
Meet the full compliance and targets for the
Chesapeake BayTIVIDL which include specific regulated
urban area reduction by 2020 for nutrients and
sediment (based on Maryland Department of the
Environments Watershed Implementation Plan)
Metric
~4300 acres of
Impervious Cover
9 12 and 20
respectively for TN TP
and TSS reductions
from baseline
conditions
18 34 and 37
respectively for TN TP
and TSS reductions
from baseline
conditions
2025
2030
Meet additional impervious cover treatment targets
associated with next MS4 Permit cycle (assumes
another 20 target)
Meet additional impervious cover treatment targets
associated with next MS4 Permit cycle (assumes
another 20 target)
Out year compliance with other watershed TMDLs
~3400 acres of
Impervious Cover (20
of impervious
remaining after 2015)
~2750 acres of
Impervious Cover (20
of impervious
remaining after 2020)
100 compliance with
MS4 Permit Area WLAs
021611
Montgomery County Coordinated Implementation Strategy - DRAFT
To meet the compliance targets outlined in Table 41 the following priorities were generally
followed
bull 100 implementation of completed high and low priority County projects in first five
years (by 2015)
bull Greater ESD focus in urban (as opposed to suburban and rural) watersheds initially Goal
for ESD in these watersheds on pUblic property in first five years is 10 and on private
property is 10 The level of implementation was largely driven by the 20 Countywide
impervious goal
bull 100 of Public Outreach Potential for all TIVIDl watersheds in first five years This was
pursued to address trash nutrient and bacteria loading which rely strongly on effective
outreach programs to modify behaviors
bull Generally limited strategies to the top four most cost effective per watershed
bull Habitat restoration (stream restoration and buffer reforestation) not pursued as priority
until after first five year period These programs emphasize greater pollutant reduction
efficiency rather than impervious cover treatment which is the primary focus for the
first permit cycle
The Strategy was informed by the individual watershed implementation plans for seven
watersheds which included the Clopper lake and Patuxent subwatersheds Therefore in order
to develop countywide estimates for pollutant load reduction (as is required by the Chesapeake
Bay TMDl) watershed area weighting was applied The process for developing the Countywide
strategy and individual watershed implementation plans was woven together Once the
restoration potential was determined from the individual plans the strategy and schedule was
compiled using the restoration potentials and the drivers listed above The final restoration
cost and schedule was then placed in the implementation plans
It is also worth noting that the high and low priority projects along with the other potential
projects strategies represent a static or fixed number of projects that have been identified by
the County For this analysiS this list of practices is not replenished and therefore once all
opportunities have been implemented other strategies are pursued In reality the County will
continue to develop and update its list of specific project opportunities and have these
available for implementation in future years
The output from this effort is presented in a series of tables ordered by target date in Appendix
D In addition Table 42 provides an overall summary of pollutant load reduction tracking
versus time Through inspection of Table 42 it can be seen that the Strategy meets the
021611
Montgomery County Coordinated Implementation Strategy - DRAFT
impervious cover treatment targets under the current MS4 permit (as well as projected targets
for 2020 and 2025 assuming a continued 20 treatment requirement) interim and final
Chesapeake Bay nutrient and sediment reduction targets by 2017 and 2020 respectively and
out year MS4 permit area WLA compliance for the majority of pollutants Exceptions include
meeting the bacteria WLA load reductions required for the Anacostia and Rock Creek
021611
Montgomery County Coordinated Implementation Strategy - DRAFT
Table 42 Projection by Phase for Watersheds and Pollutants PermitTMDL Targets
Watershed Fiscal Year 2015 2017 2020 2025 2030 2017 2020
Impervious Treated (acres) 1421 2393 3364 4272 4544
ESD ( Impervious) 26 44 61 69A 71
Cost (Million $) 160 307 486 732 820
E5D( Cost) 45 62 71 78 78
Anacostia Nitrogen 25 39 68 89A l00A 818 82
Phosphorus 27 42 77 100 100 812 81
i Sediment 47 72 100 l00A) l00A 875 88
Bacteria 21 33 46 59A 64 879 88
Trash 41 65 89 l00A) 100
Impervious Treated (acres) 1541 1961 2381 3625 3989
ESD ( Impervious) 17 28 36 57A 61
Cost (Million $) 87 172 262 566 658
ESD ( Cost) 7(JA 79 79A 89A 9(JA
Rock Creek Nitrogen 24 30 38 55 61
Phosphorus 25 3(JA 38 54 GfJA)
Sediment 38 50 92 l00A 100
Bacteria 21 27 33 5(JA 55 96(JA 96
Trash 17 24 31 5(JA) 55
Impervious Treated (acres) 187 380 570 1018 1018
ESD ( Impervious) 52 72 78 87A 87A
Cost (Million $) 23 65 114 215 219
ESD ( Cost) 92 91 86 90 88
Cabin John Nitrogen 21 27A 39A 55 58 Phosphorus 2(JA 26 35 49 51
Sediment 6 17 GfJA 91 100
Bacteria 16 22 27 4(JA) 40 31 31
Trash 6 12 19 34 34
Impervious Treated (acres) 237 237 237 237 237
ESD ( Impervious) 4 4 4 4 4
Cost (Million $) 6 8 19 25 31
ESD ( Cost) 32 27A 11 8 7
Muddy Watts Nitrogen 6 7 15 18 22
Phosphorus 6 7 10 12 13 Sediment 7 8 14 17 2(JA
Bacteria 0 (JA 0 (JA 0 i Trash 6 6 6 6 6
bull Impervious Treated (acres) 901 921 941 941 941 ESD ( Impervious) 2 2 2 2 2
Cost (Million $) 26 48 SO 51 52 ESD ( Cost) 15 8 8 8 8
Great Seneca Nitrogen 24 41 43 44 45
Phosphorus 24 32 34 34 34
i Sediment 26 41 43 44 44
I Bacteria (JA) 0 0 0 (JA
Trash 31 32 33 33 33
021611
Montgomery County Coordinated Implementation Strategy - DRAFT
Pe rmitTMDL Targets
Watershed Fiscal Year 2015 2017 2020 2025 2030 2017 2020
Clopper
Impervious Treated (acres) 0 6 12 22 22
ESD ( Impervious) 0 86 86 92 92
Cost (Million $) 0 0 1 2 2
ESD ( Cost) 0 72 73 84 84
Nitrogen 61 67 72 79 79
Phosphorus 30 36 41 48 48 45 45
Sediment 0 5 10 17 17
Bacteria 0 0 0 0 0
Trash 0 6 11 18 18
Lower Monocacy
Impervious Treated (acres) 1 16 32 58 58
ESD ( Impervious) 100 85 84 91 91
Cost (Million $) 0 4 11 18 20
ESD ( Cost) 100 85 54 63 58
Nitrogen 0 5 14 22 24
Phosphorus 0 5 16 26 28
Sediment 0 5 46 61 69 608 61
Bacteria 0 6 12 19 19
Trash 0 0 0 0 0
Rocky Gorge
Impervious Treated (acres) 11 88 165 307 307
ESD ( Impervious) 64 89 90 95 95
Cost (Million $) 3 17 40 70 75
ESD ( Cost) 55 82 64 73 68
Nitrogen 47 55 6710 82 85
Phosphorus 17 25 36 52 53 15 15
Sediment 10 19 45 7(J1o 79
Bacteria 14 23 32 47 47
Trash 15 30 46 68 68
Triadelphia
Impervious Treated (acres) 3 12 20 38 38
ESD ( Impervious) 100 98 97 99 99
Cost (Million $) 1 3 5 9 9
ESD ( Cost) 99 98 98 99 99
Nitrogen 24 27 29 34 34
Phosphorus 4 7 9 14 14 15 15
Sediment 1 4 6 12 12
Bacteria 1 4 6 12 12
Trash 2 6 11 21 21
Countywide
Impervious Treated (acres) 4302 6014 7722 10518 11154 6008 7723
ESD ( Impervious) 18 34 47 6(J1o 63
Cost (Million $) 305 622 987 1687 1884
ESD ( Cost) 53 66 7(J1o 8(J1o 80
Nitrogen 18 25 36 46 51 9 2(J1o
Phosphorus 17 23 34 44 46 12 34
Sediment 23 34 54 6(J1o 62 20 37
Bacteria 11 15 20 28 30
Trash 18 26 33 41 42
Assumptio~s
1 Does no~ includerepeated Outreach and Education costs beyond FY2015
2 Does not include ~n inflation multiplier
021611
Montgomery County Coordinated Implementation Strategy - DRAFT
Summary of Individual Implementation Plans
A summary of the general considerations and prioritization for each watershed implementation
plan is provided below
Anacostia - For the first permit cycle (through 2015) a priority was placed on full
implementation of completed high and low priority projects Next implementation of a third
of the other potential projects was targeted as a large number of these were identified in
conjunction with the USACEs Anacostia Watershed Restoration Plan efforts ESD was
emphasized on both public (10) and private property (10) Finally outreach (25) and
stream restoration (12) are targeted for pollutant load reduction but are not credited towards
impervious cover credit In future permit cycles the remainder of the other potential projects
are targeted along with ESD and a limited amount of riparian reforestation for impervious cover
and pollutant load reduction Outreach and stream restoration are significant strategies
pursued for load reduction benefits Nutrient and sediment MS4 permit area WLAs are met by
2030 but bacteria load reduction does not meet MS4 permit area WLA compliance The
remaining bacteria reduction is believed to be associated with urban wildlife sources Unless
intense urban wildlife management practices are implemented this remaining load reduction
will not be possible
Rock Creek- For the first permit cycle (through 2015) a priority was placed on full
implementation of complete high and low priority projects Next 25 implementation of
other potential projects was targeted ESD was emphasized on both public (10) and private
property (10) with private property implementation being linked to Rainscapes Program
success Finally outreach (100) and stream restoration (22) are targeted for pollutant load
reduction but are not credited towards impervious cover credit In future permit cycles the
remainder of the other potential projects are targeted along with ESD and riparian
reforestation for impervious cover and pollutant load reduction Stream restoration is a
significant strategy pursued for load reduction benefits The bacterial load reduction does not
meet MS4 permit area WLA compliance However the remaining bacterial load is believed to
be associated with urban wildlife sources Unless intense urban wildlife management practices
are implemented this remaining load reduction will not be possible
Cabin John Creek - Similar to the other two more urban watersheds in the County during the
first permit cycle (through 2015) a priority was placed on full implementation of complete high
and low priority projects Fewer opportunities exist overall compared to the Anacostia and Rock
Creek Next 25 implementation of other potential projects was targeted ESD was
emphasized on both public (10) and private property (10) Finally outreach (100) was
021611
Montgomery County Coordinated Implementation Strategy - DRAFT
targeted for pollutant load reduction but not credited towards impervious cover credit No
riparian reforestation or stream restoration was targeted due to limited or no opportunities In
future permit cycles the remainder of the other potential projects are targeted along with ESD
and some riparian reforestation for impervious cover and pollutant load reduction The
bacteria load reduction meets MS4 permit area WLA compliance by 2025
Muddy BranchWatts Branch - During the first permit cycle (through 2015) a priority was
placed on full implementation of complete high and low priority projects Fewer opportunities
exist overall compared to the Anacostia and Rock Creek Watersheds No other strategies were
pursued as there are no existing TMDLs in the Muddy BranchWatts Branch subwatersheds In
future permit cycles previously identified stream restoration projects are implemented for
pollutant load reduction
Great Seneca Creek - This watershed implementation plan is unique in that it includes the small
Clopper Lake subwatershed which has a TMDL for phosphorus Even with the TMDL there are
limited identified opportunities to pursue in the Clopper Lake subwatershed in part due to the
limited area of the subwatershed within the County MS4 permit area During the first permit
cycle (through 2015) a priority was placed on full implementation of complete high and low
priority projects within Great Seneca Creek subwatershed No opportunities exist for these
strategies in Clopper Lake However full outreach was applied in Clopper Lake in the first
permit cycle In future years other potential projects ESD on public and private property and a
small amount of riparian reforestation (in Clopper Lake) is pursued The Clopper Lake WLA for
phosphorus within the MS4 permit area is met
Patuxent - During the first permit cycle through 2015 a priority was placed on full
implementation of complete high and low priority projects Far fewer opportunities exist
overall compared to the Anacostia and Rock Creek A limited amount of ESD on private land
and stream restoration was pursued Finally outreach (100) was targeted for pollutant load
reduction (primarily nutrients) but not credited towards impervious cover credit No riparian
reforestation was targeted within the MS4 Permit area due to cost effectiveness in the Rocky
Gorge subwatershed and limited opportunities in the Triadelphia subwatershed In future
permit cycles ESD on private and public land is pursued more substantially as is stream
restoration A limited amount of riparian reforestation achieves some impervious cover and
pollutant load reduction The Rocky Gorge phosphorus WLA within the MS4 permit area is met
easily and the Tridelphia phosphorus WLA is also met but with a longer timeframe needed for
compliance
021611
Montgomery County Coordinated Implementation Strategy - DRAFT
Lower Monocacy Creek -lower Monocacy Creek is the most rural watershed in the County and
has the least amount of area subject to the County MS4 permit In addition there are no preshy
identified restoration projects within the watershed Therefore during the first permit cycle
(through 2015) only a very small amount (5) of private property ESD is pursued It is not until
the second permit cycle that more focus is placed on private and public ESD as well as stream
restoration and programmatic strategies such as street sweeping to target sediment loads
associated with the TM Dl In future permit cycles stream restoration is pursued for pollutant
load reduction The sediment WlA within the MS4 permit area is projected to be met around
2025
Countywide - The Countywide effort was driven by impervious cover treatment targets and
Chesapeake Bay TMDl2017 and 2020 reduction targets associated with sediment and nutrients
for urban MS4s For impervious cover it was assumed that a 20 target would be required for
each five-year permit cycle The Bay TMDl targets for urban MS4 areas were easily met for all
pollutants in 2017 and easily met for nitrogen and sediment but more difficult to meet for
phosphorus in 2020
Public Outreach and Stewardship
The County recognizes and is committed to the increasingly important role that public outreach
and stewardship will play if improved water quality conditions are going to be achieved
countywide While the County currently has a very active and layered outreach program the
model requires changes that will result in broader stakeholder groups serving as the leaders
and primary champions for clean water in their communities This includes greater participation
from minority and faith-based groups business consortiums schools neighborhood
associations and civic groups Additionally the new model requires revisiting current
initiatives carried out by the various County agencies to look for better and more efficient ways
to communicate messages cross-train and create synergies that result in greater engagement
greater awareness and sustained changes in behavior
Within each implementation plan specific suggestions for outreach and education
opportunities are identified In addition Appendix E of this Strategy contains practice sheets
which highlight targeted restoration activities for the County to develop and refine A total of
eight practices have been identified that can be adopted countywide or in more targeted
watershed areas where there are specific water quality issues to address Many of the
practices build upon existing County programs but require a much broader reach to new
partner groups Program start up costs are suggested and were used to for cost estimates
associated with Countywide strategy The highlighted practices include
021611
Montgomery County Coordinated Implementation Strategy - DRAFT
bull Pet Waste Pickup Education and Outreach Campaign
bull Lawn Stewardship Education and Outreach Campaign
bull Anti-littering Education and Outreach Campaign
bull Innovative Stormwater Management Awareness Campaign
bull Stream Stewards Education and Outreach Campaign
bull Riparian Reforestation Education and Outreach Campaign
bull Roof Runoff Reduction Education and Outreach Campaign
bull Parking Lot Recharge Value Education and Outreach Campaign
Start up costs by practice along with an overall five year cost estimate are provided in Table
43 Start up timeframes are assumed to be up to 18 months
Table 43 Outreach Start Up and 5-Year Cost Projections
Practice Practice Start Up Cost
Pet Waste Pickup $240500
Lawn Stewardship $301 600
Anti-Littering $175050
Stormwater Management Improvements Awareness $50450
Stream Stewards $74825
Riparian Reforestation $30575
Roof Runoff Reduction $101400
Parking Lot Recharge Value $41500
Estimated Start Up Total $744900
5-Year Outreach Budget Projection $2650000
These eight practice sheets provide specific costs and timelines for implementation They also
provide suggestions for measuring program success These practice sheets along with the
specific recommendations in the implementation plans make up the Public Outreach and
Education Campaign
Trash Reduction
Most of the implementation plans have to address trash loadings to meet requirements of the
Potomac Trash Treaty that is referenced in the County1s MS4 Permit In addition the Anacostia
Trash TMDL has recently been accepted by MDE and the EPA According to the Anacostia
021611
Montgomery County Coordinated Implementation Strategy - DRAFT
TMDl there is reasonable assurance that the goals of the Treaty and TMDl can be met with
proper watershed planning implementing pollution-reduction BMPs and using strong political
and financial mechanisms
Currently the County has a number of activities which target trash reduction They include the
following
bull Adopt-a-Road Program through DOT which focuses on public awareness and involvement in trash management There are 205 participants who adopted road segments and agreed to six major road cleanups per year
bull Storm Drain Marking through DOT bull Support for illegal dumping enforcement outreach and research and monitoring bull Partnership with DOT to conduct street sweeping covering about 2500 curb miles and
occurring once a year
bull Partnership with the Park Police to monitor illegal dumping which combined enforces 300-400 actions a year
bull Non-residential and residential recycling programs through Solid Waste Services (SWS) bull Transit stop trash management program at 600 bus stops countywide supported by DOT
Transit Services
In addition to continuing these efforts a number of trash good-housekeeping efforts have been
proposed as part of this Strategy A detailed description of the quantitative methods and
strategies applied can be found in Appendix E of the Guidance Document In general the
following six trash-reduction strategies are recommended
1 Significantly increase funding for trash reduction programs 2 Create and enhance regional partnerships and coordination among businesses
environmental groups individual citizens and government at all levels and in all jurisdictions
3 Improve peoples awareness knowledge and behavior relating to littering and illegal dumping
4 Promote the greater introduction and use of effective trash-reduction technologies and approaches
5 Improve enactment and enforcement of laws to reduce trash 6 Increase trash monitoring-related data collection generation and dissemination efforts
The Anacostia watershed implementation plan provides an outline of the actions that will be
taken through the first permit cycle to reduce trash The range of programs and practices
specially aimed at reducing trash inputs to roads and streams that will be targeted include
reduce reuse and recycle campaigns littering and illegal dumping enforcement stream
cleanups and street sweeping These measures are in addition to any trash trapped and
021611
Montgomery County Coordinated Implementation Strategy - DRAFT
removed by structural practices which are computed using the WTM The plan shows that the
trash TMDl can be met by 2025 at a cost of 732 million dollars
Adaptive Management Monitoring and Reporting
Sound implementation strategies require assessment and effective adaptation to respond to
new information changing conditions new technologies and lessons learned This will be the
basis of the plan that will be used when benchmarks are not met and the projected funding is
inadequate
Adaptive management requires monitoring of a variety of measures that can be used to
determine whether progress is being made towards meeting the Countywide water quality
objectives Ultimately it is the instream water quality and the loading limits with respect to the
TMDls that determine the success of implementation however there are many interim
measures that can also be correlated to success which are worthwhile pursuing
Surface water monitoring can be an expensive and time consuming undertaking Montgomery
County is fortunate to have an extensive Countywide stream monitoring network that can serve
as a foundation for providing spatial and temporal data to indicate stream health The Countys
MS4 Permit also outlines the required assessment of controls which includes chemical
biological and physical monitoring Specifically the permit calls for the County to continue
their watershed restoration monitoring of the lower Paint Branch subwatershed and physical
monitoring ofthe Clarksburg Special Protection area In addition to the existing monitoring
network the County will continue tracking and data reporting associated with levels of
implementation (eg acres of impervious cover treated areas of buffer planted miles of
stream restored miles of streets swept) For measuring effectiveness of outreach and
stewardship efforts other types of monitoring and reporting are planned that include before
and after attitude surveys frequency of website visits and information requests
For many restoration strategies it may be difficult to tease out their individual effectiveness in
terms of pollutant load reductions but collectively the monitoring that occurs should provide
adequate insight into the overall effectiveness of a layered implementation strategy
In addition to the monitoring and assessment the County will be reporting results on an annual
basis as part of their NPDES MS4 Permit annual report The MS4 Permit requires annual
reporting of the following
021611
Montgomery County Coordinated Implementation Strategy - DRAFT
bull The status of implementing the components of the stormwater management program
that are established as permit conditions
bull A narrative summary describing the results and analyses of data including monitoring
data that is accumulated throughout the reporting year
bull Expenditures for the reporting period and the proposed budget for the upcoming year
bull A summary describing the number and nature of enforcement actions inspections and
public education programs
bull The identification of water quality improvements and documentation of progress
toward meeting applicable WLAs developed under EPA approved TMDLs and
bull The identification of any proposed changes to the Countys program when WLAs are not
being met
The County will build upon annual reporting that has historically occurred to meet permit
requirements and will supplement this reporting with tracking table summaries that quantify
implementation activities for the range of strategies pursued during that year and the
associated treatment (eg impervious cover treated pollutant load reduced education and
outreach partners established etc) Cost will also be tracked in association with rates of
implementation This level of performance will then be compared with countywide strategy
targets (eg progress towards meeting WLAs) associated with key performance dates such as
those presented in Table 41 The level of progress achieved by the County will then feed into
the adaptive management approach described above
Organization Needs to Implement Strategy
Montgomery County DEP staff possesses substantial expertise and institutional knowledge that
yields many positive outcomes and efficient processes under the current pace of restoration
and permit compliance activities Under this strategy however the pace of implementation is
required to significantly increase Based on an increase in the level of implementation it is
reasonable to assume that additional capacity may be needed to provide sufficient oversight
and management of all the projects
Another critical element of this strategy is the recognition and commitment to pursuing
outreach initiatives that build community capacity by targeting new partner groups that
provide the necessary leadership oversight and sustained effort to change behaviors and
foster stewardship The County currently carries out many well established and managed
outreach programs but it may require additional focus across County agencies and
departments for these partnerships to become established and thrive
021611 G
Montgomery County Coordinated Implementation Strategy - DRAFT
Through the implementation process and the monitoring and reporting that is required large
amounts of data will be generated Technological advances happen so rapidly in this day and
age it will be important for the County to stay current with technology and methods so that
more efficient and cost-effective data management and reporting will be possible The County
currently relies on a detailed and sophisticated GIS to spatially locate projects and manage
tables of data related to projects The growth and development of this spatial database will be
a critical component of the reporting and tracking capability of the County These databases
generate the input data that are used to measure progress towards baseline loading targets
Regular review and upkeep of the data as well as routine summarization of progress (annually
at a minimum) will likely require additional dedication of staff This is especially the case during
periods where the implementation rate of structural practices in the ground is accelerated
021611
Montgomery County Coordinated Implementation Strategy - DRAFT
Appendix C - Restoration Potential by Watershed
021611
c-
04 03 02 01
a
_ Nitrogen Load Reduction
--shy TMDL WLA Target
_Cost
MONTGOMERY COUNTY URBAN WATERSHEDS POLLUTANTS _Bk)~Ibilats ~1~ l~ fjfsi --
Rank
1
2
3
4
5
6
7
8
9
10
11
Restoration Strategy TN reduction
Ibsyr
Pet Waste Education 15169
Retrofit of Underperforming BMPs 1769
Stream Restoration 72423
Completed Projects ~43 High Priority Projects 3260
Other Potential Projects 43276
Habitat Restoration 224
Public Property ESD Retrofits 18270
Priority Neighborhoods ESD Retrofits 9271
Private Non-residential ESD Retrofits 5594
Street Sweeping -
Incremental Cost Unit Cost
Million $ IbsMillion $ 088 17193
120 1475
9304 778
948 701
635 513
25430 170
141 158
23655 77
13278 70
8018 70
124 -
Qj c
Qj
nI CXI
o -f-
1 09 08 07 06 05
$900 $800 $700
~ $600 c $500 ~ $400 $300 0 u $200 $100
$shy
~~mf il_~IJrt~
MONTGOMERY COUNTY URBAN WATERSHEDS POLLUTANTS ItfiQ14lbilJts i~5 [i
1 $900 Qj
09 $8005 iii en 08 $700
~co 07 $600 co - til
06 $500 ~ 05- $400 ~ 04 en$300 003 u $20002
en $100I 01 o 0 $shys Q en o
s Q
Phosphorus Load Reduction
--- TMDL WLA Target
__Cost
I Rank I
1
2
3
4
5
6
7
8
9
Restoration Strategy
Pet Waste Education
Retrofit of Underperforming BMPs
Stream Restoration
Completed Projects
High Priority Projects
Habitat Restoration
Other Potential Projects
Public Property ESD Retrofits
Priority Neighborhoods ESD Retrofits
10 I Private Non-residential ESD Retrofits
11 Street Sweeping
TP reduction Incremental Cost Unit Cost
Ibsyr Million $ IbsMillion $ 1979 088 2243
247 120 206
13097 9304 141
915 948 96
451 635 71
37 141 26
6067 25430 24
2546 23655 11
1294 13278 10
781 8018 10
- 124 -
MONTGOMERY COUNTY URBAN WATERSHEDS POLLUTANTS IItQjQhabillt$middot
Cii 5 Cii 11 It CD
6 ~ r o ~ s
0 ltIIa r ltII e c ltII III
1 09 08 07 06 05 04 03 02 01
0
$900
$800 $700
v$600 r
0 $500 == $400 $300 11
0 u $200 $100
$shy
_ Sediment load Reduction
--- TMDl WlA Target
__Cost
Rank Restoration Strategy
Sediment reduction
Incremental Cost
Unit Cost
tonsyr Million $ tonsMillion $ 1 Street Sweeping 800 124 645
2 Stream Restoration 25057 9304 269
3 Retrofit of Underperforming BMPs 25 120 21
4 Completed Projects 97 948 10
5 High Priority Projects 47 635 7
6 Other Potential Projects 660 25430 3
7 I Public Property ESD Retrofits 272 23655 1
8 Priority Neighborhoods ESD Retrofits 139 13278 1
9 Private Non-residential ESD Retrofits 84 8018 1
10 Habitat Restoration 2 141 1
11 Pet Waste Education - 088 -
C-3
MONTGOMERY COUNTY URBAN WATERSHEDS POLLUTANTS
-QI5 5i ~
1 09 08 07 06 05 04 03 02 01
0
$900
$800
$700
$600 ~ 0
$500 == $400 $300 11
0 u $200
$100
$shy
--shy TMDL WLA Target
___ Cost
Rank Restoration Strategy
Enterrococci reduction
Incremental Cost
Unit Cost
Billion MPNyr Million $ Billion MPN Million $
1 Pet Waste Education 19643 088 22263
2 Retrofit of Underperforming BMPs 2781 120 2318
3 Completed Projects 10441 948 1101
4 High Priority Projects 5120 635 806
5 Other Potential Projects 69895 25430 275
6 Riparian Reforestation 310 141 219
7 Public Property ESD Retrofits 29025 23655 123
8 Priority Neighborhoods ESD Retrofits 14777 13278 111
9 Private Non-residential ESD Retrofits 8917 8018 111
10 Stream Restoration - 9304 -
11 Street Sweeping - 124 I -
~ I~~~i MONTGOMERY COUNTY URBAN WATERSHEDS POLLUTANTS 1tI2~mL ~ I~I
~$ I -~-- I
100 90 80 70 60 50 40 30 20 10
0
$900 $800 $700 $600 $500 $400 $300 $200 $100 $shy
vi c
~ 5 11 0 u
Implementation Phase
Potential Trash Incremental Unit Cost
I
Rank Restoration Strategy Reduction Cost
Ibsyear Million $ IbsMillion $ 1 Recycling Education and Investigations 51654 02 238837
2 Plastic Bag Ban and Misc Enforcement 63546 13 48882
3 Anti-litter Campaign Education 23J61 09 26930
4 Retrofit of Underperforming BMPs 1144 12 954
5 Completed Projects 6598 95 696
6 High Priority Projects 2786 64 439
7 Other Potential Projects 56341 2543 222
8 Habitat Restoration 266 14 188
9 Street Sweeping 204 12 164
10 Public Property ESD Retrofits 25348 2366 107
11 Priority lIeighborhoods ESD Retrofits 12529 1328 94
12 Private Non-residential ESD Retrofits 7547 802 94 ru Stream Restoration - 930 -14 Pet Waste Education - 09 -
C-5
MONTGOMERY COUNTY URBAN WATERSHEDS POLLUTANTS
CABIN JOHN
1 250
__CostImplementation Phase
09 08 07 06 05 04 03 02 01
0
200 ~ c
150 g E
100 - ltII 0 u
50
0
_E Coli
- - - Waste Load Allocation
Rank Restoration Strategy
E coli reduction
Incremental Cost
Unit Cost
Billion
MPNyr Million $
Billion MPN
Million $ 1 Pet Waste Education 4388 $05 9436
2 Underperforming BMP Retrofits 1892 $19 1022
3 High Priority Projects 1289 $16 800
4 Riparian Reforestation 1133 $78 146
5 Other Potential Projects 148 $17 86
6 Public Property ESD Retrofits 4AOO $860 Sl 7 Private Non-residential ESD Retrofits 1618 $392 41
8 Priority Neighborhoods ESD Retrofits 2633 $638 41
9 Completed Projects 112 $00 0
C-6
MONTGOMERY COUNTY URBAN WATERSHEDS POLLUTANTS 1Itf~~Jabitm
ROCK CREEK
1 $700 Qj5 09
o
_
$600 Qj 08
111 $500 ~ampl 07 c
t5 06 $400 ~ e 05 ~ $3005 04 - 111tl 03 $200 0 u-6 02
$100J 01 $-
Enterrococci
- - - Waste load Allocation Implementation Phase
__Cost
Rank Restoration Strategy
Enterrococci reduction
Incremental Cost
Unit Cost
Billion MPNyr Million $ Billion MPN Million $
Et Pet Waste Management 35734 118 30190
Underperforming BMP Upgrades
Other Potential Projects
28800
30239
577
1083
4995
2792
4 Completed Projects 12131 444 2734
5 High Priority Projects 14239 890 1600
6 Riparian Reforestation 18999 2384 797
7 County Property ESD Retrofits 54519 24136 226
8 Private Residential ESD Retrofits 35230 17737 199
9 Private Non-residential ESD Retrofits 32A86 16380 198
C-7
MONTGOMERY COUNTY URBAN WATERSHEDS POLLUTANTS _f~~pabitafS (fi~r ~~ l-middotshy
ROCK CREEK
100 $900 90 $800 80 $700 u70 $600 c 60 2$50050 -~$40040
lt1$300 030 $200 u
20 10 $100
0 $shy
Implementation Phase
Rank Restoration Strategy Trash Reduction
Incremental Cost
Unit Cost I
Ibsyear Million $ IbsMillion $ 1 Other Potential Projects 16038 1085 1478
2 Underperforming BMP Upgrades 6756 577 1172
3 Completed Projects 4217 444 950
4 High Priority Projects 6366 890 715
5 Riparian Reforestation 9237 2384 387
6 Public Property ESD Retrofits 24587 24136 102
7 Priority Neighborhoods ESD Retrofits 16155 17737 91
8 Private Non-residential ESD Retrofits 14793 16380 90
9 Pet Waste Education - 118 -
(-8
MONTGOMERY COUNTY RURAL WATERSHEDS POLLUTANTS
SENECA - CLOPPER LAKE -
100 Qi
90 iii 80VI to -CQ 70 0 60e 50I 0 40 u l 30
C QJ 20ex
C 10to 0
J 0
$18
$16
$14 n
$12 I
$10 sect $08 ~ $06 0
VI
U $04
$02
$shy
_TPRemoval - - - TMDL Reduction Target
Implementation Phase ___Cost
Rank Restoration Strategy TP
Reduction (Ibsyr)
Incremental Cost (Million $)
Unit Cost (IbsvrMillion $)
1 Residential Education 33 001 6246
2 Underperforming BMP Retrofits 13 004 341 3 Riparian Buffer Reforestation 19 023 99 4 Priority Neighborhood ESD Retrofits 15 051 35 5 Public Property ESD Retrofits 7 075 99
C-9
-pj[fti
MONTGOMERY COUNTY URBAN WATERSHEDS POLLUTANTS 1It[~~JIlbitIL f bull~
LOWER MONOCACY
1 09 08 07 06 05 04 03 02 01
0
Implementation Phase
25
20 ~ c
15 ~ ~
10 - 0 u
5
0
_TSS
- - - Waste load Allocation _Cost
Rank Restoration Strategy
Sediment reduction
Incremental
Cost Unit Cost
tonsyear Million $ tonMilli
1 Street Sweeping 22 $007 3121
2 Underperforming BMP Retrofits 4 $010 389
3 Stream Restoration 37 $734 51
4 Riparian Buffer Reforestation 3 $109 25
5 Other Structural BMPs and ESD Strategies 10 $851 12
6 Priority Neighborhoods ESD Retrofits 2 $160 10
7 Non-residential ESD Retrofits 1 $132 10
C-10
MONTGOMERY COUNTY RURAL WATERSHEDS POLLUTANTS 1tlj~lIbiIalSlt~~II
1 09 08 07 06 05 04 03 02 01
0
$70
$60
$50 ~ c
$40 ~ ~ $30 - UI
$20 0 v
$10
$0
_ Phosphorus Load Reduction
- - - Waste Load Allocation ___ CostImplementation Phase
Rank Restoration Strategy TP Incremental Cost
Million $ Unit Cost
Ibsyr Ibs Million $ 1 Lawn Care Education 3670 01 37394
2 Underperforming BMP Retrofits 3499 08 4338
3 Other Potential Projects 3524 33 1076
4 High Priority Projects 252 04 685
5 Riparian Reforestation 762 26 298
6 Public Property Retrofits 5854 345 169
7 Priority Neighborhoods ESD Retrofits 796 65 123
8 Private Non-residential ESD Retrofits 1941 168 116
9 Completed Projects 53 00 00
c- 11
MONTGOMERY COUNTY RURAL WATERSHEDS POLLUTANTSal12hdJilats ~I~ ~ [ -
1 10 ii 5 09 9 1 08 8 II al- 07 7 1ii o 06 6
c
~ ~ 1 o E IV
05 04 03
5 4
3
~ 11 0 u
0 11 02 2 J o 01 1
t a 0 0 11 o
t 0
_ Phosphorus Reduction
- - - Waste Load Allocation
-Cost
Rank Restoration Strategy TP Incremental Cost
Million $ Unit Cost
Ibsyr Ibs Million $ 1 Lawn Care Education 3670 01 37394
2 Underperforming BMP Retrofits 3499 08 4338
3 Other Potential Projects 3524 33 1076
4 High Priority Projects 252 04 685
5 Riparian Reforestation 762 26 298
6 Public Property Retrofits 5854 345 169
7 Priority Neighborhoods ESD Retrofits 796 65 123
8 Private Non-residential ESD Retrofits 1941 168 116
9 Completed Projects 53 00 00
C-12
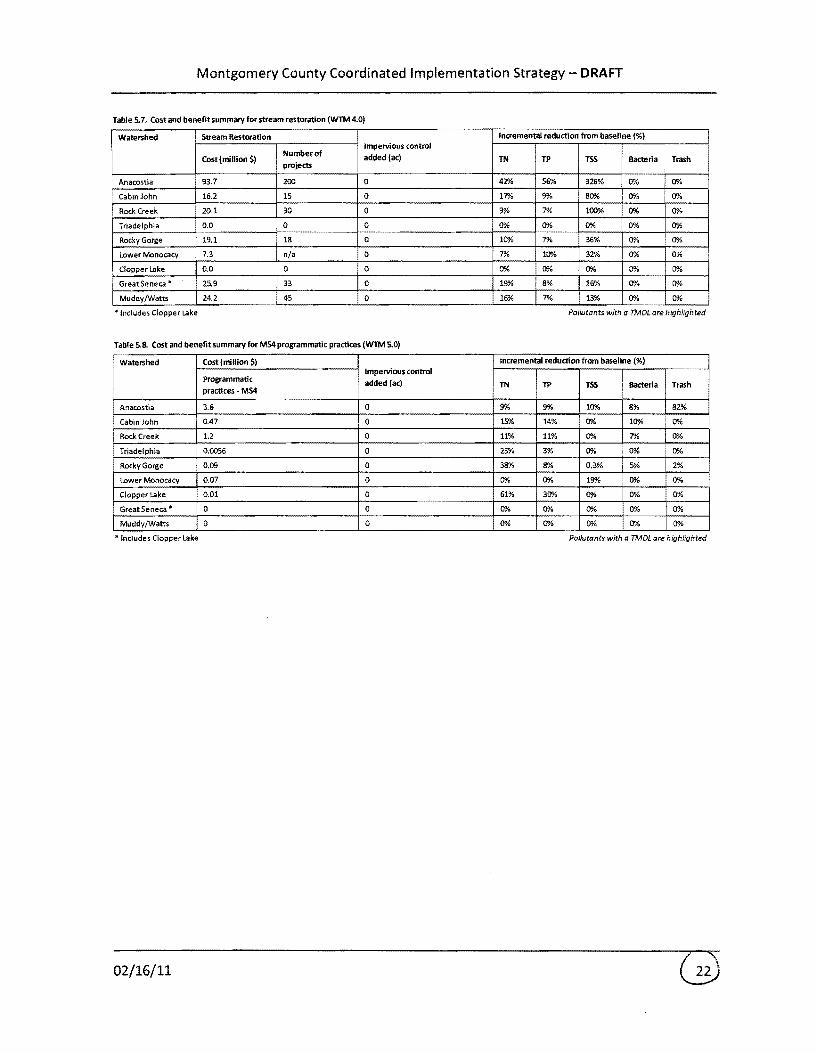
Montgomery County Coordinated Implementation Strategy - DRAFT
To meet the compliance targets outlined in Table 41 the following priorities were generally
followed
bull 100 implementation of completed high and low priority County projects in first five
years (by 2015)
bull Greater ESD focus in urban (as opposed to suburban and rural) watersheds initially Goal
for ESD in these watersheds on pUblic property in first five years is 10 and on private
property is 10 The level of implementation was largely driven by the 20 Countywide
impervious goal
bull 100 of Public Outreach Potential for all TIVIDl watersheds in first five years This was
pursued to address trash nutrient and bacteria loading which rely strongly on effective
outreach programs to modify behaviors
bull Generally limited strategies to the top four most cost effective per watershed
bull Habitat restoration (stream restoration and buffer reforestation) not pursued as priority
until after first five year period These programs emphasize greater pollutant reduction
efficiency rather than impervious cover treatment which is the primary focus for the
first permit cycle
The Strategy was informed by the individual watershed implementation plans for seven
watersheds which included the Clopper lake and Patuxent subwatersheds Therefore in order
to develop countywide estimates for pollutant load reduction (as is required by the Chesapeake
Bay TMDl) watershed area weighting was applied The process for developing the Countywide
strategy and individual watershed implementation plans was woven together Once the
restoration potential was determined from the individual plans the strategy and schedule was
compiled using the restoration potentials and the drivers listed above The final restoration
cost and schedule was then placed in the implementation plans
It is also worth noting that the high and low priority projects along with the other potential
projects strategies represent a static or fixed number of projects that have been identified by
the County For this analysiS this list of practices is not replenished and therefore once all
opportunities have been implemented other strategies are pursued In reality the County will
continue to develop and update its list of specific project opportunities and have these
available for implementation in future years
The output from this effort is presented in a series of tables ordered by target date in Appendix
D In addition Table 42 provides an overall summary of pollutant load reduction tracking
versus time Through inspection of Table 42 it can be seen that the Strategy meets the
021611
Montgomery County Coordinated Implementation Strategy - DRAFT
impervious cover treatment targets under the current MS4 permit (as well as projected targets
for 2020 and 2025 assuming a continued 20 treatment requirement) interim and final
Chesapeake Bay nutrient and sediment reduction targets by 2017 and 2020 respectively and
out year MS4 permit area WLA compliance for the majority of pollutants Exceptions include
meeting the bacteria WLA load reductions required for the Anacostia and Rock Creek
021611
Montgomery County Coordinated Implementation Strategy - DRAFT
Table 42 Projection by Phase for Watersheds and Pollutants PermitTMDL Targets
Watershed Fiscal Year 2015 2017 2020 2025 2030 2017 2020
Impervious Treated (acres) 1421 2393 3364 4272 4544
ESD ( Impervious) 26 44 61 69A 71
Cost (Million $) 160 307 486 732 820
E5D( Cost) 45 62 71 78 78
Anacostia Nitrogen 25 39 68 89A l00A 818 82
Phosphorus 27 42 77 100 100 812 81
i Sediment 47 72 100 l00A) l00A 875 88
Bacteria 21 33 46 59A 64 879 88
Trash 41 65 89 l00A) 100
Impervious Treated (acres) 1541 1961 2381 3625 3989
ESD ( Impervious) 17 28 36 57A 61
Cost (Million $) 87 172 262 566 658
ESD ( Cost) 7(JA 79 79A 89A 9(JA
Rock Creek Nitrogen 24 30 38 55 61
Phosphorus 25 3(JA 38 54 GfJA)
Sediment 38 50 92 l00A 100
Bacteria 21 27 33 5(JA 55 96(JA 96
Trash 17 24 31 5(JA) 55
Impervious Treated (acres) 187 380 570 1018 1018
ESD ( Impervious) 52 72 78 87A 87A
Cost (Million $) 23 65 114 215 219
ESD ( Cost) 92 91 86 90 88
Cabin John Nitrogen 21 27A 39A 55 58 Phosphorus 2(JA 26 35 49 51
Sediment 6 17 GfJA 91 100
Bacteria 16 22 27 4(JA) 40 31 31
Trash 6 12 19 34 34
Impervious Treated (acres) 237 237 237 237 237
ESD ( Impervious) 4 4 4 4 4
Cost (Million $) 6 8 19 25 31
ESD ( Cost) 32 27A 11 8 7
Muddy Watts Nitrogen 6 7 15 18 22
Phosphorus 6 7 10 12 13 Sediment 7 8 14 17 2(JA
Bacteria 0 (JA 0 (JA 0 i Trash 6 6 6 6 6
bull Impervious Treated (acres) 901 921 941 941 941 ESD ( Impervious) 2 2 2 2 2
Cost (Million $) 26 48 SO 51 52 ESD ( Cost) 15 8 8 8 8
Great Seneca Nitrogen 24 41 43 44 45
Phosphorus 24 32 34 34 34
i Sediment 26 41 43 44 44
I Bacteria (JA) 0 0 0 (JA
Trash 31 32 33 33 33
021611
Montgomery County Coordinated Implementation Strategy - DRAFT
Pe rmitTMDL Targets
Watershed Fiscal Year 2015 2017 2020 2025 2030 2017 2020
Clopper
Impervious Treated (acres) 0 6 12 22 22
ESD ( Impervious) 0 86 86 92 92
Cost (Million $) 0 0 1 2 2
ESD ( Cost) 0 72 73 84 84
Nitrogen 61 67 72 79 79
Phosphorus 30 36 41 48 48 45 45
Sediment 0 5 10 17 17
Bacteria 0 0 0 0 0
Trash 0 6 11 18 18
Lower Monocacy
Impervious Treated (acres) 1 16 32 58 58
ESD ( Impervious) 100 85 84 91 91
Cost (Million $) 0 4 11 18 20
ESD ( Cost) 100 85 54 63 58
Nitrogen 0 5 14 22 24
Phosphorus 0 5 16 26 28
Sediment 0 5 46 61 69 608 61
Bacteria 0 6 12 19 19
Trash 0 0 0 0 0
Rocky Gorge
Impervious Treated (acres) 11 88 165 307 307
ESD ( Impervious) 64 89 90 95 95
Cost (Million $) 3 17 40 70 75
ESD ( Cost) 55 82 64 73 68
Nitrogen 47 55 6710 82 85
Phosphorus 17 25 36 52 53 15 15
Sediment 10 19 45 7(J1o 79
Bacteria 14 23 32 47 47
Trash 15 30 46 68 68
Triadelphia
Impervious Treated (acres) 3 12 20 38 38
ESD ( Impervious) 100 98 97 99 99
Cost (Million $) 1 3 5 9 9
ESD ( Cost) 99 98 98 99 99
Nitrogen 24 27 29 34 34
Phosphorus 4 7 9 14 14 15 15
Sediment 1 4 6 12 12
Bacteria 1 4 6 12 12
Trash 2 6 11 21 21
Countywide
Impervious Treated (acres) 4302 6014 7722 10518 11154 6008 7723
ESD ( Impervious) 18 34 47 6(J1o 63
Cost (Million $) 305 622 987 1687 1884
ESD ( Cost) 53 66 7(J1o 8(J1o 80
Nitrogen 18 25 36 46 51 9 2(J1o
Phosphorus 17 23 34 44 46 12 34
Sediment 23 34 54 6(J1o 62 20 37
Bacteria 11 15 20 28 30
Trash 18 26 33 41 42
Assumptio~s
1 Does no~ includerepeated Outreach and Education costs beyond FY2015
2 Does not include ~n inflation multiplier
021611
Montgomery County Coordinated Implementation Strategy - DRAFT
Summary of Individual Implementation Plans
A summary of the general considerations and prioritization for each watershed implementation
plan is provided below
Anacostia - For the first permit cycle (through 2015) a priority was placed on full
implementation of completed high and low priority projects Next implementation of a third
of the other potential projects was targeted as a large number of these were identified in
conjunction with the USACEs Anacostia Watershed Restoration Plan efforts ESD was
emphasized on both public (10) and private property (10) Finally outreach (25) and
stream restoration (12) are targeted for pollutant load reduction but are not credited towards
impervious cover credit In future permit cycles the remainder of the other potential projects
are targeted along with ESD and a limited amount of riparian reforestation for impervious cover
and pollutant load reduction Outreach and stream restoration are significant strategies
pursued for load reduction benefits Nutrient and sediment MS4 permit area WLAs are met by
2030 but bacteria load reduction does not meet MS4 permit area WLA compliance The
remaining bacteria reduction is believed to be associated with urban wildlife sources Unless
intense urban wildlife management practices are implemented this remaining load reduction
will not be possible
Rock Creek- For the first permit cycle (through 2015) a priority was placed on full
implementation of complete high and low priority projects Next 25 implementation of
other potential projects was targeted ESD was emphasized on both public (10) and private
property (10) with private property implementation being linked to Rainscapes Program
success Finally outreach (100) and stream restoration (22) are targeted for pollutant load
reduction but are not credited towards impervious cover credit In future permit cycles the
remainder of the other potential projects are targeted along with ESD and riparian
reforestation for impervious cover and pollutant load reduction Stream restoration is a
significant strategy pursued for load reduction benefits The bacterial load reduction does not
meet MS4 permit area WLA compliance However the remaining bacterial load is believed to
be associated with urban wildlife sources Unless intense urban wildlife management practices
are implemented this remaining load reduction will not be possible
Cabin John Creek - Similar to the other two more urban watersheds in the County during the
first permit cycle (through 2015) a priority was placed on full implementation of complete high
and low priority projects Fewer opportunities exist overall compared to the Anacostia and Rock
Creek Next 25 implementation of other potential projects was targeted ESD was
emphasized on both public (10) and private property (10) Finally outreach (100) was
021611
Montgomery County Coordinated Implementation Strategy - DRAFT
targeted for pollutant load reduction but not credited towards impervious cover credit No
riparian reforestation or stream restoration was targeted due to limited or no opportunities In
future permit cycles the remainder of the other potential projects are targeted along with ESD
and some riparian reforestation for impervious cover and pollutant load reduction The
bacteria load reduction meets MS4 permit area WLA compliance by 2025
Muddy BranchWatts Branch - During the first permit cycle (through 2015) a priority was
placed on full implementation of complete high and low priority projects Fewer opportunities
exist overall compared to the Anacostia and Rock Creek Watersheds No other strategies were
pursued as there are no existing TMDLs in the Muddy BranchWatts Branch subwatersheds In
future permit cycles previously identified stream restoration projects are implemented for
pollutant load reduction
Great Seneca Creek - This watershed implementation plan is unique in that it includes the small
Clopper Lake subwatershed which has a TMDL for phosphorus Even with the TMDL there are
limited identified opportunities to pursue in the Clopper Lake subwatershed in part due to the
limited area of the subwatershed within the County MS4 permit area During the first permit
cycle (through 2015) a priority was placed on full implementation of complete high and low
priority projects within Great Seneca Creek subwatershed No opportunities exist for these
strategies in Clopper Lake However full outreach was applied in Clopper Lake in the first
permit cycle In future years other potential projects ESD on public and private property and a
small amount of riparian reforestation (in Clopper Lake) is pursued The Clopper Lake WLA for
phosphorus within the MS4 permit area is met
Patuxent - During the first permit cycle through 2015 a priority was placed on full
implementation of complete high and low priority projects Far fewer opportunities exist
overall compared to the Anacostia and Rock Creek A limited amount of ESD on private land
and stream restoration was pursued Finally outreach (100) was targeted for pollutant load
reduction (primarily nutrients) but not credited towards impervious cover credit No riparian
reforestation was targeted within the MS4 Permit area due to cost effectiveness in the Rocky
Gorge subwatershed and limited opportunities in the Triadelphia subwatershed In future
permit cycles ESD on private and public land is pursued more substantially as is stream
restoration A limited amount of riparian reforestation achieves some impervious cover and
pollutant load reduction The Rocky Gorge phosphorus WLA within the MS4 permit area is met
easily and the Tridelphia phosphorus WLA is also met but with a longer timeframe needed for
compliance
021611
Montgomery County Coordinated Implementation Strategy - DRAFT
Lower Monocacy Creek -lower Monocacy Creek is the most rural watershed in the County and
has the least amount of area subject to the County MS4 permit In addition there are no preshy
identified restoration projects within the watershed Therefore during the first permit cycle
(through 2015) only a very small amount (5) of private property ESD is pursued It is not until
the second permit cycle that more focus is placed on private and public ESD as well as stream
restoration and programmatic strategies such as street sweeping to target sediment loads
associated with the TM Dl In future permit cycles stream restoration is pursued for pollutant
load reduction The sediment WlA within the MS4 permit area is projected to be met around
2025
Countywide - The Countywide effort was driven by impervious cover treatment targets and
Chesapeake Bay TMDl2017 and 2020 reduction targets associated with sediment and nutrients
for urban MS4s For impervious cover it was assumed that a 20 target would be required for
each five-year permit cycle The Bay TMDl targets for urban MS4 areas were easily met for all
pollutants in 2017 and easily met for nitrogen and sediment but more difficult to meet for
phosphorus in 2020
Public Outreach and Stewardship
The County recognizes and is committed to the increasingly important role that public outreach
and stewardship will play if improved water quality conditions are going to be achieved
countywide While the County currently has a very active and layered outreach program the
model requires changes that will result in broader stakeholder groups serving as the leaders
and primary champions for clean water in their communities This includes greater participation
from minority and faith-based groups business consortiums schools neighborhood
associations and civic groups Additionally the new model requires revisiting current
initiatives carried out by the various County agencies to look for better and more efficient ways
to communicate messages cross-train and create synergies that result in greater engagement
greater awareness and sustained changes in behavior
Within each implementation plan specific suggestions for outreach and education
opportunities are identified In addition Appendix E of this Strategy contains practice sheets
which highlight targeted restoration activities for the County to develop and refine A total of
eight practices have been identified that can be adopted countywide or in more targeted
watershed areas where there are specific water quality issues to address Many of the
practices build upon existing County programs but require a much broader reach to new
partner groups Program start up costs are suggested and were used to for cost estimates
associated with Countywide strategy The highlighted practices include
021611
Montgomery County Coordinated Implementation Strategy - DRAFT
bull Pet Waste Pickup Education and Outreach Campaign
bull Lawn Stewardship Education and Outreach Campaign
bull Anti-littering Education and Outreach Campaign
bull Innovative Stormwater Management Awareness Campaign
bull Stream Stewards Education and Outreach Campaign
bull Riparian Reforestation Education and Outreach Campaign
bull Roof Runoff Reduction Education and Outreach Campaign
bull Parking Lot Recharge Value Education and Outreach Campaign
Start up costs by practice along with an overall five year cost estimate are provided in Table
43 Start up timeframes are assumed to be up to 18 months
Table 43 Outreach Start Up and 5-Year Cost Projections
Practice Practice Start Up Cost
Pet Waste Pickup $240500
Lawn Stewardship $301 600
Anti-Littering $175050
Stormwater Management Improvements Awareness $50450
Stream Stewards $74825
Riparian Reforestation $30575
Roof Runoff Reduction $101400
Parking Lot Recharge Value $41500
Estimated Start Up Total $744900
5-Year Outreach Budget Projection $2650000
These eight practice sheets provide specific costs and timelines for implementation They also
provide suggestions for measuring program success These practice sheets along with the
specific recommendations in the implementation plans make up the Public Outreach and
Education Campaign
Trash Reduction
Most of the implementation plans have to address trash loadings to meet requirements of the
Potomac Trash Treaty that is referenced in the County1s MS4 Permit In addition the Anacostia
Trash TMDL has recently been accepted by MDE and the EPA According to the Anacostia
021611
Montgomery County Coordinated Implementation Strategy - DRAFT
TMDl there is reasonable assurance that the goals of the Treaty and TMDl can be met with
proper watershed planning implementing pollution-reduction BMPs and using strong political
and financial mechanisms
Currently the County has a number of activities which target trash reduction They include the
following
bull Adopt-a-Road Program through DOT which focuses on public awareness and involvement in trash management There are 205 participants who adopted road segments and agreed to six major road cleanups per year
bull Storm Drain Marking through DOT bull Support for illegal dumping enforcement outreach and research and monitoring bull Partnership with DOT to conduct street sweeping covering about 2500 curb miles and
occurring once a year
bull Partnership with the Park Police to monitor illegal dumping which combined enforces 300-400 actions a year
bull Non-residential and residential recycling programs through Solid Waste Services (SWS) bull Transit stop trash management program at 600 bus stops countywide supported by DOT
Transit Services
In addition to continuing these efforts a number of trash good-housekeeping efforts have been
proposed as part of this Strategy A detailed description of the quantitative methods and
strategies applied can be found in Appendix E of the Guidance Document In general the
following six trash-reduction strategies are recommended
1 Significantly increase funding for trash reduction programs 2 Create and enhance regional partnerships and coordination among businesses
environmental groups individual citizens and government at all levels and in all jurisdictions
3 Improve peoples awareness knowledge and behavior relating to littering and illegal dumping
4 Promote the greater introduction and use of effective trash-reduction technologies and approaches
5 Improve enactment and enforcement of laws to reduce trash 6 Increase trash monitoring-related data collection generation and dissemination efforts
The Anacostia watershed implementation plan provides an outline of the actions that will be
taken through the first permit cycle to reduce trash The range of programs and practices
specially aimed at reducing trash inputs to roads and streams that will be targeted include
reduce reuse and recycle campaigns littering and illegal dumping enforcement stream
cleanups and street sweeping These measures are in addition to any trash trapped and
021611
Montgomery County Coordinated Implementation Strategy - DRAFT
removed by structural practices which are computed using the WTM The plan shows that the
trash TMDl can be met by 2025 at a cost of 732 million dollars
Adaptive Management Monitoring and Reporting
Sound implementation strategies require assessment and effective adaptation to respond to
new information changing conditions new technologies and lessons learned This will be the
basis of the plan that will be used when benchmarks are not met and the projected funding is
inadequate
Adaptive management requires monitoring of a variety of measures that can be used to
determine whether progress is being made towards meeting the Countywide water quality
objectives Ultimately it is the instream water quality and the loading limits with respect to the
TMDls that determine the success of implementation however there are many interim
measures that can also be correlated to success which are worthwhile pursuing
Surface water monitoring can be an expensive and time consuming undertaking Montgomery
County is fortunate to have an extensive Countywide stream monitoring network that can serve
as a foundation for providing spatial and temporal data to indicate stream health The Countys
MS4 Permit also outlines the required assessment of controls which includes chemical
biological and physical monitoring Specifically the permit calls for the County to continue
their watershed restoration monitoring of the lower Paint Branch subwatershed and physical
monitoring ofthe Clarksburg Special Protection area In addition to the existing monitoring
network the County will continue tracking and data reporting associated with levels of
implementation (eg acres of impervious cover treated areas of buffer planted miles of
stream restored miles of streets swept) For measuring effectiveness of outreach and
stewardship efforts other types of monitoring and reporting are planned that include before
and after attitude surveys frequency of website visits and information requests
For many restoration strategies it may be difficult to tease out their individual effectiveness in
terms of pollutant load reductions but collectively the monitoring that occurs should provide
adequate insight into the overall effectiveness of a layered implementation strategy
In addition to the monitoring and assessment the County will be reporting results on an annual
basis as part of their NPDES MS4 Permit annual report The MS4 Permit requires annual
reporting of the following
021611
Montgomery County Coordinated Implementation Strategy - DRAFT
bull The status of implementing the components of the stormwater management program
that are established as permit conditions
bull A narrative summary describing the results and analyses of data including monitoring
data that is accumulated throughout the reporting year
bull Expenditures for the reporting period and the proposed budget for the upcoming year
bull A summary describing the number and nature of enforcement actions inspections and
public education programs
bull The identification of water quality improvements and documentation of progress
toward meeting applicable WLAs developed under EPA approved TMDLs and
bull The identification of any proposed changes to the Countys program when WLAs are not
being met
The County will build upon annual reporting that has historically occurred to meet permit
requirements and will supplement this reporting with tracking table summaries that quantify
implementation activities for the range of strategies pursued during that year and the
associated treatment (eg impervious cover treated pollutant load reduced education and
outreach partners established etc) Cost will also be tracked in association with rates of
implementation This level of performance will then be compared with countywide strategy
targets (eg progress towards meeting WLAs) associated with key performance dates such as
those presented in Table 41 The level of progress achieved by the County will then feed into
the adaptive management approach described above
Organization Needs to Implement Strategy
Montgomery County DEP staff possesses substantial expertise and institutional knowledge that
yields many positive outcomes and efficient processes under the current pace of restoration
and permit compliance activities Under this strategy however the pace of implementation is
required to significantly increase Based on an increase in the level of implementation it is
reasonable to assume that additional capacity may be needed to provide sufficient oversight
and management of all the projects
Another critical element of this strategy is the recognition and commitment to pursuing
outreach initiatives that build community capacity by targeting new partner groups that
provide the necessary leadership oversight and sustained effort to change behaviors and
foster stewardship The County currently carries out many well established and managed
outreach programs but it may require additional focus across County agencies and
departments for these partnerships to become established and thrive
021611 G
Montgomery County Coordinated Implementation Strategy - DRAFT
Through the implementation process and the monitoring and reporting that is required large
amounts of data will be generated Technological advances happen so rapidly in this day and
age it will be important for the County to stay current with technology and methods so that
more efficient and cost-effective data management and reporting will be possible The County
currently relies on a detailed and sophisticated GIS to spatially locate projects and manage
tables of data related to projects The growth and development of this spatial database will be
a critical component of the reporting and tracking capability of the County These databases
generate the input data that are used to measure progress towards baseline loading targets
Regular review and upkeep of the data as well as routine summarization of progress (annually
at a minimum) will likely require additional dedication of staff This is especially the case during
periods where the implementation rate of structural practices in the ground is accelerated
021611
Montgomery County Coordinated Implementation Strategy - DRAFT
Appendix C - Restoration Potential by Watershed
021611
c-
04 03 02 01
a
_ Nitrogen Load Reduction
--shy TMDL WLA Target
_Cost
MONTGOMERY COUNTY URBAN WATERSHEDS POLLUTANTS _Bk)~Ibilats ~1~ l~ fjfsi --
Rank
1
2
3
4
5
6
7
8
9
10
11
Restoration Strategy TN reduction
Ibsyr
Pet Waste Education 15169
Retrofit of Underperforming BMPs 1769
Stream Restoration 72423
Completed Projects ~43 High Priority Projects 3260
Other Potential Projects 43276
Habitat Restoration 224
Public Property ESD Retrofits 18270
Priority Neighborhoods ESD Retrofits 9271
Private Non-residential ESD Retrofits 5594
Street Sweeping -
Incremental Cost Unit Cost
Million $ IbsMillion $ 088 17193
120 1475
9304 778
948 701
635 513
25430 170
141 158
23655 77
13278 70
8018 70
124 -
Qj c
Qj
nI CXI
o -f-
1 09 08 07 06 05
$900 $800 $700
~ $600 c $500 ~ $400 $300 0 u $200 $100
$shy
~~mf il_~IJrt~
MONTGOMERY COUNTY URBAN WATERSHEDS POLLUTANTS ItfiQ14lbilJts i~5 [i
1 $900 Qj
09 $8005 iii en 08 $700
~co 07 $600 co - til
06 $500 ~ 05- $400 ~ 04 en$300 003 u $20002
en $100I 01 o 0 $shys Q en o
s Q
Phosphorus Load Reduction
--- TMDL WLA Target
__Cost
I Rank I
1
2
3
4
5
6
7
8
9
Restoration Strategy
Pet Waste Education
Retrofit of Underperforming BMPs
Stream Restoration
Completed Projects
High Priority Projects
Habitat Restoration
Other Potential Projects
Public Property ESD Retrofits
Priority Neighborhoods ESD Retrofits
10 I Private Non-residential ESD Retrofits
11 Street Sweeping
TP reduction Incremental Cost Unit Cost
Ibsyr Million $ IbsMillion $ 1979 088 2243
247 120 206
13097 9304 141
915 948 96
451 635 71
37 141 26
6067 25430 24
2546 23655 11
1294 13278 10
781 8018 10
- 124 -
MONTGOMERY COUNTY URBAN WATERSHEDS POLLUTANTS IItQjQhabillt$middot
Cii 5 Cii 11 It CD
6 ~ r o ~ s
0 ltIIa r ltII e c ltII III
1 09 08 07 06 05 04 03 02 01
0
$900
$800 $700
v$600 r
0 $500 == $400 $300 11
0 u $200 $100
$shy
_ Sediment load Reduction
--- TMDl WlA Target
__Cost
Rank Restoration Strategy
Sediment reduction
Incremental Cost
Unit Cost
tonsyr Million $ tonsMillion $ 1 Street Sweeping 800 124 645
2 Stream Restoration 25057 9304 269
3 Retrofit of Underperforming BMPs 25 120 21
4 Completed Projects 97 948 10
5 High Priority Projects 47 635 7
6 Other Potential Projects 660 25430 3
7 I Public Property ESD Retrofits 272 23655 1
8 Priority Neighborhoods ESD Retrofits 139 13278 1
9 Private Non-residential ESD Retrofits 84 8018 1
10 Habitat Restoration 2 141 1
11 Pet Waste Education - 088 -
C-3
MONTGOMERY COUNTY URBAN WATERSHEDS POLLUTANTS
-QI5 5i ~
1 09 08 07 06 05 04 03 02 01
0
$900
$800
$700
$600 ~ 0
$500 == $400 $300 11
0 u $200
$100
$shy
--shy TMDL WLA Target
___ Cost
Rank Restoration Strategy
Enterrococci reduction
Incremental Cost
Unit Cost
Billion MPNyr Million $ Billion MPN Million $
1 Pet Waste Education 19643 088 22263
2 Retrofit of Underperforming BMPs 2781 120 2318
3 Completed Projects 10441 948 1101
4 High Priority Projects 5120 635 806
5 Other Potential Projects 69895 25430 275
6 Riparian Reforestation 310 141 219
7 Public Property ESD Retrofits 29025 23655 123
8 Priority Neighborhoods ESD Retrofits 14777 13278 111
9 Private Non-residential ESD Retrofits 8917 8018 111
10 Stream Restoration - 9304 -
11 Street Sweeping - 124 I -
~ I~~~i MONTGOMERY COUNTY URBAN WATERSHEDS POLLUTANTS 1tI2~mL ~ I~I
~$ I -~-- I
100 90 80 70 60 50 40 30 20 10
0
$900 $800 $700 $600 $500 $400 $300 $200 $100 $shy
vi c
~ 5 11 0 u
Implementation Phase
Potential Trash Incremental Unit Cost
I
Rank Restoration Strategy Reduction Cost
Ibsyear Million $ IbsMillion $ 1 Recycling Education and Investigations 51654 02 238837
2 Plastic Bag Ban and Misc Enforcement 63546 13 48882
3 Anti-litter Campaign Education 23J61 09 26930
4 Retrofit of Underperforming BMPs 1144 12 954
5 Completed Projects 6598 95 696
6 High Priority Projects 2786 64 439
7 Other Potential Projects 56341 2543 222
8 Habitat Restoration 266 14 188
9 Street Sweeping 204 12 164
10 Public Property ESD Retrofits 25348 2366 107
11 Priority lIeighborhoods ESD Retrofits 12529 1328 94
12 Private Non-residential ESD Retrofits 7547 802 94 ru Stream Restoration - 930 -14 Pet Waste Education - 09 -
C-5
MONTGOMERY COUNTY URBAN WATERSHEDS POLLUTANTS
CABIN JOHN
1 250
__CostImplementation Phase
09 08 07 06 05 04 03 02 01
0
200 ~ c
150 g E
100 - ltII 0 u
50
0
_E Coli
- - - Waste Load Allocation
Rank Restoration Strategy
E coli reduction
Incremental Cost
Unit Cost
Billion
MPNyr Million $
Billion MPN
Million $ 1 Pet Waste Education 4388 $05 9436
2 Underperforming BMP Retrofits 1892 $19 1022
3 High Priority Projects 1289 $16 800
4 Riparian Reforestation 1133 $78 146
5 Other Potential Projects 148 $17 86
6 Public Property ESD Retrofits 4AOO $860 Sl 7 Private Non-residential ESD Retrofits 1618 $392 41
8 Priority Neighborhoods ESD Retrofits 2633 $638 41
9 Completed Projects 112 $00 0
C-6
MONTGOMERY COUNTY URBAN WATERSHEDS POLLUTANTS 1Itf~~Jabitm
ROCK CREEK
1 $700 Qj5 09
o
_
$600 Qj 08
111 $500 ~ampl 07 c
t5 06 $400 ~ e 05 ~ $3005 04 - 111tl 03 $200 0 u-6 02
$100J 01 $-
Enterrococci
- - - Waste load Allocation Implementation Phase
__Cost
Rank Restoration Strategy
Enterrococci reduction
Incremental Cost
Unit Cost
Billion MPNyr Million $ Billion MPN Million $
Et Pet Waste Management 35734 118 30190
Underperforming BMP Upgrades
Other Potential Projects
28800
30239
577
1083
4995
2792
4 Completed Projects 12131 444 2734
5 High Priority Projects 14239 890 1600
6 Riparian Reforestation 18999 2384 797
7 County Property ESD Retrofits 54519 24136 226
8 Private Residential ESD Retrofits 35230 17737 199
9 Private Non-residential ESD Retrofits 32A86 16380 198
C-7
MONTGOMERY COUNTY URBAN WATERSHEDS POLLUTANTS _f~~pabitafS (fi~r ~~ l-middotshy
ROCK CREEK
100 $900 90 $800 80 $700 u70 $600 c 60 2$50050 -~$40040
lt1$300 030 $200 u
20 10 $100
0 $shy
Implementation Phase
Rank Restoration Strategy Trash Reduction
Incremental Cost
Unit Cost I
Ibsyear Million $ IbsMillion $ 1 Other Potential Projects 16038 1085 1478
2 Underperforming BMP Upgrades 6756 577 1172
3 Completed Projects 4217 444 950
4 High Priority Projects 6366 890 715
5 Riparian Reforestation 9237 2384 387
6 Public Property ESD Retrofits 24587 24136 102
7 Priority Neighborhoods ESD Retrofits 16155 17737 91
8 Private Non-residential ESD Retrofits 14793 16380 90
9 Pet Waste Education - 118 -
(-8
MONTGOMERY COUNTY RURAL WATERSHEDS POLLUTANTS
SENECA - CLOPPER LAKE -
100 Qi
90 iii 80VI to -CQ 70 0 60e 50I 0 40 u l 30
C QJ 20ex
C 10to 0
J 0
$18
$16
$14 n
$12 I
$10 sect $08 ~ $06 0
VI
U $04
$02
$shy
_TPRemoval - - - TMDL Reduction Target
Implementation Phase ___Cost
Rank Restoration Strategy TP
Reduction (Ibsyr)
Incremental Cost (Million $)
Unit Cost (IbsvrMillion $)
1 Residential Education 33 001 6246
2 Underperforming BMP Retrofits 13 004 341 3 Riparian Buffer Reforestation 19 023 99 4 Priority Neighborhood ESD Retrofits 15 051 35 5 Public Property ESD Retrofits 7 075 99
C-9
-pj[fti
MONTGOMERY COUNTY URBAN WATERSHEDS POLLUTANTS 1It[~~JIlbitIL f bull~
LOWER MONOCACY
1 09 08 07 06 05 04 03 02 01
0
Implementation Phase
25
20 ~ c
15 ~ ~
10 - 0 u
5
0
_TSS
- - - Waste load Allocation _Cost
Rank Restoration Strategy
Sediment reduction
Incremental
Cost Unit Cost
tonsyear Million $ tonMilli
1 Street Sweeping 22 $007 3121
2 Underperforming BMP Retrofits 4 $010 389
3 Stream Restoration 37 $734 51
4 Riparian Buffer Reforestation 3 $109 25
5 Other Structural BMPs and ESD Strategies 10 $851 12
6 Priority Neighborhoods ESD Retrofits 2 $160 10
7 Non-residential ESD Retrofits 1 $132 10
C-10
MONTGOMERY COUNTY RURAL WATERSHEDS POLLUTANTS 1tlj~lIbiIalSlt~~II
1 09 08 07 06 05 04 03 02 01
0
$70
$60
$50 ~ c
$40 ~ ~ $30 - UI
$20 0 v
$10
$0
_ Phosphorus Load Reduction
- - - Waste Load Allocation ___ CostImplementation Phase
Rank Restoration Strategy TP Incremental Cost
Million $ Unit Cost
Ibsyr Ibs Million $ 1 Lawn Care Education 3670 01 37394
2 Underperforming BMP Retrofits 3499 08 4338
3 Other Potential Projects 3524 33 1076
4 High Priority Projects 252 04 685
5 Riparian Reforestation 762 26 298
6 Public Property Retrofits 5854 345 169
7 Priority Neighborhoods ESD Retrofits 796 65 123
8 Private Non-residential ESD Retrofits 1941 168 116
9 Completed Projects 53 00 00
c- 11
MONTGOMERY COUNTY RURAL WATERSHEDS POLLUTANTSal12hdJilats ~I~ ~ [ -
1 10 ii 5 09 9 1 08 8 II al- 07 7 1ii o 06 6
c
~ ~ 1 o E IV
05 04 03
5 4
3
~ 11 0 u
0 11 02 2 J o 01 1
t a 0 0 11 o
t 0
_ Phosphorus Reduction
- - - Waste Load Allocation
-Cost
Rank Restoration Strategy TP Incremental Cost
Million $ Unit Cost
Ibsyr Ibs Million $ 1 Lawn Care Education 3670 01 37394
2 Underperforming BMP Retrofits 3499 08 4338
3 Other Potential Projects 3524 33 1076
4 High Priority Projects 252 04 685
5 Riparian Reforestation 762 26 298
6 Public Property Retrofits 5854 345 169
7 Priority Neighborhoods ESD Retrofits 796 65 123
8 Private Non-residential ESD Retrofits 1941 168 116
9 Completed Projects 53 00 00
C-12
Montgomery County Coordinated Implementation Strategy - DRAFT
impervious cover treatment targets under the current MS4 permit (as well as projected targets
for 2020 and 2025 assuming a continued 20 treatment requirement) interim and final
Chesapeake Bay nutrient and sediment reduction targets by 2017 and 2020 respectively and
out year MS4 permit area WLA compliance for the majority of pollutants Exceptions include
meeting the bacteria WLA load reductions required for the Anacostia and Rock Creek
021611
Montgomery County Coordinated Implementation Strategy - DRAFT
Table 42 Projection by Phase for Watersheds and Pollutants PermitTMDL Targets
Watershed Fiscal Year 2015 2017 2020 2025 2030 2017 2020
Impervious Treated (acres) 1421 2393 3364 4272 4544
ESD ( Impervious) 26 44 61 69A 71
Cost (Million $) 160 307 486 732 820
E5D( Cost) 45 62 71 78 78
Anacostia Nitrogen 25 39 68 89A l00A 818 82
Phosphorus 27 42 77 100 100 812 81
i Sediment 47 72 100 l00A) l00A 875 88
Bacteria 21 33 46 59A 64 879 88
Trash 41 65 89 l00A) 100
Impervious Treated (acres) 1541 1961 2381 3625 3989
ESD ( Impervious) 17 28 36 57A 61
Cost (Million $) 87 172 262 566 658
ESD ( Cost) 7(JA 79 79A 89A 9(JA
Rock Creek Nitrogen 24 30 38 55 61
Phosphorus 25 3(JA 38 54 GfJA)
Sediment 38 50 92 l00A 100
Bacteria 21 27 33 5(JA 55 96(JA 96
Trash 17 24 31 5(JA) 55
Impervious Treated (acres) 187 380 570 1018 1018
ESD ( Impervious) 52 72 78 87A 87A
Cost (Million $) 23 65 114 215 219
ESD ( Cost) 92 91 86 90 88
Cabin John Nitrogen 21 27A 39A 55 58 Phosphorus 2(JA 26 35 49 51
Sediment 6 17 GfJA 91 100
Bacteria 16 22 27 4(JA) 40 31 31
Trash 6 12 19 34 34
Impervious Treated (acres) 237 237 237 237 237
ESD ( Impervious) 4 4 4 4 4
Cost (Million $) 6 8 19 25 31
ESD ( Cost) 32 27A 11 8 7
Muddy Watts Nitrogen 6 7 15 18 22
Phosphorus 6 7 10 12 13 Sediment 7 8 14 17 2(JA
Bacteria 0 (JA 0 (JA 0 i Trash 6 6 6 6 6
bull Impervious Treated (acres) 901 921 941 941 941 ESD ( Impervious) 2 2 2 2 2
Cost (Million $) 26 48 SO 51 52 ESD ( Cost) 15 8 8 8 8
Great Seneca Nitrogen 24 41 43 44 45
Phosphorus 24 32 34 34 34
i Sediment 26 41 43 44 44
I Bacteria (JA) 0 0 0 (JA
Trash 31 32 33 33 33
021611
Montgomery County Coordinated Implementation Strategy - DRAFT
Pe rmitTMDL Targets
Watershed Fiscal Year 2015 2017 2020 2025 2030 2017 2020
Clopper
Impervious Treated (acres) 0 6 12 22 22
ESD ( Impervious) 0 86 86 92 92
Cost (Million $) 0 0 1 2 2
ESD ( Cost) 0 72 73 84 84
Nitrogen 61 67 72 79 79
Phosphorus 30 36 41 48 48 45 45
Sediment 0 5 10 17 17
Bacteria 0 0 0 0 0
Trash 0 6 11 18 18
Lower Monocacy
Impervious Treated (acres) 1 16 32 58 58
ESD ( Impervious) 100 85 84 91 91
Cost (Million $) 0 4 11 18 20
ESD ( Cost) 100 85 54 63 58
Nitrogen 0 5 14 22 24
Phosphorus 0 5 16 26 28
Sediment 0 5 46 61 69 608 61
Bacteria 0 6 12 19 19
Trash 0 0 0 0 0
Rocky Gorge
Impervious Treated (acres) 11 88 165 307 307
ESD ( Impervious) 64 89 90 95 95
Cost (Million $) 3 17 40 70 75
ESD ( Cost) 55 82 64 73 68
Nitrogen 47 55 6710 82 85
Phosphorus 17 25 36 52 53 15 15
Sediment 10 19 45 7(J1o 79
Bacteria 14 23 32 47 47
Trash 15 30 46 68 68
Triadelphia
Impervious Treated (acres) 3 12 20 38 38
ESD ( Impervious) 100 98 97 99 99
Cost (Million $) 1 3 5 9 9
ESD ( Cost) 99 98 98 99 99
Nitrogen 24 27 29 34 34
Phosphorus 4 7 9 14 14 15 15
Sediment 1 4 6 12 12
Bacteria 1 4 6 12 12
Trash 2 6 11 21 21
Countywide
Impervious Treated (acres) 4302 6014 7722 10518 11154 6008 7723
ESD ( Impervious) 18 34 47 6(J1o 63
Cost (Million $) 305 622 987 1687 1884
ESD ( Cost) 53 66 7(J1o 8(J1o 80
Nitrogen 18 25 36 46 51 9 2(J1o
Phosphorus 17 23 34 44 46 12 34
Sediment 23 34 54 6(J1o 62 20 37
Bacteria 11 15 20 28 30
Trash 18 26 33 41 42
Assumptio~s
1 Does no~ includerepeated Outreach and Education costs beyond FY2015
2 Does not include ~n inflation multiplier
021611
Montgomery County Coordinated Implementation Strategy - DRAFT
Summary of Individual Implementation Plans
A summary of the general considerations and prioritization for each watershed implementation
plan is provided below
Anacostia - For the first permit cycle (through 2015) a priority was placed on full
implementation of completed high and low priority projects Next implementation of a third
of the other potential projects was targeted as a large number of these were identified in
conjunction with the USACEs Anacostia Watershed Restoration Plan efforts ESD was
emphasized on both public (10) and private property (10) Finally outreach (25) and
stream restoration (12) are targeted for pollutant load reduction but are not credited towards
impervious cover credit In future permit cycles the remainder of the other potential projects
are targeted along with ESD and a limited amount of riparian reforestation for impervious cover
and pollutant load reduction Outreach and stream restoration are significant strategies
pursued for load reduction benefits Nutrient and sediment MS4 permit area WLAs are met by
2030 but bacteria load reduction does not meet MS4 permit area WLA compliance The
remaining bacteria reduction is believed to be associated with urban wildlife sources Unless
intense urban wildlife management practices are implemented this remaining load reduction
will not be possible
Rock Creek- For the first permit cycle (through 2015) a priority was placed on full
implementation of complete high and low priority projects Next 25 implementation of
other potential projects was targeted ESD was emphasized on both public (10) and private
property (10) with private property implementation being linked to Rainscapes Program
success Finally outreach (100) and stream restoration (22) are targeted for pollutant load
reduction but are not credited towards impervious cover credit In future permit cycles the
remainder of the other potential projects are targeted along with ESD and riparian
reforestation for impervious cover and pollutant load reduction Stream restoration is a
significant strategy pursued for load reduction benefits The bacterial load reduction does not
meet MS4 permit area WLA compliance However the remaining bacterial load is believed to
be associated with urban wildlife sources Unless intense urban wildlife management practices
are implemented this remaining load reduction will not be possible
Cabin John Creek - Similar to the other two more urban watersheds in the County during the
first permit cycle (through 2015) a priority was placed on full implementation of complete high
and low priority projects Fewer opportunities exist overall compared to the Anacostia and Rock
Creek Next 25 implementation of other potential projects was targeted ESD was
emphasized on both public (10) and private property (10) Finally outreach (100) was
021611
Montgomery County Coordinated Implementation Strategy - DRAFT
targeted for pollutant load reduction but not credited towards impervious cover credit No
riparian reforestation or stream restoration was targeted due to limited or no opportunities In
future permit cycles the remainder of the other potential projects are targeted along with ESD
and some riparian reforestation for impervious cover and pollutant load reduction The
bacteria load reduction meets MS4 permit area WLA compliance by 2025
Muddy BranchWatts Branch - During the first permit cycle (through 2015) a priority was
placed on full implementation of complete high and low priority projects Fewer opportunities
exist overall compared to the Anacostia and Rock Creek Watersheds No other strategies were
pursued as there are no existing TMDLs in the Muddy BranchWatts Branch subwatersheds In
future permit cycles previously identified stream restoration projects are implemented for
pollutant load reduction
Great Seneca Creek - This watershed implementation plan is unique in that it includes the small
Clopper Lake subwatershed which has a TMDL for phosphorus Even with the TMDL there are
limited identified opportunities to pursue in the Clopper Lake subwatershed in part due to the
limited area of the subwatershed within the County MS4 permit area During the first permit
cycle (through 2015) a priority was placed on full implementation of complete high and low
priority projects within Great Seneca Creek subwatershed No opportunities exist for these
strategies in Clopper Lake However full outreach was applied in Clopper Lake in the first
permit cycle In future years other potential projects ESD on public and private property and a
small amount of riparian reforestation (in Clopper Lake) is pursued The Clopper Lake WLA for
phosphorus within the MS4 permit area is met
Patuxent - During the first permit cycle through 2015 a priority was placed on full
implementation of complete high and low priority projects Far fewer opportunities exist
overall compared to the Anacostia and Rock Creek A limited amount of ESD on private land
and stream restoration was pursued Finally outreach (100) was targeted for pollutant load
reduction (primarily nutrients) but not credited towards impervious cover credit No riparian
reforestation was targeted within the MS4 Permit area due to cost effectiveness in the Rocky
Gorge subwatershed and limited opportunities in the Triadelphia subwatershed In future
permit cycles ESD on private and public land is pursued more substantially as is stream
restoration A limited amount of riparian reforestation achieves some impervious cover and
pollutant load reduction The Rocky Gorge phosphorus WLA within the MS4 permit area is met
easily and the Tridelphia phosphorus WLA is also met but with a longer timeframe needed for
compliance
021611
Montgomery County Coordinated Implementation Strategy - DRAFT
Lower Monocacy Creek -lower Monocacy Creek is the most rural watershed in the County and
has the least amount of area subject to the County MS4 permit In addition there are no preshy
identified restoration projects within the watershed Therefore during the first permit cycle
(through 2015) only a very small amount (5) of private property ESD is pursued It is not until
the second permit cycle that more focus is placed on private and public ESD as well as stream
restoration and programmatic strategies such as street sweeping to target sediment loads
associated with the TM Dl In future permit cycles stream restoration is pursued for pollutant
load reduction The sediment WlA within the MS4 permit area is projected to be met around
2025
Countywide - The Countywide effort was driven by impervious cover treatment targets and
Chesapeake Bay TMDl2017 and 2020 reduction targets associated with sediment and nutrients
for urban MS4s For impervious cover it was assumed that a 20 target would be required for
each five-year permit cycle The Bay TMDl targets for urban MS4 areas were easily met for all
pollutants in 2017 and easily met for nitrogen and sediment but more difficult to meet for
phosphorus in 2020
Public Outreach and Stewardship
The County recognizes and is committed to the increasingly important role that public outreach
and stewardship will play if improved water quality conditions are going to be achieved
countywide While the County currently has a very active and layered outreach program the
model requires changes that will result in broader stakeholder groups serving as the leaders
and primary champions for clean water in their communities This includes greater participation
from minority and faith-based groups business consortiums schools neighborhood
associations and civic groups Additionally the new model requires revisiting current
initiatives carried out by the various County agencies to look for better and more efficient ways
to communicate messages cross-train and create synergies that result in greater engagement
greater awareness and sustained changes in behavior
Within each implementation plan specific suggestions for outreach and education
opportunities are identified In addition Appendix E of this Strategy contains practice sheets
which highlight targeted restoration activities for the County to develop and refine A total of
eight practices have been identified that can be adopted countywide or in more targeted
watershed areas where there are specific water quality issues to address Many of the
practices build upon existing County programs but require a much broader reach to new
partner groups Program start up costs are suggested and were used to for cost estimates
associated with Countywide strategy The highlighted practices include
021611
Montgomery County Coordinated Implementation Strategy - DRAFT
bull Pet Waste Pickup Education and Outreach Campaign
bull Lawn Stewardship Education and Outreach Campaign
bull Anti-littering Education and Outreach Campaign
bull Innovative Stormwater Management Awareness Campaign
bull Stream Stewards Education and Outreach Campaign
bull Riparian Reforestation Education and Outreach Campaign
bull Roof Runoff Reduction Education and Outreach Campaign
bull Parking Lot Recharge Value Education and Outreach Campaign
Start up costs by practice along with an overall five year cost estimate are provided in Table
43 Start up timeframes are assumed to be up to 18 months
Table 43 Outreach Start Up and 5-Year Cost Projections
Practice Practice Start Up Cost
Pet Waste Pickup $240500
Lawn Stewardship $301 600
Anti-Littering $175050
Stormwater Management Improvements Awareness $50450
Stream Stewards $74825
Riparian Reforestation $30575
Roof Runoff Reduction $101400
Parking Lot Recharge Value $41500
Estimated Start Up Total $744900
5-Year Outreach Budget Projection $2650000
These eight practice sheets provide specific costs and timelines for implementation They also
provide suggestions for measuring program success These practice sheets along with the
specific recommendations in the implementation plans make up the Public Outreach and
Education Campaign
Trash Reduction
Most of the implementation plans have to address trash loadings to meet requirements of the
Potomac Trash Treaty that is referenced in the County1s MS4 Permit In addition the Anacostia
Trash TMDL has recently been accepted by MDE and the EPA According to the Anacostia
021611
Montgomery County Coordinated Implementation Strategy - DRAFT
TMDl there is reasonable assurance that the goals of the Treaty and TMDl can be met with
proper watershed planning implementing pollution-reduction BMPs and using strong political
and financial mechanisms
Currently the County has a number of activities which target trash reduction They include the
following
bull Adopt-a-Road Program through DOT which focuses on public awareness and involvement in trash management There are 205 participants who adopted road segments and agreed to six major road cleanups per year
bull Storm Drain Marking through DOT bull Support for illegal dumping enforcement outreach and research and monitoring bull Partnership with DOT to conduct street sweeping covering about 2500 curb miles and
occurring once a year
bull Partnership with the Park Police to monitor illegal dumping which combined enforces 300-400 actions a year
bull Non-residential and residential recycling programs through Solid Waste Services (SWS) bull Transit stop trash management program at 600 bus stops countywide supported by DOT
Transit Services
In addition to continuing these efforts a number of trash good-housekeeping efforts have been
proposed as part of this Strategy A detailed description of the quantitative methods and
strategies applied can be found in Appendix E of the Guidance Document In general the
following six trash-reduction strategies are recommended
1 Significantly increase funding for trash reduction programs 2 Create and enhance regional partnerships and coordination among businesses
environmental groups individual citizens and government at all levels and in all jurisdictions
3 Improve peoples awareness knowledge and behavior relating to littering and illegal dumping
4 Promote the greater introduction and use of effective trash-reduction technologies and approaches
5 Improve enactment and enforcement of laws to reduce trash 6 Increase trash monitoring-related data collection generation and dissemination efforts
The Anacostia watershed implementation plan provides an outline of the actions that will be
taken through the first permit cycle to reduce trash The range of programs and practices
specially aimed at reducing trash inputs to roads and streams that will be targeted include
reduce reuse and recycle campaigns littering and illegal dumping enforcement stream
cleanups and street sweeping These measures are in addition to any trash trapped and
021611
Montgomery County Coordinated Implementation Strategy - DRAFT
removed by structural practices which are computed using the WTM The plan shows that the
trash TMDl can be met by 2025 at a cost of 732 million dollars
Adaptive Management Monitoring and Reporting
Sound implementation strategies require assessment and effective adaptation to respond to
new information changing conditions new technologies and lessons learned This will be the
basis of the plan that will be used when benchmarks are not met and the projected funding is
inadequate
Adaptive management requires monitoring of a variety of measures that can be used to
determine whether progress is being made towards meeting the Countywide water quality
objectives Ultimately it is the instream water quality and the loading limits with respect to the
TMDls that determine the success of implementation however there are many interim
measures that can also be correlated to success which are worthwhile pursuing
Surface water monitoring can be an expensive and time consuming undertaking Montgomery
County is fortunate to have an extensive Countywide stream monitoring network that can serve
as a foundation for providing spatial and temporal data to indicate stream health The Countys
MS4 Permit also outlines the required assessment of controls which includes chemical
biological and physical monitoring Specifically the permit calls for the County to continue
their watershed restoration monitoring of the lower Paint Branch subwatershed and physical
monitoring ofthe Clarksburg Special Protection area In addition to the existing monitoring
network the County will continue tracking and data reporting associated with levels of
implementation (eg acres of impervious cover treated areas of buffer planted miles of
stream restored miles of streets swept) For measuring effectiveness of outreach and
stewardship efforts other types of monitoring and reporting are planned that include before
and after attitude surveys frequency of website visits and information requests
For many restoration strategies it may be difficult to tease out their individual effectiveness in
terms of pollutant load reductions but collectively the monitoring that occurs should provide
adequate insight into the overall effectiveness of a layered implementation strategy
In addition to the monitoring and assessment the County will be reporting results on an annual
basis as part of their NPDES MS4 Permit annual report The MS4 Permit requires annual
reporting of the following
021611
Montgomery County Coordinated Implementation Strategy - DRAFT
bull The status of implementing the components of the stormwater management program
that are established as permit conditions
bull A narrative summary describing the results and analyses of data including monitoring
data that is accumulated throughout the reporting year
bull Expenditures for the reporting period and the proposed budget for the upcoming year
bull A summary describing the number and nature of enforcement actions inspections and
public education programs
bull The identification of water quality improvements and documentation of progress
toward meeting applicable WLAs developed under EPA approved TMDLs and
bull The identification of any proposed changes to the Countys program when WLAs are not
being met
The County will build upon annual reporting that has historically occurred to meet permit
requirements and will supplement this reporting with tracking table summaries that quantify
implementation activities for the range of strategies pursued during that year and the
associated treatment (eg impervious cover treated pollutant load reduced education and
outreach partners established etc) Cost will also be tracked in association with rates of
implementation This level of performance will then be compared with countywide strategy
targets (eg progress towards meeting WLAs) associated with key performance dates such as
those presented in Table 41 The level of progress achieved by the County will then feed into
the adaptive management approach described above
Organization Needs to Implement Strategy
Montgomery County DEP staff possesses substantial expertise and institutional knowledge that
yields many positive outcomes and efficient processes under the current pace of restoration
and permit compliance activities Under this strategy however the pace of implementation is
required to significantly increase Based on an increase in the level of implementation it is
reasonable to assume that additional capacity may be needed to provide sufficient oversight
and management of all the projects
Another critical element of this strategy is the recognition and commitment to pursuing
outreach initiatives that build community capacity by targeting new partner groups that
provide the necessary leadership oversight and sustained effort to change behaviors and
foster stewardship The County currently carries out many well established and managed
outreach programs but it may require additional focus across County agencies and
departments for these partnerships to become established and thrive
021611 G
Montgomery County Coordinated Implementation Strategy - DRAFT
Through the implementation process and the monitoring and reporting that is required large
amounts of data will be generated Technological advances happen so rapidly in this day and
age it will be important for the County to stay current with technology and methods so that
more efficient and cost-effective data management and reporting will be possible The County
currently relies on a detailed and sophisticated GIS to spatially locate projects and manage
tables of data related to projects The growth and development of this spatial database will be
a critical component of the reporting and tracking capability of the County These databases
generate the input data that are used to measure progress towards baseline loading targets
Regular review and upkeep of the data as well as routine summarization of progress (annually
at a minimum) will likely require additional dedication of staff This is especially the case during
periods where the implementation rate of structural practices in the ground is accelerated
021611
Montgomery County Coordinated Implementation Strategy - DRAFT
Appendix C - Restoration Potential by Watershed
021611
c-
04 03 02 01
a
_ Nitrogen Load Reduction
--shy TMDL WLA Target
_Cost
MONTGOMERY COUNTY URBAN WATERSHEDS POLLUTANTS _Bk)~Ibilats ~1~ l~ fjfsi --
Rank
1
2
3
4
5
6
7
8
9
10
11
Restoration Strategy TN reduction
Ibsyr
Pet Waste Education 15169
Retrofit of Underperforming BMPs 1769
Stream Restoration 72423
Completed Projects ~43 High Priority Projects 3260
Other Potential Projects 43276
Habitat Restoration 224
Public Property ESD Retrofits 18270
Priority Neighborhoods ESD Retrofits 9271
Private Non-residential ESD Retrofits 5594
Street Sweeping -
Incremental Cost Unit Cost
Million $ IbsMillion $ 088 17193
120 1475
9304 778
948 701
635 513
25430 170
141 158
23655 77
13278 70
8018 70
124 -
Qj c
Qj
nI CXI
o -f-
1 09 08 07 06 05
$900 $800 $700
~ $600 c $500 ~ $400 $300 0 u $200 $100
$shy
~~mf il_~IJrt~
MONTGOMERY COUNTY URBAN WATERSHEDS POLLUTANTS ItfiQ14lbilJts i~5 [i
1 $900 Qj
09 $8005 iii en 08 $700
~co 07 $600 co - til
06 $500 ~ 05- $400 ~ 04 en$300 003 u $20002
en $100I 01 o 0 $shys Q en o
s Q
Phosphorus Load Reduction
--- TMDL WLA Target
__Cost
I Rank I
1
2
3
4
5
6
7
8
9
Restoration Strategy
Pet Waste Education
Retrofit of Underperforming BMPs
Stream Restoration
Completed Projects
High Priority Projects
Habitat Restoration
Other Potential Projects
Public Property ESD Retrofits
Priority Neighborhoods ESD Retrofits
10 I Private Non-residential ESD Retrofits
11 Street Sweeping
TP reduction Incremental Cost Unit Cost
Ibsyr Million $ IbsMillion $ 1979 088 2243
247 120 206
13097 9304 141
915 948 96
451 635 71
37 141 26
6067 25430 24
2546 23655 11
1294 13278 10
781 8018 10
- 124 -
MONTGOMERY COUNTY URBAN WATERSHEDS POLLUTANTS IItQjQhabillt$middot
Cii 5 Cii 11 It CD
6 ~ r o ~ s
0 ltIIa r ltII e c ltII III
1 09 08 07 06 05 04 03 02 01
0
$900
$800 $700
v$600 r
0 $500 == $400 $300 11
0 u $200 $100
$shy
_ Sediment load Reduction
--- TMDl WlA Target
__Cost
Rank Restoration Strategy
Sediment reduction
Incremental Cost
Unit Cost
tonsyr Million $ tonsMillion $ 1 Street Sweeping 800 124 645
2 Stream Restoration 25057 9304 269
3 Retrofit of Underperforming BMPs 25 120 21
4 Completed Projects 97 948 10
5 High Priority Projects 47 635 7
6 Other Potential Projects 660 25430 3
7 I Public Property ESD Retrofits 272 23655 1
8 Priority Neighborhoods ESD Retrofits 139 13278 1
9 Private Non-residential ESD Retrofits 84 8018 1
10 Habitat Restoration 2 141 1
11 Pet Waste Education - 088 -
C-3
MONTGOMERY COUNTY URBAN WATERSHEDS POLLUTANTS
-QI5 5i ~
1 09 08 07 06 05 04 03 02 01
0
$900
$800
$700
$600 ~ 0
$500 == $400 $300 11
0 u $200
$100
$shy
--shy TMDL WLA Target
___ Cost
Rank Restoration Strategy
Enterrococci reduction
Incremental Cost
Unit Cost
Billion MPNyr Million $ Billion MPN Million $
1 Pet Waste Education 19643 088 22263
2 Retrofit of Underperforming BMPs 2781 120 2318
3 Completed Projects 10441 948 1101
4 High Priority Projects 5120 635 806
5 Other Potential Projects 69895 25430 275
6 Riparian Reforestation 310 141 219
7 Public Property ESD Retrofits 29025 23655 123
8 Priority Neighborhoods ESD Retrofits 14777 13278 111
9 Private Non-residential ESD Retrofits 8917 8018 111
10 Stream Restoration - 9304 -
11 Street Sweeping - 124 I -
~ I~~~i MONTGOMERY COUNTY URBAN WATERSHEDS POLLUTANTS 1tI2~mL ~ I~I
~$ I -~-- I
100 90 80 70 60 50 40 30 20 10
0
$900 $800 $700 $600 $500 $400 $300 $200 $100 $shy
vi c
~ 5 11 0 u
Implementation Phase
Potential Trash Incremental Unit Cost
I
Rank Restoration Strategy Reduction Cost
Ibsyear Million $ IbsMillion $ 1 Recycling Education and Investigations 51654 02 238837
2 Plastic Bag Ban and Misc Enforcement 63546 13 48882
3 Anti-litter Campaign Education 23J61 09 26930
4 Retrofit of Underperforming BMPs 1144 12 954
5 Completed Projects 6598 95 696
6 High Priority Projects 2786 64 439
7 Other Potential Projects 56341 2543 222
8 Habitat Restoration 266 14 188
9 Street Sweeping 204 12 164
10 Public Property ESD Retrofits 25348 2366 107
11 Priority lIeighborhoods ESD Retrofits 12529 1328 94
12 Private Non-residential ESD Retrofits 7547 802 94 ru Stream Restoration - 930 -14 Pet Waste Education - 09 -
C-5
MONTGOMERY COUNTY URBAN WATERSHEDS POLLUTANTS
CABIN JOHN
1 250
__CostImplementation Phase
09 08 07 06 05 04 03 02 01
0
200 ~ c
150 g E
100 - ltII 0 u
50
0
_E Coli
- - - Waste Load Allocation
Rank Restoration Strategy
E coli reduction
Incremental Cost
Unit Cost
Billion
MPNyr Million $
Billion MPN
Million $ 1 Pet Waste Education 4388 $05 9436
2 Underperforming BMP Retrofits 1892 $19 1022
3 High Priority Projects 1289 $16 800
4 Riparian Reforestation 1133 $78 146
5 Other Potential Projects 148 $17 86
6 Public Property ESD Retrofits 4AOO $860 Sl 7 Private Non-residential ESD Retrofits 1618 $392 41
8 Priority Neighborhoods ESD Retrofits 2633 $638 41
9 Completed Projects 112 $00 0
C-6
MONTGOMERY COUNTY URBAN WATERSHEDS POLLUTANTS 1Itf~~Jabitm
ROCK CREEK
1 $700 Qj5 09
o
_
$600 Qj 08
111 $500 ~ampl 07 c
t5 06 $400 ~ e 05 ~ $3005 04 - 111tl 03 $200 0 u-6 02
$100J 01 $-
Enterrococci
- - - Waste load Allocation Implementation Phase
__Cost
Rank Restoration Strategy
Enterrococci reduction
Incremental Cost
Unit Cost
Billion MPNyr Million $ Billion MPN Million $
Et Pet Waste Management 35734 118 30190
Underperforming BMP Upgrades
Other Potential Projects
28800
30239
577
1083
4995
2792
4 Completed Projects 12131 444 2734
5 High Priority Projects 14239 890 1600
6 Riparian Reforestation 18999 2384 797
7 County Property ESD Retrofits 54519 24136 226
8 Private Residential ESD Retrofits 35230 17737 199
9 Private Non-residential ESD Retrofits 32A86 16380 198
C-7
MONTGOMERY COUNTY URBAN WATERSHEDS POLLUTANTS _f~~pabitafS (fi~r ~~ l-middotshy
ROCK CREEK
100 $900 90 $800 80 $700 u70 $600 c 60 2$50050 -~$40040
lt1$300 030 $200 u
20 10 $100
0 $shy
Implementation Phase
Rank Restoration Strategy Trash Reduction
Incremental Cost
Unit Cost I
Ibsyear Million $ IbsMillion $ 1 Other Potential Projects 16038 1085 1478
2 Underperforming BMP Upgrades 6756 577 1172
3 Completed Projects 4217 444 950
4 High Priority Projects 6366 890 715
5 Riparian Reforestation 9237 2384 387
6 Public Property ESD Retrofits 24587 24136 102
7 Priority Neighborhoods ESD Retrofits 16155 17737 91
8 Private Non-residential ESD Retrofits 14793 16380 90
9 Pet Waste Education - 118 -
(-8
MONTGOMERY COUNTY RURAL WATERSHEDS POLLUTANTS
SENECA - CLOPPER LAKE -
100 Qi
90 iii 80VI to -CQ 70 0 60e 50I 0 40 u l 30
C QJ 20ex
C 10to 0
J 0
$18
$16
$14 n
$12 I
$10 sect $08 ~ $06 0
VI
U $04
$02
$shy
_TPRemoval - - - TMDL Reduction Target
Implementation Phase ___Cost
Rank Restoration Strategy TP
Reduction (Ibsyr)
Incremental Cost (Million $)
Unit Cost (IbsvrMillion $)
1 Residential Education 33 001 6246
2 Underperforming BMP Retrofits 13 004 341 3 Riparian Buffer Reforestation 19 023 99 4 Priority Neighborhood ESD Retrofits 15 051 35 5 Public Property ESD Retrofits 7 075 99
C-9
-pj[fti
MONTGOMERY COUNTY URBAN WATERSHEDS POLLUTANTS 1It[~~JIlbitIL f bull~
LOWER MONOCACY
1 09 08 07 06 05 04 03 02 01
0
Implementation Phase
25
20 ~ c
15 ~ ~
10 - 0 u
5
0
_TSS
- - - Waste load Allocation _Cost
Rank Restoration Strategy
Sediment reduction
Incremental
Cost Unit Cost
tonsyear Million $ tonMilli
1 Street Sweeping 22 $007 3121
2 Underperforming BMP Retrofits 4 $010 389
3 Stream Restoration 37 $734 51
4 Riparian Buffer Reforestation 3 $109 25
5 Other Structural BMPs and ESD Strategies 10 $851 12
6 Priority Neighborhoods ESD Retrofits 2 $160 10
7 Non-residential ESD Retrofits 1 $132 10
C-10
MONTGOMERY COUNTY RURAL WATERSHEDS POLLUTANTS 1tlj~lIbiIalSlt~~II
1 09 08 07 06 05 04 03 02 01
0
$70
$60
$50 ~ c
$40 ~ ~ $30 - UI
$20 0 v
$10
$0
_ Phosphorus Load Reduction
- - - Waste Load Allocation ___ CostImplementation Phase
Rank Restoration Strategy TP Incremental Cost
Million $ Unit Cost
Ibsyr Ibs Million $ 1 Lawn Care Education 3670 01 37394
2 Underperforming BMP Retrofits 3499 08 4338
3 Other Potential Projects 3524 33 1076
4 High Priority Projects 252 04 685
5 Riparian Reforestation 762 26 298
6 Public Property Retrofits 5854 345 169
7 Priority Neighborhoods ESD Retrofits 796 65 123
8 Private Non-residential ESD Retrofits 1941 168 116
9 Completed Projects 53 00 00
c- 11
MONTGOMERY COUNTY RURAL WATERSHEDS POLLUTANTSal12hdJilats ~I~ ~ [ -
1 10 ii 5 09 9 1 08 8 II al- 07 7 1ii o 06 6
c
~ ~ 1 o E IV
05 04 03
5 4
3
~ 11 0 u
0 11 02 2 J o 01 1
t a 0 0 11 o
t 0
_ Phosphorus Reduction
- - - Waste Load Allocation
-Cost
Rank Restoration Strategy TP Incremental Cost
Million $ Unit Cost
Ibsyr Ibs Million $ 1 Lawn Care Education 3670 01 37394
2 Underperforming BMP Retrofits 3499 08 4338
3 Other Potential Projects 3524 33 1076
4 High Priority Projects 252 04 685
5 Riparian Reforestation 762 26 298
6 Public Property Retrofits 5854 345 169
7 Priority Neighborhoods ESD Retrofits 796 65 123
8 Private Non-residential ESD Retrofits 1941 168 116
9 Completed Projects 53 00 00
C-12
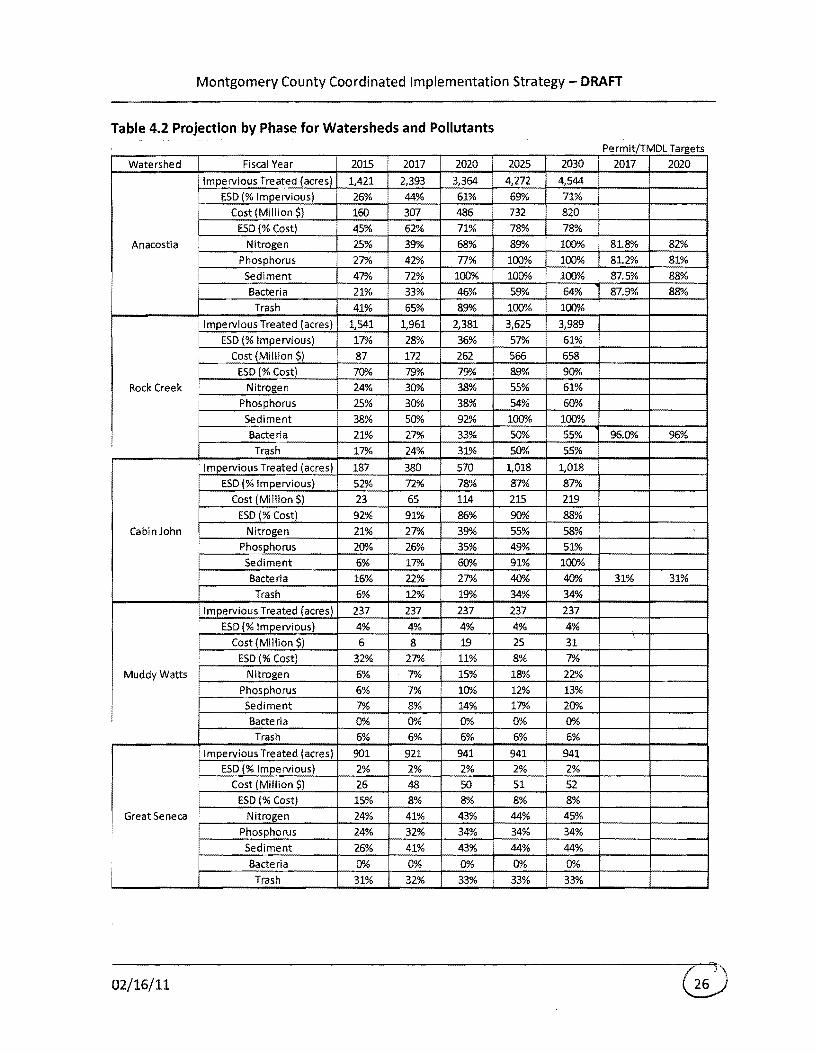
Montgomery County Coordinated Implementation Strategy - DRAFT
Table 42 Projection by Phase for Watersheds and Pollutants PermitTMDL Targets
Watershed Fiscal Year 2015 2017 2020 2025 2030 2017 2020
Impervious Treated (acres) 1421 2393 3364 4272 4544
ESD ( Impervious) 26 44 61 69A 71
Cost (Million $) 160 307 486 732 820
E5D( Cost) 45 62 71 78 78
Anacostia Nitrogen 25 39 68 89A l00A 818 82
Phosphorus 27 42 77 100 100 812 81
i Sediment 47 72 100 l00A) l00A 875 88
Bacteria 21 33 46 59A 64 879 88
Trash 41 65 89 l00A) 100
Impervious Treated (acres) 1541 1961 2381 3625 3989
ESD ( Impervious) 17 28 36 57A 61
Cost (Million $) 87 172 262 566 658
ESD ( Cost) 7(JA 79 79A 89A 9(JA
Rock Creek Nitrogen 24 30 38 55 61
Phosphorus 25 3(JA 38 54 GfJA)
Sediment 38 50 92 l00A 100
Bacteria 21 27 33 5(JA 55 96(JA 96
Trash 17 24 31 5(JA) 55
Impervious Treated (acres) 187 380 570 1018 1018
ESD ( Impervious) 52 72 78 87A 87A
Cost (Million $) 23 65 114 215 219
ESD ( Cost) 92 91 86 90 88
Cabin John Nitrogen 21 27A 39A 55 58 Phosphorus 2(JA 26 35 49 51
Sediment 6 17 GfJA 91 100
Bacteria 16 22 27 4(JA) 40 31 31
Trash 6 12 19 34 34
Impervious Treated (acres) 237 237 237 237 237
ESD ( Impervious) 4 4 4 4 4
Cost (Million $) 6 8 19 25 31
ESD ( Cost) 32 27A 11 8 7
Muddy Watts Nitrogen 6 7 15 18 22
Phosphorus 6 7 10 12 13 Sediment 7 8 14 17 2(JA
Bacteria 0 (JA 0 (JA 0 i Trash 6 6 6 6 6
bull Impervious Treated (acres) 901 921 941 941 941 ESD ( Impervious) 2 2 2 2 2
Cost (Million $) 26 48 SO 51 52 ESD ( Cost) 15 8 8 8 8
Great Seneca Nitrogen 24 41 43 44 45
Phosphorus 24 32 34 34 34
i Sediment 26 41 43 44 44
I Bacteria (JA) 0 0 0 (JA
Trash 31 32 33 33 33
021611
Montgomery County Coordinated Implementation Strategy - DRAFT
Pe rmitTMDL Targets
Watershed Fiscal Year 2015 2017 2020 2025 2030 2017 2020
Clopper
Impervious Treated (acres) 0 6 12 22 22
ESD ( Impervious) 0 86 86 92 92
Cost (Million $) 0 0 1 2 2
ESD ( Cost) 0 72 73 84 84
Nitrogen 61 67 72 79 79
Phosphorus 30 36 41 48 48 45 45
Sediment 0 5 10 17 17
Bacteria 0 0 0 0 0
Trash 0 6 11 18 18
Lower Monocacy
Impervious Treated (acres) 1 16 32 58 58
ESD ( Impervious) 100 85 84 91 91
Cost (Million $) 0 4 11 18 20
ESD ( Cost) 100 85 54 63 58
Nitrogen 0 5 14 22 24
Phosphorus 0 5 16 26 28
Sediment 0 5 46 61 69 608 61
Bacteria 0 6 12 19 19
Trash 0 0 0 0 0
Rocky Gorge
Impervious Treated (acres) 11 88 165 307 307
ESD ( Impervious) 64 89 90 95 95
Cost (Million $) 3 17 40 70 75
ESD ( Cost) 55 82 64 73 68
Nitrogen 47 55 6710 82 85
Phosphorus 17 25 36 52 53 15 15
Sediment 10 19 45 7(J1o 79
Bacteria 14 23 32 47 47
Trash 15 30 46 68 68
Triadelphia
Impervious Treated (acres) 3 12 20 38 38
ESD ( Impervious) 100 98 97 99 99
Cost (Million $) 1 3 5 9 9
ESD ( Cost) 99 98 98 99 99
Nitrogen 24 27 29 34 34
Phosphorus 4 7 9 14 14 15 15
Sediment 1 4 6 12 12
Bacteria 1 4 6 12 12
Trash 2 6 11 21 21
Countywide
Impervious Treated (acres) 4302 6014 7722 10518 11154 6008 7723
ESD ( Impervious) 18 34 47 6(J1o 63
Cost (Million $) 305 622 987 1687 1884
ESD ( Cost) 53 66 7(J1o 8(J1o 80
Nitrogen 18 25 36 46 51 9 2(J1o
Phosphorus 17 23 34 44 46 12 34
Sediment 23 34 54 6(J1o 62 20 37
Bacteria 11 15 20 28 30
Trash 18 26 33 41 42
Assumptio~s
1 Does no~ includerepeated Outreach and Education costs beyond FY2015
2 Does not include ~n inflation multiplier
021611
Montgomery County Coordinated Implementation Strategy - DRAFT
Summary of Individual Implementation Plans
A summary of the general considerations and prioritization for each watershed implementation
plan is provided below
Anacostia - For the first permit cycle (through 2015) a priority was placed on full
implementation of completed high and low priority projects Next implementation of a third
of the other potential projects was targeted as a large number of these were identified in
conjunction with the USACEs Anacostia Watershed Restoration Plan efforts ESD was
emphasized on both public (10) and private property (10) Finally outreach (25) and
stream restoration (12) are targeted for pollutant load reduction but are not credited towards
impervious cover credit In future permit cycles the remainder of the other potential projects
are targeted along with ESD and a limited amount of riparian reforestation for impervious cover
and pollutant load reduction Outreach and stream restoration are significant strategies
pursued for load reduction benefits Nutrient and sediment MS4 permit area WLAs are met by
2030 but bacteria load reduction does not meet MS4 permit area WLA compliance The
remaining bacteria reduction is believed to be associated with urban wildlife sources Unless
intense urban wildlife management practices are implemented this remaining load reduction
will not be possible
Rock Creek- For the first permit cycle (through 2015) a priority was placed on full
implementation of complete high and low priority projects Next 25 implementation of
other potential projects was targeted ESD was emphasized on both public (10) and private
property (10) with private property implementation being linked to Rainscapes Program
success Finally outreach (100) and stream restoration (22) are targeted for pollutant load
reduction but are not credited towards impervious cover credit In future permit cycles the
remainder of the other potential projects are targeted along with ESD and riparian
reforestation for impervious cover and pollutant load reduction Stream restoration is a
significant strategy pursued for load reduction benefits The bacterial load reduction does not
meet MS4 permit area WLA compliance However the remaining bacterial load is believed to
be associated with urban wildlife sources Unless intense urban wildlife management practices
are implemented this remaining load reduction will not be possible
Cabin John Creek - Similar to the other two more urban watersheds in the County during the
first permit cycle (through 2015) a priority was placed on full implementation of complete high
and low priority projects Fewer opportunities exist overall compared to the Anacostia and Rock
Creek Next 25 implementation of other potential projects was targeted ESD was
emphasized on both public (10) and private property (10) Finally outreach (100) was
021611
Montgomery County Coordinated Implementation Strategy - DRAFT
targeted for pollutant load reduction but not credited towards impervious cover credit No
riparian reforestation or stream restoration was targeted due to limited or no opportunities In
future permit cycles the remainder of the other potential projects are targeted along with ESD
and some riparian reforestation for impervious cover and pollutant load reduction The
bacteria load reduction meets MS4 permit area WLA compliance by 2025
Muddy BranchWatts Branch - During the first permit cycle (through 2015) a priority was
placed on full implementation of complete high and low priority projects Fewer opportunities
exist overall compared to the Anacostia and Rock Creek Watersheds No other strategies were
pursued as there are no existing TMDLs in the Muddy BranchWatts Branch subwatersheds In
future permit cycles previously identified stream restoration projects are implemented for
pollutant load reduction
Great Seneca Creek - This watershed implementation plan is unique in that it includes the small
Clopper Lake subwatershed which has a TMDL for phosphorus Even with the TMDL there are
limited identified opportunities to pursue in the Clopper Lake subwatershed in part due to the
limited area of the subwatershed within the County MS4 permit area During the first permit
cycle (through 2015) a priority was placed on full implementation of complete high and low
priority projects within Great Seneca Creek subwatershed No opportunities exist for these
strategies in Clopper Lake However full outreach was applied in Clopper Lake in the first
permit cycle In future years other potential projects ESD on public and private property and a
small amount of riparian reforestation (in Clopper Lake) is pursued The Clopper Lake WLA for
phosphorus within the MS4 permit area is met
Patuxent - During the first permit cycle through 2015 a priority was placed on full
implementation of complete high and low priority projects Far fewer opportunities exist
overall compared to the Anacostia and Rock Creek A limited amount of ESD on private land
and stream restoration was pursued Finally outreach (100) was targeted for pollutant load
reduction (primarily nutrients) but not credited towards impervious cover credit No riparian
reforestation was targeted within the MS4 Permit area due to cost effectiveness in the Rocky
Gorge subwatershed and limited opportunities in the Triadelphia subwatershed In future
permit cycles ESD on private and public land is pursued more substantially as is stream
restoration A limited amount of riparian reforestation achieves some impervious cover and
pollutant load reduction The Rocky Gorge phosphorus WLA within the MS4 permit area is met
easily and the Tridelphia phosphorus WLA is also met but with a longer timeframe needed for
compliance
021611
Montgomery County Coordinated Implementation Strategy - DRAFT
Lower Monocacy Creek -lower Monocacy Creek is the most rural watershed in the County and
has the least amount of area subject to the County MS4 permit In addition there are no preshy
identified restoration projects within the watershed Therefore during the first permit cycle
(through 2015) only a very small amount (5) of private property ESD is pursued It is not until
the second permit cycle that more focus is placed on private and public ESD as well as stream
restoration and programmatic strategies such as street sweeping to target sediment loads
associated with the TM Dl In future permit cycles stream restoration is pursued for pollutant
load reduction The sediment WlA within the MS4 permit area is projected to be met around
2025
Countywide - The Countywide effort was driven by impervious cover treatment targets and
Chesapeake Bay TMDl2017 and 2020 reduction targets associated with sediment and nutrients
for urban MS4s For impervious cover it was assumed that a 20 target would be required for
each five-year permit cycle The Bay TMDl targets for urban MS4 areas were easily met for all
pollutants in 2017 and easily met for nitrogen and sediment but more difficult to meet for
phosphorus in 2020
Public Outreach and Stewardship
The County recognizes and is committed to the increasingly important role that public outreach
and stewardship will play if improved water quality conditions are going to be achieved
countywide While the County currently has a very active and layered outreach program the
model requires changes that will result in broader stakeholder groups serving as the leaders
and primary champions for clean water in their communities This includes greater participation
from minority and faith-based groups business consortiums schools neighborhood
associations and civic groups Additionally the new model requires revisiting current
initiatives carried out by the various County agencies to look for better and more efficient ways
to communicate messages cross-train and create synergies that result in greater engagement
greater awareness and sustained changes in behavior
Within each implementation plan specific suggestions for outreach and education
opportunities are identified In addition Appendix E of this Strategy contains practice sheets
which highlight targeted restoration activities for the County to develop and refine A total of
eight practices have been identified that can be adopted countywide or in more targeted
watershed areas where there are specific water quality issues to address Many of the
practices build upon existing County programs but require a much broader reach to new
partner groups Program start up costs are suggested and were used to for cost estimates
associated with Countywide strategy The highlighted practices include
021611
Montgomery County Coordinated Implementation Strategy - DRAFT
bull Pet Waste Pickup Education and Outreach Campaign
bull Lawn Stewardship Education and Outreach Campaign
bull Anti-littering Education and Outreach Campaign
bull Innovative Stormwater Management Awareness Campaign
bull Stream Stewards Education and Outreach Campaign
bull Riparian Reforestation Education and Outreach Campaign
bull Roof Runoff Reduction Education and Outreach Campaign
bull Parking Lot Recharge Value Education and Outreach Campaign
Start up costs by practice along with an overall five year cost estimate are provided in Table
43 Start up timeframes are assumed to be up to 18 months
Table 43 Outreach Start Up and 5-Year Cost Projections
Practice Practice Start Up Cost
Pet Waste Pickup $240500
Lawn Stewardship $301 600
Anti-Littering $175050
Stormwater Management Improvements Awareness $50450
Stream Stewards $74825
Riparian Reforestation $30575
Roof Runoff Reduction $101400
Parking Lot Recharge Value $41500
Estimated Start Up Total $744900
5-Year Outreach Budget Projection $2650000
These eight practice sheets provide specific costs and timelines for implementation They also
provide suggestions for measuring program success These practice sheets along with the
specific recommendations in the implementation plans make up the Public Outreach and
Education Campaign
Trash Reduction
Most of the implementation plans have to address trash loadings to meet requirements of the
Potomac Trash Treaty that is referenced in the County1s MS4 Permit In addition the Anacostia
Trash TMDL has recently been accepted by MDE and the EPA According to the Anacostia
021611
Montgomery County Coordinated Implementation Strategy - DRAFT
TMDl there is reasonable assurance that the goals of the Treaty and TMDl can be met with
proper watershed planning implementing pollution-reduction BMPs and using strong political
and financial mechanisms
Currently the County has a number of activities which target trash reduction They include the
following
bull Adopt-a-Road Program through DOT which focuses on public awareness and involvement in trash management There are 205 participants who adopted road segments and agreed to six major road cleanups per year
bull Storm Drain Marking through DOT bull Support for illegal dumping enforcement outreach and research and monitoring bull Partnership with DOT to conduct street sweeping covering about 2500 curb miles and
occurring once a year
bull Partnership with the Park Police to monitor illegal dumping which combined enforces 300-400 actions a year
bull Non-residential and residential recycling programs through Solid Waste Services (SWS) bull Transit stop trash management program at 600 bus stops countywide supported by DOT
Transit Services
In addition to continuing these efforts a number of trash good-housekeeping efforts have been
proposed as part of this Strategy A detailed description of the quantitative methods and
strategies applied can be found in Appendix E of the Guidance Document In general the
following six trash-reduction strategies are recommended
1 Significantly increase funding for trash reduction programs 2 Create and enhance regional partnerships and coordination among businesses
environmental groups individual citizens and government at all levels and in all jurisdictions
3 Improve peoples awareness knowledge and behavior relating to littering and illegal dumping
4 Promote the greater introduction and use of effective trash-reduction technologies and approaches
5 Improve enactment and enforcement of laws to reduce trash 6 Increase trash monitoring-related data collection generation and dissemination efforts
The Anacostia watershed implementation plan provides an outline of the actions that will be
taken through the first permit cycle to reduce trash The range of programs and practices
specially aimed at reducing trash inputs to roads and streams that will be targeted include
reduce reuse and recycle campaigns littering and illegal dumping enforcement stream
cleanups and street sweeping These measures are in addition to any trash trapped and
021611
Montgomery County Coordinated Implementation Strategy - DRAFT
removed by structural practices which are computed using the WTM The plan shows that the
trash TMDl can be met by 2025 at a cost of 732 million dollars
Adaptive Management Monitoring and Reporting
Sound implementation strategies require assessment and effective adaptation to respond to
new information changing conditions new technologies and lessons learned This will be the
basis of the plan that will be used when benchmarks are not met and the projected funding is
inadequate
Adaptive management requires monitoring of a variety of measures that can be used to
determine whether progress is being made towards meeting the Countywide water quality
objectives Ultimately it is the instream water quality and the loading limits with respect to the
TMDls that determine the success of implementation however there are many interim
measures that can also be correlated to success which are worthwhile pursuing
Surface water monitoring can be an expensive and time consuming undertaking Montgomery
County is fortunate to have an extensive Countywide stream monitoring network that can serve
as a foundation for providing spatial and temporal data to indicate stream health The Countys
MS4 Permit also outlines the required assessment of controls which includes chemical
biological and physical monitoring Specifically the permit calls for the County to continue
their watershed restoration monitoring of the lower Paint Branch subwatershed and physical
monitoring ofthe Clarksburg Special Protection area In addition to the existing monitoring
network the County will continue tracking and data reporting associated with levels of
implementation (eg acres of impervious cover treated areas of buffer planted miles of
stream restored miles of streets swept) For measuring effectiveness of outreach and
stewardship efforts other types of monitoring and reporting are planned that include before
and after attitude surveys frequency of website visits and information requests
For many restoration strategies it may be difficult to tease out their individual effectiveness in
terms of pollutant load reductions but collectively the monitoring that occurs should provide
adequate insight into the overall effectiveness of a layered implementation strategy
In addition to the monitoring and assessment the County will be reporting results on an annual
basis as part of their NPDES MS4 Permit annual report The MS4 Permit requires annual
reporting of the following
021611
Montgomery County Coordinated Implementation Strategy - DRAFT
bull The status of implementing the components of the stormwater management program
that are established as permit conditions
bull A narrative summary describing the results and analyses of data including monitoring
data that is accumulated throughout the reporting year
bull Expenditures for the reporting period and the proposed budget for the upcoming year
bull A summary describing the number and nature of enforcement actions inspections and
public education programs
bull The identification of water quality improvements and documentation of progress
toward meeting applicable WLAs developed under EPA approved TMDLs and
bull The identification of any proposed changes to the Countys program when WLAs are not
being met
The County will build upon annual reporting that has historically occurred to meet permit
requirements and will supplement this reporting with tracking table summaries that quantify
implementation activities for the range of strategies pursued during that year and the
associated treatment (eg impervious cover treated pollutant load reduced education and
outreach partners established etc) Cost will also be tracked in association with rates of
implementation This level of performance will then be compared with countywide strategy
targets (eg progress towards meeting WLAs) associated with key performance dates such as
those presented in Table 41 The level of progress achieved by the County will then feed into
the adaptive management approach described above
Organization Needs to Implement Strategy
Montgomery County DEP staff possesses substantial expertise and institutional knowledge that
yields many positive outcomes and efficient processes under the current pace of restoration
and permit compliance activities Under this strategy however the pace of implementation is
required to significantly increase Based on an increase in the level of implementation it is
reasonable to assume that additional capacity may be needed to provide sufficient oversight
and management of all the projects
Another critical element of this strategy is the recognition and commitment to pursuing
outreach initiatives that build community capacity by targeting new partner groups that
provide the necessary leadership oversight and sustained effort to change behaviors and
foster stewardship The County currently carries out many well established and managed
outreach programs but it may require additional focus across County agencies and
departments for these partnerships to become established and thrive
021611 G
Montgomery County Coordinated Implementation Strategy - DRAFT
Through the implementation process and the monitoring and reporting that is required large
amounts of data will be generated Technological advances happen so rapidly in this day and
age it will be important for the County to stay current with technology and methods so that
more efficient and cost-effective data management and reporting will be possible The County
currently relies on a detailed and sophisticated GIS to spatially locate projects and manage
tables of data related to projects The growth and development of this spatial database will be
a critical component of the reporting and tracking capability of the County These databases
generate the input data that are used to measure progress towards baseline loading targets
Regular review and upkeep of the data as well as routine summarization of progress (annually
at a minimum) will likely require additional dedication of staff This is especially the case during
periods where the implementation rate of structural practices in the ground is accelerated
021611
Montgomery County Coordinated Implementation Strategy - DRAFT
Appendix C - Restoration Potential by Watershed
021611
c-
04 03 02 01
a
_ Nitrogen Load Reduction
--shy TMDL WLA Target
_Cost
MONTGOMERY COUNTY URBAN WATERSHEDS POLLUTANTS _Bk)~Ibilats ~1~ l~ fjfsi --
Rank
1
2
3
4
5
6
7
8
9
10
11
Restoration Strategy TN reduction
Ibsyr
Pet Waste Education 15169
Retrofit of Underperforming BMPs 1769
Stream Restoration 72423
Completed Projects ~43 High Priority Projects 3260
Other Potential Projects 43276
Habitat Restoration 224
Public Property ESD Retrofits 18270
Priority Neighborhoods ESD Retrofits 9271
Private Non-residential ESD Retrofits 5594
Street Sweeping -
Incremental Cost Unit Cost
Million $ IbsMillion $ 088 17193
120 1475
9304 778
948 701
635 513
25430 170
141 158
23655 77
13278 70
8018 70
124 -
Qj c
Qj
nI CXI
o -f-
1 09 08 07 06 05
$900 $800 $700
~ $600 c $500 ~ $400 $300 0 u $200 $100
$shy
~~mf il_~IJrt~
MONTGOMERY COUNTY URBAN WATERSHEDS POLLUTANTS ItfiQ14lbilJts i~5 [i
1 $900 Qj
09 $8005 iii en 08 $700
~co 07 $600 co - til
06 $500 ~ 05- $400 ~ 04 en$300 003 u $20002
en $100I 01 o 0 $shys Q en o
s Q
Phosphorus Load Reduction
--- TMDL WLA Target
__Cost
I Rank I
1
2
3
4
5
6
7
8
9
Restoration Strategy
Pet Waste Education
Retrofit of Underperforming BMPs
Stream Restoration
Completed Projects
High Priority Projects
Habitat Restoration
Other Potential Projects
Public Property ESD Retrofits
Priority Neighborhoods ESD Retrofits
10 I Private Non-residential ESD Retrofits
11 Street Sweeping
TP reduction Incremental Cost Unit Cost
Ibsyr Million $ IbsMillion $ 1979 088 2243
247 120 206
13097 9304 141
915 948 96
451 635 71
37 141 26
6067 25430 24
2546 23655 11
1294 13278 10
781 8018 10
- 124 -
MONTGOMERY COUNTY URBAN WATERSHEDS POLLUTANTS IItQjQhabillt$middot
Cii 5 Cii 11 It CD
6 ~ r o ~ s
0 ltIIa r ltII e c ltII III
1 09 08 07 06 05 04 03 02 01
0
$900
$800 $700
v$600 r
0 $500 == $400 $300 11
0 u $200 $100
$shy
_ Sediment load Reduction
--- TMDl WlA Target
__Cost
Rank Restoration Strategy
Sediment reduction
Incremental Cost
Unit Cost
tonsyr Million $ tonsMillion $ 1 Street Sweeping 800 124 645
2 Stream Restoration 25057 9304 269
3 Retrofit of Underperforming BMPs 25 120 21
4 Completed Projects 97 948 10
5 High Priority Projects 47 635 7
6 Other Potential Projects 660 25430 3
7 I Public Property ESD Retrofits 272 23655 1
8 Priority Neighborhoods ESD Retrofits 139 13278 1
9 Private Non-residential ESD Retrofits 84 8018 1
10 Habitat Restoration 2 141 1
11 Pet Waste Education - 088 -
C-3
MONTGOMERY COUNTY URBAN WATERSHEDS POLLUTANTS
-QI5 5i ~
1 09 08 07 06 05 04 03 02 01
0
$900
$800
$700
$600 ~ 0
$500 == $400 $300 11
0 u $200
$100
$shy
--shy TMDL WLA Target
___ Cost
Rank Restoration Strategy
Enterrococci reduction
Incremental Cost
Unit Cost
Billion MPNyr Million $ Billion MPN Million $
1 Pet Waste Education 19643 088 22263
2 Retrofit of Underperforming BMPs 2781 120 2318
3 Completed Projects 10441 948 1101
4 High Priority Projects 5120 635 806
5 Other Potential Projects 69895 25430 275
6 Riparian Reforestation 310 141 219
7 Public Property ESD Retrofits 29025 23655 123
8 Priority Neighborhoods ESD Retrofits 14777 13278 111
9 Private Non-residential ESD Retrofits 8917 8018 111
10 Stream Restoration - 9304 -
11 Street Sweeping - 124 I -
~ I~~~i MONTGOMERY COUNTY URBAN WATERSHEDS POLLUTANTS 1tI2~mL ~ I~I
~$ I -~-- I
100 90 80 70 60 50 40 30 20 10
0
$900 $800 $700 $600 $500 $400 $300 $200 $100 $shy
vi c
~ 5 11 0 u
Implementation Phase
Potential Trash Incremental Unit Cost
I
Rank Restoration Strategy Reduction Cost
Ibsyear Million $ IbsMillion $ 1 Recycling Education and Investigations 51654 02 238837
2 Plastic Bag Ban and Misc Enforcement 63546 13 48882
3 Anti-litter Campaign Education 23J61 09 26930
4 Retrofit of Underperforming BMPs 1144 12 954
5 Completed Projects 6598 95 696
6 High Priority Projects 2786 64 439
7 Other Potential Projects 56341 2543 222
8 Habitat Restoration 266 14 188
9 Street Sweeping 204 12 164
10 Public Property ESD Retrofits 25348 2366 107
11 Priority lIeighborhoods ESD Retrofits 12529 1328 94
12 Private Non-residential ESD Retrofits 7547 802 94 ru Stream Restoration - 930 -14 Pet Waste Education - 09 -
C-5
MONTGOMERY COUNTY URBAN WATERSHEDS POLLUTANTS
CABIN JOHN
1 250
__CostImplementation Phase
09 08 07 06 05 04 03 02 01
0
200 ~ c
150 g E
100 - ltII 0 u
50
0
_E Coli
- - - Waste Load Allocation
Rank Restoration Strategy
E coli reduction
Incremental Cost
Unit Cost
Billion
MPNyr Million $
Billion MPN
Million $ 1 Pet Waste Education 4388 $05 9436
2 Underperforming BMP Retrofits 1892 $19 1022
3 High Priority Projects 1289 $16 800
4 Riparian Reforestation 1133 $78 146
5 Other Potential Projects 148 $17 86
6 Public Property ESD Retrofits 4AOO $860 Sl 7 Private Non-residential ESD Retrofits 1618 $392 41
8 Priority Neighborhoods ESD Retrofits 2633 $638 41
9 Completed Projects 112 $00 0
C-6
MONTGOMERY COUNTY URBAN WATERSHEDS POLLUTANTS 1Itf~~Jabitm
ROCK CREEK
1 $700 Qj5 09
o
_
$600 Qj 08
111 $500 ~ampl 07 c
t5 06 $400 ~ e 05 ~ $3005 04 - 111tl 03 $200 0 u-6 02
$100J 01 $-
Enterrococci
- - - Waste load Allocation Implementation Phase
__Cost
Rank Restoration Strategy
Enterrococci reduction
Incremental Cost
Unit Cost
Billion MPNyr Million $ Billion MPN Million $
Et Pet Waste Management 35734 118 30190
Underperforming BMP Upgrades
Other Potential Projects
28800
30239
577
1083
4995
2792
4 Completed Projects 12131 444 2734
5 High Priority Projects 14239 890 1600
6 Riparian Reforestation 18999 2384 797
7 County Property ESD Retrofits 54519 24136 226
8 Private Residential ESD Retrofits 35230 17737 199
9 Private Non-residential ESD Retrofits 32A86 16380 198
C-7
MONTGOMERY COUNTY URBAN WATERSHEDS POLLUTANTS _f~~pabitafS (fi~r ~~ l-middotshy
ROCK CREEK
100 $900 90 $800 80 $700 u70 $600 c 60 2$50050 -~$40040
lt1$300 030 $200 u
20 10 $100
0 $shy
Implementation Phase
Rank Restoration Strategy Trash Reduction
Incremental Cost
Unit Cost I
Ibsyear Million $ IbsMillion $ 1 Other Potential Projects 16038 1085 1478
2 Underperforming BMP Upgrades 6756 577 1172
3 Completed Projects 4217 444 950
4 High Priority Projects 6366 890 715
5 Riparian Reforestation 9237 2384 387
6 Public Property ESD Retrofits 24587 24136 102
7 Priority Neighborhoods ESD Retrofits 16155 17737 91
8 Private Non-residential ESD Retrofits 14793 16380 90
9 Pet Waste Education - 118 -
(-8
MONTGOMERY COUNTY RURAL WATERSHEDS POLLUTANTS
SENECA - CLOPPER LAKE -
100 Qi
90 iii 80VI to -CQ 70 0 60e 50I 0 40 u l 30
C QJ 20ex
C 10to 0
J 0
$18
$16
$14 n
$12 I
$10 sect $08 ~ $06 0
VI
U $04
$02
$shy
_TPRemoval - - - TMDL Reduction Target
Implementation Phase ___Cost
Rank Restoration Strategy TP
Reduction (Ibsyr)
Incremental Cost (Million $)
Unit Cost (IbsvrMillion $)
1 Residential Education 33 001 6246
2 Underperforming BMP Retrofits 13 004 341 3 Riparian Buffer Reforestation 19 023 99 4 Priority Neighborhood ESD Retrofits 15 051 35 5 Public Property ESD Retrofits 7 075 99
C-9
-pj[fti
MONTGOMERY COUNTY URBAN WATERSHEDS POLLUTANTS 1It[~~JIlbitIL f bull~
LOWER MONOCACY
1 09 08 07 06 05 04 03 02 01
0
Implementation Phase
25
20 ~ c
15 ~ ~
10 - 0 u
5
0
_TSS
- - - Waste load Allocation _Cost
Rank Restoration Strategy
Sediment reduction
Incremental
Cost Unit Cost
tonsyear Million $ tonMilli
1 Street Sweeping 22 $007 3121
2 Underperforming BMP Retrofits 4 $010 389
3 Stream Restoration 37 $734 51
4 Riparian Buffer Reforestation 3 $109 25
5 Other Structural BMPs and ESD Strategies 10 $851 12
6 Priority Neighborhoods ESD Retrofits 2 $160 10
7 Non-residential ESD Retrofits 1 $132 10
C-10
MONTGOMERY COUNTY RURAL WATERSHEDS POLLUTANTS 1tlj~lIbiIalSlt~~II
1 09 08 07 06 05 04 03 02 01
0
$70
$60
$50 ~ c
$40 ~ ~ $30 - UI
$20 0 v
$10
$0
_ Phosphorus Load Reduction
- - - Waste Load Allocation ___ CostImplementation Phase
Rank Restoration Strategy TP Incremental Cost
Million $ Unit Cost
Ibsyr Ibs Million $ 1 Lawn Care Education 3670 01 37394
2 Underperforming BMP Retrofits 3499 08 4338
3 Other Potential Projects 3524 33 1076
4 High Priority Projects 252 04 685
5 Riparian Reforestation 762 26 298
6 Public Property Retrofits 5854 345 169
7 Priority Neighborhoods ESD Retrofits 796 65 123
8 Private Non-residential ESD Retrofits 1941 168 116
9 Completed Projects 53 00 00
c- 11
MONTGOMERY COUNTY RURAL WATERSHEDS POLLUTANTSal12hdJilats ~I~ ~ [ -
1 10 ii 5 09 9 1 08 8 II al- 07 7 1ii o 06 6
c
~ ~ 1 o E IV
05 04 03
5 4
3
~ 11 0 u
0 11 02 2 J o 01 1
t a 0 0 11 o
t 0
_ Phosphorus Reduction
- - - Waste Load Allocation
-Cost
Rank Restoration Strategy TP Incremental Cost
Million $ Unit Cost
Ibsyr Ibs Million $ 1 Lawn Care Education 3670 01 37394
2 Underperforming BMP Retrofits 3499 08 4338
3 Other Potential Projects 3524 33 1076
4 High Priority Projects 252 04 685
5 Riparian Reforestation 762 26 298
6 Public Property Retrofits 5854 345 169
7 Priority Neighborhoods ESD Retrofits 796 65 123
8 Private Non-residential ESD Retrofits 1941 168 116
9 Completed Projects 53 00 00
C-12
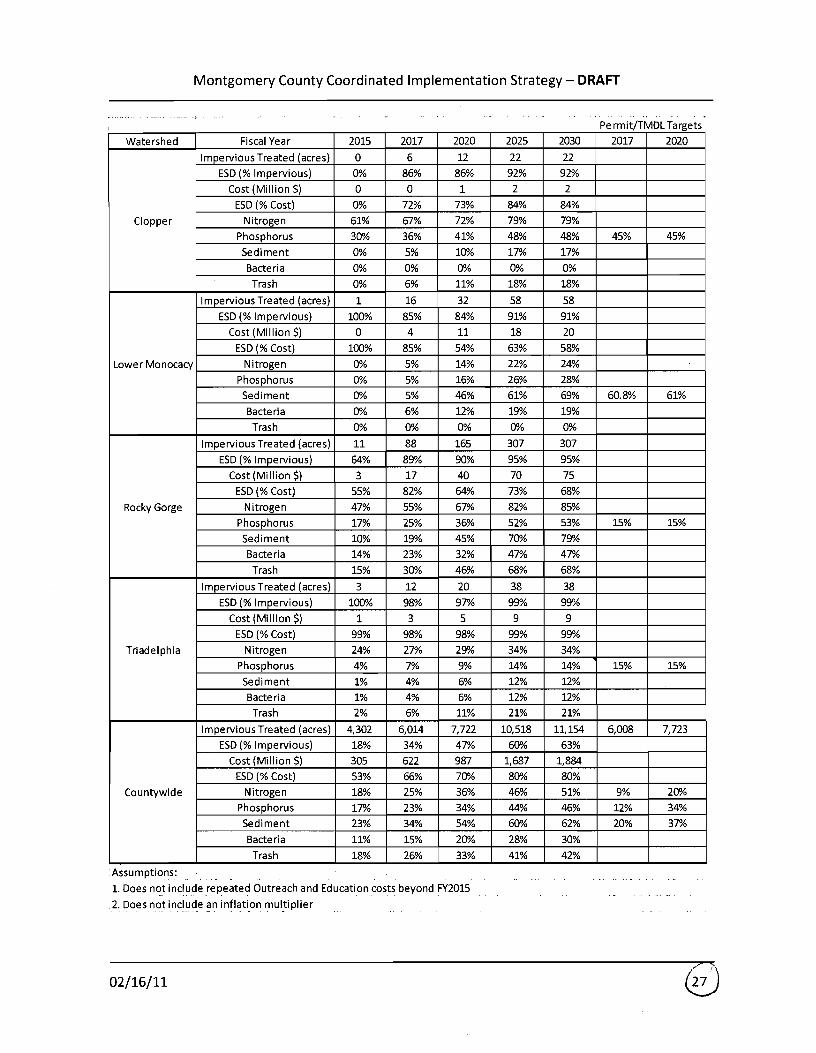
Montgomery County Coordinated Implementation Strategy - DRAFT
Summary of Individual Implementation Plans
A summary of the general considerations and prioritization for each watershed implementation
plan is provided below
Anacostia - For the first permit cycle (through 2015) a priority was placed on full
implementation of completed high and low priority projects Next implementation of a third
of the other potential projects was targeted as a large number of these were identified in
conjunction with the USACEs Anacostia Watershed Restoration Plan efforts ESD was
emphasized on both public (10) and private property (10) Finally outreach (25) and
stream restoration (12) are targeted for pollutant load reduction but are not credited towards
impervious cover credit In future permit cycles the remainder of the other potential projects
are targeted along with ESD and a limited amount of riparian reforestation for impervious cover
and pollutant load reduction Outreach and stream restoration are significant strategies
pursued for load reduction benefits Nutrient and sediment MS4 permit area WLAs are met by
2030 but bacteria load reduction does not meet MS4 permit area WLA compliance The
remaining bacteria reduction is believed to be associated with urban wildlife sources Unless
intense urban wildlife management practices are implemented this remaining load reduction
will not be possible
Rock Creek- For the first permit cycle (through 2015) a priority was placed on full
implementation of complete high and low priority projects Next 25 implementation of
other potential projects was targeted ESD was emphasized on both public (10) and private
property (10) with private property implementation being linked to Rainscapes Program
success Finally outreach (100) and stream restoration (22) are targeted for pollutant load
reduction but are not credited towards impervious cover credit In future permit cycles the
remainder of the other potential projects are targeted along with ESD and riparian
reforestation for impervious cover and pollutant load reduction Stream restoration is a
significant strategy pursued for load reduction benefits The bacterial load reduction does not
meet MS4 permit area WLA compliance However the remaining bacterial load is believed to
be associated with urban wildlife sources Unless intense urban wildlife management practices
are implemented this remaining load reduction will not be possible
Cabin John Creek - Similar to the other two more urban watersheds in the County during the
first permit cycle (through 2015) a priority was placed on full implementation of complete high
and low priority projects Fewer opportunities exist overall compared to the Anacostia and Rock
Creek Next 25 implementation of other potential projects was targeted ESD was
emphasized on both public (10) and private property (10) Finally outreach (100) was
021611
Montgomery County Coordinated Implementation Strategy - DRAFT
targeted for pollutant load reduction but not credited towards impervious cover credit No
riparian reforestation or stream restoration was targeted due to limited or no opportunities In
future permit cycles the remainder of the other potential projects are targeted along with ESD
and some riparian reforestation for impervious cover and pollutant load reduction The
bacteria load reduction meets MS4 permit area WLA compliance by 2025
Muddy BranchWatts Branch - During the first permit cycle (through 2015) a priority was
placed on full implementation of complete high and low priority projects Fewer opportunities
exist overall compared to the Anacostia and Rock Creek Watersheds No other strategies were
pursued as there are no existing TMDLs in the Muddy BranchWatts Branch subwatersheds In
future permit cycles previously identified stream restoration projects are implemented for
pollutant load reduction
Great Seneca Creek - This watershed implementation plan is unique in that it includes the small
Clopper Lake subwatershed which has a TMDL for phosphorus Even with the TMDL there are
limited identified opportunities to pursue in the Clopper Lake subwatershed in part due to the
limited area of the subwatershed within the County MS4 permit area During the first permit
cycle (through 2015) a priority was placed on full implementation of complete high and low
priority projects within Great Seneca Creek subwatershed No opportunities exist for these
strategies in Clopper Lake However full outreach was applied in Clopper Lake in the first
permit cycle In future years other potential projects ESD on public and private property and a
small amount of riparian reforestation (in Clopper Lake) is pursued The Clopper Lake WLA for
phosphorus within the MS4 permit area is met
Patuxent - During the first permit cycle through 2015 a priority was placed on full
implementation of complete high and low priority projects Far fewer opportunities exist
overall compared to the Anacostia and Rock Creek A limited amount of ESD on private land
and stream restoration was pursued Finally outreach (100) was targeted for pollutant load
reduction (primarily nutrients) but not credited towards impervious cover credit No riparian
reforestation was targeted within the MS4 Permit area due to cost effectiveness in the Rocky
Gorge subwatershed and limited opportunities in the Triadelphia subwatershed In future
permit cycles ESD on private and public land is pursued more substantially as is stream
restoration A limited amount of riparian reforestation achieves some impervious cover and
pollutant load reduction The Rocky Gorge phosphorus WLA within the MS4 permit area is met
easily and the Tridelphia phosphorus WLA is also met but with a longer timeframe needed for
compliance
021611
Montgomery County Coordinated Implementation Strategy - DRAFT
Lower Monocacy Creek -lower Monocacy Creek is the most rural watershed in the County and
has the least amount of area subject to the County MS4 permit In addition there are no preshy
identified restoration projects within the watershed Therefore during the first permit cycle
(through 2015) only a very small amount (5) of private property ESD is pursued It is not until
the second permit cycle that more focus is placed on private and public ESD as well as stream
restoration and programmatic strategies such as street sweeping to target sediment loads
associated with the TM Dl In future permit cycles stream restoration is pursued for pollutant
load reduction The sediment WlA within the MS4 permit area is projected to be met around
2025
Countywide - The Countywide effort was driven by impervious cover treatment targets and
Chesapeake Bay TMDl2017 and 2020 reduction targets associated with sediment and nutrients
for urban MS4s For impervious cover it was assumed that a 20 target would be required for
each five-year permit cycle The Bay TMDl targets for urban MS4 areas were easily met for all
pollutants in 2017 and easily met for nitrogen and sediment but more difficult to meet for
phosphorus in 2020
Public Outreach and Stewardship
The County recognizes and is committed to the increasingly important role that public outreach
and stewardship will play if improved water quality conditions are going to be achieved
countywide While the County currently has a very active and layered outreach program the
model requires changes that will result in broader stakeholder groups serving as the leaders
and primary champions for clean water in their communities This includes greater participation
from minority and faith-based groups business consortiums schools neighborhood
associations and civic groups Additionally the new model requires revisiting current
initiatives carried out by the various County agencies to look for better and more efficient ways
to communicate messages cross-train and create synergies that result in greater engagement
greater awareness and sustained changes in behavior
Within each implementation plan specific suggestions for outreach and education
opportunities are identified In addition Appendix E of this Strategy contains practice sheets
which highlight targeted restoration activities for the County to develop and refine A total of
eight practices have been identified that can be adopted countywide or in more targeted
watershed areas where there are specific water quality issues to address Many of the
practices build upon existing County programs but require a much broader reach to new
partner groups Program start up costs are suggested and were used to for cost estimates
associated with Countywide strategy The highlighted practices include
021611
Montgomery County Coordinated Implementation Strategy - DRAFT
bull Pet Waste Pickup Education and Outreach Campaign
bull Lawn Stewardship Education and Outreach Campaign
bull Anti-littering Education and Outreach Campaign
bull Innovative Stormwater Management Awareness Campaign
bull Stream Stewards Education and Outreach Campaign
bull Riparian Reforestation Education and Outreach Campaign
bull Roof Runoff Reduction Education and Outreach Campaign
bull Parking Lot Recharge Value Education and Outreach Campaign
Start up costs by practice along with an overall five year cost estimate are provided in Table
43 Start up timeframes are assumed to be up to 18 months
Table 43 Outreach Start Up and 5-Year Cost Projections
Practice Practice Start Up Cost
Pet Waste Pickup $240500
Lawn Stewardship $301 600
Anti-Littering $175050
Stormwater Management Improvements Awareness $50450
Stream Stewards $74825
Riparian Reforestation $30575
Roof Runoff Reduction $101400
Parking Lot Recharge Value $41500
Estimated Start Up Total $744900
5-Year Outreach Budget Projection $2650000
These eight practice sheets provide specific costs and timelines for implementation They also
provide suggestions for measuring program success These practice sheets along with the
specific recommendations in the implementation plans make up the Public Outreach and
Education Campaign
Trash Reduction
Most of the implementation plans have to address trash loadings to meet requirements of the
Potomac Trash Treaty that is referenced in the County1s MS4 Permit In addition the Anacostia
Trash TMDL has recently been accepted by MDE and the EPA According to the Anacostia
021611
Montgomery County Coordinated Implementation Strategy - DRAFT
TMDl there is reasonable assurance that the goals of the Treaty and TMDl can be met with
proper watershed planning implementing pollution-reduction BMPs and using strong political
and financial mechanisms
Currently the County has a number of activities which target trash reduction They include the
following
bull Adopt-a-Road Program through DOT which focuses on public awareness and involvement in trash management There are 205 participants who adopted road segments and agreed to six major road cleanups per year
bull Storm Drain Marking through DOT bull Support for illegal dumping enforcement outreach and research and monitoring bull Partnership with DOT to conduct street sweeping covering about 2500 curb miles and
occurring once a year
bull Partnership with the Park Police to monitor illegal dumping which combined enforces 300-400 actions a year
bull Non-residential and residential recycling programs through Solid Waste Services (SWS) bull Transit stop trash management program at 600 bus stops countywide supported by DOT
Transit Services
In addition to continuing these efforts a number of trash good-housekeeping efforts have been
proposed as part of this Strategy A detailed description of the quantitative methods and
strategies applied can be found in Appendix E of the Guidance Document In general the
following six trash-reduction strategies are recommended
1 Significantly increase funding for trash reduction programs 2 Create and enhance regional partnerships and coordination among businesses
environmental groups individual citizens and government at all levels and in all jurisdictions
3 Improve peoples awareness knowledge and behavior relating to littering and illegal dumping
4 Promote the greater introduction and use of effective trash-reduction technologies and approaches
5 Improve enactment and enforcement of laws to reduce trash 6 Increase trash monitoring-related data collection generation and dissemination efforts
The Anacostia watershed implementation plan provides an outline of the actions that will be
taken through the first permit cycle to reduce trash The range of programs and practices
specially aimed at reducing trash inputs to roads and streams that will be targeted include
reduce reuse and recycle campaigns littering and illegal dumping enforcement stream
cleanups and street sweeping These measures are in addition to any trash trapped and
021611
Montgomery County Coordinated Implementation Strategy - DRAFT
removed by structural practices which are computed using the WTM The plan shows that the
trash TMDl can be met by 2025 at a cost of 732 million dollars
Adaptive Management Monitoring and Reporting
Sound implementation strategies require assessment and effective adaptation to respond to
new information changing conditions new technologies and lessons learned This will be the
basis of the plan that will be used when benchmarks are not met and the projected funding is
inadequate
Adaptive management requires monitoring of a variety of measures that can be used to
determine whether progress is being made towards meeting the Countywide water quality
objectives Ultimately it is the instream water quality and the loading limits with respect to the
TMDls that determine the success of implementation however there are many interim
measures that can also be correlated to success which are worthwhile pursuing
Surface water monitoring can be an expensive and time consuming undertaking Montgomery
County is fortunate to have an extensive Countywide stream monitoring network that can serve
as a foundation for providing spatial and temporal data to indicate stream health The Countys
MS4 Permit also outlines the required assessment of controls which includes chemical
biological and physical monitoring Specifically the permit calls for the County to continue
their watershed restoration monitoring of the lower Paint Branch subwatershed and physical
monitoring ofthe Clarksburg Special Protection area In addition to the existing monitoring
network the County will continue tracking and data reporting associated with levels of
implementation (eg acres of impervious cover treated areas of buffer planted miles of
stream restored miles of streets swept) For measuring effectiveness of outreach and
stewardship efforts other types of monitoring and reporting are planned that include before
and after attitude surveys frequency of website visits and information requests
For many restoration strategies it may be difficult to tease out their individual effectiveness in
terms of pollutant load reductions but collectively the monitoring that occurs should provide
adequate insight into the overall effectiveness of a layered implementation strategy
In addition to the monitoring and assessment the County will be reporting results on an annual
basis as part of their NPDES MS4 Permit annual report The MS4 Permit requires annual
reporting of the following
021611
Montgomery County Coordinated Implementation Strategy - DRAFT
bull The status of implementing the components of the stormwater management program
that are established as permit conditions
bull A narrative summary describing the results and analyses of data including monitoring
data that is accumulated throughout the reporting year
bull Expenditures for the reporting period and the proposed budget for the upcoming year
bull A summary describing the number and nature of enforcement actions inspections and
public education programs
bull The identification of water quality improvements and documentation of progress
toward meeting applicable WLAs developed under EPA approved TMDLs and
bull The identification of any proposed changes to the Countys program when WLAs are not
being met
The County will build upon annual reporting that has historically occurred to meet permit
requirements and will supplement this reporting with tracking table summaries that quantify
implementation activities for the range of strategies pursued during that year and the
associated treatment (eg impervious cover treated pollutant load reduced education and
outreach partners established etc) Cost will also be tracked in association with rates of
implementation This level of performance will then be compared with countywide strategy
targets (eg progress towards meeting WLAs) associated with key performance dates such as
those presented in Table 41 The level of progress achieved by the County will then feed into
the adaptive management approach described above
Organization Needs to Implement Strategy
Montgomery County DEP staff possesses substantial expertise and institutional knowledge that
yields many positive outcomes and efficient processes under the current pace of restoration
and permit compliance activities Under this strategy however the pace of implementation is
required to significantly increase Based on an increase in the level of implementation it is
reasonable to assume that additional capacity may be needed to provide sufficient oversight
and management of all the projects
Another critical element of this strategy is the recognition and commitment to pursuing
outreach initiatives that build community capacity by targeting new partner groups that
provide the necessary leadership oversight and sustained effort to change behaviors and
foster stewardship The County currently carries out many well established and managed
outreach programs but it may require additional focus across County agencies and
departments for these partnerships to become established and thrive
021611 G
Montgomery County Coordinated Implementation Strategy - DRAFT
Through the implementation process and the monitoring and reporting that is required large
amounts of data will be generated Technological advances happen so rapidly in this day and
age it will be important for the County to stay current with technology and methods so that
more efficient and cost-effective data management and reporting will be possible The County
currently relies on a detailed and sophisticated GIS to spatially locate projects and manage
tables of data related to projects The growth and development of this spatial database will be
a critical component of the reporting and tracking capability of the County These databases
generate the input data that are used to measure progress towards baseline loading targets
Regular review and upkeep of the data as well as routine summarization of progress (annually
at a minimum) will likely require additional dedication of staff This is especially the case during
periods where the implementation rate of structural practices in the ground is accelerated
021611
Montgomery County Coordinated Implementation Strategy - DRAFT
Appendix C - Restoration Potential by Watershed
021611
c-
04 03 02 01
a
_ Nitrogen Load Reduction
--shy TMDL WLA Target
_Cost
MONTGOMERY COUNTY URBAN WATERSHEDS POLLUTANTS _Bk)~Ibilats ~1~ l~ fjfsi --
Rank
1
2
3
4
5
6
7
8
9
10
11
Restoration Strategy TN reduction
Ibsyr
Pet Waste Education 15169
Retrofit of Underperforming BMPs 1769
Stream Restoration 72423
Completed Projects ~43 High Priority Projects 3260
Other Potential Projects 43276
Habitat Restoration 224
Public Property ESD Retrofits 18270
Priority Neighborhoods ESD Retrofits 9271
Private Non-residential ESD Retrofits 5594
Street Sweeping -
Incremental Cost Unit Cost
Million $ IbsMillion $ 088 17193
120 1475
9304 778
948 701
635 513
25430 170
141 158
23655 77
13278 70
8018 70
124 -
Qj c
Qj
nI CXI
o -f-
1 09 08 07 06 05
$900 $800 $700
~ $600 c $500 ~ $400 $300 0 u $200 $100
$shy
~~mf il_~IJrt~
MONTGOMERY COUNTY URBAN WATERSHEDS POLLUTANTS ItfiQ14lbilJts i~5 [i
1 $900 Qj
09 $8005 iii en 08 $700
~co 07 $600 co - til
06 $500 ~ 05- $400 ~ 04 en$300 003 u $20002
en $100I 01 o 0 $shys Q en o
s Q
Phosphorus Load Reduction
--- TMDL WLA Target
__Cost
I Rank I
1
2
3
4
5
6
7
8
9
Restoration Strategy
Pet Waste Education
Retrofit of Underperforming BMPs
Stream Restoration
Completed Projects
High Priority Projects
Habitat Restoration
Other Potential Projects
Public Property ESD Retrofits
Priority Neighborhoods ESD Retrofits
10 I Private Non-residential ESD Retrofits
11 Street Sweeping
TP reduction Incremental Cost Unit Cost
Ibsyr Million $ IbsMillion $ 1979 088 2243
247 120 206
13097 9304 141
915 948 96
451 635 71
37 141 26
6067 25430 24
2546 23655 11
1294 13278 10
781 8018 10
- 124 -
MONTGOMERY COUNTY URBAN WATERSHEDS POLLUTANTS IItQjQhabillt$middot
Cii 5 Cii 11 It CD
6 ~ r o ~ s
0 ltIIa r ltII e c ltII III
1 09 08 07 06 05 04 03 02 01
0
$900
$800 $700
v$600 r
0 $500 == $400 $300 11
0 u $200 $100
$shy
_ Sediment load Reduction
--- TMDl WlA Target
__Cost
Rank Restoration Strategy
Sediment reduction
Incremental Cost
Unit Cost
tonsyr Million $ tonsMillion $ 1 Street Sweeping 800 124 645
2 Stream Restoration 25057 9304 269
3 Retrofit of Underperforming BMPs 25 120 21
4 Completed Projects 97 948 10
5 High Priority Projects 47 635 7
6 Other Potential Projects 660 25430 3
7 I Public Property ESD Retrofits 272 23655 1
8 Priority Neighborhoods ESD Retrofits 139 13278 1
9 Private Non-residential ESD Retrofits 84 8018 1
10 Habitat Restoration 2 141 1
11 Pet Waste Education - 088 -
C-3
MONTGOMERY COUNTY URBAN WATERSHEDS POLLUTANTS
-QI5 5i ~
1 09 08 07 06 05 04 03 02 01
0
$900
$800
$700
$600 ~ 0
$500 == $400 $300 11
0 u $200
$100
$shy
--shy TMDL WLA Target
___ Cost
Rank Restoration Strategy
Enterrococci reduction
Incremental Cost
Unit Cost
Billion MPNyr Million $ Billion MPN Million $
1 Pet Waste Education 19643 088 22263
2 Retrofit of Underperforming BMPs 2781 120 2318
3 Completed Projects 10441 948 1101
4 High Priority Projects 5120 635 806
5 Other Potential Projects 69895 25430 275
6 Riparian Reforestation 310 141 219
7 Public Property ESD Retrofits 29025 23655 123
8 Priority Neighborhoods ESD Retrofits 14777 13278 111
9 Private Non-residential ESD Retrofits 8917 8018 111
10 Stream Restoration - 9304 -
11 Street Sweeping - 124 I -
~ I~~~i MONTGOMERY COUNTY URBAN WATERSHEDS POLLUTANTS 1tI2~mL ~ I~I
~$ I -~-- I
100 90 80 70 60 50 40 30 20 10
0
$900 $800 $700 $600 $500 $400 $300 $200 $100 $shy
vi c
~ 5 11 0 u
Implementation Phase
Potential Trash Incremental Unit Cost
I
Rank Restoration Strategy Reduction Cost
Ibsyear Million $ IbsMillion $ 1 Recycling Education and Investigations 51654 02 238837
2 Plastic Bag Ban and Misc Enforcement 63546 13 48882
3 Anti-litter Campaign Education 23J61 09 26930
4 Retrofit of Underperforming BMPs 1144 12 954
5 Completed Projects 6598 95 696
6 High Priority Projects 2786 64 439
7 Other Potential Projects 56341 2543 222
8 Habitat Restoration 266 14 188
9 Street Sweeping 204 12 164
10 Public Property ESD Retrofits 25348 2366 107
11 Priority lIeighborhoods ESD Retrofits 12529 1328 94
12 Private Non-residential ESD Retrofits 7547 802 94 ru Stream Restoration - 930 -14 Pet Waste Education - 09 -
C-5
MONTGOMERY COUNTY URBAN WATERSHEDS POLLUTANTS
CABIN JOHN
1 250
__CostImplementation Phase
09 08 07 06 05 04 03 02 01
0
200 ~ c
150 g E
100 - ltII 0 u
50
0
_E Coli
- - - Waste Load Allocation
Rank Restoration Strategy
E coli reduction
Incremental Cost
Unit Cost
Billion
MPNyr Million $
Billion MPN
Million $ 1 Pet Waste Education 4388 $05 9436
2 Underperforming BMP Retrofits 1892 $19 1022
3 High Priority Projects 1289 $16 800
4 Riparian Reforestation 1133 $78 146
5 Other Potential Projects 148 $17 86
6 Public Property ESD Retrofits 4AOO $860 Sl 7 Private Non-residential ESD Retrofits 1618 $392 41
8 Priority Neighborhoods ESD Retrofits 2633 $638 41
9 Completed Projects 112 $00 0
C-6
MONTGOMERY COUNTY URBAN WATERSHEDS POLLUTANTS 1Itf~~Jabitm
ROCK CREEK
1 $700 Qj5 09
o
_
$600 Qj 08
111 $500 ~ampl 07 c
t5 06 $400 ~ e 05 ~ $3005 04 - 111tl 03 $200 0 u-6 02
$100J 01 $-
Enterrococci
- - - Waste load Allocation Implementation Phase
__Cost
Rank Restoration Strategy
Enterrococci reduction
Incremental Cost
Unit Cost
Billion MPNyr Million $ Billion MPN Million $
Et Pet Waste Management 35734 118 30190
Underperforming BMP Upgrades
Other Potential Projects
28800
30239
577
1083
4995
2792
4 Completed Projects 12131 444 2734
5 High Priority Projects 14239 890 1600
6 Riparian Reforestation 18999 2384 797
7 County Property ESD Retrofits 54519 24136 226
8 Private Residential ESD Retrofits 35230 17737 199
9 Private Non-residential ESD Retrofits 32A86 16380 198
C-7
MONTGOMERY COUNTY URBAN WATERSHEDS POLLUTANTS _f~~pabitafS (fi~r ~~ l-middotshy
ROCK CREEK
100 $900 90 $800 80 $700 u70 $600 c 60 2$50050 -~$40040
lt1$300 030 $200 u
20 10 $100
0 $shy
Implementation Phase
Rank Restoration Strategy Trash Reduction
Incremental Cost
Unit Cost I
Ibsyear Million $ IbsMillion $ 1 Other Potential Projects 16038 1085 1478
2 Underperforming BMP Upgrades 6756 577 1172
3 Completed Projects 4217 444 950
4 High Priority Projects 6366 890 715
5 Riparian Reforestation 9237 2384 387
6 Public Property ESD Retrofits 24587 24136 102
7 Priority Neighborhoods ESD Retrofits 16155 17737 91
8 Private Non-residential ESD Retrofits 14793 16380 90
9 Pet Waste Education - 118 -
(-8
MONTGOMERY COUNTY RURAL WATERSHEDS POLLUTANTS
SENECA - CLOPPER LAKE -
100 Qi
90 iii 80VI to -CQ 70 0 60e 50I 0 40 u l 30
C QJ 20ex
C 10to 0
J 0
$18
$16
$14 n
$12 I
$10 sect $08 ~ $06 0
VI
U $04
$02
$shy
_TPRemoval - - - TMDL Reduction Target
Implementation Phase ___Cost
Rank Restoration Strategy TP
Reduction (Ibsyr)
Incremental Cost (Million $)
Unit Cost (IbsvrMillion $)
1 Residential Education 33 001 6246
2 Underperforming BMP Retrofits 13 004 341 3 Riparian Buffer Reforestation 19 023 99 4 Priority Neighborhood ESD Retrofits 15 051 35 5 Public Property ESD Retrofits 7 075 99
C-9
-pj[fti
MONTGOMERY COUNTY URBAN WATERSHEDS POLLUTANTS 1It[~~JIlbitIL f bull~
LOWER MONOCACY
1 09 08 07 06 05 04 03 02 01
0
Implementation Phase
25
20 ~ c
15 ~ ~
10 - 0 u
5
0
_TSS
- - - Waste load Allocation _Cost
Rank Restoration Strategy
Sediment reduction
Incremental
Cost Unit Cost
tonsyear Million $ tonMilli
1 Street Sweeping 22 $007 3121
2 Underperforming BMP Retrofits 4 $010 389
3 Stream Restoration 37 $734 51
4 Riparian Buffer Reforestation 3 $109 25
5 Other Structural BMPs and ESD Strategies 10 $851 12
6 Priority Neighborhoods ESD Retrofits 2 $160 10
7 Non-residential ESD Retrofits 1 $132 10
C-10
MONTGOMERY COUNTY RURAL WATERSHEDS POLLUTANTS 1tlj~lIbiIalSlt~~II
1 09 08 07 06 05 04 03 02 01
0
$70
$60
$50 ~ c
$40 ~ ~ $30 - UI
$20 0 v
$10
$0
_ Phosphorus Load Reduction
- - - Waste Load Allocation ___ CostImplementation Phase
Rank Restoration Strategy TP Incremental Cost
Million $ Unit Cost
Ibsyr Ibs Million $ 1 Lawn Care Education 3670 01 37394
2 Underperforming BMP Retrofits 3499 08 4338
3 Other Potential Projects 3524 33 1076
4 High Priority Projects 252 04 685
5 Riparian Reforestation 762 26 298
6 Public Property Retrofits 5854 345 169
7 Priority Neighborhoods ESD Retrofits 796 65 123
8 Private Non-residential ESD Retrofits 1941 168 116
9 Completed Projects 53 00 00
c- 11
MONTGOMERY COUNTY RURAL WATERSHEDS POLLUTANTSal12hdJilats ~I~ ~ [ -
1 10 ii 5 09 9 1 08 8 II al- 07 7 1ii o 06 6
c
~ ~ 1 o E IV
05 04 03
5 4
3
~ 11 0 u
0 11 02 2 J o 01 1
t a 0 0 11 o
t 0
_ Phosphorus Reduction
- - - Waste Load Allocation
-Cost
Rank Restoration Strategy TP Incremental Cost
Million $ Unit Cost
Ibsyr Ibs Million $ 1 Lawn Care Education 3670 01 37394
2 Underperforming BMP Retrofits 3499 08 4338
3 Other Potential Projects 3524 33 1076
4 High Priority Projects 252 04 685
5 Riparian Reforestation 762 26 298
6 Public Property Retrofits 5854 345 169
7 Priority Neighborhoods ESD Retrofits 796 65 123
8 Private Non-residential ESD Retrofits 1941 168 116
9 Completed Projects 53 00 00
C-12
Montgomery County Coordinated Implementation Strategy - DRAFT
targeted for pollutant load reduction but not credited towards impervious cover credit No
riparian reforestation or stream restoration was targeted due to limited or no opportunities In
future permit cycles the remainder of the other potential projects are targeted along with ESD
and some riparian reforestation for impervious cover and pollutant load reduction The
bacteria load reduction meets MS4 permit area WLA compliance by 2025
Muddy BranchWatts Branch - During the first permit cycle (through 2015) a priority was
placed on full implementation of complete high and low priority projects Fewer opportunities
exist overall compared to the Anacostia and Rock Creek Watersheds No other strategies were
pursued as there are no existing TMDLs in the Muddy BranchWatts Branch subwatersheds In
future permit cycles previously identified stream restoration projects are implemented for
pollutant load reduction
Great Seneca Creek - This watershed implementation plan is unique in that it includes the small
Clopper Lake subwatershed which has a TMDL for phosphorus Even with the TMDL there are
limited identified opportunities to pursue in the Clopper Lake subwatershed in part due to the
limited area of the subwatershed within the County MS4 permit area During the first permit
cycle (through 2015) a priority was placed on full implementation of complete high and low
priority projects within Great Seneca Creek subwatershed No opportunities exist for these
strategies in Clopper Lake However full outreach was applied in Clopper Lake in the first
permit cycle In future years other potential projects ESD on public and private property and a
small amount of riparian reforestation (in Clopper Lake) is pursued The Clopper Lake WLA for
phosphorus within the MS4 permit area is met
Patuxent - During the first permit cycle through 2015 a priority was placed on full
implementation of complete high and low priority projects Far fewer opportunities exist
overall compared to the Anacostia and Rock Creek A limited amount of ESD on private land
and stream restoration was pursued Finally outreach (100) was targeted for pollutant load
reduction (primarily nutrients) but not credited towards impervious cover credit No riparian
reforestation was targeted within the MS4 Permit area due to cost effectiveness in the Rocky
Gorge subwatershed and limited opportunities in the Triadelphia subwatershed In future
permit cycles ESD on private and public land is pursued more substantially as is stream
restoration A limited amount of riparian reforestation achieves some impervious cover and
pollutant load reduction The Rocky Gorge phosphorus WLA within the MS4 permit area is met
easily and the Tridelphia phosphorus WLA is also met but with a longer timeframe needed for
compliance
021611
Montgomery County Coordinated Implementation Strategy - DRAFT
Lower Monocacy Creek -lower Monocacy Creek is the most rural watershed in the County and
has the least amount of area subject to the County MS4 permit In addition there are no preshy
identified restoration projects within the watershed Therefore during the first permit cycle
(through 2015) only a very small amount (5) of private property ESD is pursued It is not until
the second permit cycle that more focus is placed on private and public ESD as well as stream
restoration and programmatic strategies such as street sweeping to target sediment loads
associated with the TM Dl In future permit cycles stream restoration is pursued for pollutant
load reduction The sediment WlA within the MS4 permit area is projected to be met around
2025
Countywide - The Countywide effort was driven by impervious cover treatment targets and
Chesapeake Bay TMDl2017 and 2020 reduction targets associated with sediment and nutrients
for urban MS4s For impervious cover it was assumed that a 20 target would be required for
each five-year permit cycle The Bay TMDl targets for urban MS4 areas were easily met for all
pollutants in 2017 and easily met for nitrogen and sediment but more difficult to meet for
phosphorus in 2020
Public Outreach and Stewardship
The County recognizes and is committed to the increasingly important role that public outreach
and stewardship will play if improved water quality conditions are going to be achieved
countywide While the County currently has a very active and layered outreach program the
model requires changes that will result in broader stakeholder groups serving as the leaders
and primary champions for clean water in their communities This includes greater participation
from minority and faith-based groups business consortiums schools neighborhood
associations and civic groups Additionally the new model requires revisiting current
initiatives carried out by the various County agencies to look for better and more efficient ways
to communicate messages cross-train and create synergies that result in greater engagement
greater awareness and sustained changes in behavior
Within each implementation plan specific suggestions for outreach and education
opportunities are identified In addition Appendix E of this Strategy contains practice sheets
which highlight targeted restoration activities for the County to develop and refine A total of
eight practices have been identified that can be adopted countywide or in more targeted
watershed areas where there are specific water quality issues to address Many of the
practices build upon existing County programs but require a much broader reach to new
partner groups Program start up costs are suggested and were used to for cost estimates
associated with Countywide strategy The highlighted practices include
021611
Montgomery County Coordinated Implementation Strategy - DRAFT
bull Pet Waste Pickup Education and Outreach Campaign
bull Lawn Stewardship Education and Outreach Campaign
bull Anti-littering Education and Outreach Campaign
bull Innovative Stormwater Management Awareness Campaign
bull Stream Stewards Education and Outreach Campaign
bull Riparian Reforestation Education and Outreach Campaign
bull Roof Runoff Reduction Education and Outreach Campaign
bull Parking Lot Recharge Value Education and Outreach Campaign
Start up costs by practice along with an overall five year cost estimate are provided in Table
43 Start up timeframes are assumed to be up to 18 months
Table 43 Outreach Start Up and 5-Year Cost Projections
Practice Practice Start Up Cost
Pet Waste Pickup $240500
Lawn Stewardship $301 600
Anti-Littering $175050
Stormwater Management Improvements Awareness $50450
Stream Stewards $74825
Riparian Reforestation $30575
Roof Runoff Reduction $101400
Parking Lot Recharge Value $41500
Estimated Start Up Total $744900
5-Year Outreach Budget Projection $2650000
These eight practice sheets provide specific costs and timelines for implementation They also
provide suggestions for measuring program success These practice sheets along with the
specific recommendations in the implementation plans make up the Public Outreach and
Education Campaign
Trash Reduction
Most of the implementation plans have to address trash loadings to meet requirements of the
Potomac Trash Treaty that is referenced in the County1s MS4 Permit In addition the Anacostia
Trash TMDL has recently been accepted by MDE and the EPA According to the Anacostia
021611
Montgomery County Coordinated Implementation Strategy - DRAFT
TMDl there is reasonable assurance that the goals of the Treaty and TMDl can be met with
proper watershed planning implementing pollution-reduction BMPs and using strong political
and financial mechanisms
Currently the County has a number of activities which target trash reduction They include the
following
bull Adopt-a-Road Program through DOT which focuses on public awareness and involvement in trash management There are 205 participants who adopted road segments and agreed to six major road cleanups per year
bull Storm Drain Marking through DOT bull Support for illegal dumping enforcement outreach and research and monitoring bull Partnership with DOT to conduct street sweeping covering about 2500 curb miles and
occurring once a year
bull Partnership with the Park Police to monitor illegal dumping which combined enforces 300-400 actions a year
bull Non-residential and residential recycling programs through Solid Waste Services (SWS) bull Transit stop trash management program at 600 bus stops countywide supported by DOT
Transit Services
In addition to continuing these efforts a number of trash good-housekeeping efforts have been
proposed as part of this Strategy A detailed description of the quantitative methods and
strategies applied can be found in Appendix E of the Guidance Document In general the
following six trash-reduction strategies are recommended
1 Significantly increase funding for trash reduction programs 2 Create and enhance regional partnerships and coordination among businesses
environmental groups individual citizens and government at all levels and in all jurisdictions
3 Improve peoples awareness knowledge and behavior relating to littering and illegal dumping
4 Promote the greater introduction and use of effective trash-reduction technologies and approaches
5 Improve enactment and enforcement of laws to reduce trash 6 Increase trash monitoring-related data collection generation and dissemination efforts
The Anacostia watershed implementation plan provides an outline of the actions that will be
taken through the first permit cycle to reduce trash The range of programs and practices
specially aimed at reducing trash inputs to roads and streams that will be targeted include
reduce reuse and recycle campaigns littering and illegal dumping enforcement stream
cleanups and street sweeping These measures are in addition to any trash trapped and
021611
Montgomery County Coordinated Implementation Strategy - DRAFT
removed by structural practices which are computed using the WTM The plan shows that the
trash TMDl can be met by 2025 at a cost of 732 million dollars
Adaptive Management Monitoring and Reporting
Sound implementation strategies require assessment and effective adaptation to respond to
new information changing conditions new technologies and lessons learned This will be the
basis of the plan that will be used when benchmarks are not met and the projected funding is
inadequate
Adaptive management requires monitoring of a variety of measures that can be used to
determine whether progress is being made towards meeting the Countywide water quality
objectives Ultimately it is the instream water quality and the loading limits with respect to the
TMDls that determine the success of implementation however there are many interim
measures that can also be correlated to success which are worthwhile pursuing
Surface water monitoring can be an expensive and time consuming undertaking Montgomery
County is fortunate to have an extensive Countywide stream monitoring network that can serve
as a foundation for providing spatial and temporal data to indicate stream health The Countys
MS4 Permit also outlines the required assessment of controls which includes chemical
biological and physical monitoring Specifically the permit calls for the County to continue
their watershed restoration monitoring of the lower Paint Branch subwatershed and physical
monitoring ofthe Clarksburg Special Protection area In addition to the existing monitoring
network the County will continue tracking and data reporting associated with levels of
implementation (eg acres of impervious cover treated areas of buffer planted miles of
stream restored miles of streets swept) For measuring effectiveness of outreach and
stewardship efforts other types of monitoring and reporting are planned that include before
and after attitude surveys frequency of website visits and information requests
For many restoration strategies it may be difficult to tease out their individual effectiveness in
terms of pollutant load reductions but collectively the monitoring that occurs should provide
adequate insight into the overall effectiveness of a layered implementation strategy
In addition to the monitoring and assessment the County will be reporting results on an annual
basis as part of their NPDES MS4 Permit annual report The MS4 Permit requires annual
reporting of the following
021611
Montgomery County Coordinated Implementation Strategy - DRAFT
bull The status of implementing the components of the stormwater management program
that are established as permit conditions
bull A narrative summary describing the results and analyses of data including monitoring
data that is accumulated throughout the reporting year
bull Expenditures for the reporting period and the proposed budget for the upcoming year
bull A summary describing the number and nature of enforcement actions inspections and
public education programs
bull The identification of water quality improvements and documentation of progress
toward meeting applicable WLAs developed under EPA approved TMDLs and
bull The identification of any proposed changes to the Countys program when WLAs are not
being met
The County will build upon annual reporting that has historically occurred to meet permit
requirements and will supplement this reporting with tracking table summaries that quantify
implementation activities for the range of strategies pursued during that year and the
associated treatment (eg impervious cover treated pollutant load reduced education and
outreach partners established etc) Cost will also be tracked in association with rates of
implementation This level of performance will then be compared with countywide strategy
targets (eg progress towards meeting WLAs) associated with key performance dates such as
those presented in Table 41 The level of progress achieved by the County will then feed into
the adaptive management approach described above
Organization Needs to Implement Strategy
Montgomery County DEP staff possesses substantial expertise and institutional knowledge that
yields many positive outcomes and efficient processes under the current pace of restoration
and permit compliance activities Under this strategy however the pace of implementation is
required to significantly increase Based on an increase in the level of implementation it is
reasonable to assume that additional capacity may be needed to provide sufficient oversight
and management of all the projects
Another critical element of this strategy is the recognition and commitment to pursuing
outreach initiatives that build community capacity by targeting new partner groups that
provide the necessary leadership oversight and sustained effort to change behaviors and
foster stewardship The County currently carries out many well established and managed
outreach programs but it may require additional focus across County agencies and
departments for these partnerships to become established and thrive
021611 G
Montgomery County Coordinated Implementation Strategy - DRAFT
Through the implementation process and the monitoring and reporting that is required large
amounts of data will be generated Technological advances happen so rapidly in this day and
age it will be important for the County to stay current with technology and methods so that
more efficient and cost-effective data management and reporting will be possible The County
currently relies on a detailed and sophisticated GIS to spatially locate projects and manage
tables of data related to projects The growth and development of this spatial database will be
a critical component of the reporting and tracking capability of the County These databases
generate the input data that are used to measure progress towards baseline loading targets
Regular review and upkeep of the data as well as routine summarization of progress (annually
at a minimum) will likely require additional dedication of staff This is especially the case during
periods where the implementation rate of structural practices in the ground is accelerated
021611
Montgomery County Coordinated Implementation Strategy - DRAFT
Appendix C - Restoration Potential by Watershed
021611
c-
04 03 02 01
a
_ Nitrogen Load Reduction
--shy TMDL WLA Target
_Cost
MONTGOMERY COUNTY URBAN WATERSHEDS POLLUTANTS _Bk)~Ibilats ~1~ l~ fjfsi --
Rank
1
2
3
4
5
6
7
8
9
10
11
Restoration Strategy TN reduction
Ibsyr
Pet Waste Education 15169
Retrofit of Underperforming BMPs 1769
Stream Restoration 72423
Completed Projects ~43 High Priority Projects 3260
Other Potential Projects 43276
Habitat Restoration 224
Public Property ESD Retrofits 18270
Priority Neighborhoods ESD Retrofits 9271
Private Non-residential ESD Retrofits 5594
Street Sweeping -
Incremental Cost Unit Cost
Million $ IbsMillion $ 088 17193
120 1475
9304 778
948 701
635 513
25430 170
141 158
23655 77
13278 70
8018 70
124 -
Qj c
Qj
nI CXI
o -f-
1 09 08 07 06 05
$900 $800 $700
~ $600 c $500 ~ $400 $300 0 u $200 $100
$shy
~~mf il_~IJrt~
MONTGOMERY COUNTY URBAN WATERSHEDS POLLUTANTS ItfiQ14lbilJts i~5 [i
1 $900 Qj
09 $8005 iii en 08 $700
~co 07 $600 co - til
06 $500 ~ 05- $400 ~ 04 en$300 003 u $20002
en $100I 01 o 0 $shys Q en o
s Q
Phosphorus Load Reduction
--- TMDL WLA Target
__Cost
I Rank I
1
2
3
4
5
6
7
8
9
Restoration Strategy
Pet Waste Education
Retrofit of Underperforming BMPs
Stream Restoration
Completed Projects
High Priority Projects
Habitat Restoration
Other Potential Projects
Public Property ESD Retrofits
Priority Neighborhoods ESD Retrofits
10 I Private Non-residential ESD Retrofits
11 Street Sweeping
TP reduction Incremental Cost Unit Cost
Ibsyr Million $ IbsMillion $ 1979 088 2243
247 120 206
13097 9304 141
915 948 96
451 635 71
37 141 26
6067 25430 24
2546 23655 11
1294 13278 10
781 8018 10
- 124 -
MONTGOMERY COUNTY URBAN WATERSHEDS POLLUTANTS IItQjQhabillt$middot
Cii 5 Cii 11 It CD
6 ~ r o ~ s
0 ltIIa r ltII e c ltII III
1 09 08 07 06 05 04 03 02 01
0
$900
$800 $700
v$600 r
0 $500 == $400 $300 11
0 u $200 $100
$shy
_ Sediment load Reduction
--- TMDl WlA Target
__Cost
Rank Restoration Strategy
Sediment reduction
Incremental Cost
Unit Cost
tonsyr Million $ tonsMillion $ 1 Street Sweeping 800 124 645
2 Stream Restoration 25057 9304 269
3 Retrofit of Underperforming BMPs 25 120 21
4 Completed Projects 97 948 10
5 High Priority Projects 47 635 7
6 Other Potential Projects 660 25430 3
7 I Public Property ESD Retrofits 272 23655 1
8 Priority Neighborhoods ESD Retrofits 139 13278 1
9 Private Non-residential ESD Retrofits 84 8018 1
10 Habitat Restoration 2 141 1
11 Pet Waste Education - 088 -
C-3
MONTGOMERY COUNTY URBAN WATERSHEDS POLLUTANTS
-QI5 5i ~
1 09 08 07 06 05 04 03 02 01
0
$900
$800
$700
$600 ~ 0
$500 == $400 $300 11
0 u $200
$100
$shy
--shy TMDL WLA Target
___ Cost
Rank Restoration Strategy
Enterrococci reduction
Incremental Cost
Unit Cost
Billion MPNyr Million $ Billion MPN Million $
1 Pet Waste Education 19643 088 22263
2 Retrofit of Underperforming BMPs 2781 120 2318
3 Completed Projects 10441 948 1101
4 High Priority Projects 5120 635 806
5 Other Potential Projects 69895 25430 275
6 Riparian Reforestation 310 141 219
7 Public Property ESD Retrofits 29025 23655 123
8 Priority Neighborhoods ESD Retrofits 14777 13278 111
9 Private Non-residential ESD Retrofits 8917 8018 111
10 Stream Restoration - 9304 -
11 Street Sweeping - 124 I -
~ I~~~i MONTGOMERY COUNTY URBAN WATERSHEDS POLLUTANTS 1tI2~mL ~ I~I
~$ I -~-- I
100 90 80 70 60 50 40 30 20 10
0
$900 $800 $700 $600 $500 $400 $300 $200 $100 $shy
vi c
~ 5 11 0 u
Implementation Phase
Potential Trash Incremental Unit Cost
I
Rank Restoration Strategy Reduction Cost
Ibsyear Million $ IbsMillion $ 1 Recycling Education and Investigations 51654 02 238837
2 Plastic Bag Ban and Misc Enforcement 63546 13 48882
3 Anti-litter Campaign Education 23J61 09 26930
4 Retrofit of Underperforming BMPs 1144 12 954
5 Completed Projects 6598 95 696
6 High Priority Projects 2786 64 439
7 Other Potential Projects 56341 2543 222
8 Habitat Restoration 266 14 188
9 Street Sweeping 204 12 164
10 Public Property ESD Retrofits 25348 2366 107
11 Priority lIeighborhoods ESD Retrofits 12529 1328 94
12 Private Non-residential ESD Retrofits 7547 802 94 ru Stream Restoration - 930 -14 Pet Waste Education - 09 -
C-5
MONTGOMERY COUNTY URBAN WATERSHEDS POLLUTANTS
CABIN JOHN
1 250
__CostImplementation Phase
09 08 07 06 05 04 03 02 01
0
200 ~ c
150 g E
100 - ltII 0 u
50
0
_E Coli
- - - Waste Load Allocation
Rank Restoration Strategy
E coli reduction
Incremental Cost
Unit Cost
Billion
MPNyr Million $
Billion MPN
Million $ 1 Pet Waste Education 4388 $05 9436
2 Underperforming BMP Retrofits 1892 $19 1022
3 High Priority Projects 1289 $16 800
4 Riparian Reforestation 1133 $78 146
5 Other Potential Projects 148 $17 86
6 Public Property ESD Retrofits 4AOO $860 Sl 7 Private Non-residential ESD Retrofits 1618 $392 41
8 Priority Neighborhoods ESD Retrofits 2633 $638 41
9 Completed Projects 112 $00 0
C-6
MONTGOMERY COUNTY URBAN WATERSHEDS POLLUTANTS 1Itf~~Jabitm
ROCK CREEK
1 $700 Qj5 09
o
_
$600 Qj 08
111 $500 ~ampl 07 c
t5 06 $400 ~ e 05 ~ $3005 04 - 111tl 03 $200 0 u-6 02
$100J 01 $-
Enterrococci
- - - Waste load Allocation Implementation Phase
__Cost
Rank Restoration Strategy
Enterrococci reduction
Incremental Cost
Unit Cost
Billion MPNyr Million $ Billion MPN Million $
Et Pet Waste Management 35734 118 30190
Underperforming BMP Upgrades
Other Potential Projects
28800
30239
577
1083
4995
2792
4 Completed Projects 12131 444 2734
5 High Priority Projects 14239 890 1600
6 Riparian Reforestation 18999 2384 797
7 County Property ESD Retrofits 54519 24136 226
8 Private Residential ESD Retrofits 35230 17737 199
9 Private Non-residential ESD Retrofits 32A86 16380 198
C-7
MONTGOMERY COUNTY URBAN WATERSHEDS POLLUTANTS _f~~pabitafS (fi~r ~~ l-middotshy
ROCK CREEK
100 $900 90 $800 80 $700 u70 $600 c 60 2$50050 -~$40040
lt1$300 030 $200 u
20 10 $100
0 $shy
Implementation Phase
Rank Restoration Strategy Trash Reduction
Incremental Cost
Unit Cost I
Ibsyear Million $ IbsMillion $ 1 Other Potential Projects 16038 1085 1478
2 Underperforming BMP Upgrades 6756 577 1172
3 Completed Projects 4217 444 950
4 High Priority Projects 6366 890 715
5 Riparian Reforestation 9237 2384 387
6 Public Property ESD Retrofits 24587 24136 102
7 Priority Neighborhoods ESD Retrofits 16155 17737 91
8 Private Non-residential ESD Retrofits 14793 16380 90
9 Pet Waste Education - 118 -
(-8
MONTGOMERY COUNTY RURAL WATERSHEDS POLLUTANTS
SENECA - CLOPPER LAKE -
100 Qi
90 iii 80VI to -CQ 70 0 60e 50I 0 40 u l 30
C QJ 20ex
C 10to 0
J 0
$18
$16
$14 n
$12 I
$10 sect $08 ~ $06 0
VI
U $04
$02
$shy
_TPRemoval - - - TMDL Reduction Target
Implementation Phase ___Cost
Rank Restoration Strategy TP
Reduction (Ibsyr)
Incremental Cost (Million $)
Unit Cost (IbsvrMillion $)
1 Residential Education 33 001 6246
2 Underperforming BMP Retrofits 13 004 341 3 Riparian Buffer Reforestation 19 023 99 4 Priority Neighborhood ESD Retrofits 15 051 35 5 Public Property ESD Retrofits 7 075 99
C-9
-pj[fti
MONTGOMERY COUNTY URBAN WATERSHEDS POLLUTANTS 1It[~~JIlbitIL f bull~
LOWER MONOCACY
1 09 08 07 06 05 04 03 02 01
0
Implementation Phase
25
20 ~ c
15 ~ ~
10 - 0 u
5
0
_TSS
- - - Waste load Allocation _Cost
Rank Restoration Strategy
Sediment reduction
Incremental
Cost Unit Cost
tonsyear Million $ tonMilli
1 Street Sweeping 22 $007 3121
2 Underperforming BMP Retrofits 4 $010 389
3 Stream Restoration 37 $734 51
4 Riparian Buffer Reforestation 3 $109 25
5 Other Structural BMPs and ESD Strategies 10 $851 12
6 Priority Neighborhoods ESD Retrofits 2 $160 10
7 Non-residential ESD Retrofits 1 $132 10
C-10
MONTGOMERY COUNTY RURAL WATERSHEDS POLLUTANTS 1tlj~lIbiIalSlt~~II
1 09 08 07 06 05 04 03 02 01
0
$70
$60
$50 ~ c
$40 ~ ~ $30 - UI
$20 0 v
$10
$0
_ Phosphorus Load Reduction
- - - Waste Load Allocation ___ CostImplementation Phase
Rank Restoration Strategy TP Incremental Cost
Million $ Unit Cost
Ibsyr Ibs Million $ 1 Lawn Care Education 3670 01 37394
2 Underperforming BMP Retrofits 3499 08 4338
3 Other Potential Projects 3524 33 1076
4 High Priority Projects 252 04 685
5 Riparian Reforestation 762 26 298
6 Public Property Retrofits 5854 345 169
7 Priority Neighborhoods ESD Retrofits 796 65 123
8 Private Non-residential ESD Retrofits 1941 168 116
9 Completed Projects 53 00 00
c- 11
MONTGOMERY COUNTY RURAL WATERSHEDS POLLUTANTSal12hdJilats ~I~ ~ [ -
1 10 ii 5 09 9 1 08 8 II al- 07 7 1ii o 06 6
c
~ ~ 1 o E IV
05 04 03
5 4
3
~ 11 0 u
0 11 02 2 J o 01 1
t a 0 0 11 o
t 0
_ Phosphorus Reduction
- - - Waste Load Allocation
-Cost
Rank Restoration Strategy TP Incremental Cost
Million $ Unit Cost
Ibsyr Ibs Million $ 1 Lawn Care Education 3670 01 37394
2 Underperforming BMP Retrofits 3499 08 4338
3 Other Potential Projects 3524 33 1076
4 High Priority Projects 252 04 685
5 Riparian Reforestation 762 26 298
6 Public Property Retrofits 5854 345 169
7 Priority Neighborhoods ESD Retrofits 796 65 123
8 Private Non-residential ESD Retrofits 1941 168 116
9 Completed Projects 53 00 00
C-12

Montgomery County Coordinated Implementation Strategy - DRAFT
TMDl there is reasonable assurance that the goals of the Treaty and TMDl can be met with
proper watershed planning implementing pollution-reduction BMPs and using strong political
and financial mechanisms
Currently the County has a number of activities which target trash reduction They include the
following
bull Adopt-a-Road Program through DOT which focuses on public awareness and involvement in trash management There are 205 participants who adopted road segments and agreed to six major road cleanups per year
bull Storm Drain Marking through DOT bull Support for illegal dumping enforcement outreach and research and monitoring bull Partnership with DOT to conduct street sweeping covering about 2500 curb miles and
occurring once a year
bull Partnership with the Park Police to monitor illegal dumping which combined enforces 300-400 actions a year
bull Non-residential and residential recycling programs through Solid Waste Services (SWS) bull Transit stop trash management program at 600 bus stops countywide supported by DOT
Transit Services
In addition to continuing these efforts a number of trash good-housekeeping efforts have been
proposed as part of this Strategy A detailed description of the quantitative methods and
strategies applied can be found in Appendix E of the Guidance Document In general the
following six trash-reduction strategies are recommended
1 Significantly increase funding for trash reduction programs 2 Create and enhance regional partnerships and coordination among businesses
environmental groups individual citizens and government at all levels and in all jurisdictions
3 Improve peoples awareness knowledge and behavior relating to littering and illegal dumping
4 Promote the greater introduction and use of effective trash-reduction technologies and approaches
5 Improve enactment and enforcement of laws to reduce trash 6 Increase trash monitoring-related data collection generation and dissemination efforts
The Anacostia watershed implementation plan provides an outline of the actions that will be
taken through the first permit cycle to reduce trash The range of programs and practices
specially aimed at reducing trash inputs to roads and streams that will be targeted include
reduce reuse and recycle campaigns littering and illegal dumping enforcement stream
cleanups and street sweeping These measures are in addition to any trash trapped and
021611
Montgomery County Coordinated Implementation Strategy - DRAFT
removed by structural practices which are computed using the WTM The plan shows that the
trash TMDl can be met by 2025 at a cost of 732 million dollars
Adaptive Management Monitoring and Reporting
Sound implementation strategies require assessment and effective adaptation to respond to
new information changing conditions new technologies and lessons learned This will be the
basis of the plan that will be used when benchmarks are not met and the projected funding is
inadequate
Adaptive management requires monitoring of a variety of measures that can be used to
determine whether progress is being made towards meeting the Countywide water quality
objectives Ultimately it is the instream water quality and the loading limits with respect to the
TMDls that determine the success of implementation however there are many interim
measures that can also be correlated to success which are worthwhile pursuing
Surface water monitoring can be an expensive and time consuming undertaking Montgomery
County is fortunate to have an extensive Countywide stream monitoring network that can serve
as a foundation for providing spatial and temporal data to indicate stream health The Countys
MS4 Permit also outlines the required assessment of controls which includes chemical
biological and physical monitoring Specifically the permit calls for the County to continue
their watershed restoration monitoring of the lower Paint Branch subwatershed and physical
monitoring ofthe Clarksburg Special Protection area In addition to the existing monitoring
network the County will continue tracking and data reporting associated with levels of
implementation (eg acres of impervious cover treated areas of buffer planted miles of
stream restored miles of streets swept) For measuring effectiveness of outreach and
stewardship efforts other types of monitoring and reporting are planned that include before
and after attitude surveys frequency of website visits and information requests
For many restoration strategies it may be difficult to tease out their individual effectiveness in
terms of pollutant load reductions but collectively the monitoring that occurs should provide
adequate insight into the overall effectiveness of a layered implementation strategy
In addition to the monitoring and assessment the County will be reporting results on an annual
basis as part of their NPDES MS4 Permit annual report The MS4 Permit requires annual
reporting of the following
021611
Montgomery County Coordinated Implementation Strategy - DRAFT
bull The status of implementing the components of the stormwater management program
that are established as permit conditions
bull A narrative summary describing the results and analyses of data including monitoring
data that is accumulated throughout the reporting year
bull Expenditures for the reporting period and the proposed budget for the upcoming year
bull A summary describing the number and nature of enforcement actions inspections and
public education programs
bull The identification of water quality improvements and documentation of progress
toward meeting applicable WLAs developed under EPA approved TMDLs and
bull The identification of any proposed changes to the Countys program when WLAs are not
being met
The County will build upon annual reporting that has historically occurred to meet permit
requirements and will supplement this reporting with tracking table summaries that quantify
implementation activities for the range of strategies pursued during that year and the
associated treatment (eg impervious cover treated pollutant load reduced education and
outreach partners established etc) Cost will also be tracked in association with rates of
implementation This level of performance will then be compared with countywide strategy
targets (eg progress towards meeting WLAs) associated with key performance dates such as
those presented in Table 41 The level of progress achieved by the County will then feed into
the adaptive management approach described above
Organization Needs to Implement Strategy
Montgomery County DEP staff possesses substantial expertise and institutional knowledge that
yields many positive outcomes and efficient processes under the current pace of restoration
and permit compliance activities Under this strategy however the pace of implementation is
required to significantly increase Based on an increase in the level of implementation it is
reasonable to assume that additional capacity may be needed to provide sufficient oversight
and management of all the projects
Another critical element of this strategy is the recognition and commitment to pursuing
outreach initiatives that build community capacity by targeting new partner groups that
provide the necessary leadership oversight and sustained effort to change behaviors and
foster stewardship The County currently carries out many well established and managed
outreach programs but it may require additional focus across County agencies and
departments for these partnerships to become established and thrive
021611 G
Montgomery County Coordinated Implementation Strategy - DRAFT
Through the implementation process and the monitoring and reporting that is required large
amounts of data will be generated Technological advances happen so rapidly in this day and
age it will be important for the County to stay current with technology and methods so that
more efficient and cost-effective data management and reporting will be possible The County
currently relies on a detailed and sophisticated GIS to spatially locate projects and manage
tables of data related to projects The growth and development of this spatial database will be
a critical component of the reporting and tracking capability of the County These databases
generate the input data that are used to measure progress towards baseline loading targets
Regular review and upkeep of the data as well as routine summarization of progress (annually
at a minimum) will likely require additional dedication of staff This is especially the case during
periods where the implementation rate of structural practices in the ground is accelerated
021611
Montgomery County Coordinated Implementation Strategy - DRAFT
Appendix C - Restoration Potential by Watershed
021611
c-
04 03 02 01
a
_ Nitrogen Load Reduction
--shy TMDL WLA Target
_Cost
MONTGOMERY COUNTY URBAN WATERSHEDS POLLUTANTS _Bk)~Ibilats ~1~ l~ fjfsi --
Rank
1
2
3
4
5
6
7
8
9
10
11
Restoration Strategy TN reduction
Ibsyr
Pet Waste Education 15169
Retrofit of Underperforming BMPs 1769
Stream Restoration 72423
Completed Projects ~43 High Priority Projects 3260
Other Potential Projects 43276
Habitat Restoration 224
Public Property ESD Retrofits 18270
Priority Neighborhoods ESD Retrofits 9271
Private Non-residential ESD Retrofits 5594
Street Sweeping -
Incremental Cost Unit Cost
Million $ IbsMillion $ 088 17193
120 1475
9304 778
948 701
635 513
25430 170
141 158
23655 77
13278 70
8018 70
124 -
Qj c
Qj
nI CXI
o -f-
1 09 08 07 06 05
$900 $800 $700
~ $600 c $500 ~ $400 $300 0 u $200 $100
$shy
~~mf il_~IJrt~
MONTGOMERY COUNTY URBAN WATERSHEDS POLLUTANTS ItfiQ14lbilJts i~5 [i
1 $900 Qj
09 $8005 iii en 08 $700
~co 07 $600 co - til
06 $500 ~ 05- $400 ~ 04 en$300 003 u $20002
en $100I 01 o 0 $shys Q en o
s Q
Phosphorus Load Reduction
--- TMDL WLA Target
__Cost
I Rank I
1
2
3
4
5
6
7
8
9
Restoration Strategy
Pet Waste Education
Retrofit of Underperforming BMPs
Stream Restoration
Completed Projects
High Priority Projects
Habitat Restoration
Other Potential Projects
Public Property ESD Retrofits
Priority Neighborhoods ESD Retrofits
10 I Private Non-residential ESD Retrofits
11 Street Sweeping
TP reduction Incremental Cost Unit Cost
Ibsyr Million $ IbsMillion $ 1979 088 2243
247 120 206
13097 9304 141
915 948 96
451 635 71
37 141 26
6067 25430 24
2546 23655 11
1294 13278 10
781 8018 10
- 124 -
MONTGOMERY COUNTY URBAN WATERSHEDS POLLUTANTS IItQjQhabillt$middot
Cii 5 Cii 11 It CD
6 ~ r o ~ s
0 ltIIa r ltII e c ltII III
1 09 08 07 06 05 04 03 02 01
0
$900
$800 $700
v$600 r
0 $500 == $400 $300 11
0 u $200 $100
$shy
_ Sediment load Reduction
--- TMDl WlA Target
__Cost
Rank Restoration Strategy
Sediment reduction
Incremental Cost
Unit Cost
tonsyr Million $ tonsMillion $ 1 Street Sweeping 800 124 645
2 Stream Restoration 25057 9304 269
3 Retrofit of Underperforming BMPs 25 120 21
4 Completed Projects 97 948 10
5 High Priority Projects 47 635 7
6 Other Potential Projects 660 25430 3
7 I Public Property ESD Retrofits 272 23655 1
8 Priority Neighborhoods ESD Retrofits 139 13278 1
9 Private Non-residential ESD Retrofits 84 8018 1
10 Habitat Restoration 2 141 1
11 Pet Waste Education - 088 -
C-3
MONTGOMERY COUNTY URBAN WATERSHEDS POLLUTANTS
-QI5 5i ~
1 09 08 07 06 05 04 03 02 01
0
$900
$800
$700
$600 ~ 0
$500 == $400 $300 11
0 u $200
$100
$shy
--shy TMDL WLA Target
___ Cost
Rank Restoration Strategy
Enterrococci reduction
Incremental Cost
Unit Cost
Billion MPNyr Million $ Billion MPN Million $
1 Pet Waste Education 19643 088 22263
2 Retrofit of Underperforming BMPs 2781 120 2318
3 Completed Projects 10441 948 1101
4 High Priority Projects 5120 635 806
5 Other Potential Projects 69895 25430 275
6 Riparian Reforestation 310 141 219
7 Public Property ESD Retrofits 29025 23655 123
8 Priority Neighborhoods ESD Retrofits 14777 13278 111
9 Private Non-residential ESD Retrofits 8917 8018 111
10 Stream Restoration - 9304 -
11 Street Sweeping - 124 I -
~ I~~~i MONTGOMERY COUNTY URBAN WATERSHEDS POLLUTANTS 1tI2~mL ~ I~I
~$ I -~-- I
100 90 80 70 60 50 40 30 20 10
0
$900 $800 $700 $600 $500 $400 $300 $200 $100 $shy
vi c
~ 5 11 0 u
Implementation Phase
Potential Trash Incremental Unit Cost
I
Rank Restoration Strategy Reduction Cost
Ibsyear Million $ IbsMillion $ 1 Recycling Education and Investigations 51654 02 238837
2 Plastic Bag Ban and Misc Enforcement 63546 13 48882
3 Anti-litter Campaign Education 23J61 09 26930
4 Retrofit of Underperforming BMPs 1144 12 954
5 Completed Projects 6598 95 696
6 High Priority Projects 2786 64 439
7 Other Potential Projects 56341 2543 222
8 Habitat Restoration 266 14 188
9 Street Sweeping 204 12 164
10 Public Property ESD Retrofits 25348 2366 107
11 Priority lIeighborhoods ESD Retrofits 12529 1328 94
12 Private Non-residential ESD Retrofits 7547 802 94 ru Stream Restoration - 930 -14 Pet Waste Education - 09 -
C-5
MONTGOMERY COUNTY URBAN WATERSHEDS POLLUTANTS
CABIN JOHN
1 250
__CostImplementation Phase
09 08 07 06 05 04 03 02 01
0
200 ~ c
150 g E
100 - ltII 0 u
50
0
_E Coli
- - - Waste Load Allocation
Rank Restoration Strategy
E coli reduction
Incremental Cost
Unit Cost
Billion
MPNyr Million $
Billion MPN
Million $ 1 Pet Waste Education 4388 $05 9436
2 Underperforming BMP Retrofits 1892 $19 1022
3 High Priority Projects 1289 $16 800
4 Riparian Reforestation 1133 $78 146
5 Other Potential Projects 148 $17 86
6 Public Property ESD Retrofits 4AOO $860 Sl 7 Private Non-residential ESD Retrofits 1618 $392 41
8 Priority Neighborhoods ESD Retrofits 2633 $638 41
9 Completed Projects 112 $00 0
C-6
MONTGOMERY COUNTY URBAN WATERSHEDS POLLUTANTS 1Itf~~Jabitm
ROCK CREEK
1 $700 Qj5 09
o
_
$600 Qj 08
111 $500 ~ampl 07 c
t5 06 $400 ~ e 05 ~ $3005 04 - 111tl 03 $200 0 u-6 02
$100J 01 $-
Enterrococci
- - - Waste load Allocation Implementation Phase
__Cost
Rank Restoration Strategy
Enterrococci reduction
Incremental Cost
Unit Cost
Billion MPNyr Million $ Billion MPN Million $
Et Pet Waste Management 35734 118 30190
Underperforming BMP Upgrades
Other Potential Projects
28800
30239
577
1083
4995
2792
4 Completed Projects 12131 444 2734
5 High Priority Projects 14239 890 1600
6 Riparian Reforestation 18999 2384 797
7 County Property ESD Retrofits 54519 24136 226
8 Private Residential ESD Retrofits 35230 17737 199
9 Private Non-residential ESD Retrofits 32A86 16380 198
C-7
MONTGOMERY COUNTY URBAN WATERSHEDS POLLUTANTS _f~~pabitafS (fi~r ~~ l-middotshy
ROCK CREEK
100 $900 90 $800 80 $700 u70 $600 c 60 2$50050 -~$40040
lt1$300 030 $200 u
20 10 $100
0 $shy
Implementation Phase
Rank Restoration Strategy Trash Reduction
Incremental Cost
Unit Cost I
Ibsyear Million $ IbsMillion $ 1 Other Potential Projects 16038 1085 1478
2 Underperforming BMP Upgrades 6756 577 1172
3 Completed Projects 4217 444 950
4 High Priority Projects 6366 890 715
5 Riparian Reforestation 9237 2384 387
6 Public Property ESD Retrofits 24587 24136 102
7 Priority Neighborhoods ESD Retrofits 16155 17737 91
8 Private Non-residential ESD Retrofits 14793 16380 90
9 Pet Waste Education - 118 -
(-8
MONTGOMERY COUNTY RURAL WATERSHEDS POLLUTANTS
SENECA - CLOPPER LAKE -
100 Qi
90 iii 80VI to -CQ 70 0 60e 50I 0 40 u l 30
C QJ 20ex
C 10to 0
J 0
$18
$16
$14 n
$12 I
$10 sect $08 ~ $06 0
VI
U $04
$02
$shy
_TPRemoval - - - TMDL Reduction Target
Implementation Phase ___Cost
Rank Restoration Strategy TP
Reduction (Ibsyr)
Incremental Cost (Million $)
Unit Cost (IbsvrMillion $)
1 Residential Education 33 001 6246
2 Underperforming BMP Retrofits 13 004 341 3 Riparian Buffer Reforestation 19 023 99 4 Priority Neighborhood ESD Retrofits 15 051 35 5 Public Property ESD Retrofits 7 075 99
C-9
-pj[fti
MONTGOMERY COUNTY URBAN WATERSHEDS POLLUTANTS 1It[~~JIlbitIL f bull~
LOWER MONOCACY
1 09 08 07 06 05 04 03 02 01
0
Implementation Phase
25
20 ~ c
15 ~ ~
10 - 0 u
5
0
_TSS
- - - Waste load Allocation _Cost
Rank Restoration Strategy
Sediment reduction
Incremental
Cost Unit Cost
tonsyear Million $ tonMilli
1 Street Sweeping 22 $007 3121
2 Underperforming BMP Retrofits 4 $010 389
3 Stream Restoration 37 $734 51
4 Riparian Buffer Reforestation 3 $109 25
5 Other Structural BMPs and ESD Strategies 10 $851 12
6 Priority Neighborhoods ESD Retrofits 2 $160 10
7 Non-residential ESD Retrofits 1 $132 10
C-10
MONTGOMERY COUNTY RURAL WATERSHEDS POLLUTANTS 1tlj~lIbiIalSlt~~II
1 09 08 07 06 05 04 03 02 01
0
$70
$60
$50 ~ c
$40 ~ ~ $30 - UI
$20 0 v
$10
$0
_ Phosphorus Load Reduction
- - - Waste Load Allocation ___ CostImplementation Phase
Rank Restoration Strategy TP Incremental Cost
Million $ Unit Cost
Ibsyr Ibs Million $ 1 Lawn Care Education 3670 01 37394
2 Underperforming BMP Retrofits 3499 08 4338
3 Other Potential Projects 3524 33 1076
4 High Priority Projects 252 04 685
5 Riparian Reforestation 762 26 298
6 Public Property Retrofits 5854 345 169
7 Priority Neighborhoods ESD Retrofits 796 65 123
8 Private Non-residential ESD Retrofits 1941 168 116
9 Completed Projects 53 00 00
c- 11
MONTGOMERY COUNTY RURAL WATERSHEDS POLLUTANTSal12hdJilats ~I~ ~ [ -
1 10 ii 5 09 9 1 08 8 II al- 07 7 1ii o 06 6
c
~ ~ 1 o E IV
05 04 03
5 4
3
~ 11 0 u
0 11 02 2 J o 01 1
t a 0 0 11 o
t 0
_ Phosphorus Reduction
- - - Waste Load Allocation
-Cost
Rank Restoration Strategy TP Incremental Cost
Million $ Unit Cost
Ibsyr Ibs Million $ 1 Lawn Care Education 3670 01 37394
2 Underperforming BMP Retrofits 3499 08 4338
3 Other Potential Projects 3524 33 1076
4 High Priority Projects 252 04 685
5 Riparian Reforestation 762 26 298
6 Public Property Retrofits 5854 345 169
7 Priority Neighborhoods ESD Retrofits 796 65 123
8 Private Non-residential ESD Retrofits 1941 168 116
9 Completed Projects 53 00 00
C-12
Montgomery County Coordinated Implementation Strategy - DRAFT
Appendix C - Restoration Potential by Watershed
021611
c-
04 03 02 01
a
_ Nitrogen Load Reduction
--shy TMDL WLA Target
_Cost
MONTGOMERY COUNTY URBAN WATERSHEDS POLLUTANTS _Bk)~Ibilats ~1~ l~ fjfsi --
Rank
1
2
3
4
5
6
7
8
9
10
11
Restoration Strategy TN reduction
Ibsyr
Pet Waste Education 15169
Retrofit of Underperforming BMPs 1769
Stream Restoration 72423
Completed Projects ~43 High Priority Projects 3260
Other Potential Projects 43276
Habitat Restoration 224
Public Property ESD Retrofits 18270
Priority Neighborhoods ESD Retrofits 9271
Private Non-residential ESD Retrofits 5594
Street Sweeping -
Incremental Cost Unit Cost
Million $ IbsMillion $ 088 17193
120 1475
9304 778
948 701
635 513
25430 170
141 158
23655 77
13278 70
8018 70
124 -
Qj c
Qj
nI CXI
o -f-
1 09 08 07 06 05
$900 $800 $700
~ $600 c $500 ~ $400 $300 0 u $200 $100
$shy
~~mf il_~IJrt~
MONTGOMERY COUNTY URBAN WATERSHEDS POLLUTANTS ItfiQ14lbilJts i~5 [i
1 $900 Qj
09 $8005 iii en 08 $700
~co 07 $600 co - til
06 $500 ~ 05- $400 ~ 04 en$300 003 u $20002
en $100I 01 o 0 $shys Q en o
s Q
Phosphorus Load Reduction
--- TMDL WLA Target
__Cost
I Rank I
1
2
3
4
5
6
7
8
9
Restoration Strategy
Pet Waste Education
Retrofit of Underperforming BMPs
Stream Restoration
Completed Projects
High Priority Projects
Habitat Restoration
Other Potential Projects
Public Property ESD Retrofits
Priority Neighborhoods ESD Retrofits
10 I Private Non-residential ESD Retrofits
11 Street Sweeping
TP reduction Incremental Cost Unit Cost
Ibsyr Million $ IbsMillion $ 1979 088 2243
247 120 206
13097 9304 141
915 948 96
451 635 71
37 141 26
6067 25430 24
2546 23655 11
1294 13278 10
781 8018 10
- 124 -
MONTGOMERY COUNTY URBAN WATERSHEDS POLLUTANTS IItQjQhabillt$middot
Cii 5 Cii 11 It CD
6 ~ r o ~ s
0 ltIIa r ltII e c ltII III
1 09 08 07 06 05 04 03 02 01
0
$900
$800 $700
v$600 r
0 $500 == $400 $300 11
0 u $200 $100
$shy
_ Sediment load Reduction
--- TMDl WlA Target
__Cost
Rank Restoration Strategy
Sediment reduction
Incremental Cost
Unit Cost
tonsyr Million $ tonsMillion $ 1 Street Sweeping 800 124 645
2 Stream Restoration 25057 9304 269
3 Retrofit of Underperforming BMPs 25 120 21
4 Completed Projects 97 948 10
5 High Priority Projects 47 635 7
6 Other Potential Projects 660 25430 3
7 I Public Property ESD Retrofits 272 23655 1
8 Priority Neighborhoods ESD Retrofits 139 13278 1
9 Private Non-residential ESD Retrofits 84 8018 1
10 Habitat Restoration 2 141 1
11 Pet Waste Education - 088 -
C-3
MONTGOMERY COUNTY URBAN WATERSHEDS POLLUTANTS
-QI5 5i ~
1 09 08 07 06 05 04 03 02 01
0
$900
$800
$700
$600 ~ 0
$500 == $400 $300 11
0 u $200
$100
$shy
--shy TMDL WLA Target
___ Cost
Rank Restoration Strategy
Enterrococci reduction
Incremental Cost
Unit Cost
Billion MPNyr Million $ Billion MPN Million $
1 Pet Waste Education 19643 088 22263
2 Retrofit of Underperforming BMPs 2781 120 2318
3 Completed Projects 10441 948 1101
4 High Priority Projects 5120 635 806
5 Other Potential Projects 69895 25430 275
6 Riparian Reforestation 310 141 219
7 Public Property ESD Retrofits 29025 23655 123
8 Priority Neighborhoods ESD Retrofits 14777 13278 111
9 Private Non-residential ESD Retrofits 8917 8018 111
10 Stream Restoration - 9304 -
11 Street Sweeping - 124 I -
~ I~~~i MONTGOMERY COUNTY URBAN WATERSHEDS POLLUTANTS 1tI2~mL ~ I~I
~$ I -~-- I
100 90 80 70 60 50 40 30 20 10
0
$900 $800 $700 $600 $500 $400 $300 $200 $100 $shy
vi c
~ 5 11 0 u
Implementation Phase
Potential Trash Incremental Unit Cost
I
Rank Restoration Strategy Reduction Cost
Ibsyear Million $ IbsMillion $ 1 Recycling Education and Investigations 51654 02 238837
2 Plastic Bag Ban and Misc Enforcement 63546 13 48882
3 Anti-litter Campaign Education 23J61 09 26930
4 Retrofit of Underperforming BMPs 1144 12 954
5 Completed Projects 6598 95 696
6 High Priority Projects 2786 64 439
7 Other Potential Projects 56341 2543 222
8 Habitat Restoration 266 14 188
9 Street Sweeping 204 12 164
10 Public Property ESD Retrofits 25348 2366 107
11 Priority lIeighborhoods ESD Retrofits 12529 1328 94
12 Private Non-residential ESD Retrofits 7547 802 94 ru Stream Restoration - 930 -14 Pet Waste Education - 09 -
C-5
MONTGOMERY COUNTY URBAN WATERSHEDS POLLUTANTS
CABIN JOHN
1 250
__CostImplementation Phase
09 08 07 06 05 04 03 02 01
0
200 ~ c
150 g E
100 - ltII 0 u
50
0
_E Coli
- - - Waste Load Allocation
Rank Restoration Strategy
E coli reduction
Incremental Cost
Unit Cost
Billion
MPNyr Million $
Billion MPN
Million $ 1 Pet Waste Education 4388 $05 9436
2 Underperforming BMP Retrofits 1892 $19 1022
3 High Priority Projects 1289 $16 800
4 Riparian Reforestation 1133 $78 146
5 Other Potential Projects 148 $17 86
6 Public Property ESD Retrofits 4AOO $860 Sl 7 Private Non-residential ESD Retrofits 1618 $392 41
8 Priority Neighborhoods ESD Retrofits 2633 $638 41
9 Completed Projects 112 $00 0
C-6
MONTGOMERY COUNTY URBAN WATERSHEDS POLLUTANTS 1Itf~~Jabitm
ROCK CREEK
1 $700 Qj5 09
o
_
$600 Qj 08
111 $500 ~ampl 07 c
t5 06 $400 ~ e 05 ~ $3005 04 - 111tl 03 $200 0 u-6 02
$100J 01 $-
Enterrococci
- - - Waste load Allocation Implementation Phase
__Cost
Rank Restoration Strategy
Enterrococci reduction
Incremental Cost
Unit Cost
Billion MPNyr Million $ Billion MPN Million $
Et Pet Waste Management 35734 118 30190
Underperforming BMP Upgrades
Other Potential Projects
28800
30239
577
1083
4995
2792
4 Completed Projects 12131 444 2734
5 High Priority Projects 14239 890 1600
6 Riparian Reforestation 18999 2384 797
7 County Property ESD Retrofits 54519 24136 226
8 Private Residential ESD Retrofits 35230 17737 199
9 Private Non-residential ESD Retrofits 32A86 16380 198
C-7
MONTGOMERY COUNTY URBAN WATERSHEDS POLLUTANTS _f~~pabitafS (fi~r ~~ l-middotshy
ROCK CREEK
100 $900 90 $800 80 $700 u70 $600 c 60 2$50050 -~$40040
lt1$300 030 $200 u
20 10 $100
0 $shy
Implementation Phase
Rank Restoration Strategy Trash Reduction
Incremental Cost
Unit Cost I
Ibsyear Million $ IbsMillion $ 1 Other Potential Projects 16038 1085 1478
2 Underperforming BMP Upgrades 6756 577 1172
3 Completed Projects 4217 444 950
4 High Priority Projects 6366 890 715
5 Riparian Reforestation 9237 2384 387
6 Public Property ESD Retrofits 24587 24136 102
7 Priority Neighborhoods ESD Retrofits 16155 17737 91
8 Private Non-residential ESD Retrofits 14793 16380 90
9 Pet Waste Education - 118 -
(-8
MONTGOMERY COUNTY RURAL WATERSHEDS POLLUTANTS
SENECA - CLOPPER LAKE -
100 Qi
90 iii 80VI to -CQ 70 0 60e 50I 0 40 u l 30
C QJ 20ex
C 10to 0
J 0
$18
$16
$14 n
$12 I
$10 sect $08 ~ $06 0
VI
U $04
$02
$shy
_TPRemoval - - - TMDL Reduction Target
Implementation Phase ___Cost
Rank Restoration Strategy TP
Reduction (Ibsyr)
Incremental Cost (Million $)
Unit Cost (IbsvrMillion $)
1 Residential Education 33 001 6246
2 Underperforming BMP Retrofits 13 004 341 3 Riparian Buffer Reforestation 19 023 99 4 Priority Neighborhood ESD Retrofits 15 051 35 5 Public Property ESD Retrofits 7 075 99
C-9
-pj[fti
MONTGOMERY COUNTY URBAN WATERSHEDS POLLUTANTS 1It[~~JIlbitIL f bull~
LOWER MONOCACY
1 09 08 07 06 05 04 03 02 01
0
Implementation Phase
25
20 ~ c
15 ~ ~
10 - 0 u
5
0
_TSS
- - - Waste load Allocation _Cost
Rank Restoration Strategy
Sediment reduction
Incremental
Cost Unit Cost
tonsyear Million $ tonMilli
1 Street Sweeping 22 $007 3121
2 Underperforming BMP Retrofits 4 $010 389
3 Stream Restoration 37 $734 51
4 Riparian Buffer Reforestation 3 $109 25
5 Other Structural BMPs and ESD Strategies 10 $851 12
6 Priority Neighborhoods ESD Retrofits 2 $160 10
7 Non-residential ESD Retrofits 1 $132 10
C-10
MONTGOMERY COUNTY RURAL WATERSHEDS POLLUTANTS 1tlj~lIbiIalSlt~~II
1 09 08 07 06 05 04 03 02 01
0
$70
$60
$50 ~ c
$40 ~ ~ $30 - UI
$20 0 v
$10
$0
_ Phosphorus Load Reduction
- - - Waste Load Allocation ___ CostImplementation Phase
Rank Restoration Strategy TP Incremental Cost
Million $ Unit Cost
Ibsyr Ibs Million $ 1 Lawn Care Education 3670 01 37394
2 Underperforming BMP Retrofits 3499 08 4338
3 Other Potential Projects 3524 33 1076
4 High Priority Projects 252 04 685
5 Riparian Reforestation 762 26 298
6 Public Property Retrofits 5854 345 169
7 Priority Neighborhoods ESD Retrofits 796 65 123
8 Private Non-residential ESD Retrofits 1941 168 116
9 Completed Projects 53 00 00
c- 11
MONTGOMERY COUNTY RURAL WATERSHEDS POLLUTANTSal12hdJilats ~I~ ~ [ -
1 10 ii 5 09 9 1 08 8 II al- 07 7 1ii o 06 6
c
~ ~ 1 o E IV
05 04 03
5 4
3
~ 11 0 u
0 11 02 2 J o 01 1
t a 0 0 11 o
t 0
_ Phosphorus Reduction
- - - Waste Load Allocation
-Cost
Rank Restoration Strategy TP Incremental Cost
Million $ Unit Cost
Ibsyr Ibs Million $ 1 Lawn Care Education 3670 01 37394
2 Underperforming BMP Retrofits 3499 08 4338
3 Other Potential Projects 3524 33 1076
4 High Priority Projects 252 04 685
5 Riparian Reforestation 762 26 298
6 Public Property Retrofits 5854 345 169
7 Priority Neighborhoods ESD Retrofits 796 65 123
8 Private Non-residential ESD Retrofits 1941 168 116
9 Completed Projects 53 00 00
C-12
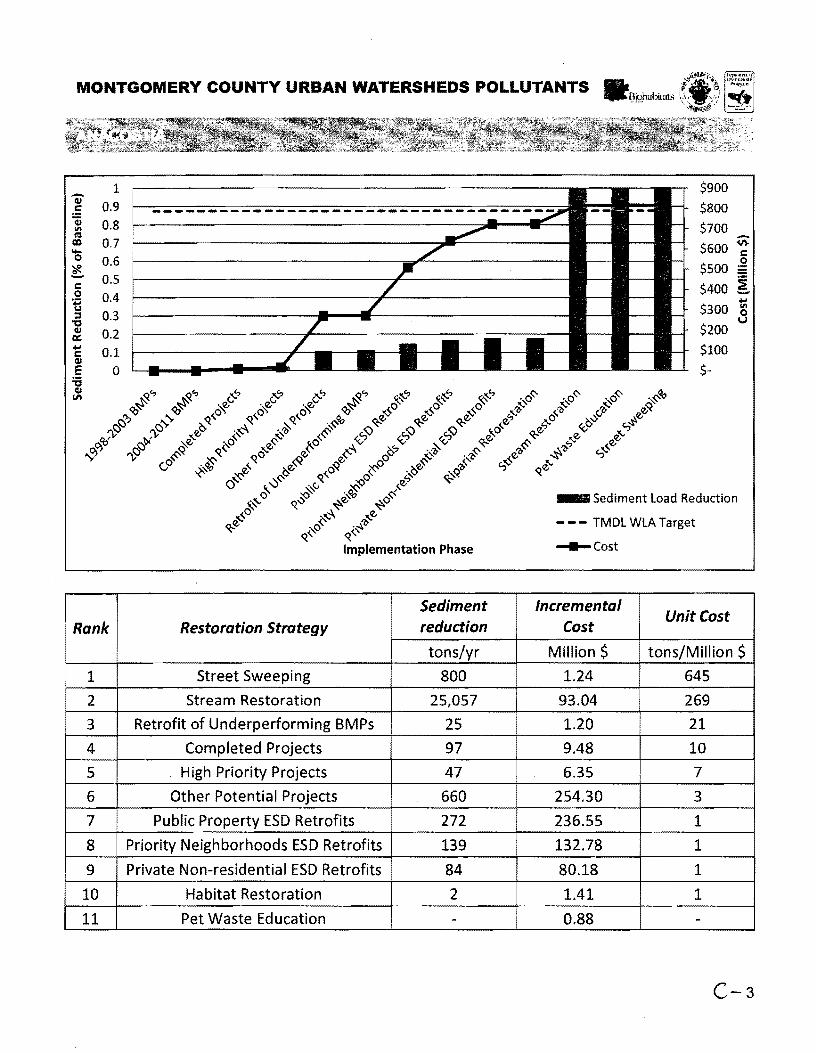
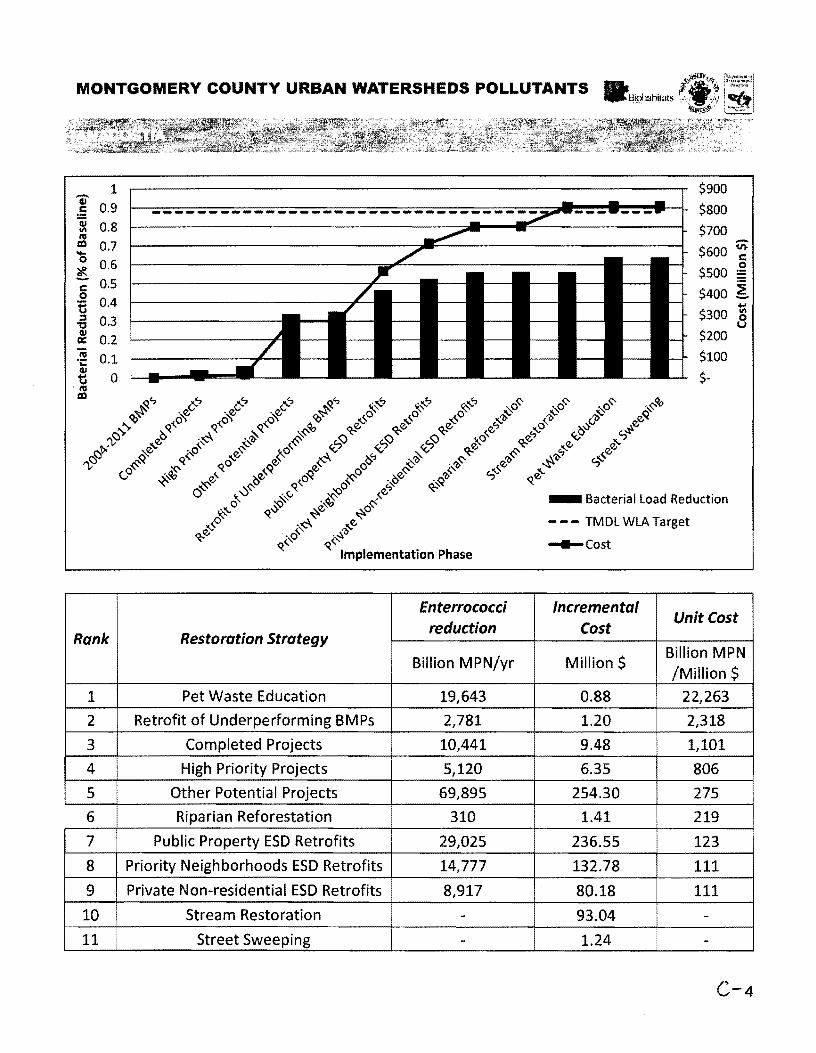
MONTGOMERY COUNTY URBAN WATERSHEDS POLLUTANTS
-QI5 5i ~
1 09 08 07 06 05 04 03 02 01
0
$900
$800
$700
$600 ~ 0
$500 == $400 $300 11
0 u $200
$100
$shy
--shy TMDL WLA Target
___ Cost
Rank Restoration Strategy
Enterrococci reduction
Incremental Cost
Unit Cost
Billion MPNyr Million $ Billion MPN Million $
1 Pet Waste Education 19643 088 22263
2 Retrofit of Underperforming BMPs 2781 120 2318
3 Completed Projects 10441 948 1101
4 High Priority Projects 5120 635 806
5 Other Potential Projects 69895 25430 275
6 Riparian Reforestation 310 141 219
7 Public Property ESD Retrofits 29025 23655 123
8 Priority Neighborhoods ESD Retrofits 14777 13278 111
9 Private Non-residential ESD Retrofits 8917 8018 111
10 Stream Restoration - 9304 -
11 Street Sweeping - 124 I -
~ I~~~i MONTGOMERY COUNTY URBAN WATERSHEDS POLLUTANTS 1tI2~mL ~ I~I
~$ I -~-- I
100 90 80 70 60 50 40 30 20 10
0
$900 $800 $700 $600 $500 $400 $300 $200 $100 $shy
vi c
~ 5 11 0 u
Implementation Phase
Potential Trash Incremental Unit Cost
I
Rank Restoration Strategy Reduction Cost
Ibsyear Million $ IbsMillion $ 1 Recycling Education and Investigations 51654 02 238837
2 Plastic Bag Ban and Misc Enforcement 63546 13 48882
3 Anti-litter Campaign Education 23J61 09 26930
4 Retrofit of Underperforming BMPs 1144 12 954
5 Completed Projects 6598 95 696
6 High Priority Projects 2786 64 439
7 Other Potential Projects 56341 2543 222
8 Habitat Restoration 266 14 188
9 Street Sweeping 204 12 164
10 Public Property ESD Retrofits 25348 2366 107
11 Priority lIeighborhoods ESD Retrofits 12529 1328 94
12 Private Non-residential ESD Retrofits 7547 802 94 ru Stream Restoration - 930 -14 Pet Waste Education - 09 -
C-5
MONTGOMERY COUNTY URBAN WATERSHEDS POLLUTANTS
CABIN JOHN
1 250
__CostImplementation Phase
09 08 07 06 05 04 03 02 01
0
200 ~ c
150 g E
100 - ltII 0 u
50
0
_E Coli
- - - Waste Load Allocation
Rank Restoration Strategy
E coli reduction
Incremental Cost
Unit Cost
Billion
MPNyr Million $
Billion MPN
Million $ 1 Pet Waste Education 4388 $05 9436
2 Underperforming BMP Retrofits 1892 $19 1022
3 High Priority Projects 1289 $16 800
4 Riparian Reforestation 1133 $78 146
5 Other Potential Projects 148 $17 86
6 Public Property ESD Retrofits 4AOO $860 Sl 7 Private Non-residential ESD Retrofits 1618 $392 41
8 Priority Neighborhoods ESD Retrofits 2633 $638 41
9 Completed Projects 112 $00 0
C-6
MONTGOMERY COUNTY URBAN WATERSHEDS POLLUTANTS 1Itf~~Jabitm
ROCK CREEK
1 $700 Qj5 09
o
_
$600 Qj 08
111 $500 ~ampl 07 c
t5 06 $400 ~ e 05 ~ $3005 04 - 111tl 03 $200 0 u-6 02
$100J 01 $-
Enterrococci
- - - Waste load Allocation Implementation Phase
__Cost
Rank Restoration Strategy
Enterrococci reduction
Incremental Cost
Unit Cost
Billion MPNyr Million $ Billion MPN Million $
Et Pet Waste Management 35734 118 30190
Underperforming BMP Upgrades
Other Potential Projects
28800
30239
577
1083
4995
2792
4 Completed Projects 12131 444 2734
5 High Priority Projects 14239 890 1600
6 Riparian Reforestation 18999 2384 797
7 County Property ESD Retrofits 54519 24136 226
8 Private Residential ESD Retrofits 35230 17737 199
9 Private Non-residential ESD Retrofits 32A86 16380 198
C-7
MONTGOMERY COUNTY URBAN WATERSHEDS POLLUTANTS _f~~pabitafS (fi~r ~~ l-middotshy
ROCK CREEK
100 $900 90 $800 80 $700 u70 $600 c 60 2$50050 -~$40040
lt1$300 030 $200 u
20 10 $100
0 $shy
Implementation Phase
Rank Restoration Strategy Trash Reduction
Incremental Cost
Unit Cost I
Ibsyear Million $ IbsMillion $ 1 Other Potential Projects 16038 1085 1478
2 Underperforming BMP Upgrades 6756 577 1172
3 Completed Projects 4217 444 950
4 High Priority Projects 6366 890 715
5 Riparian Reforestation 9237 2384 387
6 Public Property ESD Retrofits 24587 24136 102
7 Priority Neighborhoods ESD Retrofits 16155 17737 91
8 Private Non-residential ESD Retrofits 14793 16380 90
9 Pet Waste Education - 118 -
(-8
MONTGOMERY COUNTY RURAL WATERSHEDS POLLUTANTS
SENECA - CLOPPER LAKE -
100 Qi
90 iii 80VI to -CQ 70 0 60e 50I 0 40 u l 30
C QJ 20ex
C 10to 0
J 0
$18
$16
$14 n
$12 I
$10 sect $08 ~ $06 0
VI
U $04
$02
$shy
_TPRemoval - - - TMDL Reduction Target
Implementation Phase ___Cost
Rank Restoration Strategy TP
Reduction (Ibsyr)
Incremental Cost (Million $)
Unit Cost (IbsvrMillion $)
1 Residential Education 33 001 6246
2 Underperforming BMP Retrofits 13 004 341 3 Riparian Buffer Reforestation 19 023 99 4 Priority Neighborhood ESD Retrofits 15 051 35 5 Public Property ESD Retrofits 7 075 99
C-9
-pj[fti
MONTGOMERY COUNTY URBAN WATERSHEDS POLLUTANTS 1It[~~JIlbitIL f bull~
LOWER MONOCACY
1 09 08 07 06 05 04 03 02 01
0
Implementation Phase
25
20 ~ c
15 ~ ~
10 - 0 u
5
0
_TSS
- - - Waste load Allocation _Cost
Rank Restoration Strategy
Sediment reduction
Incremental
Cost Unit Cost
tonsyear Million $ tonMilli
1 Street Sweeping 22 $007 3121
2 Underperforming BMP Retrofits 4 $010 389
3 Stream Restoration 37 $734 51
4 Riparian Buffer Reforestation 3 $109 25
5 Other Structural BMPs and ESD Strategies 10 $851 12
6 Priority Neighborhoods ESD Retrofits 2 $160 10
7 Non-residential ESD Retrofits 1 $132 10
C-10
MONTGOMERY COUNTY RURAL WATERSHEDS POLLUTANTS 1tlj~lIbiIalSlt~~II
1 09 08 07 06 05 04 03 02 01
0
$70
$60
$50 ~ c
$40 ~ ~ $30 - UI
$20 0 v
$10
$0
_ Phosphorus Load Reduction
- - - Waste Load Allocation ___ CostImplementation Phase
Rank Restoration Strategy TP Incremental Cost
Million $ Unit Cost
Ibsyr Ibs Million $ 1 Lawn Care Education 3670 01 37394
2 Underperforming BMP Retrofits 3499 08 4338
3 Other Potential Projects 3524 33 1076
4 High Priority Projects 252 04 685
5 Riparian Reforestation 762 26 298
6 Public Property Retrofits 5854 345 169
7 Priority Neighborhoods ESD Retrofits 796 65 123
8 Private Non-residential ESD Retrofits 1941 168 116
9 Completed Projects 53 00 00
c- 11
MONTGOMERY COUNTY RURAL WATERSHEDS POLLUTANTSal12hdJilats ~I~ ~ [ -
1 10 ii 5 09 9 1 08 8 II al- 07 7 1ii o 06 6
c
~ ~ 1 o E IV
05 04 03
5 4
3
~ 11 0 u
0 11 02 2 J o 01 1
t a 0 0 11 o
t 0
_ Phosphorus Reduction
- - - Waste Load Allocation
-Cost
Rank Restoration Strategy TP Incremental Cost
Million $ Unit Cost
Ibsyr Ibs Million $ 1 Lawn Care Education 3670 01 37394
2 Underperforming BMP Retrofits 3499 08 4338
3 Other Potential Projects 3524 33 1076
4 High Priority Projects 252 04 685
5 Riparian Reforestation 762 26 298
6 Public Property Retrofits 5854 345 169
7 Priority Neighborhoods ESD Retrofits 796 65 123
8 Private Non-residential ESD Retrofits 1941 168 116
9 Completed Projects 53 00 00
C-12
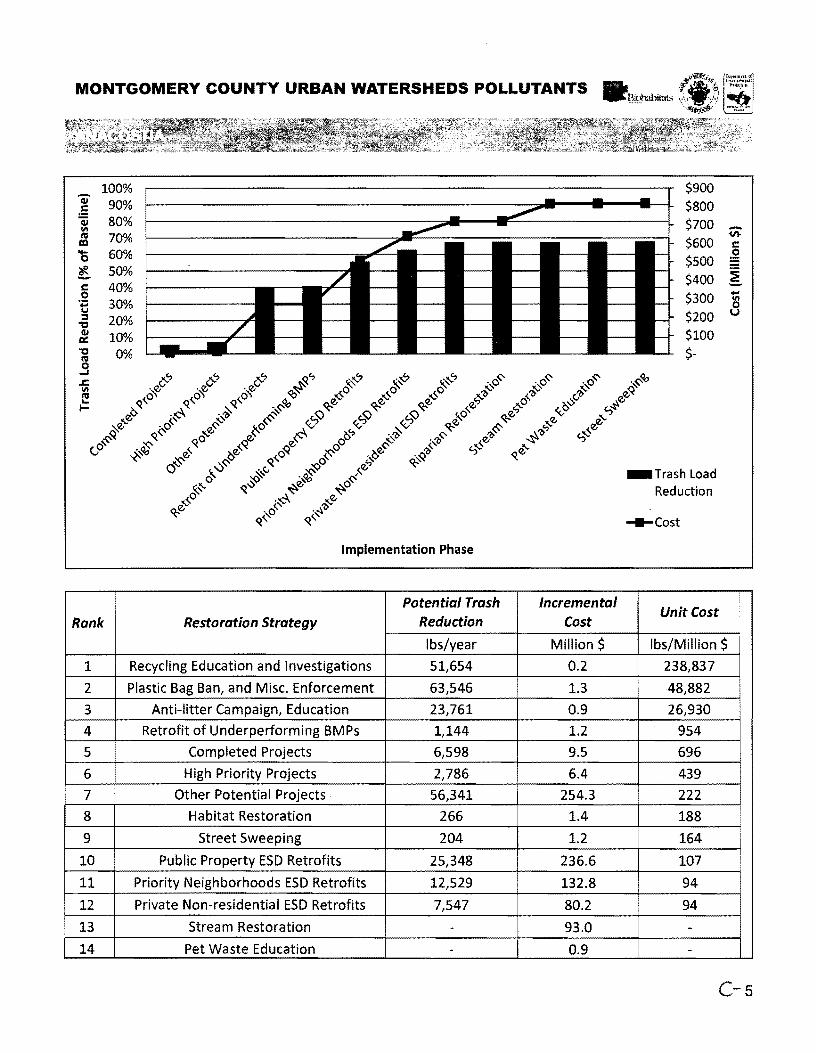
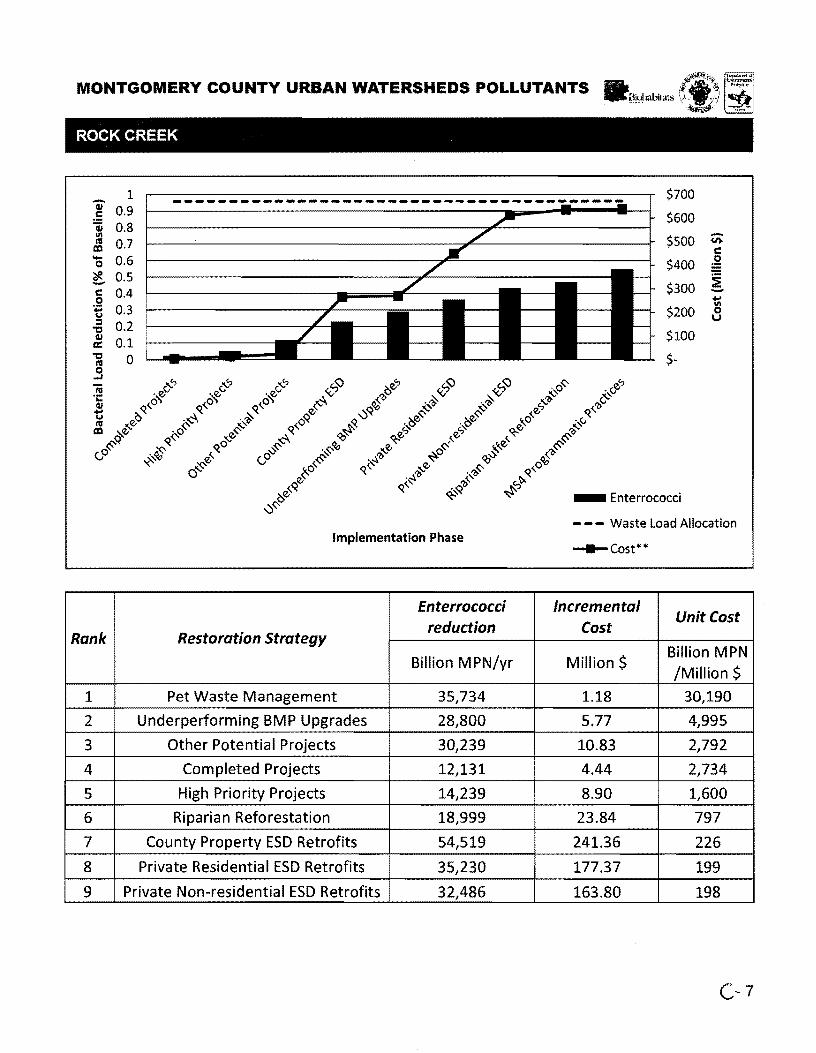
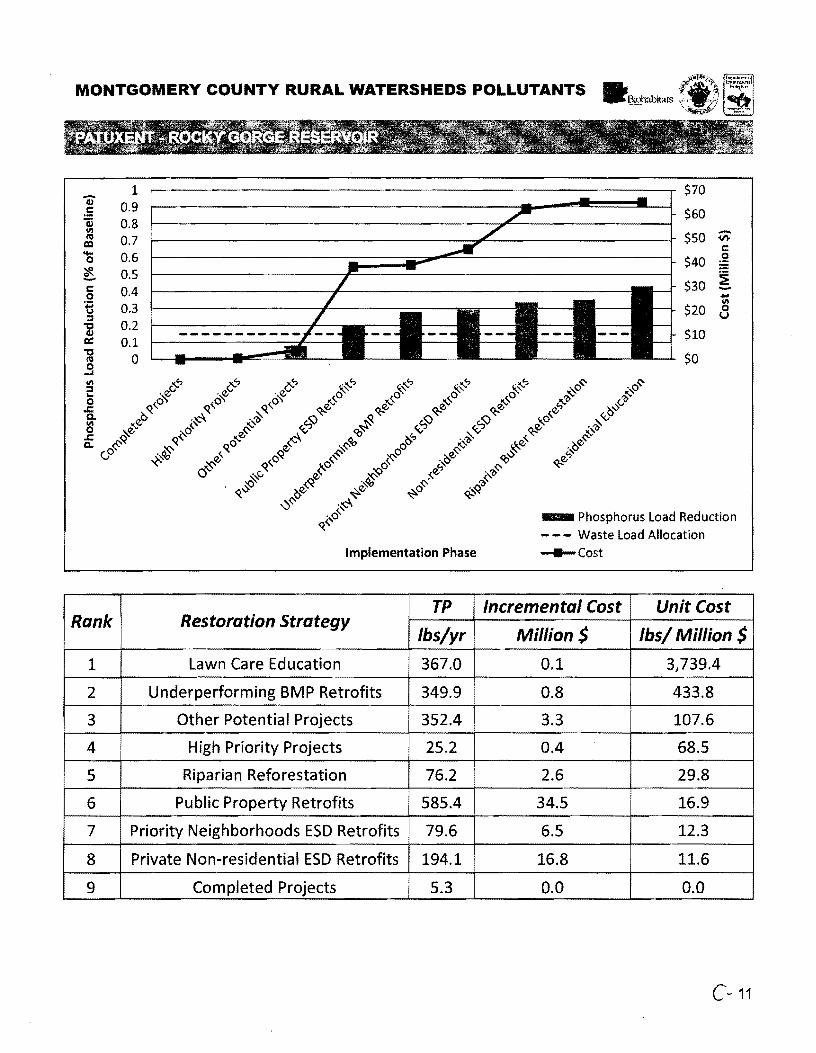


![Sent: 16,2011 PM To...From: Chrisanne Finnetty [mailto:chrisanne.finnerty@caledon.ca] Sent: December 16,2011 3:34 PM To: Reid, Carol Subjeck Aggregate Resources Act (AM) Site plan](https://img.pdfslide.us/doc/110x75/60047cd54b5f863a404a6fb2/sent-162011-pm-to-from-chrisanne-finnetty-mailtochrisannefinnertycaledonca.jpg)