Embed Size (px)
Citation preview

To the Graduate Council: I am submitting herewith a thesis written by Glendon Shaun Jackson entitled “A Survey of Meat Goat Producers in Tennessee and Surrounding Areas.” I have examined the final paper copy of this thesis for form and content and recommend that it be accepted in partial fulfillment of the requirements for the degree of Master of Science, with a major in Agricultural Operations Management.
________________________ Richard Joost
Major Professor We have read this thesis and recommend its acceptance: ________________________ An Peischel ________________________ Joey Mehlhorn ________________________ Rob Holland
Acceptance for the Council:
________________________ Victoria S. Seng
Associate Vice-Chancellor and Dean of Graduate Studies
A Survey of Meat Goat Producers in Tennessee and Surrounding Areas
A Thesis Presented For the Master of Science
Degree The University of Tennessee at Martin
Glendon Shaun Jackson May 2007
ii
ABSTRACT
Despite the fact that Tennessee ranks second in number of goats (USDA-NASS,
2002) there has been minimal research conducted on goat production in Tennessee. This
study surveyed goat producers in Tennessee and surrounding areas with the objective of
gathering information on goat producers and goat production. The study found that most
goat producers have less than 10 years experience raising goats. Other major findings for
the study include: Approximately 84 percent of goat producers do not have a written
marketing plan. Most producers (89.60 percent) want to either increase or maintain the
size of their goat herd in the future. Goats owned in the survey area are primarily Boer or
Boer Crosses (55.69 percent does, 57.14 percent bucks). Producers are not meeting
demand for holiday markets. Most producers utilize livestock auctions to sell their goats,
but most are interested in considering new or alternative markets.
iii
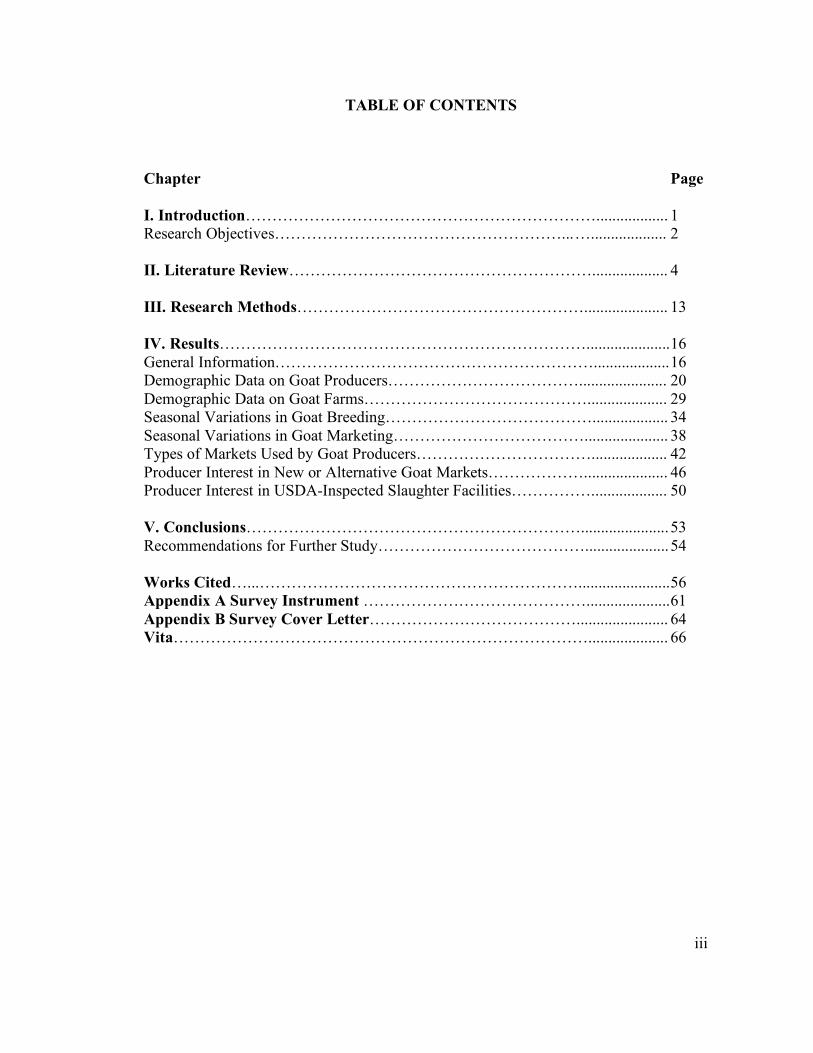
TABLE OF CONTENTS
Chapter Page I. Introduction………………………………………………………….................. 1 Research Objectives………………………………………………... …................... 2 II. Literature Review…………………………………………………................... 4 III. Research Methods………………………………………………..................... 13 IV. Results……………………………………………………………..................... 16 General Information……………………………………………………................... 16 Demographic Data on Goat Producers………………………………...................... 20 Demographic Data on Goat Farms…………………………………….................... 29 Seasonal Variations in Goat Breeding…………………………………................... 34 Seasonal Variations in Goat Marketing………………………………..................... 38 Types of Markets Used by Goat Producers……………………………................... 42 Producer Interest in New or Alternative Goat Markets………………..................... 46 Producer Interest in USDA-Inspected Slaughter Facilities……………................... 50 V. Conclusions………………………………………………………...................... 53 Recommendations for Further Study…………………………………..................... 54 Works Cited…...……………………………………………………....................... 56 Appendix A Survey Instrument ……………………………………..................... 61 Appendix B Survey Cover Letter…………………………………....................... 64 Vita…………………………………………………………………….................... 66
iv
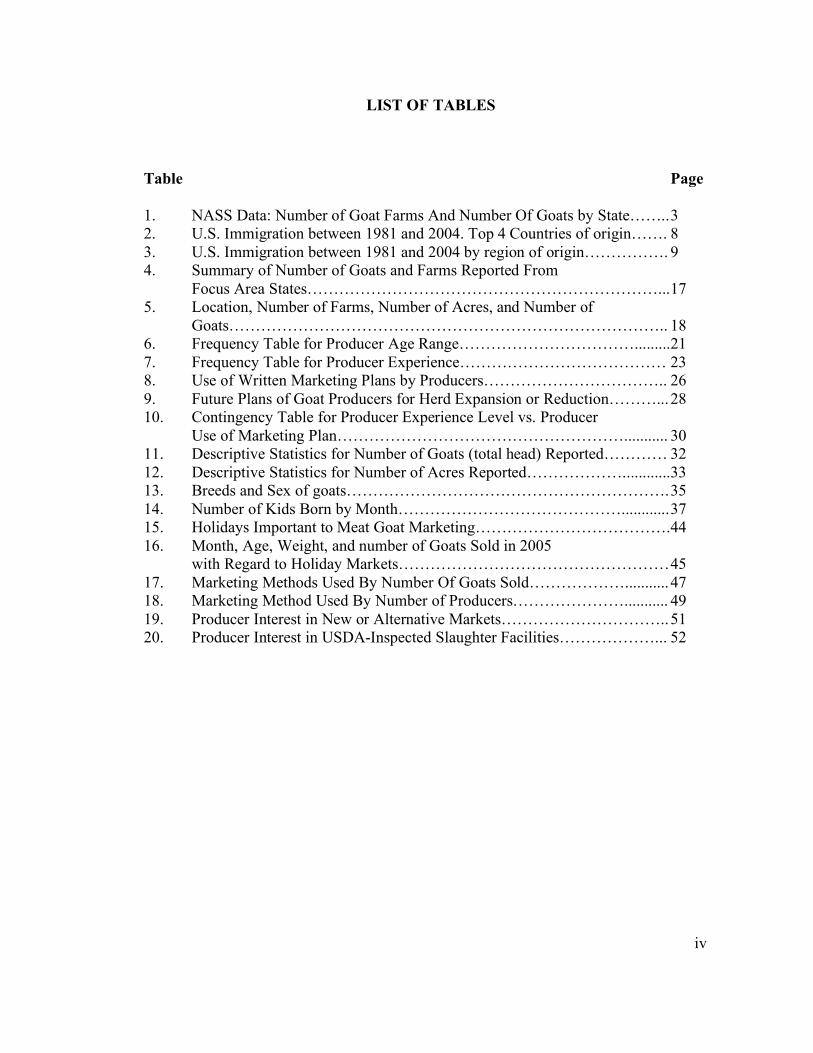
LIST OF TABLES
Table Page 1. NASS Data: Number of Goat Farms And Number Of Goats by State…….. 3 2. U.S. Immigration between 1981 and 2004. Top 4 Countries of origin……. 8 3. U.S. Immigration between 1981 and 2004 by region of origin……………. 9 4. Summary of Number of Goats and Farms Reported From Focus Area States…………………………………………………………... 17 5. Location, Number of Farms, Number of Acres, and Number of Goats……………………………………………………………………….. 18 6. Frequency Table for Producer Age Range……………………………......... 21 7. Frequency Table for Producer Experience………………………………… 23 8. Use of Written Marketing Plans by Producers…………………………….. 26 9. Future Plans of Goat Producers for Herd Expansion or Reduction………... 28 10. Contingency Table for Producer Experience Level vs. Producer Use of Marketing Plan………………………………………………........... 30 11. Descriptive Statistics for Number of Goats (total head) Reported………… 32 12. Descriptive Statistics for Number of Acres Reported………………............ 33 13. Breeds and Sex of goats……………………………………………………. 35 14. Number of Kids Born by Month……………………………………............ 37 15. Holidays Important to Meat Goat Marketing………………………………. 44 16. Month, Age, Weight, and number of Goats Sold in 2005 with Regard to Holiday Markets…………………………………………… 45 17. Marketing Methods Used By Number Of Goats Sold………………........... 47 18. Marketing Method Used By Number of Producers…………………........... 49 19. Producer Interest in New or Alternative Markets………………………….. 51 20. Producer Interest in USDA-Inspected Slaughter Facilities………………... 52
v
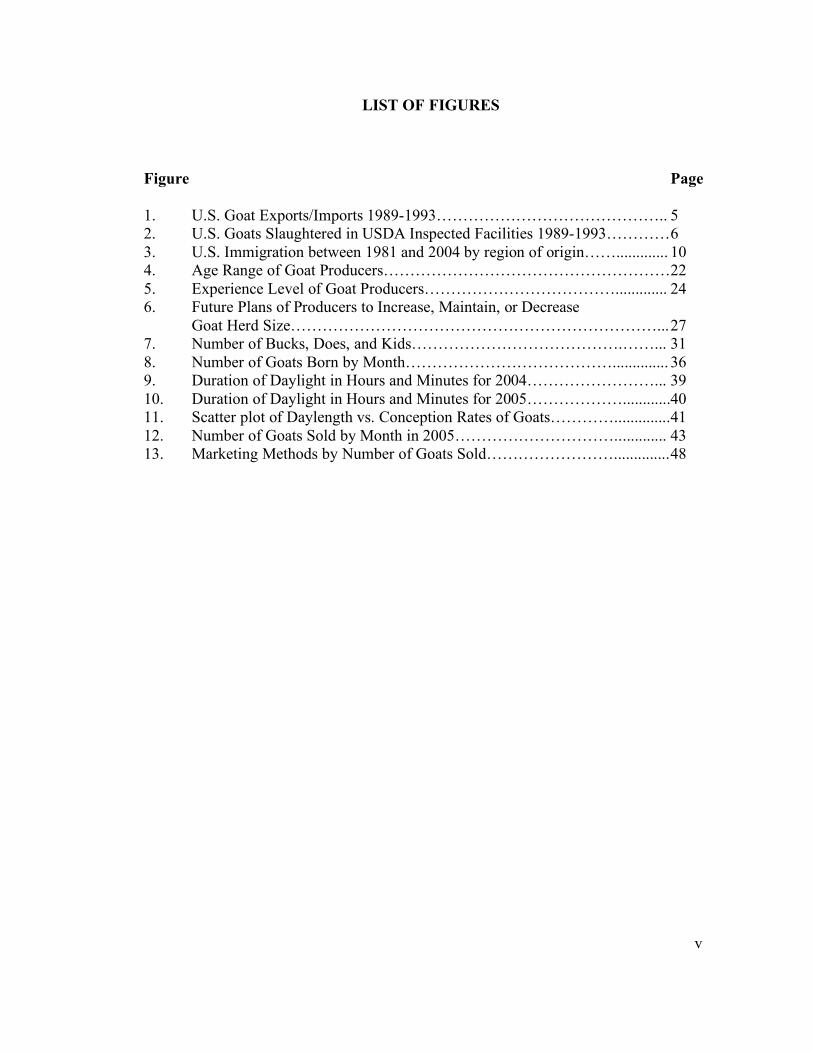
LIST OF FIGURES
Figure Page 1. U.S. Goat Exports/Imports 1989-1993…………………………………….. 5 2. U.S. Goats Slaughtered in USDA Inspected Facilities 1989-1993………… 6 3. U.S. Immigration between 1981 and 2004 by region of origin……............. 10 4. Age Range of Goat Producers………………………………………………22 5. Experience Level of Goat Producers………………………………............. 24 6. Future Plans of Producers to Increase, Maintain, or Decrease Goat Herd Size……………………………………………………………... 27 7. Number of Bucks, Does, and Kids…………………………………. ……... 31 8. Number of Goats Born by Month………………………………….............. 36 9. Duration of Daylight in Hours and Minutes for 2004……………………... 39 10. Duration of Daylight in Hours and Minutes for 2005………………............40 11. Scatter plot of Daylength vs. Conception Rates of Goats………….............. 41 12. Number of Goats Sold by Month in 2005………………………….. ........... 43 13. Marketing Methods by Number of Goats Sold…………………….............. 48
1
Chapter I
Introduction
The demand for goat meat in the United States has greatly increased in recent
years. In fact, consumption has surpassed domestic supplies during the 1990’s, leading to
increased imports from other countries (Peischel 2005). Pinkerton and McMillin (2006)
have confirmed that U.S. meat goat production has been insufficient to meet consumer
demand for the past ten years. They estimate that approximately 40 percent of U.S. goat
meat consumption is met with frozen imports from Australia and New Zealand. With the
emergence of increasing demand and subsequent higher market prices, interest in meat
goat production has increased among agricultural producers.
There is a need for information on meat goat production in order to assess the
status of the meat goat industry. There is also a need to evaluate the potential market for
meat goat products. With better information about consumer demand for goat meat
products, producers, processors and retail establishments will benefit by being able to
supply consumers the desired product at the desired time.
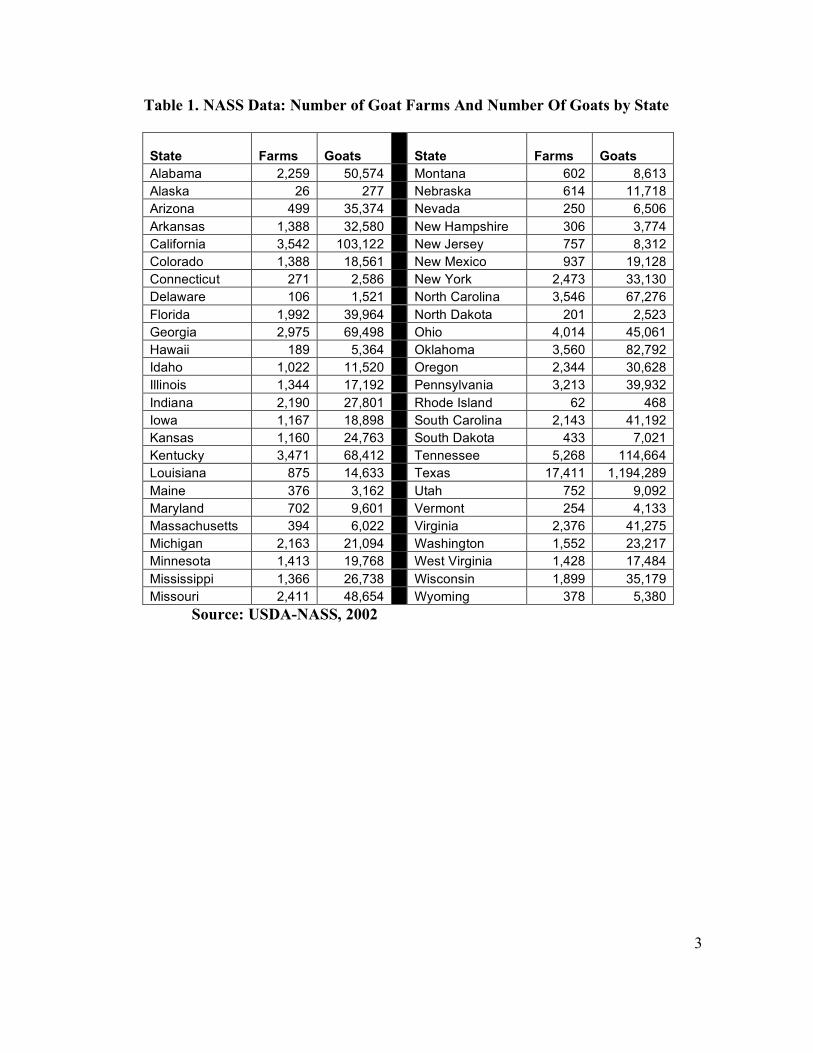
According to the National Agricultural Statistics Service, Tennessee has an inventory of
114,664 goats and ranks number two in goat production in the United States behind
Texas, which has an inventory of 1,194,289 goats (USDA-NASS, 2002). Table 1 gives
details of the U.S. goat inventory as reported to the National Agricultural Statistics
Service.
Much of the goat meat produced in the United States is consumed in the Northeast
in large cities such as New York (Pinkerton, 1995). Goats produced in Tennessee must
either be transported to slaughterhouses in the Northeast or slaughtered locally and
2
shipped in order to tap into this market. There are costs associated with transporting both
live animals and meat. While the market for goats in the Northeast has been exploited for
many years, little producer research has been conducted in the greater Tennessee area.
The purpose of this project is to assess the status of meat goat production in the greater
Tennessee area. Detailed information about goat producers in the target area will provide
the basis for improvement of educational programs and will identify areas in which
further research should be conducted.
Research Objectives
This study was designed to meet the following research objectives:
1. Expand the knowledge base for goat meat marketing in the greater Tennessee
area.
2. Collect demographic data on goat producers and farms.
3. Investigate and verify seasonal variations in goat breeding and marketing.
4. Determine the typical age and weight at which producers market their goats.
5. Identify types of markets currently used by producers to sell goats.
6. Determine goat producer interest in considering new or alternative markets for
their goats.
7. Determine producer interest in securing USDA-inspected slaughter facilities in
their local area.
8. Determine the need for future goat market research.
3
Table 1. NASS Data: Number of Goat Farms And Number Of Goats by State
State Farms Goats
State Farms
Goats
Alabama 2,259 50,574 Montana 602 8,613 Alaska 26 277 Nebraska 614 11,718 Arizona 499 35,374 Nevada 250 6,506 Arkansas 1,388 32,580 New Hampshire 306 3,774 California 3,542 103,122 New Jersey 757 8,312 Colorado 1,388 18,561 New Mexico 937 19,128 Connecticut 271 2,586 New York 2,473 33,130 Delaware 106 1,521 North Carolina 3,546 67,276 Florida 1,992 39,964 North Dakota 201 2,523 Georgia 2,975 69,498 Ohio 4,014 45,061 Hawaii 189 5,364 Oklahoma 3,560 82,792 Idaho 1,022 11,520 Oregon 2,344 30,628 Illinois 1,344 17,192 Pennsylvania 3,213 39,932 Indiana 2,190 27,801 Rhode Island 62 468 Iowa 1,167 18,898 South Carolina 2,143 41,192 Kansas 1,160 24,763 South Dakota 433 7,021 Kentucky 3,471 68,412 Tennessee 5,268 114,664 Louisiana 875 14,633 Texas 17,411 1,194,289 Maine 376 3,162 Utah 752 9,092 Maryland 702 9,601 Vermont 254 4,133 Massachusetts 394 6,022 Virginia 2,376 41,275 Michigan 2,163 21,094 Washington 1,552 23,217 Minnesota 1,413 19,768 West Virginia 1,428 17,484 Mississippi 1,366 26,738 Wisconsin 1,899 35,179 Missouri 2,411 48,654 Wyoming 378 5,380
Source: USDA-NASS, 2002
4
Chapter II
Literature Review
For many people the emerging goat meat market appears to be a new
phenomenon; however, experienced goat producers have been selling goats for meat for
many years and the market for live goats has been established for a long time. Although
meat goat marketing channels were well established, there was little recognition of meat
goat marketing channels in academia until Pinkerton’s extensive studies (Pinkerton,
1995).
Goat meat is the most consumed meat in the world (Engle et. al., 2000). In the
U.S., consumption of goat meat is on the rise as indicated by the number of goats
slaughtered and the amount of goat meat imported. In 1977 approximately 35,000 goats
were slaughtered in USDA-inspected plants and by 1998 this number increased to
approximately 450,000 (Gipson, 1999). The latest data indicate that in 2003, more than
600,000 goats were slaughtered in federally-inspected plants (Soliaman, 2005).
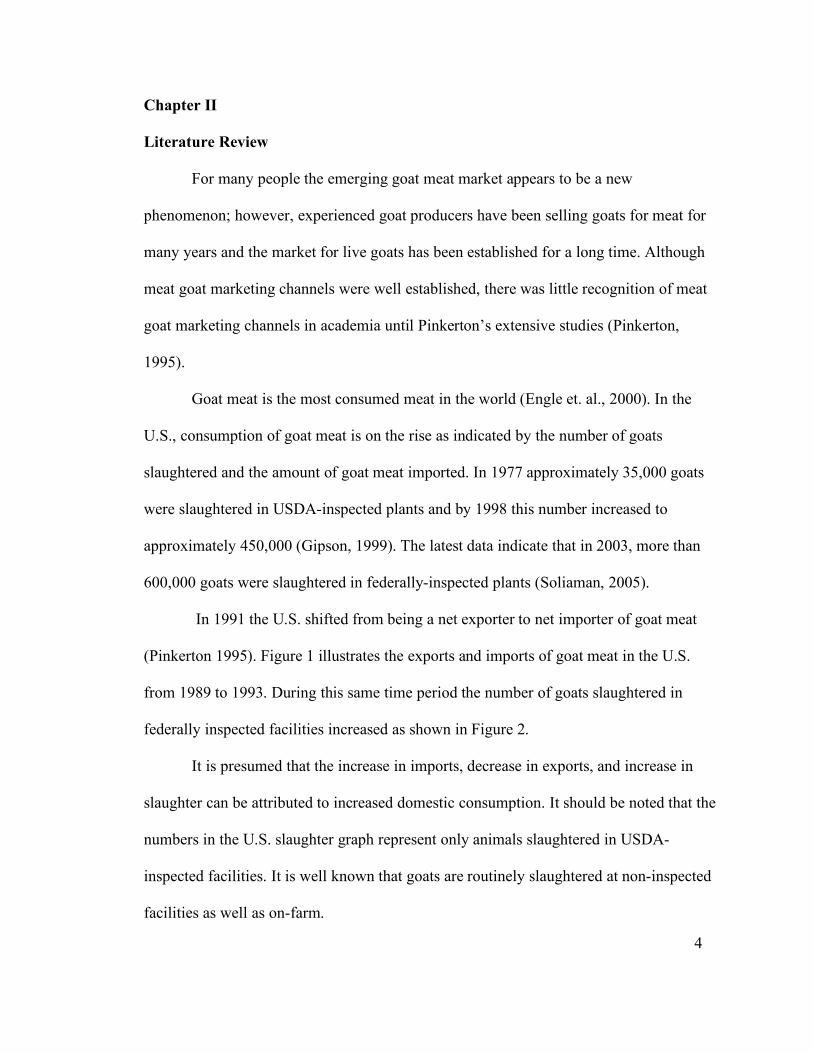
In 1991 the U.S. shifted from being a net exporter to net importer of goat meat
(Pinkerton 1995). Figure 1 illustrates the exports and imports of goat meat in the U.S.
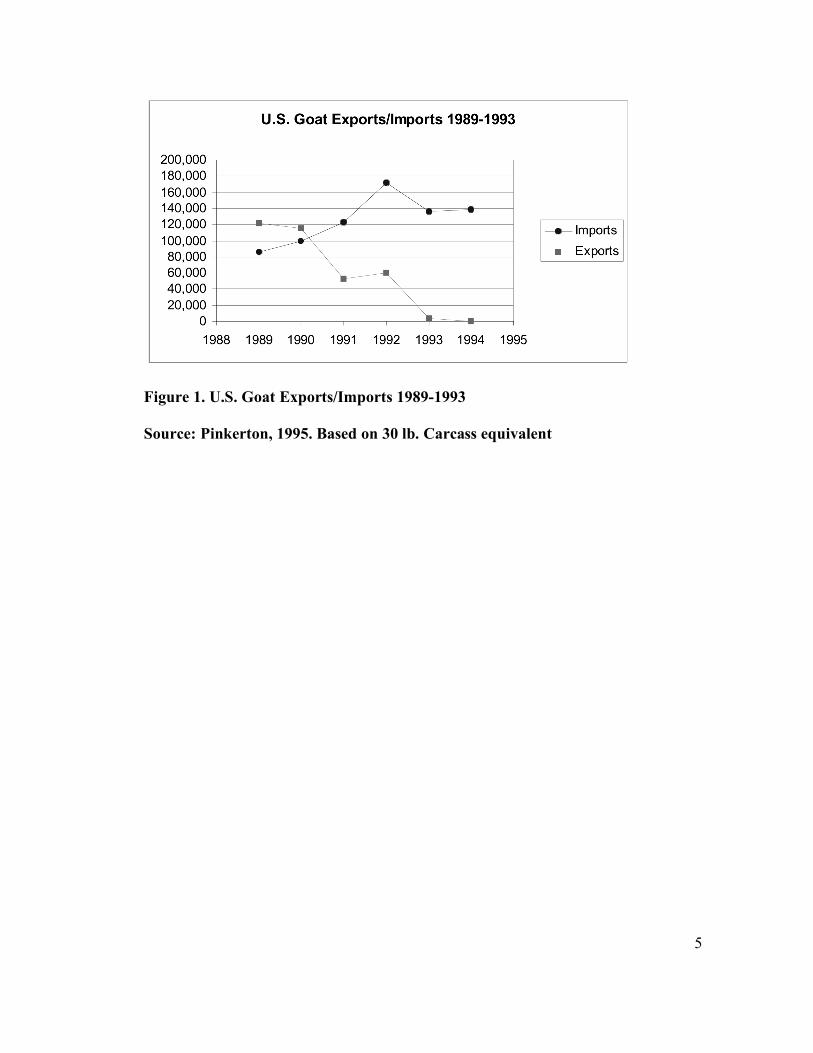
from 1989 to 1993. During this same time period the number of goats slaughtered in
federally inspected facilities increased as shown in Figure 2.
It is presumed that the increase in imports, decrease in exports, and increase in
slaughter can be attributed to increased domestic consumption. It should be noted that the
numbers in the U.S. slaughter graph represent only animals slaughtered in USDA-
inspected facilities. It is well known that goats are routinely slaughtered at non-inspected
facilities as well as on-farm.
5
Figure 1. U.S. Goat Exports/Imports 1989-1993
Source: Pinkerton, 1995. Based on 30 lb. Carcass equivalent
6
Figure 2. U.S. Goats Slaughtered in USDA Inspected Facilities 1989-1993
Source: Pinkerton, 1995
7
Due to changes at the national level, the supply of goats available for slaughter
has been affected by Federal farm policies. Excess and cull Angora goats have
traditionally been sold as meat animals. In October 1993, the discontinuation of the Wool
and Mohair Act was announced by the Federal Government. This program had provided
a subsidy for the production of mohair and in effect encouraged Angora goat numbers
(Pinkerton, 1995). The discontinuation of the program led to a sell off and subsequent
drop in the number of Angora goats in Texas from 2.1 million in 1989 (Pinkerton, 1991)
to 600,000 in 1999 (Livestock Weekly, 1999).
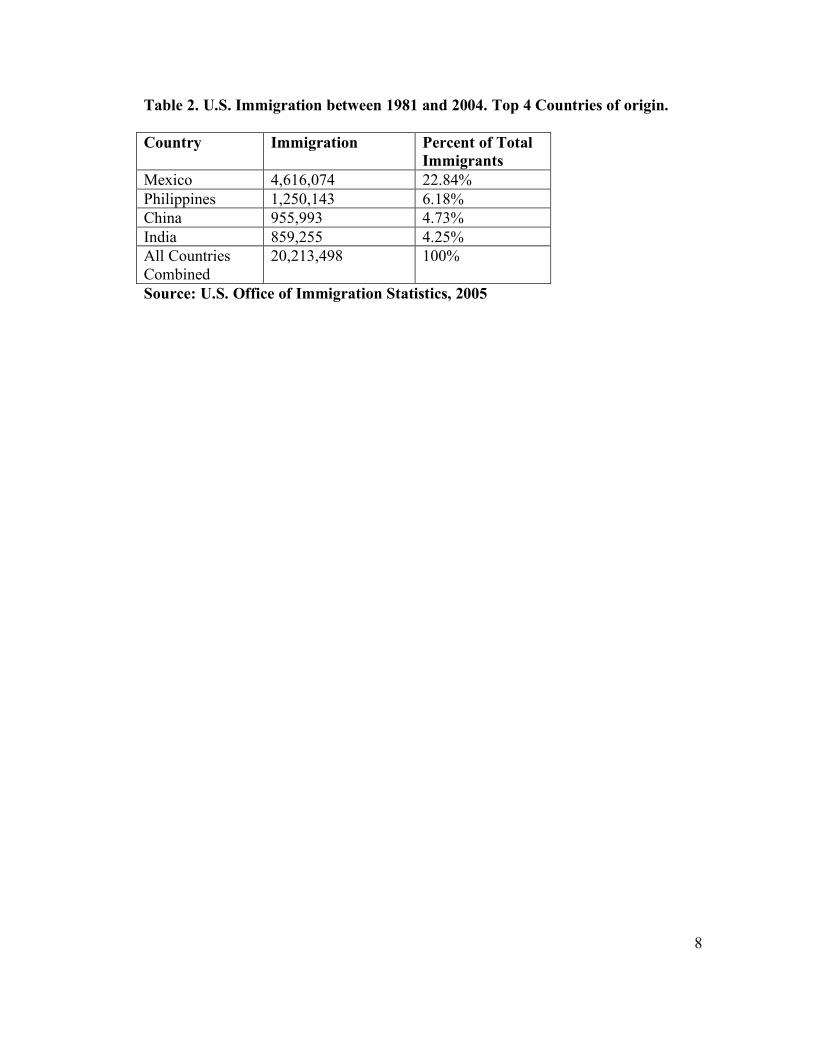
Another factor that has influenced the increased demand for goat meat in the United
States is increased immigration of people from areas where goat meat is commonly
consumed (Pinkerton et. al., 1994). Data for immigration statistics is compiled by the
Office of Immigration Statistics within the U.S. Department of Homeland Security.
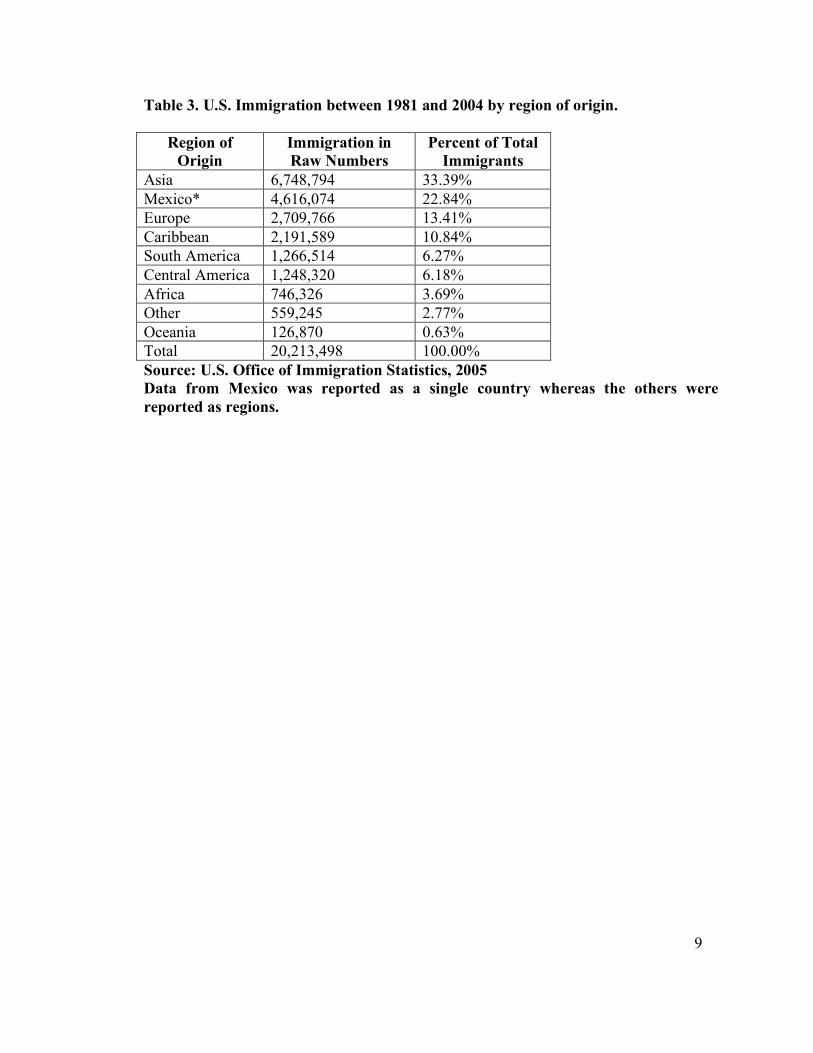
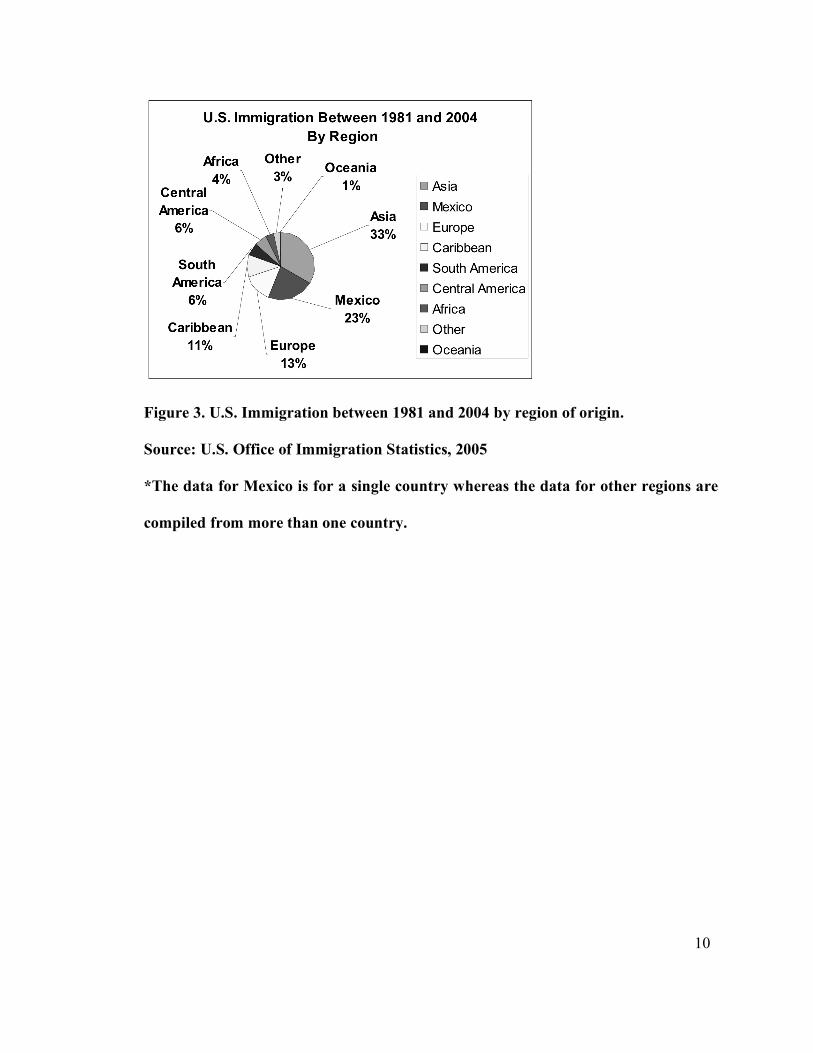
Tables 2 and 3 and Figure 3 illustrate immigration patterns into the U.S. between 1981
and 2004.
While the majority of immigrants originated in Asia, it should be noted that the
geographic area of Asia is very loosely defined by the Office of Immigration Statistics.
Countries included in Asia are: China, Hong Kong, India, Iran, Israel, Japan, Korea,
Philippines, Turkey, Vietnam, and other Asia. (U.S. Office of Immigration Statistics,
2005). In essence, immigration from these countries represented 33 percent of
immigration into the U.S. during the specified time frame. Conversely, the data from
Mexico encompasses immigration from only that country. Immigration from Mexico to
the U.S. was the greatest from any single country.
8
Table 2. U.S. Immigration between 1981 and 2004. Top 4 Countries of origin.
Country Immigration Percent of Total Immigrants
Mexico 4,616,074 22.84% Philippines 1,250,143 6.18% China 955,993 4.73% India 859,255 4.25% All Countries Combined
20,213,498 100%
Source: U.S. Office of Immigration Statistics, 2005
9
Table 3. U.S. Immigration between 1981 and 2004 by region of origin.
Region of Origin
Immigration in Raw Numbers
Percent of Total Immigrants
Asia 6,748,794 33.39% Mexico* 4,616,074 22.84% Europe 2,709,766 13.41% Caribbean 2,191,589 10.84% South America 1,266,514 6.27% Central America 1,248,320 6.18% Africa 746,326 3.69% Other 559,245 2.77% Oceania 126,870 0.63% Total 20,213,498 100.00% Source: U.S. Office of Immigration Statistics, 2005 Data from Mexico was reported as a single country whereas the others were reported as regions.
10
Figure 3. U.S. Immigration between 1981 and 2004 by region of origin.
Source: U.S. Office of Immigration Statistics, 2005
*The data for Mexico is for a single country whereas the data for other regions are
compiled from more than one country.
11
Immigration, particularly from Mexico, has changed the population demographics
of the U.S. Along with changes in population demographics, cultural changes also occur.
Immigrants add to the diversity of the U.S. population through their traditions and
customs. While it has been noted that successive generations born in the U.S. tend to
adopt “American culture,” many choose to retain the traditions of their parents
(Pinkerton, 1995).
The influence of immigrants on consumer products, including food items, is
evidenced by the increase in bilingual packaging appearing on the market. This can be
seen in nearly any grocery store from national chains to small “mom and pop” stores.
Further investigation into the products carried by these stores reveals they are beginning
to carry name brands familiar to immigrants (Casanova, 2004).
Holidays are important in meat goat marketing. Demand for goat meat and
subsequently, goat prices, increase near holidays during which goat meat is consumed.
Western or Roman Easter, Eastern or Greek Easter, Navadurgara or Navratra Dashara or
Dassai, Ramadan, Id al Fitr, Id al Adha, Christmas, and Cinco de Mayo all utilize goat
meat in some fashion (Northeast Sheep and Goat Marketing Program, 2006). If producers
can market desired animals at the correct time to meet holiday markets, they may receive
premium prices for their animals. Holidays such as those listed above represent the main
source of demand peaks for goat meat (Pinkerton, 1995); however, there is potential for
expansion of these markets.
Pinkerton (1995) also suggests further investigation into the upscale market for
goat meat. As Americans become more health conscious, many look for healthy
alternatives to traditional meats such as beef, chicken, lamb, and pork. Goat meat has
12
shown that it is lower in fat and cholesterol and rivals traditional meats in protein
(Luginbuhl, 2000).
The restaurant market for goat meat could be a feasible way to tap into the
upscale market. Degner (1991) suggests this may be a way to reach more “mainstream”
Americans; however, he cautions that what goat meat is called makes a difference. He
suggests using names such as chevon or cabrito to market goat meat products. Degner
believes that these names sound exotic to consumers and are more enticing. He also
suggests marketing through restaurants because consumers may be unsure about proper
preparation of goat meat and therefore unwilling to invest money in its purchase. He does
believe, however, that consumers may be willing to try goat meat if properly presented in
restaurants (Degner & Lin., 1993).
With increased demand for goat meat, it is imperative that research be conducted
in meat goat production and marketing. Currently, there is minimal information available
concerning goat inventory and producers in Tennessee and surrounding areas. Detailed
information about goat producers in the target area will provide a basis for improvement
of the goat industry through goat educational programs and will identify topics requiring
further research.
13
Chapter III
Research Methods
A mail survey was developed to address the questions raised in the research
objectives section and mailed to goat producers in the greater Tennessee area. The survey
was sent to producers who subscribed to the mailing list maintained by the Tennessee
Extension Small Ruminant Specialist. Extension agents throughout Tennessee were asked
to provide additional names and addresses to be added to the list. It is commonly
accepted in University Extension work that if a person is on an Extension mailing list,
then that person is familiar with the Extension Service. Therefore, the target population
for the survey was goat producers who are familiar with University Extension programs.
This survey was not intended to be a comprehensive census of all goats within the focus
area, but rather a snapshot of the goat inventory on December 31, 2005. Survey results
were compiled and the data was analyzed using standard statistical methods with
Microsoft Excel and SAS (SAS Institute, 2006).
The survey instrument and cover letter were developed and then reviewed and
tested by County Extension Agents in six of Tennessee’s ninety-five counties. The survey
instrument was then tested with select goat producers in Wayne and Lawrence counties
and some final adjustments were made. The final survey instrument consisted of nineteen
questions. A copy of the survey instrument can be found in Appendix A.
The survey and survey cover letter were mailed to 1,974 people. The return rate
was determined using the following formula:
{(A+B+C)/(X-Y)}*100
14
Where:
A= Viable Surveys Returned
B= Surveys returned from respondents who no longer keep goats
C= Surveys returned from outside the geographic focus area
X= Total surveys mailed
Y= Surveys returned due to wrong address
The survey data were collected and entered into an electronic spreadsheet. This
was done so the data could be easily sorted, collapsed, and analyzed. In addition to
Microsoft Excel, SAS was utilized as a statistical software tool. The primary statistical
tools utilized in this research were frequency tables, contingency tables, χ2 (chi-square)
test, correlation, descriptive statistics (mean, median, mode, largest variable, and smallest
variable) and percentage calculation.
Frequency tables were used to display many of the results. Frequency tables are
useful for reporting discrete categorical data represented in parts of this survey. The mean
for two of the data indicators (producer age and producer experience level) were
calculated using the formula:
Where: meany !
fi = frequency of the ith class
yi = midpoint of the ith class
A contingency table was used to analyze the relationship between producer
experience levels and their utilization of written marketing plans. The data were
15
entered into the contingency table and then transferred into SAS to conduct a χ2 test. The
χ2 compares two variables to determine if they are related. An expected value is
calculated for each observed response and then compared to the actual response. The χ2
statistic was calculated with the formula:
Where: Ob = observed value
Ex = Expected value
Descriptive statistics were calculated for the number of acres and number of
goats. One correlation test was run to determine whether goat breeding is related to day
length. The data for day length were obtained from data collected by the U.S. Navel
Observatory. The data was presented in hours and minutes. The data was converted to
strictly minutes to ensure consistency with the test.
Stocking rates for number of goats per acre were calculated using the formula
G/A = SR where
G = Total number of goats
A = Total number of acres
SR = Stocking rate expressed as goats per acre
16
Chapter IV
Results
General Information
The mail survey was sent to 1,974 goat producers. A total of 134 of the surveys
were returned by the postal service due to “wrong address”. Another 57 were returned
with the indication that the respondent no longer produces goats. One survey was
returned from New York state, which is out of the survey’s geographic focus area. A total
of 304 viable surveys were returned. The final return rate was calculated by using the
formula {(A+B+C)/(X-Y)}*100. The resulting calculation yielded a return rate of 19.67
percent.
All respondents did not answer all of the questions posed in the survey. When
percentages were calculated, unknown or unanswered questions were left out of the data
set in order to calculate a valid percent or result based on complete information.
Producers from 117 counties within the focus area responded. The majority of
respondents were from Tennessee, with producers from 72 counties (61.54 percent)
responding. There were respondents from 13 counties each in Kentucky and Alabama
(11.11 percent), 6 counties in Missouri (5.13 percent), 4 counties in Virginia (3.42%), 3
counties in both North Carolina and Georgia (2.56%), 2 counties in Arkansas (1.71%),
and 1 from Mississippi (0.85 percent). Table 4 summarizes the number of goats, goat
farms and stocking rates of respondents by focus state. Table 5 summarizes the numbers
of goats and goat farms reported by county.

17
Table 4. Summary of Number of Goats and Farms Reported From Focus Area
States
State Counties % of Counties Goats % Goats Farms % Farms Goats/Farm
TN 72 61.54% 11738 71.85% 235 77.30% 49.94894 AL 13 11.11% 1261 7.72% 23 7.57% 54.82609 KY 13 11.11% 1223 7.49% 22 7.24% 55.59091 MO 6 5.13% 882 5.40% 10 3.29% 88.2 VA 4 3.42% 135 0.83% 4 1.32% 33.75 GA 3 2.56% 157 0.96% 3 0.99% 52.33333 NC 3 2.56% 137 0.84% 3 0.99% 45.66667 AR 2 1.71% 788 4.82% 3 0.99% 262.6667 MS 1 0.85% 15 0.09% 1 0.33% 15 Total 117 100.00% 16336 100.00% 304 100.00% 53.73684
18
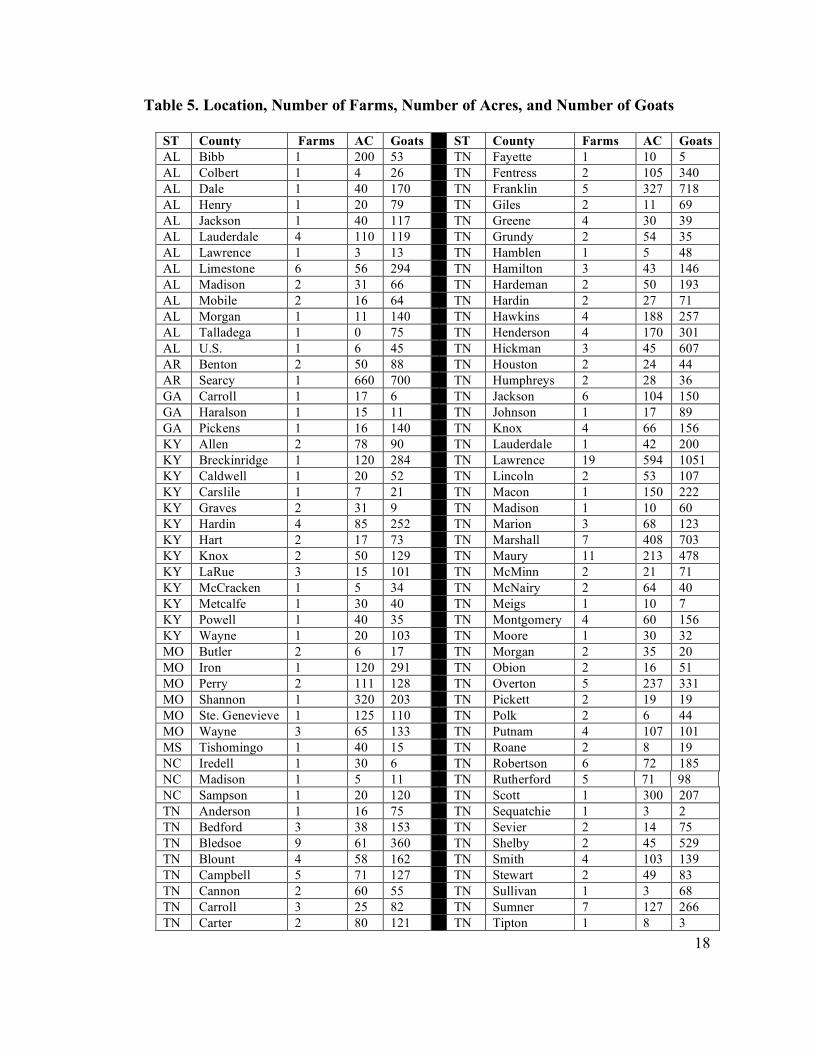
Table 5. Location, Number of Farms, Number of Acres, and Number of Goats
ST County Farms AC Goats ST County Farms AC Goats AL Bibb 1 200 53 TN Fayette 1 10 5 AL Colbert 1 4 26 TN Fentress 2 105 340 AL Dale 1 40 170 TN Franklin 5 327 718 AL Henry 1 20 79 TN Giles 2 11 69 AL Jackson 1 40 117 TN Greene 4 30 39 AL Lauderdale 4 110 119 TN Grundy 2 54 35 AL Lawrence 1 3 13 TN Hamblen 1 5 48 AL Limestone 6 56 294 TN Hamilton 3 43 146 AL Madison 2 31 66 TN Hardeman 2 50 193 AL Mobile 2 16 64 TN Hardin 2 27 71 AL Morgan 1 11 140 TN Hawkins 4 188 257 AL Talladega 1 0 75 TN Henderson 4 170 301 AL U.S. 1 6 45 TN Hickman 3 45 607 AR Benton 2 50 88 TN Houston 2 24 44 AR Searcy 1 660 700 TN Humphreys 2 28 36 GA Carroll 1 17 6 TN Jackson 6 104 150 GA Haralson 1 15 11 TN Johnson 1 17 89 GA Pickens 1 16 140 TN Knox 4 66 156 KY Allen 2 78 90 TN Lauderdale 1 42 200 KY Breckinridge 1 120 284 TN Lawrence 19 594 1051 KY Caldwell 1 20 52 TN Lincoln 2 53 107 KY Carslile 1 7 21 TN Macon 1 150 222 KY Graves 2 31 9 TN Madison 1 10 60 KY Hardin 4 85 252 TN Marion 3 68 123 KY Hart 2 17 73 TN Marshall 7 408 703 KY Knox 2 50 129 TN Maury 11 213 478 KY LaRue 3 15 101 TN McMinn 2 21 71 KY McCracken 1 5 34 TN McNairy 2 64 40 KY Metcalfe 1 30 40 TN Meigs 1 10 7 KY Powell 1 40 35 TN Montgomery 4 60 156 KY Wayne 1 20 103 TN Moore 1 30 32 MO Butler 2 6 17 TN Morgan 2 35 20 MO Iron 1 120 291 TN Obion 2 16 51 MO Perry 2 111 128 TN Overton 5 237 331 MO Shannon 1 320 203 TN Pickett 2 19 19 MO Ste. Genevieve 1 125 110 TN Polk 2 6 44 MO Wayne 3 65 133 TN Putnam 4 107 101 MS Tishomingo 1 40 15 TN Roane 2 8 19 NC Iredell 1 30 6 TN Robertson 6 72 185 NC Madison 1 5 11 TN Rutherford 5 71 98 NC Sampson 1 20 120 TN Scott 1 300 207 TN Anderson 1 16 75 TN Sequatchie 1 3 2 TN Bedford 3 38 153 TN Sevier 2 14 75 TN Bledsoe 9 61 360 TN Shelby 2 45 529 TN Blount 4 58 162 TN Smith 4 103 139 TN Campbell 5 71 127 TN Stewart 2 49 83 TN Cannon 2 60 55 TN Sullivan 1 3 68 TN Carroll 3 25 82 TN Sumner 7 127 266 TN Carter 2 80 121 TN Tipton 1 8 3
19
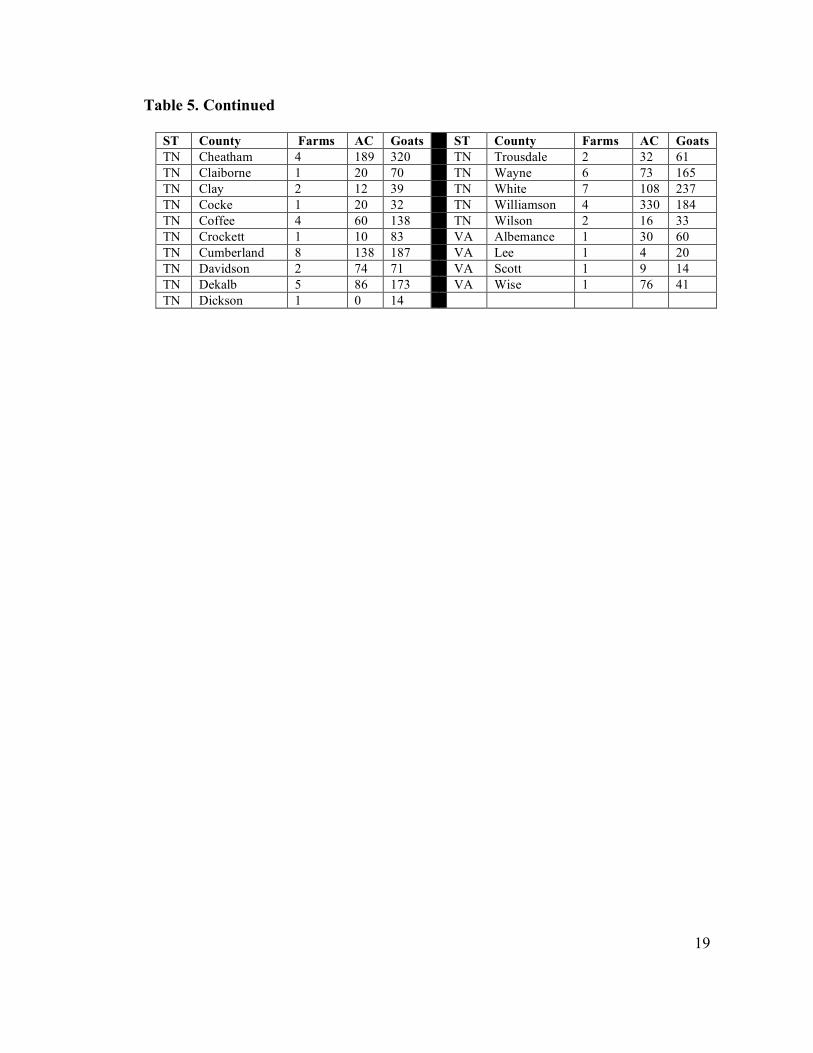
Table 5. Continued
ST County Farms AC Goats ST County Farms AC Goats TN Cheatham 4 189 320 TN Trousdale 2 32 61 TN Claiborne 1 20 70 TN Wayne 6 73 165 TN Clay 2 12 39 TN White 7 108 237 TN Cocke 1 20 32 TN Williamson 4 330 184 TN Coffee 4 60 138 TN Wilson 2 16 33 TN Crockett 1 10 83 VA Albemance 1 30 60 TN Cumberland 8 138 187 VA Lee 1 4 20 TN Davidson 2 74 71 VA Scott 1 9 14 TN Dekalb 5 86 173 VA Wise 1 76 41 TN Dickson 1 0 14
20
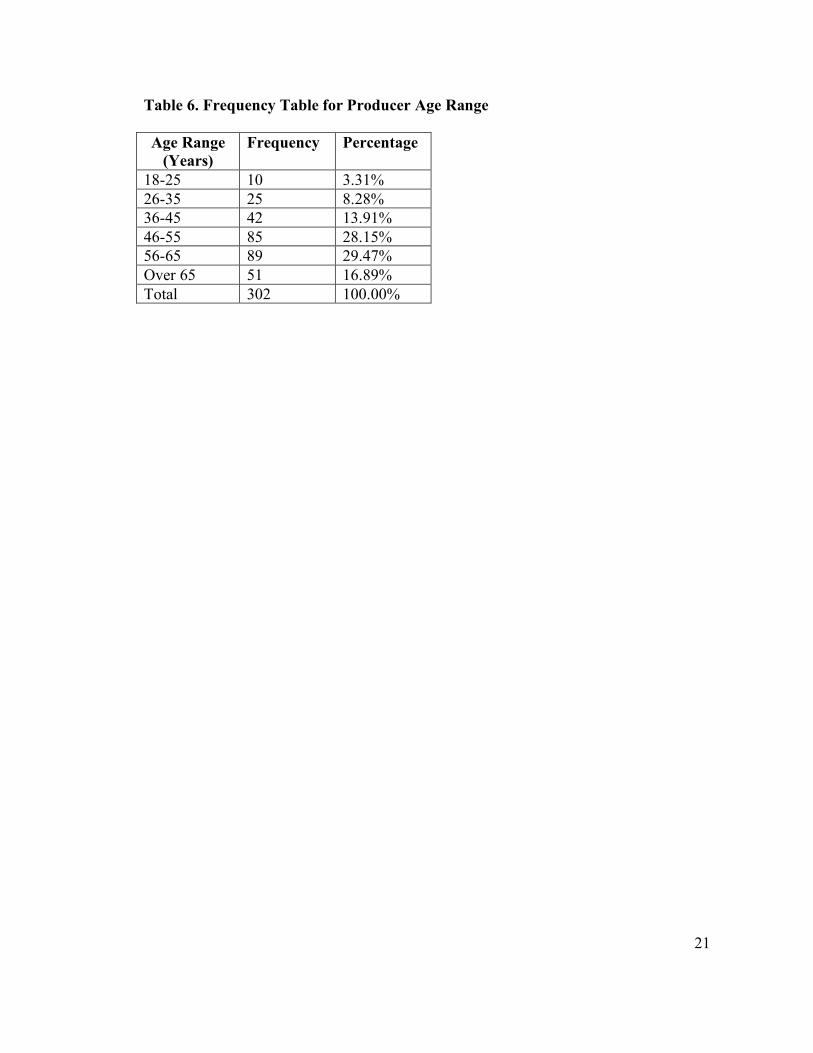
Demographic Data on Goat Producers
As previously stated, 304 goat producers returned viable surveys. Of these, 302
answered the question regarding age range. The vast majority of respondents (74.51
percent) were 46 years old or older. Only 25.49 percent of respondents were younger than
46. The mean age of producers was calculated from Table 6 which is a frequency table
for producer age.
The formula was used to calculate the mean age of producers. The mean
age of producers was calculated as 52.8 years. The mean age of goat producers who
responded to the survey is similar to the Tennessee state average of 56.0 years and
National average of 55.3 years for all types of farming operations (USDA-NASS, 2002).
A graphical representation of producer age is shown in Figure 4.
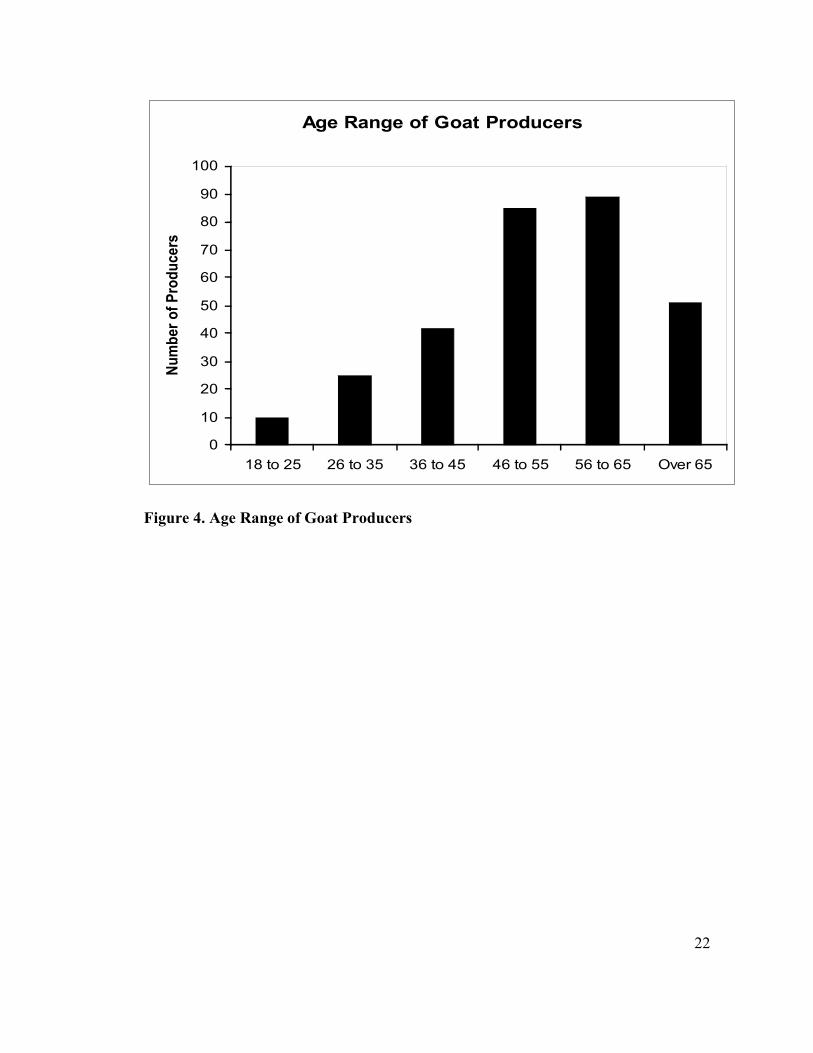
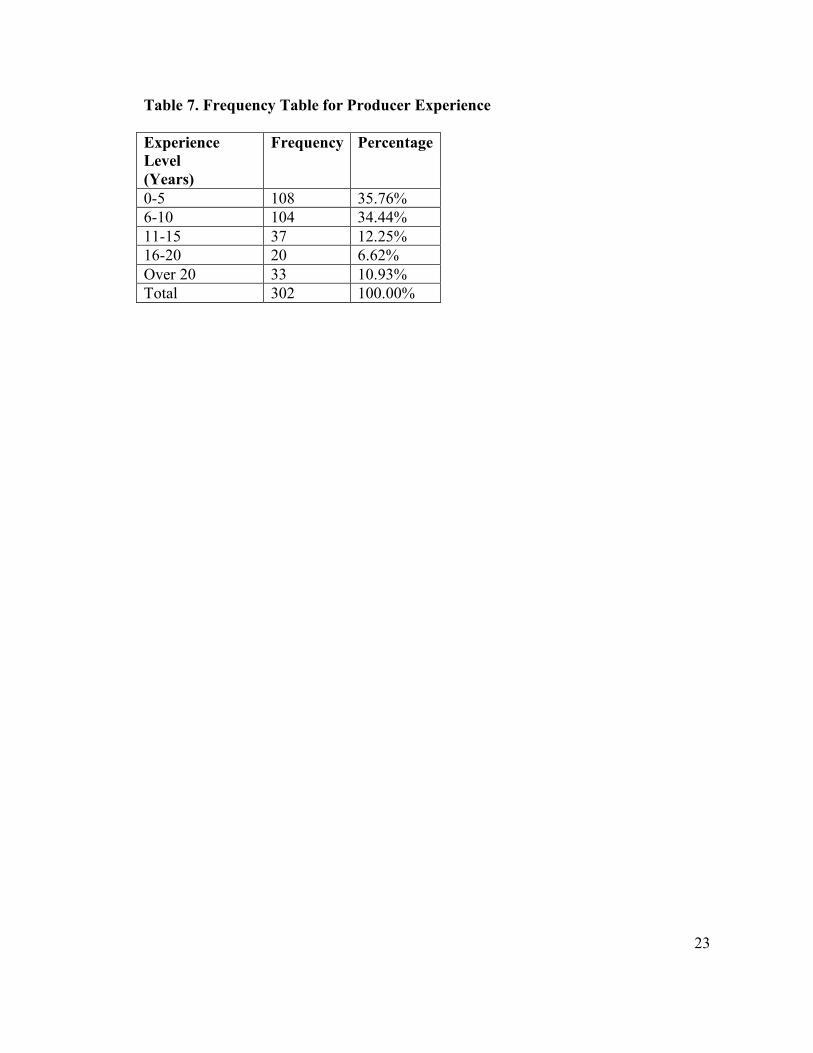
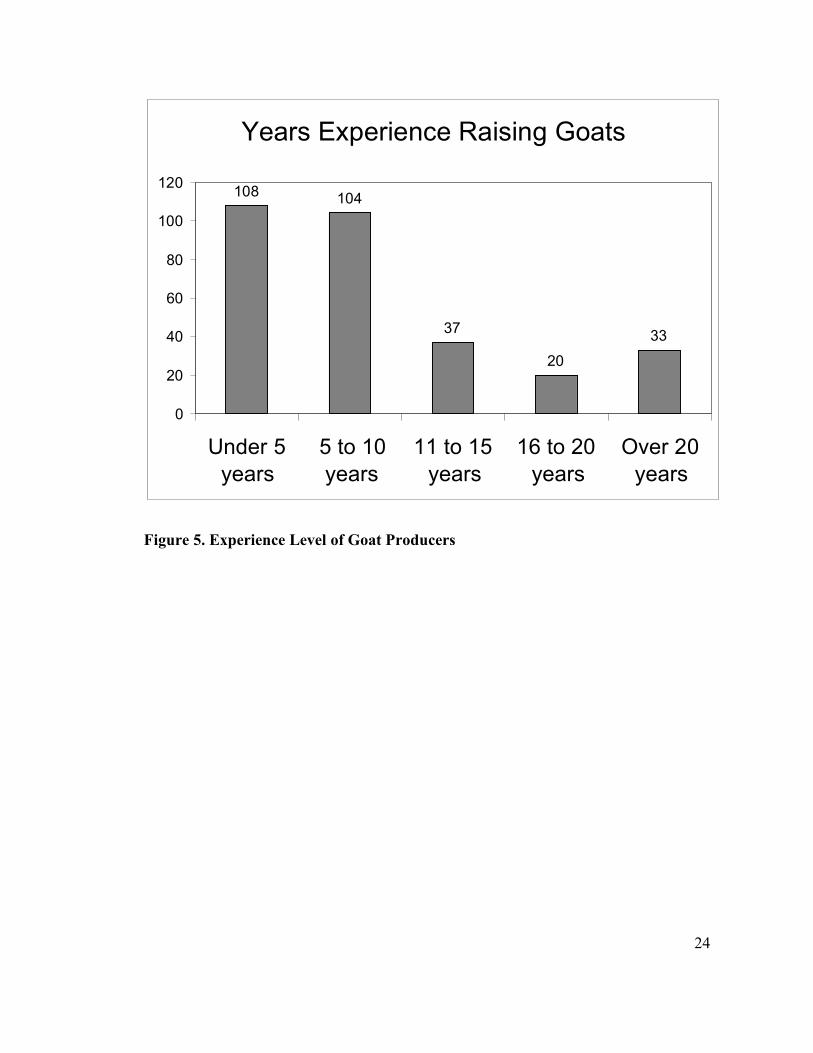
A total of 302 producers answered the question that asked how many years the
producer has been raising goats. A large majority of these respondents (70.20 percent)
had less that ten years experience raising goats. The mean experience level of producers
was calculated from Table 7 which is a frequency table for producer experience.
The formula was used to calculate the mean experience level of
producers. The mean experience level was calculated as 9.22 years. A graphical
representation of producer experience is shown in Figure 5.
One of the survey questions asked producers whether or not they had a written
marketing plan for their goat enterprise. Forty-eight producers (16.33 percent) indicated
that they do have written marketing plans for their goats while 246 (83.67 percent)
21
Table 6. Frequency Table for Producer Age Range
Age Range (Years)
Frequency Percentage
18-25 10 3.31% 26-35 25 8.28% 36-45 42 13.91% 46-55 85 28.15% 56-65 89 29.47% Over 65 51 16.89% Total 302 100.00%
22
Age Range of Goat Producers
0
10
20
30
40
50
60
70
80
90
100
18 to 25 26 to 35 36 to 45 46 to 55 56 to 65 Over 65
Nu
mb
er
of
Pro
du
ce
rs
Figure 4. Age Range of Goat Producers
23
Table 7. Frequency Table for Producer Experience
Experience Level (Years)
Frequency Percentage
0-5 108 35.76% 6-10 104 34.44% 11-15 37 12.25% 16-20 20 6.62% Over 20 33 10.93% Total 302 100.00%
24
Figure 5. Experience Level of Goat Producers
Years Experience Raising Goats
108 104
37
20
33
0
20
40
60
80
100
120
Under 5
years
5 to 10
years
11 to 15
years
16 to 20
years
Over 20
years
25
indicated that they do not have a written marketing plan. A summary of these results are
listed in Table 8.
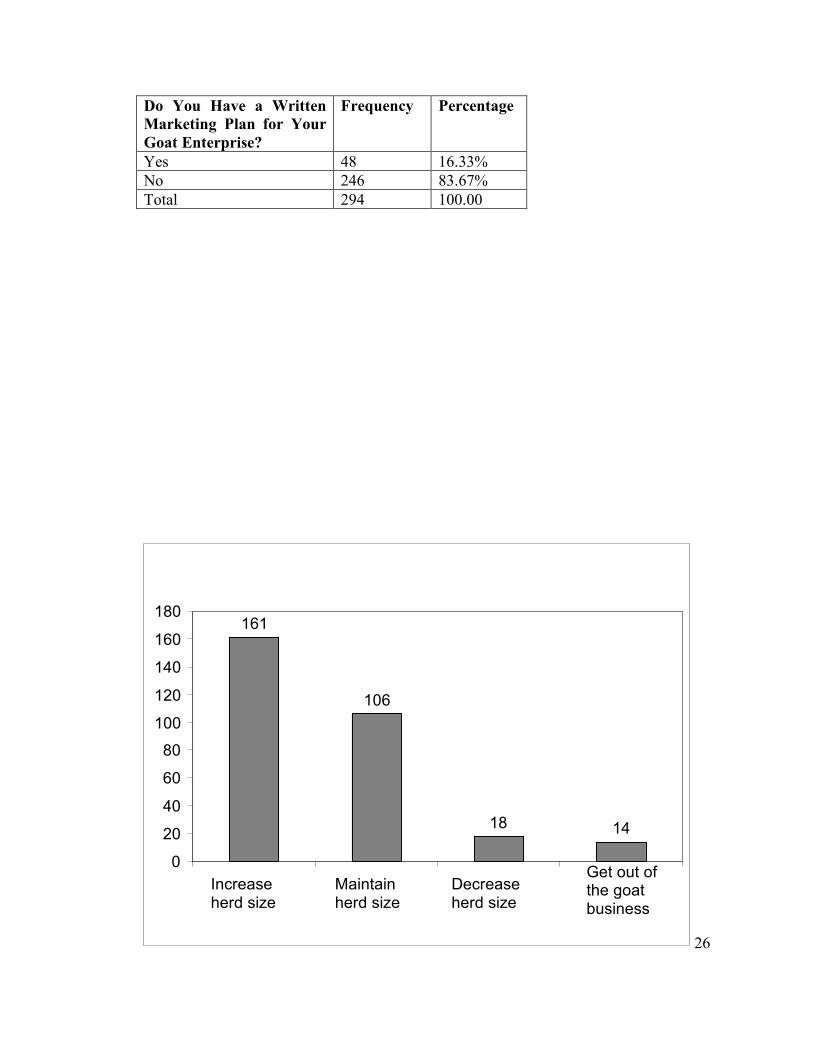
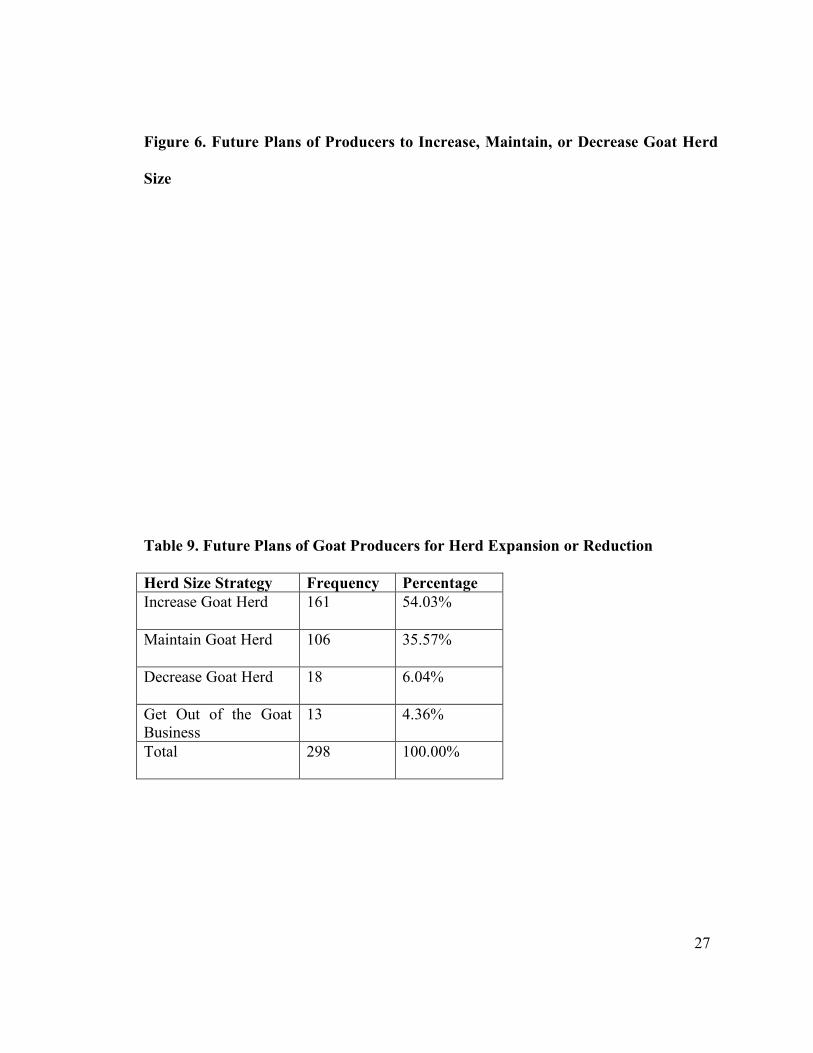
Producers were also asked about the future plans for their goat business. The
choices given were: “Increase the size of your goat herd,” “Maintain the same herd size,”
“Decrease the size of your herd,” or “Get out of the goat business.” Participants were
instructed to choose only one answer and 298 respondents answered the question. Of
these, 161 (54.03 percent) indicated a desire to increase the size of their goat herds, 106
(35.57 percent) indicated a desire to maintain the same herd size, 18 (6.04 percent)
indicated a desire to decrease the size of their goat herd, and 13 (4.36 percent) indicated a
desire to get out of the goat business. To summarize the future plans of survey
respondents, (267 or 89.60 percent) reported that they were either going to increase the
size of their goat herd or maintain the same herd size. Only 31 producers (10.40 percent)
indicated that they plan to decrease the size of their herd or get out of the goat business.
This can be interpreted as general optimism about the goat market in the future by goat
producers. Figure 6 illustrates the future plans of producers to expand, reduce, or
maintain their herd size. A summary of these results are also listed in Table 9.
A χ2 test was run to determine whether there is a relationship between producer
experience levels and the use of marketing plans by producers. A large majority of
producers (83.67 percent) did not utilize a written marketing plan. Producers with five to
ten years experience had 6.51 more yes responses than the expected value. The actual
number of yes responses for use of written marketing plans was 23 and the expected
value was 16.49. The test was statistically significant at α = 0.05. The χ2 test indicates
Table 8. Use of Written Marketing Plans by Producers
26
Do You Have a Written Marketing Plan for Your Goat Enterprise?
Frequency Percentage
Yes 48 16.33% No 246 83.67% Total 294 100.00
161
106
18 14
0
20
40
60
80
100
120
140
160
180
Increase herd size
Maintain herd size
Decrease herd size
Get out of the goat business
27
Figure 6. Future Plans of Producers to Increase, Maintain, or Decrease Goat Herd
Size
Table 9. Future Plans of Goat Producers for Herd Expansion or Reduction
Herd Size Strategy Frequency Percentage Increase Goat Herd
161 54.03%
Maintain Goat Herd
106 35.57%
Decrease Goat Herd
18 6.04%
Get Out of the Goat Business
13 4.36%
Total
298 100.00%
28
that producers with greater experience recognize the value of developing and
implementing a marketing plan. The data for the test has been summarized in Table 10.
Demographic Data on Goat Farms
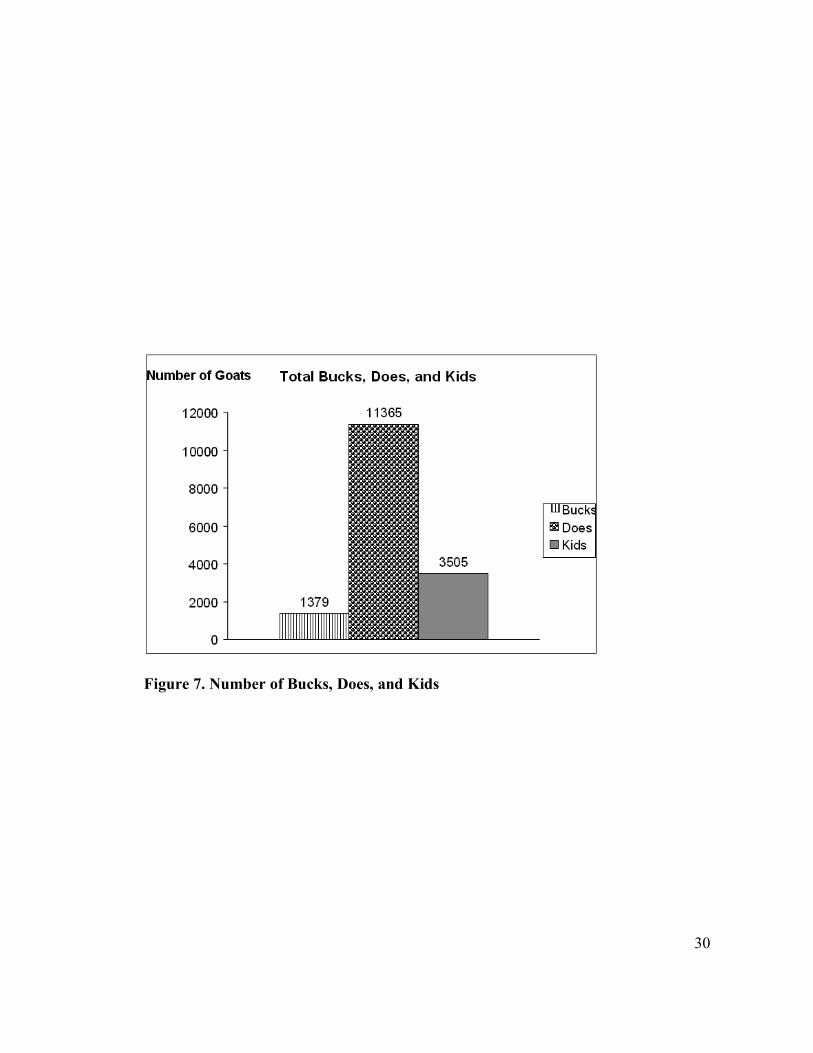
The data indicate that 16,336 goats were kept on 8,601 acres in 2005. Of the
16,336 goats reported, 1,379 were bucks, 11,365 were does, 3,505 were kids and 87 were
reported but not categorized. Buck, doe and kid numbers are illustrated in Figure 7. The
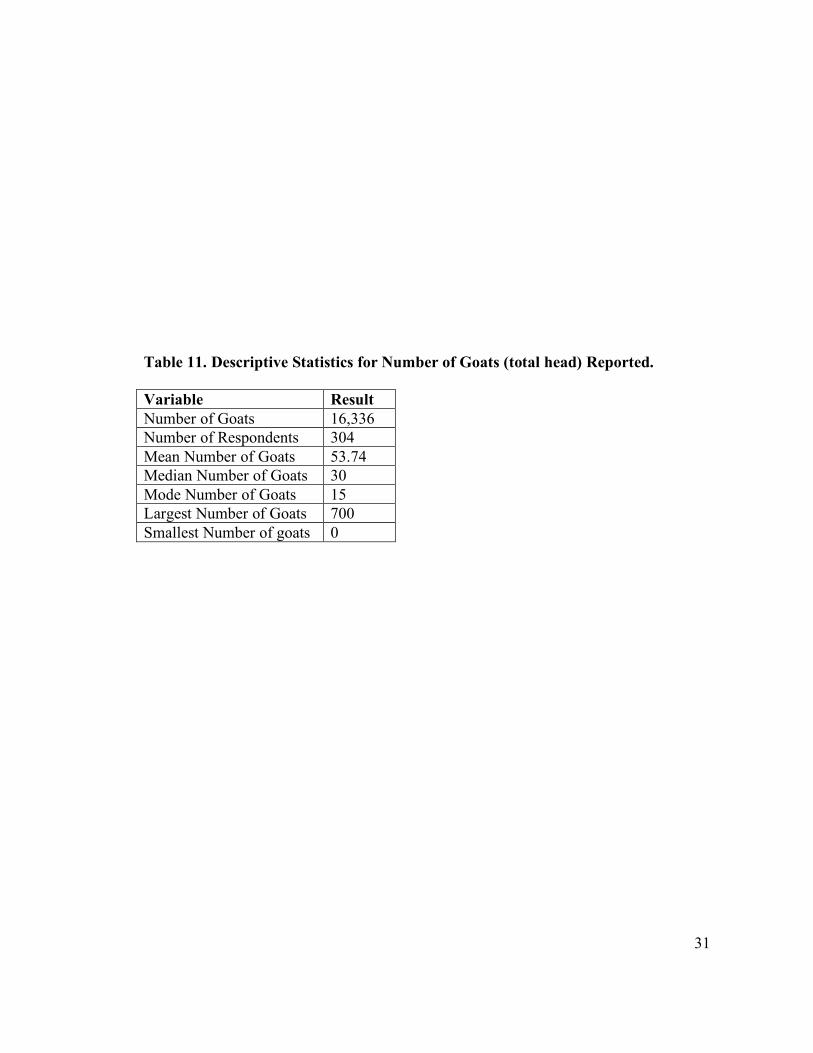
mean number of goats per farm was 53.74 head, the mode was 15 head, and the median
was 30 head. The descriptive statistics for number of goats is summarized in Table 11.
The mean number of acres per farm was 28.29 acres, the mode was 5 acres and the
median was 11 acres. The descriptive statistics for number of acres is summarized in
29
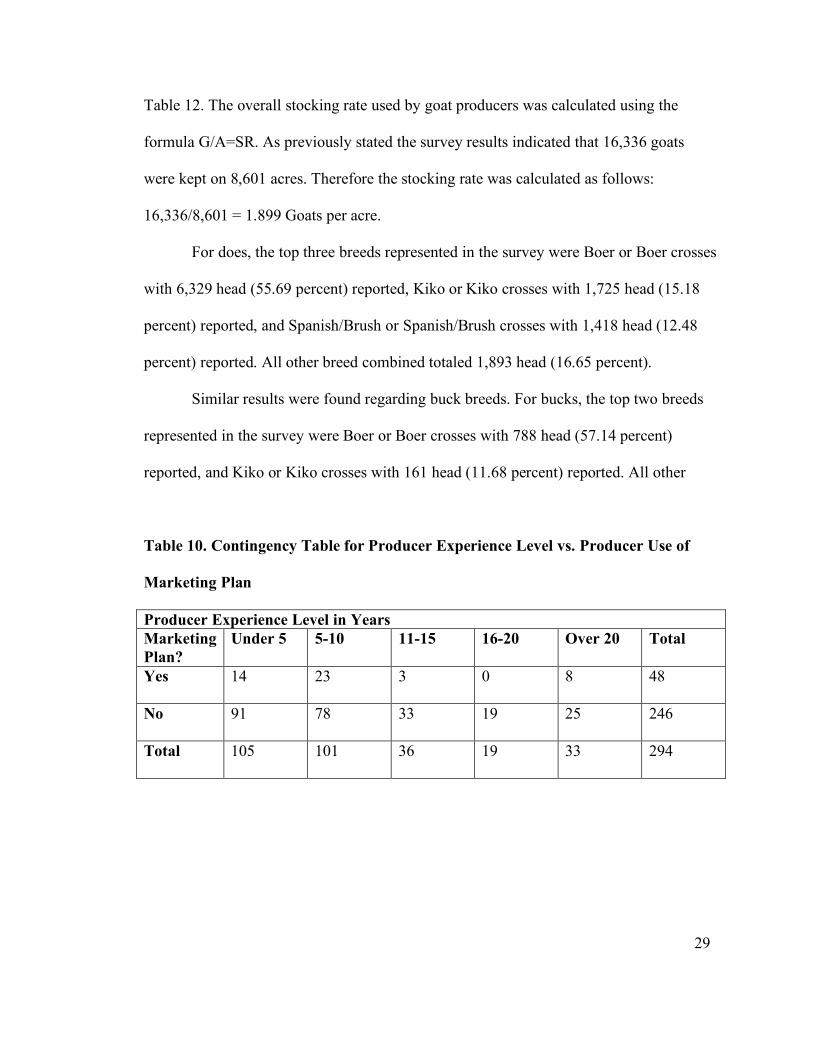
Table 12. The overall stocking rate used by goat producers was calculated using the
formula G/A=SR. As previously stated the survey results indicated that 16,336 goats
were kept on 8,601 acres. Therefore the stocking rate was calculated as follows:
16,336/8,601 = 1.899 Goats per acre.
For does, the top three breeds represented in the survey were Boer or Boer crosses
with 6,329 head (55.69 percent) reported, Kiko or Kiko crosses with 1,725 head (15.18
percent) reported, and Spanish/Brush or Spanish/Brush crosses with 1,418 head (12.48
percent) reported. All other breed combined totaled 1,893 head (16.65 percent).
Similar results were found regarding buck breeds. For bucks, the top two breeds
represented in the survey were Boer or Boer crosses with 788 head (57.14 percent)
reported, and Kiko or Kiko crosses with 161 head (11.68 percent) reported. All other
Table 10. Contingency Table for Producer Experience Level vs. Producer Use of
Marketing Plan
Producer Experience Level in Years Marketing Plan?
Under 5 5-10 11-15 16-20 Over 20 Total
Yes 14
23 3 0 8 48
No 91
78 33 19 25 246
Total
105 101 36 19 33 294
30
Figure 7. Number of Bucks, Does, and Kids
31
Table 11. Descriptive Statistics for Number of Goats (total head) Reported.
Variable Result Number of Goats 16,336 Number of Respondents 304 Mean Number of Goats 53.74 Median Number of Goats 30 Mode Number of Goats 15 Largest Number of Goats 700 Smallest Number of goats 0

32
Table 12. Descriptive Statistics for Number of Acres Reported.
Variable Result Number of Acres 8,601 Number of Respondents 304 Mean Number of Acres 28.29 Median Number of Acres 11 Mode Number of Acres 5 Largest Number of Acres 660 Smallest Number of Acres 0
33
breed combined totaled 430 head (16.65 percent). Table 13 summarizes the breeds and
sexes of goats reported.
Seasonal Variations in Goat Breeding
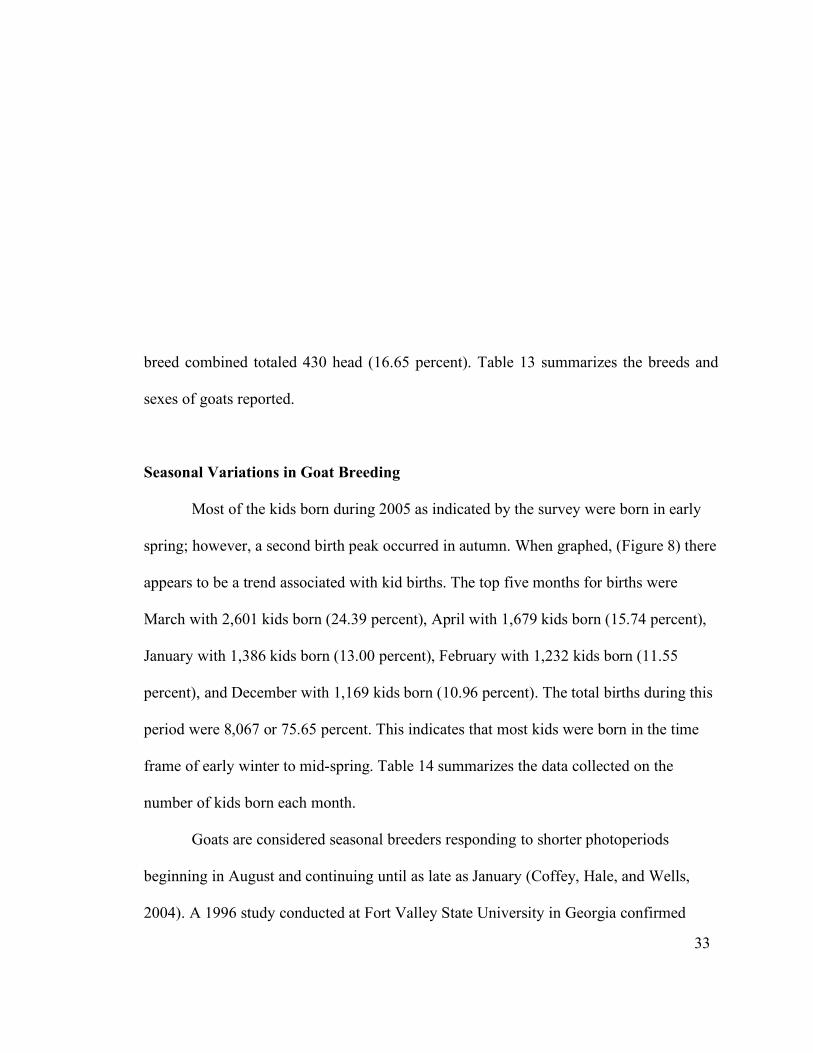
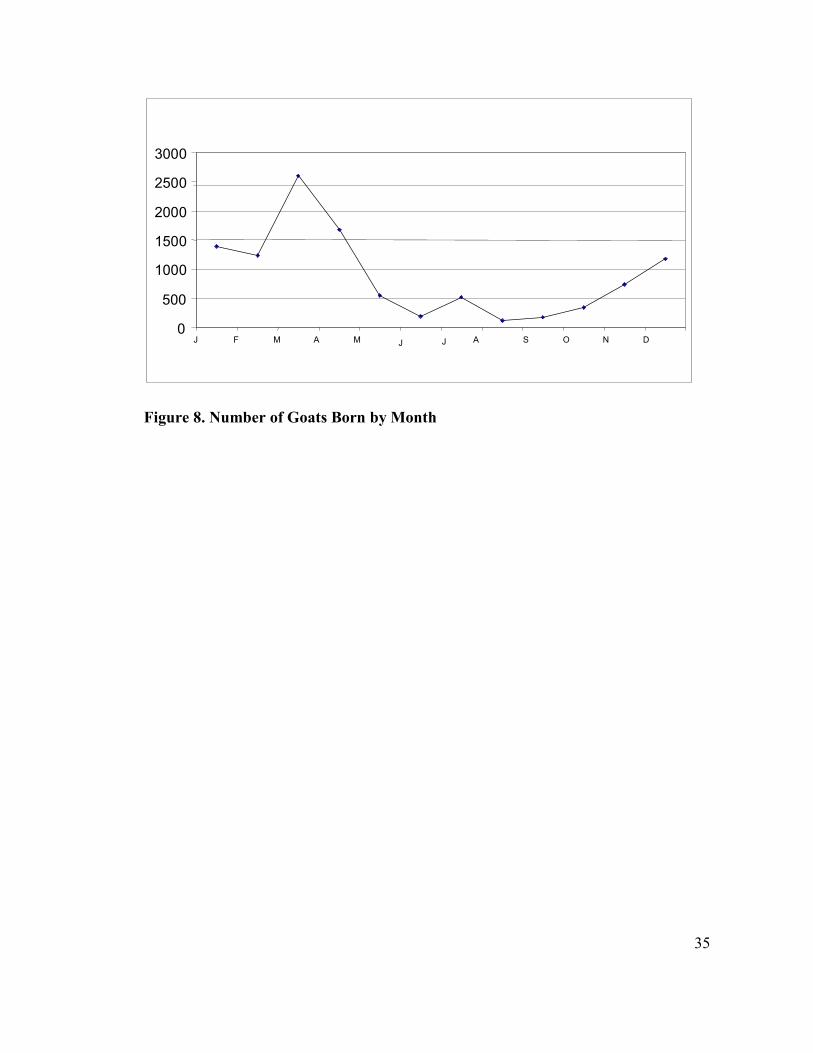
Most of the kids born during 2005 as indicated by the survey were born in early
spring; however, a second birth peak occurred in autumn. When graphed, (Figure 8) there
appears to be a trend associated with kid births. The top five months for births were
March with 2,601 kids born (24.39 percent), April with 1,679 kids born (15.74 percent),
January with 1,386 kids born (13.00 percent), February with 1,232 kids born (11.55
percent), and December with 1,169 kids born (10.96 percent). The total births during this
period were 8,067 or 75.65 percent. This indicates that most kids were born in the time
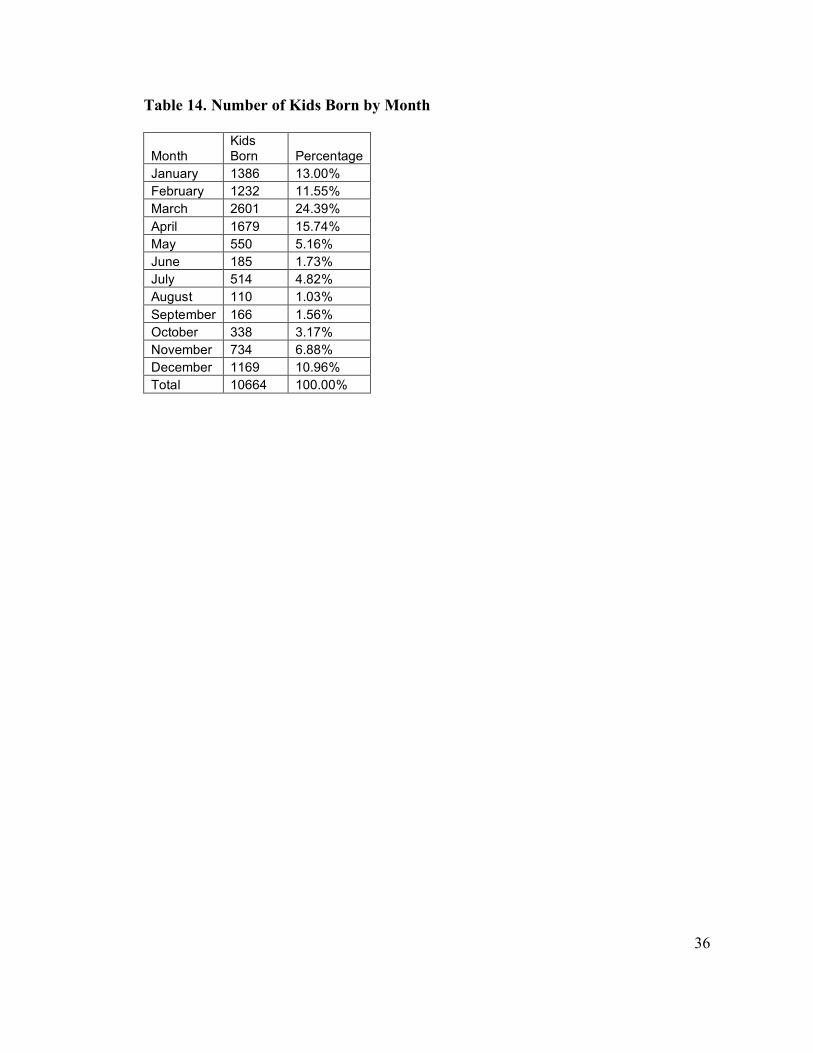
frame of early winter to mid-spring. Table 14 summarizes the data collected on the
number of kids born each month.
Goats are considered seasonal breeders responding to shorter photoperiods
beginning in August and continuing until as late as January (Coffey, Hale, and Wells,
2004). A 1996 study conducted at Fort Valley State University in Georgia confirmed
34
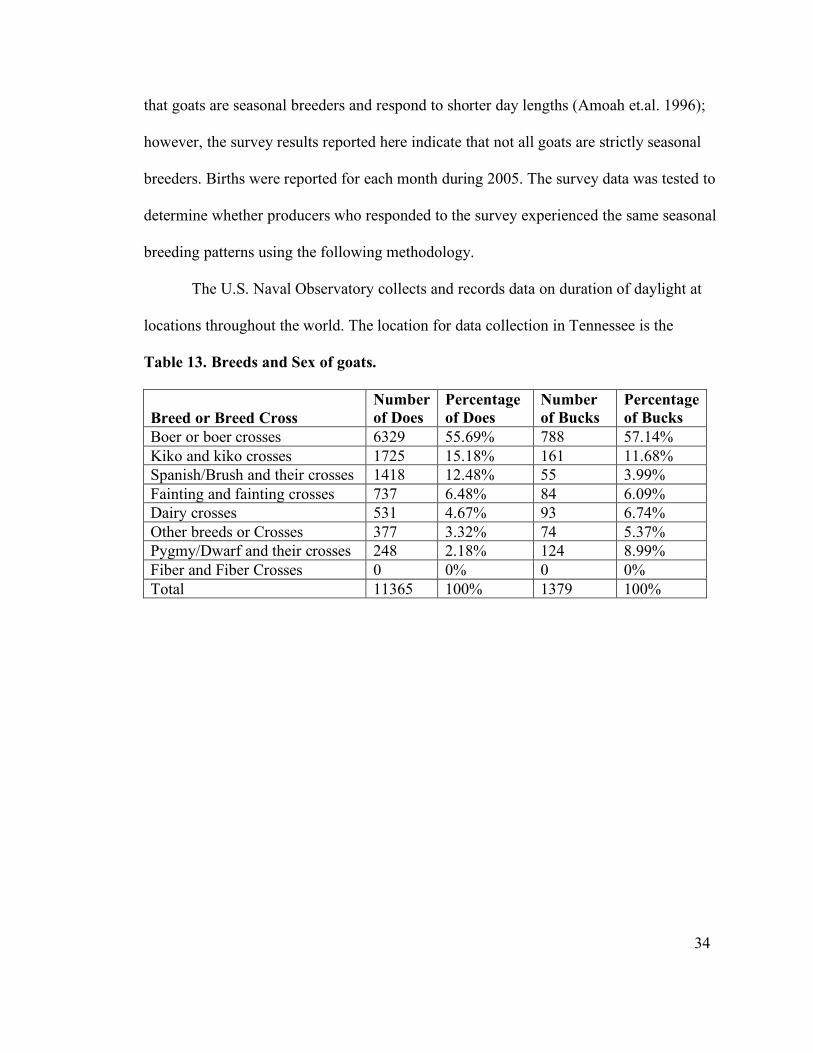
that goats are seasonal breeders and respond to shorter day lengths (Amoah et.al. 1996);
however, the survey results reported here indicate that not all goats are strictly seasonal
breeders. Births were reported for each month during 2005. The survey data was tested to
determine whether producers who responded to the survey experienced the same seasonal
breeding patterns using the following methodology.
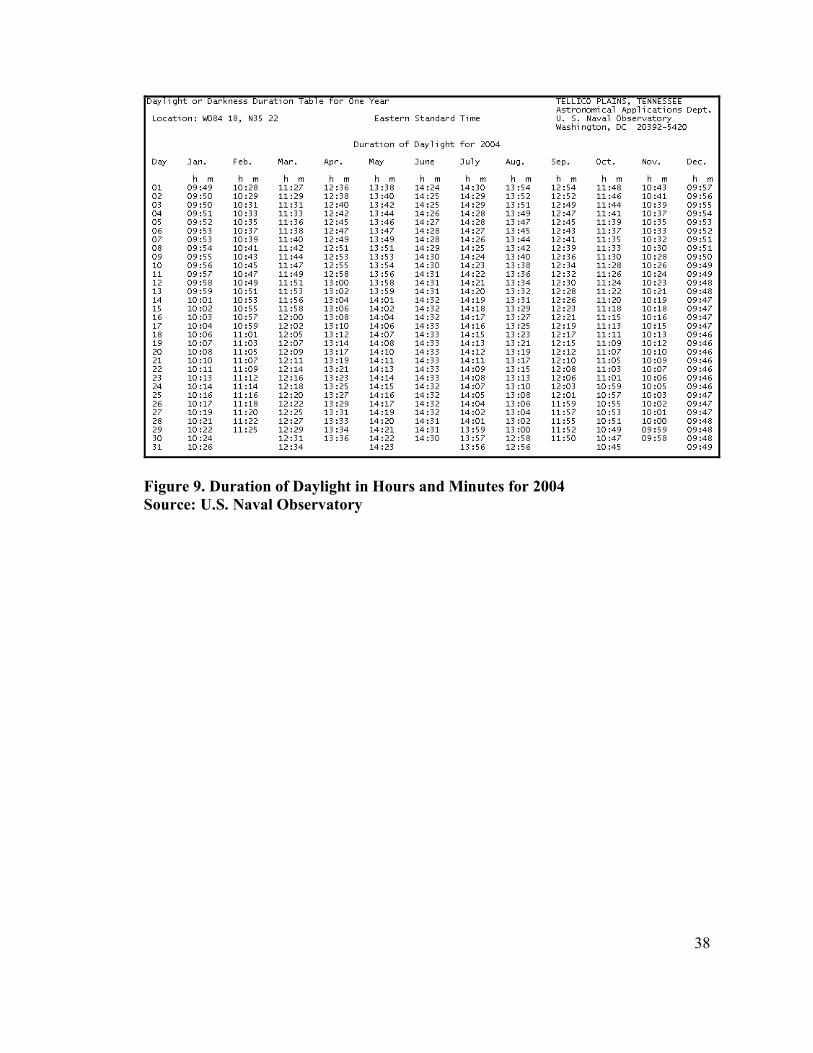
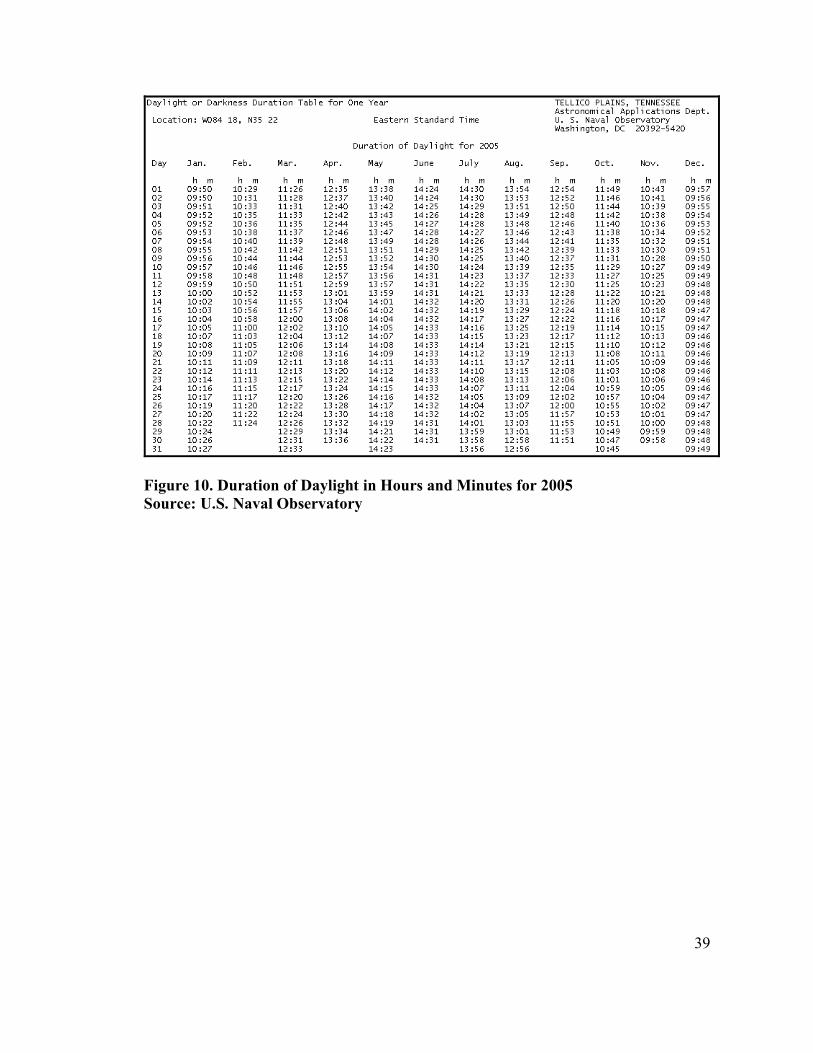
The U.S. Naval Observatory collects and records data on duration of daylight at
locations throughout the world. The location for data collection in Tennessee is the
Table 13. Breeds and Sex of goats.
Breed or Breed Cross Number of Does
Percentage of Does
Number of Bucks
Percentage of Bucks
Boer or boer crosses 6329 55.69% 788 57.14% Kiko and kiko crosses 1725 15.18% 161 11.68% Spanish/Brush and their crosses 1418 12.48% 55 3.99% Fainting and fainting crosses 737 6.48% 84 6.09% Dairy crosses 531 4.67% 93 6.74% Other breeds or Crosses 377 3.32% 74 5.37% Pygmy/Dwarf and their crosses 248 2.18% 124 8.99% Fiber and Fiber Crosses 0 0% 0 0% Total 11365 100% 1379 100%
35
Figure 8. Number of Goats Born by Month
0
500
1000
1500
2000
2500
3000
J F M A M J J A S O N D
36
Table 14. Number of Kids Born by Month
Month Kids Born Percentage
January 1386 13.00% February 1232 11.55% March 2601 24.39% April 1679 15.74% May 550 5.16% June 185 1.73% July 514 4.82% August 110 1.03% September 166 1.56% October 338 3.17% November 734 6.88% December 1169 10.96% Total 10664 100.00%

37
city of Tellico Plains. The data is collected and reported to the Astronomical Applications
Dept. at the U.S. Navel Observatory in Washington D.C. The results of the 2004 and
2005 day length data collection are summarized in Figures 9 and 10, respectively.
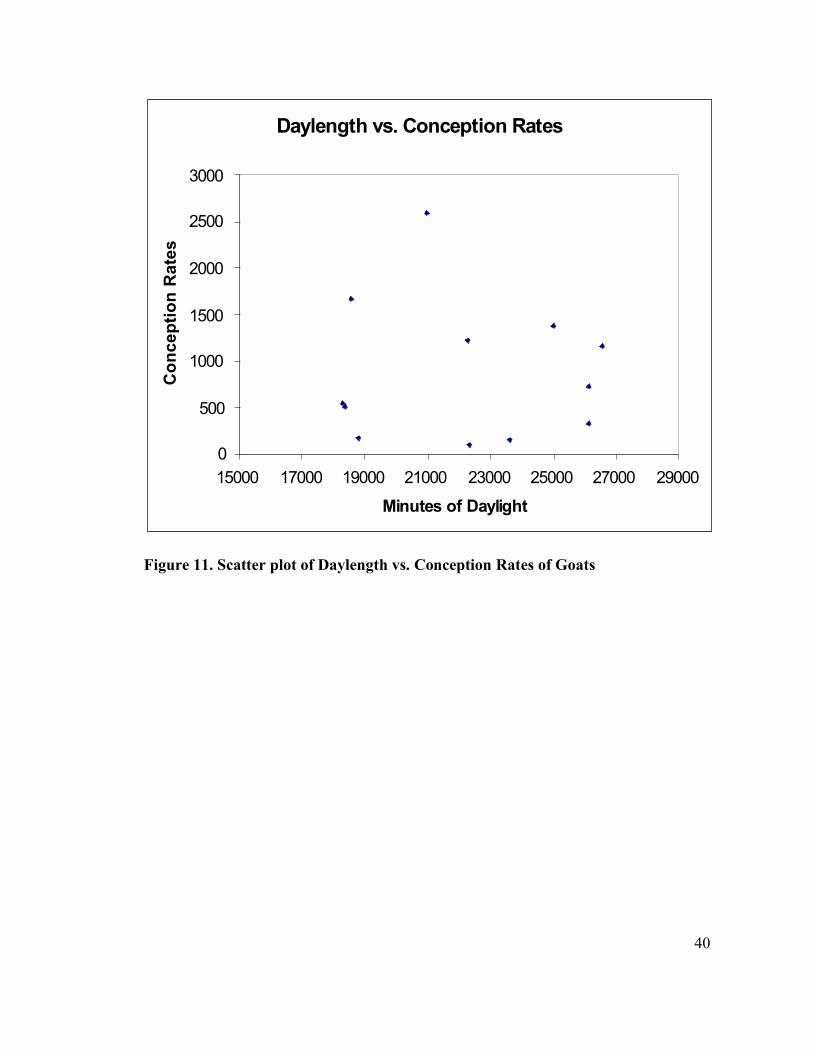
The approximate conception dates were found by tracing backward from the birth
month by 150 days. It was assumed that all kids were born on the 15th day of the month.
A correlation test was run using SAS to determine whether day length was related to
conception rates. The results of this procedure yielded a correlation coefficient of -
0.03971. This indicates that the relationship between day length and conception rates is
not statistically significant based on the data returned from the surveys at α = 0.05. It
should be noted that although this research does not confirm the previous studies,
additional research is necessary before drawing conclusions from these results. A scatter
plot of the data as shown in Figure 11 confirms the lack of correlation between the two
variables.
Despite the fact that nearly 76 percent of kids were born in early spring, no
significant correlation was shown between day length and kid births. However, some
other factor such as breed or management techniques used by producers could be
responsible for seasonal variations in goat reproduction. Again, further investigation is
necessary to determine why some goats are seasonal breeders while others are not.
Seasonal Variations in Goat Marketing
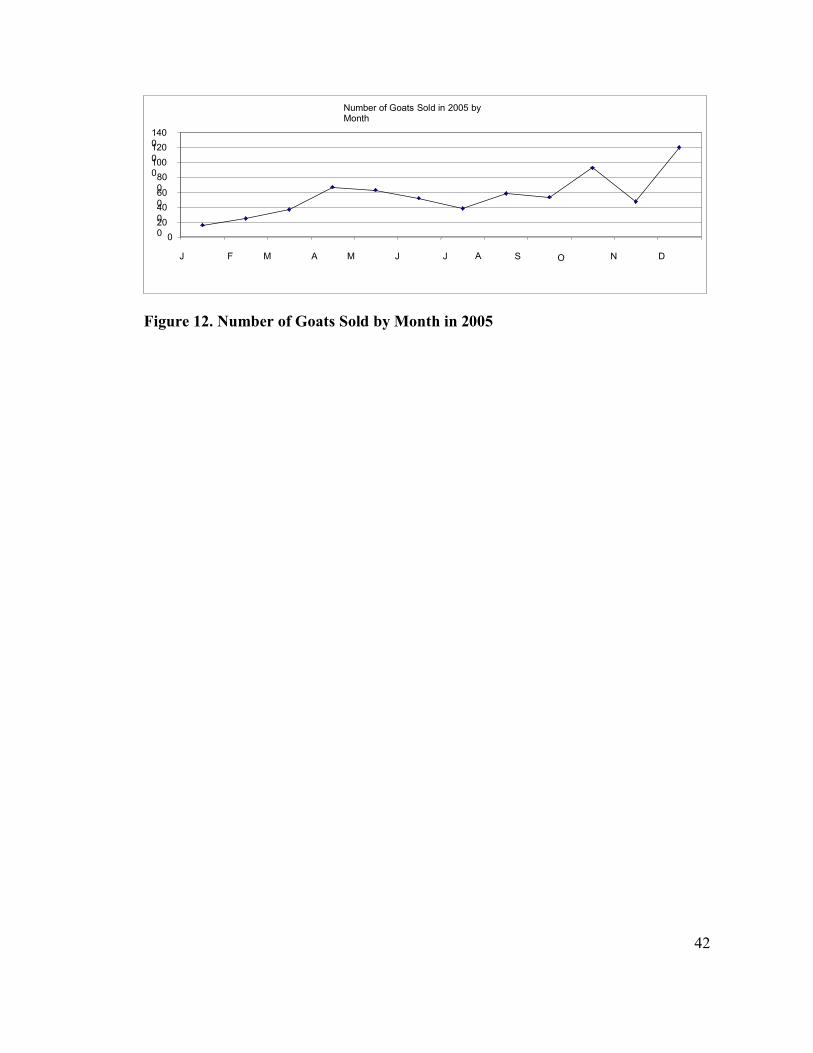
The month in which the most goats were sold in 2005 was December. The top
four months in goat sales for 2005 were December with 1,204 goats sold (18.03 percent),
October with 920 goat sold (13.78 percent), April with 670 goats sold
38
Figure 9. Duration of Daylight in Hours and Minutes for 2004 Source: U.S. Naval Observatory
39
Figure 10. Duration of Daylight in Hours and Minutes for 2005 Source: U.S. Naval Observatory
40
Daylength vs. Conception Rates
0
500
1000
1500
2000
2500
3000
15000 17000 19000 21000 23000 25000 27000 29000
Minutes of Daylight
Co
nc
ep
tio
n R
ate
s
Figure 11. Scatter plot of Daylength vs. Conception Rates of Goats
41
(10.03 percent), and May with 628 goats sold (9.40 percent). The top four months for
goat sales equaled 3,422 head (51.24 percent). In general, most goats in 2005 were sold
from mid-autumn to mid-spring. Figure 12 illustrates when respondents reported selling
their goats in 2005.
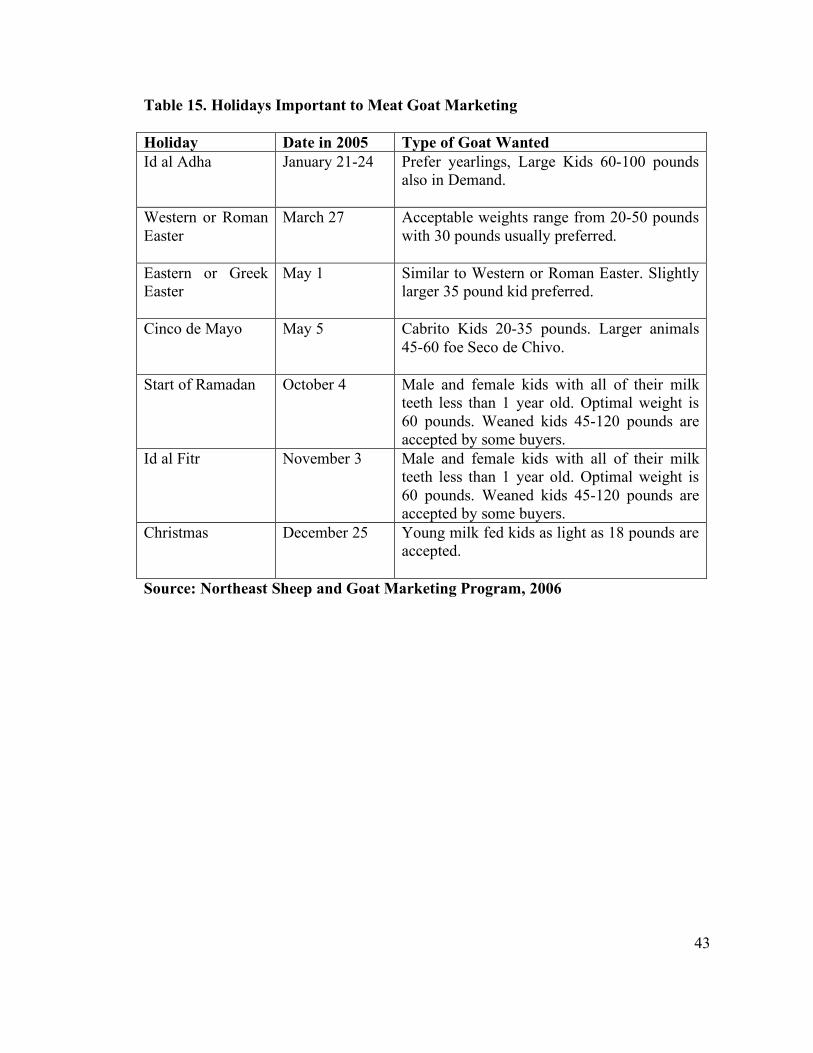
As previously stated, the holiday market for goat meat is the main source of
demand for meat goats. Although goat meat is consumed year round, it is preferred
during certain holidays. Table 15 summarizes holidays important to goat marketing and
the type of goat desired.
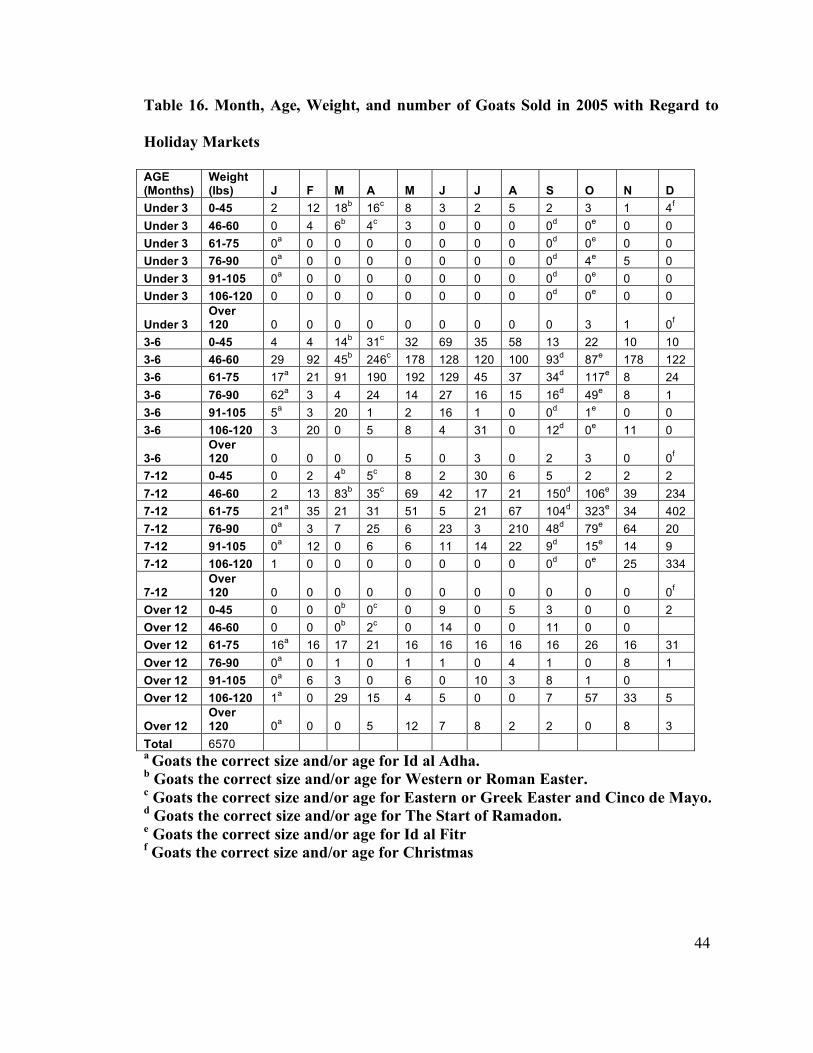
The marketing data with regard to month, age, and weight were collected from the
survey in such a manner that they could be combined into a table and compared to the
times of year when the holiday markets occur. Overall, there were 6,570 goats sold where
all three data indicators (month, age, and weight) were reported. Of these, 1,882 goats
(28.65 percent) were sold during the correct month, weight, and age for at least one of the
holiday markets. It is evident that producers would benefit from greater awareness of
holiday markets to obtain peak demand prices. Table 16 shows a summary of the data.
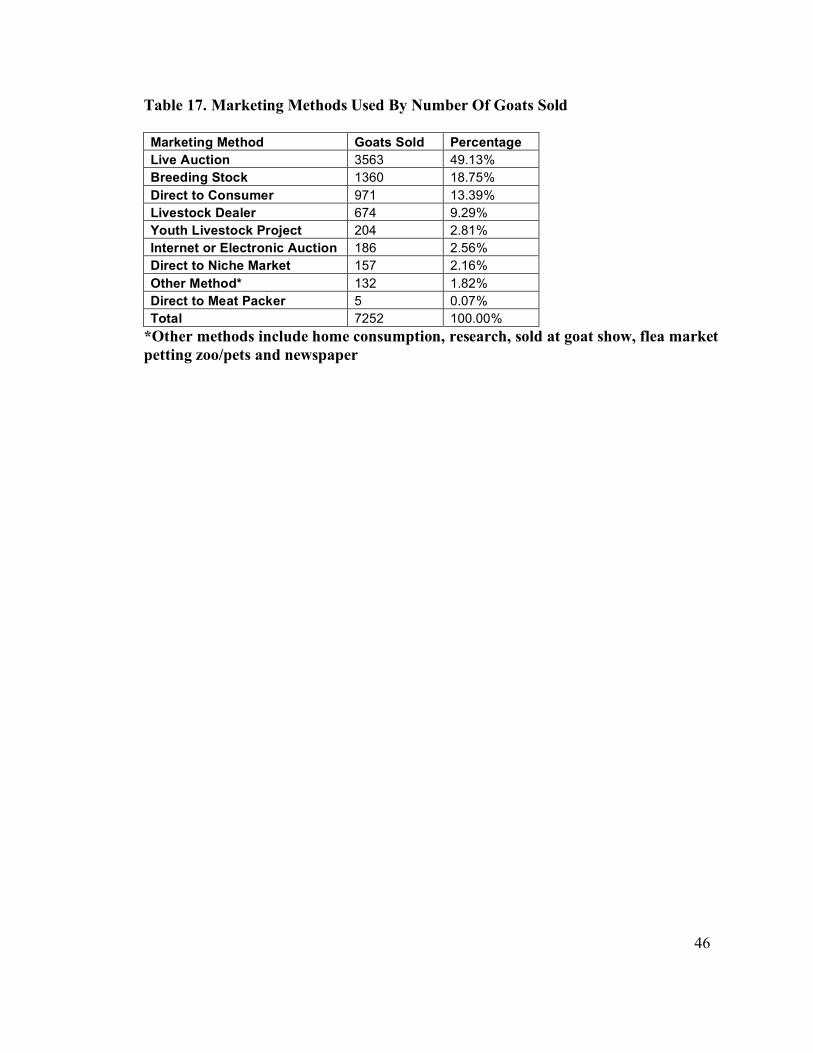
Types of Markets Used By Goat Producers
The data related to marketing methods used by goat producers was collapsed into
nine categories. The resulting nine categories were “Live Auction,” “On Farm Sale for
Breeding Stock,” “Direct to Consumer,” Directly to a Livestock Dealer,” “Sales to Youth
for a Livestock Project,” “Internet or Electronic Auction,” “Directly to a Niche Market,”
“Other Marketing Method,” and “Directly to a Meat Packer. ” Of these, “Live Auction”
was the method by which most goats were sold with 3,563 head (49.13 percent). The
42
Figure 12. Number of Goats Sold by Month in 2005
Number of Goats Sold in 2005 by Month
0 200
400
600
800
1000
1200
1400
J F M A M J J A S O N D
43
Table 15. Holidays Important to Meat Goat Marketing
Holiday Date in 2005 Type of Goat Wanted Id al Adha January 21-24
Prefer yearlings, Large Kids 60-100 pounds also in Demand.
Western or Roman Easter
March 27
Acceptable weights range from 20-50 pounds with 30 pounds usually preferred.
Eastern or Greek Easter
May 1
Similar to Western or Roman Easter. Slightly larger 35 pound kid preferred.
Cinco de Mayo May 5
Cabrito Kids 20-35 pounds. Larger animals 45-60 foe Seco de Chivo.
Start of Ramadan October 4 Male and female kids with all of their milk teeth less than 1 year old. Optimal weight is 60 pounds. Weaned kids 45-120 pounds are accepted by some buyers.
Id al Fitr November 3 Male and female kids with all of their milk teeth less than 1 year old. Optimal weight is 60 pounds. Weaned kids 45-120 pounds are accepted by some buyers.
Christmas December 25
Young milk fed kids as light as 18 pounds are accepted.
Source: Northeast Sheep and Goat Marketing Program, 2006
44
Table 16. Month, Age, Weight, and number of Goats Sold in 2005 with Regard to
Holiday Markets
AGE (Months)
Weight (lbs) J F M A M J J A S O N D
Under 3 0-45 2 12 18b 16c 8 3 2 5 2 3 1 4f Under 3 46-60 0 4 6b 4c 3 0 0 0 0d 0e 0 0 Under 3 61-75 0a 0 0 0 0 0 0 0 0d 0e 0 0 Under 3 76-90 0a 0 0 0 0 0 0 0 0d 4e 5 0 Under 3 91-105 0a 0 0 0 0 0 0 0 0d 0e 0 0 Under 3 106-120 0 0 0 0 0 0 0 0 0d 0e 0 0
Under 3 Over 120 0 0 0 0 0 0 0 0 0 3 1 0f
3-6 0-45 4 4 14b 31c 32 69 35 58 13 22 10 10 3-6 46-60 29 92 45b 246c 178 128 120 100 93d 87e 178 122 3-6 61-75 17a 21 91 190 192 129 45 37 34d 117e 8 24 3-6 76-90 62a 3 4 24 14 27 16 15 16d 49e 8 1 3-6 91-105 5a 3 20 1 2 16 1 0 0d 1e 0 0 3-6 106-120 3 20 0 5 8 4 31 0 12d 0e 11 0
3-6 Over 120 0 0 0 0 5 0 3 0 2 3 0 0f
7-12 0-45 0 2 4b 5c 8 2 30 6 5 2 2 2 7-12 46-60 2 13 83b 35c 69 42 17 21 150d 106e 39 234 7-12 61-75 21a 35 21 31 51 5 21 67 104d 323e 34 402 7-12 76-90 0a 3 7 25 6 23 3 210 48d 79e 64 20 7-12 91-105 0a 12 0 6 6 11 14 22 9d 15e 14 9 7-12 106-120 1 0 0 0 0 0 0 0 0d 0e 25 334
7-12 Over 120 0 0 0 0 0 0 0 0 0 0 0 0f
Over 12 0-45 0 0 0b 0c 0 9 0 5 3 0 0 2 Over 12 46-60 0 0 0b 2c 0 14 0 0 11 0 0 Over 12 61-75 16a 16 17 21 16 16 16 16 16 26 16 31 Over 12 76-90 0a 0 1 0 1 1 0 4 1 0 8 1 Over 12 91-105 0a 6 3 0 6 0 10 3 8 1 0 Over 12 106-120 1a 0 29 15 4 5 0 0 7 57 33 5
Over 12 Over 120 0a 0 0 5 12 7 8 2 2 0 8 3
Total 6570 a Goats the correct size and/or age for Id al Adha. b Goats the correct size and/or age for Western or Roman Easter. c Goats the correct size and/or age for Eastern or Greek Easter and Cinco de Mayo. d Goats the correct size and/or age for The Start of Ramadon. e Goats the correct size and/or age for Id al Fitr f Goats the correct size and/or age for Christmas

45
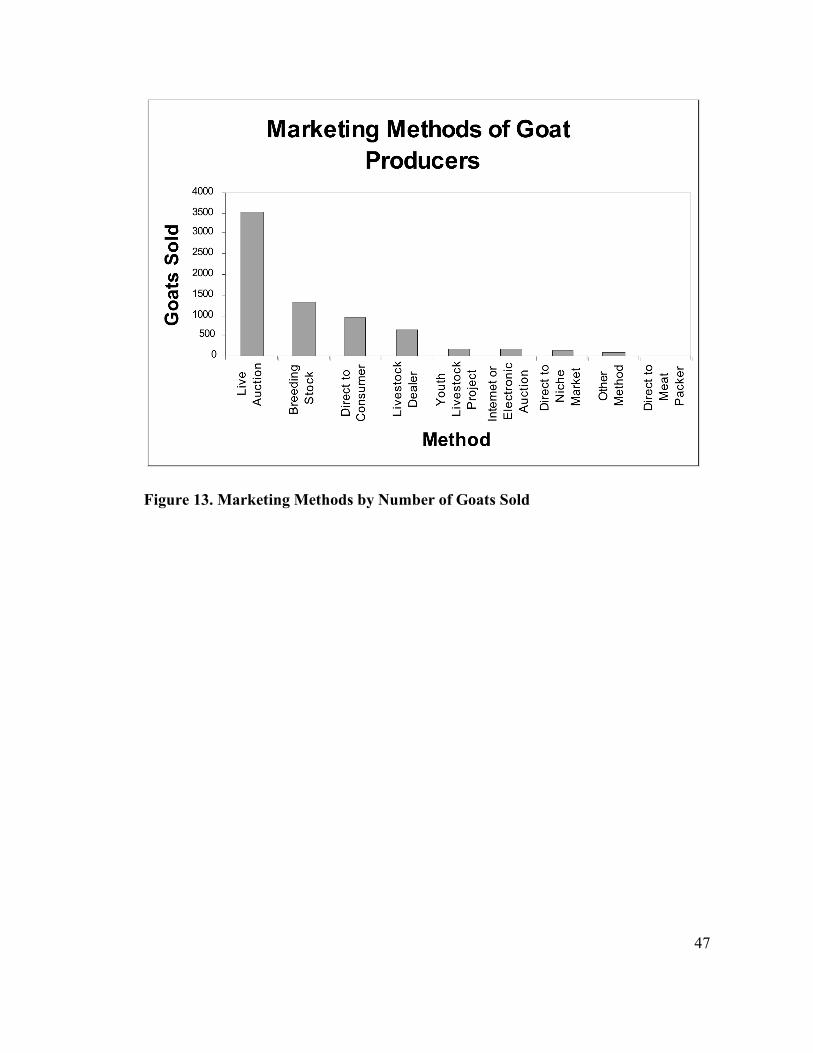
second largest number of goats sold was “On Farm Sale for Breeding Stock” (1,360 head
sold 18.75 percent). A summary of this data is shown in Table 17 and Figure 13.
The marketing method data was also analyzed by number of producers who
utilize each method. Again, “Live Auction” was the method of choice by producers with
135 producers (34.88 percent) utilizing this method and “On Farm Sale for Breeding
Stock” was second with 96 producers (24.81 percent). A summary of this data is shown
in Table 18.
These data indicate that while many goats are being sold, there are underutilized
markets. While there are advantages to using a livestock auction to sell goats such as
convenience and the fact that it only requires loading and shipping the animals, there are
disadvantages such as being a price taker, not a price setter and therefore being at the
mercy of the market. Other marketing opportunities such niche or specialty markets and
selling directly to consumers require much more planning and marketing skills. Producers
may be limited in their ability to sell directly to a meat packer if there is not a meat
packer in close proximity to the producer.
Producer Interest in New or Alternative Goat Markets
The majority of producers surveyed indicated that they are interested in
considering new or alternative markets for their goats. There were 147 producers (49.83
percent) who indicated that they are extremely interested in considering new or
alternative markets for their goats. Other responses to this question included 81 producers
(27.46 percent) are somewhat interested, 40 producers (13.56 percent) are slightly
46
Table 17. Marketing Methods Used By Number Of Goats Sold
Marketing Method Goats Sold Percentage Live Auction 3563 49.13% Breeding Stock 1360 18.75% Direct to Consumer 971 13.39% Livestock Dealer 674 9.29% Youth Livestock Project 204 2.81% Internet or Electronic Auction 186 2.56% Direct to Niche Market 157 2.16% Other Method* 132 1.82% Direct to Meat Packer 5 0.07% Total 7252 100.00%
*Other methods include home consumption, research, sold at goat show, flea market petting zoo/pets and newspaper
47
Figure 13. Marketing Methods by Number of Goats Sold

48
Table 18. Marketing Method Used By Number of Producers Marketing Method Producers Utilizing Method* Percentage Live Auction 135 34.88% Breeding Stock 96 24.81% Direct to Consumer 89 23.00% Livestock Dealer 27 6.98% Other Method** 13 3.36% Youth Livestock Project 12 3.10% Internet or Electronic Auction 11 2.84% Direct to Niche Market 3 0.78% Direct to Meat Packer 1 0.26% Total 387 100.00%
*Some Producers Used More Than One Marketing Method **Other methods include home consumption, research, sold at goat show, flea market petting zoo/pets and newspaper
49
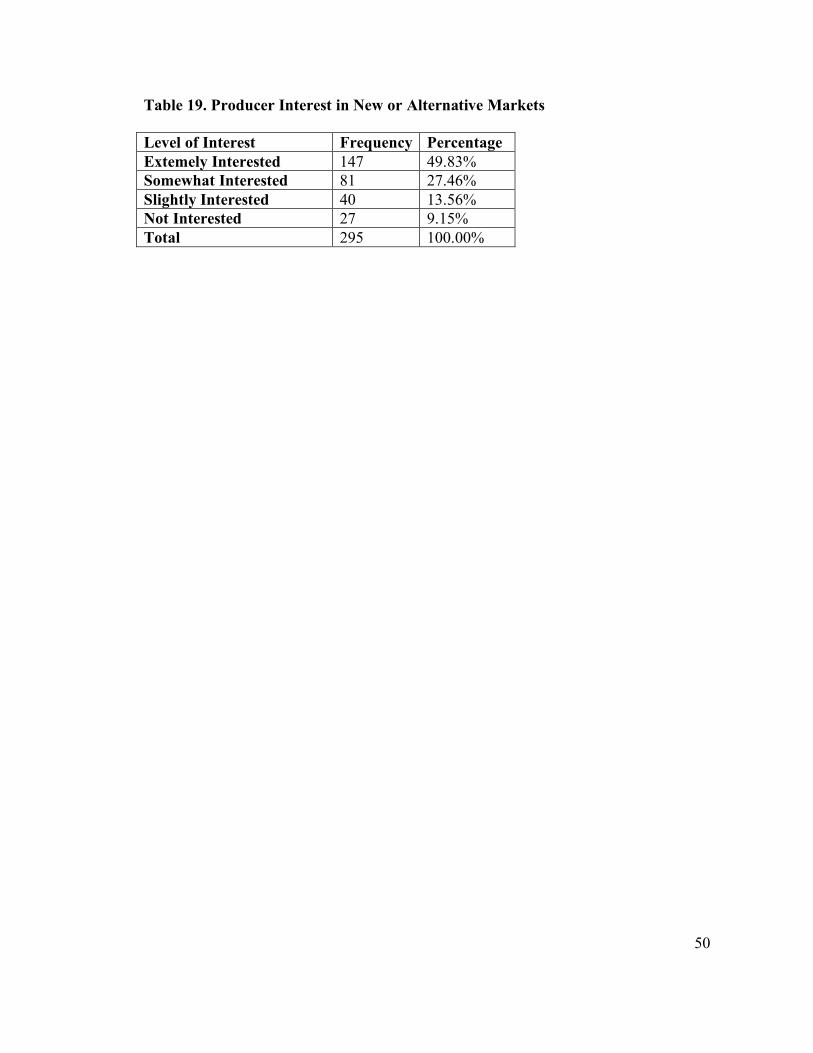
interested, and 27 producers (9.15 percent) are not at all interested in new or alternative
markets. These data are summarized in Table 19.
Although 77.29 percent of producers are extremely or somewhat interested in
considering new or alternative markets for their goats, more goats were marketed through
the traditional live auction method than any other method, even though other methods
were available. This may be due to the convenience of selling at a live action. Little
marketing skills are required to sell livestock at auction, and the producer only needs to
transport their animals to the sale barn. Other methods included on the survey require
specialized marketing skills and possibly contacts within the industry to be successful.
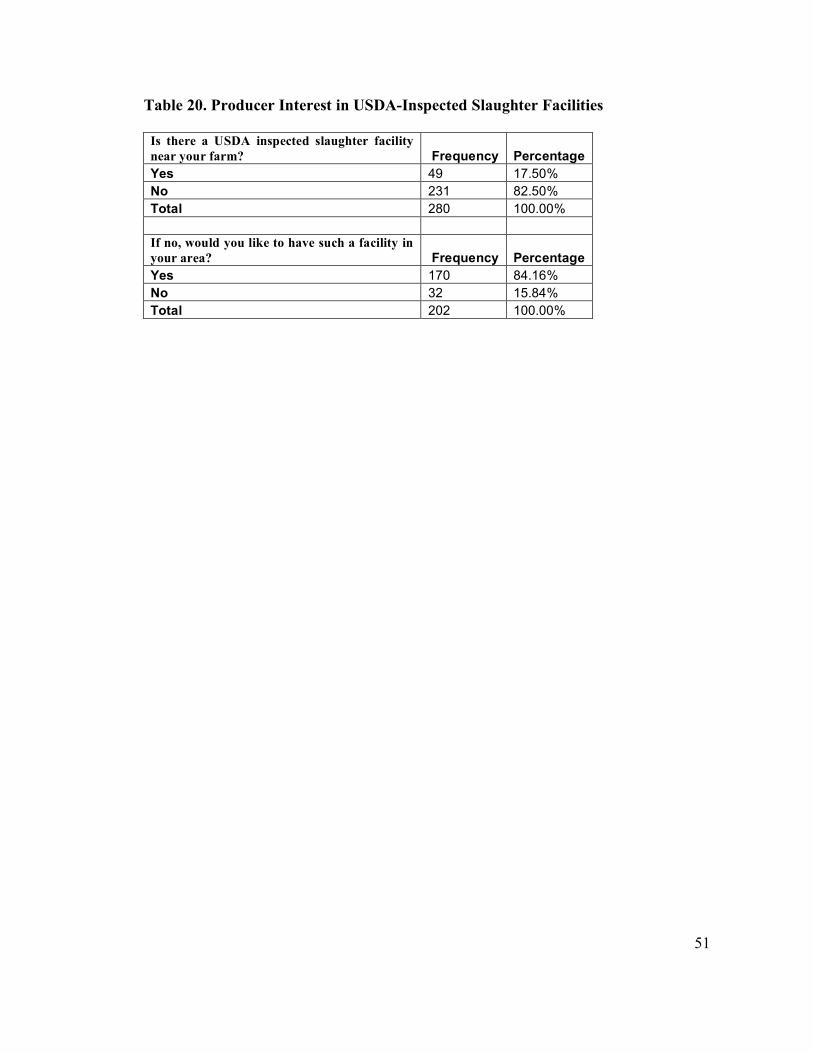
Producer Interest in USDA-Inspected Slaughter Facilities
The survey question regarding producer interest in USDA-inspected slaughter
facilities was a two-part query. “Is there a USDA inspected slaughter facility near you? If
no, would you like one?” The first question asked for producer’s proximity to a USDA
slaughter facility. It was the producer’s prerogative to determine the definition of the term
“near.” The second question was aimed at those who answered “no” to the previous part.
The vast majority of respondents (82.50 percent) did not have a USDA inspected
slaughter facility near their farm. Of those whose farm was not near a USDA inspected
slaughter facility, 84.16 percent would like to have such a facility in their area. There is
certainly a high level of interest in this potential marketing opportunity. A summary of
the data from both parts of question 15 is presented in Table 20.
50
Table 19. Producer Interest in New or Alternative Markets
Level of Interest Frequency Percentage Extemely Interested 147 49.83% Somewhat Interested 81 27.46% Slightly Interested 40 13.56% Not Interested 27 9.15% Total 295 100.00%
51
Table 20. Producer Interest in USDA-Inspected Slaughter Facilities
Is there a USDA inspected slaughter facility near your farm? Frequency Percentage Yes 49 17.50% No 231 82.50% Total 280 100.00% If no, would you like to have such a facility in your area? Frequency Percentage Yes 170 84.16% No 32 15.84% Total 202 100.00%
52
Chapter V
Conclusions
The results of this study have extended our knowledge of goat production and
producers in the Tennessee area. The following is a list of general findings about
producers and goat production in the focus area of the study.
1. The mean age of goat producers is 52.8 years old. This is similar to the average
age of the general population of farmers nationwide.
2. Most goat producers have less than 10 years experience raising goats.
3. Approximately 84 percent of goat producers do not have a written marketing
plan.
4. Most producers (89.60 percent) want to either increase or maintain the size of
their goat herd in the future.
5. Producers with five to ten years of goat production experience have more written
marketing plans than those with less or more experience.
6. The average number of goats per farm is 53.74 head.
7. Goats owned in the survey area are primarily Boer or Boer Crosses (55.69
percent does, 57.14 percent bucks).
8. Most does kid from December to April. There was no correlation between day
length and reproduction shown in this survey, although studies conducted using
live goats suggest that breeding is seasonal and biological and therefore not
under the control of the producer. If the trend of most births occurring between
December and April is indeed the normal birth pattern for goats in Tennessee, it
may not be feasible to develop a slaughter facility exclusively for goats due
53
erratic supply.
9. Producers are not meeting demand for holiday markets.
10. Most producers utilize livestock auctions to sell their goats, but most are
interested in considering new or alternative markets.
11. Most producers do not live near a USDA-inspected slaughter facility, but would
like to have one in their area.
Recommendations for Further Study
1. Seasonality of breeding. The results of this study did not find a correlation
between photoperiod and reproduction. Yet other studies have found and
confirmed this relationship. Research should be conducted to determine what
causes seasonal and out of season breeding.
2. Restaurant feasibility. A marketing study should be conducted in Tennessee to
determine the feasibility of selling goat meat in restaurants. Minimal information
is known regarding the prospect of marketing goat meat through restaurants in
Tennessee and producers could benefit from information collected.
3. Retail store feasibility. A marketing study should be conducted in Tennessee to
determine the feasibility of selling goat meat in retail stores. Minimal information
is known regarding the prospect of marketing goat meat through retail stores in
Tennessee and producers could benefit from information collected.
4. Direct marketing goats in Tennessee. Minimal information is known about direct
marketing of goats in Tennessee. A marketing study should be developed to
determine the feasibility of direct marketing goats and the type of animal in

54
demand for direct markets.

55
Works Cited
56
Amoah, E.A. Gelaye, S. Guthrie, P. and Rexroad, C. E. Breeding Season and Aspects of
Reproduction of Female Goats. Agricultural Research Station, Fort Valley State College.
Fort Valley, GA. 1996.
Casanova, D. Serving Ethnic Markets. Let’s Talk Business, Issue 93. Center For
Community Economic Development, University of Wisconsin-Extension. Madison, WI.
2004.
Coffey, L. Hale, M. and Wells, A. Goats: Sustainable Production Overview. National
Sustainable Agriculture Information Service. Fayetteville, AR. 2004.
Degner, Robert. Should You Market Chevon, Cabrito, or Goat Meat?. Florida
Agricultural Market Research Center, Food and Resource Economics Department,
Institute of Food and Agricultural Sciences, University of Florida, Gainesville, Florida.
1991.
Degner, Robert and Jordan Lin. Marketing Goat Meat: An Evaluation of Consumer
Perception and Preferences. Florida Agricultural Market Research Center, Food and
Resource Economics Department, Institute of Food and Agricultural Sciences, University
of Florida, Gainesville, Florida. 1993.
Engle, C. Greaser, G. and J. Harper. Agricultural Alternatives: Meat Goat Production.
Penn State University College of Agricultural Sciences, Agricultural Research and
57
Cooperative Extension. University Park, PA. 2000.
Freund, R. J. and Wilson, W. J. Statistical Methods 2nd Edition. Academy Press. New
York, New York. 2003.
Gipson, T.A. Demand for Goat Meat: Implications for the Future of the Industry.
Langston University Agricultural Research and Extension. Langston, OK. 2000.
Livestock Weekly. Texas Goat Numbers Now Same as Sheep. Livestock Weekly. San
Angelo Texas. February 4, 1999.
Luginbuhl, Jean-Marie. Meat Goat Production in North Carolina. North Carolina
Cooperative Extension Service. 2000.
Northeast Sheep and Goat Marketing Program. Ethnic Holiday Calendar.
Sheepgoatmarketing.info. Internet Website. http://sheepgoatmarketing.info. 2006.
Peischel, A. Status of the Tennessee Goat Industry. 2005 Meat Goat Production
Workshop and Trade Show. Center of Excellence for Experiential Learning in the
Agricultural Sciences, Department of Agriculture and Natural Resources. University of
Tennessee at Martin. Pg 5-11. 2005.
Pinkerton, F. Meat Goat Marketing in Greater New York City. The Center for
58
Agricultural Development and Entrepreneurship, State University of New York, Oneonta.
Internet Publication: http://www.clemson.edu/agronomy/goats/nypaper/. 1995.
Pinkerton, F. Mohair Pricing and Marketing. Fact Sheet. Langston University
Agricultural Research and Extension. Langston, OK. 1991.
Pinkerton, F., Harwell, L. Drinkwater, W. and N. Escobar. A Survey of Prevalent
Production and Marketing Practices in Meat Goats of Southern Origin. Langston
University Agricultural Research and Extension. Langston, OK. 1994.
Pinkerton, F., Harwell, L. Drinkwater, W. and N. Escobar. Consumer Demand for Goat
Meat. Langston University Agricultural Research and Extension. Langston, OK. 1994.
Pinkerton, F. and K. McMillin. Meat Goat Production Economics: The Influence of
Annual Doe Maintenance Cost and Reproductive Performance on the Break-Even Selling
Price/Pound of Slaughter Kids. Proceedings at the 2006 Tennessee Meat Goat Field Day.
University of Tennessee Extension and Tennessee State University Cooperative
Extension Program. Nashville. 2006.
SAS Institute Inc. Cary N.C. Internet Website: http://www.sas.com. 2006.
Soliaman, S.G. Meat Goat Industry Outlook for Small Farms in Alabama and
Surrounding States. George Washington Carver Agricultural Experiment Station.
59
Tuskegee University. Tuskegee AL. 2005
U.S. Census Bureau. Tennessee Quick Facts. U.S. Department of Commerce, Economics
and Statistics Administration. Washington, DC. Internet Publication:
http://www.census.gov. 2000.
USDA-NASS. 2002 Census of Agriculture. United States Department of Agriculture.
Washington DC. 2002.
U.S. Navel Observatory. Duration of Daylight for 2004. Astronomical Applications Dept.
U.S. Navel Observatory. Washington D.C. 2005.
U.S. Navel Observatory. Duration of Daylight for 2005. Astronomical Applications Dept.
U.S. Navel Observatory. Washington D.C. 2006.
U.S. Office of Immigration Statistics. Yearbook of Immigration Statistics: 2004.
Department of Homeland Security. Washington DC. 2005

60
Appendix A
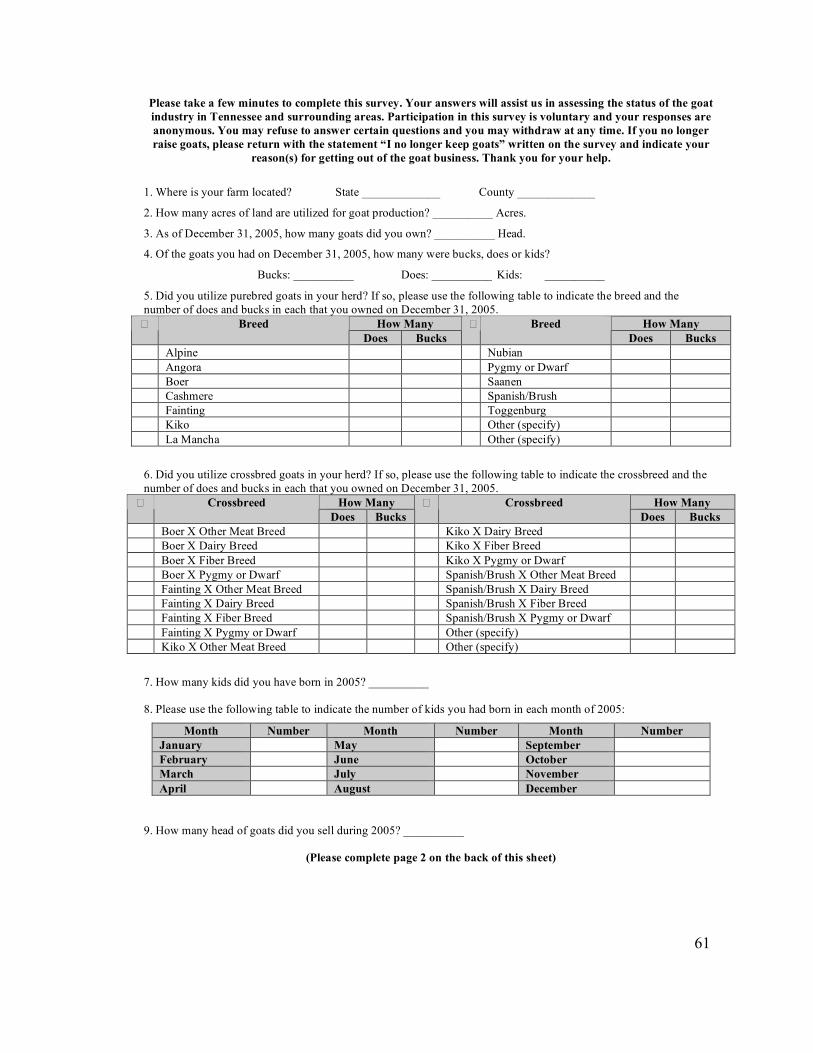
Survey Instrument
61
Please take a few minutes to complete this survey. Your answers will assist us in assessing the status of the goat industry in Tennessee and surrounding areas. Participation in this survey is voluntary and your responses are anonymous. You may refuse to answer certain questions and you may withdraw at any time. If you no longer raise goats, please return with the statement “I no longer keep goats” written on the survey and indicate your
reason(s) for getting out of the goat business. Thank you for your help.
1. Where is your farm located? State _____________ County _____________
2. How many acres of land are utilized for goat production? __________ Acres.
3. As of December 31, 2005, how many goats did you own? __________ Head.
4. Of the goats you had on December 31, 2005, how many were bucks, does or kids?
Bucks: __________ Does: __________ Kids: __________
5. Did you utilize purebred goats in your herd? If so, please use the following table to indicate the breed and the number of does and bucks in each that you owned on December 31, 2005.
How Many How Many � Breed Does Bucks
� Breed Does Bucks
Alpine Nubian Angora Pygmy or Dwarf Boer Saanen Cashmere Spanish/Brush Fainting Toggenburg Kiko Other (specify) La Mancha Other (specify)
6. Did you utilize crossbred goats in your herd? If so, please use the following table to indicate the crossbreed and the number of does and bucks in each that you owned on December 31, 2005.
How Many How Many � Crossbreed Does Bucks
� Crossbreed Does Bucks
Boer X Other Meat Breed Kiko X Dairy Breed Boer X Dairy Breed Kiko X Fiber Breed Boer X Fiber Breed Kiko X Pygmy or Dwarf Boer X Pygmy or Dwarf Spanish/Brush X Other Meat Breed Fainting X Other Meat Breed Spanish/Brush X Dairy Breed Fainting X Dairy Breed Spanish/Brush X Fiber Breed Fainting X Fiber Breed Spanish/Brush X Pygmy or Dwarf Fainting X Pygmy or Dwarf Other (specify) Kiko X Other Meat Breed Other (specify)
7. How many kids did you have born in 2005? __________
8. Please use the following table to indicate the number of kids you had born in each month of 2005:
Month Number Month Number Month Number January May September February June October March July November April August December
9. How many head of goats did you sell during 2005? __________
(Please complete page 2 on the back of this sheet)
62
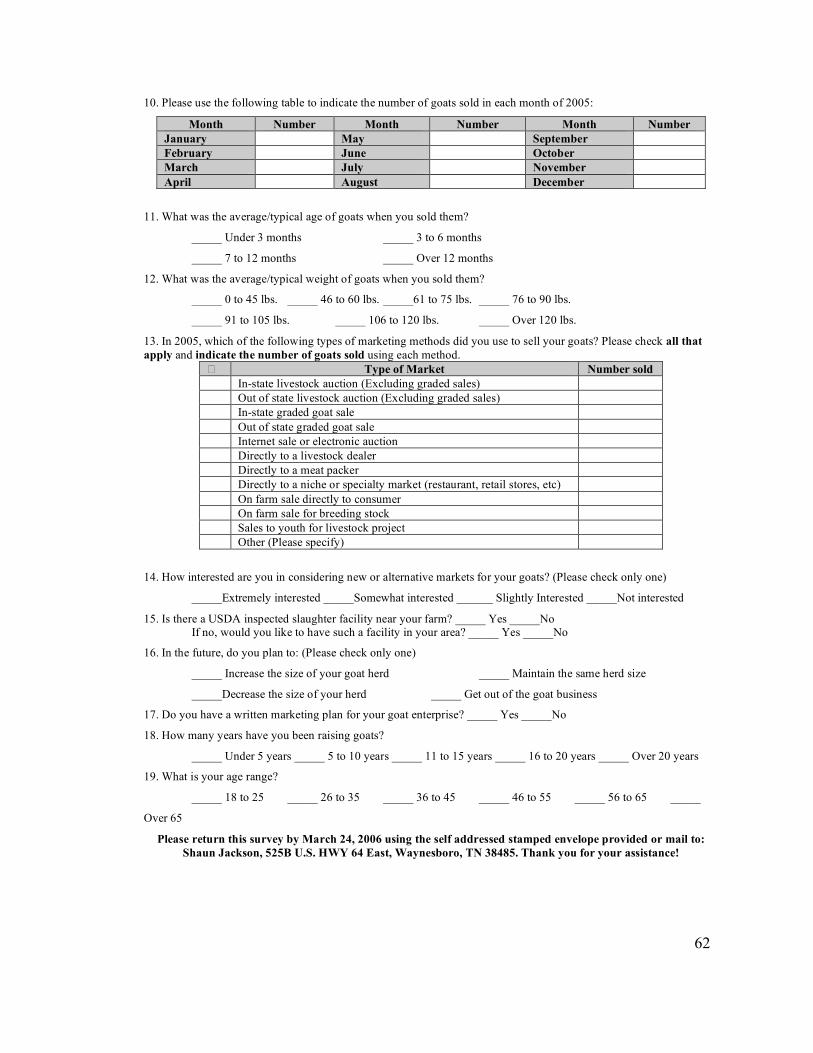
10. Please use the following table to indicate the number of goats sold in each month of 2005:
Month Number Month Number Month Number January May September February June October March July November April August December
11. What was the average/typical age of goats when you sold them?
_____ Under 3 months _____ 3 to 6 months
_____ 7 to 12 months _____ Over 12 months
12. What was the average/typical weight of goats when you sold them?
_____ 0 to 45 lbs. _____ 46 to 60 lbs. _____61 to 75 lbs. _____ 76 to 90 lbs.
_____ 91 to 105 lbs. _____ 106 to 120 lbs. _____ Over 120 lbs.
13. In 2005, which of the following types of marketing methods did you use to sell your goats? Please check all that apply and indicate the number of goats sold using each method.
� Type of Market Number sold In-state livestock auction (Excluding graded sales) Out of state livestock auction (Excluding graded sales) In-state graded goat sale Out of state graded goat sale Internet sale or electronic auction Directly to a livestock dealer Directly to a meat packer Directly to a niche or specialty market (restaurant, retail stores, etc) On farm sale directly to consumer On farm sale for breeding stock Sales to youth for livestock project Other (Please specify)
14. How interested are you in considering new or alternative markets for your goats? (Please check only one)
_____Extremely interested _____Somewhat interested ______ Slightly Interested _____Not interested
15. Is there a USDA inspected slaughter facility near your farm? _____ Yes _____No If no, would you like to have such a facility in your area? _____ Yes _____No
16. In the future, do you plan to: (Please check only one)
_____ Increase the size of your goat herd _____ Maintain the same herd size
_____Decrease the size of your herd _____ Get out of the goat business
17. Do you have a written marketing plan for your goat enterprise? _____ Yes _____No
18. How many years have you been raising goats?
_____ Under 5 years _____ 5 to 10 years _____ 11 to 15 years _____ 16 to 20 years _____ Over 20 years
19. What is your age range?
_____ 18 to 25 _____ 26 to 35 _____ 36 to 45 _____ 46 to 55 _____ 56 to 65 _____
Over 65
Please return this survey by March 24, 2006 using the self addressed stamped envelope provided or mail to: Shaun Jackson, 525B U.S. HWY 64 East, Waynesboro, TN 38485. Thank you for your assistance!

63
Appendix B
Survey Cover Letter
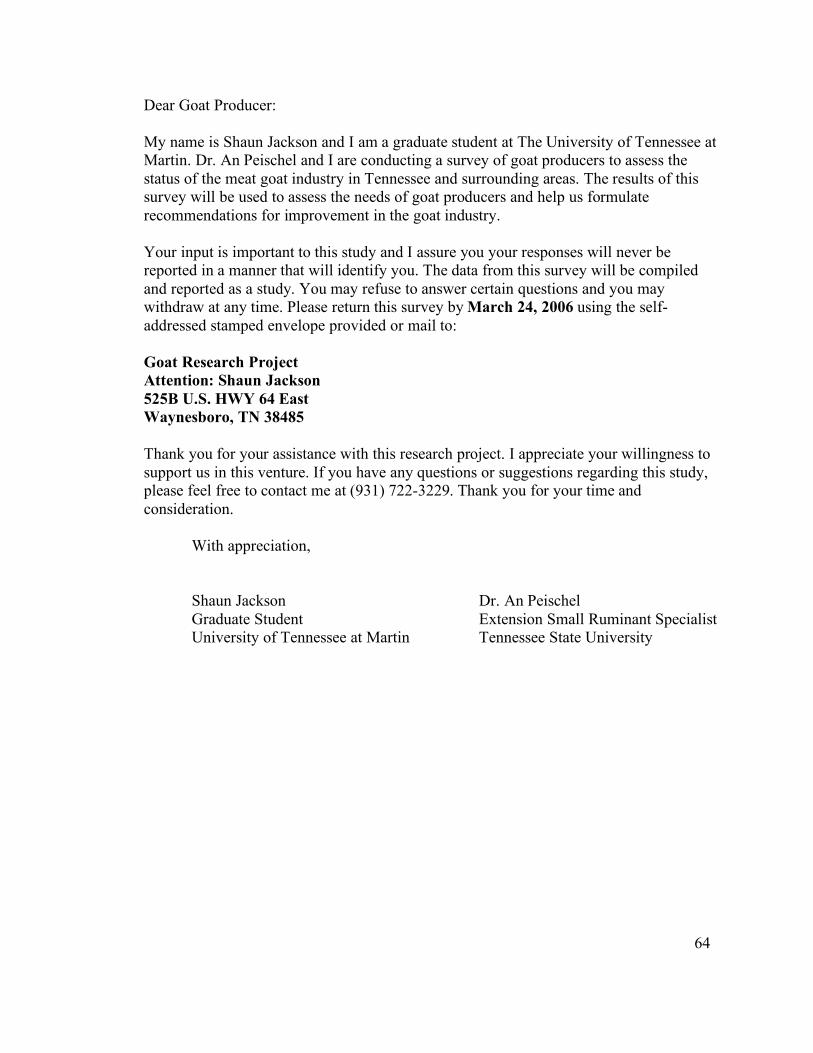
64
Dear Goat Producer: My name is Shaun Jackson and I am a graduate student at The University of Tennessee at Martin. Dr. An Peischel and I are conducting a survey of goat producers to assess the status of the meat goat industry in Tennessee and surrounding areas. The results of this survey will be used to assess the needs of goat producers and help us formulate recommendations for improvement in the goat industry. Your input is important to this study and I assure you your responses will never be reported in a manner that will identify you. The data from this survey will be compiled and reported as a study. You may refuse to answer certain questions and you may withdraw at any time. Please return this survey by March 24, 2006 using the self-addressed stamped envelope provided or mail to: Goat Research Project Attention: Shaun Jackson 525B U.S. HWY 64 East Waynesboro, TN 38485 Thank you for your assistance with this research project. I appreciate your willingness to support us in this venture. If you have any questions or suggestions regarding this study, please feel free to contact me at (931) 722-3229. Thank you for your time and consideration.
With appreciation,
Shaun Jackson Dr. An Peischel Graduate Student Extension Small Ruminant Specialist University of Tennessee at Martin Tennessee State University
65
VITA
Glendon Shaun Jackson was born on August 26, 1974 to William Glendon
Jackson and Ochel Terrell Jackson. He was reared with two older brothers on a small
farm near Barbourville, Kentucky. He graduated from Knox Central High School in
Barbourville, KY in 1993 and earned his B.S. degree in Agriculture from Berea College
in 1998. He is currently employed by The University of Tennessee as a County Extension
Agent and operates Lilly Valley Farm with his wife Karen Sue Jackson and son Samuel
Foster Jackson. Glendon Shaun Jackson also has over 25 years experience in meat and
dairy goat production.