Embed Size (px)
Citation preview

If this information is required in an accessible format, please contact 1-800-372-1102 ext. 2305.
Header
To: The Committee of the Whole From: Commissioner of Finance Report: #2017-COW-23 Date: February 1, 2017
Subject:
2017 Strategic Property Tax Study
Recommendations:
That the Committee of the Whole recommends to Regional Council that:
A) For the 2017 property taxation year, the municipal property tax ratios for the occupied property tax classes for the Regional Municipality of Durham remain unchanged from the 2016 levels as follows:
Multi-Residential 1.8665 Commercial Residual, Shopping Centre and Office Building 1.4500 Industrial Residual and Large Industrial 2.2598 Pipelines 1.2294 Farmland 0.2000 Managed Forests 0.2500
and the requisite by-law be prepared and approval be granted.
B) The Region of Durham continue to choose the maximum available options in the mandated Provincial Business Protection program (Capping) to expedite the movement of protected properties to their full current value assessment (CVA) level of taxation.
C) The Region of Durham Finance staff continue to meet with the Local Municipal Treasurers to review and consider Region-wide changes to the municipal tax ratio discounts for the commercial and industrial broad property class’ vacant/excess land classifications and the vacant unit rebate program and report back to Regional Council on the outcome of the review. Further, as part of this review, Durham Region Finance staff will consult with the business community on any proposed changes.
Report #2017-COW-23 Page 2 of 26
D) The Commissioner of Finance be authorized to file Requests for Reconsideration (RfR) with the Municipal Property Assessment Corporation (MPAC) regarding the January 1st, 2016 assessment for the Durham Regional Local Housing Corporation (DRLHC) properties.
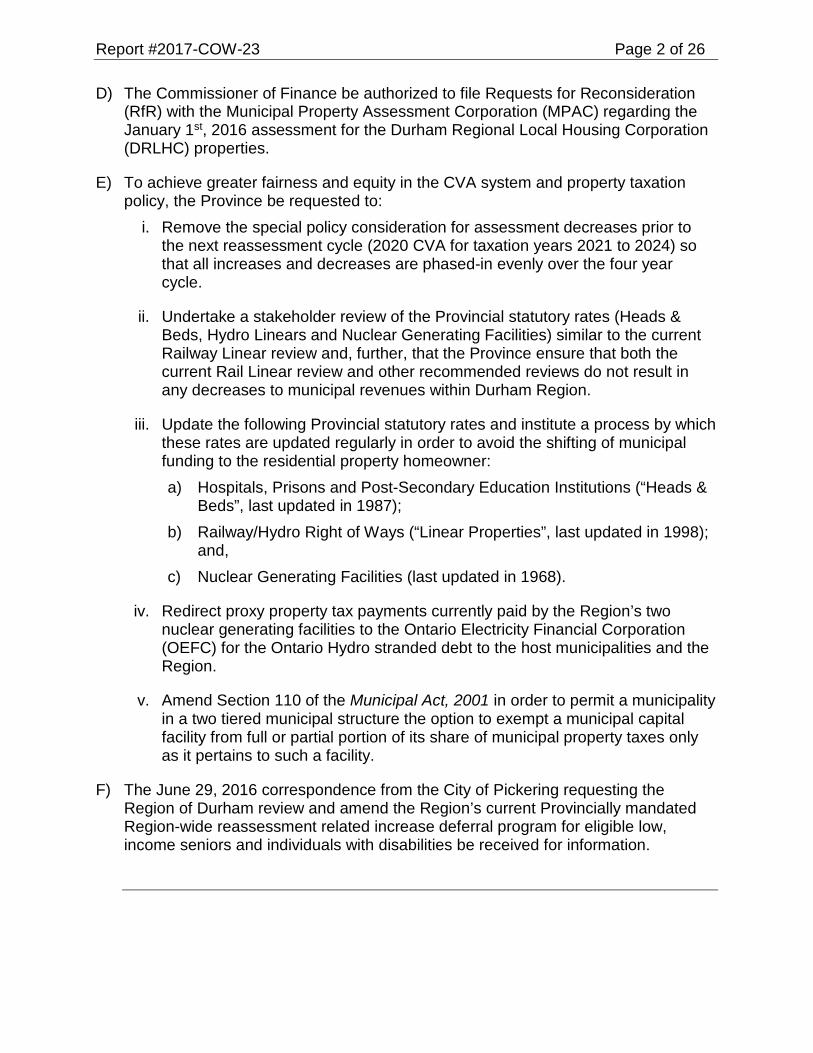
E) To achieve greater fairness and equity in the CVA system and property taxation policy, the Province be requested to:
i. Remove the special policy consideration for assessment decreases prior to the next reassessment cycle (2020 CVA for taxation years 2021 to 2024) so that all increases and decreases are phased-in evenly over the four year cycle.
ii. Undertake a stakeholder review of the Provincial statutory rates (Heads & Beds, Hydro Linears and Nuclear Generating Facilities) similar to the current Railway Linear review and, further, that the Province ensure that both the current Rail Linear review and other recommended reviews do not result in any decreases to municipal revenues within Durham Region.
iii. Update the following Provincial statutory rates and institute a process by which these rates are updated regularly in order to avoid the shifting of municipal funding to the residential property homeowner: a) Hospitals, Prisons and Post-Secondary Education Institutions (“Heads &
Beds”, last updated in 1987); b) Railway/Hydro Right of Ways (“Linear Properties”, last updated in 1998);
and, c) Nuclear Generating Facilities (last updated in 1968).
iv. Redirect proxy property tax payments currently paid by the Region’s two nuclear generating facilities to the Ontario Electricity Financial Corporation (OEFC) for the Ontario Hydro stranded debt to the host municipalities and the Region.
v. Amend Section 110 of the Municipal Act, 2001 in order to permit a municipality in a two tiered municipal structure the option to exempt a municipal capital facility from full or partial portion of its share of municipal property taxes only as it pertains to such a facility.
F) The June 29, 2016 correspondence from the City of Pickering requesting the Region of Durham review and amend the Region’s current Provincially mandated Region-wide reassessment related increase deferral program for eligible low, income seniors and individuals with disabilities be received for information.

Report #2017-COW-23 Page 3 of 26
Report 1. Introduction
1.1. The calculation of property taxes is based on a property’s current value assessment (CVA) as included in the returned assessment roll provided by the Municipal Property Assessment Corporation (MPAC) under the authority of the Assessment Act and the Municipal Act, 2001 where:
• MPAC is responsible for the assignment of CVA and classification for all individual properties in Ontario; and
• Municipalities must use MPAC information along with budgetary requirements and municipal taxation ratios to calculate annual property tax rates applicable to individual property tax classifications.
1.2. This report examines the significant risks arising from the Region’s property assessment base which have the potential to put upward pressure on the residential property tax rate including:
• assessment growth;
• the new reassessment cycle and related taxation impacts;
• changes in MPAC assessment methodologies;
• assessment appeals; and
• current Provincial policy changes and new initiatives.
1.3. A comparison of the competitiveness of the Region’s property taxes for residential, commercial and industrial properties is discussed along with a look ahead to potential policy changes and their impacts on property taxation.
1.4. Attachments #1 to #7 provide additional information and analysis on current assessment and property taxation issues including: the recent reassessment update by MPAC to January 1, 2016 (herein referred to as the 2016 CVA) and the resulting Regional property taxation impacts; Residential and Multi-Residential sector assessment and taxation, and various Provincial property tax policies.
2. Municipal Tax Ratios
2.1. A municipal tax ratio is the degree to which an individual property class is taxed relative to the residential class.
2.2. Any changes in tax ratios results in property tax shifts between the property classes. However the ratio change is revenue neutral with respect to total municipal taxes (tax changes in target class with ratio change entirely offset by changes in other classes).

Report #2017-COW-23 Page 4 of 26
2.3. Table 1 provides Durham Region’s recommended 2017 municipal tax ratios and ranking with respect to other municipal comparators (2016) showing that Durham’s ratios are comparable with similar Ontario jurisdictions.
Table 1 Municipal Tax Ratio Comparison Table
Multi-Residential Commercial Industrial Farmland
Ratio Rank Ratio Rank Ratio Rank Ratio Rank Durham Region 1.867 4 1.450 3 2.260 4 0.200 2 Toronto 2.904 10 2.904 10 2.904 9 0.250 5 Peel Region (Mississauga) 1.779 3 1.410 2 1.571 2 0.250 5 Halton Region 2.262 7 1.457 4 2.360 6 0.200 2 York Region 1.000 1 1.117 1 1.312 1 0.250 5 Ottawa 1.425 2 1.943 6 2.663 8 0.200 2 Niagara Region 2.044 6 1.759 5 2.630 7 0.250 5 Waterloo Region 1.950 5 1.950 7 1.950 3 0.250 5 Hamilton 2.740 9 1.980 8 3.090 10 0.163 1 Windsor 2.540 8 2.002 9 2.338 5 0.250 5
2.4. Further, it is also recommended, that the Region of Durham not implement any new property classes in 2017 until such time as the assessment appeal risk related to the new 2016 CVA have been quantified.
3. Assessment Growth 3.1. Since 2010, the Region has been in a historically slow growth period, which
places additional pressure on the budget as increased assessment is not available to fund inflationary and budget priority pressures. Durham Region estimated 2017 assessment growth for budgetary purposes is 1.7 per cent.
3.2. Historically, Durham Region’s residential growth has been strong relative to the non-residential growth resulting in property tax shifts from the non-residential to the residential taxpayer.
3.3. The industrial property class has had negative growth over the majority of the last decade while commercial growth has been constrained in the last several years. As discussed in detail later in this report, the large backlog of appeals at the Assessment Review Board (ARB), predominantly for commercial and industrial properties, are anticipated to further reduce near term assessment growth and further erode the non-residential share of the assessment and taxation bases.

Report #2017-COW-23 Page 5 of 26
4. Non-Residential Share of Assessment and Taxation Base
4.1. The Region has experienced a continuously decreasing non-residential share of the assessment base since 1998. The decrease in the non-residential share places upward pressure on the residential property tax rate and is a significant financial risk for the Region. Figure 1 shows the significant decline in the non-residential share of the Region’s property tax base.
Figure 1 Share of Regional Property Taxation 1998 to 2020 (estimated)
4.2. Between 1998 and 2020 (estimated based on recent reassessment):
• the residential relative share of the Regional taxation base will have risen 7.1 per cent from 78.7 per cent in 1998 to 84.3 per cent in 2020; and,
• the non-residential relative share is estimated to drop 26.3 per cent from the 21.3 per cent share in 1998 to a 15.7 per cent share in 2020.
4.3. The changes in Regional taxation shares by property class are the result of:
• differences in assessment growth across the property classes;
• different valuation changes across the property classes from reassessments;
• ARB assessment appeal decisions; and
• changes to municipal tax ratios.
78.7%
84.3%
1998
2000
2002
2004
2006
2008
2010
2012
2014
2016
2018
2020
Residential (including MR)
21.3%
15.7%
1998
2000
2002
2004
2006
2008
2010
2012
2014
2016
2018
2020
Non-Residential
Report #2017-COW-23 Page 6 of 26
5. 2016 CVA Reassessment for Taxation Years 2017 to 2020
5.1. Overview
• In 2016, MPAC conducted the Provincially mandated reassessment cycle to update the assessment valuation date from January 1, 2012 to January 1, 2016 (2016 CVA). Per Provincial legislation, assessment increases are phased-in uniformly over the subsequent four-year taxation cycle (2017 to 2020), while assessment decreases are fully implemented in the first year (2017).
• The reassessment does not result in a change in total municipal taxation but does result in shifts amongst individual taxpayers. As a result of the shifts amongst individual taxpayers, taxation shifts occur across property classes and across the local municipalities within the Region.
5.2. MPAC Process for the 2016 CVA Reassessment
• The 2016 CVA reassessment by MPAC includes the effects of several assessment methodology changes as well as the results of enhanced consultations and disclosure by MPAC. Many of these changes were the result of recommendations included in the Special Purpose Built Property Assessment Review (SPBPAR).
• The mandate of SPBPAR, announced in the Provincial 2013 spring budget, was to develop recommendations to ensure Ontario’s property assessment system is fair, accurate and predictable. In particular, it was charged with:
“Clarifying and refining the assessment methodologies applied to special-purpose business properties, such as mills, landfills, industrial lands, billboards, farms and wind turbine towers;
Reviewing the timelines for the assessment appeal process; and,
Considering other opportunities to strengthen the Municipal Property Assessment Corporation (MPAC).”
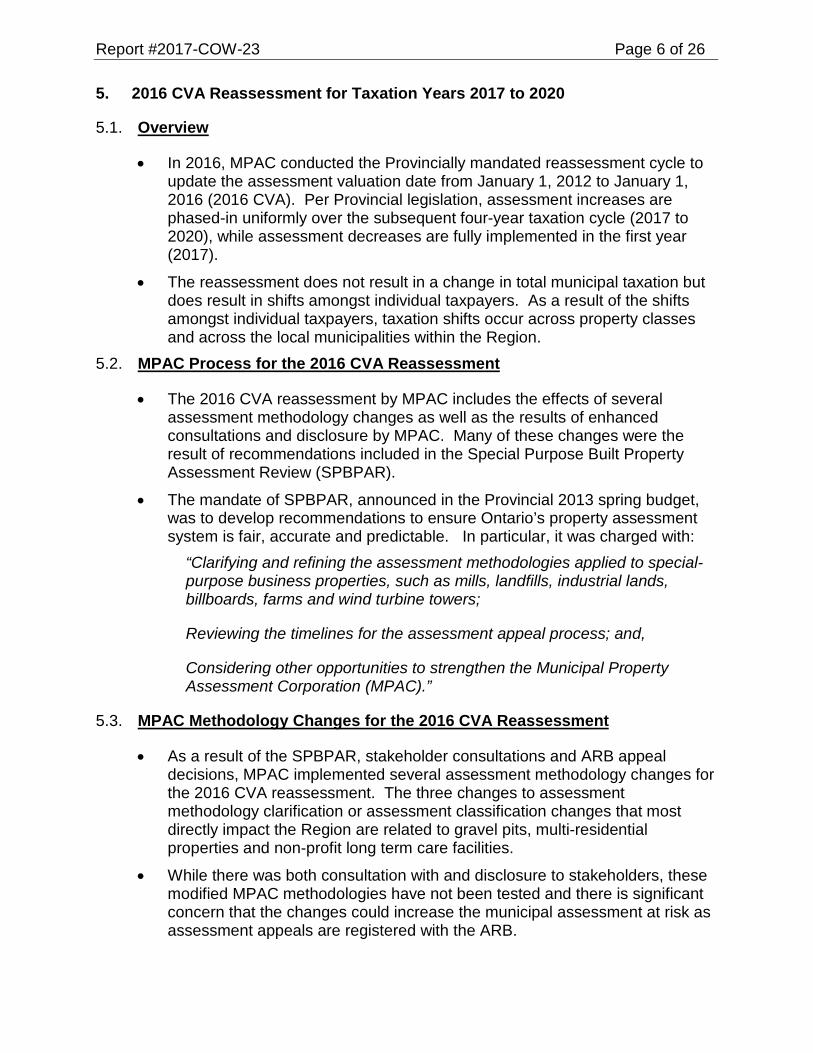
5.3. MPAC Methodology Changes for the 2016 CVA Reassessment
• As a result of the SPBPAR, stakeholder consultations and ARB appeal decisions, MPAC implemented several assessment methodology changes for the 2016 CVA reassessment. The three changes to assessment methodology clarification or assessment classification changes that most directly impact the Region are related to gravel pits, multi-residential properties and non-profit long term care facilities.
• While there was both consultation with and disclosure to stakeholders, these modified MPAC methodologies have not been tested and there is significant concern that the changes could increase the municipal assessment at risk as assessment appeals are registered with the ARB.

Report #2017-COW-23 Page 7 of 26
• Gravel Pits
• Gravel pit properties settled a large Province-wide assessment appeal in 2016 that applies retroactively as far back as 2008. The impact of these settlements was significant for the Township of Uxbridge, one of the largest aggregate producing jurisdictions in the Province, and to a lesser extent, the Region as a whole.
• For the 2016 CVA reassessment, as a result of this settlement and the consultation process, gravel pit land that is classified in the residential class (as required by the Assessment Act) will be valued as the lowest level farmland class. Previously, it was assessed at residential land valuations.
• This change in methodology combined with the valuation update results in these properties experiencing a negative valuation change of approximately (-15 per cent) for the 1st year phase-in (2017).
• Multi-Residential
• For the 2016 CVA reassessment cycle, based on consultations with stakeholders and the approval of the Ministry of Finance, MPAC changed the methodology for valuing multi-residential properties from a “gross income multiplier” methodology to a “direct capitalization” methodology”.
• The gross income multiplier approach utilizes the ratio between the sale prices of comparable properties and the potential gross income at an annual or monthly basis. This methodology was used in the 2012 CVA reassessment.
• The direct capitalization of net operating income approach uses the relationship between the net operating income (NOI) and the sale prices of comparable properties.
• This change in methodology combined with the valuation update results in these properties experiencing an average 11 per cent valuation increase for the 1st year phase-in (2017).
• The Durham Regional Local Housing Corporation (DRLHC) properties are classified as multi-residential and experienced high valuation changes as well, and it is recommended that Regional Council grant the Commissioner of Finance the authority to file Requests for Reconsiderations (RfR) with MPAC on these properties.
• Non-Profit Long Term Care Facilities
• In December, 2015, Ontario Regulation 429/15 exempted from property taxation “non-profit long term care home” under section 3(1)7.2 of the Assessment Act. In Durham Region, two properties are affected by this change resulting in an estimated loss of approximately $83,000 in annual Regional taxation.
Report #2017-COW-23 Page 8 of 26
5.4. 2016 CVA Reassessment Impacts (2017 to 2020) in Durham Region
• The full effects of the 2016 CVA reassessment will be phased in over the 2017 to 2020 taxation years, with assessment decreases being fully implemented in the 1st year of the phase-in (2017), as per Provincial legislation.
• The reassessment does not result in a change in total municipal taxation; although it does result in shifts amongst individual taxpayers. As a result of the shifts amongst individual taxpayers, taxation shifts occur across property classes and across the local municipalities within the Region.
• To ensure the revenue neutrality of the reassessment, the Region will discount its previous year’s tax rate by the Regional taxation average, which is the taxable properties’ valuation changes weighted by the municipal tax ratios. For the 1st year phase-in (2017), the Regional taxation average is 6.8 per cent and for the full reassessment it is estimated to be 29.1 per cent.
• This section provides a summary of the estimated taxation impacts for the 1st year phase-in (2017) and the overall impacts to be fully realized by taxation year 2020. Additional detailed information is provided in Attachment #1.
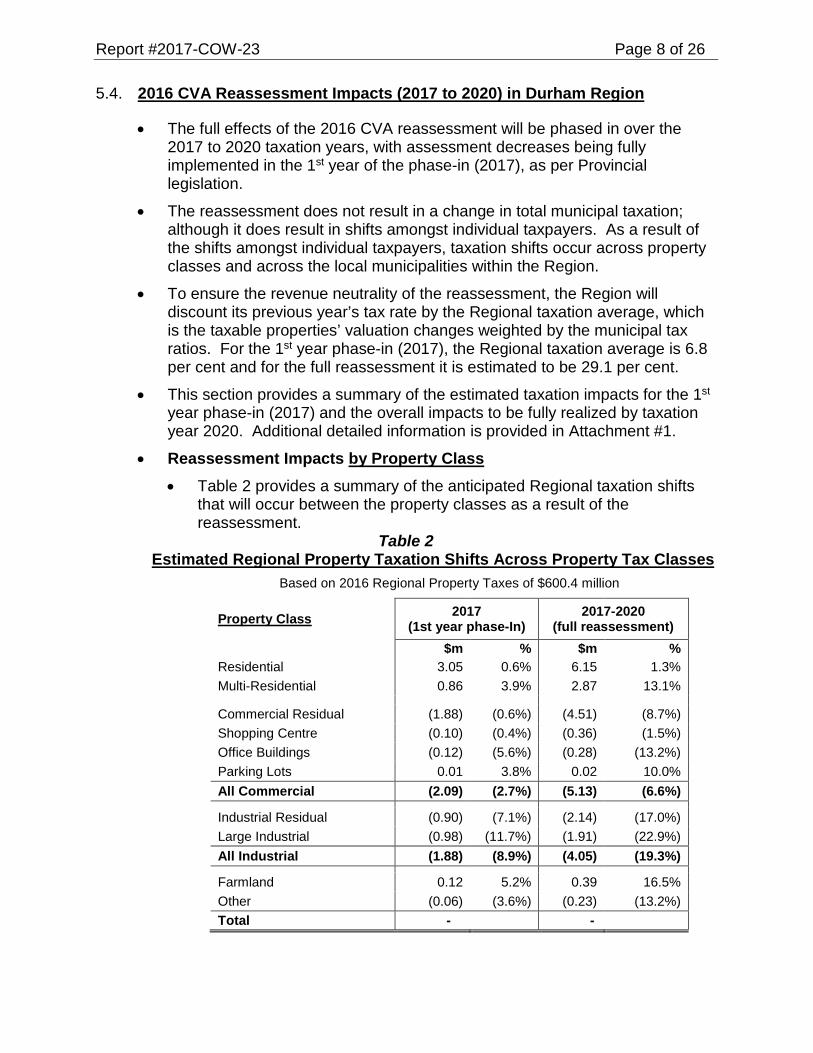
• Reassessment Impacts by Property Class • Table 2 provides a summary of the anticipated Regional taxation shifts
that will occur between the property classes as a result of the reassessment.
Table 2 Estimated Regional Property Taxation
Shifts Across Property Tax Classes
Based on 2016 Regional Property Taxes of $600.4 million
Property Class 2017 (1st year phase-In)
2017-2020 (full reassessment)
$m % $m % Residential 3.05 0.6% 6.15 1.3% Multi-Residential 0.86 3.9% 2.87 13.1%
Commercial Residual (1.88) (0.6%) (4.51) (8.7%) Shopping Centre (0.10) (0.4%) (0.36) (1.5%) Office Buildings (0.12) (5.6%) (0.28) (13.2%) Parking Lots 0.01 3.8% 0.02 10.0% All Commercial (2.09) (2.7%) (5.13) (6.6%)
Industrial Residual (0.90) (7.1%) (2.14) (17.0%) Large Industrial (0.98) (11.7%) (1.91) (22.9%) All Industrial (1.88) (8.9%) (4.05) (19.3%)
Farmland 0.12 5.2% 0.39 16.5% Other (0.06) (3.6%) (0.23) (13.2%) Total - -

Report #2017-COW-23 Page 9 of 26
• The 1st year phase-in (2017) resulted in an average CVA increase for the residential property class of 7.5 per cent and over the four year phase-in program the increase is 30.8 per cent. For the residential class as a whole, the reassessment will result in a 0.6 per cent Regional reassessment related property tax increase in 2017 and 1.3 per cent over the taxation years 2017 to 2020.
• The following section of the report highlights the reassessment impacts on what is commonly considered residential type properties.
• Reassessment Impacts by Residential Property Type • The majority of the unweighted 2016 CVA (92.3 per cent) in the
residential class is comprised of the eight residential property codes shown in Table 3.
Table 3 Reassessment Impacts by Residential Property Type
2017 (1st year phase-in)
2017-2020 (full reassessment)
Type of Residential Property
Est. Number of Properties
2016 CVA $millions
CVA Change
Est. Regional Taxation Impact
CVA Change
Est. Regional Taxation Impact
Single family detached not on waterfront 136,500 65,812 7.9% 1.1% 31.8% 2.1%
Link home 14,300 5,364 8.5% 1.6% 34.1% 3.9% Town or Row house 12,900 4,693 8.4% 1.5% 33.7% 3.6%
Semi-detached residential 12,100 3,926 8.2% 1.3% 32.9% 2.9% Residential Condominium 15,400 3,973 5.8% (0.9%) 23.4% (4.4%) Single family detached on waterfront 1,100 637 3.3% (3.3%) 13.4% (12.1%)
Seasonal/recreational 1st tier on waterfront 400 173 2.0% (4.5%) 9.2% (15.4%)
Seasonal/recreational 2nd tier on waterfront 100 19 4.5% (2.2%) 18.3% (8.4%)
Total Specific Residential Property Types 192,800 84,597 7.9% 1.0% 31.4% 1.8%
Entire Residential Class 207,796 91,680 7.5% 0.6% 30.8% 1.3%
• As shown in Table 3, the residential class is expected to experience, on average, a 1.3 per cent Regional property tax increase due to the full reassessment (phase-in over tax years 2017 to 2020), while the typical residential properties will see, on average, a larger Regional property tax increase as follows:
• Single Family Homes (not on waterfront) 2.1 per cent • Link Homes 3.9 per cent • Town and Row Houses 3.6 per cent • Semi-detached homes 2.9 per cent

Report #2017-COW-23 Page 10 of 26
• Several type of residential properties, on average, will experience a Regional full reassessment property tax decrease including condominiums and various waterfront and seasonal type properties (which experienced higher than average increases in previous reassessments).
• For the Region-wide average home with a 2012 CVA of $366,600, and 2016 Regional property taxes totalling $2,542, it is estimated that: • for the 2017 tax year (1st Year Phase-In), there will be a
reassessment related increase in Regional taxes of 1.1 per cent or approximately $27; and
• for the full reassessment (2017-2020), there will be a cumulative reassessment related increase in Regional taxes of 2.1 per cent or approximately $53 by the fourth and final phase-in year, 2020.
• Reassessment Impacts Wider Range of Changes in 2016 CVA • The use of “averages” in the presentation of the 2016 CVA reassessment
impacts hides an important feature of this reassessment cycle. As shown in the previous two sections, the 2017 (1st year phase-in) Regional reassessment related taxation impact of the residential class (0.6 per cent) does not reflect the impact being felt on the major residential property types (1.1 to 1.6 per cent).
• As well, the average of individual residential property types does not provide any indication as to the range of property tax changes from the reassessment.
• The breadth or range of CVA changes in this reassessment cycle is substantially broader than in previous cycles.
• Reassessment Impacts by Local Municipality • Table 4 provides a summary of the estimated Regional taxation shifts
between local municipalities that occur as a result of the reassessment. Table 4
Estimated Regional Property Tax Shifts by Local Municipality
Based on 2016 Regional Property Taxes of $600.4 million
Local Municipality 2017 (1st year phase-In)
2017-2020 (full reassessment)
$m % $m % Pickering 0.35 0.3% 0.76 0.8% Ajax 0.57 0.5% 1.47 1.4% Whitby 1.19 0.9% 3.35 2.7% Oshawa 0.22 0.2% 1.12 0.9% Clarington (0.55) (0.7%) (2.04) (2.7%) Scugog (0.56) (2.4%) (1.59) (6.7%) Uxbridge (0.86) (3.2%) (2.04) (7.4%) Brock (0.36) (3.4%) (1.03) (9.8%) Total - -

Report #2017-COW-23 Page 11 of 26
6. Assessment at Risk
6.1. A significant backlog of assessment appeals exists at the Assessment Review Board (ARB) where the backlog of Durham properties from taxation years 2006 to 2016 includes properties with a total of $12.6 billion assessment representing $139.9 million in Regional taxation.
6.2. Of these outstanding ARB appeals, it is estimated, in the medium risk scenario, that the forecasted loss of assessment could be $1.8 billion and the loss of Regional taxation would be $21.5 million.
6.3. The spike in the non-residential valuations in the 2008 CVA reassessment, combined with the general economic downturn, resulted in many large commercial and industrial firms with substantial land holdings launching Province-wide appeals and seeking material CVA reductions that impact multiple municipal jurisdictions. Many of these appeals, which focus on MPAC’s non-residential assessment methodology and factors related to specific property types, have been successful and have set precedents with respect to the remaining outstanding appeals that the ARB has yet to hear.
6.4. With 2016 being the final phase-in year of the 2012 CVA reassessment cycle, the ARB pushed to decide as many of the outstanding appeals as possible before the next reassessment phase-in was implemented in 2017. Significant progress in dealing with the backlog was made in 2016, however there still remains material Regional taxation revenue risk as the appeals remaining represent some of the most complex and represent a relatively higher degree of risk.
6.5. Below is a summary of some of the major appeal settlements that occurred in Durham Region in 2016:
• Gravel pit properties reached a settlement that resulted in an average assessment reduction of over 50 per cent and resulted in significant property tax refunds by the Region and the Township of Uxbridge. Further, this settlement results in a drag on 2017 assessment growth used for budgetary purposes for both the Region and the Township of Uxbridge. This result was anticipated in the Region’s 2015 risk analysis and a provision for an assessment base adjustment was included in the Region’s 2016 property tax budgets to mitigate this drag on future budgetary growth.
• Several of the appeals in the large retail sector were decided which resulted in a wide variety of assessment decreases. However, the average losses on these particular properties was less than what was estimated by the Region and MPAC in the 2016 taxation strategy.
• Several properties in the automotive sector had appeal settlements that were less than anticipated in the 2015 risk analysis. However, the majority of appealed assessment in Durham Region for this industry has not yet been formally settled.
Report #2017-COW-23 Page 12 of 26
• A higher number of no value change settlements occurred on the smaller non-industry specific appeals than was anticipated in the 2015 risk analysis.
6.6. Although a significant amount of the ARB backlog was dealt with in 2016, there remains major property assessment appeals in the auto and large retail sectors, dating back to the 2008 tax year in Durham Region, that continue to represent significant risk to the Region of Durham and its local municipalities.
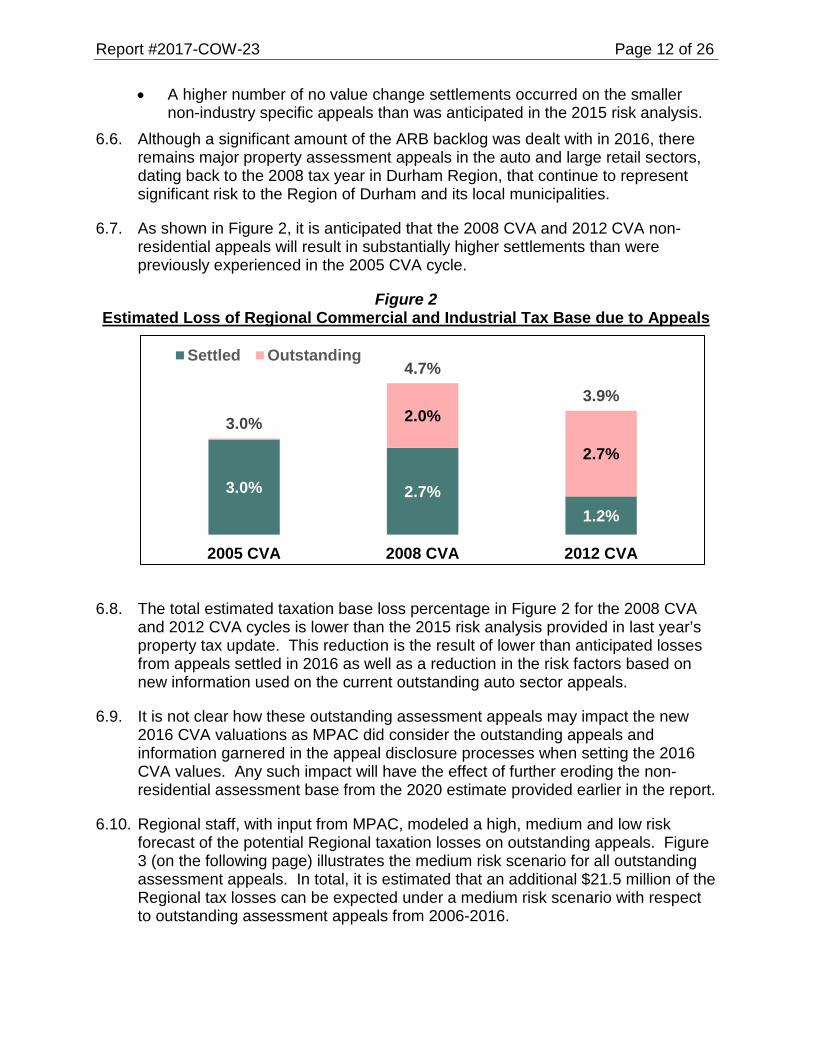
6.7. As shown in Figure 2, it is anticipated that the 2008 CVA and 2012 CVA non-residential appeals will result in substantially higher settlements than were previously experienced in the 2005 CVA cycle.
Figure 2 Estimated Loss of Regional Commercial and Industrial Tax Base due to Appeals
6.8. The total estimated taxation base loss percentage in Figure 2 for the 2008 CVA and 2012 CVA cycles is lower than the 2015 risk analysis provided in last year’s property tax update. This reduction is the result of lower than anticipated losses from appeals settled in 2016 as well as a reduction in the risk factors based on new information used on the current outstanding auto sector appeals.
6.9. It is not clear how these outstanding assessment appeals may impact the new 2016 CVA valuations as MPAC did consider the outstanding appeals and information garnered in the appeal disclosure processes when setting the 2016 CVA values. Any such impact will have the effect of further eroding the non-residential assessment base from the 2020 estimate provided earlier in the report.
6.10. Regional staff, with input from MPAC, modeled a high, medium and low risk forecast of the potential Regional taxation losses on outstanding appeals. Figure 3 (on the following page) illustrates the medium risk scenario for all outstanding assessment appeals. In total, it is estimated that an additional $21.5 million of the Regional tax losses can be expected under a medium risk scenario with respect to outstanding assessment appeals from 2006-2016.
3.0% 2.7%1.2%
2.0%
2.7%
3.0%
4.7%3.9%
2005 CVA 2008 CVA 2012 CVA
Settled Outstanding

Report #2017-COW-23 Page 13 of 26
Figure 3 Forecast of Regional Taxation Losses on Outstanding Appeal
(Medium Risk Scenario)
6.11. A high risk scenario projects Regional taxation losses of $25.5 million (19 per cent higher than the medium scenario).
6.12. Attachment #2 provides additional background information on the Region’s current challenge in managing the risk associated with assessment base appeals due to a lack of legislative authority.
7. New Provincial Reviews Initiated
7.1. Two major reviews by the Province will occur in 2017 that have the potential to significantly affect Durham in the 2018 property tax year and beyond.
• Railway Linear Properties (Right of Ways) Provincial Review • The Province is currently reviewing the rate and process of Linear
Railway payments in consultation with both municipal and industry stakeholders. Currently the rate is based on a set amount determined by geographical area ($601 per acre in Durham Region) and in 2015 this yielded approximately $0.7 million in Regional revenues.
• In previous property tax strategy reports, Regional Council has recommended the Province increase the $601 per acre value set in 1998 by an annual inflationary adjustment and, further, that an annual increase be enshrined in legislation/regulation.
• While Regional staff participated in the municipal working group with the Province, the review is in its early stages and it is too soon to assess potential outcomes and impacts on the Region of Durham.
$2.2 $2.0 $2.1 $2.1 $2.3
$3.2$3.6
$3.90.45%0.40% 0.40% 0.39% 0.40%
0.55%0.60%
0.64%
0.00%
0.10%
0.20%
0.30%
0.40%
0.50%
0.60%
0.70%
-
0.50
1.00
1.50
2.00
2.50
3.00
3.50
4.00
4.5020
06
2007
2008
2009
2010
2011
2012
2013
2014
2015
2016
Forecast of Regional Tax Losses ($m)Share of Total Regional Taxes
2005CVA Total $0.1
2005 CVA 2008 CVA 2012 CVA
Tax
Year
Report #2017-COW-23 Page 14 of 26
• This report recommends a similar review for the other three statutory rates that impact Durham Region: heads and beds, hydro linear properties and the set assessment on nuclear generation.
• Multi-Residential Provincial Review • Once the effects of both the 2016 CVA reassessment and methodology
changes for the multi-residential class became apparent (substantial increases across the Province), the Province announced a review of multi-residential municipal taxation in the 2016 Ontario Economic Outlook and Fiscal Review (November 2016). It is believed that this review will begin in early 2017 and Finance staff from the Region have been asked to participate in this review.
• As part of the 2016 Ontario Economic Outlook and Fiscal Review, the Province instituted a freeze on total municipal taxation at 2016 levels (plus growth) for the multi-residential class as a whole in municipalities with a taxation ratio above two (2.0).
• It is anticipated that this restriction will apply to over a hundred municipalities including: Toronto, Halton Region, Hamilton, Kingston, Niagara Region, Guelph, Northumberland County and Windsor. This freeze will result in a forced reduction of the 2017 multi-residential municipal tax ratios for these jurisdictions.
• This restriction will NOT apply to the Region of Durham for the 2017 taxation year as its current multi-residential municipal tax ratio is below two (2.0) at 1.8665. Durham’s initial 1998 municipal tax ratio was 2.7, however, through years 2000 to 2006, it was reduced by over 30 per cent as part of the Long-Term Property Taxation Strategy.
8. Provincial Legislative Changes
8.1. In 2016, a technical adjustment to the notional property tax rate calculation was announced in the Ontario Budget. This adjustment allows the Province or municipalities to adjust the year-end assessment used in its property tax rate calculation to offset changes resulting from certain assessment changes, including assessment appeals and Requests for Reconsideration (RfR).
8.2. In a two tiered municipal structure, the authority to make this adjustment resides with the upper tier and requires a Council resolution and by-law similar to other tax policy decisions such as municipal taxation ratios and the annual Capping Program parameters.
8.3. With the concurrence of all eight local municipal treasurers, it was decided not to utilize this assessment adjustment in 2017 as the impact on the budgetary tax increase and the notional tax rates is minimal across the Region.
Report #2017-COW-23 Page 15 of 26
8.4. Late in 2015, the Province formed a stakeholder reference group of municipal and business representations to review the current mandated Provincial Business Protection program (Capping) and the commercial/industrial vacancy subclasses and vacant unit rebates. Region of Durham Finance staff have participated in these stakeholder meetings since their inception.
8.5. Changes to the Mandated Provincial Business Protection Program (Capping)
• For the 2016 taxation year, the Province provided additional options to advance the progress of protected properties to full CVA taxation based on the input of the stakeholder reference group. The Region of Durham, with the concurrence of the local municipal treasurers, took advantage of this new flexibility and choose the options that would expedite the exit from this outdated and inequitable program.
• In the 2016 Ontario Economic Outlook and Fiscal Review (November 2016), the Province announced additional municipal flexibility in setting the parameters of the mandated Capping program as shown in the following quote:
“The Business Property Tax Capping Program, introduced in 1998 to assist with the transition to current value assessment (CVA), has resulted in continued inequities for some properties. In response to municipal and business stakeholder input, successive enhancements have provided municipalities with increased program flexibility. To further enhance fairness and transparency for property owners, the government will provide municipalities with additional flexibility to increase equity between properties. Beginning in 2017, eligibility criteria to allow municipalities to phase out the capping program will be broadened and municipalities will have the option to limit the capping program to reassessment‐related changes prior to 2017.”
• Although the additional flexibility is welcomed by the municipal sector, in the case of Durham Region, initial analysis indicates that this flexibility will have minimal impact on the estimated timeline for exiting this program.
• It is recommended that Durham Region continue in 2017 to choose the maximum options available to expedite its exit from the Capping program. An update report recommending the specific options and the results of the 2017 Capping program will be provided to Regional Council in June 2017.
8.6. Commercial and Industrial Vacant/Excess Land Subclasses and Vacant Unit Rebates
• In the 2016, the Province announced additional municipal flexibility with respect to the non-residential vacant/excess land subclasses and the vacant unit rebate programs:
Report #2017-COW-23 Page 16 of 26
“The Province has reviewed the business Vacant Unit Rebate and Vacant/Excess Land Subclasses in consultation with municipal and business stakeholders. The review was initiated in response to stakeholders' concerns regarding the appropriateness of the lower tax level provided through these programs and any unintended implications this may have for local economies. The 2016 Budget announced a legislative framework to facilitate increased municipal flexibility for these programs. In response to municipal requests, the Province is now moving forward with changes that will enable municipalities to better tailor the programs to reflect community needs and circumstances, while considering the interests of local businesses.”
• Subsequent meetings and discussions with the Province have indicated that municipalities will be provided with full flexibility to enhance or eliminate the ratio discount provided to vacant/excess land subclasses and/or the vacant unit rebate programs. Municipalities are required to consult with the business community before advising the Province of any changes to these programs. Proposed changes will be reviewed by the Province who will enshrine the individual municipal program in legislation.
• The Provincial representatives and the business community members of the stakeholder group also emphasized the need for any new program to be as consistent as possible across multi-municipal jurisdictions.
• The timing of the Provincial announcement (November 2016) has not provided sufficient opportunity to review the impacts of any changes or consultation with Durham’s business community. Consequently, this report recommends further analysis be undertaken but makes no specific recommendations with respect to this new municipal flexibility.
• It is recommended that Regional Finance staff undertake a review and analysis of the various options for the vacant/excess land subclass ratio discounts and vacant unit rebate, discuss with the local treasurers, consult with the local business community, and report back to Council in advance of the 2018 tax year.
• Attachment #3 provides additional information on the vacant/excess land subclasses and vacant unit rebate programs.
8.7. Tax Sale Process and Property Tax Collection and Administrative Changes
• In 2016, the Province completed its review of the Municipal Act and included changes to the Act in Provincial Bill 68 Modernizing Ontario’s Municipal Legislation Act, 2016, which reached 2nd reading on December 6, 2016.
• Included in Bill 68 are changes related to tax collection and administration. The majority of these changes impact the local municipalities as opposed to the Region.
Report #2017-COW-23 Page 17 of 26
• The following is a summary of the key changes in Bill 68:
• Reduction in the time that property has to be in property tax arrears before a municipality can begin the tax sale process (from three years to two years).
• Removal of the requirement for municipal councils to pass a by-law to authorize individual extension agreements.
• Explicit authority to permit municipalities to issue electronic property tax bills.
• Clarify that municipalities can apply tax refunds to outstanding tax liabilities.
• Permit the municipal treasurer to make municipal application for property tax reductions due to gross or manifest errors (without seeking the approval of the property owner).
• Although some of these changes are significant, the property tax collection and administrative authority and responsibilities reside with the local municipalities.
9. Other Recommended Provincial Changes
9.1. Provincial Statutory Rates
• The Province currently bases municipal payments for hospitals and post-secondary education institutions (Heads & Beds – last updated 1987), hydro and rail right-of ways (Linears – last updated 1998) and nuclear generating facilities (last updated 1968) on statutory rates rather than CVA.
• The use of Provincial statutory rates is an inequitable aspect of the current policy regime and continues to represent a financial challenge to the Region, given that the rates are not adjusted to take into account either the increased costs of providing Regional services or the time value of money. Regional Council has consistently requested that the Province update the statutory rates for the nuclear plants, hospitals and post-secondary education institutions and linears.
• In 2016, the Province began stakeholder consultations on the railway linears. It is too early in this consultation process to reasonably assess possible changes to this municipal revenue source.
• This report therefore recommends:
• the Province, in consultation with the municipal sector, review and update the four statutory rates identified above and institute a process by which these rates are automatically updated in the future; and
• a stakeholder review of the other three Provincial statutory rates be initiated similar to the current Railway Linear review and, that the
Report #2017-COW-23 Page 18 of 26
Province ensure that all reviews do not result in any decreases in the inflation adjusted municipal revenues within Durham Region.
• An additional issue related to the nuclear generating facilities’ proxy property taxes for the payment of stranded debt:
• Proxy property taxes are paid to the Ontario Electricity Financial Corporation (OEFC) and applied against the former Ontario Hydro stranded debt. It is understood that proxy property taxes are the difference between the statutory rate for prescribed buildings and what would apply if taxed at CVA.
• 2015/16 changes to the Electricity Act resulted in changes to the Province’s reporting requirements and recognition of the stranded debt. The Association of Municipalities of Ontario has noted the lack of clarity around the future redirection of payment-in-lieus (PILs) following the retirement of the stranded debt.
• Regional staff continues to seek clarity on this issue and this report recommends these proxy property taxes payments be redirected to the host municipalities and the Region.
• See Attachment #4 for more detailed information on Provincial Statutory Rates.
9.2. Municipal Capital Facilities
• Section 110 of the Municipal Act, 2001 provides the legislative authority for a municipality to enter into an agreement with any person for the provision of municipal capital facilities. Section 110 (6) of the Municipal Act, 2001 permits a lower or upper tier municipality within a two tiered municipal structure to designate a property as a municipal capital facility and effectively erode the tax base of the other municipal tier, without requiring that tier’s consent.
• The existing tax exemption provisions pose significant long-term financial risks to the Region. While lower tier municipalities can control the extent by which they grant such tax provisions, the cumulative impact across a two tiered municipal structure can lead to the affected upper tier being impacted more significantly than was anticipated by any one lower tier municipality.
• It is recommended that the current legislation be amended so as to require each tier of municipal government to directly consider such requests, similar to the current property tax exemption legislation for Veterans’ Associations and Heritage properties.
• Further, it is also suggested that any local municipality in the Region seeking to designate a municipal capital facility and provide a reduction or exemption for Regional taxation be respectfully requested to obtain the concurrence and consent of Regional Council, similar to the Regional consultation process with the local municipalities under affordable housing initiatives.
• See Attachment #5 for additional information on municipal capital facilities.
Report #2017-COW-23 Page 19 of 26
10. Durham Region Residential Sector Analysis
10.1. More information on the assessment and taxation of Durham’s residential (includes multi-residential) sector is included in Attachment #6.
10.2. 2016 Assessment and Taxation of Durham’s Residential Sector
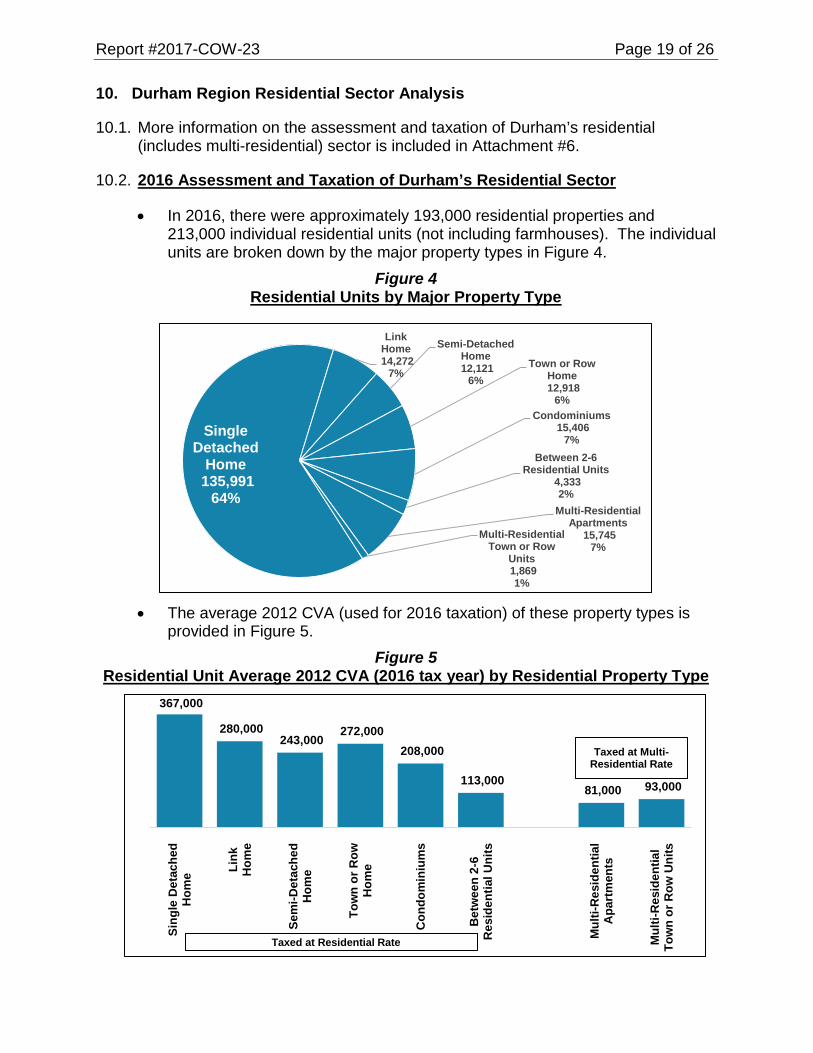
• In 2016, there were approximately 193,000 residential properties and 213,000 individual residential units (not including farmhouses). The individual units are broken down by the major property types in Figure 4.
Figure 4 Residential Units by Major Property Type
• The average 2012 CVA (used for 2016 taxation) of these property types is provided in Figure 5.
Figure 5 Residential Unit Average 2012 CVA (2016 tax year) by Residential Property Type
367,000
280,000 243,000
272,000 208,000
113,000 81,000 93,000
Sing
le D
etac
hed
Hom
e Link
Hom
e
Sem
i-Det
ache
dH
ome
Tow
n or
Row
Hom
e
Con
dom
iniu
ms
Bet
wee
n 2-
6R
esid
entia
l Uni
ts
Mul
ti-R
esid
entia
lA
part
men
ts
Mul
ti-R
esid
entia
lTo
wn
or R
ow U
nits
Taxed at Residential Rate
Taxed at Multi-Residential Rate
Single Detached
Home135,991
64%
LinkHome14,272
7%
Semi-DetachedHome12,121
6%Town or Row
Home12,918
6%Condominiums
15,406 7%
Between 2-6Residential Units
4,333 2%
Multi-ResidentialApartments
15,745 7%
Multi-ResidentialTown or Row
Units1,869 1%
Report #2017-COW-23 Page 20 of 26
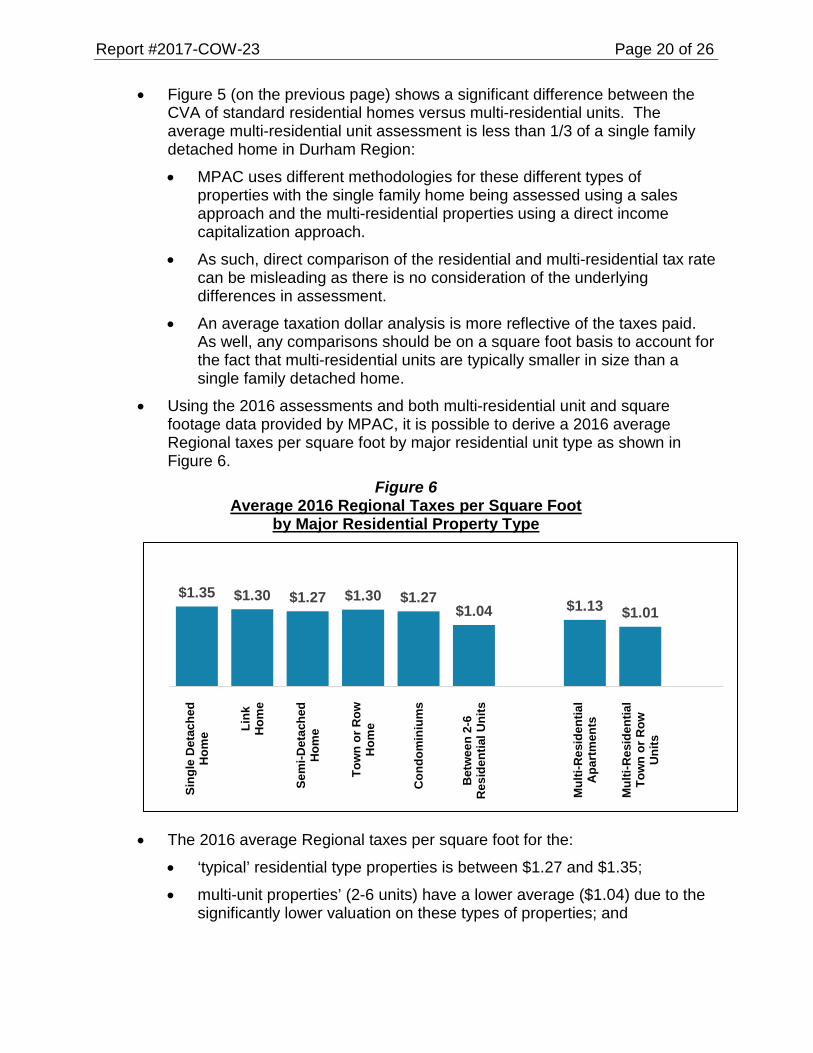
• Figure 5 (on the previous page) shows a significant difference between the CVA of standard residential homes versus multi-residential units. The average multi-residential unit assessment is less than 1/3 of a single family detached home in Durham Region:
• MPAC uses different methodologies for these different types of properties with the single family home being assessed using a sales approach and the multi-residential properties using a direct income capitalization approach.
• As such, direct comparison of the residential and multi-residential tax rate can be misleading as there is no consideration of the underlying differences in assessment.
• An average taxation dollar analysis is more reflective of the taxes paid. As well, any comparisons should be on a square foot basis to account for the fact that multi-residential units are typically smaller in size than a single family detached home.
• Using the 2016 assessments and both multi-residential unit and square footage data provided by MPAC, it is possible to derive a 2016 average Regional taxes per square foot by major residential unit type as shown in Figure 6.
Figure 6 Average 2016 Regional Taxes per Square Foot
by Major Residential Property Type
• The 2016 average Regional taxes per square foot for the:
• ‘typical’ residential type properties is between $1.27 and $1.35;
• multi-unit properties’ (2-6 units) have a lower average ($1.04) due to the significantly lower valuation on these types of properties; and
$1.35 $1.30 $1.27 $1.30 $1.27 $1.04 $1.13 $1.01
Sing
le D
etac
hed
Hom
e Link
Hom
e
Sem
i-Det
ache
dH
ome
Tow
n or
Row
Hom
e
Con
dom
iniu
ms
Bet
wee
n 2-
6R
esid
entia
l Uni
ts
Mul
ti-R
esid
entia
lA
part
men
ts
Mul
ti-R
esid
entia
lTo
wn
or R
owU
nits

Report #2017-COW-23 Page 21 of 26
• multi-residential unit is approximately 15 per cent lower than other residential type units with the weighted average of all multi-residential units being $1.11.
• Impact of the 2016 CVA reassessment on Estimated Regional Taxes
• Table 5 shows the 2016 CVA reassessment valuation changes (2017) and their estimated impacts on the 2016 estimated Regional taxes per square foot of the previous section.
Table 5 2016 and 2017 Estimated Regional Taxes per Square Foot
By Major Residential Property Type
Type of Residential Property 2016 Est. Regional
Taxes per ft2
Est. 2017 Reassessment Regional
Taxation Impact
2017 Est. Regional
Taxes per ft2 Single Family Detached Home $1.35 1.06% $1.36 Link Home $1.30 1.61% $1.32 Freehold Town or Row Home $1.30 1.52% $1.32 Semi-detached Residential $1.27 1.33% $1.29 Residential Condominium $1.27 (0.92%) $1.26 Multi-Residential $1.11 3.95% $1.16
• Although the average multi-residential unit is anticipated to have an almost 4 per cent average Regional taxation increase in 2017 due to the reassessment phase-in, its anticipated 2017 taxation is still a minimum of 10 per cent below the other residential property types and almost 20 per cent below the single family detached home.
10.3. Impact of Lowering 2016 Multi-Residential Municipal Taxation Ratio
• Figure 7 provides a 2016 overview of the number of multi-residential units within each local municipality.
Figure 7 Multi-Residential Units by Local Municipality
Pickering700 4%
Ajax2,228 13%Whitby
3,378 19%
Oshawa9,750 55%
Clarington793 5%
Scugog194 1%
Uxbridge333 2%
Brock238 1%

Report #2017-COW-23 Page 22 of 26
• A lowering of the multi-residential municipal tax ratio from 1.8665 to the residential ratio of 1.0, would result in a decrease of 46 per cent in municipal taxation on multi-residential properties which would decrease the average 2016 Regional taxes per square foot to $0.60 (from $1.11). This is substantially less than all other residential type properties in this analysis and represents only 44 per cent of $1.35 currently paid by the average single family detached home per square foot.
• In addition, a lowering of the multi-residential municipal ratio to 1.0 would have the following impacts (based on 2016 taxation);
• an average increase in Regional taxation;
• on the Region-wide average home of 1.63 per cent or $41; and
• an increase on all other property classifications of 1.63 per cent.
• an average increase in Local taxation;
• on the Region-wide average home of $31 or 0.39 percent which will vary significantly by local municipality;
• an increase in Oshawa local municipal taxes of over 4 per cent or $101 (approximately 2.5 times the Region-wide average impact due to its higher concentration of multi-residential), and
• very little increase in the northern municipalities which have proportionately lower multi-residential assessment.
• Combined, the Regional and Local municipal taxes would rise on average by;
• $72 or 1.5 per cent on the Region-wide average home; and
• $146 or 2.6 per cent on the Region-wide average home located in Oshawa due to the significantly higher impact of the ratio reduction on Oshawa local levy.
10.4. Beneficiaries of the Property Taxation Decreases from Multi-Residential Ratio Reductions
• An important consideration with respect to this Provincial review is who should be the primarily beneficiary of any municipal taxation reductions due to lowering of the multi-residential municipal ratio.
• In general, property taxation reductions flow to the owners of property (landlords). However, based on the Provincial statements in its 2016 Economic Outlook, the Province’s main concern is rental affordability for lower income tenants.
• There are current provisions in Provincial legislation that dictate when landlords are required to flow property rent reductions to tenants and these provisions must also be considered in any Provincial review of multi-residential property taxation policy.

Report #2017-COW-23 Page 23 of 26 Revised
11. Low Income Seniors and Individuals with Disabilities Property Tax Deferral
and Rebate Programs
11.1. At the September 7, 2016 Regional Council meeting, the notice of motion adopted by the City of Pickering Council on June 27, 2016 requesting the Region of Durham review and amend the current Provincially mandated Region-wide reassessment related increase deferral program for eligible low income seniors and individuals with disabilities was referred to staff.
11.2. The City of Pickering notice of motion requested that “Durham Region review and amend the eligibility criteria set out in Report #98-F-57”. This report enabled the implementation of a Region-wide reassessment related deferral program for eligible low income seniors and individuals with disabilities which came into force with Regional by-law 68-98.
• In 1998, the Province mandated that upper and single tier municipalities adopt a program that allows eligible property owners to defer annual reassessment related property taxation increases greater than $100 at zero per cent interest (amended in by-law 48-2001) until such time as the property is sold.
• This Region-wide program is administered by the local municipalities and the enrollment in this program across the Region is extremely low.
11.3. In addition to this existing Region-wide program, there are three local property tax rebate programs for low income seniors and individuals with disabilities in Durham Region. The Oshawa program provides a rebate to eligible households of $522 while the Whitby program is $300 and Brock’s program is $250. These rebates are entirely funded by the individual local municipalities.
11.4. In response to Regional Council’s referral of the City of Pickering request, amendments to this existing Region-wide program were discussed at several meetings of Regional and local municipal finance staff and it was agreed that changes to the Region-wide program are not advisable unless all local municipalities institute similar low income property tax grant programs.
11.5. The June 2016 City of Pickering resolution also directed Pickering Finance staff to prepare guidelines for the implementation of a similar local rebate program.
11.6. Regional Council has directed that Durham Region’s property tax policies should, as much as possible, treat similar properties across the Region in a similar fashion.
• It would not be equitable to provide a Regional property tax rebate to low income seniors in three local municipalities only as the other local municipalities do not provide a rebate program.
• As such, since these tax rebate programs exist in a limited number of local municipalities, Regional Council in the past has declined local municipal requests to match their existing programs with Regional funds.

Report #2017-COW-23 Page 24 of 26
12. Property Tax Comparisons
12.1. Tax rates are only one factor in the calculation of property taxes (Tax $ = Property Tax Rate X Property CVA). Direct comparisons of property tax rates are often made and lead to erroneous conclusions with respect to ‘high’ or ‘low’ tax jurisdictions.
12.2. Any comparison that does not consider the varying market value assessments (CVA) within each jurisdiction is meaningless. Further, taxation levels are impacted by different municipal services and service levels, as well as the non-residential share of the individual jurisdiction’s assessment base.
12.3. Residential Home Comparison
• In an effort to reflect the significant impact that market values (assessment) have on property tax rates, Regional staff requested that MPAC provide the assessments for four Durham homes if they were located in other similar municipal jurisdictions. This facilitates a more appropriate comparison based on the estimated property tax dollars on identical homes in different jurisdictions, rather than tax rates which are inversely related to the assessment (the higher the assessment, the lower the property tax rate required to raise a dollar in property taxes).
• The summary of the residential home comparison is shown in Figure 8 and illustrates that while the comparable municipalities’ average residential tax rate was 26 per cent lower than Durham’s, the assessment values were 35 percent higher.
Figure 8 Residential Home Sample: Tax Rate, Assessment and Taxation Dollars
• The resultant average property tax difference for this four home sample is relatively minor between Durham and the comparator municipalities.
100 100 10074
135
100
Tax Rate Assessment TaxesX =
Dur
ham
Av
erag
e
Dur
ham
Av
erag
e
Dur
ham
Av
erag
e
Com
para
ble
Mun
icip
aliti
es
Com
para
ble
Mun
icip
aliti
es
Com
para
ble
Mun
icip
aliti
es
Report #2017-COW-23 Page 25 of 26
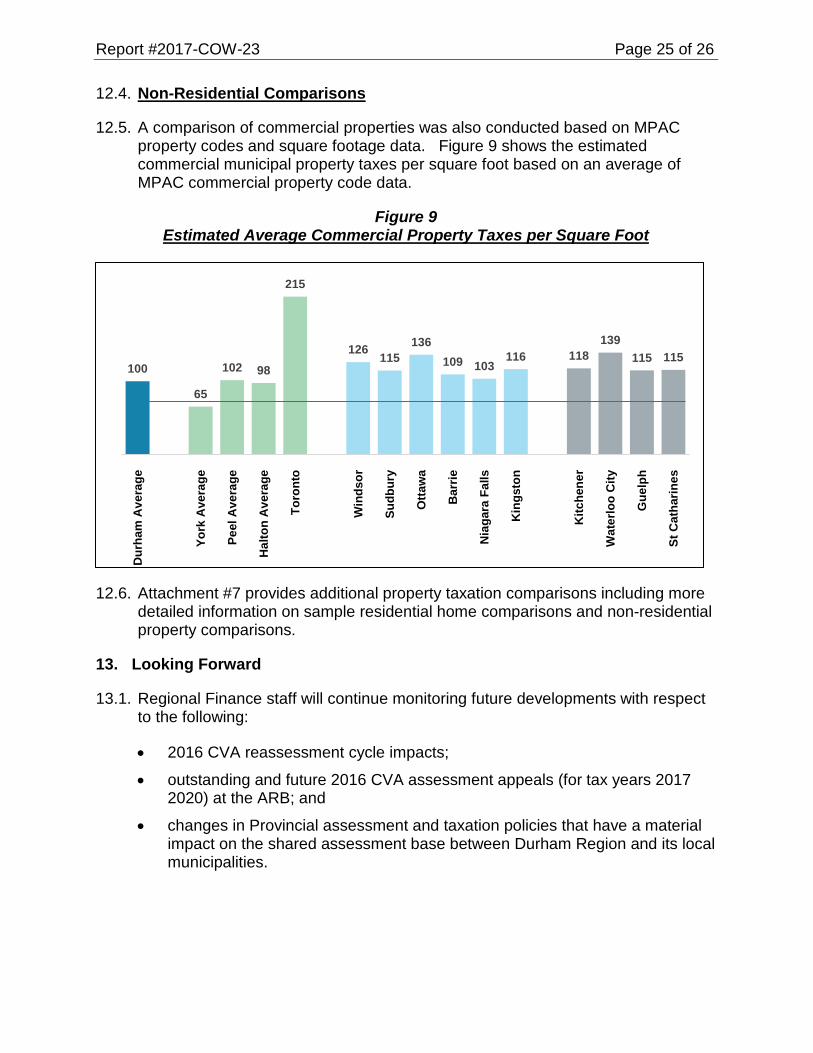
12.4. Non-Residential Comparisons
12.5. A comparison of commercial properties was also conducted based on MPAC property codes and square footage data. Figure 9 shows the estimated commercial municipal property taxes per square foot based on an average of MPAC commercial property code data.
Figure 9 Estimated Average Commercial Property Taxes per Square Foot
100
65
102 98
215
126115
136109 103
116 118139
115 115
Dur
ham
Ave
rage
York
Ave
rage
Peel
Ave
rage
Hal
ton
Ave
rage
Toro
nto
Win
dsor
Sudb
ury
Otta
wa
Bar
rie
Nia
gara
Fal
ls
Kin
gsto
n
Kitc
hene
r
Wat
erlo
o C
ity
Gue
lph
St C
atha
rines
12.6. Attachment #7 provides additional property taxation comparisons including more detailed information on sample residential home comparisons and non-residential property comparisons.
13. Looking Forward
13.1. Regional Finance staff will continue monitoring future developments with respect to the following:
• 2016 CVA reassessment cycle impacts;
• outstanding and future 2016 CVA assessment appeals (for tax years 2017 2020) at the ARB; and
• changes in Provincial assessment and taxation policies that have a material impact on the shared assessment base between Durham Region and its local municipalities.

Report #2017-COW-23 Page 26 of 26
13.2. Regional Finance staff will continue to participate, as a member of the municipal stakeholder reference group in the following Provincial reviews:
• multi-residential municipal property taxation review;
• non-residential vacancy subclass discounts and vacant unit rebate review;
• railway linear review; and
• the mandated Provincial Business Protection program (Capping) review. 13.3. Regional staff will continue to meet with local treasurers and seek the input of the
local business community with respect to potential changes to the non-residential vacant/excess land subclass ratio discounts and the vacant unit rebate program.
Original signed by
R.J. Clapp, CPA, CA Commissioner of Finance Recommended for Presentation to Committee
Original signed by
G.H. Cubitt, MSW Chief Administrative Officer Attachment #1: 2016 CVA Reassessment Impacts for Taxation Years 2017-2020 Attachment #2: Regional Role in Assessment Based Appeals Attachment #3: Non-Residential Vacant/Excess Land Subclass Ratio Discounts
and Vacant Unit Rebate Program Attachment #4: Provincial Statutory Rates Attachment #5: Municipal Capital Facilities Attachment #6: Residential and Multi-Residential Sector Assessment and Taxation Attachment #7: Property Tax Comparisons
Attachment #1 2016 CVA Reassessment Impacts for Taxation Years 2017-2020 Page 1 of 11
Attachment #1 2016 CVA Reassessment for Tax Years 2017-2020
Introduction In 2007, the Ontario Government implemented changes to both assessment and property taxation policies. The changes to assessment policy include: Implementation of a four-year reassessment cycle commencing in 2008, with the
following reassessment cycles.
Cycle Valuation Date Taxation Years
2008 CVA January 1st, 2008 2009 to 2012
2012 CVA January 1st, 2012 2013 to 2016
2016 CVA January 1st, 2016 2017 to 2020
An even four-year phase-in of assessment increases; and, Requiring assessment decreases to be fully implemented in the first year of the
cycle and not phased over four years as the assessment increases are. The 2016 CVA reassessment will be similarly phased in over four taxation years between 2017 and 2020. This appendix focuses on the full four year cumulative impacts of the 2016 CVA cycle as well as the 1st year phase-in (2017) reassessment impacts. The 2017 impacts are front-end loaded into the 1st year phase-in as all the assessment decreases are fully implemented in the 1st year. Presentations on the preliminary full 2016 CVA reassessment cycle impacts were provided to the Regional Committee of the Whole on June 21, 2016 (residential) and November 2, 2016 based on notice data provided by MPAC. This report provides updated analysis based in the 2017 MPAC Returned Assessment Roll. These final reassessment impacts are very similar to the impacts provided in the previous presentations to the Committee of the Whole. Reassessments are revenue neutral to municipalities. Although the reassessment results in no municipal tax loss or gain, the reassessment still results in taxation shifts amongst individual taxpayers and, as a result, tax shifts across classes and local municipalities (in a two tiered municipal structure).

Attachment #1 2016 CVA Reassessment Impacts for Taxation Years 2017-2020 Page 2 of 11
Reassessment by Property Tax Class
Full Reassessment CVA Changes (Phase-In 2017-2020) by Property Tax Class Figure 10 provides the average percentage change by major taxable property class for the full 2016 CVA reassessment in Durham Region. These assessment changes are phased in over the taxation years 2017 to 2020.
Figure 10 Average Change from 2012 CVA to 2016 CVA by Property Class
(phased in over 2017 to 2020 taxation years)
The full reassessment average CVA change for all taxable properties in Durham Region is 30.1 per cent and ranges from an average decrease of -0.4 per cent for the large industrial class to an increase of 50.5 per cent for farmland. The Regional taxation average (amount by which previous tax rates are discounted to ensure revenue neutrality) for the full 2016 CVA reassessment is 29.1%. Since different property classes have different tax rates (based on the municipal tax ratios) and the taxation average is used to calculate the property tax impacts of the reassessment, the taxation average must be the weighted (by ratios) valuation changes of the individual properties. The full reassessment average CVA change of 30.1 per cent is reduced to 29.1 per cent when the municipal tax ratios are considered.
30.8%
46.1%
17.9%
27.2%Regional Taxation Average
29.1%
12.1%
41.9%
20.6%
7.2%
-0.4%
4.2%
50.5%
30.1%
Commercial IndustrialTaxable Properties based on
MPAC Returned Roll
Attachment #1 2016 CVA Reassessment Impacts for Taxation Years 2017-2020 Page 3 of 11
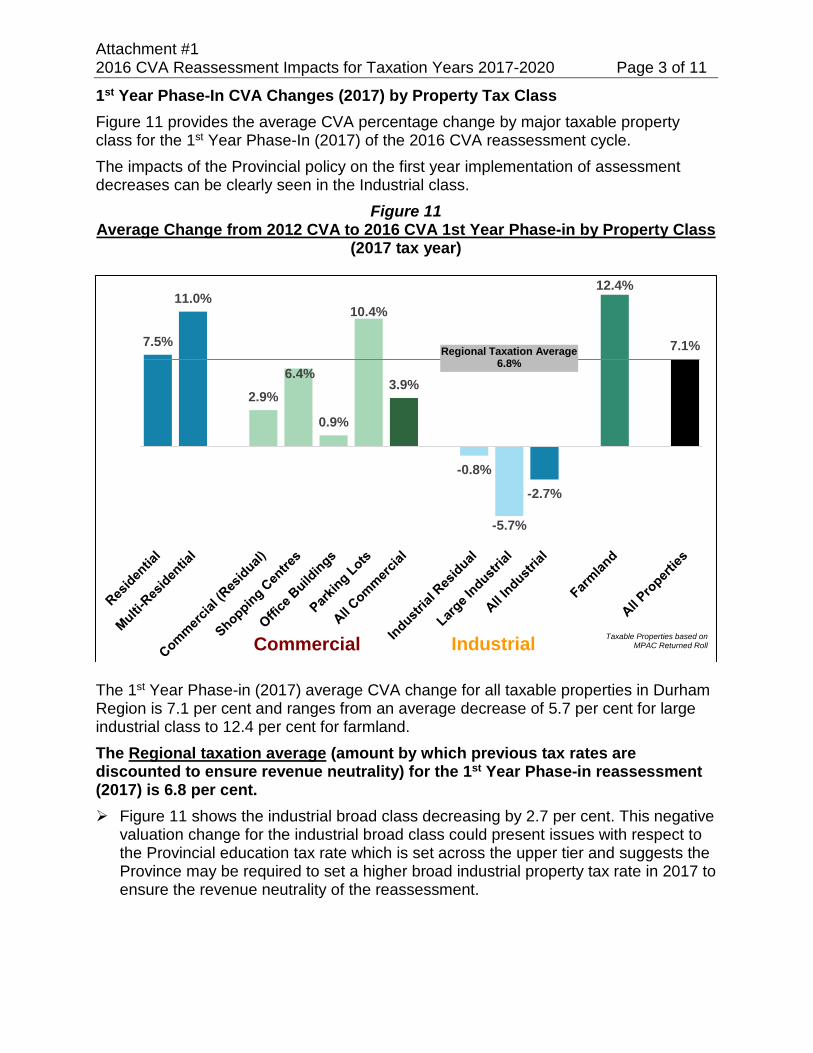
1st Year Phase-In CVA Changes (2017) by Property Tax Class Figure 11 provides the average CVA percentage change by major taxable property class for the 1st Year Phase-In (2017) of the 2016 CVA reassessment cycle. The impacts of the Provincial policy on the first year implementation of assessment decreases can be clearly seen in the Industrial class.
Figure 11 Average Change from 2012 CVA to 2016 CVA 1st Year Phase-in by Property Class
(2017 tax year)
The 1st Year Phase-in (2017) average CVA change for all taxable properties in Durham Region is 7.1 per cent and ranges from an average decrease of 5.7 per cent for large industrial class to 12.4 per cent for farmland. The Regional taxation average (amount by which previous tax rates are discounted to ensure revenue neutrality) for the 1st Year Phase-in reassessment (2017) is 6.8 per cent. Figure 11 shows the industrial broad class decreasing by 2.7 per cent. This negative
valuation change for the industrial broad class could present issues with respect to the Provincial education tax rate which is set across the upper tier and suggests the Province may be required to set a higher broad industrial property tax rate in 2017 to ensure the revenue neutrality of the reassessment.
7.5%
11.0%
2.9%
6.4%
0.9%
10.4%
3.9%
-0.8%
-5.7%
-2.7%
12.4%
7.1%
Commercial Industrial Taxable Properties based onMPAC Returned Roll
Regional Taxation Average6.8%

Attachment #1 2016 CVA Reassessment Impacts for Taxation Years 2017-2020 Page 4 of 11
Estimated Regional Reassessment Property Tax Impacts by Property Tax Class Table 6 provides a summary of the anticipated Regional taxation shifts that will occur between the property classes as a result of the reassessment.
Table 6 Estimated Regional Property Taxation Shifts Across Property Tax Classes
Based on 2016 Regional Property Taxes of $600.4 million
Property Class 2017 (1st year phase-In)
2017-2020 (full
reassessment) $m % $m % Residential 3.05 0.6% 6.15 1.3% Multi-Residential 0.86 3.9% 2.87 13.1%
Commercial Residual (1.88) (0.6%) (4.51) (8.7%) Shopping Centre (0.10) (0.4%) (0.36) (1.5%) Office Buildings (0.12) (5.6%) (0.28) (13.2%) Parking Lots 0.01 3.8% 0.02 10.0% All Commercial (2.09) (2.7%) (5.13) (6.6%) Industrial Residual (0.90) (7.1%) (2.14) (17.0%) Large Industrial (0.98) (11.7%) (1.91) (22.9%) All Industrial (1.88) (8.9%) (4.05) (19.3%) Farmland 0.12 5.2% 0.39 16.5% Other (0.06) (3.6%) (0.23) (13.2%) Total - -
The residential class, on average, is expected to see a 0.6 per cent increase in
Regional tax in 2017 and 1.3 per cent over the four year phase-in (2017-2020). Multi-Residential and farmland classes, on average, are expected to see the highest
Regional tax increases at 3.9 per cent and 5.2 per cent respectively in 2017 and 13.1 per cent and 16.5 per cent over the four year phase-in (2017-2020).
• Although farmland, on average, will have a higher percentage Regional taxation impact, the farmland municipal tax ratio is 0.20 which means these properties are taxed at 1/5 of the residential property tax rate.
• In 2016 (2012 CVA), the average assessment on a farmland parcel was $410,000, which resulted in Regional property taxes of approximately $575. The 5.2 per cent Regional reassessment property tax increase would therefore be approximately $30.
• All the commercial classes excluding parking lots will, on average, experience Regional tax decreases. Although the percentage increase for the Parking Lot commercial special class is relatively high (3.8 per cent), the number of properties across the Region is very low, along with the CVA of the individual properties.

Attachment #1 2016 CVA Reassessment Impacts for Taxation Years 2017-2020 Page 5 of 11
Both the industrial residual and large industrial classes will experience Regional property tax decreases due to the reassessment. The significant decrease in the large industrial class is driven primarily by the auto sector and gravel pit assessment changes.
Reassessment by Residential Property Type As shown in the previous sections, the full 2016 CVA reassessment resulted in an average CVA increase for the residential property class of 30.8 per cent with a resulting average residential class Region property taxation increase of 1.3 per cent phased-in over the taxation years 2017 to 2020. It is important to note that, in accordance with the Assessment Act, the residential property tax class includes several property types that are not generally considered typical residential. Non-residential property types make up approximately 6 per cent of the 2016 CVA within the residential property tax class. To better understand the reassessment impacts on a typical residential property, the following analysis looks at the eight specific property types as shown in Table 7.
Table 7 Reassessment Impacts by Residential Property Type
2017 (1st year phase-in)
2017-2020 (full reassessment)
Type of Residential Property
Est. Number of Properties (rounded to nearest 100)
2016 CVA $millions
CVA Change
Est. Regional Taxation Impact
CVA Change
Est. Regional Taxation Impact
Single family detached not on waterfront 136,500 65,812 7.9% 1.1% 31.8% 2.1%
Link home 14,300 5,364 8.5% 1.6% 34.1% 3.9%
Town or Row house 12,900 4,693 8.4% 1.5% 33.7% 3.6%
Semi-detached residential 12,100 3,926 8.2% 1.3% 32.9% 2.9%
Residential Condominium 15,400 3,973 5.8% (0.9%) 23.4% (4.4%) Single family detached on waterfront 1,100 637 3.3% (3.3%) 13.4% (12.1%)
Seasonal/recreational 1st tier on waterfront 400 173 2.0% (4.5%) 9.2% (15.4%)
Seasonal/recreational 2nd tier on waterfront 100 19 4.5% (2.2%) 18.3% (8.4%)
Total Specific Residential Property Types 192,800 84,597 7.9% 1.0% 31.4% 1.8%
Entire Residential Class 207,796 91,680 7.5% 0.6% 30.8% 1.3%
Although the residential class is expected to experience, on average, a 0.6 per cent (2017) and 1.3 per cent (full reassessment) Regional reassessment property tax increase, the following typical residential properties will see, on average, a larger Regional property tax increase as shown on the following page.

Attachment #1 2016 CVA Reassessment Impacts for Taxation Years 2017-2020 Page 6 of 11
Residential Property Type 2017 (1st Year) Full (201-2020) Single Family Homes (not on waterfront) 1.1 per cent 2.1 per cent Link Homes 1.6 per cent 3.9 per cent Town and Row Houses 1.5 per cent 3.6 per cent Semi-detached homes 1.3 per cent 2.9 per cent Several type of residential properties, on average, will experience a Regional full reassessment property tax decrease including condominiums and waterfront homes (which had higher valuation changes in previous reassessments).
Reassessment by Average Region-Wide Home Historically, the Region has used the average single family detached home (not on waterfront) to state and compare Regional reassessment and budgetary taxation impacts. For the 2012 CVA cycle, the Region-wide average home CVA was initially estimated at $318,000 (2013), rising to $362,000 in the final year of the 2012 CVA reassessment phase-in (2016) and restated to $366,600 with the following Region-wide average home CVA estimates projected for each tax year of the 2016 CVA phase-in: 2017 $395,700 2018 $424,800 2019 $453,900 2020 $483,000 (2016 CVA fully phased-in)
For the Region-wide average home with a 2012 CVA of $366,600, and 2016 Regional property taxes totalling $2,542; it is estimated that 1st Year Phase-In (2017) will result in a reassessment related
increase in Regional taxes by 1.1 per cent or approximately $27 it is estimated that Full Reassessment (2017-2020) will result in a reassessment
related increase in Regional taxes of 2.1 per cent or approximately $53 by the fourth and final year of the phase-in (2020). This increase is significantly larger than the increases that resulted from the previous 2012 CVA.
Estimated Reassessment Phase-In on Average Region-Wide Home Since the 2008 reassessment (1st implementation of the four year phase-in cycle), Regional Council has requested that the Province eliminate the special treatment provided to CVA decreases (1st year implementation) for the following reasons: Property taxation shifts result from an individual property’s valuation change relative
to the jurisdiction’s taxation average. As such, a property’s valuation change being negative or positive is not relevant to the taxation change and providing these properties with preferential treatment is not equitable.
The special treatment results in the property taxation increases being front end loaded into the first year of the phase-in.
Attachment #1 2016 CVA Reassessment Impacts for Taxation Years 2017-2020 Page 7 of 11
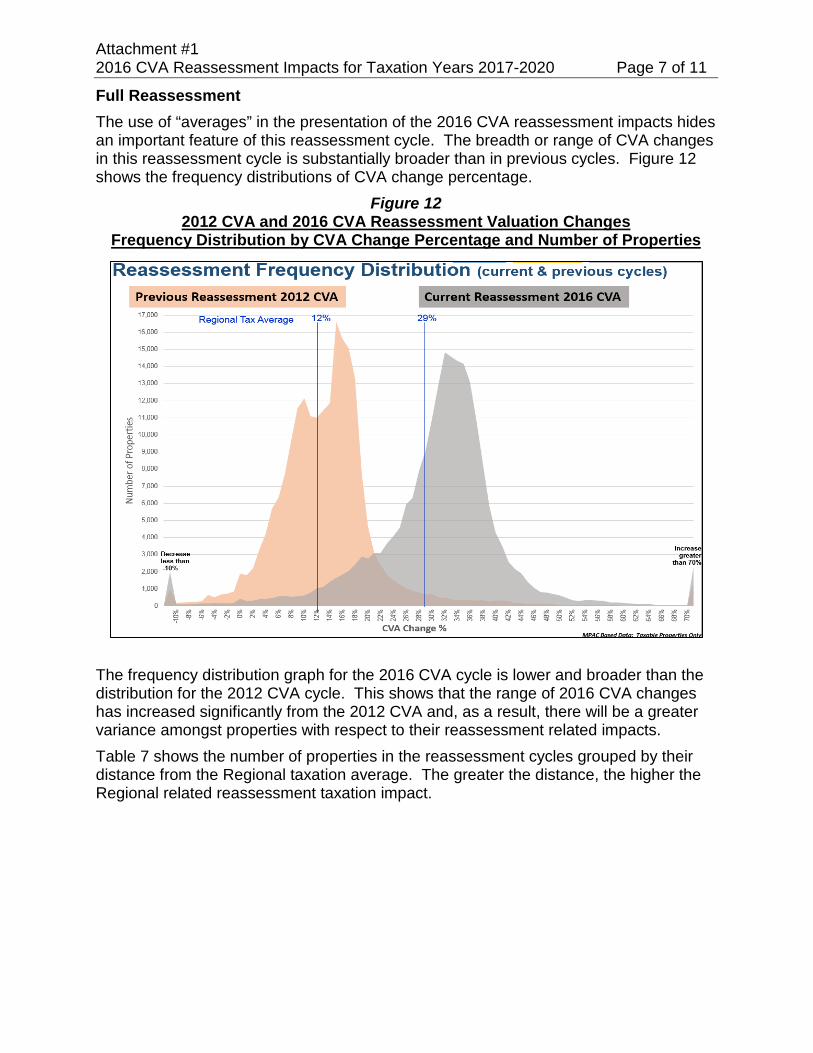
Full Reassessment The use of “averages” in the presentation of the 2016 CVA reassessment impacts hides an important feature of this reassessment cycle. The breadth or range of CVA changes in this reassessment cycle is substantially broader than in previous cycles. Figure 12 shows the frequency distributions of CVA change percentage.
Figure 12 2012 CVA and 2016 CVA Reassessment Valuation Changes
Frequency Distribution by CVA Change Percentage and Number of Properties
The frequency distribution graph for the 2016 CVA cycle is lower and broader than the distribution for the 2012 CVA cycle. This shows that the range of 2016 CVA changes has increased significantly from the 2012 CVA and, as a result, there will be a greater variance amongst properties with respect to their reassessment related impacts. Table 7 shows the number of properties in the reassessment cycles grouped by their distance from the Regional taxation average. The greater the distance, the higher the Regional related reassessment taxation impact.
Attachment #1 2016 CVA Reassessment Impacts for Taxation Years 2017-2020 Page 8 of 11
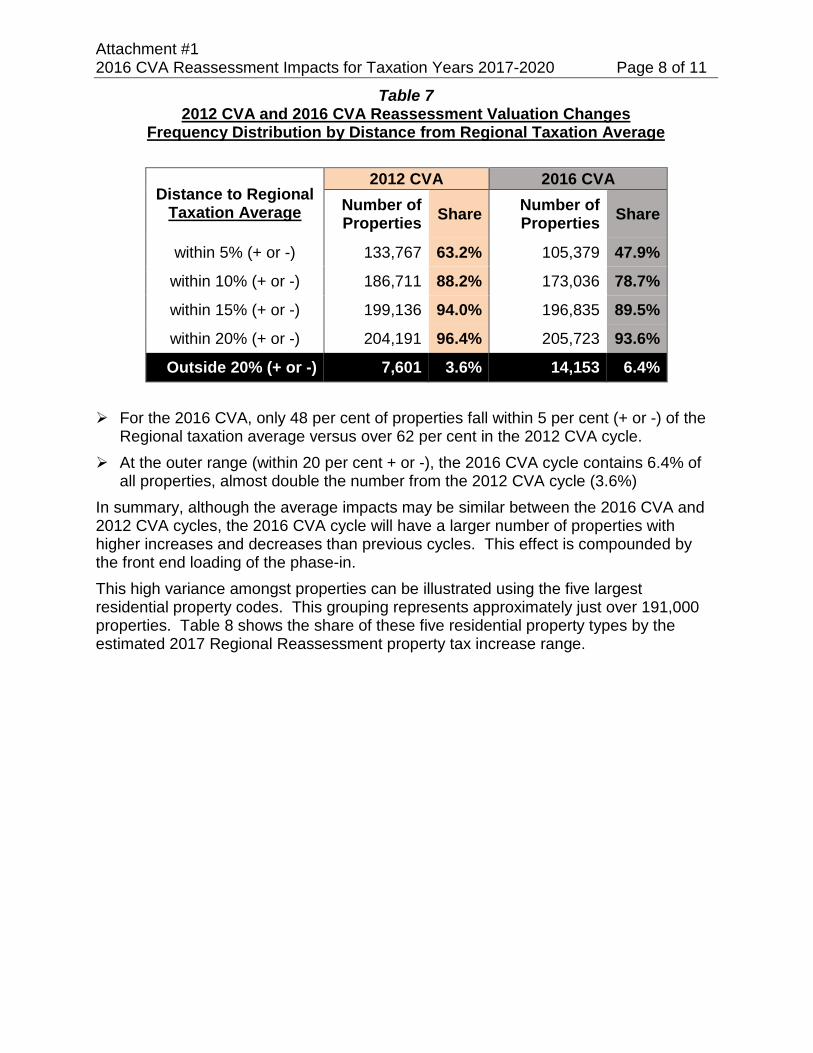
Table 7 2012 CVA and 2016 CVA Reassessment Valuation Changes
Frequency Distribution by Distance from Regional Taxation Average
Distance to Regional Taxation Average
2012 CVA 2016 CVA Number of Properties Share Number of
Properties Share
within 5% (+ or -) 133,767 63.2% 105,379 47.9%
within 10% (+ or -) 186,711 88.2% 173,036 78.7%
within 15% (+ or -) 199,136 94.0% 196,835 89.5%
within 20% (+ or -) 204,191 96.4% 205,723 93.6%
Outside 20% (+ or -) 7,601 3.6% 14,153 6.4% For the 2016 CVA, only 48 per cent of properties fall within 5 per cent (+ or -) of the
Regional taxation average versus over 62 per cent in the 2012 CVA cycle. At the outer range (within 20 per cent + or -), the 2016 CVA cycle contains 6.4% of
all properties, almost double the number from the 2012 CVA cycle (3.6%) In summary, although the average impacts may be similar between the 2016 CVA and 2012 CVA cycles, the 2016 CVA cycle will have a larger number of properties with higher increases and decreases than previous cycles. This effect is compounded by the front end loading of the phase-in. This high variance amongst properties can be illustrated using the five largest residential property codes. This grouping represents approximately just over 191,000 properties. Table 8 shows the share of these five residential property types by the estimated 2017 Regional Reassessment property tax increase range.

Attachment #1 2016 CVA Reassessment Impacts for Taxation Years 2017-2020 Page 9 of 11
Table 8 Share of Residential Property Types by
Estimated 2017 Regional Reassessment Property Tax Increase
Number of properties rounded to nearest 10 The average Region-wide home residential home has, on average, a 2017 Regional reassessment related property tax increase of 1.06 per cent, however, the use of averages in this reassessment does not tell the full story of the variability amongst residential property types presented in Table 8 above In the four largest residential type groupings, between 43.7 to 49.5 per cent of the
properties will have 2017 Regional reassessment related property tax increases greater than the 2017 Budget Guideline Regional Council adopted in the fall of 2016 (2.0 per cent).
This represents almost 80,000 homes.
Regional Reassessment
Tax Change Range
Single family detached (not on waterfront)
Link home Freehold
Town or Row house
Semi-detached
residential Residential
Condo
# Share % # Share
% # Share % # Share
% # Share %
Decrease 19,440 14.2% 240 1.6% 610 4.7% 640 5.3% 8,790 57.0%
0% to 1% 18,530 13.6% 1,860 13.0% 1,970 15.3% 1,980 16.3% 3,570 23.1%
1% to 2% 38,840 28.5% 5,610 39.3% 3,950 30.6% 3,980 32.8% 1,600 10.4%
2% to 3% 39,900 29.2% 3,350 23.5% 3,820 29.6% 4,360 36.0% 630 4.1%
3% to 5% 17,160 12.6% 3,060 21.4% 2,350 18.2% 1,050 8.7% 600 3.9%
5% to 10% 2,500 1.8% 160 1.1% 200 1.6% 120 1.0% 220 1.4%
Greater than 10% 80 0.1% - 0.0% 20 0.1% - 0.0% - 0.0%
Attachment #1 2016 CVA Reassessment Impacts for Taxation Years 2017-2020 Page 10 of 11
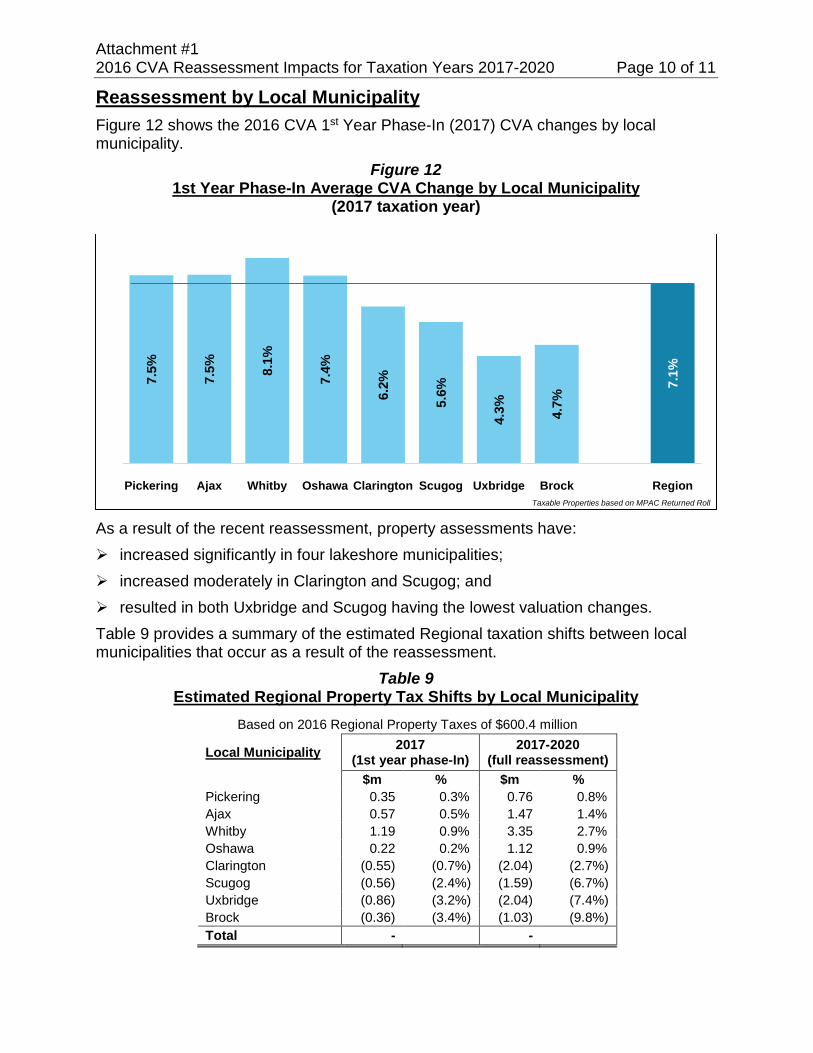
Reassessment by Local Municipality Figure 12 shows the 2016 CVA 1st Year Phase-In (2017) CVA changes by local municipality.
Figure 12 1st Year Phase-In Average CVA Change by Local Municipality
(2017 taxation year)
As a result of the recent reassessment, property assessments have: increased significantly in four lakeshore municipalities; increased moderately in Clarington and Scugog; and resulted in both Uxbridge and Scugog having the lowest valuation changes. Table 9 provides a summary of the estimated Regional taxation shifts between local municipalities that occur as a result of the reassessment.
Table 9 Estimated Regional Property Tax Shifts by Local Municipality
Based on 2016 Regional Property Taxes of $600.4 million
Local Municipality 2017 (1st year phase-In)
2017-2020 (full reassessment)
$m % $m % Pickering 0.35 0.3% 0.76 0.8% Ajax 0.57 0.5% 1.47 1.4% Whitby 1.19 0.9% 3.35 2.7% Oshawa 0.22 0.2% 1.12 0.9% Clarington (0.55) (0.7%) (2.04) (2.7%) Scugog (0.56) (2.4%) (1.59) (6.7%) Uxbridge (0.86) (3.2%) (2.04) (7.4%) Brock (0.36) (3.4%) (1.03) (9.8%) Total - -
7.5%
7.5% 8.
1%
7.4%
6.2%
5.6%
4.3% 4.7%
7.1%
Pickering Ajax Whitby Oshawa Clarington Scugog Uxbridge Brock RegionTaxable Properties based on MPAC Returned Roll

Attachment #1 2016 CVA Reassessment Impacts for Taxation Years 2017-2020 Page 11 of 11
With respect to the Regional reassessment impacts by local municipality shown in Table 9 on the previous page: Whitby will experience the largest increase in Regional property taxation as a result
of the reassessment at 0.9 per cent in 2017 and 2.7 per cent over the four year phase-in (2017-2020). This is almost double Ajax which is the next highest.
Brock will experience the largest decrease at 3.4 per cent in 2017 and 9.8 per cent over the four year phase-in (2017-2020).

Attachment #2 Regional Role in Assessment Base Appeals Page 1 of 2
Attachment #2
Regional Role in Assessment Base Appeals
Overview The assessment risk analysis in this report covers three reassessment cycles and involves the previous 11 property taxation years: 2005 CVA for the tax years 2006 to 2008; 2008 CVA for the tax years 2009 to 2012; and 2012 CVA for the tax years 2013 to 2016. Each reassessment cycle and every taxation year, a significant number of appeals are filed by property owners with respect to the MPAC assigned CVA or classification. At any given point in time, five to ten per cent of the assessment base can be involved in assessment appeals which represents significant financial risks to the municipal sector. It can take several years for appeals to reach settlement, with many of the more complex commercial and industrial complaint processes extending beyond the current four-year assessment phase-in period.
Upper Tier Appeal Rights In December 2013, the Provincially-directed Special Purpose Business Property Assessment Review (SPBPAR) made nine specific recommendations concerning municipal involvement in the appeals process and the municipal risk inherent in CVA based appeals, including:
“…develop and implement a protocol to increase early and ongoing municipal engagement in ARB and settlement processes, to reduce the current imbalance in the level of engagement of parties in the appeals process.” (Recommendation 25) “…prioritize municipal involvement in appeals accordingly.” (Recommendation 26)
These recommendations highlight the problems faced by upper tier municipalities such as Durham Region. More specifically, upper tier municipalities are legislatively excluded from the appeals process, as the Assessment Act does not provide any recognition or standing to Ontario Regional governments in this regard. The Region’s legislative disconnect from the assessment complaint and appeals process represents a financial risk, and hampers the Region’s ability to accurately forecast potential financial losses, effectively monitor, and protect the assessment base. The Region’s 48 per cent share of total property taxation relies on maintenance of the assessment base and any reduction due to appeals has a direct financial impact on Regional taxation revenues.

Attachment #2 Regional Role in Assessment Base Appeals Page 2 of 2
The appeal provisions in the Assessment Act should be revised to provide upper tier municipalities with the rights commensurate with the role they play in the establishment of property taxation policy, as well as recognizing their higher share of property tax revenues.
Working with Local Municipalities Durham Region’s assessment base has several inherent risks and is exhibiting certain trends which require more proactive monitoring, continued analysis and cooperative approaches. As approved by Regional Council, an assessment base working group was established and Regional Finance staff and local municipal finance representatives work together in reviewing issues and risks related to the assessment base. Over the past three years, the working group (Treasurers and tax collectors of the local municipalities and Regional Finance staff) have met on several occasions to discuss emerging and historic assessment base issues and risks. As well, the working group held meetings with MPAC senior staff in 2016 to discuss the following: assessment methodologies; specific assessment appeal risks associated with specific property types within
Durham; and the 2016 CVA reassessment impacts. Regional Finance staff will continue to work closely with the local municipalities to further explore assessment base issues and find more effective and efficient proactive responses to assessment risk.
Attachment #3 Non-Residential Vacant/Excess Land Subclass Ratio Discounts and Vacant Unit Rebate Program Page 1 of 1
Attachment #3 Non-Residential Vacant/Excess Land Subclass
Ratio Discounts and Vacant Unit Rebate Program
Commercial and Industrial Vacancy Subclasses In 1997, prior to the 1998 CVA reforms, a business occupancy tax (BOT) was levied by municipalities against the owner/tenant of commercial and industrial properties with varying rates depending on the type of operations conducted on the premises. As part of the 1998 reforms, the Province eliminated the BOT and increased the municipal tax ratio of the commercial and industrial classes to recoup the lost revenue. However, since the BOT was not levied against vacant or excess land components of a property, these subclasses were provided a municipal tax ratio discount to shield them from the impact of the BOT elimination. In 1998, the authority to set vacancy subclass ratio discounts, within Provincially defined parameters, was assigned to the upper or single tier municipalities. Regional Council through Report #98-F-2 chose to discount the commercial broad subclasses by 30 per cent and the industrial broad subclasses by 35 per cent (the minimum mandated by the Province in 1998). In 2016, the vacant and excess land subclasses of the commercial and industrial broad classes paid a total of approximately $4.0 million in Regional property taxes and approximately $2.6 million in local municipal taxes involving approximately 960 properties (61 per cent in the vacant land subclass and 39 per cent in the excess land subclass.
Commercial and Industrial Vacant Unit Rebates Similar to the vacant/excess land subclass, in 1998 there was also a vacant unit subclass that shared the same discounted municipal tax ratio set by Regional Council. In 2001, this vacant unit subclass was eliminated by the Province and replaced by an application based vacant unit rebate program. The vacant unit rebate program is administered by single or local municipalities with the rebated amount determined by the Region in the setting of the 1998 ratios. The rebated amount is based on the initial 1998 ratios set by the Region of Durham. There are numerous eligibility requirements for a vacancy rebate including: the unit must be vacant for at least 90 days, be unused (including for storage purposes) and the vacant portion must be clearly delineated or separated by physical barriers from any portion of the building in use. In a 2014 Assessment Review Board (ARB) decision, this vacancy rebate was applied to a property that was ‘unused’ as a result of a labour disruption. This ARB extension of the application of this rebate program causes significant municipal concern.

Attachment #4 Provincial Statutory Rates Page 1 of 3
Attachment #4 Provincial Statutory Rates
Regional Concerns The Province currently bases municipal payments for hospitals and post-secondary education institutions (Heads & Beds – last updated 1987), hydro and rail linears (Rights of Ways – last updated 1998) and nuclear generating facilities (last updated 1968) on legislated statutory rates rather than current value assessment. The use of Provincial statutory rates is an inequitable aspect of the current policy regime. Statutory rates continue to represent a financial risk to the Region, given they have not been adjusted to take into account either increased Regional service costs or the time value of money. In its annual property tax study, Regional Council has consistently requested that the Province update the statutory rates for the nuclear plants, hospitals and post-secondary education (Heads & Beds), and linears (right-of ways). In 2016, the Province began stakeholder consultations on railway linears. While it is too early in the consultation process to reasonably assess possible changes to this municipal revenue source, this report does request that any changes not result in a decrease in the inflation adjusted municipal revenues within Durham Region. Further, although the Province is reviewing railway linears in 2016, there has been no indication that the Province is willing to launch reviews with respect to the other similar linear properties (hydro right of ways), heads and beds or nuclear generating facilities. It is recommended that the Province, in consultation with the municipal sector, review and update the current statutory rates on the following property types and institute a process by which these rates are automatically updated in the future. Statutory rates whose funding has eroded over time include: Head and Bed Provincially set rate of $75.00, last adjusted in 1987. Heads and
Beds are partial compensation to municipalities for revenue losses associated with property tax exempt status properties (e.g. Universities/Colleges, Prisons, and Hospitals;
Hydro linear (land under electrical towers) and Railway linear properties (land under railway tracks) also benefit from Provincially set rates at $834 and $611 per acre respectively, last updated in 1998; and,
The statutory rate set by the Province for assessing nuclear generating facilities is $86.11 per m2 of inside ground floor area of the actual generating and transformer station buildings. This rate was set in 1968 and has never been updated. Of all the provincial statutory rates, those that are applied to nuclear generating facilities are particularly inequitable to Durham taxpayers.

Attachment #4 Provincial Statutory Rates Page 2 of 3
It is estimated that the lack of indexing with an appropriate Statistics Canada Consumer Price Index (CPI) for the first two statutory rates resulted in a Regional revenue shortfall of approximately $1.84 million in 2016 and a cumulative deficit of over $14.8 million in Regional funding since the rates were established in 1987/1998 as illustrated in Table 10.
Table 10 Estimated Regional Revenue Shortfall as a Result of Not Indexing Provincial
Statutory Rates
Regional Shortfalls ($m)
Established 2016 Since 1999
Heads & Beds 1987 $0.73 $6.39
Hydro Linears 1998 $0.81 $6.44
Railway Linears 1998 $0.30 $1.96
Total $1.84 $14.79
It is more difficult to estimate the foregone revenue with respect to prescribed nuclear generating facilities as it is not set at a flat fee, but rather a set assessment used in a property tax calculation. Since the nuclear rate was established in 1968, CPI has risen by close to 600 per cent.
Provincial Treatment of Wind Turbine Towers It should be noted that in the 2013 Special Purpose Business Property Assessment Review (SPBPAR), it was recommended for the assessment of wind turbine towers that:
“Beginning in 2017, and with every four-year reassessment, the amount of the increase for wind turbine towers would be updated to reflect the province-wide average assessment increase of the industrial property class, phased-in over four years. This approach is recommended to provide stability and to help mitigate tax shifts within the industrial property class between wind turbine towers and other industrial properties”.
The approach recommended in the SPBPAR for wind turbine towers which was adopted for the taxation year 2017 is very similar to the approach recommended to the Province by Regional Council for several years with respect to the three statutory rates noted.

Attachment #4 Provincial Statutory Rates Page 3 of 3
Nuclear Generating Facilities Proxy Property Taxes An additional issue related to the nuclear generating facilities is the alternative assessment and proxy property taxes related to the payment of stranded debt. As outlined earlier, Payment-in-Lieu of Taxes (PILs) on specific generating structures are based on statutory assessment rate of $86.11/m2 and paid to the hosting municipalities. Further proxy property taxes are levied and paid to the Ontario Electricity Financial Corporation (OEFC) and applied against the former Ontario Hydro stranded debt. Details of the alternative assessment are outlined in O. Reg. 423/11 under the Electricity Act, 1998. It is understood that proxy property taxes are the difference between the statutory rate for prescribed buildings and what would apply if taxed at CVA. Given that proxy tax payments to the OEFC are to be equivalent to what would have been payable by a private corporation based on an MPAC-derived alternative market valuation for these asset classes, Regional staff have previously requested confirmation from the Ontario Ministry of Finance regarding Section 92(3) of the Electricity Act, 1998, where it is noted that following the retirement of the stranded debt and repeal of Part V under Section 84.1 of the Act, that payments currently being made to the OEFC will instead be paid to the appropriate municipalities in respect of land located in those municipalities. Recent changes to the Electricity Act as made through Bill 144, Budget Measures Act, 2015 have resulted in changes to the Province’s reporting requirements and recognition of the stranded debt and residual stranded debt as outlined within the Act, in addition to full elimination of the Debt Retirement Charge in 2018 for non-residential customers. While Section 92(3) still alludes to payments to be made to municipalities upon the repeal of Part V under Section 84.1 of the Act, there now exists additional uncertainty to the status of these future payments given the lack of clarity around the status of the stranded debt itself. Similar concerns have been echoed by the Association of Municipalities of Ontario (AMO) in a submission to the Ontario Legislature’s Standing Committee on Finance and Economic Affairs (December 2, 2015). AMO has noted the lack of clarity around the future redirection of PILs following the retirement of the stranded debt and has noted that any amendments ultimately resulting in reduced revenues for municipalities should be addressed through alternative sources of funding by the Province. It is recommended that the Province redirect the proxy tax payments currently made to the OEFC to the hosting municipalities and the upper tier. It should be noted that the two local municipalities under current Provincial legislation retains the education tax portion of commercial and industrial classified PILs.
Attachment #5 Municipal Capital Facilities Page 1 of 1
Attachment #5 Municipal Capital Facilities
Legislation Section 110 of the Municipal Act, 2001 provides the legislative authority for municipal capital facilities. Specifically, this section introduces tax exemption provisions, which allow a municipal council “may exempt from all or part of the taxes levied for municipal and school purposes land or a portion of land on which municipal capital facilities are or will be located…” Ontario Regulation 603/06 identifies classes of municipal capital facilities for the purpose of exempting land from taxation under subsection 110 (6) of the Municipal Act, 2001.
Regional Concerns The effect of Section 110 (6) of the Municipal Act, 2001 is that it permits a lower or upper tier municipality within a two tiered municipal structure to designate a property as a municipal capital facility and effectively erode the tax base of the other municipal tier via the tax exemption provisions without requiring that tier’s consent. As such, the tax exemption provisions, as currently written, pose significant long-term financial impacts for the Region. In a two tiered municipal structure, any lower-tier municipality using these tax exemption provisions can negatively impact the upper-tier tax revenues. While lower tier municipalities can control the extent by which it might grant such tax provisions, the cumulative impact across a two tiered municipal structure can lead to a situation in which the affected upper tier municipality is impacted more significantly than was intended by any one lower tier municipality. As more municipalities choose to support particular community initiatives by way of tax exemption provisions, the upper tier’s municipal tax base is further eroded and tax revenues decrease. It would be preferable and therefore is recommended in this report that the Province amend current legislation so as to require each level of municipal government to directly consider such requests for exemptions rather than allow either level to have the power to exempt selected properties from both upper tier and lower tier fees, charges and property taxes. For example, current tax policy legislation for Veteran’s Associations and designated Heritage properties considers both municipalities in a two tiered municipal structure when seeking authorization to rebate/exempt municipal taxes. The Region has passed several Municipal Capital Facilities By-laws related to affordable housing initiatives as required by senior levels of government to qualify for capital grants. During the drafting of these by-laws, the Region consults extensively with each affected lower tier municipality and proceed only when there is the consent and support of the affected lower tier municipality.

Attachment #6 Residential & Multi-Residential Sector Assessment and Taxation Page 1 of 9
Attachment #6 Residential and Multi-Residential Sector
Assessment and Taxation
Multi-Residential Property Class Multi-residential properties are those that contain seven or more self-contained units and, as part of the 2016 reassessment, MPAC updated the valuation of properties from 2012 to 2016, as well as changed the methodology used to value the properties from a gross income multiplier approach which utilizes the ratio between the sale prices of
similar property and the potential gross income at an annual or monthly basis (used in the 2012 CVA cycle); to a
direct capitalization of net operating income approach which uses the relationship between the net operating income (NOI) and the sale prices of similar property.
As well, for the 2016 CVA reassessment, the market rents were updated Province-wide by major geographical area, as well as changes in the quality build rating system which is a significant factor in deriving valuations. It is not possible for the municipal sector to separate the valuation impacts from the methodology impacts based on the data provided by MPAC. The combined effects, resulted in significant variance across the Province in terms of the 2012 CVA to 2016 CVA changes for this property class as shown in Figure 13.
Figure 13 Comparator Municipalities: Average Change from 2012 CVA to 2016 CVA
Multi-Residential Property Class (phased in over 2017 to 2020 taxation years)
46%
29%
54%
63%
37%
53%
9%
18%
27%
54%
19%
11%
9%
35%
36%
19%
16% 19
%
44%
41%
39%
MPAC Provincial Summary BookAll Properties including PILs and exempt

Attachment #6 Residential & Multi-Residential Sector Assessment and Taxation Page 2 of 9
Similar to the residential class, the Region of Durham experienced some of the highest valuation changes when compared to its municipal comparators, exceeded only by the City of Toronto, Peel Region and Barrie.
The average change for the multi-residential class across the Province was 39 per cent compared to an average for all properties in the Province of 24 percent and 22 per cent for the residential class.
The 1st year phase-in (2017) reassessment is anticipated to increase the multi-residential share of the Regional taxation based from 3.5 per cent in 2016 to 3.8 per cent in 2017, a relative increase of over 8 per cent
Social Housing Properties Many of the properties in Durham Region which provide social housing residential units are within the multi-residential class and are subject to the similar valuation increases and changes in MPAC methodology as other multi-residential properties. This includes the properties owned by Durham Region through the Durham Regional Local Housing Corporation (DRLHC). Based on a preliminary analysis, it appears that multi-residential properties involved in the provision of social housing units (including rent-geared-to-income) will experience an overall increase of 7.4 per cent in total taxes in the 1st year phase-in (2017) of the 2016 CVA reassessment (2017). The properties owned by the DRLHC are estimated to see a somewhat lower, but still substantial, increase in both the 2017 tax year as well as the other 3 phase-in years (2018-2020). This report recommends that the Regional Commissioner of Finance be provided Council authorization to file a Request for Consideration (RfR) on the 2016 CVA of the DRLHC properties with MPAC. This review is necessary to ensure that the 2016 CVA have correctly considered building conditions.
2016 Assessment and Taxation of Durham’s Residential Sector Regional Finance staff provided an analysis of the residential sector assessment and taxation which included multi-residential in 2008 and this analysis has been updated to 2016 due to recent interest in the taxation of multi-residential properties. For the purpose of the comparative analysis, the following six property types were considered.

Attachment #6 Residential & Multi-Residential Sector Assessment and Taxation Page 3 of 9
Residential Property Types used in Comparative Analysis
Residential Type Approximate Number of Units Property Class MPAC Valuation
Methodology Single family detached homes (not on waterfront)
136,000 Residential Sales Approach
Link and semi-detached homes 26,300 Residential Sales Approach
Town or row housing 13,000 Residential Sales Approach
Condominiums 15,400 Residential Sales Approach
Between 2-6 residential unit properties
4,000 Residential Sales Approach
Multi-residential (apartments & row housing)
17,600 Multi-Residential Direct Capitalization Approach
Units rounded to nearest hundreds
Unlike the single-family detached homes and condominiums, multi-residential properties have their own property tax class which has a 1.8665 municipal tax ratio, which results in a higher municipal property tax rate, but not necessarily higher property taxes as the average assessment on individual multi-residential units is substantially less than the other residential types (as shown in Figure 14 below).
2012 CVA (2016 Tax Year) – Average Assessment by Residential Unit Types The average 2012 CVA (2016 taxation) of these property types is provided in Figure 14.
Figure 14 Residential Unit Average CVA for 2016 tax year by Residential Type
367,000
280,000 243,000 272,000
208,000
113,000 81,000 93,000
Sing
leD
etac
hed
Hom
e
Link
Hom
e
Sem
i-Det
ache
dH
ome
Tow
n or
Row
Hou
sing
Con
dom
iniu
ms
Bet
wee
n 2-
6R
esid
entia
lU
nits
Mul
ti-R
esid
entia
lA
part
men
ts
Mul
ti-R
esid
entia
lTo
wn
or R
owH
ousi
ng
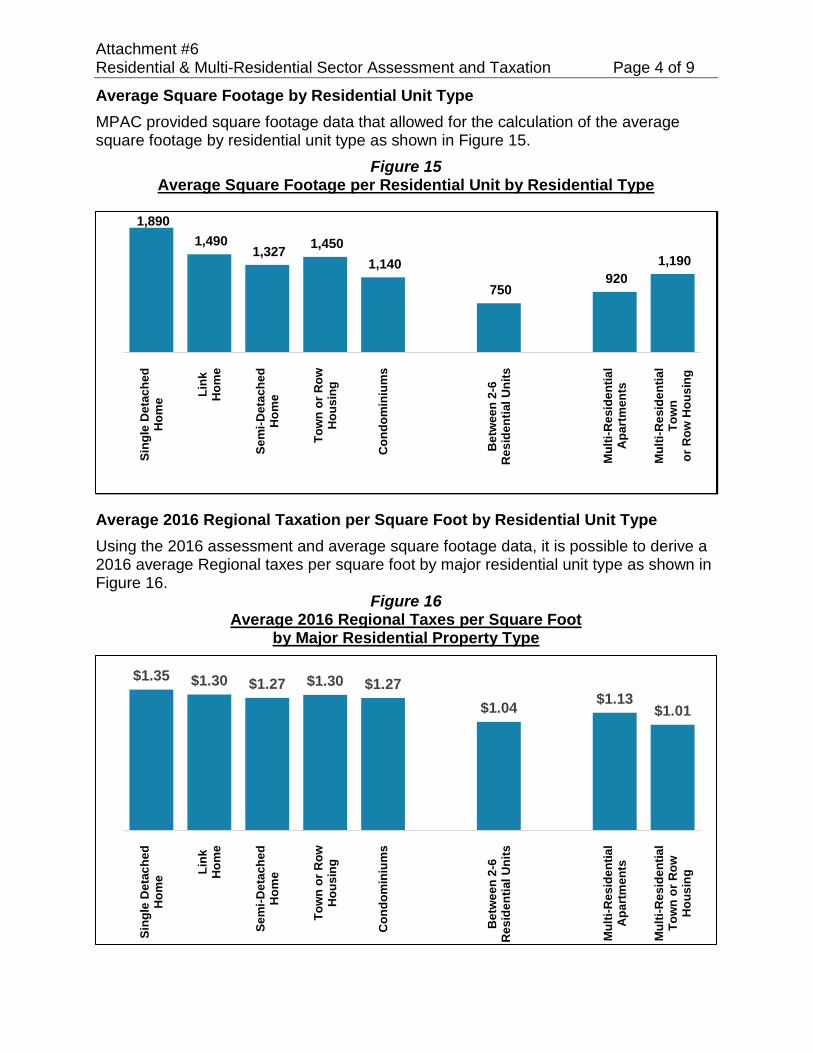
Attachment #6 Residential & Multi-Residential Sector Assessment and Taxation Page 4 of 9
Average Square Footage by Residential Unit Type MPAC provided square footage data that allowed for the calculation of the average square footage by residential unit type as shown in Figure 15.
Figure 15 Average Square Footage per Residential Unit by Residential Type
Average 2016 Regional Taxation per Square Foot by Residential Unit Type Using the 2016 assessment and average square footage data, it is possible to derive a 2016 average Regional taxes per square foot by major residential unit type as shown in Figure 16.
Figure 16 Average 2016 Regional Taxes per Square Foot
by Major Residential Property Type
1,890 1,490
1,327 1,450 1,140
750 920
1,190
Sing
le D
etac
hed
Hom
e Link
Hom
e
Sem
i-Det
ache
dH
ome
Tow
n or
Row
Hou
sing
Con
dom
iniu
ms
Bet
wee
n 2-
6R
esid
entia
l Uni
ts
Mul
ti-R
esid
entia
lA
part
men
ts
Mul
ti-R
esid
entia
lTo
wn
or R
ow H
ousi
ng$1.35 $1.30 $1.27 $1.30 $1.27
$1.04 $1.13 $1.01
Sing
le D
etac
hed
Hom
e Link
Hom
e
Sem
i-Det
ache
dH
ome
Tow
n or
Row
Hou
sing
Con
dom
iniu
ms
Bet
wee
n 2-
6R
esid
entia
l Uni
ts
Mul
ti-R
esid
entia
lA
part
men
ts
Mul
ti-R
esid
entia
lTo
wn
or R
owH
ousi
ng
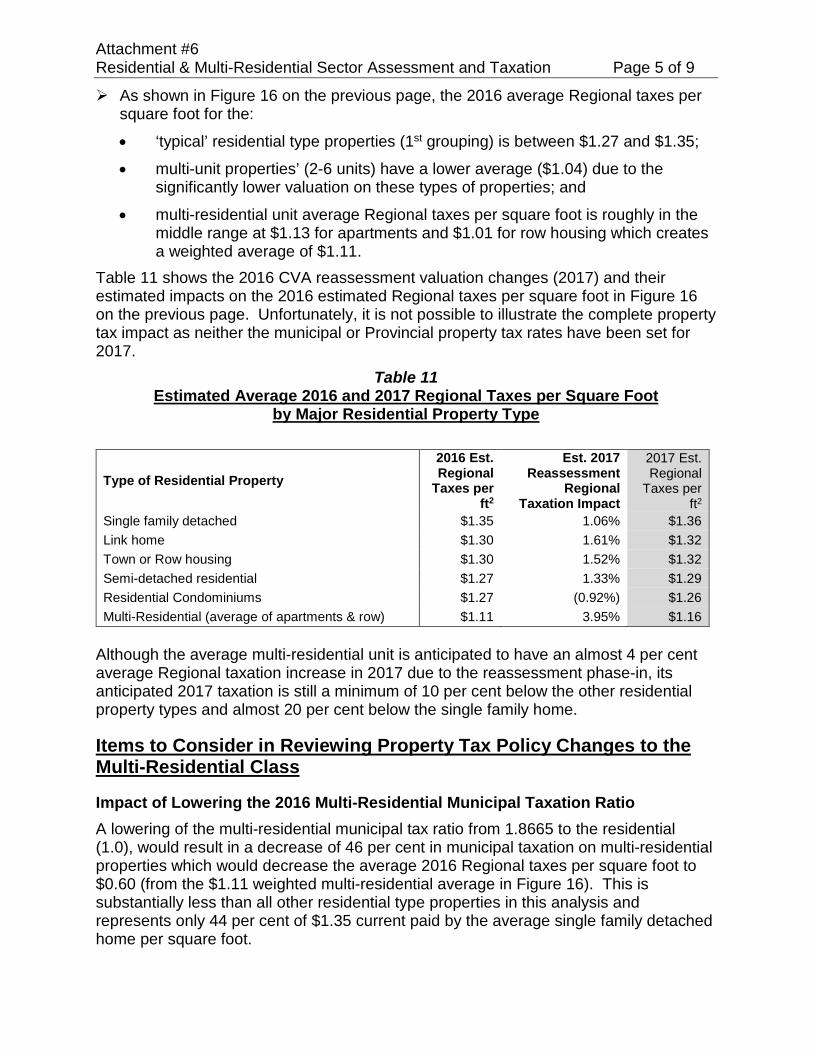
Attachment #6 Residential & Multi-Residential Sector Assessment and Taxation Page 5 of 9
As shown in Figure 16 on the previous page, the 2016 average Regional taxes per square foot for the:
• ‘typical’ residential type properties (1st grouping) is between $1.27 and $1.35;
• multi-unit properties’ (2-6 units) have a lower average ($1.04) due to the significantly lower valuation on these types of properties; and
• multi-residential unit average Regional taxes per square foot is roughly in the middle range at $1.13 for apartments and $1.01 for row housing which creates a weighted average of $1.11.
Table 11 shows the 2016 CVA reassessment valuation changes (2017) and their estimated impacts on the 2016 estimated Regional taxes per square foot in Figure 16 on the previous page. Unfortunately, it is not possible to illustrate the complete property tax impact as neither the municipal or Provincial property tax rates have been set for 2017.
Table 11 Estimated Average 2016 and 2017 Regional Taxes per Square Foot
by Major Residential Property Type
Type of Residential Property 2016 Est. Regional
Taxes per ft2
Est. 2017 Reassessment
Regional Taxation Impact
2017 Est. Regional
Taxes per ft2
Single family detached $1.35 1.06% $1.36 Link home $1.30 1.61% $1.32 Town or Row housing $1.30 1.52% $1.32 Semi-detached residential $1.27 1.33% $1.29 Residential Condominiums $1.27 (0.92%) $1.26 Multi-Residential (average of apartments & row) $1.11 3.95% $1.16
Although the average multi-residential unit is anticipated to have an almost 4 per cent average Regional taxation increase in 2017 due to the reassessment phase-in, its anticipated 2017 taxation is still a minimum of 10 per cent below the other residential property types and almost 20 per cent below the single family home.
Items to Consider in Reviewing Property Tax Policy Changes to the Multi-Residential Class
Impact of Lowering the 2016 Multi-Residential Municipal Taxation Ratio A lowering of the multi-residential municipal tax ratio from 1.8665 to the residential (1.0), would result in a decrease of 46 per cent in municipal taxation on multi-residential properties which would decrease the average 2016 Regional taxes per square foot to $0.60 (from the $1.11 weighted multi-residential average in Figure 16). This is substantially less than all other residential type properties in this analysis and represents only 44 per cent of $1.35 current paid by the average single family detached home per square foot.

Attachment #6 Residential & Multi-Residential Sector Assessment and Taxation Page 6 of 9
In addition, a lowering of the multi-residential municipal ratio to 1.0 would have the following impacts (based on 2016 taxation); an average increase in Regional taxation on the
• Region-wide average home of 1.63 per cent or $41;
• an increase on all other property classification of 1.63 per cent an average increase in Local taxation on the
• Region-wide average home of $31 or 0.39 percent which will vary significantly by local municipality with:
• The largest impact would be in Oshawa where a Region-wide average home will experience a local municipal tax increase of over 4 per cent or $101 (approximately 2.5 times the Region-wide average impact due to its higher concentration of multi-residential); and
• very little increase in the northern municipalities which have proportionately lower multi-residential assessment.
Combined, the Regional and local municipal taxes would rise on average:
• $72 or 1.5 per cent on the Region-wide average home; and
• $146 or 2.6 per cent on the Region-wide average home located in Oshawa due to the significantly higher impact of the ratio reduction on Oshawa Local levy.
Provincial Review of the Multi-Residential Class Once the effects of both the 2016 CVA reassessment and methodology changes for the multi-residential class became apparent, the Province announced in the 2016 Ontario Economic Outlook and Fiscal Review (November 2016) a review of municipal property taxation of multi-residential properties. As part of the review, the Province has committed to consulting with affected stakeholders including municipalities, renters and apartment building owners. It is believed that this review will begin early in 2017 and Finance staff from the Region have been asked to participate.
Provincial Freeze on Multi-Residential Class Municipal Taxation for Municipalities with Municipal Tax Ratio Greater than Two The Province, in the 2016 Ontario Economic Outlook and Fiscal Review, announced a freeze on total municipal taxation at 2016 levels (plus growth) for the multi-residential class as a whole in municipalities whose municipal tax ratio for the multi-residential class exceeds two. It anticipated that this restriction will apply to over a hundred municipalities including the following; the City of Toronto, Halton Region, Hamilton, Kingston, Niagara Region, Guelph, Northumberland County and Windsor. This restriction will not apply to the Region of Durham as its current multi-residential municipal tax ratio is 1.8665. Durham’s initial 1998 municipal tax ratio was 2.7 and was reduced by over 30 per cent from 2000 to 2007 as part of Durham’s Long-Term Property Taxation Strategy.
Attachment #6 Residential & Multi-Residential Sector Assessment and Taxation Page 7 of 9
The 2017 freeze on the aggregate multi-residential municipal taxation will still allow individual property 2016 CVA reassessment shifts to occur within the multi-residential class for the target municipalities (> 2.0 ratio). It will also result in a forced reduction of the 2017 multi-residential municipal tax ratios in these jurisdictions.
Recipients of Property Taxation Decreases from Multi-Residential Ratio Reductions An important consideration with respect to the Provincial review is who should be the primarily beneficiary of any municipal taxation reductions due to lowering of the municipal ratio. In general, property taxation reductions flow to the owners of property (landlords). However, based on the Provincial statements in its 2016 Economic Outlook, the Provinces’ main concern is the rent affordability for lower income tenants. There are current provisions in Provincial legislation that dictate when landlords are required to flow property rent reductions to tenants and these provisions must also be considered in any Provincial review of multi-residential property taxation policy.
Conversion of Multi-Residential to Condominium Considerations Multi-residential to condominium conversions are also a critical issue in the determination of the appropriate level for the municipal multi-residential ratio. A multi-residential to condo conversion is simply a change in the ownership structure, however the ability to sell individual units (rather than collectively) significantly increases the CVA of the overall property. Yet, this change in ownership structure does not alter the municipal servicing requirements of the property. This raises the question as to whether it is appropriate to have different municipal property taxes based purely on a difference in ownership structure. The 2008 residential study identified four almost identical properties that underwent condominium conversion and the municipal property taxation decreased on average 9 per cent. If a municipal multi-residential tax ratio was one (1.0), in 2008, these properties would have seen a 42 per cent decrease in municipal taxes for simply changing the ownership structure. Recently, in 2016, a 42 unit multi-residential property was converted to condominiums and the resulting Regional taxation on the aggregate units decreased only 1.5 per cent, suggesting that Durham’s current multi-residential ratio is set at an appropriate level.
Appeals Risk As discussed in the report, the 2008 CVA reassessment had significant increases in non-residential assessment which led to a large number of appeals filed at the ARB, increasing both municipal assessment at risk and property tax reductions. There is a concern that the new MPAC methodology on multi-residential properties will also result in a material increase in the number of these properties that will appeal their assessment and could lead to a further increase in assessment at risk and property tax reductions.

Attachment #6 Residential & Multi-Residential Sector Assessment and Taxation Page 8 of 9
Permanent Ratio Reductions Municipalities have the power to lower municipal tax ratios, but not to increase them if they are outside the Provincially defined range of fairness (which Durham Region is). Therefore, caution is advisable in the consideration of any ratio reductions as the reduction could be considered permanent, even if the circumstances change.
Conclusion Regional Council has reduced the multi-residential ratio since the initial implementation of CVA reforms in 1998. Durham’s initial 1998 municipal tax ratio was 2.7 and was reduced by over 30 per cent from 2000 to 2007 as part of Durham’s Long-Term Property Taxation Strategy as shown in Figure 17.
Figure 17 Durham Region Residential & Multi-Residential Classes Municipal Tax Ratio
2000-2017
As shown in the attachment, care must be taken when considering municipal ratio reductions or the implementation of new property tax classes. Such steps can result in significant taxation shifts at both the upper and lower municipal tiers and these steps could be considered permanent, as the Province does not allow municipal ratio increases. This report has recommended no multi-residential municipal ratio changes or the implementation of new classes for the Region of Durham for the following reasons: the Provincial review has not yet began and the outcomes are unknown; the new multi-residential methodology has not been tested at the ARB and it is
anticipated that there will be a significant increase in the number of appeals to the ARB with respect to the 2016 CVA of Durham Region multi-residential properties;
before implementing a change in taxation policy care must be taken to ensure that the beneficiary of any property tax reduction is both quantified and targeted;
0.0
0.5
1.0
1.5
2.0
2.5
3.0
2000
2001
2002
2003
2004
2005
2006
2007
2008
2009
2010
2011
2012
2013
2014
2015
2016
2017
Mun
icip
al T
ax R
atio
Residential Ratio = 1.0
Multi-Residential = 1.8665
Durham RegionResidential Municipal Taxation Ratios

Attachment #6 Residential & Multi-Residential Sector Assessment and Taxation Page 9 of 9
taxation policy, as much as possible, should not provide an incentive or disincentives to convert from one property ownership structure to another; and
local municipalities must be consulted on any changes and both fully informed and prepared of the potential impacts on local property tax revenues (which vary significantly across Durham’s local municipalities).

Attachment #7 Property Tax Comparisons Page 1 of 6
Attachment #7 Property Tax Comparisons
Direct Tax Rate Comparisons Direct comparisons of property tax rates are often made and lead to erroneous conclusions with respect to ‘high’ or ‘low’ tax jurisdictions as tax rates are only one factor in the calculation of property taxes.
Taxes = (Property Tax Rate) X (Property CVA)
Any comparison that does not consider the varying market value assessments (CVA) within each jurisdiction is meaningless. Further, taxation levels reflect the services and service levels provided by the municipalities. Municipalities do not provide identical services or service levels. A comparison of property tax rates alone does not consider these significant differences in expenditure levels.
Annual Municipal Comparison This attachment provides a comparison of residential and non-residential properties across comparable municipalities making adjustments for the varying market values and shows the degree to which the market values impact the comparison. This analysis uses property taxation amounts (Property Tax Rate X CVA) and therefore requires municipalities to have published property taxation rates. Since tax rates are set in the early spring for most municipalities, there is a one year time lag in this analysis. This report presents the comparisons based on 2016 property taxation and, therefore, the impacts of the 2016 CVA reassessment will not be reflected until the 2018 property tax study.

Attachment #7 Property Tax Comparisons Page 2 of 6
Residential Home Property Tax Comparison Figure 18 illustrates the significant differences in residential property tax rates across the comparator municipalities.
Figure 18 2016 Residential Property Tax Rates for Comparator Municipalities
Durham Region Average = 100
The average total property tax rate for the non-Durham municipal comparators used in this analysis is only 74 per cent of Durham Region’s average residential property tax rate. In an effort to reflect the significant impact that market values (assessment) has on property tax rates, Regional staff requested that MPAC provide the assessments for four Durham homes if they were located in other similar municipal jurisdictions. This facilitates a more appropriate comparison based on the estimated property tax dollars on identical homes in different jurisdictions, rather than tax rates which are inversely related to the assessment (the higher the assessment, the lower the property tax rate required to raise a dollar in property taxes). Figure 19 on the following page shows the average of the comparable assessments (CVA) provided by MPAC for the four sample homes. On average, the municipal comparators had 33 per cent higher assessments.
100
74
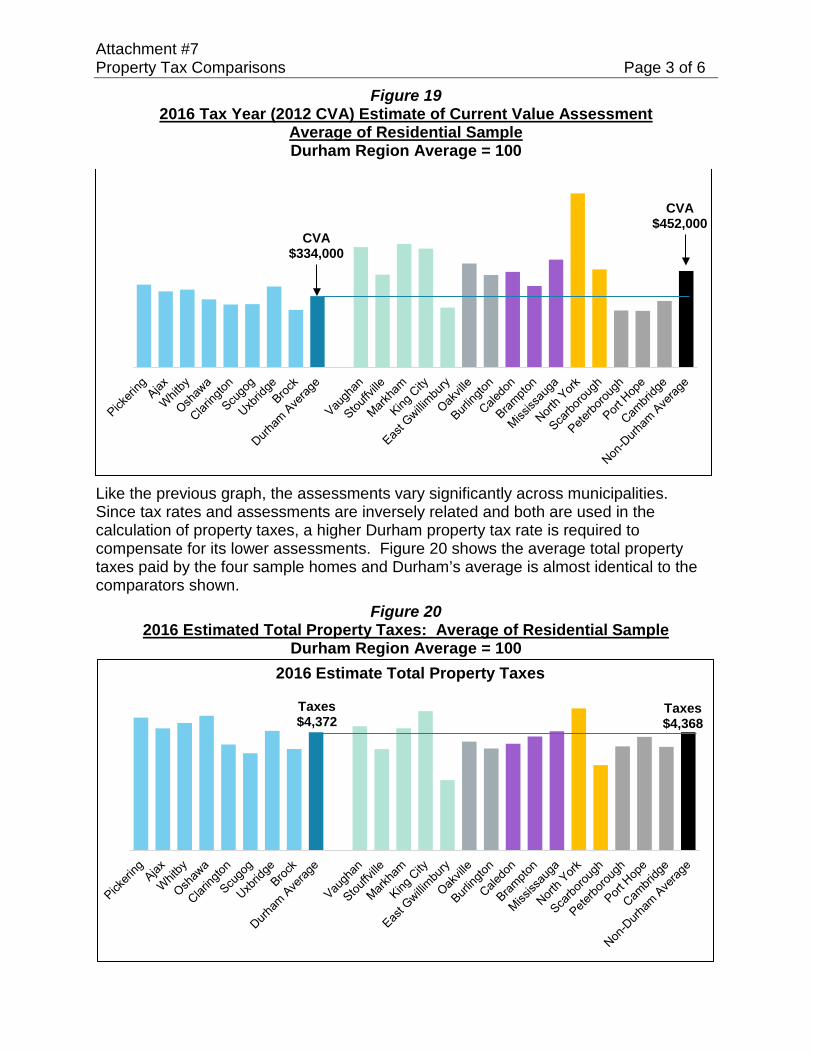
Attachment #7 Property Tax Comparisons Page 3 of 6
Figure 19 2016 Tax Year (2012 CVA) Estimate of Current Value Assessment
Average of Residential Sample Durham Region Average = 100
Like the previous graph, the assessments vary significantly across municipalities. Since tax rates and assessments are inversely related and both are used in the calculation of property taxes, a higher Durham property tax rate is required to compensate for its lower assessments. Figure 20 shows the average total property taxes paid by the four sample homes and Durham’s average is almost identical to the comparators shown.
Figure 20 2016 Estimated Total Property Taxes: Average of Residential Sample
Durham Region Average = 100
CVA$334,000
CVA$452,000
2016 Estimate Total Property Taxes
Taxes$4,372
Taxes$4,368

Attachment #7 Property Tax Comparisons Page 4 of 6
In summary (Figure 21), the comparable municipalities’ average residential tax rate was 26 per cent lower than Durham’s. However, assessment values in comparators were found to be 35 per cent higher. The resultant average property tax difference between Durham and the comparators is only $4 or 0.09 per cent.
Figure 21 Residential Home Sample Average: Tax Rate, Assessment and Taxation
As shown in this analysis, the 26 per cent gap in tax rates is reduced to almost zero in tax dollars when Durham’s lower market values (assessments) are considered in the Residential sample. This example only adjusted for the different relative CVA in the comparator properties. There are also differences in local assessment base compositions (i.e. residential vs. non-residential shares) and service/budget levels which should also be considered when comparing municipal jurisdictions.
Commercial Property Tax Comparison Figure 22 provides the commercial 2016 municipal tax rates for a large group of comparable Ontario municipalities.
Figure 22 2016 Commercial Average Municipal Tax Rates of Municipal Comparators
Durham Region Average = 100
100 100 10074
135
100
Tax Rate Assessment TaxesX =
Dur
ham
Av
erag
e
Dur
ham
Av
erag
e
Dur
ham
Av
erag
e
Com
para
ble
Mun
icip
aliti
es
Com
para
ble
Mun
icip
aliti
es
Com
para
ble
Mun
icip
aliti
es
Dur
ham
York
Peel
Hal
ton
Toro
nto
Cam
brid
ge
Port
Hop
e
Pete
rbor
ough
Kitc
hene
r
Wat
erlo
o C
ity
Nia
gara
Fal
ls
St C
athe
rines
Gue
lph
Bar
rie
Sudb
ury
Kin
gsto
n
2016 Commercial Average Municipal Tax Rates

Attachment #7 Property Tax Comparisons Page 5 of 6
Again, municipal commercial tax rates vary considerably, with Durham’s average commercial rates higher than the other 905 Regions, but more comparable to other similar Ontario Municipalities. However, similar to the residential properties in the previous section, comparing property tax rates cannot lead to any conclusion with respect to taxation levels since tax rates are inversely related to the market value of the properties (CVA). Similar to the previous residential home analysis which isolated the market value effect on a sample of identical residential properties, a non-residential sample study was also conducted for specific Durham commercial and industrial properties with the CVA data provided by MPAC. Due to the assessment complexity of these unique special purpose properties, the individual properties within the property sample show a high degree of variance. However, the findings were similar to the residential properties discussed in the previous section in that Durham’s lower assessment values account for a significant portion of the difference in taxation rates (services and service levels, assessment base composition and municipal tax ratios account for the remaining variances) Figure 23 on the following page shows the municipal property tax rates, estimated CVA and estimated property taxes (excluding education taxes) for the average of all 28 properties in the commercial sample assuming they were relocated in other municipalities. Similar to the residential sample comparison, adjusting for the market values of properties within different jurisdictions accounts for almost 45 per cent of the municipal differences in property tax rates.
Figure 23 2016 Commercial Property Sample Municipal Comparison
Durham Regional Average = 100
Dur
ham
Mar
kham
Vaug
han
Scar
boro
ugh
Nor
th Y
ork
Etob
icok
e
Bra
mpt
on
Mis
siss
auga
Non
-Dur
ham
Ave
rage
Tax Rate CVA Taxes
34%19%
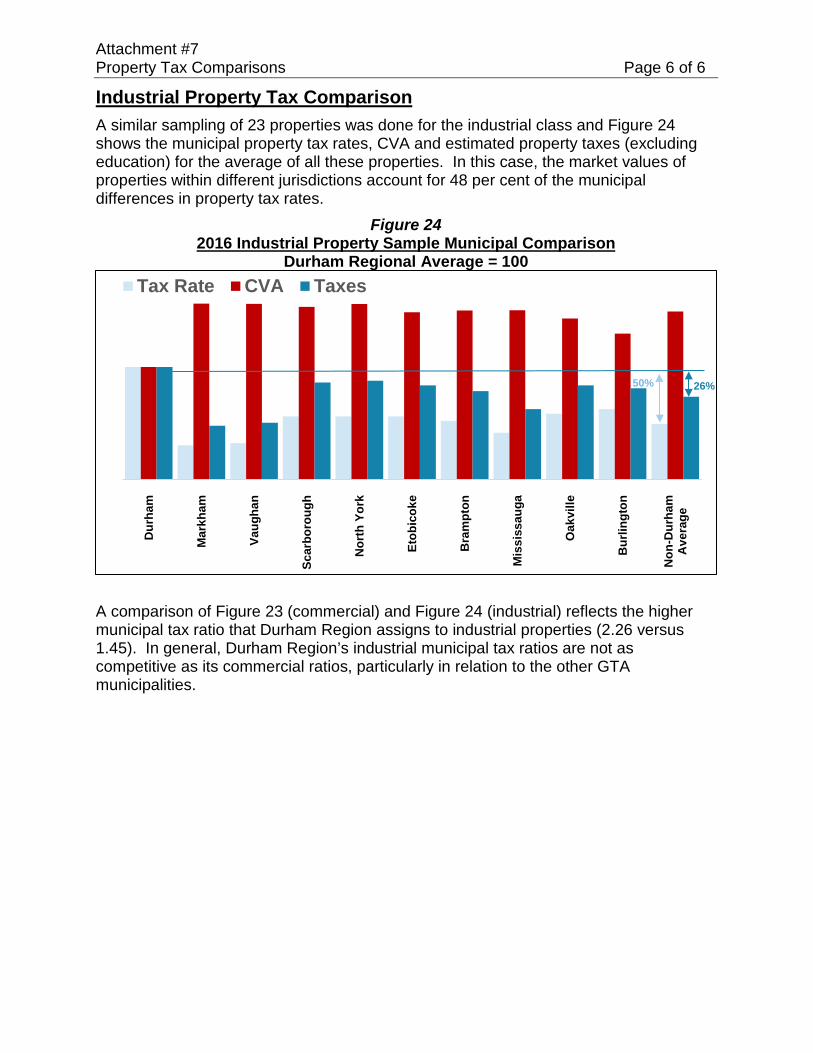
Attachment #7 Property Tax Comparisons Page 6 of 6
Industrial Property Tax Comparison A similar sampling of 23 properties was done for the industrial class and Figure 24 shows the municipal property tax rates, CVA and estimated property taxes (excluding education) for the average of all these properties. In this case, the market values of properties within different jurisdictions account for 48 per cent of the municipal differences in property tax rates.
Figure 24 2016 Industrial Property Sample Municipal Comparison
Durham Regional Average = 100
A comparison of Figure 23 (commercial) and Figure 24 (industrial) reflects the higher municipal tax ratio that Durham Region assigns to industrial properties (2.26 versus 1.45). In general, Durham Region’s industrial municipal tax ratios are not as competitive as its commercial ratios, particularly in relation to the other GTA municipalities.
Dur
ham
Mar
kham
Vaug
han
Scar
boro
ugh
Nor
th Y
ork
Etob
icok
e
Bra
mpt
on
Mis
siss
auga
Oak
ville
Bur
lingt
on
Non
-Dur
ham
Ave
rage
Tax Rate CVA Taxes
50% 26%