Embed Size (px)
Citation preview

University of Warwick institutional repository: http://go.warwick.ac.uk/wrap
This paper is made available online in accordance with publisher policies. Please scroll down to view the document itself. Please refer to the repository record for this item and our policy information available from the repository home page for further information.
To see the final version of this paper please visit the publisher’s website. Access to the published version may require a subscription.
Author(s): K. Beuermann, F. Euchner, K. Reinsch, S. Jordan, B. T. Gänsicke Article Title: Zeeman tomography of magnetic white dwarfs - IV. The complex field structure of the polars EF Eridani, BL Hydri and CP Tucanae Year of publication: 2007 Link to published article: http://dx.doi.org/10.1051/0004-6361:20066332 Publisher statement: © ESO 2007. Beuermann, K. et al. (2007). Zeeman tomography of magnetic white dwarfs - IV. The complex field structure of the polars EF Eridani, BL Hydri and CP Tucanae. Astronomy & Astrophysics, Vol.463 (2), pp.647-655
A&A 463, 647–655 (2007)DOI: 10.1051/0004-6361:20066332c© ESO 2007
Astronomy&
Astrophysics
Zeeman tomography of magnetic white dwarfs
IV. The complex field structure of the polars EF Eridani,BL Hydri and CP Tucanae�
K. Beuermann1, F. Euchner1 ,��, K. Reinsch1, S. Jordan2, and B. T. Gänsicke3
1 Institut für Astrophysik, Universität Göttingen, Friedrich-Hund-Platz 1, 37077 Göttingen, Germanye-mail: [email protected]
2 Astronomisches Rechen-Institut am ZAH, Mönchhofstr. 12–14, 69120 Heidelberg, Germanye-mail: [email protected]
3 Department of Physics, University of Warwick, Coventry CV4 7AL, UKe-mail: [email protected]
Received 1 September 2006 / Accepted 26 September 2006
ABSTRACT
Context. The magnetic fields of the accreting white dwarfs in magnetic cataclysmic variables (mCVs) determine the accretion ge-ometries, the emission properties, and the secular evolution of these objects.Aims. We determine the structure of the surface magnetic fields of the white dwarf primaries in magnetic CVs using Zeeman tomog-raphy.Methods. Our study is based on orbital-phase resolved optical flux and circular polarization spectra of the polars EF Eri, BL Hyi,and CP Tuc obtained with FORS1 at the ESO VLT. An evolutionary algorithm is used to synthesize best fits to these spectra from anextensive database of pre-computed Zeeman spectra. The general approach has been described in previous papers of this series.Results. The results achieved with simple geometries as centered or offset dipoles are not satisfactory. Significantly improved fits areobtained for multipole expansions that are truncated at degree lmax = 3 or 5 and include all tesseral and sectoral components with0 ≤ m ≤ l. The most frequent field strengths of 13, 18, and 10 MG for EF Eri, BL Hyi, and CP Tuc, and the ranges of field strengthcovered are similar for the dipole and multipole models, but only the latter provide access to accreting matter at the right locationson the white dwarf. The results suggest that the field geometries of the white dwarfs in short-period mCVs are quite complex, withstrong contributions from multipoles higher than the dipole in spite of a typical age of the white dwarfs in CVs in excess of 1 Gyr.Conclusions. It is feasible to derive the surface field structure of an accreting white dwarf from phase-resolved low-state circularspectropolarimetry of sufficiently high signal-to-noise ratio. The fact that independent information is available on the strength anddirection of the field in the accretion spot from high-state observations helps in unraveling the global field structure.
Key words. stars: white dwarfs – stars: magnetic fields – stars: atmospheres – polarization
1. Introduction
The subclass of magnetic cataclysmic variables (mCVs) termedpolars (Krzeminski & Serkowski 1977) contains an accretingwhite dwarf that emits circularly polarized cyclotron radiationfrom an accretion region standing off the photosphere, often re-ferred to as an accretion spot. The harmonic structure of the cy-clotron radiation allows a straightforward measurement of themagnetic field and an estimate of the field direction in the spot.Photospheric absorption lines are heavily veiled by the intensecyclotron emission in the high (accreting) state. The field struc-ture over the surface of the white dwarf becomes accessible tomeasurement only in low states of discontinued accretion via theprofiles of the photospheric Zeeman-broadened Balmer absorp-tion lines, an approach that is also applicable to non-accreting
� Based on observations collected at the European SouthernObservatory, Paranal, Chile, under programme IDs 63.P-0003(A),64.P-0150(C), and 66.D-0128(B).�� Present address: Swiss Seismological Service, ETH Hönggerberg,8093 Zürich, Switzerland.
isolated white dwarfs. Different from the latter, accreting sys-tems offer the advantage that the strength and direction of thefield in the accretion spot and its approximate location on thesurface as determined from high-state observations represent afixed point for the field structure. For simplicity it was oftenassumed that the field is quasi-dipolar, although accreting sys-tems with two accretion spots separated by much less than 180◦supported suspicions of a more complex structure (Meggitt &Wickramasinghe 1989; Piirola et al. 1987b; see Wickramasinghe& Ferrario 2000 for a review).
We have set out on a program to obtain a more complete pic-ture of the surface field structure of magnetic white dwarfs usingan approach dubbed Zeeman tomography (Euchner et al. 2002).The field geometries of two isolated white dwarfs, HE 1045-0908 and PG 1015+014 (Euchner et al. 2005, 2006), provedto be significantly more complex than simple centered or off-set dipoles. In this paper, we present first results of the Zeemantomography of three polars observed in their low states, EF Eri,BL Hyi, and CP Tuc, and find that they, too, have rather complexfield geometries.
Article published by EDP Sciences and available at http://www.aanda.org or http://dx.doi.org/10.1051/0004-6361:20066332
648 K. Beuermann et al.: Magnetic field structure of white dwarfs in CVs
Table 1. Dates of the spectropolarimetric observations obtained at theESO VLT, exposure times, and number of exposures.
Object Date UT texp (s) NumberEF Eri 2000/11/22 01:02–03:03 360 14
04:24–05:14 360 6BL Hyi 1999/12/04 04:25–06:29 360 16CP Tuc 1999/06/04 08:07–08:44 480 4
09:35–10:31 480 6
2. Observations and data analysis
We have obtained spin phase-resolved circular spectropolarime-try of EF Eri, BL Hyi, and CP Tuc in their low states. Thesestars belong to the short-period variety with orbital periods of81.0 min (EF Eri), 113.6 min (BL Hyi), and 89.0 min (CP Tuc).The secondary star is a late M-star in BL Hyi. It is substellar inEF Eri (Beuermann et al. 2000; Harrison et al. 2004) and possi-bly in CP Tuc, too. Full orbital coverage was achieved for EF Eriand BL Hyi, but for technical reasons only half of the orbital pe-riod was covered for CP Tuc.
The data were collected at the ESO VLT using thefocal reducer spectrograph FORS1. The instrument wasoperated in spectropolarimetric (PMOS) mode, with theGRIS_300V+10 grism and an order separation filter GG 375,yielding a usable wavelength range of 3750–8450 Å. With a slitwidth of 1′′, the FWHM spectral resolution was 13 Å at 5500 Å.A signal-to-noise ratio of typically S/N � 100 was reached forthe individual flux spectra. FORS1 contains a Wollaston prismfor beam separation and two superachromatic phase retarderplate mosaics. Since both plates cannot be used simultaneously,only the circular polarization has been recorded using the quar-ter wave plate. Spectra of the target star and comparison stars inthe field have been obtained simultaneously by using the multi-object spectroscopy mode of FORS1. This allows us to deriveindividual correction functions for the atmospheric absorptionlosses in the target spectra and to check for remnant instrumen-tal polarization. Table 1 contains a log of the observations.
The observational data have been reduced according tostandard procedures (bias, flat field, night sky subtraction,wavelength calibration, atmospheric extinction, flux calibration)using the context MOS of the ESO MIDAS package. To elimi-nate observational biases caused by Stokes parameter crosstalk,the wavelength-dependent degree of circular polarization V/Ihas been computed from two consecutive exposures recordedwith the quarter wave retarder plate rotated by±45◦. The circularpolarization was then obtained as the average of two consecutivesets of spectra in the ordinary and the extraordinary beams (seeEuchner et al. 2005, for details).
The three stars were in their low states with magnitudes es-timated from the spectrophotometry of V ∼ 18 for EF Eri andBL Hyi and V ∼ 19 for CP Tuc. CCD photometry of BL Hyi inthe same night gave V = 17.45. In the case of BL Hyi, the result-ing spectra were corrected for the contribution by the secondarystar using a spectrum of the dM5.5 star Gl 473 as a template.No trace of the secondary star was seen in the other two objects.Seeing variations and a loss of blue flux in the first two hours ofthe EF Eri run and in the last three spectra of BL Hyi affectedthe detection of orbital modulations. The orbital modulation ofEF Eri seen in the remainder of the data is consistent with thatreported by Szkody et al. (2006, and references therein). No sub-stantial orbital modulation was detected in the data of BL Hyiand CP Tuc.
To facilitate analysis of the Zeeman absorption features,the continua of the observed spectra were normalized by thefollowing procedure, which minimizes the differences betweenobserved and theoretical continua, and also corrects for the men-tioned loss of blue light. In a first step, a mean effective tem-perature of each object was determined by fitting a magneticmodel spectrum to the quasi-continuum of the mean of the ob-served spectra unaffected by light loss. In a second step, thecontinua of all observed flux spectra were sampled in some20 narrow fiducial wavelength intervals, which avoid the knownZeeman features and the emission lines, and adjusted to thebest-fitting model spectrum using low-order polynomials (seeEuchner et al. 2005, for more details). This approach removesthe time variability in the flux continua, but leaves the equiva-lent widths of the Zeeman features largely unaffected. The meaneffective temperature is Teff = 11 000 K for EF Eri, 12000 K forBL Hyi, and 10 000 K for CP Tuc, with an estimated accuracyof about ∼1500 K. Using this mean temperature in the tomo-graphic analysis affects the theoretical Zeeman absorption fea-tures only minimally, because their equivalent width reaches amaximum around 11 000 K and varies little with effective tem-perature around the maximum. In passing we note that our meaneffective temperatures confirm the rather low temperatures of thewhite dwarfs in polars (Araujo-Betancor et al. 2005, and refer-ences therein). For the tomographic analysis, the flux and polar-ization spectra were collected into n = 4 phase bins for EF Eriand n = 5 for BL Hyi about equally spaced to cover the wholeorbit. The spectra from the half orbit of CP Tuc were gatheredinto three bins.
3. General approach
We determine the global surface magnetic field structure us-ing the Zeeman tomographic procedure described by Euchneret al. (2002, 2005, 2006). The process involves the inversionof the one-dimensional time series of rotational phase-resolvedZeeman flux and circular polarization spectra obtained in a non-accreting (low) state into a two-dimensional field distributionover the surface of the star. Because of the finite signal-to-noiseratio, this inversion problem may allow more than one solu-tion within the observational uncertainties (for a discussion seeEuchner et al. 2002). This ambiguity arises from the fact thatdifferent models may have similar frequency distributions of thefield strength B and the angle ψ between field vector and lineof sight and, hence, yield similar Zeeman spectra, but differ inthe arrangement of the field over the surface. In this situation,it is advantageous to use the field vector in the accretion spotas deduced from cyclotron spectroscopy and broad band circularpolarimetry in a high state as a fixpoint and effective constrainton the tomographic procedure. In the present paper, we have notincluded such a constraint in a formal way, but use it to selectbetween solutions of the tomographic process obtained for dif-ferent assumptions on the field geometry. To this end, we followthe surface field outward and determine the maximal radial dis-tance reached by each field line. Field lines extending to morethan Rmax = 10 RWD are considered ’open’. The accretion streamcan couple to field lines which reach out sufficiently far, with theactual radius at which coupling can occur depending on the rampressure of the accreting matter and the local field strength. Therequirement that field lines that originate at a specific point at thesurface reach out to more than several white dwarf radii can ef-fectively discriminate between different field models. To be sure,a model that provides a good fit to the Zeeman spectra and pos-sesses field lines reaching far out at the required position may not
K. Beuermann et al.: Magnetic field structure of white dwarfs in CVs 649
be the correct model, but is as close to reality as we can presentlyget. As a further caveat, note that the actual coupling conditionshave not been investigated and part of the far-reaching field linesmay not be accessible to the stream. Consequently, only a frac-tion of the long ribbon-like structures of far-reaching field linesthat appear in some models may act as foot points of accret-ing field lines. Nevertheless, with this information included, theanalysis of accreting white dwarfs may yield more definite re-sults than that of isolated white dwarfs.
As in our previous papers on isolated white dwarfs (Euchneret al. 2005, 2006), we fit the data with either a hybrid model ora multipole expansion truncated at a maximum degree l = lmaxincluding all lmax(lmax+2) components with m = 0 . . . l . As a hy-brid model, we consider the superposition of zonal (m = 0) mul-tipole components that are allowed to be inclined to each otherand to be offset from the center of the white dwarf. Examplesare, e.g., an offset dipole or the sum of dipole and quadrupoleetc. Such combinations can easily be visualized given the polarfield strengths and orientations of the individual components. Inthe case of the multipole expansion, on the other hand, the pa-rameters of the basic dipole are easily interpreted, but the struc-ture created by the higher multipole components is more difficultto judge (Euchner et al. 2002). The hybrid models correspondto special situations not encountered in truncated multipole ex-pansions of low lmax, and we lack information from dynamo the-ory on the feasibility of such models. For the sake of economyand simplicity of presentation, we present results for the offsetdipole as a simple and popular model and for the full multipoleexpansion for either lmax = 3 or 5, with occasional commentson other models (a multipole expansion up to lmax = 4 was nottested). We use two graphic forms to present the results: (i) the“B − ψ diagrams” that depict the frequency distribution of fieldvectors over the surface of the star at a given orbital phase in theB–cosψ plane; and (ii) actual images of the field distribution.The latter include (a) the field strength B, (b) cosψ = Bl/B withBl the field component along the line of sight, and (c) an im-age of the maximum radial distance to which a field line extendsthat originates from a certain location on the star. We subjectedthe flux and polarization spectra at all orbital phases simulta-neously to the tomographic analysis, weighing all wavelengthsequally except for narrow intervals around the Balmer emissionlines. An improved fit can be obtained by restricting it to theset of flux and polarization spectra at a single phase, but if themodel parameters deduced for different phases disagree, there isno unique solution (Euchner et al. 2006).
4. Results
The models are fitted to the average flux and circular polariza-tion spectra in four orbital phase bins for EF Eri, five bins forBL Hyi, and three bins for the half orbit of CP Tuc. The orbitalphase conventions used in this paper are the dip ephemeris forEF Eri (Piirola et al. 1987a), slightly updated by including theROSAT PSPC dip timings from July 19901 (Beuermann et al.1991), the ephemeris for the start of the bright phase for BL Hyi(Wolff et al. 1999), and the dip ephemeris for CP Tuc (Ramsayet al. 1999). In our previous papers on the field structure ofsingle white dwarfs, we considered the inclination of the lineof sight relative to the rotation axis as a free parameter of thefit. For the mCVs, however, independent and better informationon i is available from the light curve and broad band polarization
1 The updated EF Eri dip ephemeris with 90% confidence errors isT0 = HJD 244 3944.9518(6) + 0.056265949(14) E.
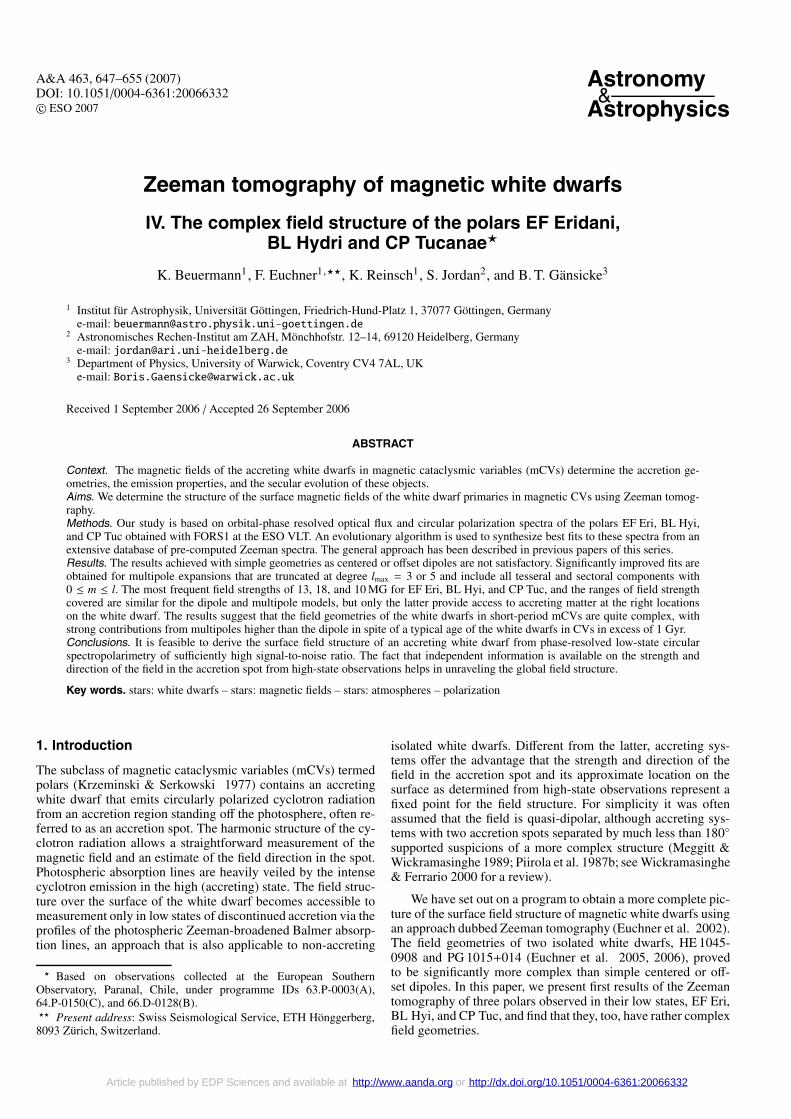
Fig. 1. Flux spectra (top) and circular polarization spectra (bottom) ofEF Eri at two selected orbital phases and for two field models. Model Ais an offset dipole and model B a multipole expansion truncated atlmax = 5. The data are shown as grey curves, the best-fit models fromthe Zeeman tomographic analysis are overlaid as solid black curves.The order of orbital phases and field models for the polarization spectrais the same as for the flux spectra, i.e., the bottom spectrum and thirdfrom the bottom are for the multipole expansion, the other two for theoffset dipole. The ordinate scales refer to the bottom spectrum, the otherones are arbitrarily shifted upwards.
studies in their high states. We use i = 55◦ for EF Eri (Piirolaet al. 1987b; Achilleos et al. 1992) and i = 40◦ for CP Tuc(Thomas & Reinsch 1996; Ramsay et al. 1999). For BL Hyi,we use i = 32◦ (Schwope et al. 1995).
Our Zeeman tomography uses the observed flux and circularpolarization spectra of all orbital phases. For conciseness, how-ever, we show the spectra only for two selected phases and theglobes representing the field structure only for φ � φ0 whenthe main accretion spot most directly faces the observer, i.e.,φ0 � 0.10 for EF Eri, φ0 � 0.20 for BL Hyi, and probablyφ0 � 0.50 for CP Tuc. Our phases closest to φ0 are φ = 0.14for EF Eri, φ = 0.19 for BL Hyi, and φ = 0.43 for CP Tuc.
Figures 1 and 2 show the flux and circular polarization spec-tra (grey curves) for the value of φ closest to φ0 and for an-other phase selected to point out differences in the Zeeman spec-tra. The spectral data in Figs. 1 and 2 are shown twice alongwith the best-fit theoretical spectra for two models, the shifteddipole (model A) and the multipole expansion with lmax = 3 or5 (model B). The ordinate scales refer to the bottom spectra, theother ones being shifted upwards by arbitrary amounts. Since thefit to Hα σ+ always mimics that of theσ− feature, we have omit-ted the former in the figures to avoid excessive compression inwavelength. That feature is included in the fits, however.
We judged the fits by eye and by a formal global χ2 forthe flux and polarization spectra at all phases combined andwith all wavelengths weighted equally. As discussed by Euchneret al. (2005), the formal reduced χ2
ν are large because the ad-justment of the observed continua to the model continua is notperfect and the standard deviations used in calculating χ2 ac-count for the statistical noise in the data but not for the remaining
650 K. Beuermann et al.: Magnetic field structure of white dwarfs in CVs
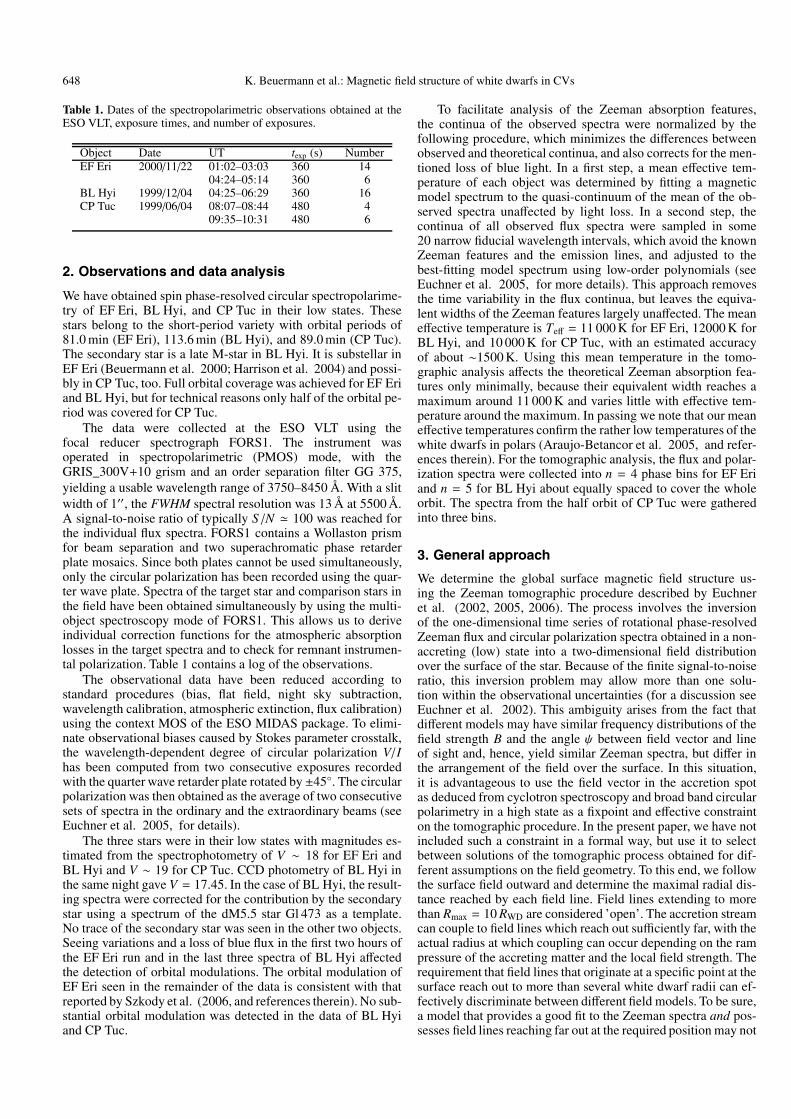
Fig. 2. As Fig. 1, but for BL Hyi and CP Tuc. Model A is an offset dipole and model B a multipole expansion truncated at lmax = 3.
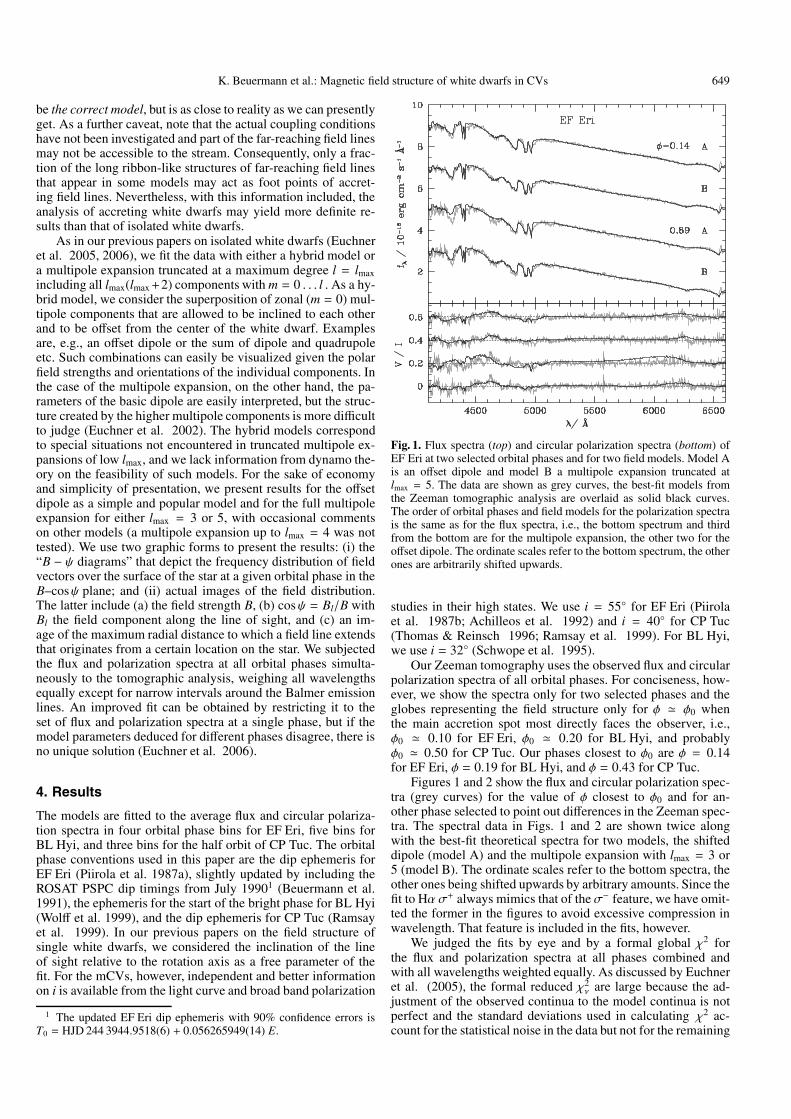
Table 2. Best-fit magnetic parameters for the truncated multipole expansions up to degree lmax = 5 for EF Eri and up to lmax = 3 for BL Hyi andCP Tuc. The coefficients gm
l and hml are in MG. The tilt angle of the multipole axis relative to the rotational axis is 74◦, 32◦, and 23◦ for EF Eri,
BL Hyi, and CP Tuc, respectively.
EF Eri BL Hyi CP Tucm l = 1 2 3 4 5 l = 1 2 3 l = 1 2 3
0 g0l −5.9 4.2 4.1 −1.9 −0.3 −5.2 −12.0 5.8 3.5 14.6 −1.6
1 g1l 6.1 −4.8 1.2 1.0 −0.4 −8.1 15.8 −2.5 −15.5 8.5 −2.8
h1l 0.7 12.7 −1.2 0.2 4.9 0.2 12.8 6.6 8.1 −13.0 4.9
2 g2l 10.8 −3.9 −4.0 −1.6 12.5 −2.7 −3.7 −1.5
h2l −1.0 5.4 −5.8 2.1 −10.4 −2.1 0.3 −1.7
3 g3l 7.7 −2.0 −0.9 −2.5 −4.9
h3l 1.8 −5.1 −0.6 8.6 0.0
4 g4l 2.4 −0.2
h4l 1.5 3.7
5 g5l −1.2
h5l 3.2
systematic differences between model and data. We quote theglobal χ2
ν values that serve as a guideline, but also judge themerits and failures of individual models by eye and describethem in words. Not surprisingly, significantly reduced χ2
ν are ob-tained by excluding the poorly fitting spectral regions from thefit. However, since these regions differ from object to object, wehave refrained from including such restrictions in a general way.We have assured ourselves, however, that the inclusion of thepoorly fitting regions does not affect the selection of the best-fitting model as the one with the lowest χ2
ν .
For all three objects, the dipole, even after allowing for anoff-center shift in the three spatial coordinates, does not providea good fit, whereas the multipole expansions fare decidedly bet-ter. While it is possible that substantially more complicated hy-brid models might be successful, we are limited in the number ofmodels that could be tested by the slow convergence propertiesof our code (see Sect. 5). We quote some of the parameters of thedipole models in the text and list the coefficients gm
l and hml of the
best-fit multipole expansions (Euchner et al. 2006) in Table 2.These coefficients are given in MG, and, although such modelsare difficult to visualize, the numbers allow some insight into the
field structure: the three l = 1 coefficients combine to define thedipole, which is allowed to be inclined relative to the multipoleaxis; the l,m = 2, 0 coefficient describes the quadrupole alignedalong the multipole axis and the following m = 0 coefficientsthe octupole and higher multipole zonal components; the m � 0(tesseral) components are modulated in azimuth in addition tozenith angle.
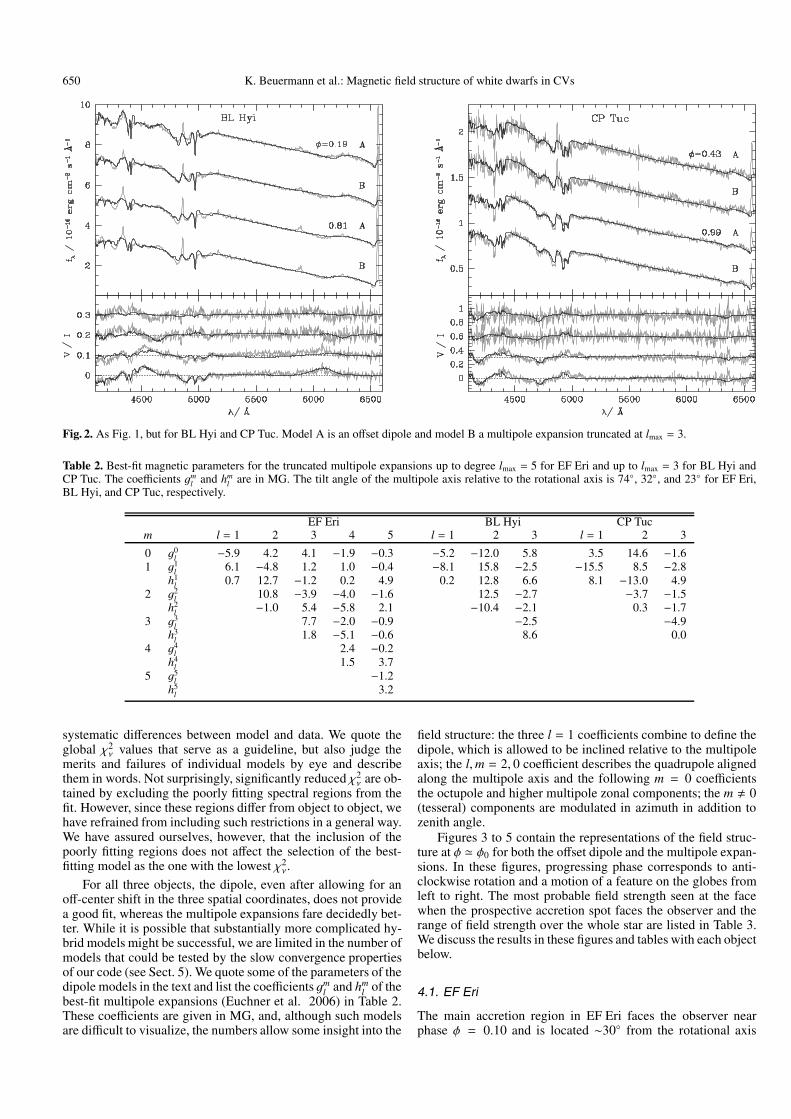
Figures 3 to 5 contain the representations of the field struc-ture at φ � φ0 for both the offset dipole and the multipole expan-sions. In these figures, progressing phase corresponds to anti-clockwise rotation and a motion of a feature on the globes fromleft to right. The most probable field strength seen at the facewhen the prospective accretion spot faces the observer and therange of field strength over the whole star are listed in Table 3.We discuss the results in these figures and tables with each objectbelow.
4.1. EF Eri
The main accretion region in EF Eri faces the observer nearphase φ = 0.10 and is located ∼30◦ from the rotational axis
K. Beuermann et al.: Magnetic field structure of white dwarfs in CVs 651
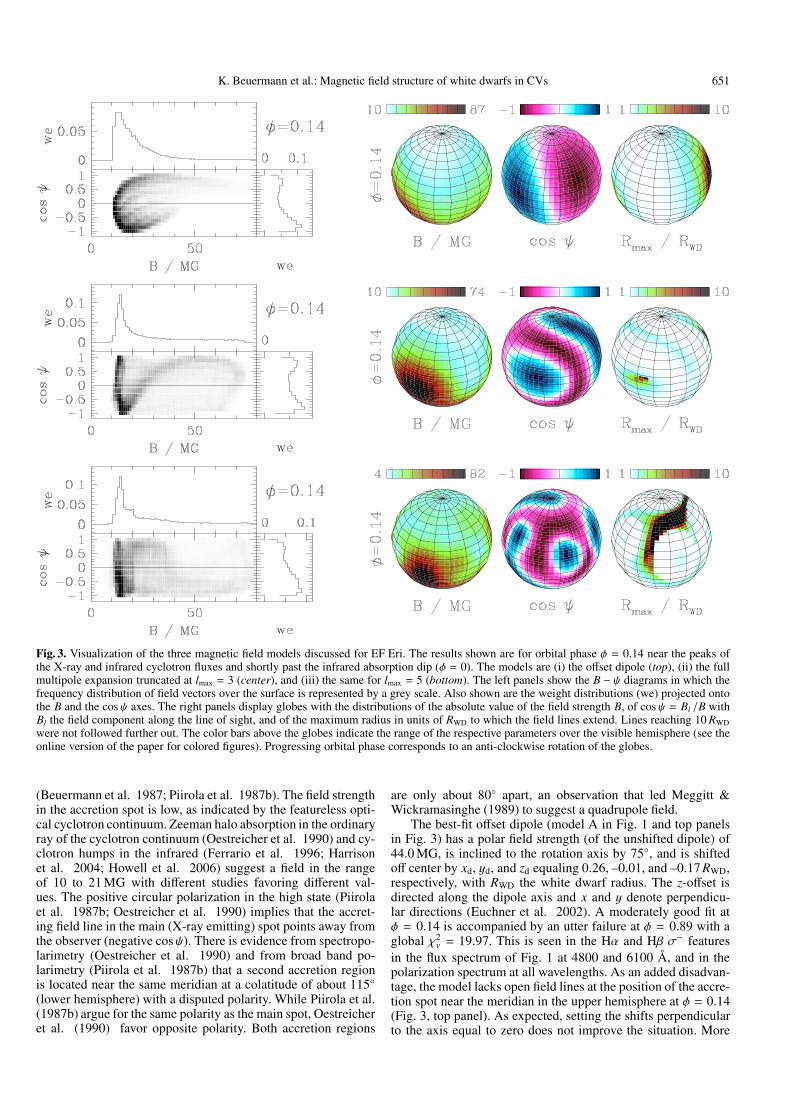
Fig. 3. Visualization of the three magnetic field models discussed for EF Eri. The results shown are for orbital phase φ = 0.14 near the peaks ofthe X-ray and infrared cyclotron fluxes and shortly past the infrared absorption dip (φ = 0). The models are (i) the offset dipole (top), (ii) the fullmultipole expansion truncated at lmax = 3 (center), and (iii) the same for lmax = 5 (bottom). The left panels show the B − ψ diagrams in which thefrequency distribution of field vectors over the surface is represented by a grey scale. Also shown are the weight distributions (we) projected ontothe B and the cosψ axes. The right panels display globes with the distributions of the absolute value of the field strength B, of cosψ = Bl /B withBl the field component along the line of sight, and of the maximum radius in units of RWD to which the field lines extend. Lines reaching 10 RWD
were not followed further out. The color bars above the globes indicate the range of the respective parameters over the visible hemisphere (see theonline version of the paper for colored figures). Progressing orbital phase corresponds to an anti-clockwise rotation of the globes.
(Beuermann et al. 1987; Piirola et al. 1987b). The field strengthin the accretion spot is low, as indicated by the featureless opti-cal cyclotron continuum. Zeeman halo absorption in the ordinaryray of the cyclotron continuum (Oestreicher et al. 1990) and cy-clotron humps in the infrared (Ferrario et al. 1996; Harrisonet al. 2004; Howell et al. 2006) suggest a field in the rangeof 10 to 21 MG with different studies favoring different val-ues. The positive circular polarization in the high state (Piirolaet al. 1987b; Oestreicher et al. 1990) implies that the accret-ing field line in the main (X-ray emitting) spot points away fromthe observer (negative cosψ). There is evidence from spectropo-larimetry (Oestreicher et al. 1990) and from broad band po-larimetry (Piirola et al. 1987b) that a second accretion regionis located near the same meridian at a colatitude of about 115◦(lower hemisphere) with a disputed polarity. While Piirola et al.(1987b) argue for the same polarity as the main spot, Oestreicheret al. (1990) favor opposite polarity. Both accretion regions
are only about 80◦ apart, an observation that led Meggitt &Wickramasinghe (1989) to suggest a quadrupole field.
The best-fit offset dipole (model A in Fig. 1 and top panelsin Fig. 3) has a polar field strength (of the unshifted dipole) of44.0 MG, is inclined to the rotation axis by 75◦, and is shiftedoff center by xd, yd, and zd equaling 0.26, –0.01, and –0.17 RWD,respectively, with RWD the white dwarf radius. The z-offset isdirected along the dipole axis and x and y denote perpendicu-lar directions (Euchner et al. 2002). A moderately good fit atφ = 0.14 is accompanied by an utter failure at φ = 0.89 with aglobal χ2
ν = 19.97. This is seen in the Hα and Hβ σ− featuresin the flux spectrum of Fig. 1 at 4800 and 6100 Å, and in thepolarization spectrum at all wavelengths. As an added disadvan-tage, the model lacks open field lines at the position of the accre-tion spot near the meridian in the upper hemisphere at φ = 0.14(Fig. 3, top panel). As expected, setting the shifts perpendicularto the axis equal to zero does not improve the situation. More
652 K. Beuermann et al.: Magnetic field structure of white dwarfs in CVs
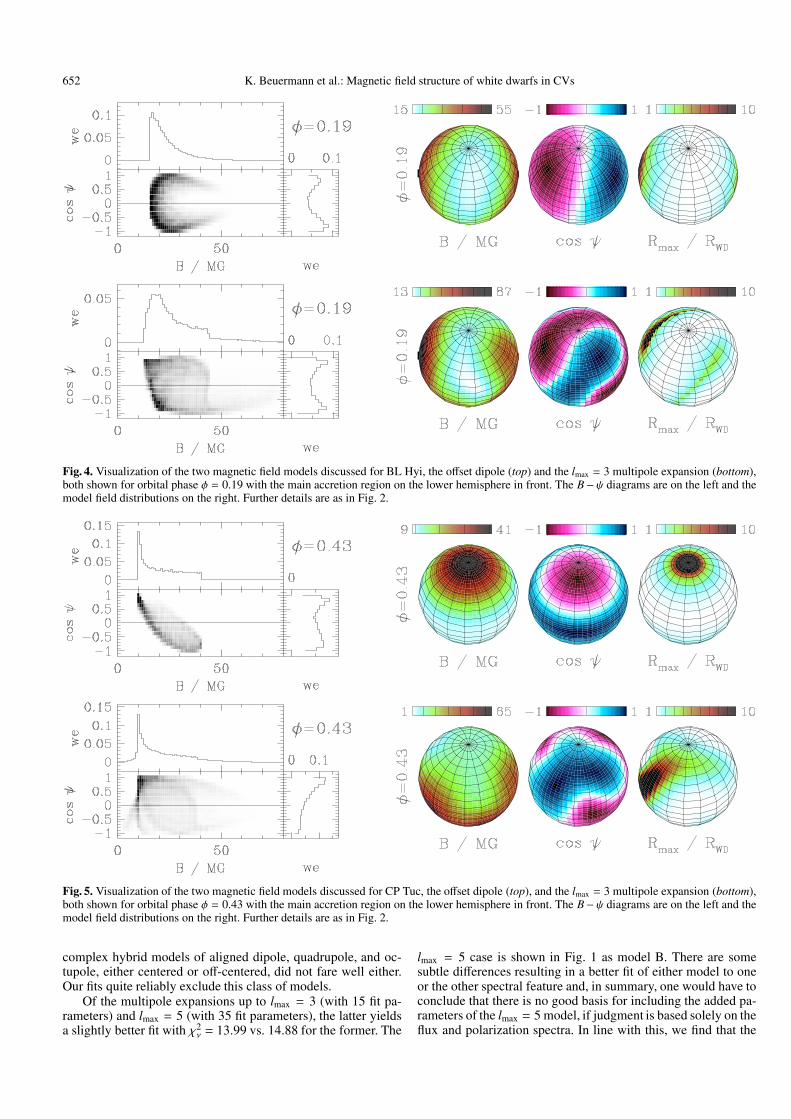
Fig. 4. Visualization of the two magnetic field models discussed for BL Hyi, the offset dipole (top) and the lmax = 3 multipole expansion (bottom),both shown for orbital phase φ = 0.19 with the main accretion region on the lower hemisphere in front. The B− ψ diagrams are on the left and themodel field distributions on the right. Further details are as in Fig. 2.
Fig. 5. Visualization of the two magnetic field models discussed for CP Tuc, the offset dipole (top), and the lmax = 3 multipole expansion (bottom),both shown for orbital phase φ = 0.43 with the main accretion region on the lower hemisphere in front. The B− ψ diagrams are on the left and themodel field distributions on the right. Further details are as in Fig. 2.
complex hybrid models of aligned dipole, quadrupole, and oc-tupole, either centered or off-centered, did not fare well either.Our fits quite reliably exclude this class of models.
Of the multipole expansions up to lmax = 3 (with 15 fit pa-rameters) and lmax = 5 (with 35 fit parameters), the latter yieldsa slightly better fit with χ2
ν = 13.99 vs. 14.88 for the former. The
lmax = 5 case is shown in Fig. 1 as model B. There are somesubtle differences resulting in a better fit of either model to oneor the other spectral feature and, in summary, one would have toconclude that there is no good basis for including the added pa-rameters of the lmax = 5 model, if judgment is based solely on theflux and polarization spectra. In line with this, we find that the
K. Beuermann et al.: Magnetic field structure of white dwarfs in CVs 653
Table 3. Dipole field strength Bdip, most frequent photospheric fieldstrength Bprob, and ranges Bmin to Bmax in the models of EF Eri, BL Hyi,and CP Tuc in MG. The former refers to the orbital phase when the ac-cretion spot faces the observer (Fig. 3–5), the latter to all orbital phasescombined.
Object Model Bdip Bprob Bmin Bmax
EF Eri offset dipole 44.0 12 10 110lmax = 5 multipole 13 4 111
BL Hyi offset dipole 59.5 17 15 88lmax = 3 multipole 18 13 110
CP Tuc offset dipole 19.8 10 9 41lmax = 3 multipole 10 1 69
B−ψ diagrams in Fig. 3 (center panel for lmax = 3; bottom panelfor lmax = 5) are similar in the predominance of field strengths of10–15 MG, but differ in the extensions to higher field strengths.The decisive difference of the two multipole expansions is de-picted in the rightmost globes in Fig. 3. The lmax = 3 modelpossesses only a small spot from which field lines reach far out.Such field lines, whether they close within the Roche lobe ofthe white dwarf or not, are needed for the accretion stream tobe guided towards the white dwarf. The field in this tiny spot isdirected outward (cosψ > 0), however, leading to negative po-larization of the cyclotron emission from this potential accretionspot, while the observed polarization is positive (cosψ < 0). Thelmax = 5 model, for comparison, displays a large arc-like regionof ingoing field lines, which also covers the expected locationof the primary accretion region ∼30◦ from the rotation axis andfacing the observer shortly past φ = 0 (Beuermann et al. 1987;Piirola et al. 1987b). This ribbon of open ingoing field lineswith cosψ < 0 winds around a region of quadrupole-like low-lying magnetic arcs in the lower right quadrant at φ = 0.142. Thedecisive point in favor of the lmax = 5 truncated multipole expan-sion among the models studied is the correct polarity of the openfield lines with cosψ < 0 and a positive sign of the resulting cir-cular polarization of the high-state cyclotron emission from themain accretion spot.
As seen from Table 2, the dipole component of the multi-pole expansion is relatively weak, with a polar field strength of8.5 MG obtained by squaring the three dipole coefficients. Thestrongest components are azimuthally modulated quadrupole-like ones. All individual l = 3–5 coefficients are smaller than10 MG, but their combined effect is significant in shaping thefield structure (Fig. 3), which is not that of an m = 0 quadrupole.Hence, from the present study, we conclude that the field struc-ture of EF Eri is substantially more complex than that of a cen-tered or offset dipole or quadrupole and may be even morecomplex than suggested by the present best fit.
4.2. BL Hyi
BL Hyi is another polar that displays a complex accretion ge-ometry, usually referred to as “one-pole” and “two-pole” ac-cretion in states of low and high accretion rates, respectively(Beuermann & Schwope 1989). The main hard X-ray and cy-clotron emitting accretion spot is located in the lower hemi-sphere of the white dwarf and is visible only for part of the orbit.Its appearance at the limb of the white dwarf defines photomet-ric phase φ = 0. It slowly disappears some 0.40 phase units later(Piirola et al. 1987a). The second emission region in the upper
2 The interested reader may look up Fig. 7 of Schwope et al. (1995),which shows the field structure of such a region at its upper pole.
hemisphere facing the observer emits in the soft X-ray and EUVregime and is visible over much of the orbital period (Schwope& Beuermann 1993; Szkody et al. 1997). The sign of the circu-lar polarization of the cyclotron emission from the main (second)pole is negative (positive) implying positive (negative) cosψ(Cropper 1987; Bailey 1988; Schwope & Beuermann 1989).The dominant photospheric field strength is 22 MG, but the pres-ence of significantly higher fields is inferred from Zeeman spec-troscopy. A field of only 12 MG was at times detected by HαZeeman absorption in the cyclotron continuum emission of themain accretion spot (Schwope et al. 1995), but the feature mayhave originated at some height above the white dwarf surface.
Our present data cover the whole binary orbit in five aboutequally spaced intervals. The best-fit offset dipole model featuresa polar field strength of 59.5 MG, an inclination against the rota-tion axis of 80◦, and offsets of –0.18, 0.15, and –0.03 RWD in x, y,and z. As in the case of EF Eri, the offset dipole model does notfare well. We find χ2
ν = 200.3, which is so large because of thesmall standard deviation in the low-noise observed spectrum andobviously poor fits in a few places. The model fails to reproducethe Hα σ− feature in the flux spectra near 6000 Å and also muchof the detail in the circular polarization spectra over the entirewavelength range (Fig. 2, left panel). The fit to the polarizationdata is particularly poor at φ = 0.40 (not shown). We discard theoffset dipole model because it provides a comparatively poor fitand because of the lack of open field lines in both the upper andthe lower hemisphere at φ = 0.19 at positions that might corre-spond to the main and the secondary accretion regions (Fig. 4,upper right).
The multipole expansion truncated at lmax = 3 fits better thanthe offset dipole, although there are still some systematic devi-ations in the flux and circular polarization spectra, in particularnear 4300 Å, as well as 6050 Å and around 5500 Å. In spiteof the still very high χ2
ν = 193.51, the field distribution lookspromising. On the positive side, we note the correct represen-tation of the reversal of the polarization near 4600 Å betweenφ = 0.19 and φ = 0.81 and the approximately correct descriptionof the Hα σ− polarization near 6100 Å. As in the case of EF Eri,the quadrupole-like components are strongest, but, again, theother components are essential for the field structure (Table 2).There is a longish ribbon of field lines reaching out moderatelyfar (about 3 RWD). It faces the observer near φ = 0.19 and yieldsnegative circularly polarized cyclotron emission (positive cosψ)as required for the main accretion region. A second region withnegative cosψ may allow access as close as 35◦ from the rota-tional pole and may be responsible for the intense flaring softX-ray emission (Schwope & Beuermann 1989) and the positivecircularly polarized cyclotron emission at orbital phases whenthe main spot is behind the white dwarf. The B − ψ diagramprominently shows field strengths between 13 and 45 MG witha faint (and ill-defined) extension to beyond 100 MG. The rib-bon that may contain the main accretion spot crosses the 13 MGfield minimum, quite consistent with the featureless cyclotroncontinuum and the 12-MG Zeeman absorption in the cyclotronemission of the main spot. These facts suggest that the model ap-proaches reality, although the large χ2
ν lets us suspect that the fi-nal model is still different. The experience from EF Eri with sub-stantially different structures of the best-fit multipole expansionsfor lmax = 3 and lmax = 5 suggests that such an improved modelcan be found. In this case, however, convergence problems haveprevented the construction of an lmax = 4 or 5 model. We do notexpect such a better-fitting model to possess a simpler structurethan the lmax = 3 model and conclude that BL Hyi possesses a
654 K. Beuermann et al.: Magnetic field structure of white dwarfs in CVs
complex field geometry, probably not completely unraveled withthe model presented here.
4.3. CP TucUnlike the majority of polars, CP Tuc was discovered by its hardX-ray emission (Misaki et al. 1996). It displays a broad dip inthe X-ray flux that was used to derive a rotational ephemerisof the white dwarf (Ramsay et al. 1999). The narrow emissionline from the heated face of the secondary star yields the or-bital period (Thomas & Reinsch 1996), which agrees with therotational period proving synchronism. The ephemeris of theseauthors shows that inferior conjunction of the secondary star oc-curs at dip phase φ = 0.08. There is debate about the locationof the accretion region: Misaki et al. (1996) suggested that theenergy-dependent X-ray dip arises from photoabsorption, whileRamsay et al. (1999) assign it to a self-eclipse by the whitedwarf. In the first case, the accretion spot conveniently faces theobserver shortly before inferior conjunction; in the latter it facesaway from the secondary.
As noted above, our data cover only one half of the binaryorbit. They were combined into two sets of flux and polariza-tion spectra at dip phases φ = 0.99 and 0.21, plus a noisier sin-gle set at φ = 0.43. In the Misaki et al. (1996) and Ramsayet al. (1999) interpretations, the accretion spot faces the ob-server near φ = 0 and φ � 0.55, respectively. We show ourspectra at φ = 0.99 and φ = 0.43 in Fig. 2 (right panel).Model A is the offset dipole and model B the multipole expan-sion with lmax = 3, of which the latter yields a formally betterfit with χ2
ν = 12.35 and 11.78, respectively. Visual inspection,however, shows that the differences are not pronounced and thatboth models reproduce the major Zeeman features of Hβ andthe higher Balmer lines in the flux and the polarization spectrareasonably well. The B − ψ diagrams in Fig. 5 demonstrate thepreponderance of field strengths close to 10 MG, which makeCP Tuc a low-field polar and may explain the hard X-ray spec-trum. The offset dipole has a polar field strength of 19.8 MG,is practically aligned with the rotation axis, and offset mainlyin z by 0.21 RWD. It has its high-field pole in the upper hemi-sphere, whereas the multipole model possesses low fields in thesame region. The dipole component of the multipole expansionhas a polar field strength of 17.8 MG, but the quadrupole-likecomponents are of similar strength and the octupole-like com-ponents are non-negligible (Table 2). Both models, offset dipoleand multipole expansion, differ in the sign of the longitudinalfield component over the near and far hemispheres. The feature-less cyclotron continuum indicates a low field strength (Thomas& Reinsch 1996), and the negative circular polarization of thecontinuum (Ramsay et al. 1999) shows that the accretion regionmust lie in the lower (upper) hemisphere for the dipole (multi-pole) model. Only the multipole model, however, possesses anextended region of outgoing field lines that faces the observernear φ = 0.55, as expected from the Ramsay et al. (1999) model(some 0.12 in phase later than in the lower right globe of Fig. 5).In summary, CP Tuc is the third of the polars studied here witha field structure more complex than a simple offset dipole. As acaveat we recall the incomplete phase coverage. The results forCP Tuc are, therefore, preliminary.
4.3.1. Summary of resultsFor all three objects, the truncated multipole expansions yieldsignificantly better fits than the offset dipole models. Only theformer provide access to the surface of the white dwarf viafield lines reaching sufficiently far out at the expected posi-tions on the surface. As seen from Table 3, dipole and multipole
models have practically the same most frequent values of thefield strength. They also cover similar ranges, in particular, ifone considers that the faint extensions in the probability distri-bution to the lowest and highest field strengths are not well de-fined. This similarity reflects the fact that both models more orless fit the principal features of the Zeeman spectra. Intuitively,one might consider rotating the offset dipole model to matchthe accretion conditions, but that changes the phase-dependentB − ψ diagrams and destroys the fits to the Zeeman spectra.Hence, the offset dipoles clearly cannot match all conditionssimultaneously. In spite of the similar B-distributions, the fieldstructures of the two models are significantly different and ourconclusion in favor of stuctures more complex than offset dipolesis safe.
5. DiscussionWe have presented the first Zeeman tomographic study ofthe field structure of white dwarfs in polars based on phase-resolved VLT spectropolarimetry. We have demonstrated that thestudied stars possess field structures significantly more complexthan simple centered or offset dipoles. Such a result was consid-ered possible or even likely in many previous publications, butdetailed proof hade not been available so far. Our results clearlydemonstrate this complexity, although we have to caution thatour best fits may not yet describe reality in every detail. Thesimplest parameter indicative of a structure more complex thana centered dipole is the range of field strengths over the surfaceof the star that exceeds seven for the best-fit models for all threestars, while it would be two for a centered dipole. The presenceof strong higher multipole components besides the dipole maybe surprising considering the fact that the white dwarfs in CVshave a typical age in excess of 1 Gyr (Kolb & Baraffe 1999),sufficient to expect substantial decay of the higher order compo-nents (e.g., Cumming 2002). Recreation of higher order poloidalcomponents from a toroidal interior field has been suggested byMuslimov et al. (1995), but it is not known whether the requiredstrong toroidal field exists in magnetic white dwarfs. The singlewhite dwarfs HE 1045-0908 and PG 1015+014 (Euchner et al.2005, 2006) have similarly complex magnetic field structures atan age of ∼0.5 Gyr. At present, field evolution is not sufficientlyconstrained by observations, but may become so when when thefield structure of more objects becomes available.
We find that fitting the field structure of accreting whitedwarfs in CVs offers a decisive advantage over the analysis ofisolated white dwarfs. The location of the accretion spot and theabsolute value and direction of the field vector in the spot can bededuced independently, e.g., from X-ray and optical light curvesand from broad band polarimetry. Requiring that a successfulfield model complies with this independent information turns outto be a powerful tool and is the main driver for our conclusion infavor of a field structure more complex than an offset dipole inall three objects.
There is a semantic aspect worth mentioning. A compari-son of the right-hand globes for the multipole expansions andthe offset dipoles in Figs. 3–6 (including the phases omitted forconciseness) demonstrates that the latter have well-defined cir-cular regions of outgoing field lines that are properly addressedas ‘poles’. The corresponding regions in the multipole structures,on the other hand, are quite irregular and longish structures thatimply accretion geometries which probably allow access to thewhite dwarf surface at more than one position characterized by awide range of angular separations. The resulting accretion geom-etry is no longer appropriately described by the dipole-inspiredexpressions “one-pole accretion” or “two-pole accretion”.
K. Beuermann et al.: Magnetic field structure of white dwarfs in CVs 655
Given the complicated field structures in the three polarsstudied here, it is desirable to extend the Zeeman tomographicanalysis to a larger number of objects to distinguish betweenidiosyncrasies of individuals and the general properties of theclass. Such a program is feasible, but it calls also for a consid-eration of the limitations of our approach. One obvious limit-ing factor is telescope time. Although we have typically usedtwo orbital periods of high signal-to-noise spectra using the VLTand the spectropolarimetric capabilities of FORS1, the remain-ing noise in the circular polarization spectra limits the discrimi-nation between the B − ψ diagrams of different models. A moreextensive tomographic program requires covering several orbitalperiods of each target with an 8-m class telescope. A second lim-iting factor is CPU time. To thoroughly test a given field model,50 to 100 χ2-minimization runs are typically required becausethey tend to get stuck in secondary minima of the complicatedχ2 landscape. Each step in this process requires assembling theZeeman spectra for the respective field model from the database.The resulting lack of speed is the main reason why we had tolimit the number of models tested.
In the previous papers of this series (Euchner et al. 2005,2006), we have already discussed the alternative approachof Donati et al. (1994), the Zeeman Broadening Analysis(ZEBRA). This method determines the best-fitting B − ψ dia-grams for each orbital phase interval directly from the data, em-ploying the Maximum Entropy Method (MEM) as a regulariza-tion procedure. The advantage is predictably speed, the disad-vantage is the uncertainty whether the individual B−ψ diagramsare compatible with any global physical field model. The methodfaithfully reproduces the distribution in the absolute value of Bover the visible hemisphere at a given orbital phase, but substan-tially smears the angle relative to the line of sight (Donati et al.1994). If interpreted in terms of a multipole model, the recon-structed B − ψ-diagram then leads to spurious higher multipolecomponents. Furthermore, the requirement that the so-deriveddiagrams contain the B−ψ combination describing the accretionspot is easily implemented, but the exact location of the spot onthe star is not because the method forgoes imaging. On the otherhand, testing a larger number of field models for compatibilitywith the B − ψ diagrams for the individual phase intervals willprobably be less time consuming than our present approach be-cause the large database of Zeeman spectra need no longer beaccessed after these diagrams have been established. We planto study the different approaches further to find the ultimatelypreferable one.
Acknowledgements. This work was supported in part by BMBF/DLR grant50 OR 9903 6. B.T.G. was supported by a PPARC Advanced Fellowship.
References
Achilleos, N., Wickramasinghe, D. T., & Wu, K. 1992, MNRAS, 256, 80Araujo-Betancor, S., Gänsicke, B. T., Long, K. S., et al. 2005, ApJ, 622,
589Bailey, J. 1988, in Polarized Radiation of Circumstellar Origin, Vatican
Observatory, ed. G. V. Coyne et al., 105Beuermann, K., & Schwope, A. D. 1989, A&A, 223, 179Beuermann, K., Stella, L., & Patterson, J. 1987, ApJ, 316, 360Beuermann, K., Thomas, H.-C., & Pietsch, W. 1991, A&A, 246, L36Beuermann, K., Wheatley, P., Ramsay, G., Euchner, F., & Gänsicke, B. T. 2000,
A&A, 354, L49Cumming, A. 2002, MNRAS, 333, 589Cropper, M. 1987, MNRAS, 228, 389Donati, J. F., Achilleos, N., Matthews, J. M., & Wesemael, F. 1994, A&A, 285,
285Euchner, F., Jordan, S., Beuermann, K., Gänsicke, B. T., & Hessman, F. V. 2002,
A&A, 390, 633Euchner, F., Reinsch, K., Jordan, S., Beuermann, K., & Gänsicke, B. T. 2005,
A&A, 442, 651Euchner, F., Jordan, S., Beuermann, K., Reinsch, K., & Gänsicke, B. T. 2006,
A&A, 451, 671Ferrario, L., Bailey, J., & Wickramasinghe, D. 1996, MNRAS, 282, 218Harrison, T. E., et al. 2004, ApJ, 614, 947Howell, S. B., Walter, F. M., Harrison, T. E., et al. 2006, ApJ, 652, 709Kolb, U., & Baraffe, I. 1999, MNRAS, 309, 1034Krzeminski, W., & Serkowski, K. 1977, ApJ, 216, L45Meggitt, S. M. A., & Wickramasinghe, D. T. 1989, MNRAS, 236, 31Misaki, K., Terashima, Y., Kamata, Y., Ishida, M., Kunieda, H., & Tawara, Y.
1996, ApJ, 470, L53Muslimov, A. G., Van Horn, H. M., & Wood, M. A. 1995, ApJ, 442, 758Oestreicher, R., Seifert, W., Wunner, G., & Ruder, H. 1990, ApJ, 350, 324Piirola, V., Coyne, G. V., & Reiz, A. 1987a, A&A, 185, 189Piirola, V., Coyne, G. V., & Reiz, A. 1987b, A&A, 186, 120Ramsay, G., Potter, S. B., Buckley, D. A. H., & Wheatley, P. J. 1999, MNRAS,
306, 809Schwope, A. D., & Beuermann, K. 1989, A&A, 222, 132Schwope, A. D., & Beuermann, K. 1993, Cataclysmic Variables and Related
Physics, 2nd Technion Haifa Conference, ed. O. Regev, & G. Shaviv, Annalsof the Israel Physical Society, 10, 234
Schwope, A. D., Beuermann, K., & Jordan, S. 1995, A&A, 301, 447Szkody, P., Vennes, S., Sion, E. M., Long, K. S., & Howell, S. B. 1997, ApJ, 487,
916Szkody, P., Harrison, T. E., Plotkin, R. M., et al. 2006, ApJ, 646, L147Thomas, H.-C., & Reinsch, K. 1996, A&A, 315, L1Wickramasinghe, D. T., & Ferrario, L. 2000, PASP, 112, 873Wolff, M. T., Wood, K. S., Imamura, J. N., Middleditch, J., & Steiman-Cameron,
T. Y. 1999, ApJ, 526, 435