Embed Size (px)
Citation preview

ARISE www.arisejournal.com
Action Research and Innovation in Science Education, 1(1), 15-25 ISSN: 2626-9902
Copyright © 2018 Author. Terms and conditions of Creative Commons Attribution 4.0 International (CC BY 4.0) apply. http://10.12973/arise/96343
* Corresponding author
RESEARCH ARTICLE
“To see ourselves as others see us”*:
Post-primary school students’ drawings of
scientists before and after participation in a
career orientation programme
Aimee Stapleton* University of Limerick, Ireland
Martin McHugh University of Limerick, Ireland
Peter E. Childs
University of Limerick, Ireland
Sarah Hayes
University of Limerick, Ireland
The stereotypical image of a scientist has negative consequences in terms of promoting a perception of scientists and relevant careers that is both positive and realistic. This study employs a modified Draw a Scientist Test (DAST) to investigate the perceptions held by post-primary school students in Ireland about scientists and their work. Participants completed the DAST before and after partaking in a Career Orientation Programme that aimed to promote careers in science and portray scientists and their working life realistically. After completing the programme, participants’ drawings were less stereotypical, with fewer images of male scientist working alone. Drawings also reflected activities the participants did throughout the programme, suggesting that first-hand experience can broaden perceptions of scientific careers.
Keywords: Draw-a-Scientist-Test; Transition Year; Science Camp; Perceptions of Scientists; Career-Orientation
Received 31 July 2018 Revised 27 September 2018 Accepted 29 September 2018
* “To see ourselves as others see us” – a quote from Robert Burn’s poem ‘To a Louse’
Introduction
As in many countries, Ireland has a shortage of graduates with the appropriate skills in science, technology, engineering and maths (STEM) disciplines to meet the demand of the labour market (Walsh & Loxley, 2015). Intertwined with this issue is the low uptake of physical science subjects at school and consequently at third level which is affected by how people perceive science and scientists (Cakmakci et al., 2011). Unfortunately, the prevailing conception of a scientist is inaccurate and unrealistic. The predominant image is that of an elderly male scientist, with crazy hair, wearing a lab coat and glasses, working alone on some secret invention (Reinisch et al., 2017). This image negatively influences students’ subject choice, third-level course preferences and ultimately their career path (Lee, 1998).
Challenging the stereotypical image of a scientist among post-primary school students, and in particular girls, is important as they face decisions about subject choice and career pathways (Farenga & Joyce, 1999). The stereotypical conception of a scientist exists also among some pre-service and in-service teachers (Finson et al., 1995). It may be difficult for some teachers and schools to provide a realistic image of a scientist and associated careers, when they themselves may have limited access or experience interacting with scientists in the workplace (Perry & Ball, 1998).
In combatting such trends, informal science education offers an alternative vehicle to broaden and improve the accuracy of students’ perceptions of scientists. The authors are science public engagement professionals with experience in science, teaching, and both formal and informal science education; in addition, they work in a university setting with access to scientists working in academia and industry. Thus, the authors created an opportunity for post-primary school students (aged 15-16 years) in the Transition Year (TY), to experience the working life of scientists in Ireland.
The TY represents a unique feature of the Irish post-primary educational system, in which students can choose to take a curriculum-free year after completing the first three years of post-primary (Junior Cycle) and before commencing the final two years of post-primary education (Senior Cycle). The Department of Education provides a broad set of guidelines to direct the TY. These guidelines promote “Education through experience of adult and working life as a basis for personal development and maturity” (Department of Education and Science, p.4, 1993). As such, an important element of the TY is work experience. Through participation in work experience, students may revise their original perception of a particular career path or reconsider a path previously dismissed as unattractive (Clerkin, 2012). Identifying and securing appropriate science work placements for students in the TY can be challenging. The issue of insufficient numbers of students pursuing science at third level to meet the STEM sectors employment needs runs parallel to this. Thus, the authors aimed to address both concerns simultaneously by creating a bespoke programme for students in the TY seeking authentic work experience in science. This paper

16 A. Stapleton, et. al., Students’ drawings of scientists
ARISE – Action Research and Innovation in Science Education, 1(1), 15-25 www.arisejournal.com
investigates if the TY students’ perception of scientists becomes more aligned with reality after participating in a work experience programme.
Theoretical Framework
Our perception of scientists starts in early childhood, with children of primary school age envisaging a scientist in a stereotypical way (Fung, 2002). A person’s experience of their science teacher at school (Türkmen, 2008), along with the manner in which scientists are portrayed in books (McAdam, 1990), movies (Barnett et al., 2006), on the internet (Schummer & Spector, 2007) and in the general media (Tan et al., 2017; McCarthy, 2015) all influence our perception of scientists. For many people, their own sense of self may contrast strongly with their perceived image of scientists. Thus, the stereotypical image of a scientist may be discouraging. If people cannot relate any aspect of their sense of self with their perception of a scientist, their likelihood of pursuing science is severely diminished (Bennett & Hogarth, 2009).
To investigate people’s perception of scientists, Chambers (1983) developed the DAST. The test itself is uncomplicated and in its most basic form prompts the participant to draw a scientist. Recent DAST studies show that typical stereotypes of scientists still prevail (Reinisch et al., 2017). The DAST instrument has its limitations and criticisms. The biggest concern with the DAST is whether it actual reports the participants’ conception of a scientist, or merely a common representation of a scientist. Some studies conclude that drawings alone are insufficient (Ehrlén, 2009). To overcome this limitation, more recent versions of the DAST prompt the participant to explain their drawing (Reinisch et al., 2017).
Interventions to improve the accuracy of the public’s perception of scientists are desirable. Informal science education is an effective mechanism of improving the competence, knowledge, skills and attitudes of people towards science (Kim & Dopico, 2016). Participation in a dedicated science camp has the potential to refine and reshape participants’ perceptions of scientists more
positively and broadly (Farland‐Smith, 2009). Research shows that students who participate in a weeklong science-focused camp are more likely to pursue STEM careers than their peers who do not (Kong et al., 2014).
In this Action Research (AR) project, we investigate the following research question: How does the career orientation programme (COP) influence TY students’ perceptions of scientists?
Methods
Programme Overview
The weeklong COP has an overarching goal to increase students’ positive attitudes towards science and give them a realistic experience of the working life of a scientist. An overview of the structure and content of the COP in both AR cycles is presented in Table 1. The programme combines traditional laboratory sessions in physics, biology and chemistry with workshops that focus on communication, innovation and team-working skills, highlighting the breath of skills required in scientific professions.
Table 1. Overview of the structure and content of the Career Orientation Programme for both cycles of the study. Changes to the content of the programme in cycle 2 made after evaluation of cycle 1 are highlighted in blue
COP Schedule: Action Research Cycle 1
Monday Tuesday Wednesday Thursday Friday
Morning Registration &
Pre-DAST
Biology Lab Session
(Exploring bacteria and
making hand-sanitizer gel)
Visit to Industry Site (Contact lens
manufacturing)
Physics Lab session (Light: reflection and
refraction)
Poster session
Special break (ice-cream
prepared with liquid nitrogen)
Mid-morning
Team working workshop
(build a tower from
newspapers challenge)
Chemistry Lab Session
(Anodising Aluminium)
Career talks & Course
Information session
Chemistry Lab session (using
spectroscopy to solve a murder
mystery
Feedback session & Post-
DAST
Afternoon Science Debate on the topic of raw materials Biology Lab
session (Water health analysis)
Biology Lab session (PCR
Gels and Microbiology
plates)
Communication workshop (using
improvisation techniques)
Late-afternoon
Physics Lab session (Build
your own generator)
Preparation time for poster
session
COP Schedule: Action Research Cycle 2
Monday Tuesday Wednesday Thursday Friday
Morning Registration &
Pre-DAST Interview skills
workshop Chemistry
Career Talk
Physics Lab session (The physics of
sound)
Poster session
Mid-morning
Team working workshop (build
a tower from newspapers challenge)
Biology Career Talk
Visit to Industry Site
(pharmaceutical manufacturer)
Chemistry Lab session (using
spectroscopy to solve a murder
mystery
Special break (ice-cream
prepared with liquid nitrogen)
Afternoon
Science Debate on the topic of raw materials
Chemistry Lab Session
(Anodising Aluminium)
Engineering-Design
workshop (Crystal Drop
Challenge)
Feedback session & Post-
DAST Physics Career Talks
Late-afternoon
Physics Lab session (Build
your own generator)
Biology Lab session (Water health analysis)
Biology Lab session (PCR
Gels and Microbiology
plates)
Preparation time for poster
session

17 A. Stapleton, et. al., Students’ drawings of scientists
ARISE – Action Research and Innovation in Science Education, 1(1), 15-25 www.arisejournal.com
In addition, there are dedicated career orientation workshops in which students learn from scientists (postdoctoral researchers, teaching faculty and graduate students) about third level courses and careers options. Although the COP is hosted in a university setting, we aim to expose participants to the broad range of career options available to those pursuing science, and not to limit the focus to scientific careers in academia alone. As such, the programme embeds links to industry where possible, most explicitly in the form of a site-tour of a local scientific industry. All aspects of the programme are designed to engage the students, challenge their existing perception of science and broaden their first-hand experience of science.
The Education and Public Engagement (EPE) team that lead the programme, treat it as an evidence-based innovation that can be enhanced through AR, whereby the EPE team act as the AR practitioners. After each cycle, the EPE team reflect on the feedback from the students and volunteer scientists (researchers, teaching faculty and graduate students) to identify areas for improvement in the next cycle. In this particular study, the EPE team sought to understand the participant’s perception of scientists before and after participating in the programme. The EPE team hypothesised that although the participants had a positive disposition towards science, having applied to participate in the COP, their perception of scientists may be limited and stereotypical. The EPE team hypothesise that exposure to real scientists and scientific work experiences throughout the COP, would promote a more realistic perception of scientists among the participants.
Selection of participants
The programme is open to all students in the TY nationwide. To recruit participants for the programme, the COP was advertised on the university website and through the national science teaching professional association. Those interested were requested to submit an application form. A panel (consisting of the EPE team, the chief-technical officers of each of the science departments and the manager of the Faculty of Science and Engineering) then selected students for the programme based on merit. That is, the panel select those students who have a genuine interest and aptitude towards science. In cycle 1 of the AR study, 31 students participated in the programme (12 Female; 19 Male). In cycle 2, the number of students was reduced to 14 (7 Female; 7 Male). The majority of applicants had little or no experience of science beyond what they experience in school. Therefore, there is an opportunity to investigate their perception of scientists and to improve the accuracy of this perception through the COP.
The Draw a Scientist Test (DAST)
We used a modified DAST test as used by Reinisch et al. (2017) to reveal student’s perception of scientists before and after taking part in the COP. This version of the DAST, requests participants to: “Imagine that tomorrow you are going on a trip (anywhere) to visit a scientist in a place where the scientist is working right now. Draw the scientist busy with the work this scientist does. Add a speech bubble, which tells what this scientist might be saying to you about the work you are watching the scientist do. Label the drawing.”
Furthermore, the DAST prompts the participant to explain their drawing: “What is the scientist in your drawing doing?”
This version of the DAST has several advantages. In the case of unclear drawings, the researcher does not rely solely on the participants’ drawing skills but can use the written text to lessen the ambiguity. Additionally, compared to the original DAST (Chambers, 1983), this modified DAST prompts the participant to give more detail and thus allows the participant opportunity to give a more comprehensive account of their perception of a scientist.
Participants completed the pre-DAST on the first morning of the programme, prior to commencing any workshop sessions and completed the post-DAST on the final day of the programme after all workshop sessions were complete. In the first cycle, participants had 15 minutes to complete the DAST and an unlimited amount of time to complete the post-DAST. This apparent discrepancy in drawing time occurred only for practical reasons; to adhere to the timetable it was necessary to impose a restriction for the pre-DAST but not so for the post-DAST test. However, during the second research cycle, participants were given approximately 25 minutes to complete both the pre- and post-DASTs to remove this discrepancy. Participants were provided only with a pen/pencil to complete the DAST; no colouring pencils or other materials were provided.
The DAST was analysed in accordance with the framework outlined by Reinisch et al. (2017) under three categories – appearance, location and activity. The ‘appearance’ category refers to the physical appearance of the scientist drawn in the DAST and was examined under ten sub-headings: Sex, Number of scientists, Clothes, Protective clothing, Glasses, Headgear, Beard, Bald or half-bald, Crazy hair and Fictive.
The ‘location’ category refers to the location of the scientist as drawn in the DAST. The sub-headings in the location category were: Surroundings (Inside/Outside/Both), Technology (e.g. computers), Knowledge (e.g. books, formulas), Research instruments (e.g. pipettes) and Danger (e.g. smoke).
The ‘activity’ category refers to the type of work the scientist is doing in the DAST. The sub-headings in activity category were:
• Inquiry: Depiction of scientist doing manual, analytical or task-orientated activities such as using a microscope
• Artistic-Engineering: Depiction of a scientist doing creative activities such as inventing a new instrument
• Social-teaching: Depiction of a scientist involved with knowledge transfer such as teaching or supervising students
• Conventional: Depiction of a scientist doing administrative tasks such as accounting
• Social-Scientific exchange: Depiction of a scientist involved in networking activities such as attending a conference
• Unrealistic: Depiction of a scientist doing fictive activities such as creating a secret substance
18 A. Stapleton, et. al., Students’ drawings of scientists
ARISE – Action Research and Innovation in Science Education, 1(1), 15-25 www.arisejournal.com
These categories and sub-headings are the same as those outlined by Reinisch et al. (2017) with the following exceptions. The sub-category ‘crazy hair’ was included to reflect the fact that many of the DASTs depicted persons with wild or crazy hair in line with the common stereotype of a scientist. Also, we did not attempt to make any interpretation of the age of the scientist drawn in the DASTs. The presence or absence of a sub-category feature within a drawing was recorded as 1 or 0, respectively and the totals (absolute frequency) calculated. We also calculated the percentage frequency of each relative to the sample size.
Results
AR Cycle 1
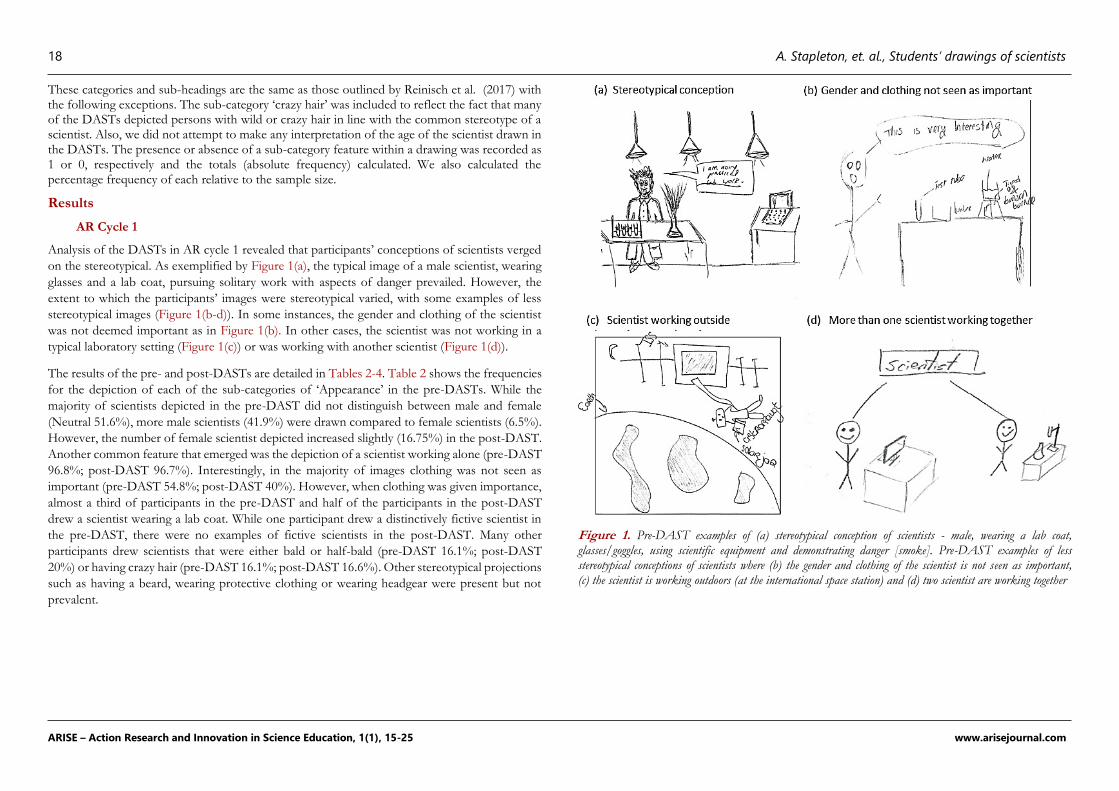
Analysis of the DASTs in AR cycle 1 revealed that participants’ conceptions of scientists verged
on the stereotypical. As exemplified by Figure 1(a), the typical image of a male scientist, wearing
glasses and a lab coat, pursuing solitary work with aspects of danger prevailed. However, the
extent to which the participants’ images were stereotypical varied, with some examples of less
stereotypical images (Figure 1(b-d)). In some instances, the gender and clothing of the scientist
was not deemed important as in Figure 1(b). In other cases, the scientist was not working in a
typical laboratory setting (Figure 1(c)) or was working with another scientist (Figure 1(d)).
The results of the pre- and post-DASTs are detailed in Tables 2-4. Table 2 shows the frequencies
for the depiction of each of the sub-categories of ‘Appearance’ in the pre-DASTs. While the
majority of scientists depicted in the pre-DAST did not distinguish between male and female
(Neutral 51.6%), more male scientists (41.9%) were drawn compared to female scientists (6.5%).
However, the number of female scientist depicted increased slightly (16.75%) in the post-DAST.
Another common feature that emerged was the depiction of a scientist working alone (pre-DAST
96.8%; post-DAST 96.7%). Interestingly, in the majority of images clothing was not seen as
important (pre-DAST 54.8%; post-DAST 40%). However, when clothing was given importance,
almost a third of participants in the pre-DAST and half of the participants in the post-DAST
drew a scientist wearing a lab coat. While one participant drew a distinctively fictive scientist in
the pre-DAST, there were no examples of fictive scientists in the post-DAST. Many other
participants drew scientists that were either bald or half-bald (pre-DAST 16.1%; post-DAST
20%) or having crazy hair (pre-DAST 16.1%; post-DAST 16.6%). Other stereotypical projections
such as having a beard, wearing protective clothing or wearing headgear were present but not
prevalent.
Figure 1. Pre-DAST examples of (a) stereotypical conception of scientists - male, wearing a lab coat, glasses/goggles, using scientific equipment and demonstrating danger [smoke]. Pre-DAST examples of less stereotypical conceptions of scientists where (b) the gender and clothing of the scientist is not seen as important, (c) the scientist is working outdoors (at the international space station) and (d) two scientist are working together

19 A. Stapleton, et. al., Students’ drawings of scientists
ARISE – Action Research and Innovation in Science Education, 1(1), 15-25 www.arisejournal.com
Table 2. Absolute and percentage frequencies of the pre-DAST and post-DAST responses during Cycle 1 for the category ‘Appearance’
Category Cycle 1: Pre-DAST (N =31) Absolute frequency
(Percentage frequency)
Cycle 1: Post-DAST (N =30) Absolute frequency
(Percentage frequency)
Gender Male 13 (41.9%)
Female 2
(6.5%)
Neutral 16
(51.6%)
Male 10 (33.3%)
Female 5
(16.7%)
Neutral 15
(50%)
Number of scientists One 30 (96.8%)
More than one 1 (3.2%)
One 29 (96.7%)
More than one 1 (3.3%)
Clothing
- Wearing a lab coat 10 (32.3%) 15 (50%)
- Wearing everyday clothes
3 (9.7%) 3 (10%)
- Clothing not seen as important
17 (54.8%) 12 (40%)
Protective clothing 1 (3.2%) 4 (13.3%) Glasses 8 (25.8%) 6 (20%) Headgear 1 (3.2%) 0 (0%) Beard 1 (3.2%) 0 (0%) Bald or half-bald 5 (16.1%) 6 (20%) Crazy hair 5 (16.1%) 5 (16.6%) Fictive 1 (3.2%) 0 (0%)
Table 3 shows the frequencies for the depiction of each of the sub-categories of ‘Location’ in the
pre-DASTs. The perception of a scientist working indoors (pre-DAST 90.3%) was much more
prevalent than that of a scientist working outdoors (pre-DAST 9.7%), a feature that persisted in
the post-DAST. Slightly less than a third of participants drew items such as a computer to depict
technology in the pre-DAST (29.0%) which decreased slightly in the post-DAST (13.3%). Fewer
participants drew books, formulas or scientific terms that depicted ‘knowledge’ (pre-DAST 6.5%;
post-DAST 13.3%). In contrast, the majority of participants drew research instruments (pre-
DAST 80.6%; post-DAST 90%) with conical flasks and Bunsen burners featuring most often.
Three participants in the pre-DAST (9.7%) and four in the post-DAST (13.3%) incorporated
some element of danger in their image in the form of smoke or explosions, consistent with the
stereotypical perception of scientists at work.
Table 3. Absolute and percentage frequencies of the pre-DAST and post-DAST responses during Cycle 1 for the category ‘Location’
Category Cycle 1: Pre-DAST (N=31) Absolute frequency
Cycle 1: Post-DAST (N=30) Absolute frequency
Surroundings Inside 28
(90.3%)
Outside 3
(9.7%)
Both 0
(0%)
Inside 30
(100%)
Outside 0
(0%)
Both 0
(0%)
Technology 9 (29.0%) 4 (13.3%) Knowledge 2 (6.5%) 4 (13.3) Research instruments 25 (80.6%) 27 (90%) Danger 3 (9.7%) 4 (13.3%)
The pre- and post-DASTs of cycle 1 featured scientists involved in predominantly enquiry-based
activities (pre-DAST 93.5%; post-DAST 83.3%). No participant depicted a scientist involved in
enterprising, conventional tasks such as administration, or social-scientific exchange such as
attending a conference.
Table 4. Absolute and percentage frequencies of the pre-DAST and post-DAST responses during Cycle 1 for the category “Activity”
Category Cycle 1: Pre-DAST (N=31) Absolute frequency
Cycle 1: Post-DAST (N=30) Absolute frequency
Enquiry 29 (93.5%) 25 (83.3%) Artistic-engineering 5 (16.1%) 0 (0%) Social-teaching 1 (3.2%) 2 (6.7%) Enterprising 0 (0%) 0 (0%) Conventional 0 (0%) 0 (0%) Social-scientific exchange 0 (0%) 0 (0%) Unrealistic 0 (0%) 1 (3.3%)
Across both pre- and post-DASTs, only three participants in total depicted a scientist involved in teaching. In the post-DAST data, there was one example of a scientist portrayed to be involved in an activity characterised as ‘unrealistic’. The participant described the scientists to be:
“working in his secret science submarine, studying potions and creepy animals with his pet goofer” – Post-DAST Cycle 1
Some participants drew images of scientists engaged in more creative or engineering-based activities (pre-DAST 16.1%) such as designing a new rocket or developing new medicines to cure cancer. For example, one participant wrote about the scientists in his/her drawing saying that:
“One of them is working on a computer coming up with new ideas to push technology forward, new designs to help make machines more efficient. The other is working in a lab coming up with new medicines.”–Pre-DAST Cycle1
20 A. Stapleton, et. al., Students’ drawings of scientists
ARISE – Action Research and Innovation in Science Education, 1(1), 15-25 www.arisejournal.com
Taken together, the DAST results of cycle 1 reported in Tables 2-4, portray a generally
stereotypical perception of scientists in terms of their physical appearance, work location and
activities while at work. It is interesting that even despite the fact that the participants have a
genuine interest in science, their perception of a scientists is limited.
Images of school-related activities in pre-DASTs
A trend that emerged from the pre-DASTs was that participants frequently drew scientists
involved in activities that they themselves would have experienced during the Junior Cycle science
programme at school. Table 5 lists examples of such activities, the frequency of which these types
of activities appeared in the pre-DASTs as well as the corresponding topic in the Junior Cycle
science curriculum.
Table 5. The frequency of pre-DAST depicting a scientist involved in an activity that the participants are likely to have completed themselves at school as part of their science curriculum
Example of activity depicted in pre-DAST
Absolute frequency (% frequency) (N =31)
School science curriculum activity
“…separating a solute from a solvent by getting the solute by itself”.
2 (6.5%) Chemistry: Separating mixtures
“I’m measuring the acidity of chemicals”. 4 (13.9) Chemistry: Classification of substances
“I’m doing the experiment to prepare CO2”. 1 (3.2%) Chemistry: Preparation and properties of carbon dioxide
“The scientist is dissecting a sheep’s heart”. 1 (3.2%) Biology: The circulatory system
“teaching everyone about the optic nerve”. 1 (3.2%) Biology: Human biology – the eye
“The scientist in this drawing is finding the conditions necessary for the germination of seeds -> water, oxygen and warmth.”
1 (3.2%) Biology: Reproduction and germination in plants
Images of scientists separating solutions (6.5%) and measuring the acidity of chemicals (13.9%) were most common. Overall, 32.3% of participants drew a scientist involved in a task that would be familiar to the drawer from their experience of school science. While ones perceptions of scientists derive from a range of places, this illustrates that students’ experience of science at school is one factor that strongly influences their perceptions of scientists.
Images of COP activities in post-DASTs
While it is disappointing that a broader range of activities was not reflected in participants’ post-
DASTs, another trend did emerge. The post-DAST data frequently depicted scientists
performing similar activities to that which the participants had done themselves throughout the
COP. Activities such making contact lenses, testing horse DNA, and building electrical circuits
were illustrated in the post-DASTs and not in the pre-DASTs. These are activities that the
participants had the opportunity to do themselves throughout the programme. Table 6 reports
the frequency of these COP activities appearing in the post-DAST responses during cycle 1.
Table 6. The frequency of post-DAST depicting a scientist involved in an activity that the participants completed themselves during the COP and the corresponding COP workshop
Description of activity
Frequency (N = 31)
(% Frequency)
Corresponding workshop in COP
Scientist making a generator or electrical circuit
2 (6.5%) Physics laboratory workshop: Creating your own electrical generator
Scientist making contact lenses
1 (3.2%) Industry site tour to contact lenses manufacturer
Scientist studying Staphylococcus aureus, horse diseases DNA
8 (25.8%) Biology laboratory workshop: Investigating the prevalence of a viral disease of horses and testing for Staphylococcus aureus
Scientist studying bacteria, making hand sanitizer
3 (9.7%) Gross Germs workshop: Learn about bacteria and antibiotics and make own hand-sanitizer
Scientist investigating patient overdose
2 (6.5%) Spectroscopy in a Suitcase workshop: Solve murder mystery by measuring the concentration of aspirin in blood
One could argue that the participants drew these types of activities simply because it was at the
forefront of their mind having completed the tasks recently. While this may be the case, it is
noteworthy that some participants drew images of activities they did on the first day of the
programme, while others drew activities they did on the last day. It is clear that taking part in the
COP made an impression the participants. What is less clear is how long that impression will last.
However, one participant drew an image of a scientist in a hospital reflecting her experience of
visiting a hospital department earlier in the year, suggesting that these type of experiences may
have a longer-term impact on participants. Notably, when participants drew activities they had
done throughout the programme in their post-DASTs, the activities mainly belonged to either
biology or chemistry with far fewer depicting activities related to physics.
Evaluation and Revision after AR Cycle 1
After evaluating the pre- and post-DASTs of cycle 1, the following aspects were identified for
improvement. Firstly, the authors wished to broaden participants’ perceptions of the activities of
scientists particularly in the ‘artistic-engineering’ domain. To make participants more aware of the
creative, artistic and engineering aspects of science professions, a workshop called ‘The Crystal
Drop’ was included in the programme for cycle 2. This workshop asks participants to design,
21 A. Stapleton, et. al., Students’ drawings of scientists
ARISE – Action Research and Innovation in Science Education, 1(1), 15-25 www.arisejournal.com
built and test a device to protect a sugar crystal when being dropped from a height. Secondly, to
improve participants’ awareness of the importance of ‘knowledge exchange’ among scientists, a
workshop on communication and interview skills was included in the programme. Thirdly, the
authors wished to promote physics in particular, as in cycle 1 it was less popular than biology and
chemistry. In cycle 1, the physics workshops involved experiments that students were likely to
have complete previously in school, which proved disengaging. To engage students with physics
more effectively, new workshops were developed around the concept of sound, of which
participants would have had no prior experience. Changes to the content of the COP are
highlighted in blue in Table 1. Finally, to increase the overall quality of experience for participants
and to ease the process of facilitating the COP, the number of participants was decreased to 14
(7 Female; 7 Male).
AR Cycle 2
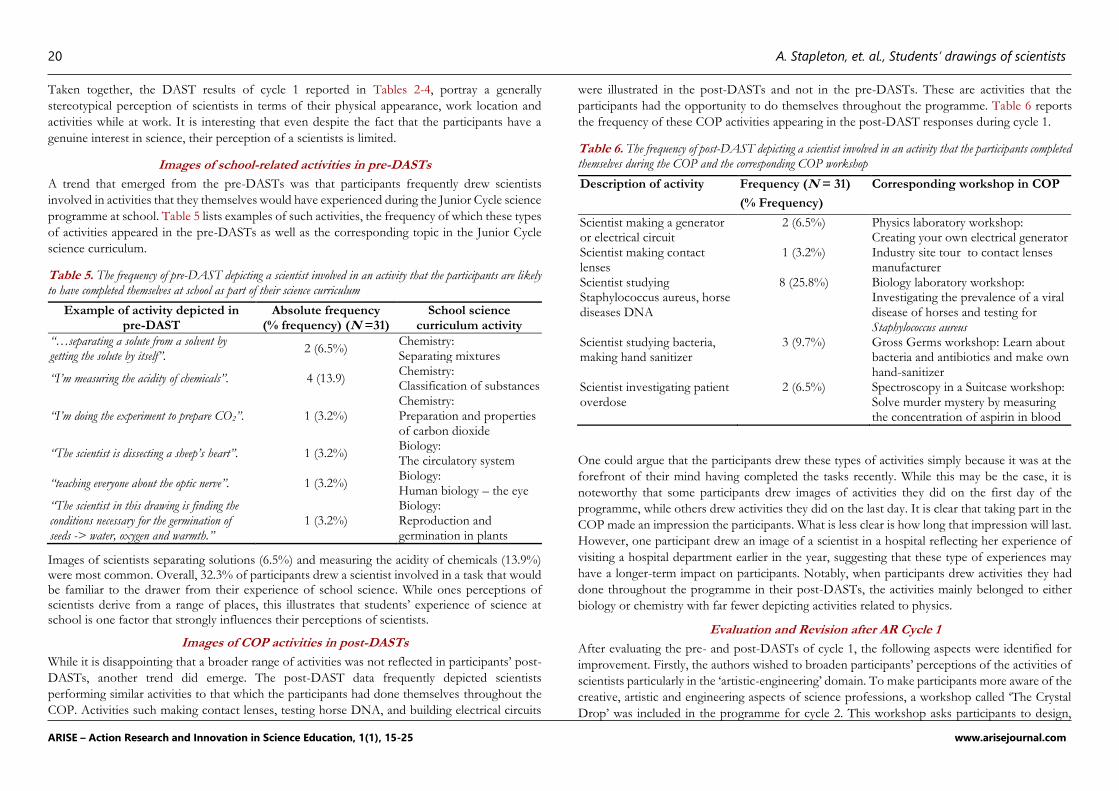
As in cycle 1, the pre-DAST for cycle 2 depicted many stereotypical images of scientists (Figure
2(a)), as well as unrealistic images of scientists (e.g. working with potions, Figure (2(b)) or images
of scientists featuring aspects of danger (Figure 2(c)).
Figure 2. Examples of pre-DASTs in cycle 2 showing (a) a stereotypical conceptions of scientists, (b) an unrealistic conception of a scientific activity [using potions], and (c) an indication of danger/explosives
Table 7 shows the frequencies for the depiction of each of the sub-categories of ‘Appearance’ in
the pre- and post-DASTs in cycle 2. In the pre-DAST, participants drew more male scientists
than female scientists (64.3% versus 21.4%). While the number of female scientists drawn in the
post-DAST remained approximately the same, the frequency of scientists being drawn as male
decreased from to 35.7%. Correspondingly, the number of images in which gender was not
important increased. In the pre-DASTs of cycle 2, scientists were depicted to work alone
exclusively (100%), while in the post-DASTs three participants depicted more than one scientist
working together (21.4%). While these changes are promising, other stereotypical aspects
prevailed such as wearing a lab coat (57.1%) and glasses (42.9%).
Table 7. Absolute frequencies of the pre-DAST and post-DAST responses during Cycle 2 for the category ‘Appearance’
Category Cycle 2: Pre-DAST (N=14) Absolute frequency
(Percentage frequency)
Cycle 2: Post-DAST (N=14) Absolute frequency
(Percentage frequency)
Gender Male 9 (64.3%)
Female 3 (21.4%)
Neutral 2 (14.3%)
Male 5 (35.7)
Female 4 (28.6%)
Neutral 5 (35.7%)
Number of scientists One 14 (100%)
More than one 0 (0%)
One 11(78.6%)
More than one 3 (21.4%)
Clothing Wearing a lab coat 8 (57.1%) 8 (57.1%) Wearing everyday clothes 2 (14.3%) 0 (0%) Clothing not seen as
important 4 (28.6%) 6 (42.9%)
Protective clothing 2 (14.3%) 1 (7.1%) Glasses 6 (42.9%) 6 (42.9%) Headgear 0 (0%) 1 (7.1%) Beard 0 (0%) 2 (14.3%) Bald or half-bald 1 (7.1%) 3 (21.4%) Crazy hair 3 (21.4%) 0 (0%) Fictive 0 (0%) 0 (0%)
Table 8 shows the frequencies for the depiction of each of the sub-categories of ‘Location’ in the
images drawn of scientists in the pre- and post-DAST in cycle 2. The perception of a scientist
working indoors dominated in both tests, with no examples of scientists working outdoors.
Similar to the outcome of cycle 1, participants drew a few examples of technology and knowledge
and drew several examples of research instruments in both the pre- and post-DASTs in cycle 2.
22 A. Stapleton, et. al., Students’ drawings of scientists
ARISE – Action Research and Innovation in Science Education, 1(1), 15-25 www.arisejournal.com
Table 8. Absolute frequencies of the pre-DAST and post-DAST responses during Cycle 2 for the category ‘Location’
Category Cycle 2: Pre-DAST (N = 14) Absolute frequency
(Percentage frequency)
Cycle 2: Post-DAST (N = 14) Absolute frequency
(Percentage frequency)
Surroundings Inside
14 (100%)
Outside
0 (0%)
Both
0 (0%)
Inside
14 (100%)
Outside
0 (0%)
Both
0 (0%)
Technology 2 (14.3%) 2 (14.3%) Knowledge 3 (21.4%) 2 (14.3%) Research instruments 9 (64.3%) 12(85.7%) Danger 1 (7.1%) 0 (0%)
Table 9 shows the frequencies for the depiction of each of the sub-categories of ‘Activity’ in the
images drawn of scientists in the pre- and post-DAST in cycle 2. There was a notable increase in
the number of images depicting scientists involved in enquiry-based activities (64.3% in pre-
DAST, 92.9% in post-DAST).
Table 9. Absolute frequencies of the pre-DAST and post-DAST responses during Cycle 2 for the category ‘Activity'
Category Cycle 2: Pre-DAST (N = 14) Absolute frequency
(Percentage frequency)
Cycle 2: Post-DAST (N = 14) Absolute frequency
(Percentage frequency)
Enquiry 9 (64.3%) 13 (92.9%) Artistic-engineering 4 (28.6%) 4 (28.6%) Social-teaching 2 (14.3%) 1 (7.1%) Enterprising 0 (0%) 0 (0%) Conventional 1 (7.1%) 0 (0%) Social-scientific exchange 0 (0%) 0 (0%) Unrealistic 1 (7.1%) 0 (0%)
In the pre-DAST of cycle 2, many of the participants’ statements about the activity the scientist
in their drawing was doing were vague with no obvious links to their school science curriculum.
For example, “She is doing chemistry experiments” and “He is looking at some machine to see the results of
his experiment”. However, there were also examples in the pre-DASTs where participants described
their scientist as doing an activity that that could be categorised as “Artistic-engineering”, such as
“The scientist is creating compounds and mixtures to test as alternatives to other medicines. The scientist is thinking
about the applications of his developments to improve the efficiency and improve the world.”
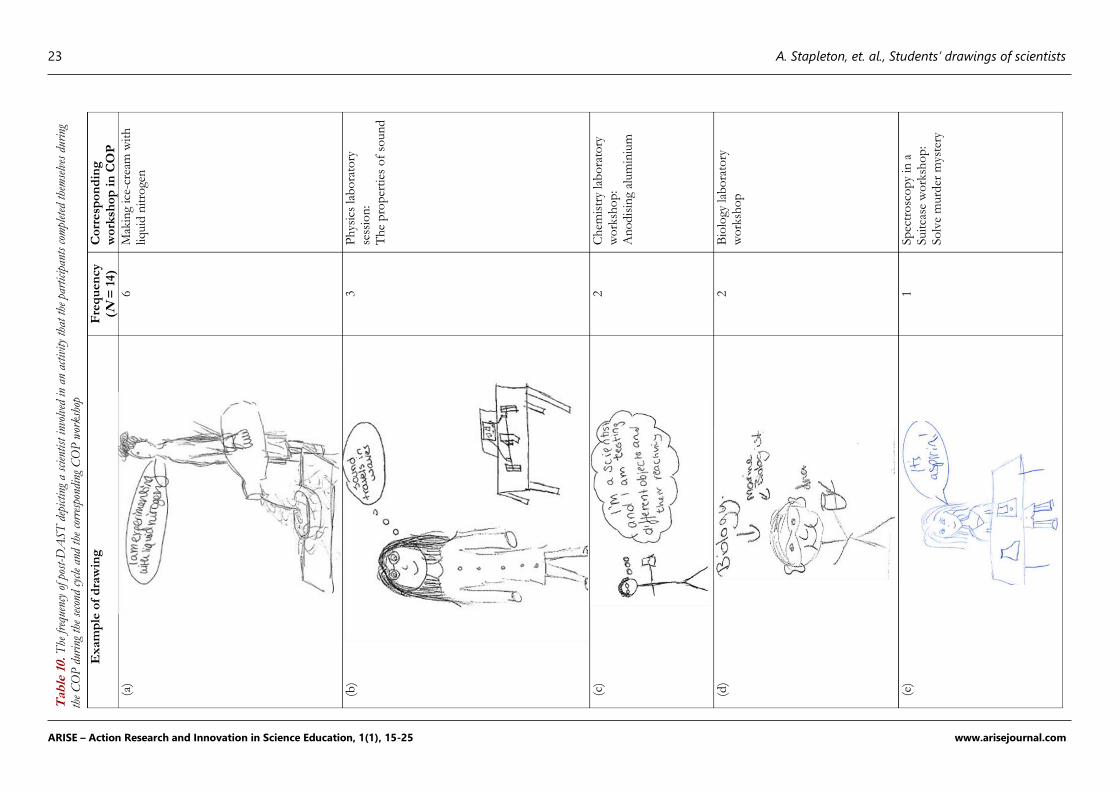
As in the post-DASTs of cycle 1, the analysis of cycle 2 showed many images of scientists
involved in COP activities as shown in Table 10.
In terms of influencing the participants’ perception of the work activities of scientists, there was
no example of ‘scientific exchange’ in the pre- or post-DASTs despite the addition of a workshop
based around communication skills. Although the number of images depicting ‘artistic-
engineering’ activities stayed the same, the number is noteworthy with more than one-quarter of
participants depicting such activity (28.6% in both pre- and post-DASTs).
23 A. Stapleton, et. al., Students’ drawings of scientists
ARISE – Action Research and Innovation in Science Education, 1(1), 15-25 www.arisejournal.com
Tab
le 1
0. T
he fre
quen
cy o
f po
st-D
AS
T d
epic
ting
a s
cien
tist
inv
olve
d in
an
activi
ty tha
t th
e pa
rtic
ipan
ts c
ompl
eted
the
mse
lves
dur
ing
the
CO
P d
urin
g th
e se
cond
cyc
le a
nd t
he c
orre
spon
ding
CO
P w
ork
shop
E
xam
ple
of
dra
win
g
Fre
qu
en
cy
(N =
14)
Co
rresp
on
din
g
wo
rksh
op
in
CO
P
(a)
6
Mak
ing
ice-
crea
m w
ith
liq
uid
nit
roge
n
(b)
3
Ph
ysic
s la
bo
rato
ry
sess
ion
: T
he
pro
per
ties
of
soun
d
(c)
2
Ch
emis
try
lab
ora
tory
w
ork
sho
p:
An
od
isin
g al
um
iniu
m
(d)
2
Bio
logy
lab
ora
tory
w
ork
sho
p
(e)
1
Sp
ectr
osc
op
y in
a
Suit
case
wo
rksh
op
: So
lve
murd
er m
yste
ry

24 A. Stapleton, et. al., Students’ drawings of scientists
ARISE – Action Research and Innovation in Science Education, 1(1), 15-25 www.arisejournal.com
Discussion
Previous studies have shown that science camps similar to the COP presented here are successful,
at least to an extent, in impacting the long-term career goals (Bischoff et al., 2008) and scientific
literacy (Foster & Shiel-Rolle, 2011) of participants. The objective of this study was to investigate
if the COP influenced TY students’ perceptions of scientists. The authors are aware that
perceptions are notoriously resistant to change (Finson et al., 2006) and that this intervention is
only a week in duration. Despite these limitations, after two cycles of AR the data suggests that
the programme does broaden certain aspects of the participants’ perceptions of scientists. In both
cycles of the AR, the number of images depicting male scientists was less in the post-DAST than
in the pre-DAST test. Correspondingly, the number of images depicting either female scientists
or images in which the gender of the scientist was unimportant increased. In this regard, it appears
that the participants’ changed their perception of the gender of a scientist slightly after the COP.
In future AR cycles, the EPE team will record the ratio of male to female scientists (postdoctoral
researchers, teaching faculty, graduate students) involved in the COP and analyse the DASTs in
light of this.
While the perception of a scientist working alone persisted after the COP in cycle 1, there were
more examples of scientists working together after the COP in cycle 2. The COPs in both AR
cycles had a distinct focus on team working. The COP in cycle 2 included an additional activity
involving teamwork (The Crystal Drop workshop) which proved particularly engaging. Perhaps,
this additional workshop reinforced a new perception of scientists, one in which collaboration
and teamwork are integral to the activities of scientists.
The COP did not alter participants’ perception that scientists work solely indoors. On reflection,
this resistance to change may not be surprising. While, the COP included access to scientists
working in industry and academia, both groups work in laboratory or manufacturing
environments, perpetuating the stereotype. Future AR cycles may address this by including an
element of science fieldwork. Similarly, the post-DAST did not report any marked increase in
participants’ awareness that scientists are active in activities involving enterprise or scientific
exchange. On the final day of the COP, participants presented posters on a given topic and
became active in scientific exchange themselves. However, we may not have expressed explicitly
enough that ‘real scientists’ disseminate their research at conferences in a similar way. Also, the
EPE team noted that the COP might be reinforcing some stereotypes unintentionally. The
perception of a scientist wearing a lab coat and glasses persisted in the post-DASTs of the AR
cycles. The COP places a large emphasis on safety, a message echoed strongly on the site tours
to industry. Therefore, in some cases such as this COP, trying to alter the stereotypical perception
of a scientist wearing a lab coat and glasses is not appropriate.
The main success of the COP was that the participants’ perception of the tasks that scientists do
expanded after the programme. Before partaking in the COP, participants’ pre-DASTs depicted
images of scientists doing vague tasks (AR Cycle 2) or tasks they themselves had done previously
in school (AR Cycle 1). After the COP, participants had collected a breath of new science
experiences and reflected these in their post-DASTs. This result is encouraging, as it highlights
the power of practical and hands-on activities in altering participants’ perceptions.
Conclusions
This study showed that post-primary students’ in the TY have a stereotypical perception of
scientists and their work. This stereotype exists even amongst a group who were positively
disposed towards science, having elected to take part in a science COP voluntarily. The
intervention was a weeklong programme that aimed to challenge participants’ existing perception
of science and broaden their first-hand experience of science. While the programme was not
successful in changing participants’ perceptions across all criteria, certain aspects of their
perception did become more accurate after partaking in the programme. Participants were less
likely to draw images of scientists in which the scientist was male and working alone after taking
part in the programme. Furthermore, participants’ drawings after the programme reflected a
broader set of scientific tasks which they themselves gained first-hand experience of throughout
the programme.
Acknowledgments
This publication has received support through the Synthesis and Solid State Pharmaceutical
Centre, which is funded by Science Foundation Ireland (SFI) and co-funded under the
European Regional Development Fund under Grant 12/RC/2275
References
Barnett, M., Wagner, H., Gatling, A., Anderson, J., Houle, M., & Kafka, A. (2006). The impact of science fiction film on student understanding of science. Journal of Science Education and Technology, 15(2), 179-191.
Bennett, J., & Hogarth, S. (2009). Would you want to talk to a scientist at a party? High school students’ attitudes to school science and to science. International Journal of Science Education, 31(14), 1975-1998.
Bischoff, P. J., et al. (2008). A Science Summer Camp as an Effective Way to Recruit High School Students to Major in the Physical Sciences and Science Education. International Journal of Environmental and Science Education, 3(3): 131-141.
Cakmakci, G., Tosun, O., Turgut, S., Orenler, S., Sengul, K., & Top, G. (2011). Promoting an inclusive image of scientists among students: Towards research evidence-based practice. International Journal of Science and Mathematics Education, 9(3), 627-655.
Chambers, D. W. (1983). Stereotypic images of the scientist: The Draw‐a‐Scientist Test. Science education, 67(2), 255-265.

25 A. Stapleton, et. al., Students’ drawings of scientists
ARISE – Action Research and Innovation in Science Education, 1(1), 15-25 www.arisejournal.com
Clerkin, A. (2012). Personal development in secondary education: the Irish Transition Year. education policy analysis archives, 20, 38.
Ehrlén, K. (2009). Drawings as Representations of Children's Conceptions. International Journal of Science Education, 31(1), 41-57. doi:10.1080/09500690701630455
Farenga, S. J., & Joyce, B. A. (1999). Intentions of young students to enroll in science courses in the future: An examination of gender differences. Science education, 83(1), 55-75.
Farland‐Smith, D. (2009). Exploring middle school girls’ science identities: Examining attitudes
and perceptions of scientists when working “side‐by‐side” with scientists. School Science and Mathematics, 109(7), 415-427.
Finson, K. D., Beaver, J. B., & Cramond, B. L. (1995). Development and field test of a checklist
for the Draw‐A‐Scientist Test. School Science and Mathematics, 95(4), 195-205.
Finson, K. D., Pedersen, J., & Thomas, J. (2006). Comparing science teaching styles to students' perceptions of scientists. School Science and Mathematics, 106(1), 8-15.
Fung, Y. Y. (2002). A comparative study of primary and secondary school students' images of scientists. Research in Science & Technological Education, 20(2), 199-213.
Foster, J. S. and N. Shiel-Rolle (2011). Building Scientific Literacy through Summer Science Camps: A Strategy for Design, Implementation and Assessment. Science Education International, 22(2): 85-98.
Kim, M. and E. Dopico (2016). Science education through informal education. Cultural Studies of Science Education, 11(2): 439-445.
Kong, X., Dabney, K. P., & Tai, R. H. (2014). The association between science summer camps and career interest in science and engineering. International Journal of Science Education, Part B, 4(1), 54-65.
Lee, J. D. (1998). Which kids can" become" scientists? Effects of gender, self-concepts, and perceptions of scientists. Social Psychology Quarterly, 199-219.
McAdam, J. E. (1990). The persistent stereotype: Children's images of scientists. Physics Education, 25(2), 102.
McCarthy, D. (2015). Teacher candidates’ perceptions of scientists: images and attributes. Educational Review, 67(4): 389-413.
Perry, C., & Ball, I. (1998). What do teachers really know about work? professional development through education-industry links. Teacher Development, 2(1), 73-86.
Reinisch, B., Krell, M., Hergert, S., Gogolin, S., & Krüger, D. (2017). Methodical challenges concerning the Draw-A-Scientist Test: a critical view about the assessment and evaluation of learners’ conceptions of scientists. International Journal of Science Education, 39(14), 1952-1975.
Schummer, J., & Spector, T. I. (2007). Popular images versus self-images of science: Visual representations of science in clipart cartoons and internet photographs. Science Images and Popular Images of Science, London-New York: Routledge, 69-95.
Department of Education and Science. (1993). Transition Year programmes guidelines 1994 -1995.
Tan, A.-L., et al. (2017). Spiderman and science: How students’ perceptions of scientists are shaped by popular media. Public Understanding of Science, 26(5): 520-530.
Türkmen, H. (2008). Turkish Primary Students' Perceptions about Scientist and What Factors Affecting the Image of the Scientists. Eurasia Journal of Mathematics, Science & Technology Education, 4(1).
Walsh, J., & Loxley, A. (2015). The Hunt Report and higher education policy in the Republic of Ireland: ‘an international solution to an Irish problem?’. Studies in Higher Education, 40(6), 1128-1145. doi:10.1080/03075079.2014.881350