Embed Size (px)
Citation preview


To our stockholders, customers, partners and employees:
2014 was a fantastic year for Tableau. We saw the strongest demand in our history as the move to visualanalytics grew faster than ever. After five years of revenue growth over 75%, we’ve reached more than$900 million in lifetime revenue—$412.6 million of which was generated in 2014. With that achievement, we’vebecome one of the fastest growing companies in the fifty-year history of business analytics software.
Our mission to help people see and understand data has come to define a new era of analytics. We’re enablingpeople to answer questions, solve problems and generate meaning from data in a way that has never before beenpossible. And, we’re putting that power in the hands of a much broader population of people. Customers callTableau easy and fun – a far cry from the complicated business intelligence systems of the prior era.
2014 was a record year for customer growth. During 2014, we added more than 9,100 customer accounts,bringing our total to more than 26,000 worldwide. In the average week more than 150 organizations are movingto the Tableau way. Even with this success, we believe there is a large untapped market for our products.
Our growth was also driven by continued international expansion. In 2014, international revenue grew to $93.8million, up 105% year-over-year. We now have customers in more than 150 countries.
Our product innovation continues at a rapid pace. In 2014, we invested $90.1 million(1) on research anddevelopment, more than the previous two years combined. This commitment led to the release of Tableau 8.2,which allows customers to run Tableau natively on the Mac and to create interactive stories with data. In December,we announced Tableau 8.3, an update that extends our enterprise-class security with support for Kerberos.
At our customer conference in September, we laid out our vision to further develop our products. We remainfocused on product innovation and advancing our platform to bring even more value to our growing customerbase. We’re excited about the upcoming release of Tableau 9.0, the next step in our journey to help peopleachieve more with data. Tableau 9.0 will include innovations in visual analytics, performance, scalability, datapreparation, enterprise capabilities, cloud and mobile.
We’re encouraged by Tableau Public’s growth. We launched Tableau Public with the vision of creating an onlinecommunity for people to share and explore data. We now have more than 90,000 authors creating 4,500visualizations every week. Since its launch in 2010, people have published more than 500,000 visualizations onTableau Public – nearly half of which were published in 2014 alone. Tableau Public has become the go-tocommunity for people to create and share data visualizations with the world.
In closing, I’m proud to say that our investments in people, products and customers paid off in 2014. I’d like toextend a sincere thank you to our customers and partners for your adoption and support of Tableau. It’s been anamazing year, and I look forward to 2015.
Christian ChabotCo-founder and Chief Executive OfficerTableau Software, Inc.
(1) Represents non-GAAP research and development expense. The figure excludes $20.8 million of stock-based compensation expense. The definition andreconciliation of non-GAAP measures can be found at investors.tableau.com/overview/default.aspx.

UNITED STATES SECURITIES AND EXCHANGE COMMISSION
Washington, D.C. 20549
FORM 10-K
(Mark One)
x ANNUAL REPORT PURSUANT TO SECTION 13 OR 15(d) OF THE SECURITIES EXCHANGE ACTOF 1934
For the fiscal year ended December 31, 2014
or
o TRANSITION REPORT PURSUANT TO SECTION 13 OR 15(d) OF THE SECURITIES EXCHANGEACT OF 1934
For the transition period from ____ to ____
Commission File Number: 001-35925
TABLEAU SOFTWARE, INC. (Exact name of registrant as specified in its charter)
Delaware 47-0945740
(State or other jurisdiction of incorporation or organization)
(I.R.S. Employer Identification Number)
837 North 34th Street, Suite 200 Seattle, Washington 98103
(Address of principal executive offices and zip code)
(206) 633-3400(Registrant's telephone number, including area code)
Securities registered pursuant to Section 12(b) of the Act:
Title of Each Class Name of each exchange on which registered
Class A Common Stock, par value $0.0001 New York Stock ExchangeSecurities registered pursuant toSection 12 (g) of the Act: None
Indicate by a check mark if the Registrant is a well-known seasoned issuer, as defined in Rule 405 of the SecuritiesAct. Yes x No o
Indicate by check mark if the Registrant is not required to file reports pursuant to Section 13 or Section 15(d) of the Act.Yes o No x
Indicate by check mark whether the Registrant (1) has filed all reports required to be filed by Section 13 or 15(d) of theSecurities Exchange Act of 1934 during the preceding 12 months (or for such shorter period that the Registrant was required tofile such reports), and (2) has been subject to such filing requirements for the past 90 days. Yes x No o
Indicate by check mark whether the Registrant has submitted electronically and posted on its corporate Web site, ifany, every Interactive Data File required to be submitted and posted pursuant to Rule 405 of Regulation S-T (§232.405 of thischapter) during the preceding 12 months (or for such shorter period that the Registrant was required to submit and post suchfiles). Yes x No o
Indicate by check mark if disclosure of delinquent filers pursuant to Item 405 of Regulation S-K is not contained herein,and will not be contained, to the best of Registrant’s knowledge, in definitive proxy or information statements incorporated byreference in Part III of this Form 10-K or any amendment to this Form 10-K. x
Indicate by check mark whether the Registrant is a large accelerated filer, an accelerated filer, a non-accelerated filer,or a smaller reporting company. See the definitions of “large accelerated filer,” “accelerated filer” and “smaller reporting company”in Rule 12b-2 of the Exchange Act.
Large accelerated filer x Accelerated filer o
Non-accelerated filer o (Do not check if smaller reporting company) Smaller reporting company o
Indicate by check mark whether the registrant is a shell company (as defined in Rule 12b-2 of the Exchange Act). Yeso No x
The aggregate market value of common equity held by non-affiliates of the Registrant on June 30, 2014, based onthe closing price of $71.33 for shares of the Registrant’s Class A common stock as reported by the New York Stock Exchangeon June 30, 2014 was approximately $3.0 billion. For purposes of determining whether a stockholder was an affiliate of theRegistrant at June 30, 2014, the Registrant assumed that a stockholder was an affiliate of the Registrant at June 30, 2014 ifsuch stockholder (i) beneficially owned 10% or more of the Registrant’s capital stock (on an as-converted basis), asdetermined based on public filings, and/or (ii) was an executive officer or director, or was affiliated with an executive officer ordirector of the Registrant, at June 30, 2014. This determination of affiliate status is not necessarily a conclusive determinationfor other purposes.
As of February 24, 2015, there were approximately 49,361,124 shares of the registrant's Class A common stock and21,449,827 shares of the registrant's Class B common stock outstanding.
DOCUMENTS INCORPORATED BY REFERENCE Information required in response to Part III of Form 10-K (Items 10, 11, 12, 13 and 14) is hereby incorporated by reference
to portions of the Registrant’s Proxy Statement for the Annual Meeting of Stockholders to be held in 2015. The Proxy Statementwill be filed by the Registrant with the Securities and Exchange Commission no later than 120 days after the end of the Registrant’sfiscal year ended December 31, 2014.
TABLEAU SOFTWARE, INC.ANNUAL REPORT ON FORM 10-K
For the Year Ended December 31, 2014
Table of Contents
PART I Page
Item 1. Business 4
Item 1A. Risk Factors 17
Item 1B. Unresolved Staff Comments 37
Item 2. Properties 37
Item 3. Legal Proceedings 37
Item 4. Mine Safety Disclosure 37
PART II
Item 5Market for Registrant's Common Equity, Related Stockholders Mattersand Issuer Purchases of Equity Securities 38
Item 6. Selected Consolidated Financial Data 40
Item 7.Management's Discussion and Analysis of Financial Condition andResults of Operations 43
Item 7A. Quantitative and Qualitative Disclosures About Market Risk 61
Item 8. Consolidated Financial Statements and Supplementary Data 62
Item 9.Changes in and Disagreements with Accountants on Accounting andFinancial Disclosures 85
Item 9A. Controls and Procedures 85
Item 9B. Other Information 85
PART III
Item 10. Directors, Executive Officers and Corporate Governance 86
Item 11. Executive Compensation 86
Item 12.Security Ownership of Certain Beneficial Owners and Management andRelated Stockholder Matters 86
Item 13.Certain Relationships and Related Transactions and DirectorIndependence 86
Item 14. Principal Accountant Fees and Services 86
PART IV
Item 15. Exhibits and Financial Statement Schedules 86
Signatures 90
PART I. SPECIAL NOTE REGARDING FORWARD-LOOKING STATEMENTS
This Annual Report on Form 10-K contains forward-looking statements within the meaning of Section 21Eof the Securities Exchange Act of 1934, as amended, and section 27A of the Securities Act of 1933, as amended.All statements contained in this report other than statements of historical fact, including statements regarding ourfuture results of operations and financial position, our business strategy and plans, and our objectives for futureoperations, are forward-looking statements. The words “believe,” “may,” “will,” “estimate,” “continue,” “anticipate,”“intend,” “expect,” “seek”, and similar expressions are intended to identify forward-looking statements. We havebased these forward-looking statements largely on our current expectations and projections about future events andtrends that we believe may affect our financial condition, results of operations, business strategy, short-term andlong-term business operations and objectives, and financial needs. These forward-looking statements are subjectto a number of risks, uncertainties and assumptions, including those described in the “Risk Factors” section of thisreport. Moreover, we operate in a very competitive and rapidly changing environment. New risks emerge from timeto time. It is not possible for our management to predict all risks, nor can we assess the impact of all factors on ourbusiness or the extent to which any factor, or combination of factors, may cause actual results to differ materiallyfrom those contained in any forward-looking statements we may make. In light of these risks, uncertainties andassumptions, the future events and trends discussed in this report may not occur and actual results could differmaterially and adversely from those anticipated or implied in the forward-looking statements.
You should not rely upon forward-looking statements as predictions of future events. The events andcircumstances reflected in the forward-looking statements may not be achieved or occur. Although we believe thatthe expectations reflected in the forward-looking statements are reasonable, we cannot guarantee future results,levels of activity, performance or achievements. We are under no duty to update any of these forward-lookingstatements after the date of this report or to conform these statements to actual results or revised expectations.
As used in this report, the terms “Tableau,” “Registrant,” “Company,” “we,” “us,” and “our” mean TableauSoftware, Inc. and its subsidiaries unless the context indicates otherwise.
4
ITEM 1. BUSINESS
OverviewOur mission is to help people see and understand data.
Our software products put the power of data into the hands of everyday people, allowing a broadpopulation of business users to engage with their data, ask questions, solve problems and create value.
Based on innovative core technologies originally developed at Stanford University, our productsdramatically reduce the complexity, inflexibility and expense associated with traditional business intelligenceapplications. We aim to make our products easy to use, ubiquitous and as deeply-rooted in the workplace asspreadsheets are today.
Our software is designed for anyone with data and questions. We are democratizing the use of businessanalytics software by allowing people to access information, perform analysis and share results withoutassistance from technical specialists. By putting powerful, self-service analytical technology directly into the handsof people who make decisions with data, we seek to accelerate the pace of informed and intelligent decisionmaking. We believe this enables our customers to create better workplaces, with happier employees who areempowered to more fully express their ingenuity and creativity.
Our products are used by people of diverse skill levels across all kinds of organizations, including Fortune500 corporations, small and medium-sized businesses, government agencies, universities, research institutionsand non-profits. Organizations employ our products in a broad range of use cases such as increasing sales,streamlining operations, improving customer service, managing investments, assessing quality and safety,studying and treating diseases, completing academic research, addressing environmental problems andimproving education. Our products are flexible and capable enough to help a single user on a laptop analyze datafrom a simple spreadsheet, or to enable thousands of users across an enterprise to execute complex queriesagainst massive databases.
Underpinning our innovative products is a set of technology advances that spans the domains of
sophisticated computer graphics, human-computer interaction and high performance database systems. These
technology innovations include VizQL and our Hybrid Data Architecture:
• VizQL—Our breakthrough visual query language, VizQL, translates drag-and-drop actions into dataqueries and then expresses that information visually. VizQL unifies the formerly disparate tasks of query
and visualization and allows users to transform questions into pictures without the need for software
scripts, chart wizards or dialogue boxes that inhibit speed and flexibility. This capability is designed to
enable a more intuitive, creative and engaging experience for our users. VizQL can deliver dramatic gains
in people’s ability to see and understand data, and we believe it represents a foundational advancement
in the field of analytics.
• Hybrid Data Architecture—Our Hybrid Data Architecture combines the power and flexibility of our LiveQuery and In-Memory Data Engines. Our Live Query Engine allows users to instantaneously connect to
large volumes of data in its existing format and location, reducing the need for time-consuming data
transformation processes that only technical specialists can perform. In addition, this capability allows
customers to leverage investments in their existing data platforms and to capitalize on the capabilities of
high performance databases. Our In-Memory Data Engine enables users to import large amounts of data
into our own in-memory database. Using advanced algorithms and data compression techniques, our in-
memory technology facilitates quick query responses on up to hundreds of millions of rows of data. Our
Hybrid Data Architecture enables these data engines to work in harmony, allowing users the flexibility to
access and analyze data from diverse sources and locations, while optimizing speed and performance for
each source.
Our distribution strategy is based on a “land and expand” business model and is designed to capitalize on
the ease of use, low up-front cost and collaborative capabilities of our software. Our products tend to be adopted
at a grassroots level within organizations, often beginning with a free trial, and then spread across departments,
divisions and geographies via word-of-mouth and the discovery of new use cases. Over time, many of our
customers find that the use of our products expands to a broad cross-section of their organizations and that our
deployments and use cases become significantly more strategic in nature. Accordingly, we have developed
enterprise-class product and service capabilities that allow us to both complement and supplant core, legacy
business intelligence deployments.
As of December 31, 2014, we had more than 26,000 customer accounts across a broad array of
company sizes and industries and located in over 150 countries. Some of our largest customers include Deere &
Company, affiliates of Deloitte Touche Tohmatsu Limited, E. I. du Pont de Nemours and Company, the Federal
Aviation Administration, Sears Holdings Corporation and affiliates of Verizon Communications Inc. In addition, we
have cultivated strong relationships with technology partners to help us extend the reach of our products. These
partners include both traditional database vendors such as International Business Machines Corporation ("IBM"),
Microsoft Corporation, Oracle Corporation and Teradata Corporation and emerging database vendors such as
Amazon.com, Cloudera Inc., Google Inc., Pivotal Greenplum Database ("Pivotal GPDB") and Vertica (a division of
Hewlett-Packard Company).
We have achieved significant growth in recent periods. For the years ended December 31, 2014, 2013
and 2012, our total revenues were $412.6 million, $232.4 million and $127.7 million, respectively, representing a
compound annual growth rate of approximately 79.7% from 2012 to 2014. We also generated net income of $5.9
million, $7.1 million and $1.4 million for the years ended December 31, 2014, 2013 and 2012, respectively, and
have generated positive cash flow from operating activities on an annual basis in each of those fiscal years. We
believe our land and expand business model provides financial visibility as aggregate revenues from subsequent
sales of products and maintenance services to our customers have typically been multiples of the revenues we
realized from those customers’ initial purchases.
Growth StrategyOur mission to help people see and understand data presents a broad and momentous market
opportunity. We intend to continue to invest in a number of growth initiatives to allow us to pursue our mission
aggressively. Our strategies for growth include:
• Expand our customer base—We believe the market for analytics and business intelligence software isconsiderably underserved and, as a result, we have the opportunity to substantially expand our present
base of over 26,000 customer accounts. We are expanding our online and offline marketing efforts to
5
increase our brand awareness. We are also making significant investments in growing both our directsales teams and indirect sales channels.
• Further penetrate our existing customer base—Leveraging our land and expand business model, weintend to continue to increase adoption of our products within and across our existing customers, as theyexpand the number of users and develop new use cases for our products. We believe there is anopportunity to extend the reach of our products within our customers. Our sales and marketing strategyand focus on customer success help our customers identify and pursue new use cases within theirorganizations. As this expansion occurs, we believe that our products will also increasingly supplantincumbent legacy platforms to become the standard platform for analytics and business intelligence forour customers.
• Grow internationally—With approximately 23% of our total revenues generated outside the UnitedStates and Canada in the year ended December 31, 2014, we believe there is significant opportunity togrow our international business. Our products currently support eight languages, and we are aggressivelyexpanding our direct sales force and indirect sales channels outside the United States. We haveinternational operations in Australia, Canada, France, Germany, India, Ireland, Japan, Singapore and theUnited Kingdom, and we intend to invest in further expanding our footprint in these and other regions.
• Relentlessly innovate and advance our products—We have sought to rapidly improve the capabilitiesof our products over time and intend to continue to invest in product innovation and leadership. Buildingon our foundational technology innovations, including VizQL, we have released eight major versions ofour software to date, rapidly expanding and improving our feature set and capabilities. Our most recentmajor release, Tableau 8.0, added many new features including Web and mobile authoring, statisticalforecasting, free form dashboards, integration with applications like salesforce.com and Google Analytics,and APIs. Since the release of Tableau 8.0, we introduced Tableau Online, new data connectors toAmazon Redshift, Sybase ASE, Cloudera Impala and EXASOL EXASolution, Tableau 8.1, which providedweb authoring capabilities, R integration, 64-bit processing, and other enhanced functionality, Tableau8.2, which included the release of story points and desktop on the Mac, and Tableau 8.3, which extendsenterprise security with support for Kerberos. We plan to continue to invest in research and development,including hiring top technical talent, focusing on core technology innovation and maintaining an agileorganization that supports rapid release cycles. In particular, we intend to focus on further developing ourcloud and mobile capabilities, expanding our advanced analytical and statistical functionality andcontinuing to expand the range of visualization formats and data sources and platforms we can address.
• Extend our distribution channels and partner ecosystem—We plan to continue investing indistribution channels, technology partners and OEM relationships to help us enter and grow in newmarkets while complementing our direct sales efforts. We are actively growing our indirect channels,particularly in international markets. Our most important technology partnerships are with market-leadingdatabase vendors, such as IBM, Microsoft, Oracle and Teradata, and emerging database vendors, suchas Amazon.com, Cloudera, Google, Pivotal GPDB and Vertica, with which we have collaborated todevelop high performance and optimized connectivity to a broad group of popular data stores. We intendto continue to invest in technology partnerships that enable us to build and promote complementarycapabilities that benefit our customers. We have also recently introduced APIs to further empower ourdeveloper and OEM partner ecosystem to create applications that embed Tableau functionality.
• Foster our passionate user community—We benefit from a vibrant and engaged user community. Weare investing in initiatives to further expand and energize this group, both online, through our onlinecommunity site and through events such as our annual customer conferences, including our U.S. TableauCustomer Conference which has grown from approximately 180 attendees in 2008 to more than 5,500attendees in 2014. In addition, Tableau Public, which we launched as a free cloud-based service, has acommunity of engaged users from media, government, non-profit and other organizations, who arepassionate about sharing public data online. We intend to expand these efforts and to seek other meansto evangelize our mission and facilitate sharing of best practices and success stories.
• Treasure and cultivate our exceptional culture—We believe our culture is a core ingredient of oursuccess. Our employees share a passion for our mission, and our mission stands at the top of a list ofeight core cultural values that govern our approach to our business. Our other core values include:Teamwork; Product leadership; Using our own products; Respect; Honesty; Simplicity; and Commitmentto delighting customers. Our values permeate our organization and drive our identity as a company. For
6
example, we strive to paint virtually all aspects of our business with a brush of simplicity, including productuser interfaces, pricing models, business processes and marketing strategies. Our culture is consistentlycited in employee surveys as a key reason for their satisfaction with Tableau and we have been publiclyrecognized as one of the best workplaces in the State of Washington.
ProductsOur products help people see and understand data. They offer the power and flexibility required to serve
a broad range of use cases, from answering questions with small spreadsheets to completing enterprise businessintelligence projects involving massive volumes of data. We currently offer four products: Tableau Desktop, a self-service, powerful analytics product for anyone with data, Tableau Server, a business intelligence platform fororganizations, Tableau Online, a cloud-based version of Tableau Server, and Tableau Public, a free cloud-basedplatform for analyzing and sharing public data.
Tableau DesktopTableau Desktop helps knowledge workers make sense of the many kinds of data they encounter every
day. The defining capability of Tableau Desktop is the interactive experience it provides for exploring andanalyzing data. By fundamentally integrating data analysis and visualization, our products provide a visual windowinto data trapped in spreadsheets and databases, fostering greater engagement with data and allowing people tobetter answer questions, develop insights and solve problems. The result is a self-service analytics environmentthat empowers people to access and analyze data independently and at a rapid pace.
Tableau Desktop’s key capabilities include:
• Visual analytics—Tableau Desktop empowers people to ask sophisticated questions by composing drag-and-drop pictures of their data. Tableau Desktop’s easy-to-use interface is built on VizQL, which iscapable of describing thousands of easily understood visual presentations of data including tables, maps,time series, dashboards and tables of graphs. The combination of a sophisticated language with a simpleuser interface means users can explore many different perspectives of their data. We believe being ableto quickly view data from different perspectives inspires creative thinking and helps people find the rightview to answer a question.
• Analytical depth—An important aspect of Tableau Desktop is its ability to marry powerful visualizationwith deep analytics. Users can filter and sort their data, create sophisticated calculations, drill intounderlying information, define sets and cohorts, perform statistical analysis and derive correlationsbetween diverse data sets with agility and relative ease. For example, with a few clicks, users cangenerate sophisticated forecasting models. This combination of simplicity and usefulness, of ease of useand analytical depth, is what makes it possible for Tableau Desktop to empower a whole new group ofpeople to become data analysts.
• Data access—Tableau Desktop lets people access and query a large number of common data sources,from traditional database systems like Oracle and SQL Server, to innovative new data stores like SAPHANA and Teradata Aster, to Web applications like salesforce.com and Google Analytics, to spreadsheetsand files, to newly emerging data sources like Hadoop and NoSQL databases. Users can connect tothese data sources with a few clicks, without any scripting or programming.
• Live query—Tableau Desktop translates users’ interactions into live queries. As people use the drag-and-drop interface to examine information, they are automatically generating sophisticated queries againsttheir database. Tableau Desktop can generate queries in a range of query languages including StructuredQuery Language ("SQL"), Multidimensional Expressions ("MDX"), and Salesforce Object QueryLanguage ("SOQL"). Each query is optimized for the target platform and its unique performance andanalytical characteristics. This live query approach allows customers to leverage their investments indatabase infrastructure and enables them to take advantage of query-optimized databases.
• In-memory query—Tableau Desktop contains an in-memory data engine that can be used for rapidanalysis. Many business users have data that is not stored in a database, and many databases are notset-up to support interactive and analytical queries. In these cases, users can import the data into TableauDesktop’s in-memory data engine. This data engine is designed to support analytical queries on hundredsof millions of rows of data with responses rendered in seconds.
• Data integration—Many questions require combining data from multiple sources. Tableau Desktopprovides a number of ways for people to combine data without requiring a typical data loading and
7
transformation project. A Tableau workbook can connect to many different data sources, with each sourceindependently leveraging either a live query or in-memory approach. Users can then combine the data insingle dashboard, visualization, filter or calculation using our Data Blending functionality. This approachcan greatly extend the scope and depth of questions a person can answer.
• Sharing and presentation—Tableau Desktop allows users to author and distribute visualizations anddashboards with the ease expected of everyday office tools like spreadsheets. Content created in TableauDesktop can be embedded in documents and presentations, or the workbooks can be distributed forviewing by people who have Tableau Desktop or Tableau Reader, a free product to view and interact withvisualizations built in Tableau Desktop. Alternately, users can publish their workbooks to Tableau Serverenabling others in the organization to access them using a web browser.
Tableau ServerTableau Server is a powerful business intelligence platform with enterprise-class data management,
scalability and security. The collaborative features of Tableau Server are designed to foster more sharing of datato improve the dissemination of information across an organization and promote improved decision-making.
Tableau Server’s key capabilities include:
• Shared content—Tableau Server provides an easy-to-navigate repository of shared visualizations anddashboards within an organization. After users of Tableau Desktop create and publish their work toTableau Server, any other user with appropriate security credentials can view and interact with it using aWeb browser or mobile application. These viewers can also edit the work and republish it back to theserver. The ability to publish dashboards and easily share impactful visual analysis increases awarenessof business data and promotes improved decision-making. In addition, allowing others to interact with ananalysis gives them deeper understanding of the information which leads to an improved grasp on theproblem and hence greater confidence in the solution.
• Shared data—Just as Tableau Server is a platform for shared analysis, it is also a platform for shareddata. Organizations can use Tableau Server to centrally manage enterprise data sources and metadataenabling knowledge sharing, efficiency, data consistency and security. Business users or IT professionalscan create rich data models, containing calculations, hierarchies, field aliases, sets and groups of interest,and publish them to Tableau Server to be shared across an organization. Others can use these models asa starting point while extending them to meet their own specific analytical needs. While centralized datamodels are not a pre-requisite for analysis in Tableau, they provide flexibility and increased productivitywhile maintaining control and security of data.
• Universal access—We have designed Tableau Server to enable seamless sharing of content acrossdesktop, mobile and Web clients. Once users author and publish analytical content to the server, peopleacross an organization can consume it on different browsers and devices. Further, Tableau Serverautomatically detects the access device being used and adapts the content to take advantage of thedevice’s capabilities including native touch experience, form factor and security. Tableau Server allowsusers to actively subscribe to content for automatic delivery on their devices or pull content on demand.
• Integration—Tableau Server offers APIs that help developers, customers and partners embed andcontrol our software from portals, websites and other enterprise applications. Our APIs can also be usedto construct in-memory databases, upload content and add users to the server programmatically. Inaddition to APIs, we also offer command line utilities to automate management tasks, and data uploadtools to move data rapidly into Tableau Server.
• Scalability—Tableau Server’s distributed multi-tier architecture allows it to scale to tens of thousands ofusers, across desktop, Web and mobile clients, meeting the needs of some of the largest organizationsglobally.
• Security—Tableau Server provides a robust security model that encompasses authentication, data andnetwork security. Tableau Server is also built on a multi-tenant architecture that allows administrators tologically partition a single system across user populations, providing for separation of content.
• Administration—We believe the ease of administering a system is tremendously important to itsadoption. While Tableau Server’s management interface is designed to be simple enough for a line-of-business user, we also provide APIs to allow administrators to automate routine management processes.
8
After the initial setup, many of our customers have reported that they spend little time on Tableau Serveradministration.
Tableau OnlineTableau Online, a cloud-based hosted version of Tableau Server, launched in July 2013. Tableau Online is
built on the Tableau Server platform and provides ease-of use, speed, availability and security without requiringcustomers to manage physical infrastructure. Tableau Online runs in a secure data center and can be accessedby clients remotely using Tableau Desktop, a browser or a mobile device.
Tableau PublicTableau Public is a free cloud-based offering that is available for anyone to use with public data. This
offering allows users of diverse backgrounds, from bloggers and journalists to researchers to governmentworkers, to easily visualize public data on their websites. People who visit these websites can interact with thevisualizations and share them via social media.
Using Tableau Public, data can be transformed into interactive graphs, dashboards and maps for theworld to see on the Web. For example, a blogger focused on economic issues may want to blog about changes inthe U.S. unemployment rate. Using Tableau Public, the blogger can quickly build an interactive visualization usingdata from the U.S. Bureau of Labor Statistics and embed it in his blog. Every time the blog is viewed, TableauPublic serves up the data as a dynamic visualization.
Tableau Public has been used by thousands of people to make public data easy to see and understand.People have used the product to visualize and share data about government budgets, school performance,economic policy, sports statistics and box office trends. Visualizations from Tableau Public have been embeddedin numerous websites including the Wall Street Journal, CNBC, Financial Times, the Guardian, Huffington Post,La Nacion, Le Monde, New Scientist, Gizmodo, the Washington Post, the Irish Times and Oxford University.
Tableau Public enables us to test new product features and engage in user research as well as generategreater awareness of Tableau and increase community engagement. In addition to offering most of the features ofTableau Desktop and Tableau Server, Tableau Public offers the following capabilities:
• Web scale—Tableau Public meets the massive performance requirements of serving dynamic content ontop tier websites including media channels, social media and other consumer internet services. Through acombination of proprietary software and optimized hardware we have designed a highly scalable, multi-tenant, online infrastructure that is based at a secure third party Web hosting facility. Our Tableau Publicservice has served over 300 million views worldwide.
• Social reach—Anyone viewing or interacting with a Tableau Public visualization can share it onFacebook or Twitter. The ease of social sharing has facilitated greater conversations around data onTableau Public.
TechnologyOur powerful and easy-to-use products are built on a foundation of proprietary technologies. Key among
these are VizQL, our Live Query Engine and In-Memory Data Engine, which work together in harmony to createour Hybrid Data Architecture.
Visual Query Language (VizQL) for DatabasesAt the heart of Tableau‘s products is our proprietary and breakthrough technology called VizQL. VizQL is
a visual query language for data that simultaneously describes how to query data and how to present it visually.VizQL can deliver dramatic gains in people’s ability to see and understand data and we believe is unique inseveral important aspects:
• Extensibility and flexibility—VizQL is a computer language for describing pictures of data, includingtables, graphs, charts, maps, time series and tables of visualizations. VizQL unifies these different visualrepresentations into a single framework. Conventional component architectures that underlie reportingpackages and charting wizards contain a fixed number of computer procedures, one for each type ofpicture. VizQL, in contrast, is a language for creating pictures. Each type of picture is a different statementin the language. The extensibility and flexibility of VizQL makes it possible to create a virtually unlimitednumber of visualizations.
9
• Transforms database records to graphical representations—VizQL statements define the mappingfrom records returned from a database to graphical marks on a screen. Some fields in the record controlthe geometric properties of the mark, including position, size and orientation while other fields controlvisual attributes like color, transparency and shape.
• Declarative language—VizQL is a declarative language like other database languages, including SQL.The advantage of a declarative language is that the user describes what picture should be created, nothow to make it. The user need not be aware of underlying implementation as query, analysis andrendering operations run behind the scenes. The result is a portable and more scalable system.
• Defines and controls queries—VizQL procedures define both the resulting picture and the databasequery. Our Live Query Engine generates efficient queries for external databases of many types frommany vendors. VizQL also controls execution of our optimized In-Memory Data Engine to performcalculations in real time.
• Optimized—VizQL’s interpreter is optimized for interactive use, enabling visualization and drawing oflarge data sets. VizQL is specifically designed to take advantage of modern computer graphics hardware,such as the fast rendering chips developed for gaming that are standard on personal computers.
The initial development of VizQL began at Stanford University in 1999. Stanford University has granted usan exclusive license to commercialize the software and related patents resulting from that research. The softwareand related patents generally relate to three subject areas: (1) architecture for creating table-based visualizationsfrom relational databases; (2) graphical user interface for creating specification for table-based visualizations; and(3) an environment for rapid development of interactive visualizations. Our license from Stanford University isexclusive in all fields, worldwide and sublicensable. The license agreement provides for Tableau to own allimprovements to and derivative works of the software that it develops. The license agreement also provides forenforcement of the licensed patents against alleged infringers. If Stanford University and Tableau agree to jointlyenforce the licensed patents against an alleged infringer, the parties equally share the costs and the recovery orsettlement for such enforcement. If Stanford University and Tableau do not agree to jointly enforce the licensedpatents against an alleged infringer, Stanford University and Tableau will each have the right to enforce thelicensed patents against the alleged infringer. If Tableau files such a suit in a United States court, StanfordUniversity joins such suit only for standing purposes, and Tableau wins an award of damages for, or receives asettlement payment for, infringement of a United States licensed patent, Tableau would retain that award orsettlement payment and would be required to negotiate in good faith with Stanford University to compensate it forits expenses in connection with the suit. If Stanford University files such a suit in a United States court, Tableaujoins such suit only for standing purposes, and Stanford University wins an award of damages for, or receives asettlement payment for, infringement of a United States licensed patent, Stanford University would retain thataward or settlement payment. The license agreement does not expire and can be terminated by StanfordUniversity only if Tableau breaches the agreement and does not remedy the breach within thirty days afterreceiving written notice of the alleged breach from Stanford University. We have invested substantial research anddevelopment in VizQL since obtaining these rights. We have also been granted additional patents related to ourcore VizQL technology.
Live Query EngineWe have developed a Live Query Engine that interprets abstract queries generated by VizQL into syntax
understandable by popular database systems. For instance, our Live Query Engine can compile VizQLstatements into optimized SQL and MDX syntax understandable by database systems made by Microsoft, Oracle,IBM, EMC, SAP, Teradata and many other database vendors. As a result, our technology provides customers witha way to increase the accessibility, usability and performance of their databases. It also gives them a uniform userinterface for interacting with databases of diverse vendors, formats and sizes.
It is common for traditional business intelligence products to import data from the organization’s databasesystems. In contrast, Tableau’s Live Query Engine enables people to query databases without having to firstimport the data into our products. Queries generated by our Live Query Engine are interpreted and run by thedatabase, with only the results of each query rendered. This approach offers many advantages for customers:
• Data consistency—Copying data can cause people to work with out-of-date information. Further, eachcopy of the data may represent information at different times leading to inconsistency. With our LiveQuery Engine, customers do not need to create additional copies of their data.
10
• Avoids data movement—Moving and loading data is often time consuming and expensive. With LiveQuery Engine, our customers do not need to move data in order to use our products.
• Scalability—Many database vendors provide massively parallel implementations of databases thatprovide scalable data access to large data sets. These systems can scale in various ways including
scaling the number of tables in the database, the number of records in each table, the number of columns
in each record, the number of users and the number of active queries. These systems also provide
powerful computation capabilities for very large data volumes. Our Live Query Engine allows businesses
to leverage their investment in scalable data infrastructure.
• Security—Transferring data out of a database causes customers to lose the security and permissionsmodels associated with that data. Using our Live Query Engine, customers can leverage the security and
permissions models specified in their database systems.
• Flexibility—The database industry consists of multiple vendors with competitively differentiated products.Our Live Query Engine enables our customers to choose the appropriate technology for their business.
We focus on ensuring our software is compatible with popular database platforms and that our live query
technology works with the most recent releases of those platforms. Our Live Query Engine is compatible with 38
data sources, including those from the top five database vendors in the world.
We have also pioneered connectors to emerging “Big Data” and cloud technologies. We connect to open-
source Hadoop databases, proprietary MapReduce technologies and cloud data warehouses like Amazon
Redshift and Google BigQuery. We also connect to column stores, databases designed to process unstructured
data, and Web applications such as salesforce.com and Google Analytics. We believe the size of the data that our
customers analyze continues to grow. We will continue to develop our live query technology with the goal of
empowering our users to have complete access to any data stored anywhere.
In-Memory Data EngineWe have also developed a fast In-Memory Data Engine that allows people to analyze large amounts of
data independently of database systems. This option is valuable to our customers as it enables them to overcome
the following challenges:
• Lack of databases—Much of the world’s data is not stored in databases. For instance, data is commonlystored in text files, spreadsheets, logs or other formats.
• Limited performance—In addition, much of the world’s data is stored in databases that are too slow forinteractive analysis or reporting.
For these situations, we have developed an In-Memory Data Engine, with the following unique
combination of attributes that enable fast calculations:
• Column-based storage—Our In-Memory Data Engine is based on a column-oriented format which isable to reduce input/output on analytical workloads. It employs a simple disk based representation of data
that leverages the operating systems’ management of virtual memory.
• Compressed data representation—Our technology utilizes compression aimed to keep the memoryfootprint as small as possible.
• Optimization for in-memory analytics—Our In-Memory Data Engine is optimized for analyzing data inrandom access memory ("RAM"). For example, leveraging RAM-based indices our technology is more
efficient than those using disk-based indices.
• Architecture aware algorithms—Our technology is designed to achieve high-throughput on modernprocessors. Key algorithms, such as grouping and aggregation, are designed to be cache and multi-core
aware and adaptive to different hardware characteristics.
By importing data into our In-Memory Data engine, our customers can get many of the benefits of a fast
database without the complication, cost and delay of a new investment in databases systems. Our In-Memory
Data Engine is designed to be used on commodity hardware such as personal computers, laptops and servers
that are common in companies today.
Hybrid Data ArchitectureWe have designed our Live Query Engine and In-Memory Data Engine to work in harmony. This hybrid
approach gives customers flexibility and power. For instance, customers can use our In-Memory Data Engine to
11
import a sample of data from a large database, and then after designing an initial visualization that answers aquestion, run the visualization against the entire database using the live query option. As another example of thehybrid approach, customers can integrate live data with in-memory data in a single visualization or dashboard.Both of these examples can be achieved by business users without any programming or scripting.
Information about Segments and Geographic RevenueInformation about segments and geographic revenue is set forth in Note 9 of the notes to consolidated
financial statements included elsewhere in this report.
SeasonalityWe generally experience seasonal fluctuations in demand for our products and services. Our quarterly
sales are impacted by industry buying patterns. As a result, our sales have generally historically been highest inthe fourth quarter of a calendar year and lowest in the first quarter.
CustomersOur software is designed for anyone with data and questions. Our customers range from the largest
corporations in the world to sole proprietors. Tableau’s ease of installation and maintenance provides the flexibilityto be deployed by individuals, departments or as an enterprise-wide system. We provide our products toorganizations in various industries, including business services, energy and telecommunications, financialservices, Internet, life sciences and healthcare, manufacturing and technology, media and entertainment, publicsector and education, and retail, consumer and distribution.
We have grown our customer accounts from approximately 11,000 as of December 31, 2012 toapproximately 26,000 as of December 31, 2014, located in more than 150 countries. We define a customeraccount as a purchaser of our products. Customer accounts are typically organizations. In some cases,organizations will have multiple groups purchasing our software, which we count as discrete customer accounts.No customer represented more than 10% of our total revenues in 2014, 2013 or 2012.
Support and ServicesOur products are designed for our customers to be able to deploy and use on their own. However, we
offer several programs to enable our customers to maximize their experience and successful use of our products.
Maintenance and SupportOur maintenance and support services provide access to new releases of our software in addition to
technical support services. Our technical support team also fields “how-to” inquiries from customers related tospecific product functionality.
We offer multiple levels of technical support services to our customers from our offices in Seattle,Washington; Kirkland, Washington; London, United Kingdom; and Dublin, Ireland. We offer our highest supportlevel, including a dedicated phone number, to address critical issues, 24 hours a day, seven days a week, year-round. In addition, we offer a variety of support tools on our website including a knowledge base, productdocumentation guides, release notes and drivers. We have also developed an extensive online supportcommunity, which includes forums and user groups that is intended to enable our customers to learn and toconnect with each other.
TrainingIn order to enable our customers to be self-reliant, we offer free online training to customers on our
website, including hundreds of hours of training videos, sample visualizations and best practice articles.
We also provide a variety of fee-based product training options ranging from instructor-led courses in atraditional classroom setting to online courses. These training courses are designed to deepen understanding ofspecific aspects of our products and range from a single day to a week in length.
Professional ServicesWe have also invested in a professional services organization to help our customers maximize their
benefits from using our products. Our professional services are generally intended to accelerate the analyticsprocess rather than focus on installation and configuration of our software, as we believe most of our customersare able to deploy our products without assistance. These services are delivered either in person or remotely, andwe tailor our services engagements to a customer’s specific needs.
12
Tableau Community We have built a strong and growing community of users and partners that help us evangelize our mission.
The purpose of our community is to give customer and prospects opportunities to connect and share theirexperiences and ideas, and to allow them to provide valuable feedback on our products that helps us prioritizeproduct enhancements.
Our online community currently offers:
• knowledge bases, forums and repositories that help users learn about topics of interest, ask questionsand share insights;
• groups, a mechanism that allows users to connect based on geographical location or industry affiliation;• ideas, an avenue to share product suggestions; • Viz Talk, designed to let users share and discuss interesting data visualizations;• blogs; and• news.
We also organize events to engage with our customers and foster our user community. Our seminalevent is our annual U.S. Tableau Customer Conference, which has grown rapidly in the last several years, fromapproximately 180 attendees in 2008 to over 5,500 attendees in 2014. At this event, our customers have theopportunity to network and connect, learn best practices, attend training sessions, and present their questionsand suggestions directly to our software developers, executives and other employees. Based on the positivefeedback and demand for this conference, we expanded this offering internationally with our 2012 and 2013Tableau European Customer Conferences. During 2014, we held Tableau Conference on Tour, which includedevents in: Sydney, Australia; The Hague, Netherlands; Munich, Germany; London, United Kingdom; and Tokyo,Japan. Finally, many of our customers form local user groups that meet periodically to discuss and shareexperiences using our products.
Culture and EmployeesOur culture is fundamental to our success and we embrace and cultivate it with pride. Eight core values
define our culture and govern our approach to business. These consist of teamwork, product leadership, using ourown products, respect, honesty, simplicity and commitment to delighting our customers, as well as our mission tohelp people see and understand data.
Our values permeate our organization and drive our identity as a company. For example, we strive topaint virtually all aspects of our business with a brush of simplicity, from product user interfaces to pricing modelsto internal business processes to marketing strategies. We view our employees as partners in creating a greatwork environment, and we take a long term approach to their recruitment and development. As a result of ourcareful hiring choices, we believe our company is populated by smart, respectful people grounded in humility. Wehave been publicly recognized as one of the best workplaces in the State of Washington.
We desire to make an impact on our community, and in December 2012 we established the TableauFoundation, a donor-advised charitable fund. The focus of the Tableau Foundation will be to encourage the use offacts and analytical reasoning to solve the world’s problems. It is also an avenue to support specific employeecauses.
As of December 31, 2014, we had 1,947 full-time employees globally. We also engage temporaryemployees and consultants. None of our employees are represented by a labor union. We have not experiencedany work stoppages, and we consider our relations with our employees to be good.
Sales and MarketingOur sales and marketing teams collaborate to create market awareness and demand, to build a robust
sales pipeline and to ensure customer success that drives revenue growth.
SalesOur sales efforts are built on a land and expand sales model that is designed to capitalize on the ease of
use, low up-front cost and collaborative capabilities of our software. To facilitate rapid adoption of our products, weprovide fully functional free trial versions of our products on our website and have created a simple pricing modelwith no minimum purchase requirements. After an initial trial or purchase, which is often made to target a specificbusiness need at a grassroots level within an organization, the use of our products often spreads acrossdepartments, divisions and geographies, via word-of-mouth, discovery of new use cases and our sales efforts.
13
Our direct sales approach includes inside sales teams and field sales teams. Our inside sales team,based in regional sales hubs, qualifies and manages accounts throughout the world in a manner in which we canseed new sales at a low cost and expand these accounts over time. Our direct field sales team covers NorthAmerica; Europe, Middle East and Africa; the Asia Pacific region; and Latin America, and is mainly responsible forlead qualification and account management for large enterprises. All our direct sales teams partner with technicalsales representatives who provide presales technical support. We also have a dedicated customer success teamresponsible for driving renewals of existing contracts.
We also sell our products through indirect sales channels including technology vendors, resellers andOEMs and independent software vendors ("ISV") partners. These channels provide additional sales coverage,solution-based selling, services and training throughout the world. Our channel program is led by a dedicatedsales team and provides training, certification and sales resources to our partners. As of December 31, 2014, lessthan 10% of our sales team focused on indirect sales channels. We plan to continue to invest in our partnerprograms to help us enter and grow in new markets while complementing our direct sales efforts.
Our sales organization also includes professional services and training teams that work with customers ofall sizes to support implementations and increase adoption. These efforts include in person and phone-basedengagements, webinars, in-person training and free on-demand training.
MarketingOur marketing efforts focus on establishing our brand, generating awareness, creating leads and
cultivating the Tableau community. The marketing team consists primarily of marketing operations, demandgeneration, enterprise marketing, product marketing, programs, field events, channel marketing, corporatecommunications and visual design teams. We leverage both online and offline marketing channels such as eventsand trade shows, seminars and webinars, third-party analyst reports, whitepapers, case studies, blogs, searchengines and email marketing. A central focus for the marketing team is to drive free product trials and encourageuse of our free online training, an integral part of our customer acquisition process. Our marketing team isresponsible for the logistics of hosting various events, including our annual customer conferences and regionalevents, as well as providing Web-based community tools and supporting customer-driven user groups.
We believe the simplest way to showcase our products is by using them in live or recordeddemonstrations. Our marketing team also promotes Tableau Public to generate awareness. By democratizingaccess to public data and facilitating sharing of insights online, Tableau Public has rapidly increased communityengagement and extended the reach of our products. Interest in this service has grown quickly and isdemonstrated by more than 300 million cumulative Tableau Public page views to date.
Strategic RelationshipsWe view our partners as an extension of our team, playing an integral role in our development and
growth. Our partner programs include technology partnerships, reseller arrangements, and OEM and ISVrelationships. In addition, we also work closely with system integrators, consulting firms and training partners.
Technology VendorsOur most important technology partnerships are with data platform vendors. We collaborate with these
vendors to build high performance connectivity to their data sources. We have 38 optimized data platformconnectors to popular data platforms from vendors such as Amazon.com, Cloudera, Inc., IBM, MicrosoftCorporation, Oracle Corporation, salesforce.com, inc., SAP AG and Teradata Corporation. In addition, some ofour technology partners, such as Teradata Corporation, are resellers of our products.
Resellers/VARsMost of our indirect sales are through resellers. In certain international markets we rely more heavily on
resellers than we do in the United States. Our reseller program is designed to support business growth, helpgenerate new opportunities, optimize customer experience and care, increase profitability and close deals morequickly. We partner with value-added resellers ("VARs"), who provide vertical expertise and technical advice inaddition to reselling or bundling our software. We qualify our partners carefully to help ensure that each has thenecessary capabilities and technical expertise to allow us to deliver even greater value to our customers.
14
OEMsWe believe that software applications made by other companies can benefit from the analytical
capabilities that our products can provide, and we continue to develop relationships with OEM partners thatembed our software into their applications. Currently, we have over 50 OEM relationships. These consist of bothtraditional OEMs that provide a customized version of our products for their applications as well as software-as-a-service ("SaaS") -based OEMs that deliver analytics as a service.
With the release of Tableau 8.0, we introduced API support, which includes a JavaScript API that enablesthird-party applications to control the Tableau application and a Data Extract API that allows partners andcustomers to load data into our products programmatically. We believe these APIs will make it easier to integrateour products with third party products and further advance our partner relationships.
Research and DevelopmentWe invest substantial resources in research and development to drive core technology innovation and to
bring new products to market. Our research and development organization, primarily located in Seattle,Washington, Kirkland, Washington, and Palo Alto, California, is primarily responsible for design, development,testing and certification of our products and core technologies. Our mission-driven culture empowers ouremployees to take ownership and personal pride in building our products. We work hard to create an environmentthat satisfies our talents and intellectual curiosities while promoting the development of broadly impactful andtransformative technologies.
We have historically targeted major product releases on an annual cycle. Since our founding, we havedeveloped eight major versions of our products. In addition, we also provide maintenance releases with bug fixesand incremental functionality, generally on a monthly basis. For example, in the maintenance releases thatfollowed Tableau 8.0, we introduced features such as new data connectors, enhanced security, increased weband mobile interactivity, integration with the R open-source environment for statistical analysis, and improvedmemory usage. Our release cycles enable us to be responsive to customers by delivering new functionality on afrequent basis. We establish priorities for our organization by collaborating closely with our customers, communityand employees. We use our products across all business functions at Tableau, from customer support to financeto sales and marketing to human resources, and every employee is encouraged to test and provide feedback.
Our founders conducted the original research that led to the development of VizQL at Stanford University.We actively invest in an internally focused research effort and collaborate with the research and academiccommunity to keep current with cutting edge technologies and help us to stay at the forefront of innovation.
We are focused on hiring the top technical talent in the industry, top engineering programs and researchinstitutions. Our talented engineers and computer scientists are focused on finding simple and elegant solutions tocomplex problems in information visualization, data analytics, user experience and distributed system design.Over one third of our research and development employees have advanced technical degrees.
Research and development expenses were $110.9 million, $60.8 million and $33.1 million for the yearsended December 31, 2014, 2013 and 2012, respectively.
CompetitionOur current primary competitors generally fall into the following categories:
• large software companies, including suppliers of traditional business intelligence products that provideone or more capabilities that are competitive with our products, such as IBM, Microsoft Corporation,Oracle Corporation and SAP AG
• business analytics software companies, such as Qlik Technologies Inc. ("Qlik"), MicroStrategy and TIBCOSpotfire (a subsidiary of TIBCO Software Inc.)
• analytical tools embedded in SaaS-based products, such as Salesforce Wave
In addition, we may compete with open source initiatives and custom development efforts. We expectcompetition to increase as other established and emerging companies enter the business analytics market, ascustomer requirements evolve and as new products and technologies are introduced. We expect this to beparticularly true with respect to our cloud-based offerings as we and our competitors seek to provide businessanalytics products based on a SaaS platform. This is a relatively new and evolving area of business analyticssolutions, and we anticipate competition to increase based on customer demand for these types of products.
15
Many of our competitors, particularly the large software companies named above, have longer operatinghistories, significantly greater financial, technical, marketing, distribution or other resources and greater namerecognition than we do. In addition, many of our competitors have strong relationships with current and potentialcustomers and extensive knowledge of the business analytics industry. As a result, they may be able to respondmore quickly to new or emerging technologies and changes in customer requirements or devote greaterresources to the development, promotion and sale of their products than us. Moreover, many of these competitorsare bundling their analytics products into larger deals or maintenance renewals, often at significant discounts.Increased competition may lead to price cuts or the introduction of products available for free or a nominal price,fewer customer orders, reduced gross margins, longer sales cycles and loss of market share. We may not be ableto compete successfully against current and future competitors, and our business, results of operations andfinancial condition will be harmed if we fail to meet these competitive pressures.
Intellectual PropertyWe rely on federal, state, common law and international rights, as well as contractual restrictions, to
protect our intellectual property. We control access to our proprietary technology by entering into confidentialityand invention assignment agreements with our employees and contractors, and confidentiality agreements withthird parties, such as service providers, vendors, individuals and entities that may be exploring a businessrelationship with us.
In addition to these contractual arrangements, we also rely on a combination of trade secrets, copyrights,patents, trademarks, service marks and domain names to protect our intellectual property. We pursue theregistration of our copyrights, trademarks, service marks and domain names in the United States and in certainlocations outside the United States.
As of December 31, 2014, we had 13 issued U.S. patents directed to our technology. We also had 25pending patent applications in the United States. We own registered trademarks for Tableau, Tableau Software,VizQL, Show Me! and Data In. Brilliance Out. in the United States, which have various expiration dates unlessrenewed through customary processes. We also own trademark registrations for Tableau, Tableau Software,VizQL, and Show Me! In Canada; Tableau Software and Show Me! in China and Japan; and Tableau Software,VizQL and Show Me! in the European Union. Such registered trademarks will expire unless renewed at varioustimes in the future.
Despite our efforts to protect our proprietary technology and our intellectual property rights, unauthorizedparties may attempt to copy or obtain and use our technology to develop applications with the same functionalityas our applications. Policing unauthorized use of our technology and intellectual property rights is difficult.
We expect that software and other applications in our industry may be subject to third-party infringementclaims as the number of competitors grows and the functionality of applications in different industry segmentsoverlaps. Any of these third parties might make a claim of infringement against us at any time.
Corporate Information We were formed as Tableau Software LLC, a Delaware limited liability company, in 2003, and incorporated
as Tableau Software, Inc., a Delaware corporation in 2004. Our principal executive offices are located at 837 North34th Street, Seattle, Washington 98103, and our telephone number is (206) 633-3400. Our website address iswww.tableau.com. The information on, or that can be accessed through, our website is not part of this report.
Available Information We file annual reports on Form 10-K, quarterly reports on Form 10-Q, current reports on Form 8-K, proxy
and information statements and amendments to reports filed or furnished pursuant to Sections 13(a), 14 and 15(d)of the Securities Exchange Act of 1934, as amended. The public may obtain these filings at the Securities andExchange Commission (SEC)’s Public Reference Room at 100 F Street, NE, Washington, DC 20549 or by callingthe SEC at 1-800-SEC-0330. The SEC also maintains a website at http://www.sec.gov that contains reports, proxyand information statements and other information regarding Tableau Software and other companies that file materialswith the SEC electronically. Copies of Tableau’s reports on Form 10-K, Forms 10-Q and Forms 8-K, may be obtained,free of charge, electronically through our internet website, http://investors.tableau.com/financial-reports-and-filings/default.aspx
16
ITEM 1A. RISK FACTORSOur operations and financial results are subject to various risk and uncertainties, including those
described below. You should carefully consider the following risks and all of the other information contained in thisreport, including our consolidated financial statements and related notes, before making an investment decision.While we believe that the risks and uncertainties described below are the material risks currently facing us,additional risks that we do not yet know of or that we currently think are immaterial may also arise and materiallyaffect our business. If any of the following risks materialize, our business, financial condition and results ofoperations could be materially and adversely affected. In that case, the trading price of our Class A common stockcould decline, and you may lose some or all of your investment.
Risks Related to Our Business and IndustryDue to our rapid growth, we have a limited operating history at our current scale, which makes it difficultto evaluate our future prospects and may increase the risk that we will not be successful.
We have been growing rapidly in recent periods, and as a result have a relatively short history operatingour business at its current scale. For example, we have significantly increased the number of our employees andhave expanded our operations worldwide. Furthermore, we operate in an industry that is characterized by rapidtechnological innovation, intense competition, changing customer needs and frequent introductions of newproducts, technologies and services. We have encountered, and will continue to encounter, risks anduncertainties frequently experienced by growing companies in evolving industries. If our assumptions regardingthese risks and uncertainties, which we use to plan our business, are incorrect or change in reaction to changesin the market, or if we do not address these risks successfully, our operating and financial results could differmaterially from our expectations and our business could suffer.
Our future success will depend in large part on our ability to, among other things:
• hire, integrate, train and retain skilled talent, including members of our direct sales force andsoftware engineers;
• maintain and expand our business, including our operations and infrastructure to support ourgrowth, both domestically and internationally;
• compete with other companies, custom development efforts and open source initiatives that arecurrently in, or may in the future enter, the market for our software;
• expand our customer base, both domestically and internationally; • renew maintenance agreements with, and sell additional products to, existing customers;• improve the performance and capabilities of our software; • maintain high customer satisfaction and ensure quality and timely releases of our products and
product enhancements; • maintain, expand and support our indirect sales channels and strategic partner network; • maintain the quality of our website infrastructure to minimize latency when downloading or
utilizing our software; • increase market awareness of our products and enhance our brand; and • maintain compliance with applicable governmental regulations and other legal obligations,
including those related to intellectual property, international sales and taxation.
If we fail to address the risks and difficulties that we face, including those associated with the challengeslisted above as well as those described elsewhere in this “Risk Factors” section, our business will be adverselyaffected and our results of operations will suffer.
We may not be able to sustain our revenue growth rate or profitability in the future. While we have achieved profitability on an annual basis over the past three years, we have not
consistently achieved profitability on a quarterly basis during that same period. For example, we had net losses inthe fourth quarter of 2012, the first and second quarters of 2013 and the first, second and third quarters of 2014.We expect expenses to increase substantially in the near term, particularly as we make significant investments inour sales and marketing and research and development organizations, expand our operations and infrastructureboth domestically and internationally and develop new products and new features for and enhancements of ourexisting products.
Moreover, as we grow our business, we expect our revenue growth rates to slow in future periods due toa number of reasons, which may include slowing demand for our products, increasing competition, a decrease in
17
the growth of our overall market, our failure, for any reason, to continue to capitalize on growth opportunities, thematuration of our business or the decline in the number of organizations into which we have not alreadyexpanded. Accordingly, our historical revenue growth should not be considered indicative of our futureperformance.
If we are unable to attract, integrate and retain additional qualified personnel, including top technicaltalent, our business could be adversely affected.
Our future success depends in part on our ability to identify, attract, integrate and retain highly skilledtechnical, managerial, sales and other personnel, including top technical talent from the industry and top researchinstitutions. We face intense competition for qualified individuals from numerous other companies, including othersoftware and technology companies, many of whom have greater financial and other resources than we do.These companies also may provide more diverse opportunities and better chances for career advancement.Some of these characteristics may be more appealing to high-quality candidates than those we have to offer. Inaddition, new hires often require significant training and, in many cases, take significant time before they achievefull productivity. We may incur significant costs to attract and retain qualified personnel, including significantexpenditures related to salaries and benefits and compensation expenses related to equity awards, and we maylose new employees to our competitors or other companies before we realize the benefit of our investment inrecruiting and training them. Moreover, new employees may not be or become as productive as we expect, as wemay face challenges in adequately or appropriately integrating them into our workforce and culture. In addition, aswe move into new geographies, we will need to attract and recruit skilled personnel in those areas. We havelimited experience with recruiting in geographies outside of the United States, and may face additional challengesin attracting, integrating and retaining international employees. If we are unable to attract, integrate and retainsuitably qualified individuals who are capable of meeting our growing technical, operational and managerialrequirements, on a timely basis or at all, our business will be adversely affected.
Volatility or lack of positive performance in our stock price may also affect our ability to attract and retainour key employees. Many of our senior management personnel and other key employees have become, or willsoon become, vested in a substantial amount of stock or stock options. Employees may be more likely to leave usif the shares they own or the shares underlying their vested options have significantly appreciated in value relativeto the original purchase prices of the shares or the exercise prices of the options, or, conversely, if the exerciseprices of the options that they hold are significantly above the market price of our common stock. If we are unableto appropriately incentivize and retain our employees through equity compensation, or if we need to increase ourcompensation expenses in order to appropriately incentivize and retain our employees, our business, results ofoperations, financial condition and cash flows would be adversely affected.
We have been growing rapidly and expect to continue to invest in our growth for the foreseeable future. Ifwe fail to manage this growth effectively, our business and results of operations will be adverselyaffected.
We have experienced rapid growth in a relatively short period of time. Our revenues grew to $412.6million in the year ended December 31, 2014 from $127.7 million in the year ended December 31, 2012. Ournumber of full time employees increased to 1,947 at December 31, 2014 from 749 as of December 31, 2012.During this period, we also expanded our operations in outside the United States.
We intend to continue to aggressively grow our business. For example, we plan to continue to hire newemployees at a rapid pace, particularly in our sales and engineering groups. If we cannot adequately train thesenew employees, including our direct sales force, our sales may decrease or our customers may lose confidencein the knowledge and capability of our employees. In addition, we are expanding internationally, establishingoperations in additional countries outside the United States, and we intend to make direct and substantialinvestments to continue our international expansion efforts. We must successfully manage our growth to achieveour objectives. Although our business has experienced significant growth in the past, we cannot provide anyassurance that our business will continue to grow at the same rate, or at all.
Our ability to effectively manage any significant growth of our business will depend on a number offactors, including our ability to do the following:
• effectively recruit, integrate, train and motivate a large number of new employees, including ourdirect sales force, while retaining existing employees, maintaining the beneficial aspects of ourcorporate culture and effectively executing our business plan;
• satisfy existing customers and attract new customers;
18
• successfully introduce new products and enhancements; • continue to improve our operational, financial and management controls;• protect and further develop our strategic assets, including our intellectual property rights; and • make sound business decisions in light of the scrutiny associated with operating as a public
company.
These activities will require significant capital expenditures and allocation of valuable management andemployee resources, and our growth will continue to place significant demands on our management and ouroperational and financial infrastructure.
Our future financial performance and our ability to execute on our business plan will depend, in part, onour ability to effectively manage any future growth. There are no guarantees we will be able to do so in an efficientor timely manner, or at all. In particular, any failure to successfully implement systems enhancements andimprovements will likely negatively impact our ability to manage our expected growth, ensure uninterruptedoperation of key business systems and comply with the rules and regulations that are applicable to publicreporting companies. Moreover, if we do not effectively manage the growth of our business and operations, thequality of our software could suffer, which could negatively affect our brand, results of operations and overallbusiness.
We face intense competition, and we may not be able to compete effectively, which could reduce demandfor our products and adversely affect our business, growth, revenues and market share.
The market for our products is intensely and increasingly competitive and subject to rapidly changingtechnology and evolving standards. In addition, many companies in our target market are offering, or may soonoffer, products and services that may compete with our products.
Our current primary competitors generally fall into the following categories:
• large software companies, including suppliers of traditional business intelligence products thatprovide one or more capabilities that are competitive with our products, such as IBM, MicrosoftCorporation, Oracle Corporation and SAP AG
• business analytics software companies, such as Qlik, MicroStrategy and TIBCO Spotfire (asubsidiary of TIBCO Software Inc.)
• analytical tools embedded in SaaS-based products, such as Salesforce Wave
In addition, we may compete with open source initiatives and custom development efforts. We expectcompetition to increase as other established and emerging companies enter the business analytics softwaremarket, as customer requirements evolve and as new products and technologies are introduced. We expect thisto be particularly true with respect to our cloud-based initiatives as we and our competitors seek to providebusiness analytics products based on a SaaS platform. This is a relatively new and evolving area of businessanalytics solutions, and we anticipate competition to increase based on customer demand for these types ofproducts.
Many of our competitors, particularly the large software companies named above, have longer operatinghistories, significantly greater financial, technical, marketing, distribution, professional services or other resourcesand greater name recognition than we do. In addition, many of our competitors have strong relationships withcurrent and potential customers and extensive knowledge of the business analytics industry. As a result, they maybe able to respond more quickly to new or emerging technologies and changes in customer requirements, forexample by offering a SaaS based product that competes with our on-premise products or our SaaS product,Tableau Online, or devote greater resources to the development, promotion and sale of their products than we do.Moreover, many of these competitors are bundling their analytics products into larger deals or maintenancerenewals, often at significant discounts. Increased competition may lead to price cuts, alternative pricingstructures or the introduction of products available for free or a nominal price, fewer customer orders, reducedgross margins, longer sales cycles and loss of market share. We may not be able to compete successfully againstcurrent and future competitors, and our business, results of operations and financial condition will be harmed if wefail to meet these competitive pressures.
Our ability to compete successfully in our market depends on a number of factors, both within and outsideof our control. Some of these factors include ease and speed of product deployment and use, discovery andvisualization capabilities, analytical and statistical capabilities, performance and scalability, the quality andreliability of our customer service and support, total cost of ownership, return on investment and brand
19
recognition. Any failure by us to compete successfully in any one of these or other areas may reduce the demandfor our products, as well as adversely affect our business, results of operations and financial condition.
Moreover, current and future competitors may also make strategic acquisitions or establish cooperativerelationships among themselves or with others. By doing so, these competitors may increase their ability to meetthe needs of our customers or potential customers. In addition, our current or prospective indirect sales channelpartners may establish cooperative relationships with our current or future competitors. These relationships maylimit our ability to sell or certify our products through specific distributors, technology providers, databasecompanies and distribution channels and allow our competitors to rapidly gain significant market share. Thesedevelopments could limit our ability to obtain revenues from existing and new customers and to maintainmaintenance and support revenues from our existing and new customers. If we are unable to competesuccessfully against current and future competitors, our business, results of operations and financial conditionwould be harmed.
Our success is highly dependent on our ability to penetrate the existing market for business analyticssoftware as well as the growth and expansion of that market.
Although the overall market for business analytics software is well-established, the market for businessanalytics software like ours is relatively new, rapidly evolving and unproven. Our future success will depend inlarge part on our ability to penetrate the existing market for business analytics software, as well as the continuedgrowth and expansion of what we believe to be an emerging market for analytics solutions that are faster, easierto adopt, easier to use and more focused on self-service capabilities. It is difficult to predict customer adoptionand renewal rates, customer demand for our products, the size, growth rate and expansion of these markets, theentry of competitive products or the success of existing competitive products. Our ability to penetrate the existingmarket and any expansion of the emerging market depends on a number of factors, including the cost,performance and perceived value associated with our products, as well as customers' willingness to adopt adifferent approach to data analysis. Furthermore, many potential customers have made significant investments inlegacy business analytics software systems and may be unwilling to invest in new software. If we are unable topenetrate the existing market for business analytics software, the emerging market for self-service analyticssolutions fails to grow or expand, or either of these markets decreases in size, our business, results of operationsand financial condition would be adversely affected.
Our future quarterly results of operations may fluctuate significantly due to a wide range of factors, whichmakes our future results difficult to predict.
Our revenues and results of operations could vary significantly from quarter to quarter as a result ofvarious factors, many of which are outside of our control, including:
• costs related to the hiring, training and maintenance of our direct sales force; • the timing of satisfying revenue recognition criteria, particularly with regard to large transactions; • the expansion of our customer base; • the renewal of maintenance agreements with, and sales of additional products to, existing
customers; • seasonal variations in our sales, which have generally historically been highest in the fourth
quarter of a calendar year and lowest in the first quarter; • the size, timing and terms of our perpetual license sales to both existing and new customers; • the mix of direct sales versus sales through our indirect sales channels; • the timing and growth of our business, in particular through our hiring of new employees and
international expansion; • the introduction of products and product enhancements by existing competitors or new entrants
into our market, and changes in pricing for products offered by us or our competitors;• customers delaying purchasing decisions in anticipation of new products or product
enhancements by us or our competitors or otherwise; • changes in customers' budgets; • customer acceptance of and willingness to pay for new versions of our products; • seasonal variations related to sales and marketing and other activities, such as expenses related
to our annual customer conferences; • our ability to control costs, including our operating expenses; • fluctuations in our effective tax rate; and
20
• general economic and political conditions, both domestically and internationally, as well aseconomic conditions specifically affecting industries in which our customers operate.
Any one of these or other factors discussed elsewhere in this report may result in fluctuations in ourrevenues and operating results, meaning that quarter-to-quarter comparisons of our revenues, results ofoperations and cash flows may not necessarily be indicative of our future performance.
We may not be able to accurately predict our future revenues or results of operations. For example, alarge percentage of the revenues we recognize each quarter has been attributable to sales made in the lastmonth of that same quarter. Our license revenues, which are primarily attributable to perpetual licenses, inparticular can be impacted by short-term shifts in customer demand. As a result, our ability to forecast revenueson a quarterly or longer-term basis is limited. In addition, we base our current and future expense levels on ouroperating plans and sales forecasts, and our operating expenses are expected to be relatively fixed in the shortterm. Accordingly, we may not be able to reduce our costs sufficiently to compensate for an unexpected shortfallin revenues, and even a small shortfall in revenues could disproportionately and adversely affect our financialresults for that quarter. The variability and unpredictability of these and other factors could result in our failing tomeet or exceed financial expectations for a given period.
If we are unable to attract new customers and expand sales to existing customers, both domestically andinternationally, our growth could be slower than we expect and our business may be harmed.
Our future growth depends in part upon increasing our customer base. Our ability to achieve significantgrowth in revenues in the future will depend, in large part, upon the effectiveness of our marketing efforts, bothdomestically and internationally, and our ability to attract new customers. This may be particularly challengingwhere an organization has already invested substantial personnel and financial resources to integrate traditionalbusiness intelligence products into its business, as such organization may be reluctant or unwilling to invest in anew product. If we fail to attract new customers and maintain and expand those customer relationships, ourrevenues will grow more slowly than expected and our business will be harmed.
Our future growth also depends upon expanding sales of our products to and renewing license andmaintenance agreements with existing customers and their organizations. If our customers do not purchaseadditional licenses or capabilities, our revenues may grow more slowly than expected, may not grow at all or maydecline. Additionally, increasing incremental sales to our current customer base requires increasinglysophisticated and costly sales efforts that are targeted at senior management. There can be no assurance thatour efforts would result in increased sales to existing customers ("upsells"), and additional revenues. If our effortsto upsell to our customers are not successful, our business would suffer. Moreover, while most of our software islicensed and sold under perpetual license agreements, we also enter into term license agreements with some ofour customers and offer a SaaS-based product, Tableau Online, which is sold on a subscription basis. In addition,all of our maintenance and support agreements are sold on a term basis. In order for us to grow our revenues andincrease profitability, it is important that our existing customers renew their maintenance and support agreementsand their term licenses, if applicable, when the initial contract term expires. Our customers have no obligation torenew their term licenses or maintenance and support contracts with us after the initial terms have expired. Ourcustomers' renewal rates may decline or fluctuate as a result of a number of factors, including their satisfaction ordissatisfaction with our software or professional services, our pricing or pricing structure, the pricing or capabilitiesof products or services offered by our competitors, the effects of economic conditions, or reductions in ourcustomers' spending levels. If our customers do not renew their agreements with us, or renew on terms lessfavorable to us, our revenues may decline.
We derive substantially all of our revenues from a limited number of software products. We currently derive and expect to continue to derive substantially all of our revenues from our Tableau
Desktop, Tableau Server and Tableau Online software products. As such, the continued growth in market demandof these software products is critical to our continued success. Demand for our software is affected by a numberof factors, including continued market acceptance of our products, the timing of development and release of newproducts by our competitors, price changes by us or by our competitors, technological change, growth orcontraction in the traditional and expanding business analytics market, and general economic conditions andtrends. If we are unable to continue to meet customer demands or to achieve more widespread marketacceptance of our software, our business, results of operations, financial condition and growth prospects will bematerially and adversely affected.
21
Our success depends on increasing the number and value of enterprise sales transactions, whichtypically involve a longer sales cycle, greater deployment challenges and additional support and servicesthan sales to individual purchasers of our products.
Growth in our revenues and profitability depends in part on our ability to complete more and largerenterprise sales transactions. During 2014 there were 781 sales transactions greater than $100,000 as comparedto 455 sales transactions greater than $100,000 in 2013, representing an increase of 72%. These largertransactions may involve significant customer negotiation. Enterprise customers may undertake a significantevaluation process, which can last from several months to a year or longer. For example, in recent periods,excluding renewals, our transactions over $100,000 have generally taken over three months to close. Anyindividual transaction may take substantially longer than three months to close. If our sales cycle were to lengthenin this manner, events may occur during this period that affect the size or timing of a purchase or even causecancellations, which may lead to greater unpredictability in our business and results of operations. We will spendsubstantial time, effort and money on enterprise sales efforts without any assurance that our efforts will produceany sales.
We may also face unexpected deployment challenges with enterprise customers or more complicatedinstallations of our software platform. It may be difficult to deploy our software platform if the customer hasunexpected database, hardware or software technology issues. Additional deployment complexities may occur if acustomer hires a third party to deploy or implement our products or if one of our indirect sales channel partnersleads the implementation of our products. In addition, enterprise customers may demand more configuration andintegration services, which increase our upfront investment in sales and deployment efforts, with no guaranteethat these customers will increase the scope of their use. As a result of these factors, we must devote a significantamount of sales support and professional services resources to individual customers, increasing the cost and timerequired to complete sales. Any difficulties or delays in the initial implementation, configuration or integration ofour products could cause customers to reject our software or lead to the delay in or failure to obtain future orderswhich would harm our business, results of operations and financial condition.
If our new products and product enhancements do not achieve sufficient market acceptance, our resultsof operations and competitive position will suffer.
We spend substantial amounts of time and money to research and develop new software and enhancedversions of our existing software to incorporate additional features, improve functionality, function in concert withnew technologies or changes to existing technologies and allow our customers to analyze a wide range of datasources. When we develop a new product or an enhanced version of an existing product, we typically incurexpenses and expend resources upfront to market, promote and sell the new offering. Therefore, when wedevelop and introduce new or enhanced products, they must achieve high levels of market acceptance in order tojustify the amount of our investment in developing and bringing them to market.
Further, we may make changes to our software that our customers do not find useful. We may alsodiscontinue certain features, begin to charge for certain features that are currently free or increase fees for any ofour features or usage of our software. We may also face unexpected problems or challenges in connection withnew product or feature introductions.
Our new products or product enhancements, such as Tableau Online and our most recent release,Tableau 8.3, and changes to our existing software could fail to attain sufficient market acceptance for manyreasons, including:
• failure to predict market demand accurately in terms of software functionality and capability or tosupply software that meets this demand in a timely fashion;
• inability to operate effectively with the technologies, systems or applications of our existing orpotential customers;
• defects, errors or failures; • negative publicity about their performance or effectiveness; • delays in releasing our new software or enhancements to our existing software to the market; • the introduction or anticipated introduction of competing products by our competitors; • an ineffective sales force; • poor business conditions for our end-customers, causing them to delay purchases; and • the reluctance of customers to purchase software incorporating open source software.
22
In addition, because our products are designed to operate on and with a variety of systems, we will needto continuously modify and enhance our products to keep pace with changes in technology. We may not besuccessful in either developing these modifications and enhancements or in bringing them to market in a timelyfashion.
If our new software or enhancements and changes do not achieve adequate acceptance in the market,our competitive position will be impaired, and our revenues could decline. The adverse effect on our results ofoperations may be particularly acute because of the significant research, development, marketing, sales andother expenses we will have incurred in connection with the new software or enhancements.
We are dependent on the continued services and performance of our senior management and other keypersonnel, the loss of any of whom could adversely affect our business.
Our future success depends in large part on the continued contributions of our senior management andother key personnel. In particular, the leadership of key management personnel is critical to the successfulmanagement of our company, the development of our products, and our strategic direction. We do not maintain“key person” insurance for any member of our senior management team or any of our other key employees. Oursenior management and key personnel are all employed on an at-will basis, which means that they couldterminate their employment with us at any time, for any reason and without notice. The loss of any of our keymanagement personnel could significantly delay or prevent the achievement of our development and strategicobjectives and adversely affect our business.
Our growth depends on being able to expand our direct sales force successfully. To date, most of our revenues have been attributable to the efforts of our direct sales force in the United
States. In order to increase our revenues and profitability, we must increase the size of our direct sales force, bothin the United States and internationally, to generate additional revenues from new and existing customers. Weintend to substantially further increase our number of direct sales professionals.
We believe that there is significant competition for sales personnel with the skills and technical knowledgethat we require. Our ability to achieve significant revenue growth will depend, in large part, on our success inrecruiting, training and retaining sufficient numbers of direct sales personnel to support our growth. New hiresrequire significant training and may take significant time before they achieve full productivity. Our recent hires andplanned hires may not become productive as quickly as we expect, and we may be unable to hire or retainsufficient numbers of qualified individuals in the markets where we do business or plan to do business. In addition,as we continue to grow rapidly, a large percentage of our sales force will be new to our company and ourproducts, which may adversely affect our sales if we cannot train our sales force quickly or effectively. Attritionrates may increase and we may face integration challenges as we continue to seek to aggressively expand oursales force. If we are unable to hire and train sufficient numbers of effective sales personnel, or the salespersonnel are not successful in obtaining new customers or increasing sales to our existing customer base, ourbusiness will be adversely affected.
If we cannot maintain our corporate culture as we grow, we could lose the innovation, teamwork, passionand focus on execution that we believe contribute to our success, and our business may be harmed.
We believe that our corporate culture has been a critical component to our success. We have investedsubstantial time and resources in building our team. As we grow and mature as a public company, we may find itdifficult to maintain our corporate culture. Any failure to preserve our culture could negatively affect our futuresuccess, including our ability to recruit and retain personnel and effectively focus on and pursue our corporateobjectives.
Real or perceived errors, failures or bugs in our software could adversely affect our results of operationsand growth prospects.
Because our software is complex, undetected errors, failures or bugs may occur, especially when newversions or updates are released. Our software is often installed and used in large-scale computing environmentswith different operating systems, system management software, and equipment and networking configurations,which may cause errors or failures of our software or other aspects of the computing environment into which it isdeployed. In addition, deployment of our software into computing environments may expose undetected errors,compatibility issues, failures or bugs in our software. Despite testing by us, errors, failures or bugs may not befound in our software until it is released to our customers. Moreover, our customers could incorrectly implement orinadvertently misuse our software, which could result in customer dissatisfaction and adversely impact theperceived utility of our products as well as our brand. Any of these real or perceived errors, compatibility issues,
23
failures or bugs in our software could result in negative publicity, reputational harm, loss of or delay in marketacceptance of our software, loss of competitive position or claims by customers for losses sustained by them. Insuch an event, we may be required, or may choose, for customer relations or other reasons, to expend additionalresources in order to help correct the problem. Alleviating any of these problems could require significantexpenditures of our capital and other resources and could cause interruptions, delays or cessation of ourlicensing, which could cause us to lose existing or potential customers and could adversely affect our results ofoperations and growth prospects.
Interruptions or performance problems, including any caused by cyber-attacks or associated with ourtechnology and infrastructure, may adversely affect our business and results of operations.
We have in the past experienced, and may in the future experience, performance issues due to a varietyof factors, including infrastructure changes, human or software errors, website or third-party hosting disruptions orcapacity constraints due to a number of potential causes including technical failures, cyber-attacks, securityvulnerabilities, natural disasters or fraud. If our security is compromised, our website is unavailable or our usersare unable to download our software within a reasonable amount of time or at all, our business could benegatively affected. Moreover, if our security measures, products or services are subject to cyber-attacks thatdegrade or deny the ability of users to access our website, Tableau Online, or other products or services, ourproducts or services may be perceived as unsecure and we may incur significant legal and financial exposure. Inparticular, our cloud-based products, Tableau Online and Tableau Public, may be especially vulnerable tointerruptions, performance problems or cyber-attacks. In some instances, we may not be able to identify thecause or causes of these performance problems within an acceptable period of time. These cloud-based productsare hosted at third-party data centers that are not under our direct control. If these data centers were to bedamaged or suffer disruption, our ability to provide these products to our customers could be impaired and ourreputation could be harmed.
In addition, it may become increasingly difficult to maintain and improve our website performance,especially during peak usage times and as our software becomes more complex and our user traffic increases.Adverse consequences could include unanticipated system disruptions, slower response times, degradation inlevel of customer support, and impaired quality of users' experiences, and could result in customer dissatisfactionand the loss of existing customers. We expect to continue to make significant investments to maintain andimprove website performance and security and to enable rapid and secure releases of new features andapplications for our software. To the extent that we do not effectively address capacity constraints, upgrade oursystems as needed and continually develop our technology and network architecture to accommodate actual andanticipated changes in technology, our business and results of operations may be adversely affected.
We also rely on SaaS technologies from third parties in order to operate critical functions of our business,including financial management services from NetSuite Inc. and customer relationship management services fromsalesforce.com, inc. If these services become unavailable due to extended outages or interruptions, securityvulnerabilities or cyber-attacks, or because they are no longer available on commercially reasonably terms orprices, our expenses could increase, our ability to manage these critical functions could be interrupted and ourprocesses for managing sales of our software and supporting our customers could be impaired until equivalentservices, if available, are identified, obtained and implemented, all of which could adversely affect our business.
Breaches in our security, cyber-attacks or other cyber-risks could expose us to significant liability andcause our business and reputation to suffer.
Our operations involve transmission and processing of our customers' confidential, proprietary andsensitive information including, in some cases, personally identifiable information and credit card information. Wehave legal and contractual obligations to protect the confidentiality and appropriate use of customer data. Despiteour security measures, our information technology and infrastructure may be vulnerable to attacks as a result ofthird party action, employee error or misconduct. Security risks, including but not limited to, unauthorized use ordisclosure of customer data, theft of proprietary information, denial of service attacks, loss or corruption ofcustomer data, and computer hacking attacks or other cyber-attacks, could expose use to substantial litigationexpenses and damages, indemnity and other contractual obligations, government fines and penalties, mitigationexpenses and other liabilities. Because techniques used to obtain unauthorized access or to sabotage systemschange frequently and generally are not recognized until successfully launched against a target, we may beunable to anticipate these techniques or to implement adequate preventative measures. If an actual or perceivedbreach of our security occurs, the market perception of the effectiveness of our security measures could be
24
harmed, we could lose potential sales and existing customers, our ability to operate our business could beimpaired, and we may incur significant liabilities.
Our products use third-party software and services that may be difficult to replace or cause errors orfailures of our products that could lead to a loss of customers or harm to our reputation and ouroperating results.
We license third-party software and depend on services from various third parties for use in our products.In the future, this software or these services may not be available to us on commercially reasonable terms, or atall. Any loss of the right to use any of the software or services could result in decreased functionality of ourproducts until equivalent technology is either developed by us or, if available from another provider, is identified,obtained and integrated, which could harm our business. In addition, any errors or defects in or failures of thethird-party software or services could result in errors or defects in our products or cause our products to fail, whichcould harm our business and be costly to correct. Many of these providers attempt to impose limitations on theirliability for such errors, defects or failures, and if enforceable, we may have additional liability to our customers orthird-party providers that could harm our reputation and increase our operating costs.
We will need to maintain our relationships with third-party software and service providers, and to obtainsoftware and services from such providers that do not contain any errors or defects. Any failure to do so couldadversely impact our ability to deliver effective products to our customers and could harm our operating results.
If customers demand products that provide business analytics via a SaaS business model, our businesscould be adversely affected.
We believe that companies have begun to expect that key software be provided through a SaaS model,and customers may eventually require that we provide our product via a SaaS deployment. In July 2013, welaunched Tableau Online, our cloud-based service that provides our software's core capabilities as a commercialSaaS offering. We anticipate using our current cash or future cash flows to fund further development of thisproduct, and we may encounter difficulties that cause our costs to exceed our current expectations. Moreover, asdemand increases, we will need to make additional investments in related infrastructure such as server farms,data centers, network bandwidth and technical operations personnel. All of these investments will negatively affectour operating results. Even if we make these investments, we may be unsuccessful in achieving significantmarket acceptance of this new product. Moreover, sales of a potential future SaaS offering by our competitorscould adversely affect sales of all of our existing products. In addition, increasing sales of our SaaS offering couldcannibalize license sales of our on-premise desktop and server products to our existing and prospectivecustomers, which could negatively impact our overall sales growth. The migration of our customers to a SaaSmodel would also change the manner in which we recognize revenue, which could adversely affect our operatingresults and business operations.
Our success depends on our ability to maintain and expand our indirect sales channels. Historically, we have used indirect sales channel partners, such as original equipment manufacturers,
technology partners, systems integrators and resellers, to a limited degree. Indirect sales channel partners arebecoming an increasingly important aspect of our business, particularly with regard to enterprise and internationalsales. Our future growth in revenues and profitability depends in part on our ability to identify, establish and retainsuccessful channel partner relationships in the United States and internationally, which will take significant timeand resources and involve significant risk.
We cannot be certain that we will be able to identify suitable indirect sales channel partners. To the extentwe do identify such partners, we will need to negotiate the terms of a commercial agreement with them underwhich the partner would distribute our products. We cannot be certain that we will be able to negotiatecommercially-attractive terms with any channel partner, if at all. In addition, all channel partners must be trained todistribute our products. In order to develop and expand our distribution channel, we must develop and improveour processes for channel partner introduction and training.
We also cannot be certain that we will be able to maintain successful relationships with any channelpartners. These channel partners may not have an exclusive relationship with us, and may offer customers theproducts of several different companies, including products that compete with ours. With or without an exclusiverelationship, we cannot be certain that they will prioritize or provide adequate resources for selling our products. Alack of support by any of our channel partners may harm our ability to develop, market, sell or support ourproducts, as well as harm our brand. There can be no assurance that our channel partners will comply with theterms of our commercial agreements with them or will continue to work with us when our commercial agreements
25
with them expire or are up for renewal. If we are unable to maintain our relationships with these channel partners,
or these channel partners fail to live up to their contractual obligations, our business, results of operations and
financial condition could be harmed.
Our long-term growth depends in part on being able to expand internationally on a profitable basis. Historically, we have generated a substantial majority of our revenues from customers inside the United
States and Canada. For example, approximately 77% of our total revenues in the year ended December 31, 2014
was derived from sales within the United States and Canada. We plan to continue to expand our international
operations as part of our growth strategy. Expanding our international operations will subject us to a variety of
risks and challenges, including:
• increased management, travel, infrastructure, legal compliance and regulation costs associated
with having multiple international operations;
• management communication and integration problems resulting from geographic dispersion and
language and cultural differences;
• sales and customer service challenges associated with operating in different countries;
• increased reliance on indirect sales channel partners outside the United States;
• longer payment cycles and difficulties in collecting accounts receivable or satisfying revenue
recognition criteria, especially in emerging markets;
• increased financial accounting and reporting burdens and complexities;
• general economic or political conditions in each country or region;
• economic uncertainty around the world and adverse effects arising from economic
interdependencies across countries and regions;
• compliance with foreign laws and regulations and the risks and costs of non-compliance with
such laws and regulations;
• compliance with laws and regulations for foreign operations, including the U.S. Foreign Corrupt
Practices Act, the U.K. Bribery Act, import and export control laws, tariffs, trade barriers,
economic sanctions and other regulatory or contractual limitations on our ability to sell our
software in certain foreign markets, and the risks and costs of non-compliance;
• heightened risks of unfair or corrupt business practices in certain geographies and of improper or
fraudulent sales arrangements that may impact financial results and result in restatements of
financial statements and irregularities in financial statements;
• fluctuations in currency exchange rates and related effects on our results of operations;
• difficulties in transferring or, if we determine to do so, repatriating funds from or converting
currencies in certain countries;
• the need for localized software and licensing programs;
• reduced protection for intellectual property rights in certain countries and practical difficulties and
costs of enforcing rights abroad; and
• compliance with the laws of numerous foreign taxing jurisdictions and overlapping of different tax
regimes.
Any of these risks could adversely affect our international operations, reduce our international revenues
or increase our operating costs, adversely affecting our business, results of operations and financial condition and
growth prospects.
For example, compliance with laws and regulations applicable to our international operations increases
our cost of doing business in foreign jurisdictions. We may be unable to keep current with changes in government
requirements as they change from time to time. Failure to comply with these regulations could have adverse
effects on our business. In addition, in many foreign countries it is common for others to engage in business
practices that are prohibited by our internal policies and procedures or U.S. laws and regulations applicable to us.
As we grow, we continue to implement compliance procedures designed to prevent violations of these laws and
regulations. There can be no assurance that all of our employees, contractors, indirect sales channel partners and
agents will comply with the formal policies we will implement, or applicable laws and regulations. Violations of
laws or key control policies by our employees, contractors, channel partners or agents could result in delays in
revenue recognition, financial reporting misstatements, fines, penalties, or the prohibition of the importation or
exportation of our software and services and could have a material adverse effect on our business and results of
operations.
26
We are obligated to develop and maintain proper and effective internal control over financial reporting.These internal controls may not be determined to be effective, which may adversely affect investorconfidence in our company and, as a result, the value of our Class A common stock.
We are required, pursuant to Section 404 of the Sarbanes-Oxley Act, to furnish a report by managementon, among other things, the effectiveness of our internal control over financial reporting for our fiscal year 2014.This assessment includes disclosure of any material weaknesses identified by our management in our internalcontrol over financial reporting. We are also required to have our independent registered public accounting firmissue an opinion on the effectiveness of our internal control over financial reporting for fiscal year 2014. During theevaluation and testing process, if we identify one or more material weaknesses in our internal control overfinancial reporting, we will be unable to assert that our internal control over financial reporting is effective.
If we are unable to assert that our internal control over financial reporting is effective, or if ourindependent registered public accounting firm is unable to express an opinion on the effectiveness of our internalcontrol over financial reporting, we could lose investor confidence in the accuracy and completeness of ourfinancial reports, which could cause the price of our common stock to decline, and we may be subject toinvestigation or sanctions by the SEC.
Our business is highly dependent upon our brand recognition and reputation, and the failure to maintainor enhance our brand recognition or reputation would likely adversely affect our business and results ofoperations.
We believe that maintaining and enhancing the Tableau brand identity and our reputation are critical toour relationships with our customers and channel partners and to our ability to attract new customers and channelpartners. We also believe that the importance of our brand recognition and reputation will continue to increase ascompetition in our market continues to develop. Our success in this area will depend on a wide range of factors,some of which are beyond our control, including the following:
• the efficacy of our marketing efforts; • our ability to continue to offer high-quality, innovative and error- and bug-free products;• our ability to retain existing customers and obtain new customers; • our ability to maintain high customer satisfaction; • the quality and perceived value of our products; • our ability to successfully differentiate our products from those of our competitors; • actions of our competitors and other third parties; • our ability to provide customer support and professional services; • any misuse or perceived misuse of our products; • positive or negative publicity; • interruptions, delays or attacks on our website; and • litigation- or regulatory-related developments.
Our brand promotion activities may not be successful or yield increased revenues.
Independent industry analysts often provide reviews of our products, as well as those of our competitors,and perception of our products in the marketplace may be significantly influenced by these reviews. If thesereviews are negative, or less positive as compared to those of our competitors' products and services, our brandmay be adversely affected.
Furthermore, negative publicity, whether or not justified, relating to events or activities attributed to us, ouremployees, our partners or others associated with any of these parties, may tarnish our reputation and reduce thevalue of our brand. Damage to our reputation and loss of brand equity may reduce demand for our products andhave an adverse effect on our business, operating results and financial condition. Moreover, any attempts torebuild our reputation and restore the value of our brand may be costly and time consuming, and such efforts maynot ultimately be successful.
Economic uncertainties or downturns could materially adversely affect our business. Current or future economic uncertainties or downturns could adversely affect our business and results of
operations. Negative conditions in the general economy both in the United States and abroad, includingconditions resulting from changes in gross domestic product growth, the continued sovereign debt crisis, potentialfuture government shutdowns, the federal government's failure to raise the debt ceiling, financial and creditmarket fluctuations, political deadlock, natural catastrophes, warfare and terrorist attacks on the United States,Europe, the Asia Pacific region or elsewhere, could cause a decrease in business investments, including
27
corporate spending on business analytics software in general and negatively affect the rate of growth of ourbusiness.
Although legislation was recently passed to lift the debt ceiling, the law only does so through March 2015.The efforts of legislators to pass additional short- or longer-term spending bills, could lead to additional shutdownsor other disruptions. In addition, general worldwide economic conditions have experienced a significant downturnand continue to remain unstable. These conditions make it extremely difficult for our customers and us to forecastand plan future business activities accurately, and they could cause our customers to reevaluate their decisions topurchase our products, which could delay and lengthen our sales cycles or result in cancellations of plannedpurchases. Furthermore, during challenging economic times our customers may tighten their budgets and faceissues in gaining timely access to sufficient credit, which could result in an impairment of their ability to maketimely payments to us. In turn, we may be required to increase our allowance for doubtful accounts, which wouldadversely affect our financial results.
To the extent purchases of our software are perceived by customers and potential customers to bediscretionary, our revenues may be disproportionately affected by delays or reductions in general informationtechnology spending. Also, customers may choose to develop in-house software as an alternative to using ourproducts. Moreover, competitors may respond to market conditions by lowering prices and attempting to lureaway our customers. In addition, the increased pace of consolidation in certain industries may result in reducedoverall spending on our software.
We cannot predict the timing, strength or duration of any economic slowdown, instability or recovery,generally or within any particular industry. If the economic conditions of the general economy or industries inwhich we operate do not improve, or worsen from present levels, our business, results of operations, financialcondition and cash flows could be adversely affected.
If currency exchange rates fluctuate substantially in the future, the results of our operations, which arereported in U.S. dollars, could be adversely affected.
As we continue to expand our international operations, we become more exposed to the effects offluctuations in currency exchange rates. Although we expect an increasing number of sales contracts to bedenominated in currencies other than the U.S. dollar in the future, our sales contracts have historically beendenominated in U.S. dollars, and therefore most of our revenues have not been subject to foreign currency risk.However, a strengthening of the U.S. dollar could increase the real cost of our software to our customers outsideof the United States, which could adversely affect our business, results of operations, financial condition and cashflows. In addition, we incur expenses for employee compensation and other operating expenses at our non-U.S.locations in the local currency. Fluctuations in the exchange rates between the U.S. dollar and other currenciescould result in the dollar equivalent of such expenses being higher. This could have a negative impact on ourreported results of operations. Although we may in the future decide to undertake foreign exchange hedgingtransactions to cover a portion of our foreign currency exchange exposure, we currently do not hedge ourexposure to foreign currency exchange risks.
Failure to protect our intellectual property rights could adversely affect our business. Our success depends, in part, on our ability to protect proprietary methods and technologies that we
develop or license under patent and other intellectual property laws of the United States, so that we can preventothers from using our inventions and proprietary information. If we fail to protect our intellectual property rightsadequately, our competitors might gain access to our technology, and our business might be adversely affected.However, defending our intellectual property rights might entail significant expenses. Any of our patent rights,copyrights, trademarks or other intellectual property rights may be challenged by others, weakened or invalidatedthrough administrative process or litigation.
As of December 31, 2014, we had 13 issued U.S. patents covering our technology and 25 patentapplications pending for examination in the United States. The patents that we own or license from others(including those that have issued or may issue in the future) may not provide us with any competitive advantagesor may be challenged by third parties, and our patent applications may never be granted.
Additionally, the process of obtaining patent protection is expensive and time-consuming, and we may notbe able to prosecute all necessary or desirable patent applications at a reasonable cost or in a timely manner.Even if issued, there can be no assurance that these patents will adequately protect our intellectual property, asthe legal standards relating to the validity, enforceability and scope of protection of patent and other intellectualproperty rights are uncertain.
28
Any patents that are issued may subsequently be invalidated or otherwise limited, allowing othercompanies to develop offerings that compete with ours, which could adversely affect our competitive businessposition, business prospects and financial condition. In addition, issuance of a patent does not guarantee that wehave a right to practice the patented invention. Patent applications in the United States are typically not publisheduntil 18 months after filing or, in some cases, not at all, and publications of discoveries in industry-related literaturelag behind actual discoveries. We cannot be certain that third parties do not have blocking patents that could beused to prevent us from marketing or practicing our patented software or technology.
Effective patent, trademark, copyright and trade secret protection may not be available to us in everycountry in which our software is available. The laws of some foreign countries may not be as protective ofintellectual property rights as those in the United States (in particular, some foreign jurisdictions do not permitpatent protection for software), and mechanisms for enforcement of intellectual property rights may beinadequate. Additional uncertainty may result from changes to intellectual property legislation enacted in theUnited States, including the recent America Invents Act, and other national governments and from interpretationsof the intellectual property laws of the United States and other countries by applicable courts and agencies.Accordingly, despite our efforts, we may be unable to prevent third parties from infringing upon ormisappropriating our intellectual property.
We rely in part on trade secrets, proprietary know-how and other confidential information to maintain ourcompetitive position. Although we endeavor to enter into non-disclosure agreements with our employees,licensees and others who may have access to this information, we cannot assure you that these agreements orother steps we have taken will prevent unauthorized use, disclosure or reverse engineering of our technology.Moreover, third parties may independently develop technologies or products that compete with ours, and we maybe unable to prevent this competition.
We might be required to spend significant resources to monitor and protect our intellectual property rights.We may initiate claims or litigation against third parties for infringement of our proprietary rights or to establish thevalidity of our proprietary rights. Litigation also puts our patents at risk of being invalidated or interpreted narrowlyand our patent applications at risk of not issuing. Additionally, we may provoke third parties to assertcounterclaims against us. We may not prevail in any lawsuits that we initiate, and the damages or other remediesawarded, if any, may not be commercially viable. Any litigation, whether or not resolved in our favor, could result insignificant expense to us and divert the efforts of our technical and management personnel, which may adverselyaffect our business, results of operations, financial condition and cash flows.
We may be subject to intellectual property rights claims by third parties, which are extremely costly todefend, could require us to pay significant damages and could limit our ability to use certaintechnologies.
Companies in the software and technology industries, including some of our current and potentialcompetitors, own large numbers of patents, copyrights, trademarks and trade secrets and frequently enter intolitigation based on allegations of infringement or other violations of intellectual property rights. In addition, many ofthese companies have the capability to dedicate substantially greater resources to enforce their intellectualproperty rights and to defend claims that may be brought against them. The litigation may involve patent holdingcompanies or other adverse patent owners that have no relevant product revenues and against which our patentsmay therefore provide little or no deterrence. We have received, and may in the future receive, notices that claimwe have misappropriated, misused, or infringed other parties' intellectual property rights, and, to the extent wegain greater market visibility, we face a higher risk of being the subject of intellectual property infringement claims,which is not uncommon with respect to the business analytics software market.
There may be third-party intellectual property rights, including issued or pending patents that coversignificant aspects of our technologies or business methods. Any intellectual property claims, with or withoutmerit, could be very time-consuming, could be expensive to settle or litigate and could divert our management'sattention and other resources. These claims could also subject us to significant liability for damages, potentiallyincluding treble damages if we are found to have willfully infringed patents or copyrights. These claims could alsoresult in our having to stop using technology found to be in violation of a third party's rights. We might be requiredto seek a license for the intellectual property, which may not be available on reasonable terms or at all. Even if alicense were available, we could be required to pay significant royalties, which would increase our operatingexpenses. As a result, we may be required to develop alternative non-infringing technology, which could requiresignificant effort and expense. If we cannot license or develop technology for any infringing aspect of our
29
business, we would be forced to limit or stop sales of our software and may be unable to compete effectively. Anyof these results would adversely affect our business, results of operations, financial condition and cash flows.
Our use of open source software could negatively affect our ability to sell our software and subject us topossible litigation.
We use open source software in our software and expect to continue to use open source software in thefuture. We may face claims from others claiming ownership of, or seeking to enforce the license terms applicableto such open source software, including by demanding release of the open source software, derivative works orour proprietary source code that was developed using such software. These claims could also result in litigation,require us to purchase a costly license or require us to devote additional research and development resources tochange our software, any of which would have a negative effect on our business and results of operations. Inaddition, if the license terms for the open source code change, we may be forced to re-engineer our software orincur additional costs. Finally, we cannot assure you that we have not incorporated open source software into oursoftware in a manner that may subject our proprietary software to an open source license that requires disclosure,to customers or the public, of the source code to such proprietary software. Any such disclosure would have anegative effect on our business and the value of our software.
We may be subject to litigation for a variety of claims, which could adversely affect our results ofoperations, harm our reputation or otherwise negatively impact our business.
In addition to intellectual property litigation, we may be subject to other claims arising from our normalbusiness activities. These may include claims, suits, and proceedings involving labor and employment, wage andhour, commercial and other matters. The outcome of any litigation, regardless of its merits, is inherently uncertain.Any claims and lawsuits, and the disposition of such claims and lawsuits, could be time-consuming and expensiveto resolve, divert management attention and resources, and lead to attempts on the part of other parties to pursuesimilar claims. Any adverse determination related to litigation could adversely affect our results of operations,harm our reputation or otherwise negatively impact our business. In addition, depending on the nature and timingof any such dispute, a resolution of a legal matter could materially affect our future results of operations, our cashflows or both.
Our success depends in part on maintaining and increasing our sales to customers in the public sector. We derive a portion of our revenues from contracts with federal, state, local and foreign governments and
agencies, and we believe that the success and growth of our business will continue to depend on our successfulprocurement of government contracts. Selling to government entities can be highly competitive, expensive andtime consuming, often requiring significant upfront time and expense without any assurance that our efforts willproduce any sales. Factors that could impede our ability to maintain or increase the amount of revenues derivedfrom government contracts include:
• changes in fiscal or contracting policies; • decreases in available government funding; • changes in government programs or applicable requirements; • the adoption of new laws or regulations or changes to existing laws or regulations; • potential delays or changes in the government appropriations or other funding authorization
processes; • governments and governmental agencies requiring contractual terms that are unfavorable to us,
such as most-favored-nation pricing provisions; and • delays in the payment of our invoices by government payment offices.
The occurrence of any of the foregoing could cause governments and governmental agencies to delay orrefrain from purchasing our software in the future or otherwise have an adverse effect on our business, results ofoperations, financial condition and cash flows.
Further, to increase our sales to customers in the public sector, we must comply with laws and regulationsrelating to the formation, administration, performance and pricing of contracts with the public sector, including U.S.federal, state and local governmental bodies, which affect how we and our channel partners do business inconnection with governmental agencies. These laws and regulations may impose added costs on our business,and failure to comply with these laws and regulations or other applicable requirements, including non-compliancein the past, could lead to claims for damages from our channel partners or government customers, penalties,termination of contracts, loss of intellectual property rights and temporary suspension or permanent debarmentfrom government contracting. Any such damages, penalties, disruptions or limitations in our ability to do business
30
with the public sector could have a material adverse effect on our business, results of operations, financialcondition and cash flows.
Future acquisitions could disrupt our business and adversely affect our results of operations, financialcondition and cash flows.
We may choose to expand by making acquisitions that could be material to our business, results ofoperations, financial condition and cash flows. Our ability as an organization to successfully acquire and integratetechnologies or businesses is unproven. Acquisitions involve many risks, including the following:
• an acquisition may negatively affect our results of operations, financial condition or cash flowsbecause it may require us to incur charges or assume substantial debt or other liabilities, maycause adverse tax consequences or unfavorable accounting treatment, including potential write-downs of deferred revenues, may expose us to claims and disputes by third parties, includingintellectual property claims and disputes, or may not generate sufficient financial return to offsetadditional costs and expenses related to the acquisition;
• we may encounter difficulties or unforeseen expenditures in integrating the business,technologies, products, personnel or operations of any company that we acquire, particularly ifkey personnel of the acquired company decide not to work for us;
• an acquisition may disrupt our ongoing business, divert resources, increase our expenses anddistract our management;
• an acquisition may result in a delay or reduction of customer purchases for both us and thecompany we acquired due to customer uncertainty about continuity and effectiveness of servicefrom either company;
• we may encounter difficulties in, or may be unable to, successfully sell any acquired products; • an acquisition may involve the entry into geographic or business markets in which we have little
or no prior experience or where competitors have stronger market positions;• challenges inherent in effectively managing an increased number of employees in diverse
locations; • the potential strain on our financial and managerial controls and reporting systems and
procedures; • potential known and unknown liabilities associated with an acquired company; • our use of cash to pay for acquisitions would limit other potential uses for our cash; • if we incur debt to fund such acquisitions, such debt may subject us to material restrictions on our
ability to conduct our business as well as financial maintenance covenants; • the risk of impairment charges related to potential write-downs of acquired assets or goodwill in
future acquisitions; • to the extent that we issue a significant amount of equity or convertible debt securities in
connection with future acquisitions, existing stockholders may be diluted and earnings per sharemay decrease; and
• managing the varying intellectual property protection strategies and other activities of an acquiredcompany.
We may not succeed in addressing these or other risks or any other problems encountered in connectionwith the integration of any acquired business. The inability to integrate successfully the business, technologies,products, personnel or operations of any acquired business, or any significant delay in achieving integration,could have a material adverse effect on our business, results of operations, financial condition and cash flows.
We may require additional capital to fund our business and support our growth, and our inability togenerate and obtain such capital on acceptable terms, or at all, could harm our business, operatingresults, financial condition and prospects.
We intend to continue to make substantial investments to fund our business and support our growth. Inaddition, we may require additional funds to respond to business challenges, including the need to develop newfeatures or enhance our software, improve our operating infrastructure or acquire or develop complementarybusinesses and technologies. As a result, we may need to engage in equity or debt financings to provide thefunds required for these and other business endeavors. If we raise additional funds through future issuances ofequity or convertible debt securities, our existing stockholders could suffer significant dilution, and any new equitysecurities we issue could have rights, preferences and privileges superior to those of holders of our commonstock. Any debt financing that we may secure in the future could involve restrictive covenants relating to our
31
capital raising activities and other financial and operational matters, which may make it more difficult for us toobtain additional capital and to pursue business opportunities, including potential acquisitions. We may not beable to obtain such additional financing on terms favorable to us, if at all. If we are unable to obtain adequatefinancing or financing on terms satisfactory to us when we require it, our ability to continue to support ourbusiness growth and to respond to business challenges could be significantly impaired, and our business may beadversely affected. In addition, our inability to generate or obtain the financial resources needed may require us todelay, scale back, or eliminate some or all of our operations, which may have a material adverse effect on ourbusiness, operating results, financial condition and prospects.
Governmental export or import controls could limit our ability to compete in foreign markets and subjectus to liability if we violate them.
Our products are subject to U.S. export controls, and we incorporate encryption technology into certain ofour products. These products and the underlying technology may be exported only with the required exportauthorizations, including by license, a license exception or other appropriate government authorizations. U.S.export controls may require submission of an encryption registration, product classification and annual or semi-annual reports. Governmental regulation of encryption technology and regulation of imports or exports ofencryption products, or our failure to obtain required import or export authorization for our products, whenapplicable, could harm our international sales and adversely affect our revenues. Compliance with applicableregulatory requirements regarding the export of our products, including with respect to new releases of oursoftware, may create delays in the introduction of our product releases in international markets, prevent ourcustomers with international operations from deploying our products or, in some cases, prevent the export of ourproducts to some countries altogether. Furthermore, U.S. export control laws and economic sanctions prohibit theshipment of certain products and services to countries, governments and persons targeted by U.S. sanctions. Ifwe fail to comply with export and import regulations and such economic sanctions, we may be fined or otherpenalties could be imposed, including a denial of certain export privileges. Moreover, any new export or importrestrictions, new legislation or shifting approaches in the enforcement or scope of existing regulations, or in thecountries, persons or technologies targeted by such regulations, could result in decreased use of our products by,or in our decreased ability to export or sell our products to, existing or potential customers with internationaloperations. Any decreased use of our products or limitation on our ability to export or sell our products would likelyadversely affect our business, financial condition and results of operations.
We may not be able to utilize all of our deferred tax assets.Based on our assessment, it appears more likely than not that the net deferred tax assets will be realized
through future taxable earnings. If future results are less than projected and there is no objectively verifiableevidence to support the realization of our deferred tax assets, a substantial valuation allowance may be requiredto reduce the deferred tax assets. However, currently no valuation allowance has been established for our netdeferred tax assets. We will continue to assess the need for a valuation allowance in the future.
We may have additional tax liabilities, which could harm our business, operating results, financialcondition and prospects.
Significant judgments and estimates are required in determining the provision for income taxes and othertax liabilities. Our tax expense may be impacted if our intercompany transactions, which are required to becomputed on an arm's-length basis, are challenged and successfully disputed by the taxing authorities. Also, ourtax expense could be impacted depending on the applicability of withholding taxes and other indirect taxes onsoftware licenses and related intercompany transactions in certain jurisdictions. In determining the adequacy ofincome taxes, we assess the likelihood of adverse outcomes that could result if our tax positions were challengedby the Internal Revenue Service ("IRS"), and other taxing authorities. The taxing authorities in the United Statesand other countries where we do business regularly examine our income and other tax returns. We are currentlyunder audit by the IRS for taxable years 2012 and 2013. The ultimate outcome of these or other examinationscannot be predicted with certainty. Should the IRS or other taxing authorities assess additional taxes as a result ofexaminations, we may be required to record charges to our operations.
The enactment of legislation implementing changes in the U.S. taxation of international businessactivities or the adoption of other tax reform policies could materially impact our financial position andresults of operations.
Any changes to or the reform of current U.S. tax laws that may be enacted in the future could impact thetax treatment of our foreign earnings. Due to expansion of our international business activities, any changes in the
32
U.S. taxation of such activities may increase our worldwide effective tax rate and adversely affect our financialposition and results of operations.
Our international operations subject us to potentially adverse tax consequences. We generally conduct our international operations through wholly-owned subsidiaries, branches and
representative offices and report our taxable income in various jurisdictions worldwide based upon our businessoperations in those jurisdictions. Our corporate structure and intercompany arrangements align with theinternational expansion of our business activities. The application of the tax laws of various jurisdictions, includingthe United States, to our international business activities is subject to interpretation. The taxing authorities of thejurisdictions in which we operate may challenge our methodologies for valuing developed technology orintercompany arrangements, including our transfer pricing, or determine the manner in which we operate ourbusiness is not consistent with the manner in which we report our income to the jurisdictions. If such adisagreement were to occur, and our positions were not sustained, we could be required to pay additional taxes,interest and penalties, resulting in higher effective tax rates, reduced cash flows and lower overall profitability ofour operations. Additionally, our future worldwide tax rate and financial position may be affected by changes in thetax laws or the interpretation of such tax laws, such as the Base Erosion Profit Shifting project initiated by theOrganization for Economic Co-operation and Development and any legislation proposed by the relevant taxingauthorities.
Natural or man-made disasters and other similar events may significantly disrupt our business, andnegatively impact our results of operations and financial condition.
Any of our facilities may be harmed or rendered inoperable by natural or man-made disasters, includingearthquakes, tornadoes, hurricanes, wildfires, floods, nuclear disasters, acts of terrorism or other criminalactivities, infectious disease outbreaks, and power outages, which may render it difficult or impossible for us tooperate our business for some period of time. For example, we host our Tableau Online and Tableau Publicproducts from a data center located in the San Francisco Bay Area, a region known for seismic activity. Ourfacilities would likely be costly to repair or replace, and any such efforts would likely require substantial time. Anydisruptions in our operations could negatively impact our business and results of operations, and harm ourreputation. In addition, we may not carry business insurance or may not carry sufficient business insurance tocompensate for losses that may occur. Any such losses or damages could have a material adverse effect on ourbusiness, results of operations and financial condition. In addition, the facilities of significant customers or majorstrategic partners may be harmed or rendered inoperable by such natural or man-made disasters, which maycause disruptions, difficulties or material adverse effects on our business.
Changes in financial accounting standards may cause adverse and unexpected revenue fluctuations andimpact our reported results of operations.
A change in accounting standards or practices could harm our operating results and may even affect ourreporting of transactions completed before the change is effective. New accounting pronouncements, such asAccounting Standards Update 2014-09 related to revenue recognition, and varying interpretations of accountingpronouncements have occurred and may occur in the future. Changes to existing rules or the questioning ofcurrent practices may harm our operating results or the way we conduct our business.
Risks Related to Ownership of Our Class A Common StockOur stock price has been and will likely continue to be volatile or may decline regardless of our operatingperformance, resulting in the potential for substantial losses for our stockholders.
The trading price for shares of our Class A common stock has been, and is likely to continue to be,volatile for the foreseeable future. For example, since shares of our Class A common stock were sold in our initialpublic offering in May 2013 at a price of $31.00 per share, our Class A common stock’s daily closing price on theNew York Stock Exchange has ranged from $48.53 to $100.28 through February 24, 2015. On February 24, 2015,the closing price of our Class A common stock was $96.22.
The market price of our common stock may fluctuate significantly in response to numerous factors, manyof which are beyond our control, including the factors listed below and other factors described in this “RiskFactors” section:
• actual or anticipated fluctuations in our results of operations; • the financial projections we may provide to the public, any changes in these projections or our
failure to meet these projections;
33
• failure of securities analysts to initiate or maintain coverage of our company, changes in financial
estimates by any securities analysts who follow our company, or our failure to meet these
estimates or the expectations of investors;
• ratings changes by any securities analysts who follow our company;
• announcements by us or our competitors of significant technical innovations, acquisitions,
strategic partnerships, joint ventures or capital commitments;
• changes in operating performance and stock market valuations of other technology companies
generally, or those in our industry in particular;
• price and volume fluctuations in the overall stock market, including as a result of trends in the
economy as a whole;
• changes in our board of directors or management;
• sales of large blocks of our common stock, including sales by our executive officers, directors and
significant stockholders;
• lawsuits threatened or filed against us;
• short sales, hedging and other derivative transactions involving our capital stock;
• general economic conditions in the United States and abroad; and
• other events or factors, including those resulting from war, incidents of terrorism or responses to
these events.
In addition, stock markets have experienced extreme price and volume fluctuations that have affected and
continue to affect the market prices of equity securities of many technology companies. Stock prices of many
technology companies have fluctuated in a manner unrelated or disproportionate to the operating performance of
those companies. In the past, stockholders have instituted securities class action litigation following periods of
market volatility. If we were to become involved in securities litigation, it could subject us to substantial costs,
divert resources and the attention of management from our business and adversely affect our business, results of
operations, financial condition and cash flows.
Substantial future sales of shares of our Class A common stock could cause the market price of ourClass A common stock to decline.
Sales of a substantial number of shares of our Class A common stock into the public market, or the
perception that these sales might occur, could depress the market price of our Class A common stock and could
impair our ability to raise capital through the sale of additional equity securities. We are unable to predict the effect
that such sales may have on the prevailing market price of our common stock.
In addition, as of December 31, 2014, we had options outstanding that, if fully exercised, would result in
the issuance of approximately 8.5 million shares of Class A and Class B common stock. Our Class B common
stock converts into Class A common stock on a one-for-one basis. All of the shares of Class A common stock
issuable upon the exercise of options (or upon conversion of shares of Class B common stock issued upon the
exercise of options) have been registered for public resale under the Securities Act of 1933, as amended, or the
Securities Act. Accordingly, these shares will be able to be freely sold in the public market upon issuance as
permitted by any applicable vesting requirements.
Holders of approximately 3.5 million shares of Class A and Class B common stock have rights, subject to
some conditions, to require us to file registration statements for the public resale of such shares (in the case of
Class B common stock, the Class A common stock issuable upon conversion of such shares) or to include such
shares in registration statements that we may file for Tableau or other stockholders.
Future sales and issuances of our capital stock or rights to purchase capital stock could result in dilutionof the percentage ownership of our stockholders and could cause our stock price to decline.
We may issue additional securities in the future. Future sales and issuances of our capital stock or rights
to purchase our capital stock could result in substantial dilution to our existing stockholders. We may sell Class A
common stock, convertible securities and other equity securities in one or more transactions at prices and in a
manner as we may determine from time to time. If we sell any such securities in subsequent transactions,
investors may be materially diluted. New investors in such subsequent transactions could gain rights, preferences
and privileges senior to those of holders of our Class A common stock.
34
If securities or industry analysts do not publish research or reports about our business, or publishnegative reports about our business, our share price and trading volume could decline.
The trading market for our Class A common stock depends in part on the research and reports thatsecurities or industry analysts publish about us or our business, our market and our competitors. We do not haveany control over these analysts. If one or more of the analysts who cover us downgrade our shares or changetheir opinion of our shares, our share price would likely decline. If one or more of these analysts cease coverageof our company or fail to regularly publish reports on us, we could lose visibility in the financial markets, whichcould cause our share price or trading volume to decline.
The dual class structure of our common stock and the existing ownership of capital stock by ourexecutive officers, directors and their affiliates have the effect of concentrating voting control with ourexecutive officers, directors and their affiliates for the foreseeable future, which will limit the ability of ourother investors to influence corporate matters.
Our Class B common stock has ten votes per share and our Class A common stock has one vote pershare. As of December 31, 2014, the holders of shares of Class B common stock collectively beneficially ownedshares representing approximately 83% of the voting power of our outstanding capital stock. Our executiveofficers and directors and their affiliates, which include funds affiliated with New Enterprise Associates, collectivelybeneficially owned shares representing a substantial majority of the voting power of our outstanding capital stockas of that date. Consequently, the holders of Class B common stock, including our executive officers and directorsand their affiliates, collectively control all matters submitted to our stockholders for approval. This concentratedcontrol limits the ability of our other investors to influence corporate matters for the foreseeable future. Forexample, these stockholders control elections of directors, amendments of our certificate of incorporation orbylaws, increases to the number of shares available for issuance under our equity incentive plans or adoption ofnew equity incentive plans, and approval of any merger or sale of assets for the foreseeable future. This controlmay adversely affect the market price of our Class A common stock.
Future transfers by holders of Class B common stock will generally result in those shares converting toClass A common stock, which will have the effect, over time, of increasing the relative voting power of thoseholders of Class B common stock who retain their shares in the long term, which may include our executiveofficers and directors and their affiliates.
The requirements of being a public company may strain our resources, divert management's attentionand affect our ability to attract and retain additional executive management and qualified board members.
As a public company, we are subject to the reporting requirements of the Exchange Act, the Sarbanes-Oxley Act, the Dodd-Frank Act, the listing requirements of the New York Stock Exchange and other applicablesecurities rules and regulations. Compliance with these rules and regulations has increased our legal andfinancial compliance costs and will make some activities more difficult, time-consuming or costly and increasedemand on our systems and resources. The Exchange Act requires, among other things, that we file annual,quarterly and current reports with respect to our business and results of operations. The Sarbanes-Oxley Actrequires, among other things, that we maintain effective disclosure controls and procedures and internal controlover financial reporting. In order to maintain and, if required, improve our disclosure controls and procedures andinternal control over financial reporting to meet this standard, significant resources and management oversightmay be required. As a result, management's attention may be diverted from other business concerns, which couldadversely affect our business and results of operations. Although we have already hired additional employees tocomply with these requirements, we may need to hire more employees in the future or engage outsideconsultants, which will increase our costs and expenses.
In addition, changing laws, regulations and standards relating to corporate governance and publicdisclosure are creating uncertainty for public companies, increasing legal and financial compliance costs andmaking some activities more time consuming. These laws, regulations and standards are subject to varyinginterpretations, in many cases due to their lack of specificity, and, as a result, their application in practice mayevolve over time as new guidance is provided by regulatory and governing bodies. This could result in continuinguncertainty regarding compliance matters and higher costs necessitated by ongoing revisions to disclosure andgovernance practices. We intend to invest resources to comply with evolving laws, regulations and standards, andthis investment may result in increased general and administrative expenses and a diversion of management'stime and attention from revenue-generating activities to compliance activities. If our efforts to comply with newlaws, regulations and standards differ from the activities intended by regulatory or governing bodies due to
35
ambiguities related to their application and practice, regulatory authorities may initiate legal proceedings against
us and our business may be adversely affected.
Being a public company and these new rules and regulations have made it more expensive for us to
obtain director and officer liability insurance, and in the future we may be required to accept reduced coverage or
incur substantially higher costs to obtain coverage. These factors could also make it more difficult for us to attract
and retain qualified members of our board of directors, particularly to serve on our audit committee and
compensation committee, and qualified executive officers.
As a result of disclosure of information in our filings with the Securities and Exchange Commission
("SEC"), our business and financial condition have become more visible, which we believe may result in
threatened or actual litigation, including by competitors and other third parties. If such claims are successful, our
business and results of operations could be adversely affected, and even if the claims do not result in litigation or
are resolved in our favor, these claims, and the time and resources necessary to resolve them, could divert the
resources of our management and adversely affect our business and results of operations.
We do not intend to pay dividends for the foreseeable future. We have never declared or paid any cash dividends on our Class A or Class B common stock and do not
intend to pay any cash dividends in the foreseeable future. We anticipate that we will retain all of our future
earnings for use in the development of our business and for general corporate purposes. Any determination to
pay dividends in the future will be at the discretion of our board of directors. Accordingly, investors must rely on
sales of their Class A common stock after price appreciation, which may never occur, as the only way to realize
any future gains on their investments.
Anti-takeover provisions in our charter documents and under Delaware law could make an acquisition ofour company more difficult, limit attempts by our stockholders to replace or remove our currentmanagement and limit the market price of our common stock.
Provisions in our certificate of incorporation and bylaws may have the effect of delaying or preventing a
change of control or changes in our management. Our amended and restated certificate of incorporation and
bylaws include provisions that:
• establish a classified board of directors so that not all members of our board of directors are
elected at one time;
• permit the board of directors to establish the number of directors and fill any vacancies and
newly-created directorships;
• provide that directors may only be removed for cause;
• require super-majority voting to amend some provisions in our certificate of incorporation and
bylaws;
• authorize the issuance of “blank check” preferred stock that our board of directors could use to
implement a stockholder rights plan;
• eliminate the ability of our stockholders to call special meetings of stockholders;
• prohibit stockholder action by written consent, which requires all stockholder actions to be taken
at a meeting of our stockholders;
• provide that the board of directors is expressly authorized to make, alter or repeal our bylaws;
and
• establish advance notice requirements for nominations for election to our board of directors or for
proposing matters that can be acted upon by stockholders at annual stockholder meetings.
These provisions may frustrate or prevent any attempts by our stockholders to replace or remove our
current management by making it more difficult for stockholders to replace members of our board of directors,
which is responsible for appointing the members of our management. In addition, because we are incorporated in
Delaware, we are governed by the provisions of Section 203 of the Delaware General Corporation Law, which
generally prohibits a Delaware corporation from engaging in any of a broad range of business combinations with
any holder of at least 15% of our capital stock for a period of three years following the date on which the
stockholder became a 15% stockholder.
36
ITEM 1B. UNRESOLVED STAFF COMMENTSNone.
37
ITEM 2. PROPERTIESOur principal executive offices are located in Seattle, Washington. We also have offices located in
Kirkland, Washington; Palo Alto, California; Austin, Texas; London, United Kingdom; Singapore; Tokyo, Japan;
Sydney, Australia; Dublin, Ireland; and Frankfurt, Germany. We believe that our properties are generally suitable
to meet our needs for the foreseeable future. In addition, to the extent we require additional space in the future,
we believe that it would be readily available on commercially reasonable terms.
ITEM 3. LEGAL PROCEEDINGSIn the ordinary course of business, we may be involved in various legal proceedings and claims related to
intellectual property rights, commercial disputes, employment and wage and hour laws, and other matters. For
example, we have been, and may in the future be, put on notice and sued by third parties for alleged infringement
of their proprietary rights, including patent infringement. We evaluate these claims and lawsuits with respect to
their potential merits, our potential defenses and counter claims, and the expected effect on us. We are not
presently a party to any legal proceedings that in the opinion of our management, if determined adversely to us,
would have a material adverse effect on our business, financial condition or operating results.
The outcome of any litigation, regardless of its merits, is inherently uncertain. Any claims and lawsuits, and
the disposition of such claims and lawsuits, could be time-consuming and expensive to resolve, divert
management attention from executing our business plan, lead to attempts on the part of other parties to make
similar claims and require us to change our technology, change our business practices and pay monetary
damages or enter into royalty or licensing agreements, which could materially adversely affect our financial
condition or operating results.
We make a provision for a liability relating to a claim when it is both probable that a liability has been
incurred and the amount of the loss can be reasonably estimated. When we make such provisions, they are
reviewed at least quarterly and adjusted to reflect the impact of negotiations, settlements, rulings, advice of legal
counsel and other information and events pertaining to a particular matter. In management's opinion, resolution of
currently outstanding matters is not expected to have a material adverse impact on our consolidated results of
operations, cash flows or financial position. However, depending on the nature and timing of any such dispute, an
unfavorable resolution of the matter could materially affect our future results of operations or cash flows, or both,
of a particular quarter.
ITEM 4. MINE SAFETY DISCLOSURENot applicable.
PART II
38
ITEM 5. MARKET FOR REGISTRANT'S COMMON EQUITY, RELATED STOCKHOLDERS MATTERSAND ISSUER PURCHASES OF EQUITY SECURITIES
Market Information for Common Stock
Our Class A common stock has been listed on the New York Stock Exchange under the symbol “DATA” sinceMay 17, 2013, the date of our initial public offering.
The following table sets forth for the indicated periods the high and low sales prices of our Class A commonstock as reported by the New York Stock Exchange.
Fiscal Year 2013High Low
Second Quarter (from May 17, 2013) $ 59.88 $ 44.00Third Quarter 77.74 51.99Fourth Quarter 73.45 58.96
Fiscal Year 2014High Low
First Quarter $ 102.37 $ 66.19Second Quarter 82.10 52.02Third Quarter 78.42 57.89Fourth Quarter 89.95 62.15
Our Class B common stock is not listed or traded on any stock exchange.
Dividend Policy
We have never declared or paid cash dividends on our capital stock. We currently intend to retain any futureearnings for use in the operation of our business and do not intend to declare or pay any cash dividends in theforeseeable future. Any further determination to pay dividends on our capital stock will be at the discretion of ourboard of directors, subject to applicable laws, and will depend on our financial condition, results of operations, capitalrequirements, general business conditions and other factors that our board of directors considers relevant.
Stockholders
As of January 31, 2015, there were 15 stockholders of record of our Class A common stock, including TheDepository Trust Company, which holds shares of our common stock on behalf of an indeterminate number ofbeneficial owners, as well as 23 stockholders of record of our Class B common stock.
Stock Performance Graph
The following shall not be deemed “filed” for purposes of Section 18 of the Exchange Act, or incorporatedby reference into any of our other filings under the Exchange Act or the Securities Act except to the extent wespecifically incorporate it by reference into such filing.
This chart compares the cumulative total return on our common stock with that of the NASDAQ CompositeIndex and the NASDAQ Computer and Data Processing Services Index. The chart assumes $100 was invested atthe close of market on May 17, 2013, in our Class A common stock, the NASDAQ Composite Index and the NASDAQComputer and Data Processing Services Index, and assumes the reinvestment of any dividends. The stock priceperformance on the following graph is not necessarily indicative of future stock price performance.
The closing price of our Class A common stock on December 31, 2014, the last day of our 2014 fiscal year,was $84.76 per share.
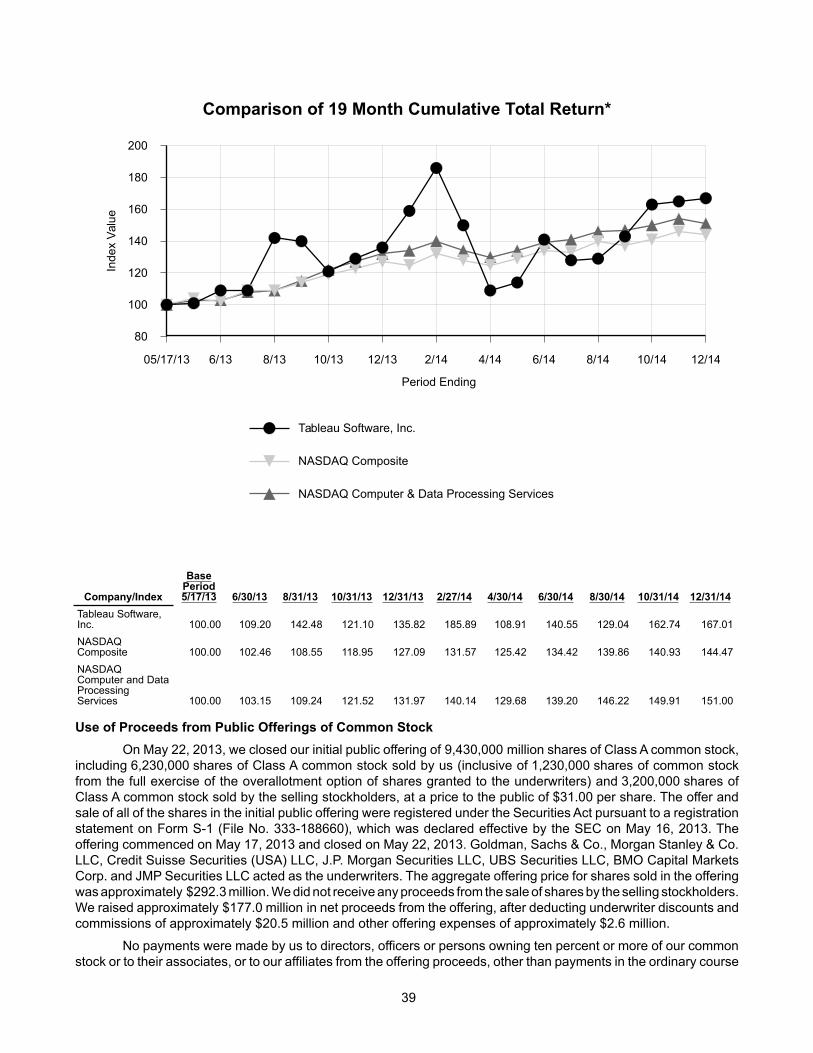
Tableau Software, Inc.
NASDAQ Composite
NASDAQ Computer & Data Processing Services
Comparison of 19 Month Cumulative Total Return*
200
180
160
140
120
100
80
IndexValue
05/17/13 6/13 8/13 10/13 12/13 2/14 4/14 6/14 8/14 10/14 12/14
Period Ending
Company/Index
BasePeriod5/17/13 6/30/13 8/31/13 10/31/13 12/31/13 2/27/14 4/30/14 6/30/14 8/30/14 10/31/14 12/31/14
Tableau Software,Inc. 100.00 109.20 142.48 121.10 135.82 185.89 108.91 140.55 129.04 162.74 167.01NASDAQComposite 100.00 102.46 108.55 118.95 127.09 131.57 125.42 134.42 139.86 140.93 144.47NASDAQComputer and DataProcessingServices 100.00 103.15 109.24 121.52 131.97 140.14 129.68 139.20 146.22 149.91 151.00
Use of Proceeds from Public Offerings of Common Stock
On May 22, 2013, we closed our initial public offering of 9,430,000 million shares of Class A common stock,including 6,230,000 shares of Class A common stock sold by us (inclusive of 1,230,000 shares of common stockfrom the full exercise of the overallotment option of shares granted to the underwriters) and 3,200,000 shares ofClass A common stock sold by the selling stockholders, at a price to the public of $31.00 per share. The offer andsale of all of the shares in the initial public offering were registered under the Securities Act pursuant to a registrationstatement on Form S-1 (File No. 333-188660), which was declared effective by the SEC on May 16, 2013. Theoffering commenced on May 17, 2013 and closed on May 22, 2013. Goldman, Sachs & Co., Morgan Stanley & Co.LLC, Credit Suisse Securities (USA) LLC, J.P. Morgan Securities LLC, UBS Securities LLC, BMO Capital MarketsCorp. and JMP Securities LLC acted as the underwriters. The aggregate offering price for shares sold in the offeringwas approximately $292.3 million. We did not receive any proceeds from the sale of shares by the selling stockholders.We raised approximately $177.0 million in net proceeds from the offering, after deducting underwriter discounts andcommissions of approximately $20.5 million and other offering expenses of approximately $2.6 million.
No payments were made by us to directors, officers or persons owning ten percent or more of our commonstock or to their associates, or to our affiliates from the offering proceeds, other than payments in the ordinary course
39

of business to officers for salaries. There has been no material change in the planned use of proceeds from our
offering as described in our final prospectus filed with the SEC pursuant to Rule 424(b) under the Securities Act on
May 20, 2013. Pending the uses described, we have invested the net proceeds in short-term, investment-grade
interest-bearing securities such as money market funds.
40
ITEM 6. SELECTED CONSOLIDATED FINANCIAL DATA The following selected consolidated historical financial data are derived from our audited financial
statements. The consolidated balance sheet data as of December 31, 2014 and 2013 and the consolidated
statement of operations data for the years ended December 31, 2014, 2013 and 2012 are derived from our
audited consolidated financial statements and related notes that are included elsewhere in this Form 10-K. The
consolidated balance sheet data as of December 31, 2012, 2011 and 2010 and the consolidated statement of
operations for the years ended December 31, 2011 and 2010 are derived from our audited consolidated financial
statements and related notes which are not included in this report. The information set forth below should be read
in conjunction with our historical financial statements, including the notes thereto, and “Management’s Discussion
and Analysis of Financial Condition and Results of Operations,” included elsewhere in this report.
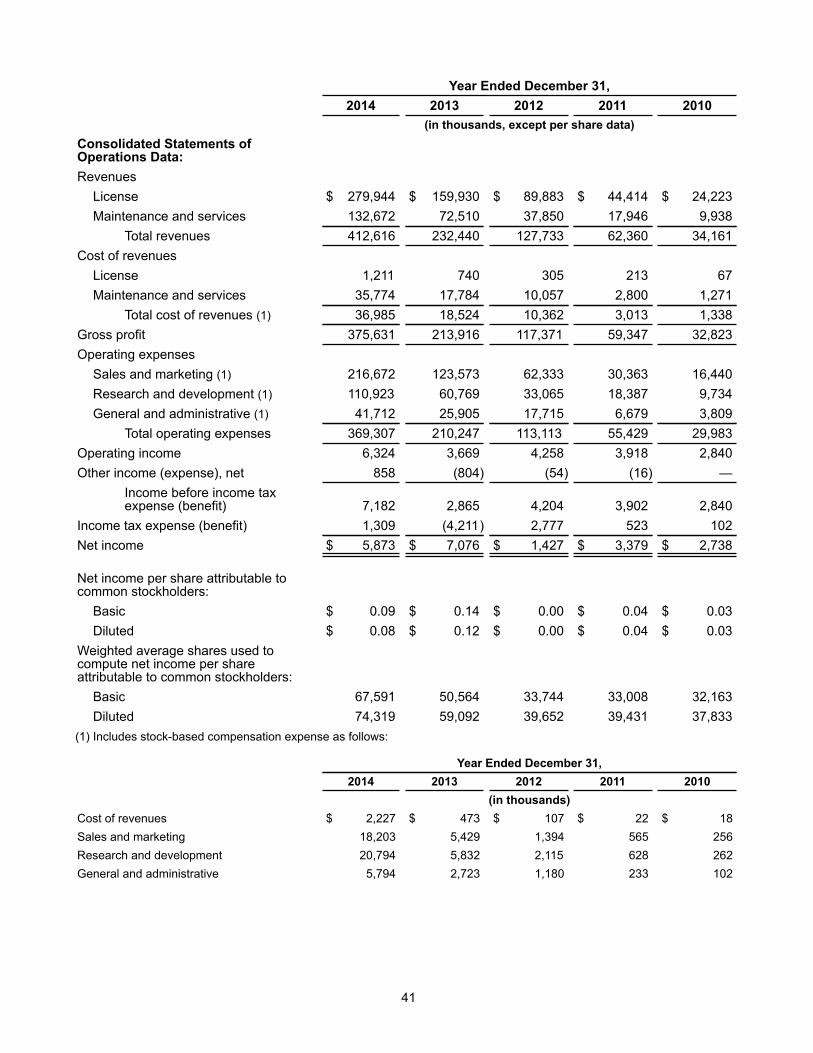
Year Ended December 31,2014 2013 2012 2011 2010
(in thousands, except per share data)Consolidated Statements ofOperations Data:RevenuesLicense $ 279,944 $ 159,930 $ 89,883 $ 44,414 $ 24,223Maintenance and services 132,672 72,510 37,850 17,946 9,938
Total revenues 412,616 232,440 127,733 62,360 34,161Cost of revenuesLicense 1,211 740 305 213 67Maintenance and services 35,774 17,784 10,057 2,800 1,271
Total cost of revenues (1) 36,985 18,524 10,362 3,013 1,338Gross profit 375,631 213,916 117,371 59,347 32,823Operating expensesSales and marketing (1) 216,672 123,573 62,333 30,363 16,440Research and development (1) 110,923 60,769 33,065 18,387 9,734General and administrative (1) 41,712 25,905 17,715 6,679 3,809
Total operating expenses 369,307 210,247 113,113 55,429 29,983Operating income 6,324 3,669 4,258 3,918 2,840Other income (expense), net 858 (804) (54) (16) —
Income before income taxexpense (benefit) 7,182 2,865 4,204 3,902 2,840
Income tax expense (benefit) 1,309 (4,211) 2,777 523 102Net income $ 5,873 $ 7,076 $ 1,427 $ 3,379 $ 2,738
Net income per share attributable tocommon stockholders:Basic $ 0.09 $ 0.14 $ 0.00 $ 0.04 $ 0.03Diluted $ 0.08 $ 0.12 $ 0.00 $ 0.04 $ 0.03
Weighted average shares used tocompute net income per shareattributable to common stockholders:Basic 67,591 50,564 33,744 33,008 32,163Diluted 74,319 59,092 39,652 39,431 37,833
(1) Includes stock-based compensation expense as follows:
Year Ended December 31,2014 2013 2012 2011 2010
(in thousands)Cost of revenues $ 2,227 $ 473 $ 107 $ 22 $ 18Sales and marketing 18,203 5,429 1,394 565 256Research and development 20,794 5,832 2,115 628 262General and administrative 5,794 2,723 1,180 233 102
41
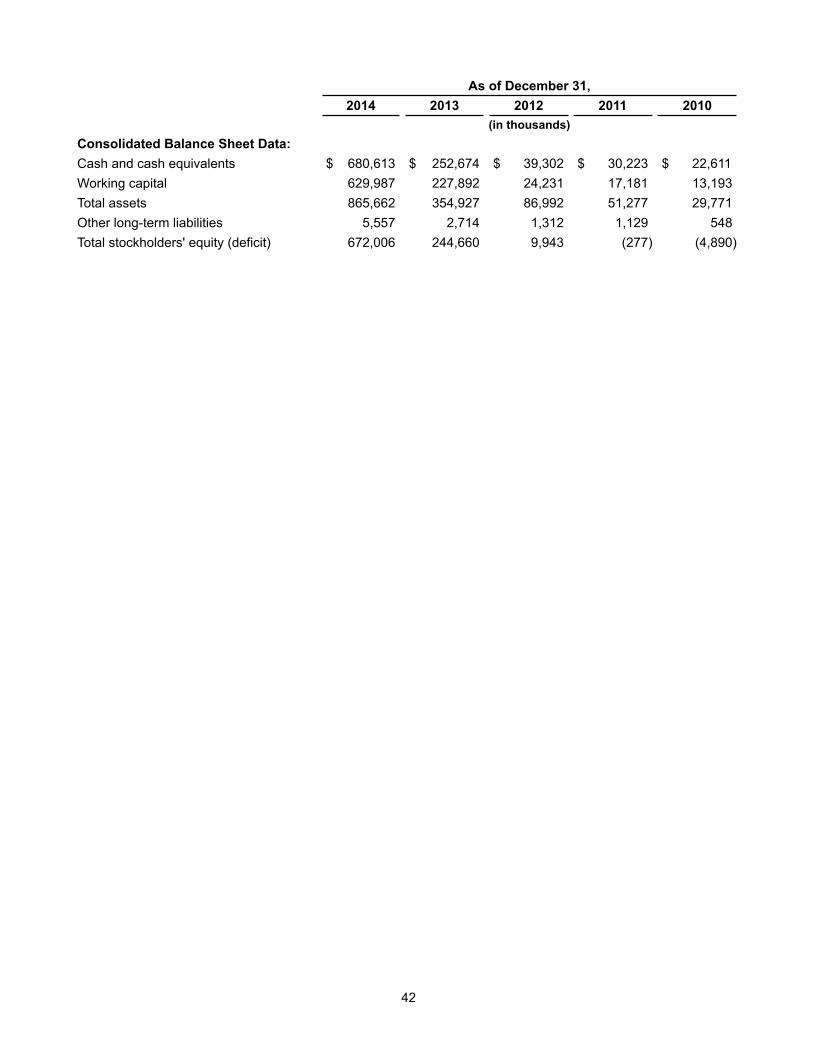
As of December 31,2014 2013 2012 2011 2010
(in thousands)Consolidated Balance Sheet Data:Cash and cash equivalents $ 680,613 $ 252,674 $ 39,302 $ 30,223 $ 22,611Working capital 629,987 227,892 24,231 17,181 13,193Total assets 865,662 354,927 86,992 51,277 29,771Other long-term liabilities 5,557 2,714 1,312 1,129 548Total stockholders' equity (deficit) 672,006 244,660 9,943 (277) (4,890)
42
ITEM 7. MANAGEMENT'S DISCUSSION AND ANALYSIS OF FINANCIAL CONDITION AND RESULTSOF OPERATIONS
The following discussion and analysis of our financial condition and results of operations should be readin conjunction with our consolidated financial statements and related notes appearing elsewhere in this AnnualReport. This discussion contains forward-looking statements that reflect our plans, estimates and beliefs, andinvolve risks and uncertainties. Our actual results and the timing of certain events could differ materially fromthose anticipated in these forward-looking statements as a result of several factors, including those discussed inthe section titled “Risk Factors” included under Part I, Item 1A and elsewhere in this Annual Report. See “SpecialNote Regarding Forward-Looking Statements” in this Annual Report.
43
Overview Our mission is to help people see and understand data. Our software products put the power of data into
the hands of everyday people, allowing a broad population of business users to engage with their data, askquestions, solve problems and create value. Based on innovative core technologies originally developed atStanford University, our products dramatically reduce the complexity, inflexibility and expense associated withtraditional business intelligence applications. We currently offer four products: Tableau Desktop, a self-service,powerful analytics product for anyone with data; Tableau Server, a business intelligence platform fororganizations; Tableau Online, a cloud-based hosted version of Tableau Server; and Tableau Public, a free cloud-based platform for analyzing and sharing public data.
We have sought to rapidly improve the capabilities of our products over time and intend to continue toinvest in product innovation and leadership. We were founded in January 2003 and we introduced TableauDesktop in December 2003, our first version of Tableau Server in March 2007, our first version of Tableau Publicin February 2010 and our first version of Tableau Online in July 2013. Building on our foundational technologyinnovations, we have released eight major versions of our software, each expanding and improving our products'capabilities. Our most recent major release, Tableau 8.0, includes several new features including Web and mobileauthoring, free form dashboards, forecasting, integration with enterprise applications such as salesforce.com andGoogle Analytics, and application programming interfaces ("APIs").
Our products are used by people of diverse skill levels across all kinds of organizations, including Fortune500 corporations, small and medium-sized businesses, government agencies, universities, research institutions,and non-profits. As of December 31, 2014, we had over 26,000 customer accounts located in over 150 differentcountries. We define a customer account as a purchaser of our products. Customer accounts are typicallyorganizations. In some cases, organizations will have multiple groups purchasing our software, which we count asdiscrete customer accounts.
Our distribution strategy is based on a “land and expand” business model and is designed to capitalize onthe ease of use, low up-front cost and collaborative capabilities of our software. To facilitate rapid adoption of ourproducts, we provide fully-functional free trial versions of our products on our website and have created a simplepricing model. After an initial trial or purchase, which is often made to target a specific business need at agrassroots level within an organization, the use of our products often spreads across departments, divisions, andgeographies, via word-of-mouth, discovery of new use cases, and our sales efforts.
We generate revenues primarily in the form of license fees and related maintenance and services fees.License revenues reflect the revenues recognized from sales of licenses to new customer accounts and additionallicenses to existing customer accounts. License fees include perpetual, term, and subscription license fees. Feesfrom perpetual licenses comprised more than 90% of our license revenues for the year ended December 31,2014. Maintenance and services revenues reflect the revenues recognized from fees paid for maintenanceservices (including support and unspecified upgrades and enhancements when and if they are available) and, to alesser extent, for training and professional services that help our customers maximize the benefits from using ourproducts. A substantial majority of our maintenance and services revenues to date has been attributable torevenues from maintenance agreements. When purchasing a license, a customer typically also purchases oneyear of maintenance service and has the opportunity to purchase maintenance service annually thereafter. Weexpect maintenance and services revenues to become a larger percentage of our total revenues as our customerbase grows.
Our direct sales approach includes inside sales teams and field sales teams. We also sell our productsthrough indirect sales channels including technology vendors, resellers, original equipment manufacturers("OEMs") and independent software vendors ("ISVs"). We view these partners as an extension of our team,
playing an integral role in our growth. We plan to continue to invest in our partner programs to help us enter andgrow in new markets while complementing our direct sales efforts.
With approximately 23% of our total revenues from customers located outside the United States andCanada in the year ended December 31, 2014, we believe there is significant opportunity to expand ourinternational business. Our products currently support eight languages and we are aggressively expanding ourdirect sales force and indirect sales channels outside the United States.
Our quarterly results reflect seasonality in the sale of our products and services. Historically, we believe apattern of increased license sales in the fourth fiscal quarter as a result of industry buying patterns has positivelyimpacted total revenues in that period, which has resulted in low or negative sequential revenue growth in the firstquarter compared to the prior quarter.
We have been growing rapidly in recent periods. Our total revenues for the years ended December 31,2014, 2013 and 2012 were $412.6 million, $232.4 million and $127.7 million, respectively. We increased the totalnumber of customer accounts that had purchased our products to over 26,000 as of December 31, 2014 fromover 11,000 at December 31, 2012. During this period, we significantly increased the size of our workforce,particularly in our sales and marketing and research and development ("R&D") organizations, expandedinternationally, and invested in our operational infrastructure to support our growth. As a result of our significantinvestments in growth, our net income did not grow in a manner commensurate with our total revenues. Our netincome for the years ended December 31, 2014, 2013 and 2012 was $5.9 million, $7.1 million and $1.4 million,respectively.
During the years ended December 31, 2014, 2013 and 2012, there were 781, 455, and 239 salestransactions greater than $100,000, respectively.
44
Factors Affecting Our Performance We believe that our performance and future success are dependent upon a number of factors, including
our ability to continue to expand and further penetrate our customer base, innovate and enhance our products,and invest in our infrastructure. While each of these areas presents significant opportunities for us, they also posesignificant risks and challenges that we must successfully address. See the section of this report titled “1A. RiskFactors.”
Investment in Expansion and Further Penetration of Our Customer Base Our performance depends on our ability to continue to attract new customers and to increase adoption of
our products within our existing customers, both domestically and internationally. Our ability to increase adoptionamongst existing customers is particularly important in light of our land and expand business model. We believethe existing market for business analytics software is underserved. We believe that we have an addressablemarket that is substantially larger than the market for traditional business analytics software. As a result, webelieve we have the opportunity to substantially expand our customer base and to increase adoption of ourproducts within and across our existing customers.
In order to expand and further penetrate our customer base, we have made and plan to continue to makesignificant investments in expanding our direct sales teams and indirect sales channels, and increasing our brandawareness. We plan to continue to significantly increase the size of our sales and marketing team domesticallyand internationally, particularly in the near term. We also intend to expand our online and offline marketing effortsto increase our brand awareness.
Investment in Innovation and Advancement of Our Products Our performance is also significantly dependent on the investments we make in our R&D efforts, and in our
ability to continue to innovate, improve functionality, adapt to new technologies or changes to existingtechnologies, and allow our customers to analyze data from a large and expanding range of data stores. Weintend to continue to invest in product innovation and leadership, including hiring top technical talent, focusing oncore technology innovation, and maintaining an agile organization that supports rapid release cycles.
Investment in Infrastructure We have made and expect to continue to make substantial investments in our infrastructure in connection
with enhancing and expanding our operations domestically and internationally. We expect to continue to opennew offices internationally and domestically. Our international expansion efforts have resulted and will result inincreased costs and are subject to a variety of risks, including those associated with communication and
integration problems resulting from geographic dispersion and language and cultural differences, and compliancewith laws of multiple countries. Moreover, the investments we have made and will make in our internationalorganization may not result in our expected benefits. We currently expect to rely on our current cash on hand andcash generated from our operations to fund these investments. These costs could adversely affect our operatingresults.
Mix and Timing of Sales Our land and expand business model results in a wide variety of sales transaction sizes, ranging from a
single Tableau Desktop order of $1,000-$2,000 to Tableau Desktop and Tableau Server orders of over$1.0 million. The time it takes to close a transaction, defined as the time between when a sales opportunity isentered in our customer relationship management system until when a related license agreement is signed withthe customer, generally varies with the size of the transaction.
45
Components of Operating Results Revenues
License revenues. License revenues consist of the revenues recognized from sales of licenses to newcustomers and additional licenses to existing customers. More than 90% of our license revenues for the yearended December 31, 2014 resulted from perpetual licenses, under which we generally recognize the license feeportion of the arrangement upfront, assuming all revenue recognition criteria are satisfied and we have VSOE onall undelivered elements. In each of the past three years, our existing customer accounts in aggregate havegenerated at least as much perpetual license revenues as they had in the previous year. In the future, we expectthis buying pattern to moderate with the continued growth of our customer base. In addition, a small number ofcustomers have purchased term or subscription licenses, under which we recognize the license fee ratably, on astraight-line basis, over the term of the license. In July 2013, we introduced Tableau Online, a subscription, cloud-based version of Tableau Server. To date, we have not derived a significant amount of revenues from term orsubscription licenses.
Maintenance and services revenues. Maintenance and services revenues consist of revenues frommaintenance agreements and, to a lesser extent, professional services and training. A substantial majority of ourmaintenance and services revenues to date has been attributable to revenues from maintenance agreements.When purchasing a perpetual license, a customer also purchases one year of maintenance, and has theopportunity to purchase maintenance annually thereafter. We currently charge approximately 25% of the price ofthe perpetual license for each year of maintenance service, although this price may vary with regard to largeenterprise sales. We measure the aggregate perpetual license maintenance renewal rate for our customers in a12-month period of time, based on a dollar renewal rate for contracts expiring during that time period. Ourmaintenance renewal rate is measured three months after the 12-month period ends to account for late renewals.Our aggregate maintenance renewal rate for the 12-month period ended September 30, 2014 was over 90%.
Customers with maintenance agreements are entitled to receive support and unspecified upgrades andenhancements if and when they become available during the maintenance term. We recognize the revenuesassociated with maintenance agreements ratably, on a straight-line basis, over the associated maintenance term.
When a term or subscription license is purchased, maintenance service is bundled with the license for theterm of the license period. In arrangements involving a term or subscription license, we recognize both the licenseand maintenance revenues ratably, on a straight-line basis, over the contract term. Term and subscription licenserevenues are included in license revenues.
We also have a professional services organization focused on both training and assisting our customers tofully leverage the use of our products. We recognize the revenues associated with these professional services ona time and materials basis as we deliver the services or provide the training.
We expect maintenance and services revenues to become a larger percentage of our total revenues as ourcustomer base grows.
Cost of Revenues Cost of license revenues. Cost of license revenues primarily consists of referral fees paid to third
parties. For Tableau Online, cost of license revenues is calculated through an allocation of shared costs, whichwas not significant for the year ended December 31, 2014.
Cost of maintenance and services revenues. Cost of maintenance and services revenues includessalaries, benefits and stock-based compensation expense associated with our technical support and servicesorganization, as well as allocated overhead. Allocated overhead includes overhead costs for depreciation ofequipment, facilities (consisting of leasehold improvements and rent) and technical operations (including costs forcompensation of our personnel and costs associated with our infrastructure). We recognize expenses related toour technical support and services organization as they are incurred. We expect the cost of maintenance andservices revenues to increase as a percentage of maintenance and services revenues due to increasedinvestment in our technical support and services organization to support our expanding customer base.
We expect that the cost of revenues will increase as a percentage of total revenues as we expand ourtechnical support capabilities worldwide and seek to expand our product and service offerings.
Gross Profit and Gross Margin Gross profit is total revenues less total cost of revenues. Gross margin is gross profit expressed as a
percentage of total revenues. We expect that our gross margin may fluctuate from period to period as a result ofchanges in product and services mix, direct and indirect sales mix and the introduction of new products by us orour competitors.
Operating Expenses Our operating expenses are classified into three categories: sales and marketing, research and
development, and general and administrative. For each category, the largest component is personnel costs, whichinclude salaries, payroll taxes, employee benefit costs, bonuses, commissions, as applicable, and stock-basedcompensation expense.
Sales and marketing. Sales and marketing expenses primarily consist of personnel-related costsattributable to our sales and marketing personnel, commissions earned by our sales personnel, marketing, travel,and facility related costs and allocated overhead. We expect sales and marketing expenses to continue tosignificantly increase, in absolute dollars, in 2015 compared to 2014 primarily due to our planned growth in oursales and marketing organization, both domestically and internationally. We expect sales and marketing expensesto be our largest category of operating expenses as we continue to expand our business.
Research and development. R&D expenses primarily consist of personnel-related costs attributable toour R&D personnel and contractors, as well as allocated overhead. We have devoted our product developmentefforts primarily to develop new products, incorporate additional features, improve functionality, support additionallanguages and adapt to new technologies or changes to existing technologies. We expect that our R&D expenseswill continue to increase, in absolute dollars, in 2015 compared to 2014 as we increase our R&D headcount tofurther strengthen our software and invest in the development of our products.
General and administrative. General and administrative expenses primarily consist of personnel-relatedcosts attributable to our executive, finance, legal, human resources and administrative personnel, legal,accounting and other professional services fees, other corporate expenses and allocated overhead. In 2012,general and administrative expenses included cash and stock-based expenses associated with our funding of theTableau Foundation. We will continue to incur additional expenses associated with being a publicly tradedcompany, including higher legal, corporate insurance and accounting expenses, and the additional costs ofachieving and maintaining compliance with Section 404 of the Sarbanes-Oxley Act and other regulations. We alsoexpect that general and administrative expenses will continue to increase, in absolute dollars, in 2015 comparedto 2014 as we further expand our operations, particularly internationally.
Other Income (Expense), Net Other income (expense), net consists primarily of gains and losses on foreign currency transactions and
interest income on our cash and cash equivalents balances.
Income Tax Expense (Benefit) Our income taxes are based on the amount of our taxable income and enacted federal, state and foreign
tax rates, as adjusted for allowable credits and deductions. Our provision for income taxes consists of federal,state and foreign taxes.
We generally conduct our international operations through wholly-owned subsidiaries, branches andrepresentative offices and report our taxable income in various jurisdictions worldwide based upon our businessoperations in those jurisdictions. Our corporate structure and intercompany arrangements align with the
46
international expansion of our business activities. The application of the tax laws of various jurisdictions, includingthe United States, to our international business activities is subject to interpretation. The taxing authorities of thejurisdictions in which we operate may challenge our methodologies for valuing developed technology orintercompany arrangements, including our transfer pricing, or determine the manner in which we operate ourbusiness is not consistent with the manner in which we report our income to the jurisdictions. If such adisagreement were to occur, and our positions were not sustained, we could be required to pay additional taxes,interest and penalties, resulting in higher effective tax rates, reduced cash flows and lower overall profitability ofour operations. Additionally, our future worldwide tax rate and financial position may be affected by changes in thetax laws or the interpretation of such tax laws, such as the Base Erosion Profit Shifting project initiated by theOrganization for Economic Co-operation and Development and any legislation proposed by the relevant taxingauthorities.
Our income tax provision may be significantly affected by changes to our estimates for taxes in jurisdictionsin which we operate and other estimates utilized in determining our global effective tax rate. Actual results mayalso differ from our estimates based on changes in tax laws and economic conditions. Such changes could have asubstantial impact on the income tax provision and effective income tax rate.
We are subject to the continuous examinations of our income tax returns by the taxing authorities invarious tax jurisdictions, which authorities may assess additional income tax liabilities against us. We are currentlyunder audit by the Internal Revenue Service for taxable years 2012 and 2013. Although we believe our taxestimates are reasonable, the final outcome of tax audits and any related litigation could be materially differentfrom our historical income tax provisions. We regularly assess the likelihood of adverse outcomes resulting fromthese examinations to determine the adequacy of our provision for income taxes.
47
Critical Accounting Policies and EstimatesWe prepare our consolidated financial statements in accordance with GAAP. The preparation of
consolidated financial statements also requires us to make estimates and assumptions that affect the reportedamounts of assets, liabilities, revenues, costs and expenses and related disclosures. We base our estimates onhistorical experience and on various other assumptions that we believe to be reasonable under thecircumstances. Actual results could differ significantly from the estimates made by our management. To the extentthat there are differences between our estimates and actual results, our future financial statement presentation,financial condition, results of operations and cash flows will be affected.
Critical accounting policies and estimates are those that we consider the most important to the portrayalof our financial condition and results of operations because they require our most difficult, subjective or complexjudgments, often as a result of the need to make estimates about the effect of the matters that are inherentlyuncertain.
Revenue RecognitionWe generate revenues primarily in the form of software license fees and related maintenance and
services fees. License fees include perpetual, term and subscription license fees. Maintenance and services feesprimarily consist of fees for maintenance services (including support and unspecified upgrades andenhancements when and if they are available), training, and professional services that are not essential tofunctionality of the software.
We recognize revenues when all of the following conditions are met:
• there is persuasive evidence of an arrangement;• the software or services have been delivered to the customer;• the amount of fees to be paid by the customer is fixed or determinable; and• the collection of the related fees is probable.
We use click-through license agreements, signed agreements and purchase orders as evidence of anarrangement. We deliver all of our software electronically. Electronic delivery occurs when we provide thecustomer with access to the software and license key via a secure portal. We assess whether the fee is fixed ordeterminable at the outset of the arrangement. Our typical terms of payment are due 30 days from delivery. Weassess collectability based on a number of factors such as collection history and creditworthiness of the customer.If we determine that collectability is not probable, revenue is deferred until collectability becomes probable,generally upon receipt of cash.
Substantially all of our software licenses are sold in multiple-element arrangements that includemaintenance and may include professional services and training.
Vendor specific objective evidence (“VSOE”) of the fair value is not available for software licenses as theyare never sold without maintenance. VSOE of the fair value generally exists for all undelivered elements and anyservices that are not essential to the functionality of the delivered software. We account for delivered softwarelicenses under the residual method.
Maintenance agreements consist of fees for providing software updates on a when and if available basisand technical support for software products (“post-contract support” or “PCS”) for an initial term, generally oneyear. We have established VSOE of the fair value for maintenance on perpetual licenses based on statedsubstantive renewal rates or the price when sold on a standalone basis. Stated renewal rates are considered tobe substantive if they are at least 15% of the actual price charged for the software license. VSOE of the fair valuefor standalone sales is considered to have been established when a substantial majority of individual salestransactions within the previous 12 month period falls within a reasonably narrow range, which we have defined tobe plus or minus 15% of the median sales price of actual standalone sales transactions.
License arrangements may include professional services and training. In determining whetherprofessional services and training revenues should be accounted for separately from license revenues, weevaluate:
• whether such services are considered essential to the functionality of the software using factors such asthe nature of the software products;
• whether they are ready for use by the customer upon receipt; • the nature of the services, which typically do not involve significant customization to or development of
the underlying software code; • the availability of services from other vendors; • whether the timing of payments for license revenues coincides with performance of services; and• whether milestones or acceptance criteria exist that affect the realizability of the software license fee.
Revenues related to training are billed on a fixed fee basis and accordingly recognized as trainingservices are delivered. Payments received in advance of services performed are deferred and recognized whenthe related services are performed.
To date, professional services have not been considered essential to the functionality of the software. TheVSOE of the fair value of our professional services and training is based on the price for these same serviceswhen they are sold separately. Revenues related to professional services are billed on a time and materials basisand, accordingly, are recognized as the services are performed.
When software is licensed for a specified term or on a subscription basis, fees for support andmaintenance are generally bundled with the license fee over the entire term of the contract. In these cases, we donot have VSOE of the fair value for support and maintenance. Revenues related to term license fees arerecognized ratably over the contract term beginning on the date the customer has access to the software licensekey and continuing through the end of the contract term.
We do not offer refunds and therefore have not recorded any sales return allowance for any of the periodspresented. Upon a periodic review of outstanding accounts receivable, amounts that are deemed to beuncollectable are written off against the allowance for doubtful accounts.
We account for taxes collected from customers and remitted to governmental authorities on a net basisand exclude them from revenues.
Income Taxes Income taxes are accounted for under the asset and liability method in accordance with authoritative
guidance for income taxes. Deferred tax assets are recognized for deductible temporary differences, net operatingloss carryforwards, and credit carryforwards if it is more likely than not that the tax benefits will be realized. Weconsidered future taxable income, historical operating results, and ongoing prudent and feasible tax planningstrategies in assessing the need for a valuation allowance. If we determine we would not be able to realize all orpart of our net deferred tax assets in the future, we will record a valuation allowance on such net deferred taxassets with an offset to expense in the period such determination is made.
Deferred tax assets and liabilities are measured using enacted tax rates expected to apply to taxableincome in the years in which those temporary differences are expected to be recovered or settled. The effect on
48
deferred tax assets and liabilities of a change in tax rates is recognized in income in the period that includes theenactment date.
We are subject to income taxes in the United States and in numerous foreign jurisdictions. While webelieve the positions we have taken are appropriate, we record reserves for taxes to address potential exposuresinvolving tax positions that we believe could be challenged by taxing authorities. We record a benefit on a taxposition when we determine that it is more likely than not that the position is sustainable upon examination,including resolution of any related appeals or litigation processes, based on the technical merits of the position.For tax positions that are more likely than not to be sustained, we measure the tax position at the largest amountof benefit that has a greater than 50% likelihood of being realized when it is effectively settled. We review the taxreserves as circumstances warrant and adjust the reserves as events occur that affect our potential liability foradditional taxes. We follow the applicable guidance on derecognition, classification, interest and penalties,accounting in interim periods, disclosure, and transition with respect to tax positions. We reflect interest andpenalties related to income tax liabilities as a component of income tax expense.
Recent Accounting PronouncementsIn May 2014, as part of its ongoing efforts to assist in the convergence of GAAP and International
Financial Reporting Standards ("IFRS"), the Financial Accounting Standards Board ("FASB") issued AccountingStandards Update ("ASU") 2014-09 related to revenue recognition. The new guidance sets forth a new five-steprevenue recognition model that replaces the prior revenue recognition guidance in its entirety and is intended toeliminate numerous industry-specific pieces of revenue recognition guidance that have historically existed inGAAP. The underlying principle of the new standard is that a business or other organization will recognizerevenue to depict the transfer of promised goods or services to customers in an amount that reflects theconsideration to which the entity expects to be entitled in exchange for those goods or services. ASU 2014-09provides retrospective or modified prospective methods of initial adoption and is effective for annual periodsbeginning after December 15, 2016 and interim periods within those annual periods. Early adoption is notpermitted. We are currently evaluating the method of adoption and the impact that this standard will have on ourconsolidated financial statements.
In August 2014, the FASB issued ASU 2014-15 related to status as a going concern. The new guidanceexplicitly requires that management assess an entity's ability to continue as a going concern and may requireadditional detailed disclosures. ASU 2014-15 is effective for annual periods beginning after December 15, 2016and interim periods within those annual periods. Though permitted, we do not plan to early adopt. We do notbelieve that this standard will have significant impact on our consolidated financial statements.
49
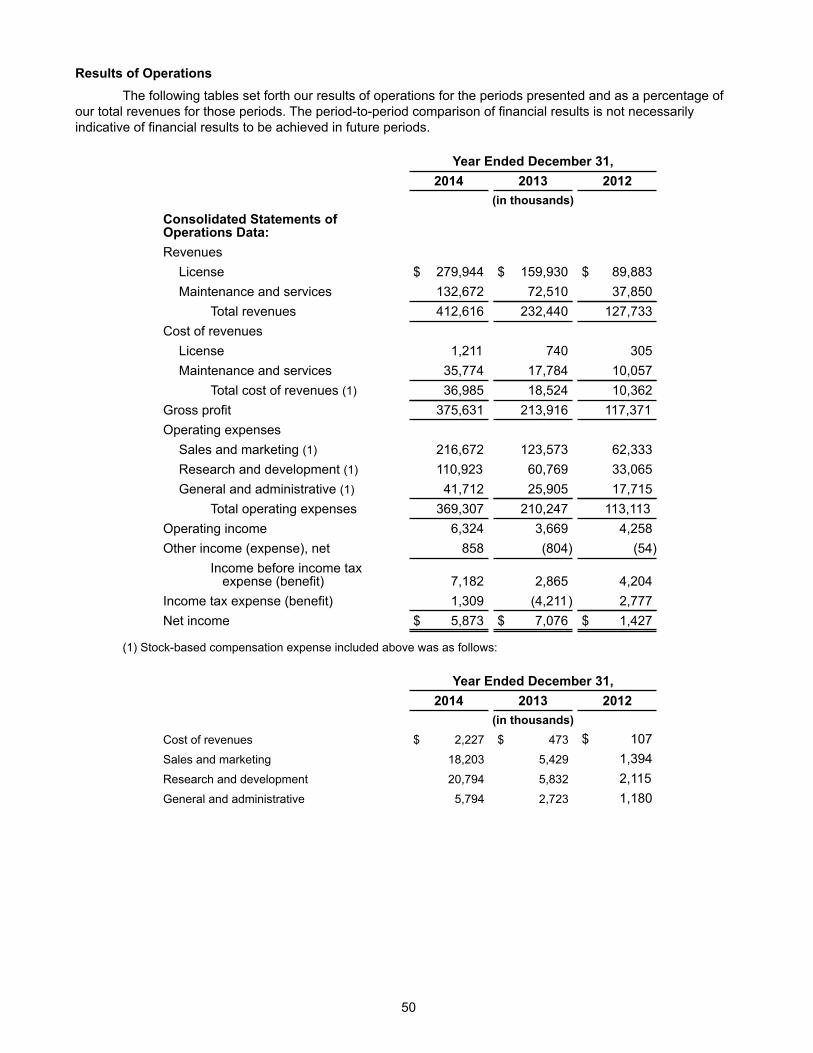
Results of OperationsThe following tables set forth our results of operations for the periods presented and as a percentage of
our total revenues for those periods. The period-to-period comparison of financial results is not necessarilyindicative of financial results to be achieved in future periods.
Year Ended December 31,2014 2013 2012
(in thousands)Consolidated Statements ofOperations Data:RevenuesLicense $ 279,944 $ 159,930 $ 89,883Maintenance and services 132,672 72,510 37,850
Total revenues 412,616 232,440 127,733Cost of revenuesLicense 1,211 740 305Maintenance and services 35,774 17,784 10,057
Total cost of revenues (1) 36,985 18,524 10,362Gross profit 375,631 213,916 117,371Operating expensesSales and marketing (1) 216,672 123,573 62,333Research and development (1) 110,923 60,769 33,065General and administrative (1) 41,712 25,905 17,715
Total operating expenses 369,307 210,247 113,113Operating income 6,324 3,669 4,258Other income (expense), net 858 (804) (54)
Income before income taxexpense (benefit) 7,182 2,865 4,204
Income tax expense (benefit) 1,309 (4,211) 2,777Net income $ 5,873 $ 7,076 $ 1,427
(1) Stock-based compensation expense included above was as follows:
Year Ended December 31,2014 2013 2012
(in thousands)Cost of revenues $ 2,227 $ 473 $ 107Sales and marketing 18,203 5,429 1,394Research and development 20,794 5,832 2,115General and administrative 5,794 2,723 1,180
50
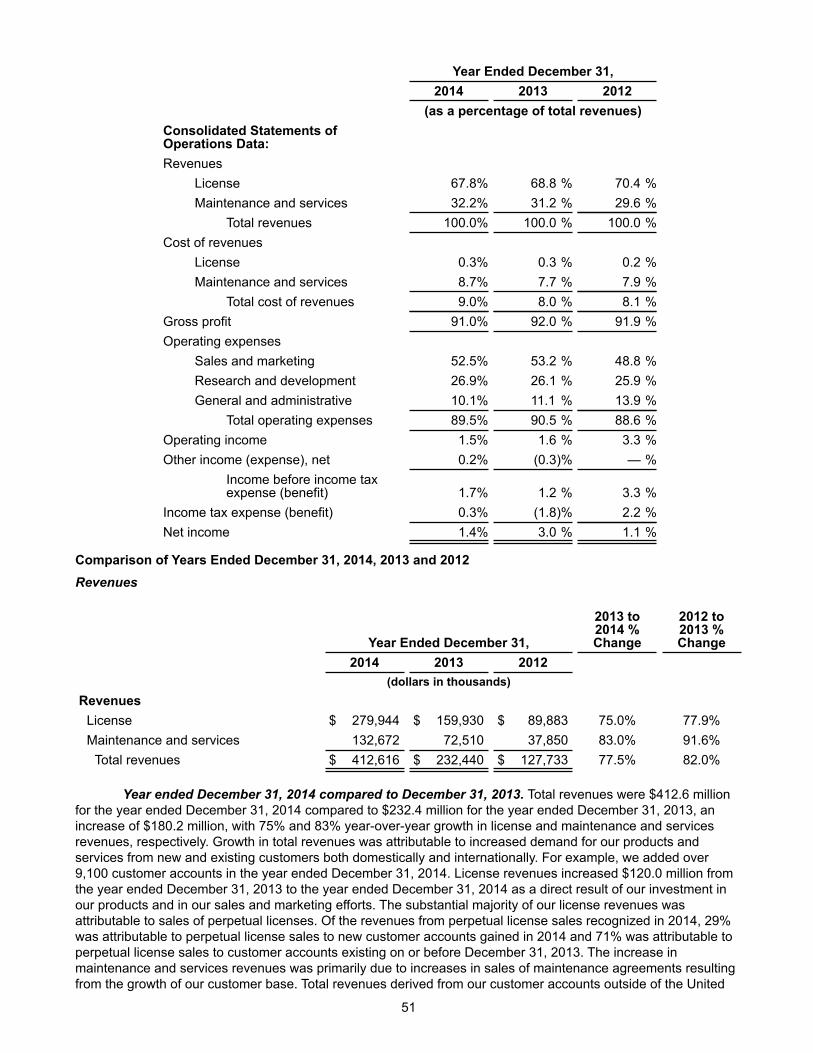
Year Ended December 31,2014 2013 2012(as a percentage of total revenues)
Consolidated Statements ofOperations Data:Revenues
License 67.8% 68.8 % 70.4 %Maintenance and services 32.2% 31.2 % 29.6 %
Total revenues 100.0% 100.0 % 100.0 %Cost of revenues
License 0.3% 0.3 % 0.2 %Maintenance and services 8.7% 7.7 % 7.9 %
Total cost of revenues 9.0% 8.0 % 8.1 %Gross profit 91.0% 92.0 % 91.9 %Operating expenses
Sales and marketing 52.5% 53.2 % 48.8 %Research and development 26.9% 26.1 % 25.9 %General and administrative 10.1% 11.1 % 13.9 %
Total operating expenses 89.5% 90.5 % 88.6 %Operating income 1.5% 1.6 % 3.3 %Other income (expense), net 0.2% (0.3)% — %
Income before income taxexpense (benefit) 1.7% 1.2 % 3.3 %
Income tax expense (benefit) 0.3% (1.8)% 2.2 %Net income 1.4% 3.0 % 1.1 %
Comparison of Years Ended December 31, 2014, 2013 and 2012 Revenues
Year Ended December 31,
2013 to2014 %Change
2012 to2013 %Change
2014 2013 2012(dollars in thousands)
RevenuesLicense $ 279,944 $ 159,930 $ 89,883 75.0% 77.9%Maintenance and services 132,672 72,510 37,850 83.0% 91.6%Total revenues $ 412,616 $ 232,440 $ 127,733 77.5% 82.0%
Year ended December 31, 2014 compared to December 31, 2013. Total revenues were $412.6 millionfor the year ended December 31, 2014 compared to $232.4 million for the year ended December 31, 2013, anincrease of $180.2 million, with 75% and 83% year-over-year growth in license and maintenance and servicesrevenues, respectively. Growth in total revenues was attributable to increased demand for our products andservices from new and existing customers both domestically and internationally. For example, we added over9,100 customer accounts in the year ended December 31, 2014. License revenues increased $120.0 million fromthe year ended December 31, 2013 to the year ended December 31, 2014 as a direct result of our investment inour products and in our sales and marketing efforts. The substantial majority of our license revenues wasattributable to sales of perpetual licenses. Of the revenues from perpetual license sales recognized in 2014, 29%was attributable to perpetual license sales to new customer accounts gained in 2014 and 71% was attributable toperpetual license sales to customer accounts existing on or before December 31, 2013. The increase inmaintenance and services revenues was primarily due to increases in sales of maintenance agreements resultingfrom the growth of our customer base. Total revenues derived from our customer accounts outside of the United
51
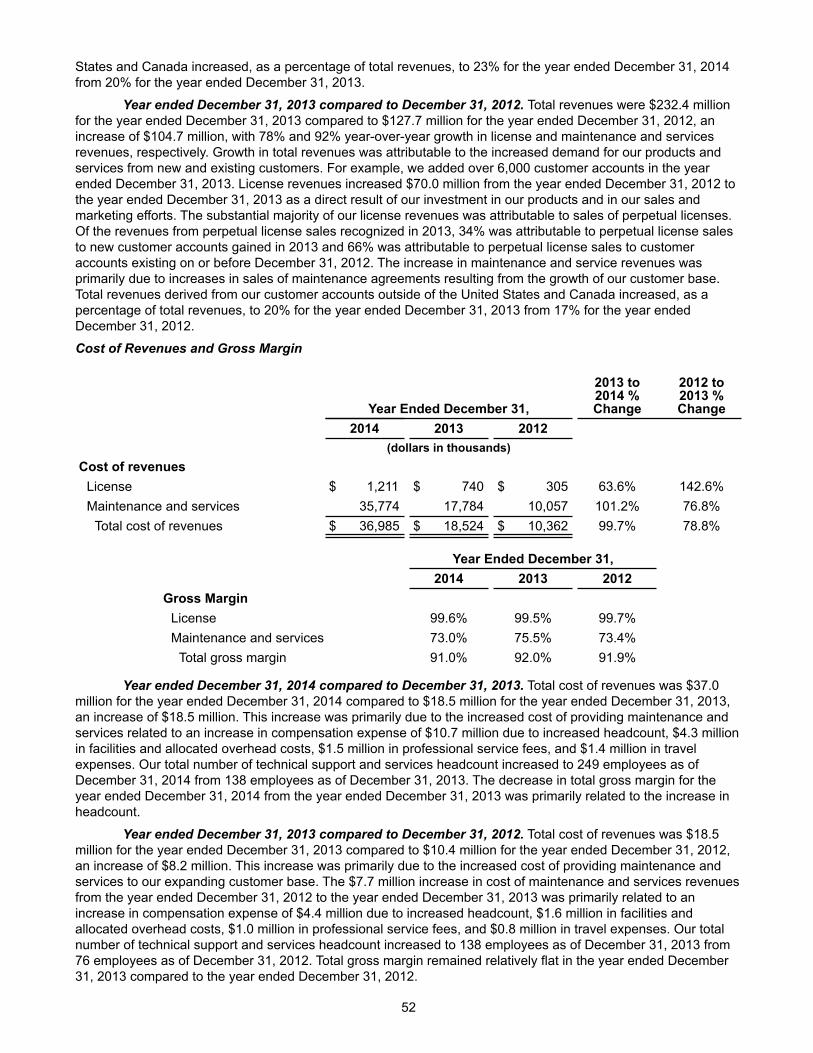
States and Canada increased, as a percentage of total revenues, to 23% for the year ended December 31, 2014from 20% for the year ended December 31, 2013.
Year ended December 31, 2013 compared to December 31, 2012. Total revenues were $232.4 millionfor the year ended December 31, 2013 compared to $127.7 million for the year ended December 31, 2012, anincrease of $104.7 million, with 78% and 92% year-over-year growth in license and maintenance and servicesrevenues, respectively. Growth in total revenues was attributable to the increased demand for our products andservices from new and existing customers. For example, we added over 6,000 customer accounts in the yearended December 31, 2013. License revenues increased $70.0 million from the year ended December 31, 2012 tothe year ended December 31, 2013 as a direct result of our investment in our products and in our sales andmarketing efforts. The substantial majority of our license revenues was attributable to sales of perpetual licenses.Of the revenues from perpetual license sales recognized in 2013, 34% was attributable to perpetual license salesto new customer accounts gained in 2013 and 66% was attributable to perpetual license sales to customeraccounts existing on or before December 31, 2012. The increase in maintenance and service revenues wasprimarily due to increases in sales of maintenance agreements resulting from the growth of our customer base.Total revenues derived from our customer accounts outside of the United States and Canada increased, as apercentage of total revenues, to 20% for the year ended December 31, 2013 from 17% for the year endedDecember 31, 2012.
Cost of Revenues and Gross Margin
Year Ended December 31,
2013 to2014 %Change
2012 to2013 %Change
2014 2013 2012(dollars in thousands)
Cost of revenuesLicense $ 1,211 $ 740 $ 305 63.6% 142.6%Maintenance and services 35,774 17,784 10,057 101.2% 76.8%Total cost of revenues $ 36,985 $ 18,524 $ 10,362 99.7% 78.8%
Year Ended December 31,2014 2013 2012
Gross MarginLicense 99.6% 99.5% 99.7%Maintenance and services 73.0% 75.5% 73.4%Total gross margin 91.0% 92.0% 91.9%
Year ended December 31, 2014 compared to December 31, 2013. Total cost of revenues was $37.0million for the year ended December 31, 2014 compared to $18.5 million for the year ended December 31, 2013,an increase of $18.5 million. This increase was primarily due to the increased cost of providing maintenance andservices related to an increase in compensation expense of $10.7 million due to increased headcount, $4.3 millionin facilities and allocated overhead costs, $1.5 million in professional service fees, and $1.4 million in travelexpenses. Our total number of technical support and services headcount increased to 249 employees as ofDecember 31, 2014 from 138 employees as of December 31, 2013. The decrease in total gross margin for theyear ended December 31, 2014 from the year ended December 31, 2013 was primarily related to the increase inheadcount.
Year ended December 31, 2013 compared to December 31, 2012. Total cost of revenues was $18.5million for the year ended December 31, 2013 compared to $10.4 million for the year ended December 31, 2012,an increase of $8.2 million. This increase was primarily due to the increased cost of providing maintenance andservices to our expanding customer base. The $7.7 million increase in cost of maintenance and services revenuesfrom the year ended December 31, 2012 to the year ended December 31, 2013 was primarily related to anincrease in compensation expense of $4.4 million due to increased headcount, $1.6 million in facilities andallocated overhead costs, $1.0 million in professional service fees, and $0.8 million in travel expenses. Our totalnumber of technical support and services headcount increased to 138 employees as of December 31, 2013 from76 employees as of December 31, 2012. Total gross margin remained relatively flat in the year ended December31, 2013 compared to the year ended December 31, 2012.
52
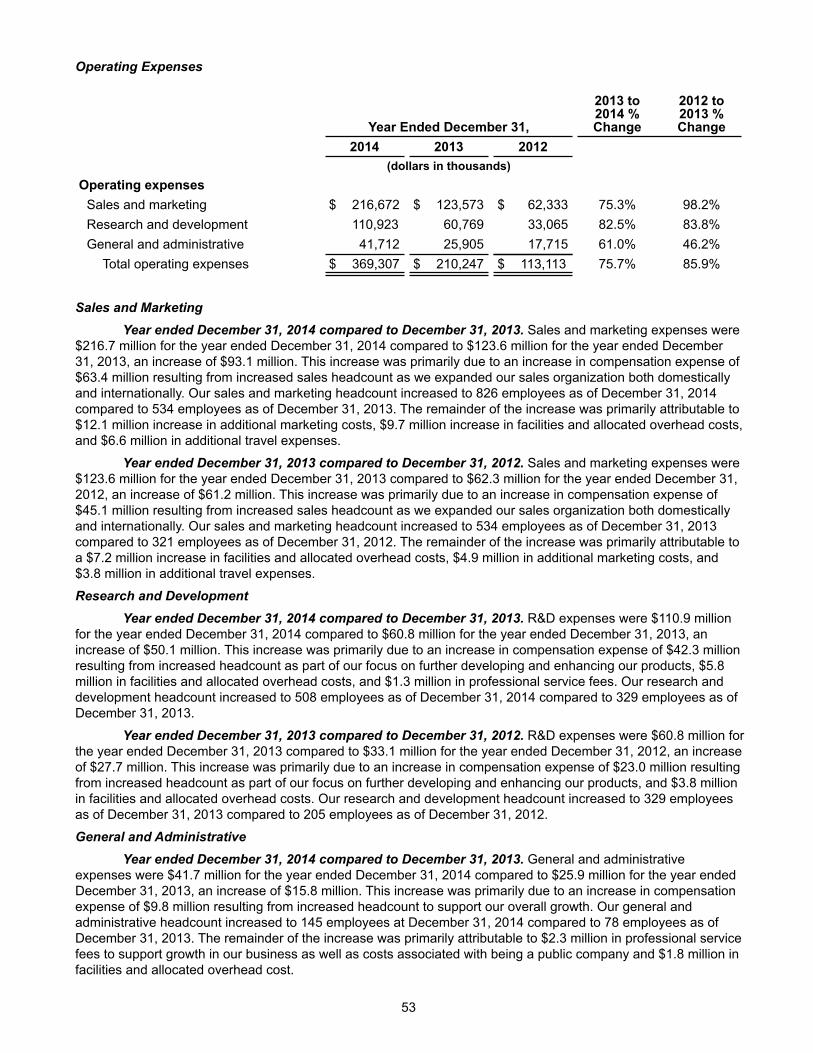
Operating Expenses
Year Ended December 31,
2013 to2014 %Change
2012 to2013 %Change
2014 2013 2012(dollars in thousands)
Operating expensesSales and marketing $ 216,672 $ 123,573 $ 62,333 75.3% 98.2%Research and development 110,923 60,769 33,065 82.5% 83.8%General and administrative 41,712 25,905 17,715 61.0% 46.2%Total operating expenses $ 369,307 $ 210,247 $ 113,113 75.7% 85.9%
Sales and MarketingYear ended December 31, 2014 compared to December 31, 2013. Sales and marketing expenses were
$216.7 million for the year ended December 31, 2014 compared to $123.6 million for the year ended December31, 2013, an increase of $93.1 million. This increase was primarily due to an increase in compensation expense of$63.4 million resulting from increased sales headcount as we expanded our sales organization both domesticallyand internationally. Our sales and marketing headcount increased to 826 employees as of December 31, 2014compared to 534 employees as of December 31, 2013. The remainder of the increase was primarily attributable to$12.1 million increase in additional marketing costs, $9.7 million increase in facilities and allocated overhead costs,and $6.6 million in additional travel expenses.
Year ended December 31, 2013 compared to December 31, 2012. Sales and marketing expenses were$123.6 million for the year ended December 31, 2013 compared to $62.3 million for the year ended December 31,2012, an increase of $61.2 million. This increase was primarily due to an increase in compensation expense of$45.1 million resulting from increased sales headcount as we expanded our sales organization both domesticallyand internationally. Our sales and marketing headcount increased to 534 employees as of December 31, 2013compared to 321 employees as of December 31, 2012. The remainder of the increase was primarily attributable toa $7.2 million increase in facilities and allocated overhead costs, $4.9 million in additional marketing costs, and$3.8 million in additional travel expenses.
Research and DevelopmentYear ended December 31, 2014 compared to December 31, 2013. R&D expenses were $110.9 million
for the year ended December 31, 2014 compared to $60.8 million for the year ended December 31, 2013, anincrease of $50.1 million. This increase was primarily due to an increase in compensation expense of $42.3 millionresulting from increased headcount as part of our focus on further developing and enhancing our products, $5.8million in facilities and allocated overhead costs, and $1.3 million in professional service fees. Our research anddevelopment headcount increased to 508 employees as of December 31, 2014 compared to 329 employees as ofDecember 31, 2013.
Year ended December 31, 2013 compared to December 31, 2012. R&D expenses were $60.8 million forthe year ended December 31, 2013 compared to $33.1 million for the year ended December 31, 2012, an increaseof $27.7 million. This increase was primarily due to an increase in compensation expense of $23.0 million resultingfrom increased headcount as part of our focus on further developing and enhancing our products, and $3.8 millionin facilities and allocated overhead costs. Our research and development headcount increased to 329 employeesas of December 31, 2013 compared to 205 employees as of December 31, 2012.
General and AdministrativeYear ended December 31, 2014 compared to December 31, 2013. General and administrative
expenses were $41.7 million for the year ended December 31, 2014 compared to $25.9 million for the year endedDecember 31, 2013, an increase of $15.8 million. This increase was primarily due to an increase in compensationexpense of $9.8 million resulting from increased headcount to support our overall growth. Our general andadministrative headcount increased to 145 employees at December 31, 2014 compared to 78 employees as ofDecember 31, 2013. The remainder of the increase was primarily attributable to $2.3 million in professional servicefees to support growth in our business as well as costs associated with being a public company and $1.8 million infacilities and allocated overhead cost.
53
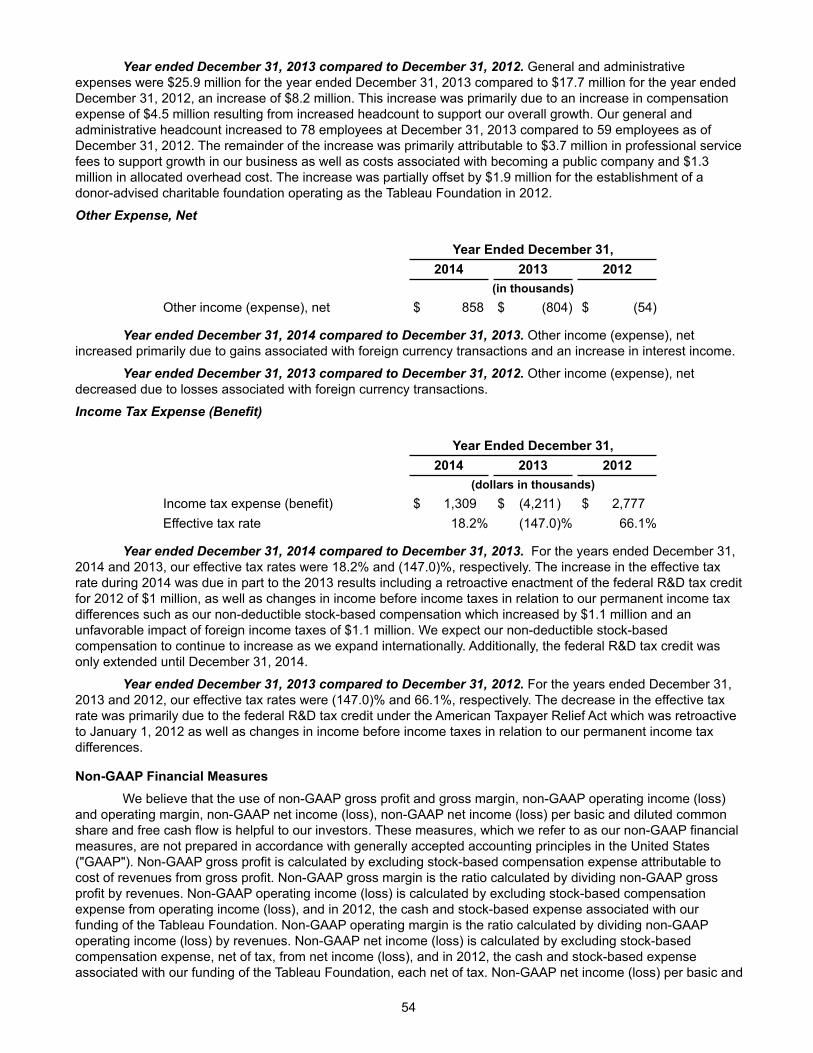
Year ended December 31, 2013 compared to December 31, 2012. General and administrativeexpenses were $25.9 million for the year ended December 31, 2013 compared to $17.7 million for the year ended
December 31, 2012, an increase of $8.2 million. This increase was primarily due to an increase in compensation
expense of $4.5 million resulting from increased headcount to support our overall growth. Our general and
administrative headcount increased to 78 employees at December 31, 2013 compared to 59 employees as of
December 31, 2012. The remainder of the increase was primarily attributable to $3.7 million in professional service
fees to support growth in our business as well as costs associated with becoming a public company and $1.3
million in allocated overhead cost. The increase was partially offset by $1.9 million for the establishment of a
donor-advised charitable foundation operating as the Tableau Foundation in 2012.
Other Expense, Net
Year Ended December 31,2014 2013 2012
(in thousands)Other income (expense), net $ 858 $ (804) $ (54)
Year ended December 31, 2014 compared to December 31, 2013. Other income (expense), netincreased primarily due to gains associated with foreign currency transactions and an increase in interest income.
Year ended December 31, 2013 compared to December 31, 2012. Other income (expense), netdecreased due to losses associated with foreign currency transactions.
Income Tax Expense (Benefit)
Year Ended December 31,2014 2013 2012
(dollars in thousands)Income tax expense (benefit) $ 1,309 $ (4,211) $ 2,777
Effective tax rate 18.2% (147.0)% 66.1%
Year ended December 31, 2014 compared to December 31, 2013. For the years ended December 31,2014 and 2013, our effective tax rates were 18.2% and (147.0)%, respectively. The increase in the effective tax
rate during 2014 was due in part to the 2013 results including a retroactive enactment of the federal R&D tax credit
for 2012 of $1 million, as well as changes in income before income taxes in relation to our permanent income tax
differences such as our non-deductible stock-based compensation which increased by $1.1 million and an
unfavorable impact of foreign income taxes of $1.1 million. We expect our non-deductible stock-based
compensation to continue to increase as we expand internationally. Additionally, the federal R&D tax credit was
only extended until December 31, 2014.
Year ended December 31, 2013 compared to December 31, 2012. For the years ended December 31,2013 and 2012, our effective tax rates were (147.0)% and 66.1%, respectively. The decrease in the effective tax
rate was primarily due to the federal R&D tax credit under the American Taxpayer Relief Act which was retroactive
to January 1, 2012 as well as changes in income before income taxes in relation to our permanent income tax
differences.
54
Non-GAAP Financial MeasuresWe believe that the use of non-GAAP gross profit and gross margin, non-GAAP operating income (loss)
and operating margin, non-GAAP net income (loss), non-GAAP net income (loss) per basic and diluted common
share and free cash flow is helpful to our investors. These measures, which we refer to as our non-GAAP financial
measures, are not prepared in accordance with generally accepted accounting principles in the United States
("GAAP"). Non-GAAP gross profit is calculated by excluding stock-based compensation expense attributable to
cost of revenues from gross profit. Non-GAAP gross margin is the ratio calculated by dividing non-GAAP gross
profit by revenues. Non-GAAP operating income (loss) is calculated by excluding stock-based compensation
expense from operating income (loss), and in 2012, the cash and stock-based expense associated with our
funding of the Tableau Foundation. Non-GAAP operating margin is the ratio calculated by dividing non-GAAP
operating income (loss) by revenues. Non-GAAP net income (loss) is calculated by excluding stock-based
compensation expense, net of tax, from net income (loss), and in 2012, the cash and stock-based expense
associated with our funding of the Tableau Foundation, each net of tax. Non-GAAP net income (loss) per basic and
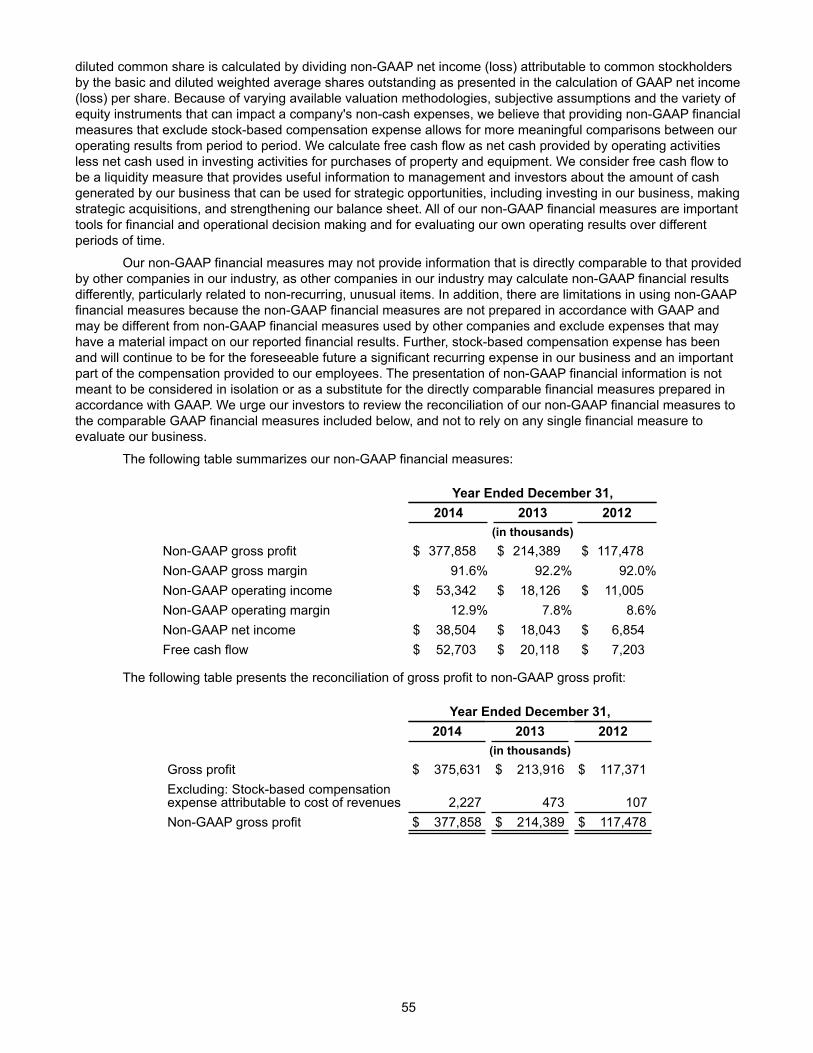
diluted common share is calculated by dividing non-GAAP net income (loss) attributable to common stockholdersby the basic and diluted weighted average shares outstanding as presented in the calculation of GAAP net income(loss) per share. Because of varying available valuation methodologies, subjective assumptions and the variety ofequity instruments that can impact a company's non-cash expenses, we believe that providing non-GAAP financialmeasures that exclude stock-based compensation expense allows for more meaningful comparisons between ouroperating results from period to period. We calculate free cash flow as net cash provided by operating activitiesless net cash used in investing activities for purchases of property and equipment. We consider free cash flow tobe a liquidity measure that provides useful information to management and investors about the amount of cashgenerated by our business that can be used for strategic opportunities, including investing in our business, makingstrategic acquisitions, and strengthening our balance sheet. All of our non-GAAP financial measures are importanttools for financial and operational decision making and for evaluating our own operating results over differentperiods of time.
Our non-GAAP financial measures may not provide information that is directly comparable to that providedby other companies in our industry, as other companies in our industry may calculate non-GAAP financial resultsdifferently, particularly related to non-recurring, unusual items. In addition, there are limitations in using non-GAAPfinancial measures because the non-GAAP financial measures are not prepared in accordance with GAAP andmay be different from non-GAAP financial measures used by other companies and exclude expenses that mayhave a material impact on our reported financial results. Further, stock-based compensation expense has beenand will continue to be for the foreseeable future a significant recurring expense in our business and an importantpart of the compensation provided to our employees. The presentation of non-GAAP financial information is notmeant to be considered in isolation or as a substitute for the directly comparable financial measures prepared inaccordance with GAAP. We urge our investors to review the reconciliation of our non-GAAP financial measures tothe comparable GAAP financial measures included below, and not to rely on any single financial measure toevaluate our business.
The following table summarizes our non-GAAP financial measures:
Year Ended December 31,2014 2013 2012
(in thousands)Non-GAAP gross profit $ 377,858 $ 214,389 $ 117,478Non-GAAP gross margin 91.6% 92.2% 92.0%Non-GAAP operating income $ 53,342 $ 18,126 $ 11,005Non-GAAP operating margin 12.9% 7.8% 8.6%Non-GAAP net income $ 38,504 $ 18,043 $ 6,854Free cash flow $ 52,703 $ 20,118 $ 7,203
The following table presents the reconciliation of gross profit to non-GAAP gross profit:
Year Ended December 31,2014 2013 2012
(in thousands)Gross profit $ 375,631 $ 213,916 $ 117,371Excluding: Stock-based compensationexpense attributable to cost of revenues 2,227 473 107Non-GAAP gross profit $ 377,858 $ 214,389 $ 117,478
55
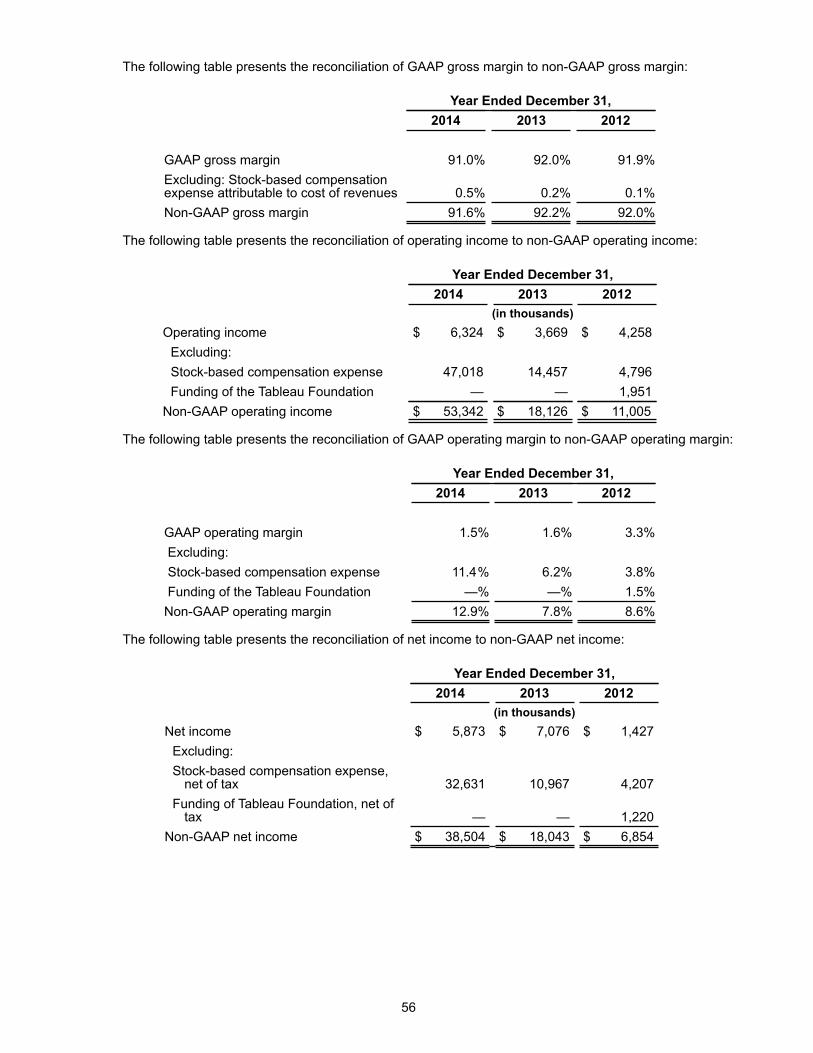
The following table presents the reconciliation of GAAP gross margin to non-GAAP gross margin:
Year Ended December 31,2014 2013 2012
GAAP gross margin 91.0% 92.0% 91.9%Excluding: Stock-based compensationexpense attributable to cost of revenues 0.5% 0.2% 0.1%Non-GAAP gross margin 91.6% 92.2% 92.0%
The following table presents the reconciliation of operating income to non-GAAP operating income:
Year Ended December 31,2014 2013 2012
(in thousands)Operating income $ 6,324 $ 3,669 $ 4,258Excluding:Stock-based compensation expense 47,018 14,457 4,796Funding of the Tableau Foundation — — 1,951Non-GAAP operating income $ 53,342 $ 18,126 $ 11,005
The following table presents the reconciliation of GAAP operating margin to non-GAAP operating margin:
Year Ended December 31,2014 2013 2012
GAAP operating margin 1.5% 1.6% 3.3% Excluding: Stock-based compensation expense 11.4% 6.2% 3.8% Funding of the Tableau Foundation —% —% 1.5%Non-GAAP operating margin 12.9% 7.8% 8.6%
The following table presents the reconciliation of net income to non-GAAP net income:
Year Ended December 31,2014 2013 2012
(in thousands)Net income $ 5,873 $ 7,076 $ 1,427Excluding:Stock-based compensation expense,net of tax 32,631 10,967 4,207
Funding of Tableau Foundation, net oftax — — 1,220
Non-GAAP net income $ 38,504 $ 18,043 $ 6,854
56
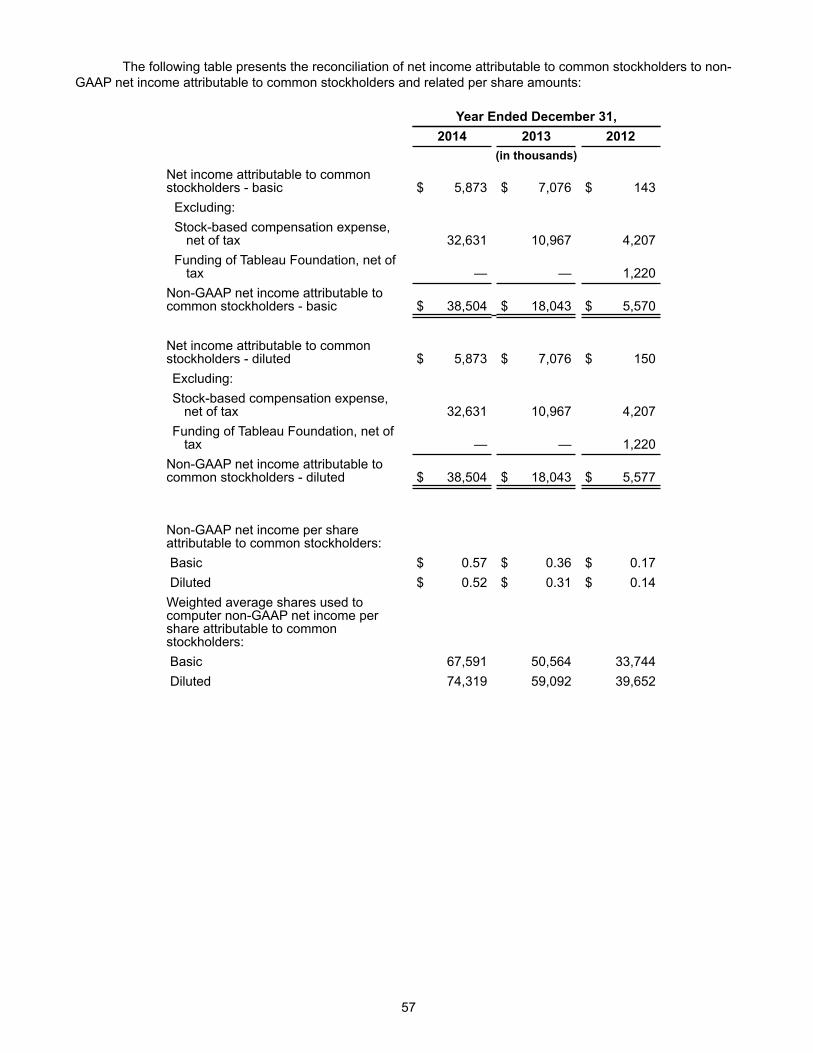
The following table presents the reconciliation of net income attributable to common stockholders to non-
GAAP net income attributable to common stockholders and related per share amounts:
Year Ended December 31,2014 2013 2012
(in thousands)Net income attributable to common
stockholders - basic $ 5,873 $ 7,076 $ 143
Excluding:
Stock-based compensation expense,
net of tax 32,631 10,967 4,207
Funding of Tableau Foundation, net of
tax — — 1,220
Non-GAAP net income attributable to
common stockholders - basic $ 38,504 $ 18,043 $ 5,570
Net income attributable to common
stockholders - diluted $ 5,873 $ 7,076 $ 150
Excluding:
Stock-based compensation expense,
net of tax 32,631 10,967 4,207
Funding of Tableau Foundation, net of
tax — — 1,220
Non-GAAP net income attributable to
common stockholders - diluted $ 38,504 $ 18,043 $ 5,577
Non-GAAP net income per share
attributable to common stockholders:
Basic $ 0.57 $ 0.36 $ 0.17
Diluted $ 0.52 $ 0.31 $ 0.14
Weighted average shares used to
computer non-GAAP net income per
share attributable to common
stockholders:
Basic 67,591 50,564 33,744
Diluted 74,319 59,092 39,652
57
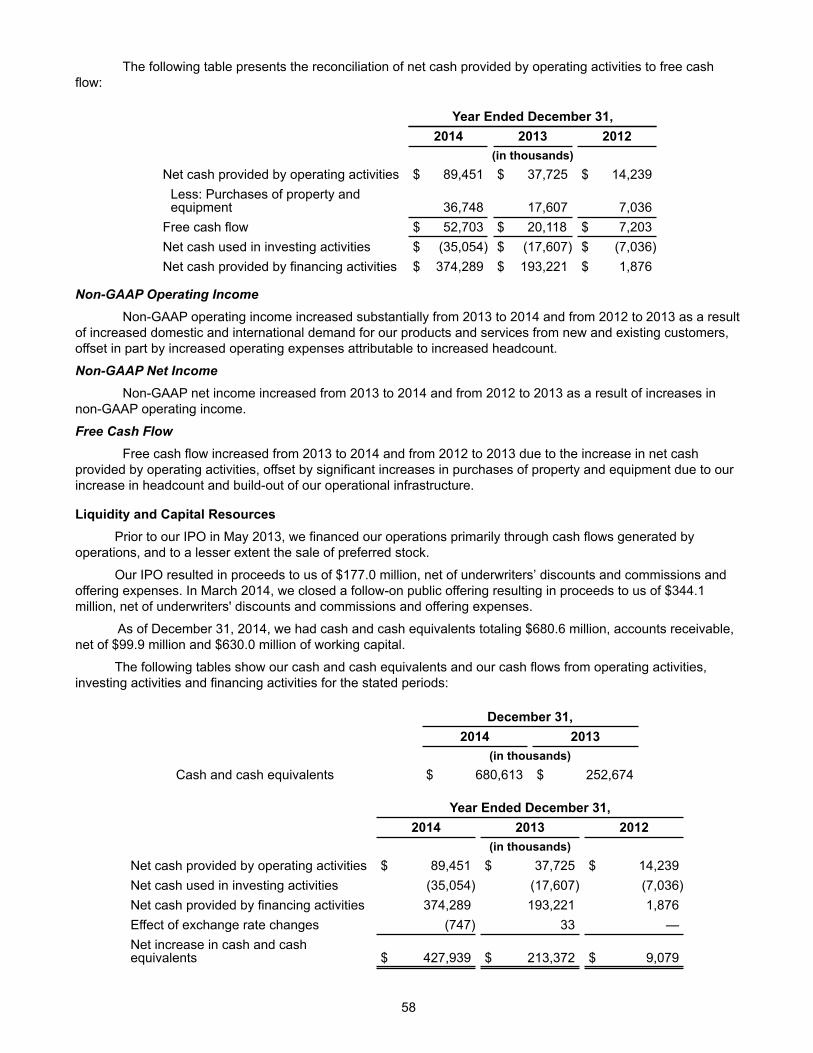
The following table presents the reconciliation of net cash provided by operating activities to free cashflow:
Year Ended December 31,2014 2013 2012
(in thousands)Net cash provided by operating activities $ 89,451 $ 37,725 $ 14,239Less: Purchases of property andequipment 36,748 17,607 7,036Free cash flow $ 52,703 $ 20,118 $ 7,203Net cash used in investing activities $ (35,054) $ (17,607) $ (7,036)Net cash provided by financing activities $ 374,289 $ 193,221 $ 1,876
Non-GAAP Operating Income Non-GAAP operating income increased substantially from 2013 to 2014 and from 2012 to 2013 as a result
of increased domestic and international demand for our products and services from new and existing customers,offset in part by increased operating expenses attributable to increased headcount.
Non-GAAP Net Income Non-GAAP net income increased from 2013 to 2014 and from 2012 to 2013 as a result of increases in
non-GAAP operating income.
Free Cash Flow Free cash flow increased from 2013 to 2014 and from 2012 to 2013 due to the increase in net cash
provided by operating activities, offset by significant increases in purchases of property and equipment due to ourincrease in headcount and build-out of our operational infrastructure.
58
Liquidity and Capital Resources Prior to our IPO in May 2013, we financed our operations primarily through cash flows generated by
operations, and to a lesser extent the sale of preferred stock.
Our IPO resulted in proceeds to us of $177.0 million, net of underwriters’ discounts and commissions andoffering expenses. In March 2014, we closed a follow-on public offering resulting in proceeds to us of $344.1million, net of underwriters' discounts and commissions and offering expenses.
As of December 31, 2014, we had cash and cash equivalents totaling $680.6 million, accounts receivable,net of $99.9 million and $630.0 million of working capital.
The following tables show our cash and cash equivalents and our cash flows from operating activities,investing activities and financing activities for the stated periods:
December 31,2014 2013
(in thousands)Cash and cash equivalents $ 680,613 $ 252,674
Year Ended December 31,2014 2013 2012
(in thousands)Net cash provided by operating activities $ 89,451 $ 37,725 $ 14,239Net cash used in investing activities (35,054) (17,607) (7,036)Net cash provided by financing activities 374,289 193,221 1,876Effect of exchange rate changes (747) 33 —Net increase in cash and cashequivalents $ 427,939 $ 213,372 $ 9,079
Cash and Cash Equivalents As of December 31, 2014, our cash and cash equivalents were held for working capital purposes, a
majority of which was held in cash deposits and money market funds. We intend to increase our capitalexpenditures to support the growth in our business and operations. We believe that our existing cash and cashequivalents, together with cash generated from operations, will be sufficient to meet our anticipated cash needsfor at least the next 12 months. Our future capital requirements will depend on many factors including our growthrate, the timing and extent of spending to support research and development efforts, the continued expansion ofsales and marketing activities, the introduction of new and enhanced software and services offerings, and thecontinued market acceptance of our products.
Operating Activities Net cash provided by operating activities was $89.5 million for the year ended December 31, 2014, as a
result of net income of $5.9 million, which included stock-based compensation expense of $47.0 million, non-cashdepreciation and amortization expense of $13.5 million related to capital expenditures, a $41.0 million offsettingincrease in accounts receivable, net, and a $62.8 million increase in deferred revenue. The increase in accountsreceivable, net and deferred revenue was primarily due to increased license and maintenance agreement sales.The increase in stock-based compensation expense was a result of the issuance of RSUs at a higher fair-marketvalue on grant date and an increase in headcount.
Net cash provided by operating activities was $37.7 million for the year ended December 31, 2013, as aresult of net income of $7.1 million, which included stock-based compensation expense of $14.5 million, non-cashdepreciation and amortization expense of $6.9 million related to capital expenditures, a $30.0 million offsettingincrease in accounts receivable, net, and a $34.7 million increase in deferred revenue. The increase in accountsreceivable, net and deferred revenue was primarily due to increased license and maintenance agreement sales.
Net cash provided by operating activities was $14.2 million for the year ended December 31, 2012, as aresult of net income of $1.4 million, which included stock-based compensation expense of $4.8 million, non-cashdepreciation and amortization expense of $3.8 million related to capital expenditures, a $17.4 million offsettingincrease in accounts receivable, net, and a $15.4 million increase in deferred revenue. The increase in accountsreceivable, net and deferred revenue was primarily due to increased license and maintenance agreement sales.
Investing Activities Cash outflows for investing activities for the years ended December 31, 2014, 2013 and 2012 were $35.1
million, $17.6 million and $7.0 million, respectively. The cash used for these periods was primarily attributable tocapital expenditures to support the growth of our business, including hardware, software, office equipment andleasehold improvements.
Financing Activities Cash inflows from our financing activities for the years ended December 31, 2014, 2013 and 2012 were
$374.3 million, $193.2 million and $1.9 million, respectively. For the years ended December 31, 2014, and 2013,cash provided by financing activities was primarily due to the $344.1 million and $177.0 million net proceeds fromour public offerings in March 2014 and May 2013, respectively. In addition, for the years ended December 31,2014 and 2013, cash provided by financing activities attributable to proceeds and excess tax benefits from theexercise of stock options was $30.2 million and $16.2 million, respectively.
Off-Balance Sheet Arrangements We do not have any off-balance sheet arrangements (as defined by applicable SEC regulations) that are
reasonably likely to have a current or future material effect on our financial condition, results of operations,liquidity, capital expenditures or capital resources.
59
Obligations and CommitmentsAs of December 31, 2014, our principal obligations consisted of obligations outstanding under operating
leases. We lease our facilities under operating leases that expire at various dates through 2025. The following
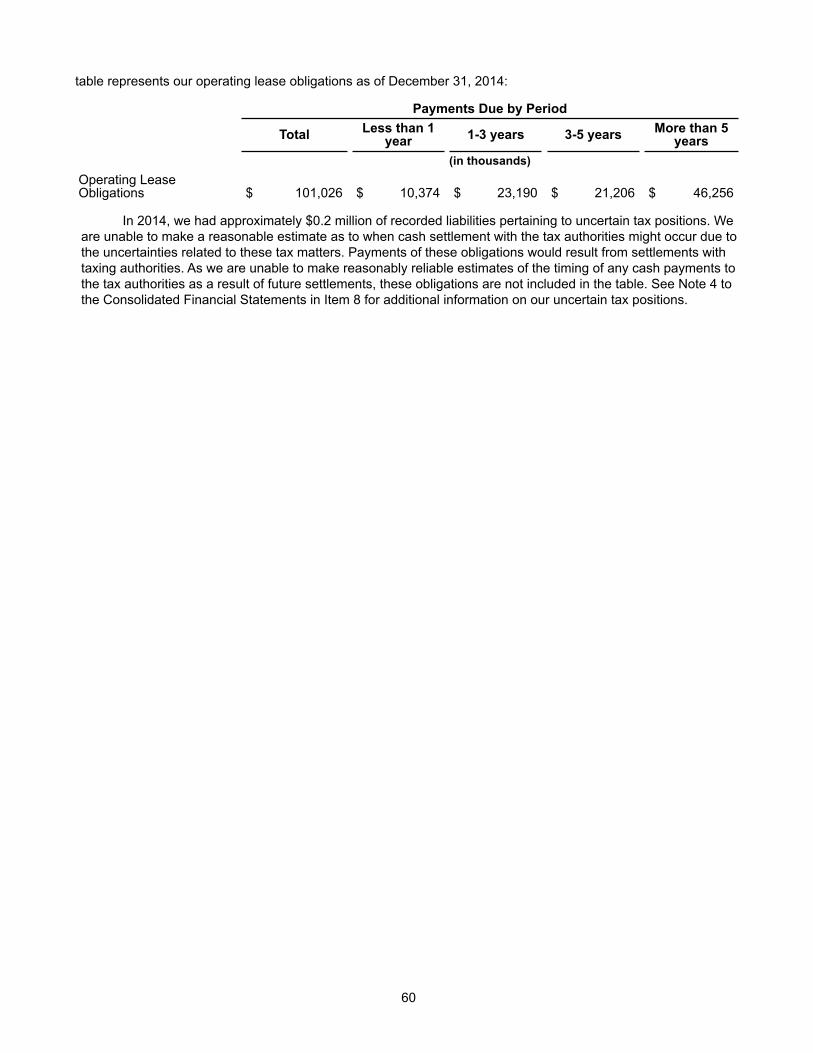
table represents our operating lease obligations as of December 31, 2014:
Payments Due by Period
Total Less than 1year 1-3 years 3-5 years More than 5
years(in thousands)
Operating LeaseObligations $ 101,026 $ 10,374 $ 23,190 $ 21,206 $ 46,256
In 2014, we had approximately $0.2 million of recorded liabilities pertaining to uncertain tax positions. Weare unable to make a reasonable estimate as to when cash settlement with the tax authorities might occur due tothe uncertainties related to these tax matters. Payments of these obligations would result from settlements withtaxing authorities. As we are unable to make reasonably reliable estimates of the timing of any cash payments tothe tax authorities as a result of future settlements, these obligations are not included in the table. See Note 4 tothe Consolidated Financial Statements in Item 8 for additional information on our uncertain tax positions.
60
ITEM 7A. Quantitative and Qualitative Disclosures about Market Risk We are exposed to financial market risks, primarily changes in interest rates. Market risk is the potential
loss arising from adverse changes in market rates and prices.
Interest Rate Risk We had cash and cash equivalents of $680.6 million as of December 31, 2014. We hold our cash and
cash equivalents for working capital purposes. Our cash and cash equivalents are held in cash deposits and
money market funds. Due to the short-term nature of these instruments, we believe that we do not have any
material exposure to changes in the fair value of our investment portfolio as a result of changes in interest rates.
Declines in interest rates, however, would reduce future interest income.
Foreign Currency Exchange Risk Our results of operations and cash flows are subject to fluctuations due to changes in foreign currency
exchange rates. Most of our revenues are generated in U.S. dollars. Our expenses are generally denominated in
the currencies in which our operations are located, which is primarily in the United States and to a lesser extent in
Europe and Asia. Our results of operations and cash flows are, therefore, subject to fluctuations due to changes in
foreign currency exchange rates and may be adversely affected in the future due to changes in foreign exchange
rates. Currently, the portion of our results of operations and cash flows denominated in foreign currency is not
significant and therefore, the effect of a hypothetical 10% change in foreign currency exchange rates applicable to
our business would not have a material impact on our consolidated financial statements. To date, we have not
engaged in any foreign currency hedging strategies. As our international operations grow, we plan to generate
revenues in foreign currencies and we will continue to reassess our approach to manage our risk relating to
fluctuations in currency rates.
Inflation We do not believe that inflation had a material effect on our business, financial condition or results of
operations in the last three fiscal years. If our costs were to become subject to significant inflationary pressures,
we may not be able to fully offset such higher costs through price increases. Our inability or failure to do so could
harm our business, financial condition and results of operations.
61
ITEM 8. CONSOLIDATED FINANCIAL STATEMENTS AND SUPPLEMENTARY DATA
TABLEAU SOFTWARE, INC. INDEX TO CONSOLIDATED FINANCIAL STATEMENTS
Report of Independent Registered Public Accounting Firm 63Consolidated Balance Sheets 64Consolidated Statements of Operations 65Consolidated Statements of Comprehensive Income 66Consolidated Statements of Convertible Preferred Stock andStockholders' Equity (Deficit) 67Consolidated Statements of Cash Flows 68Notes to Consolidated Financial Statements 69
62
REPORT OF INDEPENDENT REGISTERED PUBLIC ACCOUNTING FIRM To the Board of Directors and Stockholders of
Tableau Software, Inc.:
In our opinion, the accompanying consolidated balance sheets and the related consolidated statements ofoperations, of comprehensive income, of convertible preferred stock and stockholders’ equity (deficit) and of cashflows present fairly, in all material respects, the financial position of Tableau Software, Inc. and its subsidiaries atDecember 31, 2014 and 2013, and the results of their operations and their cash flows for each of the three yearsin the period ended December 31, 2014 in conformity with accounting principles generally accepted in the UnitedStates of America. Also in our opinion, the Company maintained, in all material respects, effective internal controlover financial reporting as of December 31, 2014, based on criteria established in Internal Control - IntegratedFramework (2013) issued by the Committee of Sponsoring Organizations of the Treadway Commission (COSO).The Company's management is responsible for these financial statements, for maintaining effective internalcontrol over financial reporting and for its assessment of the effectiveness of internal control over financialreporting, included in Management's Report on Internal Control Over Financial Reporting appearing under Item9A. Our responsibility is to express opinions on these financial statements and on the Company's internal controlover financial reporting based on our audits (which was an integrated audit in 2014). We conducted our audits inaccordance with the standards of the Public Company Accounting Oversight Board (United States). Thosestandards require that we plan and perform the audits to obtain reasonable assurance about whether the financialstatements are free of material misstatement and whether effective internal control over financial reporting wasmaintained in all material respects. Our audits of the financial statements included examining, on a test basis,evidence supporting the amounts and disclosures in the financial statements, assessing the accounting principlesused and significant estimates made by management, and evaluating the overall financial statement presentation.Our audit of internal control over financial reporting included obtaining an understanding of internal control overfinancial reporting, assessing the risk that a material weakness exists, and testing and evaluating the design andoperating effectiveness of internal control based on the assessed risk. Our audits also included performing suchother procedures as we considered necessary in the circumstances. We believe that our audits provide areasonable basis for our opinions.
A company's internal control over financial reporting is a process designed to provide reasonableassurance regarding the reliability of financial reporting and the preparation of financial statements for externalpurposes in accordance with generally accepted accounting principles. A company's internal control over financialreporting includes those policies and procedures that (i) pertain to the maintenance of records that, in reasonabledetail, accurately and fairly reflect the transactions and dispositions of the assets of the company; (ii) providereasonable assurance that transactions are recorded as necessary to permit preparation of financial statements inaccordance with generally accepted accounting principles, and that receipts and expenditures of the company arebeing made only in accordance with authorizations of management and directors of the company; and (iii) providereasonable assurance regarding prevention or timely detection of unauthorized acquisition, use, or disposition ofthe company's assets that could have a material effect on the financial statements.
Because of its inherent limitations, internal control over financial reporting may not prevent or detectmisstatements. Also, projections of any evaluation of effectiveness to future periods are subject to the risk thatcontrols may become inadequate because of changes in conditions, or that the degree of compliance with thepolicies or procedures may deteriorate.
/s/ PricewaterhouseCoopers LLP
Seattle, Washington
February 26, 2015
63
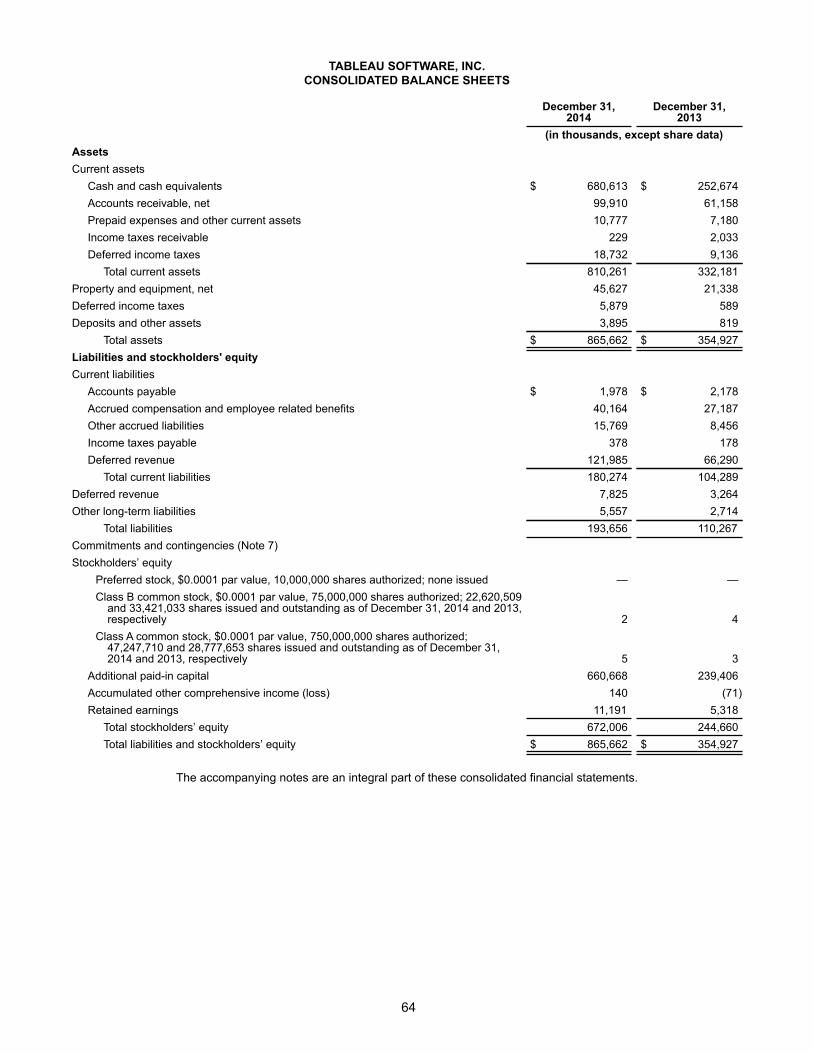
TABLEAU SOFTWARE, INC.CONSOLIDATED BALANCE SHEETS
December 31,2014
December 31,2013
(in thousands, except share data)AssetsCurrent assetsCash and cash equivalents $ 680,613 $ 252,674Accounts receivable, net 99,910 61,158Prepaid expenses and other current assets 10,777 7,180Income taxes receivable 229 2,033Deferred income taxes 18,732 9,136Total current assets 810,261 332,181
Property and equipment, net 45,627 21,338Deferred income taxes 5,879 589Deposits and other assets 3,895 819
Total assets $ 865,662 $ 354,927Liabilities and stockholders' equityCurrent liabilitiesAccounts payable $ 1,978 $ 2,178Accrued compensation and employee related benefits 40,164 27,187Other accrued liabilities 15,769 8,456Income taxes payable 378 178Deferred revenue 121,985 66,290Total current liabilities 180,274 104,289
Deferred revenue 7,825 3,264Other long-term liabilities 5,557 2,714
Total liabilities 193,656 110,267Commitments and contingencies (Note 7)Stockholders’ equity
Preferred stock, $0.0001 par value, 10,000,000 shares authorized; none issued — —Class B common stock, $0.0001 par value, 75,000,000 shares authorized; 22,620,509and 33,421,033 shares issued and outstanding as of December 31, 2014 and 2013,respectively 2 4
Class A common stock, $0.0001 par value, 750,000,000 shares authorized;47,247,710 and 28,777,653 shares issued and outstanding as of December 31,2014 and 2013, respectively 5 3
Additional paid-in capital 660,668 239,406Accumulated other comprehensive income (loss) 140 (71)Retained earnings 11,191 5,318Total stockholders’ equity 672,006 244,660Total liabilities and stockholders’ equity $ 865,662 $ 354,927
The accompanying notes are an integral part of these consolidated financial statements.
64
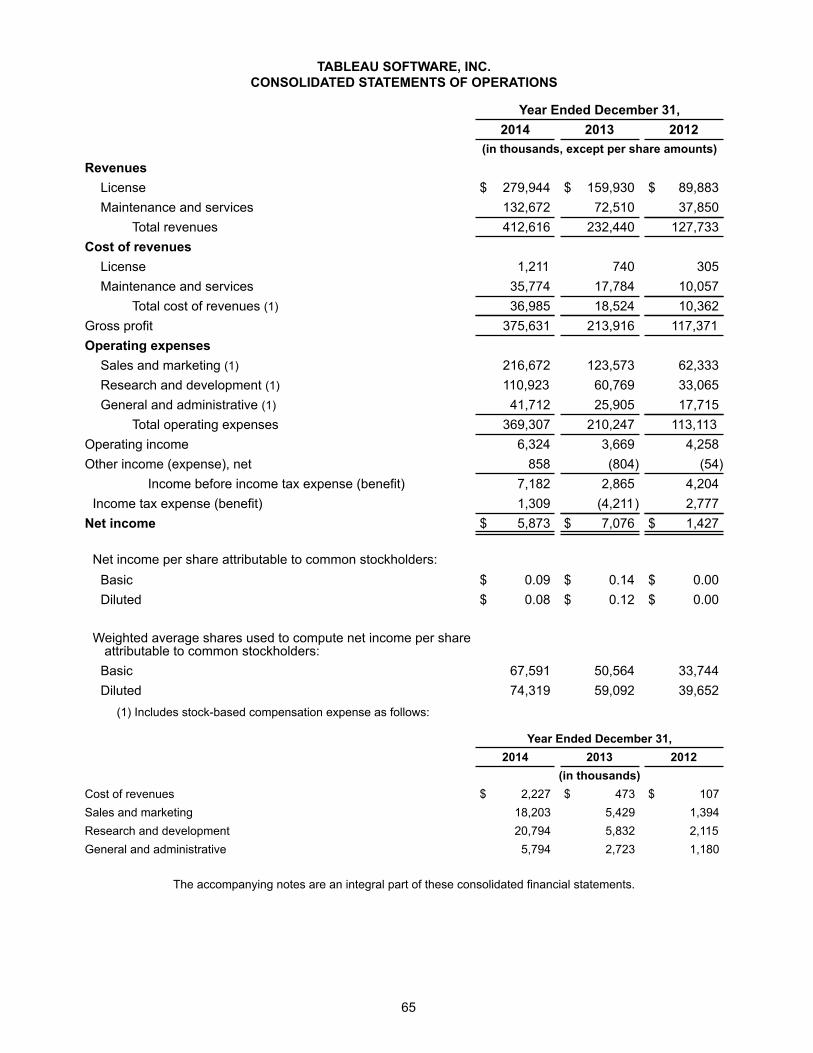
TABLEAU SOFTWARE, INC.CONSOLIDATED STATEMENTS OF OPERATIONS
Year Ended December 31,2014 2013 2012
(in thousands, except per share amounts)
RevenuesLicense $ 279,944 $ 159,930 $ 89,883Maintenance and services 132,672 72,510 37,850
Total revenues 412,616 232,440 127,733Cost of revenuesLicense 1,211 740 305Maintenance and services 35,774 17,784 10,057
Total cost of revenues (1) 36,985 18,524 10,362Gross profit 375,631 213,916 117,371Operating expensesSales and marketing (1) 216,672 123,573 62,333Research and development (1) 110,923 60,769 33,065General and administrative (1) 41,712 25,905 17,715
Total operating expenses 369,307 210,247 113,113Operating income 6,324 3,669 4,258Other income (expense), net 858 (804) (54)
Income before income tax expense (benefit) 7,182 2,865 4,204Income tax expense (benefit) 1,309 (4,211) 2,777Net income $ 5,873 $ 7,076 $ 1,427
Net income per share attributable to common stockholders:Basic $ 0.09 $ 0.14 $ 0.00Diluted $ 0.08 $ 0.12 $ 0.00
Weighted average shares used to compute net income per shareattributable to common stockholders:Basic 67,591 50,564 33,744Diluted 74,319 59,092 39,652(1) Includes stock-based compensation expense as follows:
Year Ended December 31,2014 2013 2012
(in thousands)Cost of revenues $ 2,227 $ 473 $ 107Sales and marketing 18,203 5,429 1,394Research and development 20,794 5,832 2,115General and administrative 5,794 2,723 1,180
The accompanying notes are an integral part of these consolidated financial statements.
65
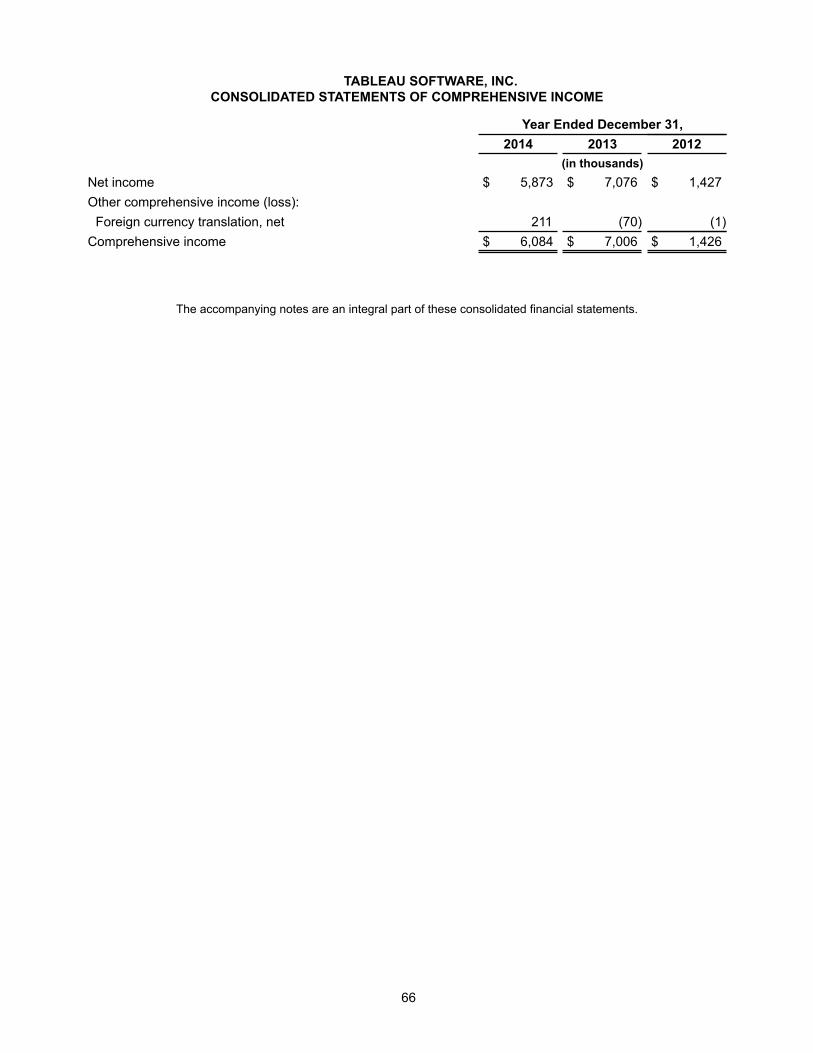
TABLEAU SOFTWARE, INC.CONSOLIDATED STATEMENTS OF COMPREHENSIVE INCOME
Year Ended December 31,2014 2013 2012
(in thousands)Net income $ 5,873 $ 7,076 $ 1,427
Other comprehensive income (loss):
Foreign currency translation, net 211 (70) (1)
Comprehensive income $ 6,084 $ 7,006 $ 1,426
The accompanying notes are an integral part of these consolidated financial statements.
66
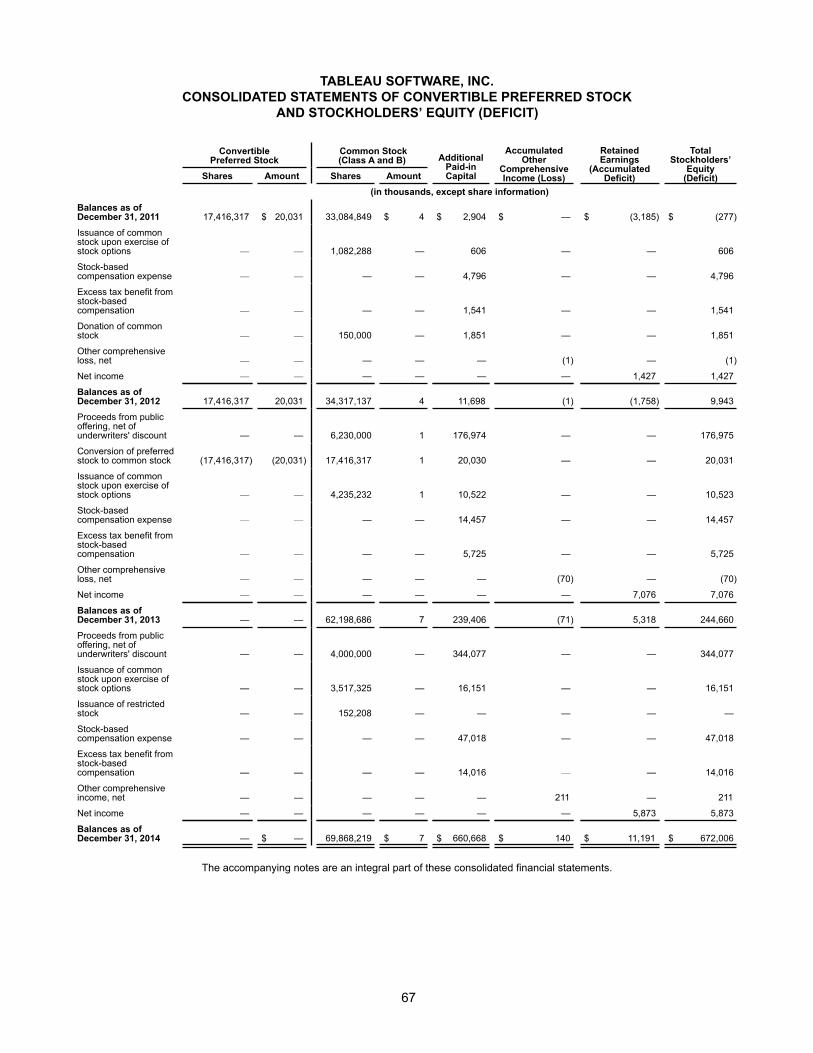
TABLEAU SOFTWARE, INC.CONSOLIDATED STATEMENTS OF CONVERTIBLE PREFERRED STOCK
AND STOCKHOLDERS’ EQUITY (DEFICIT)
ConvertiblePreferred Stock
Common Stock(Class A and B) Additional
Paid-inCapital
AccumulatedOther
ComprehensiveIncome (Loss)
RetainedEarnings
(AccumulatedDeficit)
TotalStockholders’
Equity(Deficit)Shares Amount Shares Amount
(in thousands, except share information)
Balances as ofDecember 31, 2011 17,416,317 $ 20,031 33,084,849 $ 4 $ 2,904 $ — $ (3,185) $ (277)
Issuance of commonstock upon exercise ofstock options — — 1,082,288 — 606 — — 606
Stock-basedcompensation expense — — — — 4,796 — — 4,796
Excess tax benefit fromstock-basedcompensation — — — — 1,541 — — 1,541
Donation of commonstock — — 150,000 — 1,851 — — 1,851
Other comprehensiveloss, net — — — — — (1) — (1)
Net income — — — — — — 1,427 1,427
Balances as ofDecember 31, 2012 17,416,317 20,031 34,317,137 4 11,698 (1) (1,758) 9,943
Proceeds from publicoffering, net ofunderwriters' discount — — 6,230,000 1 176,974 — — 176,975
Conversion of preferredstock to common stock (17,416,317) (20,031) 17,416,317 1 20,030 — — 20,031
Issuance of commonstock upon exercise ofstock options — — 4,235,232 1 10,522 — — 10,523
Stock-basedcompensation expense — — — — 14,457 — — 14,457
Excess tax benefit fromstock-basedcompensation — — — — 5,725 — — 5,725
Other comprehensiveloss, net — — — — — (70) — (70)
Net income — — — — — — 7,076 7,076
Balances as ofDecember 31, 2013 — — 62,198,686 7 239,406 (71) 5,318 244,660
Proceeds from publicoffering, net ofunderwriters' discount — — 4,000,000 — 344,077 — — 344,077
Issuance of commonstock upon exercise ofstock options — — 3,517,325 — 16,151 — — 16,151
Issuance of restrictedstock — — 152,208 — — — — —
Stock-basedcompensation expense — — — — 47,018 — — 47,018
Excess tax benefit fromstock-basedcompensation — — — — 14,016 — — 14,016
Other comprehensiveincome, net — — — — — 211 — 211
Net income — — — — — — 5,873 5,873
Balances as ofDecember 31, 2014 — $ — 69,868,219 $ 7 $ 660,668 $ 140 $ 11,191 $ 672,006
The accompanying notes are an integral part of these consolidated financial statements.
67
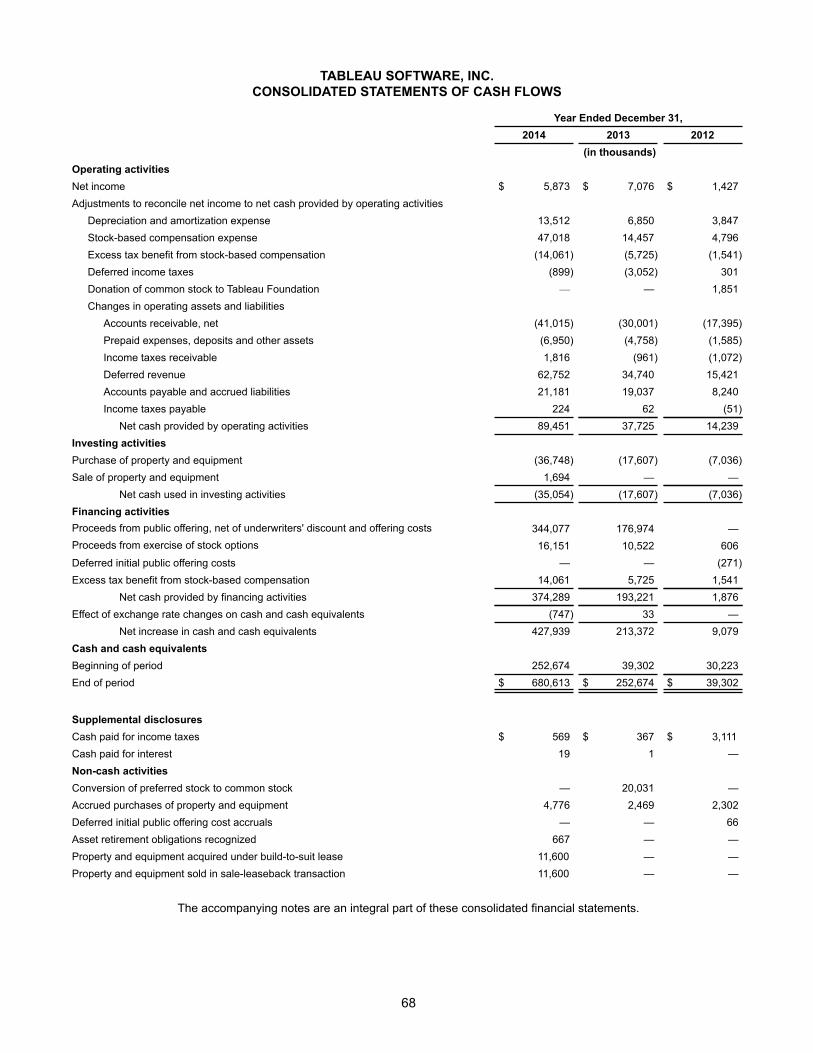
TABLEAU SOFTWARE, INC.CONSOLIDATED STATEMENTS OF CASH FLOWS
Year Ended December 31,
2014 2013 2012
(in thousands)
Operating activities
Net income $ 5,873 $ 7,076 $ 1,427
Adjustments to reconcile net income to net cash provided by operating activities
Depreciation and amortization expense 13,512 6,850 3,847
Stock-based compensation expense 47,018 14,457 4,796
Excess tax benefit from stock-based compensation (14,061) (5,725) (1,541)
Deferred income taxes (899) (3,052) 301
Donation of common stock to Tableau Foundation — — 1,851
Changes in operating assets and liabilities
Accounts receivable, net (41,015) (30,001) (17,395)
Prepaid expenses, deposits and other assets (6,950) (4,758) (1,585)
Income taxes receivable 1,816 (961) (1,072)
Deferred revenue 62,752 34,740 15,421
Accounts payable and accrued liabilities 21,181 19,037 8,240
Income taxes payable 224 62 (51)
Net cash provided by operating activities 89,451 37,725 14,239
Investing activities
Purchase of property and equipment (36,748) (17,607) (7,036)
Sale of property and equipment 1,694 — —
Net cash used in investing activities (35,054) (17,607) (7,036)
Financing activities
Proceeds from public offering, net of underwriters' discount and offering costs 344,077 176,974 —
Proceeds from exercise of stock options 16,151 10,522 606
Deferred initial public offering costs — — (271)
Excess tax benefit from stock-based compensation 14,061 5,725 1,541
Net cash provided by financing activities 374,289 193,221 1,876
Effect of exchange rate changes on cash and cash equivalents (747) 33 —
Net increase in cash and cash equivalents 427,939 213,372 9,079
Cash and cash equivalents
Beginning of period 252,674 39,302 30,223
End of period $ 680,613 $ 252,674 $ 39,302
Supplemental disclosures
Cash paid for income taxes $ 569 $ 367 $ 3,111
Cash paid for interest 19 1 —
Non-cash activities
Conversion of preferred stock to common stock — 20,031 —
Accrued purchases of property and equipment 4,776 2,469 2,302
Deferred initial public offering cost accruals — — 66
Asset retirement obligations recognized 667 — —
Property and equipment acquired under build-to-suit lease 11,600 — —
Property and equipment sold in sale-leaseback transaction 11,600 — —
The accompanying notes are an integral part of these consolidated financial statements.
68
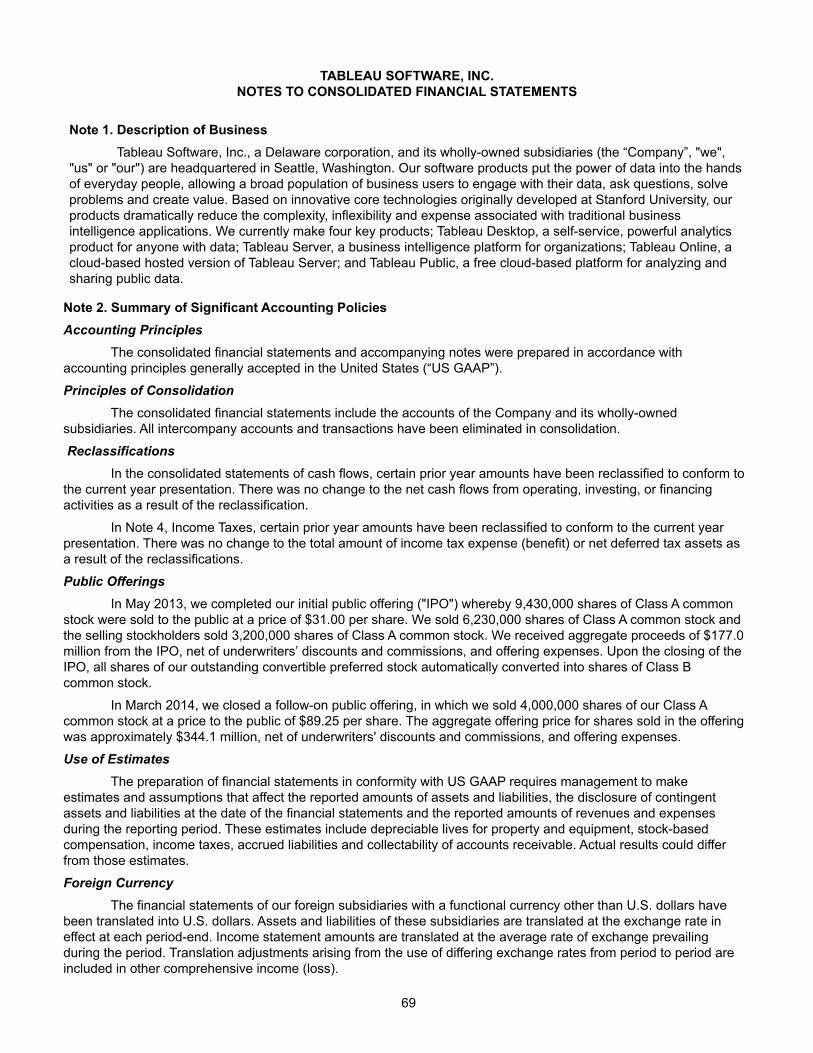
TABLEAU SOFTWARE, INC.NOTES TO CONSOLIDATED FINANCIAL STATEMENTS
69
Note 1. Description of BusinessTableau Software, Inc., a Delaware corporation, and its wholly-owned subsidiaries (the “Company”, "we",
"us" or "our") are headquartered in Seattle, Washington. Our software products put the power of data into the handsof everyday people, allowing a broad population of business users to engage with their data, ask questions, solveproblems and create value. Based on innovative core technologies originally developed at Stanford University, ourproducts dramatically reduce the complexity, inflexibility and expense associated with traditional businessintelligence applications. We currently make four key products; Tableau Desktop, a self-service, powerful analyticsproduct for anyone with data; Tableau Server, a business intelligence platform for organizations; Tableau Online, acloud-based hosted version of Tableau Server; and Tableau Public, a free cloud-based platform for analyzing andsharing public data.
Note 2. Summary of Significant Accounting PoliciesAccounting Principles
The consolidated financial statements and accompanying notes were prepared in accordance withaccounting principles generally accepted in the United States (“US GAAP”).
Principles of ConsolidationThe consolidated financial statements include the accounts of the Company and its wholly-owned
subsidiaries. All intercompany accounts and transactions have been eliminated in consolidation.
ReclassificationsIn the consolidated statements of cash flows, certain prior year amounts have been reclassified to conform to
the current year presentation. There was no change to the net cash flows from operating, investing, or financingactivities as a result of the reclassification.
In Note 4, Income Taxes, certain prior year amounts have been reclassified to conform to the current yearpresentation. There was no change to the total amount of income tax expense (benefit) or net deferred tax assets asa result of the reclassifications.
Public Offerings In May 2013, we completed our initial public offering ("IPO") whereby 9,430,000 shares of Class A common
stock were sold to the public at a price of $31.00 per share. We sold 6,230,000 shares of Class A common stock andthe selling stockholders sold 3,200,000 shares of Class A common stock. We received aggregate proceeds of $177.0million from the IPO, net of underwriters’ discounts and commissions, and offering expenses. Upon the closing of theIPO, all shares of our outstanding convertible preferred stock automatically converted into shares of Class Bcommon stock.
In March 2014, we closed a follow-on public offering, in which we sold 4,000,000 shares of our Class Acommon stock at a price to the public of $89.25 per share. The aggregate offering price for shares sold in the offeringwas approximately $344.1 million, net of underwriters' discounts and commissions, and offering expenses.
Use of EstimatesThe preparation of financial statements in conformity with US GAAP requires management to make
estimates and assumptions that affect the reported amounts of assets and liabilities, the disclosure of contingentassets and liabilities at the date of the financial statements and the reported amounts of revenues and expensesduring the reporting period. These estimates include depreciable lives for property and equipment, stock-basedcompensation, income taxes, accrued liabilities and collectability of accounts receivable. Actual results could differfrom those estimates.
Foreign Currency The financial statements of our foreign subsidiaries with a functional currency other than U.S. dollars have
been translated into U.S. dollars. Assets and liabilities of these subsidiaries are translated at the exchange rate ineffect at each period-end. Income statement amounts are translated at the average rate of exchange prevailingduring the period. Translation adjustments arising from the use of differing exchange rates from period to period areincluded in other comprehensive income (loss).
Gains and losses on foreign currency transactions are included in income. Foreign currency transaction gain(loss) was $0.6 million and $(0.9) million for the years ended December 31, 2014 and 2013, respectively, and wasnot significant during the year ended December 31, 2012.
Risks and UncertaintiesInherent in our business are various risks and uncertainties, including our limited operating history and
development of advanced technologies in a rapidly changing industry. These risks include our ability to manage ourrapid growth and our ability to attract new customers and expand sales to existing customers, as well as other risksand uncertainties. In the event that we do not successfully implement our business plan, certain assets may not berecoverable, certain liabilities may not be paid and investments in our capital stock may not be recoverable. Oursuccess depends upon the acceptance of our technology, development of sales and distribution channels, and ourability to generate significant revenues from the use of our technology.
SegmentsWe follow the authoritative literature that established annual and interim reporting standards for enterprise’s
operating segments and related disclosures about its products and services, geographic regions and majorcustomers.
We operate our business as one operating segment. Our chief operating decision makers (“CODM”) are ourChief Executive Officer and Chief Financial Officer, who review financial information presented on a consolidatedbasis for purposes of making operating decisions, assessing financial performance and allocating resources.
Revenue RecognitionWe generate revenues primarily in the form of software license fees and related maintenance and services
fees. License fees include perpetual, term and subscription license fees. Maintenance and services fees primarilyconsist of fees for maintenance services (including support and unspecified upgrades and enhancements when andif they are available), training, and professional services that are not essential to functionality of the software.
We recognize revenues when all of the following conditions are met:
• there is persuasive evidence of an arrangement;• the software or services have been delivered to the customer;• the amount of fees to be paid by the customer is fixed or determinable; and• the collection of the related fees is probable.
We use click-through license agreements, signed agreements and purchase orders as evidence of anarrangement. We deliver all of our software electronically. Electronic delivery occurs when we provide the customerwith access to the software and license key via a secure portal. We assess whether the fee is fixed or determinableat the outset of the arrangement. Our typical terms of payment are due 30 days from delivery. We assesscollectability based on a number of factors such as collection history and creditworthiness of the customer. If wedetermine that collectability is not probable, revenue is deferred until collectability becomes probable, generally uponreceipt of cash.
Substantially all of our software licenses are sold in multiple-element arrangements that include maintenanceand may include professional services and training.
Vendor specific objective evidence (“VSOE”) of the fair value is not available for software licenses as theyare never sold without maintenance. VSOE of the fair value generally exists for all undelivered elements and anyservices that are not essential to the functionality of the delivered software. We account for delivered softwarelicenses under the residual method.
Maintenance agreements consist of fees for providing software updates on a when and if available basis andtechnical support for software products (“post-contract support” or “PCS”) for an initial term, generally one year. Wehave established VSOE of the fair value for maintenance on perpetual licenses based on stated substantive renewalrates or the price when sold on a standalone basis. Stated renewal rates are considered to be substantive if they areat least 15% of the actual price charged for the software license. VSOE of the fair value for standalone sales isconsidered to have been established when a substantial majority of individual sales transactions within the previous12 months period falls within a reasonably narrow range, which we have defined to be plus or minus 15% of themedian sales price of actual standalone sales transactions.
License arrangements may include professional services and training. In determining whether professionalservices and training revenues should be accounted for separately from license revenues, we evaluate:
70
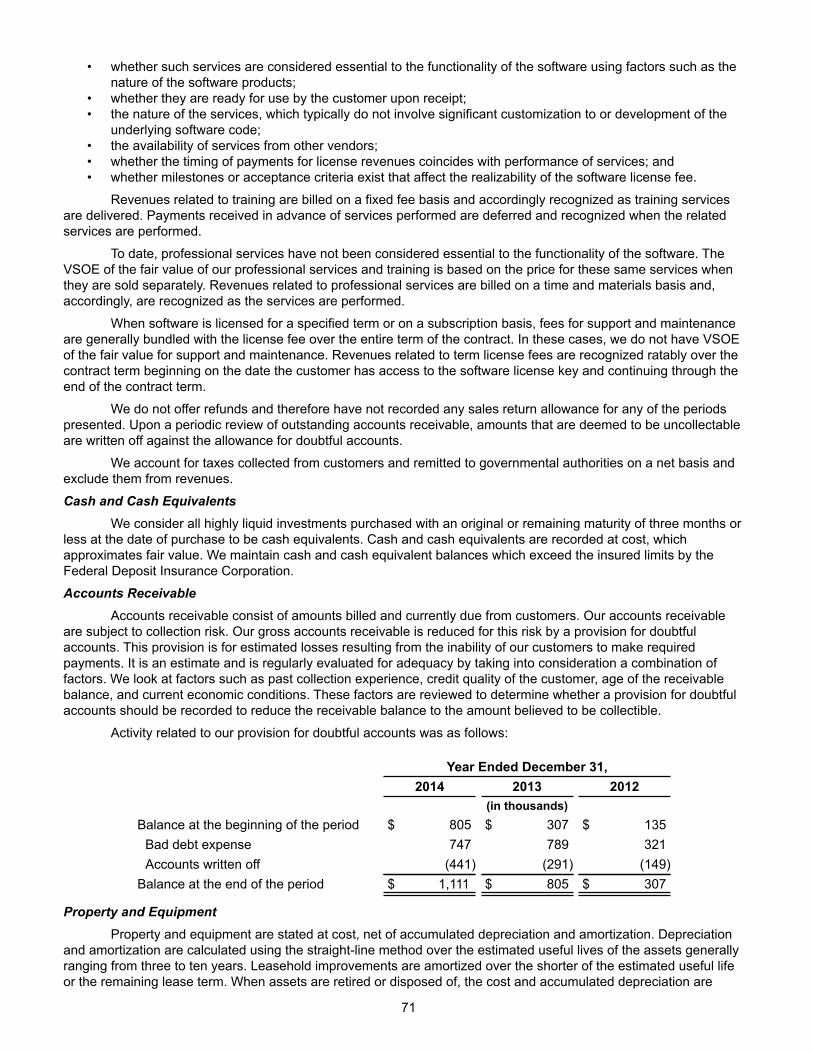
• whether such services are considered essential to the functionality of the software using factors such as thenature of the software products;
• whether they are ready for use by the customer upon receipt; • the nature of the services, which typically do not involve significant customization to or development of the
underlying software code; • the availability of services from other vendors;• whether the timing of payments for license revenues coincides with performance of services; and• whether milestones or acceptance criteria exist that affect the realizability of the software license fee.
Revenues related to training are billed on a fixed fee basis and accordingly recognized as training servicesare delivered. Payments received in advance of services performed are deferred and recognized when the relatedservices are performed.
To date, professional services have not been considered essential to the functionality of the software. TheVSOE of the fair value of our professional services and training is based on the price for these same services whenthey are sold separately. Revenues related to professional services are billed on a time and materials basis and,accordingly, are recognized as the services are performed.
When software is licensed for a specified term or on a subscription basis, fees for support and maintenanceare generally bundled with the license fee over the entire term of the contract. In these cases, we do not have VSOEof the fair value for support and maintenance. Revenues related to term license fees are recognized ratably over thecontract term beginning on the date the customer has access to the software license key and continuing through theend of the contract term.
We do not offer refunds and therefore have not recorded any sales return allowance for any of the periodspresented. Upon a periodic review of outstanding accounts receivable, amounts that are deemed to be uncollectableare written off against the allowance for doubtful accounts.
We account for taxes collected from customers and remitted to governmental authorities on a net basis andexclude them from revenues.
Cash and Cash EquivalentsWe consider all highly liquid investments purchased with an original or remaining maturity of three months or
less at the date of purchase to be cash equivalents. Cash and cash equivalents are recorded at cost, whichapproximates fair value. We maintain cash and cash equivalent balances which exceed the insured limits by theFederal Deposit Insurance Corporation.
Accounts ReceivableAccounts receivable consist of amounts billed and currently due from customers. Our accounts receivable
are subject to collection risk. Our gross accounts receivable is reduced for this risk by a provision for doubtfulaccounts. This provision is for estimated losses resulting from the inability of our customers to make requiredpayments. It is an estimate and is regularly evaluated for adequacy by taking into consideration a combination offactors. We look at factors such as past collection experience, credit quality of the customer, age of the receivablebalance, and current economic conditions. These factors are reviewed to determine whether a provision for doubtfulaccounts should be recorded to reduce the receivable balance to the amount believed to be collectible.
Activity related to our provision for doubtful accounts was as follows:
Year Ended December 31,2014 2013 2012
(in thousands)Balance at the beginning of the period $ 805 $ 307 $ 135Bad debt expense 747 789 321Accounts written off (441) (291) (149)Balance at the end of the period $ 1,111 $ 805 $ 307
Property and EquipmentProperty and equipment are stated at cost, net of accumulated depreciation and amortization. Depreciation
and amortization are calculated using the straight-line method over the estimated useful lives of the assets generallyranging from three to ten years. Leasehold improvements are amortized over the shorter of the estimated useful lifeor the remaining lease term. When assets are retired or disposed of, the cost and accumulated depreciation are
71
removed from the accounts, and any resulting gains or losses are included in results of operations. Maintenance andrepairs that do not improve or extend the lives of the respective assets are charged to expense in the periodincurred.
Leases and Asset Retirement ObligationsLeases are categorized at their inception as either operating or capital leases. Within some lease
agreements, rent holidays and other incentives are included. Rent expense is recognized on a straight-line method,over the term of the agreement generally beginning once control of the space is achieved, without regard to deferredpayment terms, such as rent holidays that defer the commencement date of required rent payments. Additionally,incentives received are treated as a reduction of expense over the term of the agreement.
Leased buildings under build-to-suit lease arrangements are capitalized and included in property andequipment when we are involved in the construction of the structural improvements or take construction risk prior tothe commencement of the lease. Upon completion of the construction under the build-to-suit leases, we assesswhether those arrangements qualify for sales recognition under the sale-leaseback accounting guidance.
Liabilities are established for the present value of estimated future costs to retire leasehold improvements atthe termination or expiration of a lease. A corresponding asset is recorded in the period in which the obligation isincurred. Such assets are amortized over the estimated useful life of the asset, and the recorded liabilities areaccreted to the future value of the estimated retirement costs.
Impairment of Long-Lived AssetsWe evaluate the recoverability of long-lived assets in accordance with authoritative guidance on accounting
for the impairment or disposal of long-lived assets. We evaluate long-lived assets for impairment whenever events orchanges in circumstances indicate that the carrying value of these assets may not be recoverable. Such impairmentis recognized in the event the carrying value of such assets exceeds their fair value. If the carrying value of the netassets assigned exceeds the fair value of the assets, then the second step of the impairment test is performed inorder to determine the implied fair value. No impairment of long-lived assets occurred in the periods presented.
Software Development CostsSoftware development costs associated with the development of new products, enhancements of existing
products and quality assurance activities consists of employee, consulting and other external personnel costs. Thecosts incurred internally from the research and development of computer software products are charged to expenseuntil technological feasibility has been established for the product. Once technological feasibility is established, allsoftware costs are capitalized until the product is available for release to customers. Judgment is required indetermining when technological feasibility of a product is established. To date, we have determined that technologicalfeasibility of software products is reached shortly before the products are released. Costs incurred afterestablishment of technological feasibility have not been material, and therefore, we have expensed all research anddevelopment costs as they were incurred. Research and development expenses primarily consist of personnelrelated costs attributable to our research and development personnel and allocated overhead.
We capitalize certain costs relating to software acquired, developed, or modified solely to meet our internalrequirements and for which there are no substantive plans to market the software. To date, we have not capitalizedany such costs.
Intangible Asset CostsCosts related to filing and pursuing patent and trademark applications are expensed as incurred, as
recoverability of such expenditures is uncertain. These intangible asset-related legal costs are reported as acomponent of general and administrative expenses.
Advertising ExpensesWe have expensed all advertising costs as incurred and classify these costs as sales and marketing
expenses. Advertising expenses for the years ended December 31, 2014, 2013 and 2012 were $7.6 million, $4.9million, and $3.0 million, respectively.
Income TaxesIncome taxes are accounted for under the asset and liability method in accordance with authoritative
guidance for income taxes. Deferred tax assets are recognized for deductible temporary differences, net operatingloss carryfowards, and tax credit carryfowards if it is more likely than not that the tax benefits will be realized. Weconsidered future taxable income, historical operating results, and ongoing prudent and feasible tax planningstrategies in assessing the need for a valuation allowance. If we determine we would not be able to realize all or part
72
of our net deferred assets in the future, we record a valuation allowance on such net deferred tax assets with anoffset to expense in the period such determination was made.
Deferred tax assets and liabilities are measured using enacted tax rates expected to apply to taxable incomein the years in which those temporary differences are expected to be recovered or settled. The effect on deferred taxassets and liabilities of a change in tax rates is recognized in income in the period that includes the enactment date.
Concentrations of Credit RiskFinancial instruments that potentially subject us to concentrations of credit risk consist primarily of cash and
cash equivalents and accounts receivable. We extend credit to customers based upon an evaluation of thecustomer’s financial condition and generally collateral is not required. As of December 31, 2014 and 2013, noindividual customer accounted for 10% or more of total accounts receivable. For the years ended December 31,2014, 2013 and 2012, no individual customer represented 10% or more of our total revenues.
Stock-Based CompensationCompensation expense related to stock-based transactions, including employee and non-employee stock
option and restricted stock unit (“RSU”) awards, is measured and recognized in the financial statements based onfair value. The fair value of each RSU award is based on the number of shares granted and the closing price of ourClass A common stock as reported on the New York Stock Exchange.
The fair value of each stock option award is determined at the date of grant by applying the Black-Scholesoption pricing model. This model utilizes the estimated value of our underlying common stock at the measurementdate, the expected or contractual term of the option, the expected volatility of our common stock, risk-free interestrates and expected dividend yield of our common stock. Prior to our initial public offering in May 2013, because ourstock was not publicly traded we estimated the fair value of our common stock. Our board of directors considerednumerous objective and subjective factors to determine the fair value of our common stock at each meeting at whichawards were approved. The factors included, but were not limited to: (i) contemporaneous third-party valuations ofour common stock; (ii) the prices, rights, preferences and privileges of our preferred stock that was then outstandingrelative to those of our common stock; (iii) the lack of marketability of our common stock; (iv) our actual operatingand financial results; (v) current business conditions and projections; and (vi) the likelihood of achieving a liquidityevent, such as an initial public offering or merger or acquisition, given prevailing market conditions. After thecompletion of our initial public offering, our common stock has been valued by reference to the closing price of ourClass A common stock as reported on the New York Stock Exchange.
Measurement of stock-based compensation is subject to periodic adjustment as the underlying equityinstruments vest. We recognize compensation expense for only the portion of awards expected to vest. Therefore,management applied an estimated forfeiture rate that was derived from historical employee termination behavior. Ifthe actual number of forfeitures differs from the estimates, adjustments to stock-based compensation expense maybe required in future periods.
We compute the timing of excess tax benefits from the exercise of stock options and the vesting andsettlement of RSUs under the "with-and-without" approach. Under this approach, we will not record an excess taxbenefit until such time as a cash tax benefit is recognized. We include the impact of the excess tax benefits in thecalculation of certain tax attributes such as the research and development ("R&D") tax credit and do not prepareseparate computations considering the cascading impacts of the excess tax deduction. We compute the pool ofexcess tax benefits available to offset any future shortfalls in the tax benefits actually realized as a single pool foremployees and non-employees.
Fair Value MeasurementsWe categorize assets and liabilities recorded at fair value on our consolidated balance sheets based upon
the level of judgment associated with inputs used to measure their fair value. The levels of the fair value hierarchyare as follows:
• Level 1—Inputs are unadjusted quoted prices in active markets for identical assets or liabilities.
• Level 2—Inputs are quoted prices for similar assets and liabilities in active markets or quoted prices foridentical or similar instruments in markets that are not active and model-derived valuations in which allsignificant inputs and significant value drivers are observable in active markets.
• Level 3—Inputs are unobservable inputs based on our own assumptions and valuation techniques used tomeasure assets and liabilities at fair value. The inputs require significant management judgment orestimation.
73

Our assessment of the significance of a particular input to the fair value measurement requires judgment andmay affect the valuation of fair value assets and liabilities and their placement within the fair value hierarchy levels.
We establish fair value of our assets and liabilities using the price that would be received to sell an asset orpaid to transfer a liability in an orderly transaction between market participants at the measurement date and using afair value hierarchy based on the inputs used to measure fair value. The carrying amounts reported in theconsolidated financial statements approximate the fair value for cash equivalents, accounts receivable, accountspayable, and accrued and other current liabilities, due to their short-term nature.
Recent Accounting PronouncementsIn May 2014, as part of its ongoing efforts to assist in the convergence of GAAP and International Financial
Reporting Standards ("IFRS"), the FASB issued ASU 2014-09 related to revenue recognition. The new guidance setsforth a new five-step revenue recognition model that replaces the prior revenue recognition guidance in its entiretyand is intended to eliminate numerous industry-specific pieces of revenue recognition guidance that have historicallyexisted in GAAP. The underlying principle of the new standard is that a business or other organization will recognizerevenue to depict the transfer of promised goods or services to customers in an amount that reflects theconsideration to which the entity expects to be entitled in exchange for those goods or services. ASU 2014-09provides retrospective or modified prospective methods of initial adoption and is effective for annual periodsbeginning after December 15, 2016 and interim periods within those annual periods. Early adoption is not permitted.We are currently evaluating the method of adoption and the impact that this standard will have on our consolidatedfinancial statements.
In August 2014, the FASB issued ASU 2014-15 related to status as a going concern. The new guidanceexplicitly requires that management assess an entity's ability to continue as a going concern and may requireadditional detailed disclosures. ASU 2014-15 is effective for annual periods beginning after December 15, 2016 andinterim periods within those annual periods. Though permitted, we do not plan to early adopt. We do not believe thatthis standard will have significant impact on our consolidated financial statements.
74
Note 3. Balance Sheet DetailProperty and equipment, net consisted of the following:
Useful Life December 31,(in months) 2014 2013
(in thousands)Computer equipment and software 36 $ 43,340 $ 24,840Furniture and fixtures 36 8,493 2,820Leasehold improvements 10-120 15,444 7,792Construction in progress 5,397 80
72,674 35,532Less: Accumulated depreciation and
amortization (27,047) (14,194)$ 45,627 $ 21,338
Depreciation and amortization expense was $13.5 million, $6.9 million and $3.8 million for the years endedDecember 31, 2014, 2013 and 2012, respectively.
Accrued compensation and employee related benefits consisted of the following:
December 31,2014 2013(in thousands)
Accrued commissions $ 17,913 $ 11,215Accrued bonuses 10,931 6,644Accrued vacation 7,368 4,773Other 3,952 4,555Total $ 40,164 $ 27,187
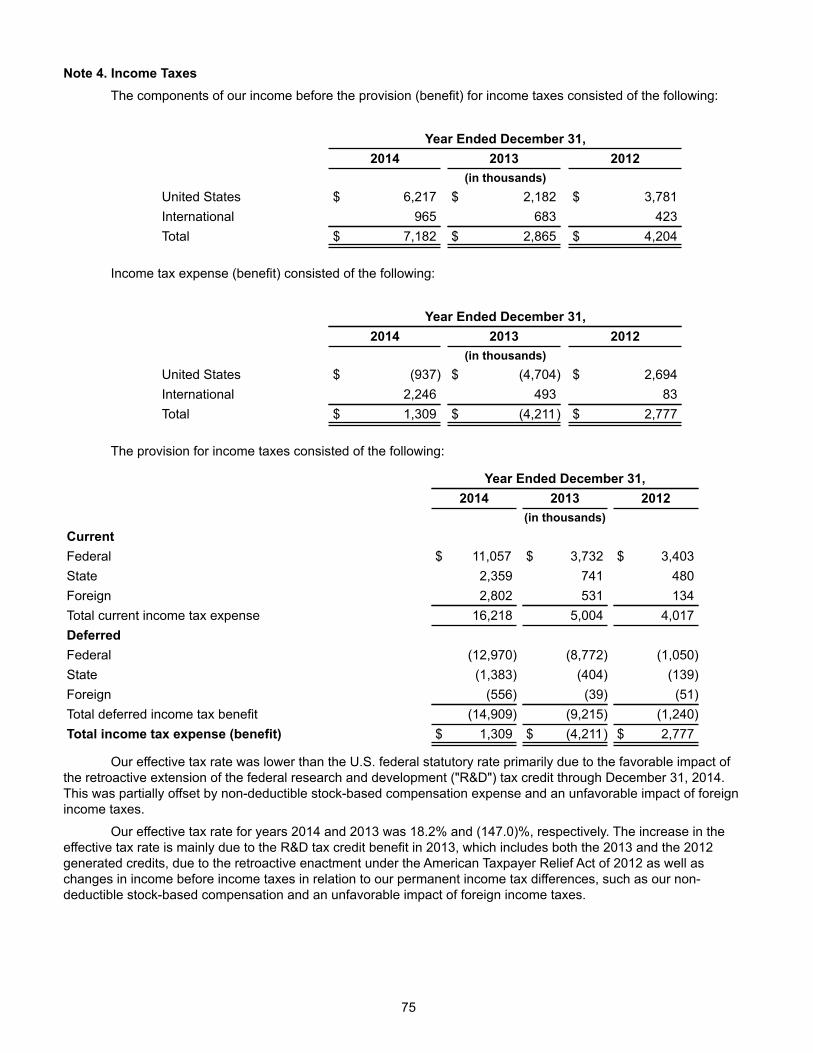
Note 4. Income TaxesThe components of our income before the provision (benefit) for income taxes consisted of the following:
Year Ended December 31,2014 2013 2012
(in thousands)United States $ 6,217 $ 2,182 $ 3,781International 965 683 423Total $ 7,182 $ 2,865 $ 4,204
Income tax expense (benefit) consisted of the following:
Year Ended December 31,2014 2013 2012
(in thousands)United States $ (937) $ (4,704) $ 2,694International 2,246 493 83Total $ 1,309 $ (4,211) $ 2,777
The provision for income taxes consisted of the following:
Year Ended December 31,2014 2013 2012
(in thousands)CurrentFederal $ 11,057 $ 3,732 $ 3,403State 2,359 741 480Foreign 2,802 531 134Total current income tax expense 16,218 5,004 4,017DeferredFederal (12,970) (8,772) (1,050)State (1,383) (404) (139)Foreign (556) (39) (51)Total deferred income tax benefit (14,909) (9,215) (1,240)Total income tax expense (benefit) $ 1,309 $ (4,211) $ 2,777
Our effective tax rate was lower than the U.S. federal statutory rate primarily due to the favorable impact ofthe retroactive extension of the federal research and development ("R&D") tax credit through December 31, 2014.This was partially offset by non-deductible stock-based compensation expense and an unfavorable impact of foreignincome taxes.
Our effective tax rate for years 2014 and 2013 was 18.2% and (147.0)%, respectively. The increase in theeffective tax rate is mainly due to the R&D tax credit benefit in 2013, which includes both the 2013 and the 2012generated credits, due to the retroactive enactment under the American Taxpayer Relief Act of 2012 as well aschanges in income before income taxes in relation to our permanent income tax differences, such as our non-deductible stock-based compensation and an unfavorable impact of foreign income taxes.
75
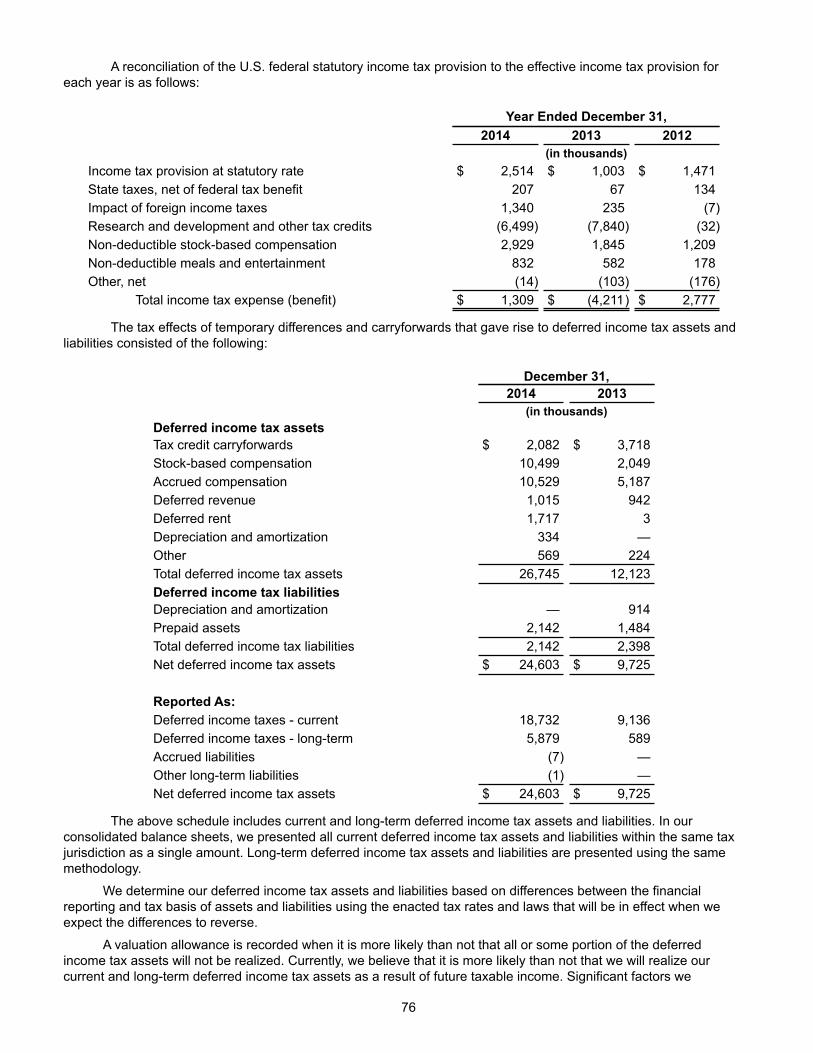
A reconciliation of the U.S. federal statutory income tax provision to the effective income tax provision foreach year is as follows:
Year Ended December 31,2014 2013 2012
(in thousands)Income tax provision at statutory rate $ 2,514 $ 1,003 $ 1,471State taxes, net of federal tax benefit 207 67 134Impact of foreign income taxes 1,340 235 (7)Research and development and other tax credits (6,499) (7,840) (32)Non-deductible stock-based compensation 2,929 1,845 1,209Non-deductible meals and entertainment 832 582 178Other, net (14) (103) (176)
Total income tax expense (benefit) $ 1,309 $ (4,211) $ 2,777
The tax effects of temporary differences and carryforwards that gave rise to deferred income tax assets andliabilities consisted of the following:
December 31,2014 2013
(in thousands)Deferred income tax assetsTax credit carryforwards $ 2,082 $ 3,718Stock-based compensation 10,499 2,049Accrued compensation 10,529 5,187Deferred revenue 1,015 942Deferred rent 1,717 3Depreciation and amortization 334 —Other 569 224Total deferred income tax assets 26,745 12,123Deferred income tax liabilitiesDepreciation and amortization — 914Prepaid assets 2,142 1,484Total deferred income tax liabilities 2,142 2,398Net deferred income tax assets $ 24,603 $ 9,725
Reported As:Deferred income taxes - current 18,732 9,136Deferred income taxes - long-term 5,879 589Accrued liabilities (7) —Other long-term liabilities (1) —Net deferred income tax assets $ 24,603 $ 9,725
The above schedule includes current and long-term deferred income tax assets and liabilities. In ourconsolidated balance sheets, we presented all current deferred income tax assets and liabilities within the same taxjurisdiction as a single amount. Long-term deferred income tax assets and liabilities are presented using the samemethodology.
We determine our deferred income tax assets and liabilities based on differences between the financialreporting and tax basis of assets and liabilities using the enacted tax rates and laws that will be in effect when weexpect the differences to reverse.
A valuation allowance is recorded when it is more likely than not that all or some portion of the deferredincome tax assets will not be realized. Currently, we believe that it is more likely than not that we will realize ourcurrent and long-term deferred income tax assets as a result of future taxable income. Significant factors we
76
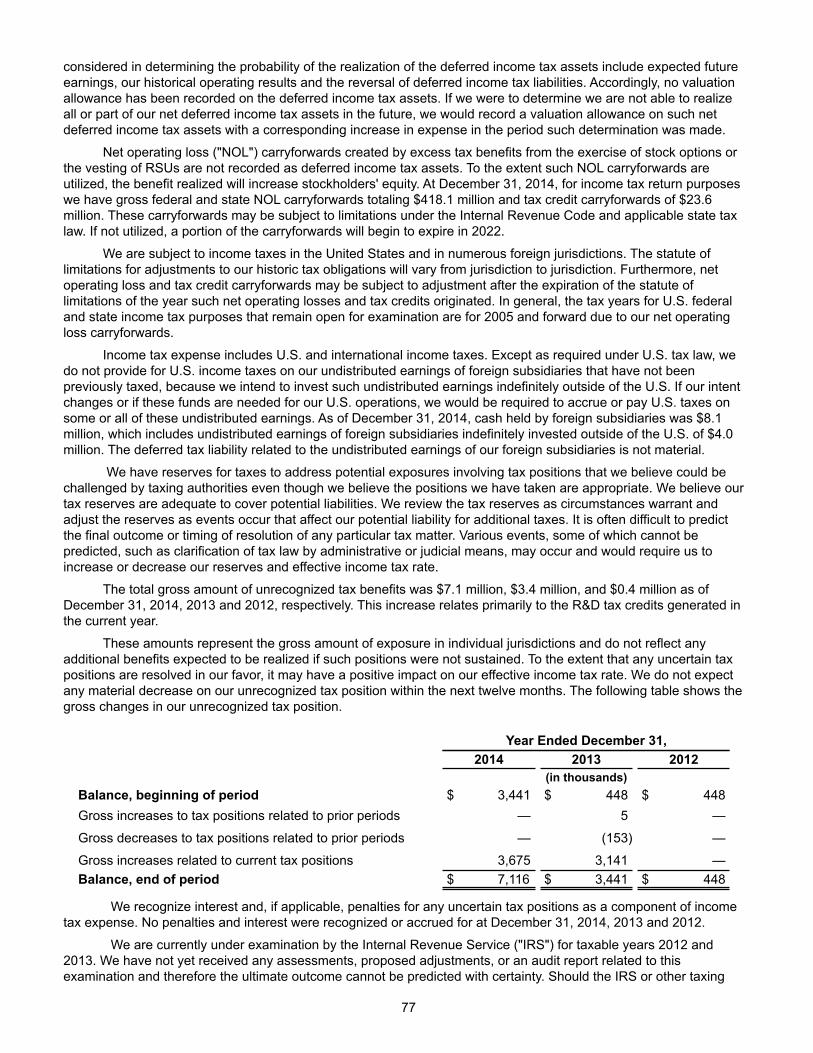
considered in determining the probability of the realization of the deferred income tax assets include expected futureearnings, our historical operating results and the reversal of deferred income tax liabilities. Accordingly, no valuationallowance has been recorded on the deferred income tax assets. If we were to determine we are not able to realizeall or part of our net deferred income tax assets in the future, we would record a valuation allowance on such netdeferred income tax assets with a corresponding increase in expense in the period such determination was made.
Net operating loss ("NOL") carryforwards created by excess tax benefits from the exercise of stock options orthe vesting of RSUs are not recorded as deferred income tax assets. To the extent such NOL carryforwards areutilized, the benefit realized will increase stockholders' equity. At December 31, 2014, for income tax return purposeswe have gross federal and state NOL carryforwards totaling $418.1 million and tax credit carryforwards of $23.6million. These carryforwards may be subject to limitations under the Internal Revenue Code and applicable state taxlaw. If not utilized, a portion of the carryforwards will begin to expire in 2022.
We are subject to income taxes in the United States and in numerous foreign jurisdictions. The statute oflimitations for adjustments to our historic tax obligations will vary from jurisdiction to jurisdiction. Furthermore, netoperating loss and tax credit carryforwards may be subject to adjustment after the expiration of the statute oflimitations of the year such net operating losses and tax credits originated. In general, the tax years for U.S. federaland state income tax purposes that remain open for examination are for 2005 and forward due to our net operatingloss carryforwards.
Income tax expense includes U.S. and international income taxes. Except as required under U.S. tax law, wedo not provide for U.S. income taxes on our undistributed earnings of foreign subsidiaries that have not beenpreviously taxed, because we intend to invest such undistributed earnings indefinitely outside of the U.S. If our intentchanges or if these funds are needed for our U.S. operations, we would be required to accrue or pay U.S. taxes onsome or all of these undistributed earnings. As of December 31, 2014, cash held by foreign subsidiaries was $8.1million, which includes undistributed earnings of foreign subsidiaries indefinitely invested outside of the U.S. of $4.0million. The deferred tax liability related to the undistributed earnings of our foreign subsidiaries is not material.
We have reserves for taxes to address potential exposures involving tax positions that we believe could bechallenged by taxing authorities even though we believe the positions we have taken are appropriate. We believe ourtax reserves are adequate to cover potential liabilities. We review the tax reserves as circumstances warrant andadjust the reserves as events occur that affect our potential liability for additional taxes. It is often difficult to predictthe final outcome or timing of resolution of any particular tax matter. Various events, some of which cannot bepredicted, such as clarification of tax law by administrative or judicial means, may occur and would require us toincrease or decrease our reserves and effective income tax rate.
The total gross amount of unrecognized tax benefits was $7.1 million, $3.4 million, and $0.4 million as ofDecember 31, 2014, 2013 and 2012, respectively. This increase relates primarily to the R&D tax credits generated inthe current year.
These amounts represent the gross amount of exposure in individual jurisdictions and do not reflect anyadditional benefits expected to be realized if such positions were not sustained. To the extent that any uncertain taxpositions are resolved in our favor, it may have a positive impact on our effective income tax rate. We do not expectany material decrease on our unrecognized tax position within the next twelve months. The following table shows thegross changes in our unrecognized tax position.
Year Ended December 31,2014 2013 2012
(in thousands)Balance, beginning of period $ 3,441 $ 448 $ 448
Gross increases to tax positions related to prior periods — 5 —
Gross decreases to tax positions related to prior periods — (153) —
Gross increases related to current tax positions 3,675 3,141 —
Balance, end of period $ 7,116 $ 3,441 $ 448
We recognize interest and, if applicable, penalties for any uncertain tax positions as a component of incometax expense. No penalties and interest were recognized or accrued for at December 31, 2014, 2013 and 2012.
We are currently under examination by the Internal Revenue Service ("IRS") for taxable years 2012 and2013. We have not yet received any assessments, proposed adjustments, or an audit report related to thisexamination and therefore the ultimate outcome cannot be predicted with certainty. Should the IRS or other taxing
77
authorities assess additional taxes as a result of examinations, we may be required to record charges to operationsthat could have a material impact. In addition, we are unable to make a reasonable estimate as to if or when cashsettlement with the tax authorities might occur due to the uncertainties related to these tax matters.
78
Note 5. Stockholders' EquityCommon Stock
Our certificate of incorporation, as amended and restated, authorizes us to issue 75,000,000 shares of ClassB common stock, $0.0001 par value per share, and 750,000,000 shares of Class A common stock, $0.0001 parvalue per share. Each holder of Class B common stock is entitled to ten votes per share and each holder of Class Acommon stock is entitled to one vote per share.The rights of the holders of Class A and Class B common stock areidentical, except with respect to voting and conversion. Shares of Class B common stock may be converted intoClass A common stock at any time at the option of the stockholder, and are automatically converted upon sale ortransfer to Class A common stock, subject to certain limited exceptions. At its discretion, the board of directors maydeclare dividends on shares of common stock, subject to the rights of our preferred stockholders, if any. Uponliquidation or dissolution, holders of common stock will receive distributions only after preferred stock preferenceshave been satisfied.
Preferred StockOur certificate of incorporation, as amended and restated, authorizes us to issue 10,000,000 shares of
preferred stock at $0.0001 par value per share. Our board of directors has the authority to provide for the issuanceof all of the shares in one or more series. At its discretion, our board of directors may designate the voting rights andpreferences of the preferred stock. As of December 31, 2014 and 2013, no shares of preferred stock wereoutstanding.
Donation to Tableau FoundationIn December 2012, our board of directors approved the establishment of the Tableau Foundation, a donor-
advised charitable fund, which included the donation of 150,000 shares of Class B common stock. We recorded acharge of $1.9 million for the value of the donated shares to general and administrative expense for the year endedDecember 31, 2012 based on the value of our stock at that date. We had no similar expenses in the years endedDecember 31, 2014 or 2013.
Note 6. Stock-Based CompensationOur 2004 Equity Incentive Plan (the “2004 Plan”) authorizes the granting of options to purchase shares of
Class B common stock, RSUs and other stock-based awards to our employees, consultants, officers and directors.In December 2012, we modified the 2004 Plan to increase the number of shares of Class B common stockauthorized thereunder to 26,473,282. Our 2013 Equity Incentive Plan (the “2013 Plan” and, together with the 2004Plan, the “Plans”), which was a successor to our 2004 Plan, authorizes the granting of options to purchase shares ofour Class A common stock, RSUs and other stock-based awards to our employees, consultants, officers anddirectors. Options granted under the Plans may be incentive or nonstatutory stock options. Incentive stock optionsmay only be granted to employees. The term of each option is stated in the award agreement, but shall be no morethan ten years from the date of grant. The board of directors determines the period over which options and RSUsbecome vested. Currently, the vesting period for our options and RSUs is typically four years.
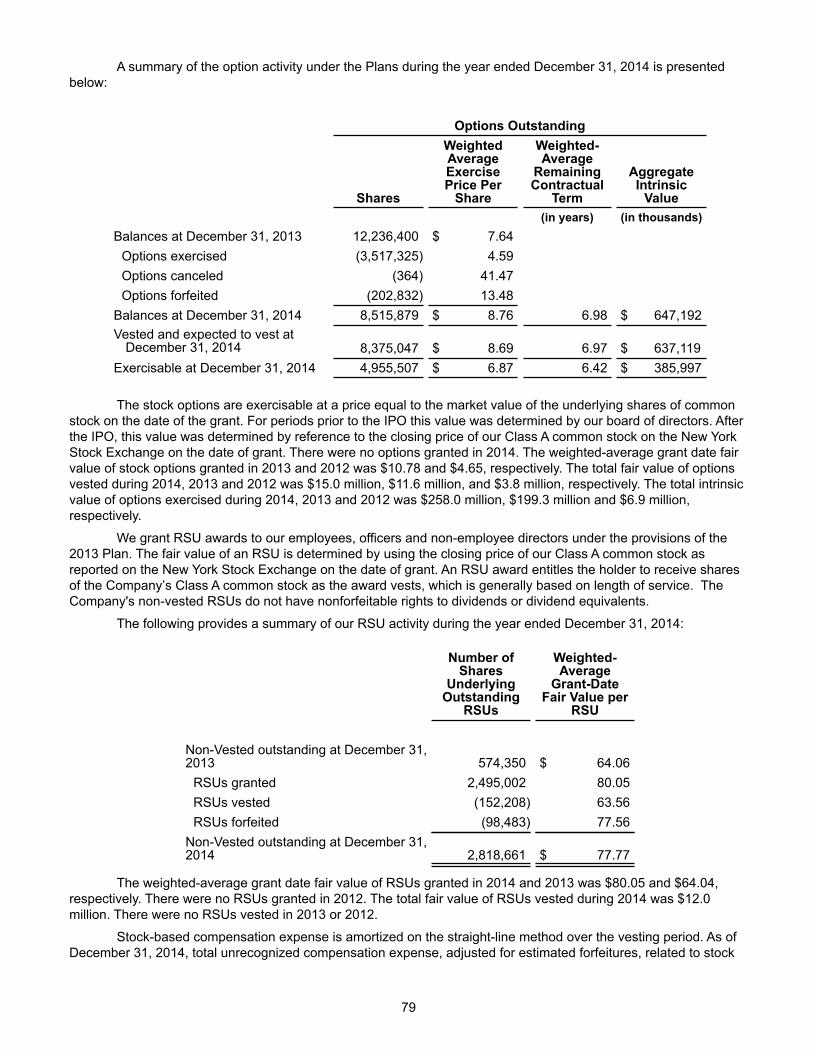
A summary of the option activity under the Plans during the year ended December 31, 2014 is presentedbelow:
Options Outstanding
Shares
WeightedAverageExercisePrice PerShare
Weighted-AverageRemainingContractual
Term
AggregateIntrinsicValue
(in years) (in thousands)Balances at December 31, 2013 12,236,400 $ 7.64Options exercised (3,517,325) 4.59Options canceled (364) 41.47Options forfeited (202,832) 13.48Balances at December 31, 2014 8,515,879 $ 8.76 6.98 $ 647,192Vested and expected to vest atDecember 31, 2014 8,375,047 $ 8.69 6.97 $ 637,119
Exercisable at December 31, 2014 4,955,507 $ 6.87 6.42 $ 385,997
The stock options are exercisable at a price equal to the market value of the underlying shares of commonstock on the date of the grant. For periods prior to the IPO this value was determined by our board of directors. Afterthe IPO, this value was determined by reference to the closing price of our Class A common stock on the New YorkStock Exchange on the date of grant. There were no options granted in 2014. The weighted-average grant date fairvalue of stock options granted in 2013 and 2012 was $10.78 and $4.65, respectively. The total fair value of optionsvested during 2014, 2013 and 2012 was $15.0 million, $11.6 million, and $3.8 million, respectively. The total intrinsicvalue of options exercised during 2014, 2013 and 2012 was $258.0 million, $199.3 million and $6.9 million,respectively.
We grant RSU awards to our employees, officers and non-employee directors under the provisions of the2013 Plan. The fair value of an RSU is determined by using the closing price of our Class A common stock asreported on the New York Stock Exchange on the date of grant. An RSU award entitles the holder to receive sharesof the Company’s Class A common stock as the award vests, which is generally based on length of service. TheCompany's non-vested RSUs do not have nonforfeitable rights to dividends or dividend equivalents.
The following provides a summary of our RSU activity during the year ended December 31, 2014:
Number ofShares
UnderlyingOutstanding
RSUs
Weighted-AverageGrant-DateFair Value per
RSU
Non-Vested outstanding at December 31,2013 574,350 $ 64.06RSUs granted 2,495,002 80.05RSUs vested (152,208) 63.56RSUs forfeited (98,483) 77.56Non-Vested outstanding at December 31,2014 2,818,661 $ 77.77
The weighted-average grant date fair value of RSUs granted in 2014 and 2013 was $80.05 and $64.04,respectively. There were no RSUs granted in 2012. The total fair value of RSUs vested during 2014 was $12.0million. There were no RSUs vested in 2013 or 2012.
Stock-based compensation expense is amortized on the straight-line method over the vesting period. As ofDecember 31, 2014, total unrecognized compensation expense, adjusted for estimated forfeitures, related to stock
79
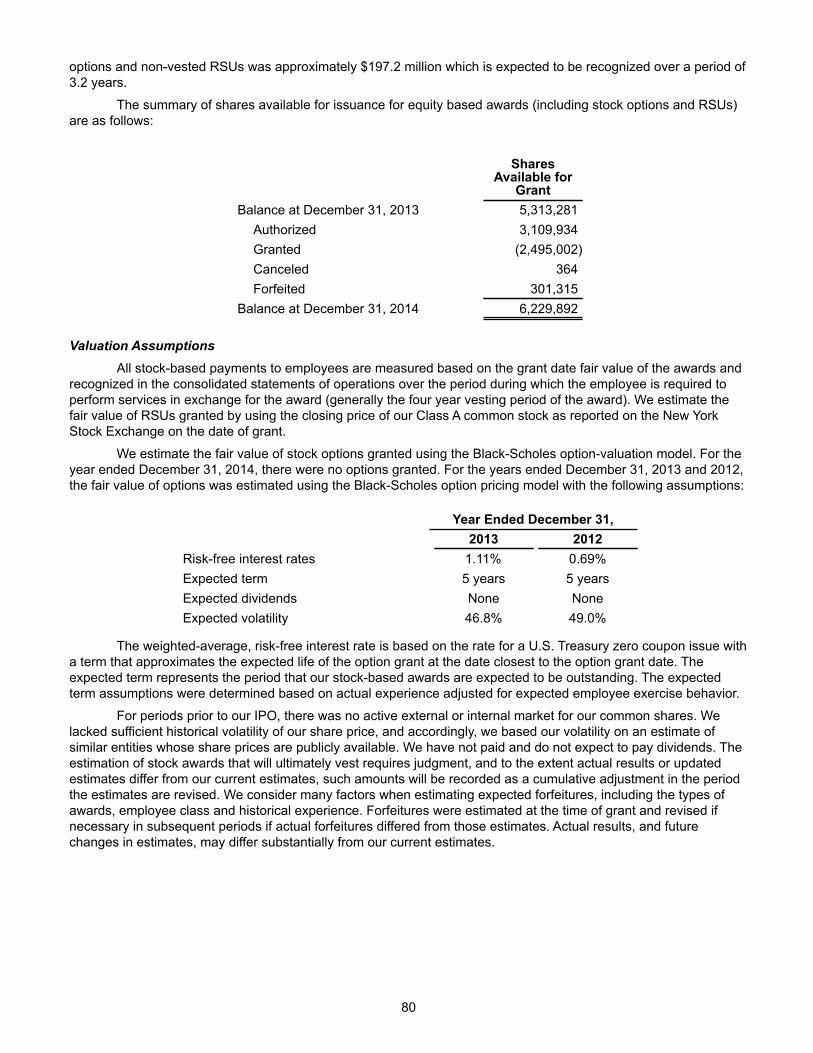
options and non-vested RSUs was approximately $197.2 million which is expected to be recognized over a period of3.2 years.
The summary of shares available for issuance for equity based awards (including stock options and RSUs)are as follows:
SharesAvailable for
GrantBalance at December 31, 2013 5,313,281Authorized 3,109,934Granted (2,495,002)Canceled 364Forfeited 301,315
Balance at December 31, 2014 6,229,892
Valuation AssumptionsAll stock-based payments to employees are measured based on the grant date fair value of the awards and
recognized in the consolidated statements of operations over the period during which the employee is required toperform services in exchange for the award (generally the four year vesting period of the award). We estimate thefair value of RSUs granted by using the closing price of our Class A common stock as reported on the New YorkStock Exchange on the date of grant.
We estimate the fair value of stock options granted using the Black-Scholes option-valuation model. For theyear ended December 31, 2014, there were no options granted. For the years ended December 31, 2013 and 2012,the fair value of options was estimated using the Black-Scholes option pricing model with the following assumptions:
Year Ended December 31,2013 2012
Risk-free interest rates 1.11% 0.69%Expected term 5 years 5 yearsExpected dividends None NoneExpected volatility 46.8% 49.0%
The weighted-average, risk-free interest rate is based on the rate for a U.S. Treasury zero coupon issue witha term that approximates the expected life of the option grant at the date closest to the option grant date. Theexpected term represents the period that our stock-based awards are expected to be outstanding. The expectedterm assumptions were determined based on actual experience adjusted for expected employee exercise behavior.
For periods prior to our IPO, there was no active external or internal market for our common shares. Welacked sufficient historical volatility of our share price, and accordingly, we based our volatility on an estimate ofsimilar entities whose share prices are publicly available. We have not paid and do not expect to pay dividends. Theestimation of stock awards that will ultimately vest requires judgment, and to the extent actual results or updatedestimates differ from our current estimates, such amounts will be recorded as a cumulative adjustment in the periodthe estimates are revised. We consider many factors when estimating expected forfeitures, including the types ofawards, employee class and historical experience. Forfeitures were estimated at the time of grant and revised ifnecessary in subsequent periods if actual forfeitures differed from those estimates. Actual results, and futurechanges in estimates, may differ substantially from our current estimates.
80
Note 7. Commitments and Contingencies
Operating Lease CommitmentsWe conduct our operations in leased facilities under leases expiring at various dates through 2025. We
recognize rent expense on a straight-line basis over the defined lease periods. Total rent expense under operatingleases was approximately $7.2 million, $4.7 million and $2.7 million for the years ended December 31, 2014, 2013and 2012, respectively. Future minimum lease payments under non-cancellable operating leases as of December31, 2014 are as follows (in thousands):
Year Ending December 31,2015 $ 10,3742016 11,7642017 11,4262018 11,0212019 10,185Thereafter 46,256Total minimum lease payments $ 101,026
Our significant lease agreements relate to the global corporate headquarters located in Seattle,Washington, and additional offices located in Kirkland, Washington; Palo Alto, California; Austin, Texas; London,United Kingdom; Singapore; Tokyo, Japan; Sydney, Australia; Dublin, Ireland; and Frankfurt, Germany.
Legal ProceedingsWe are subject to certain routine legal proceedings, as well as demands and claims that arise in the normal
course of our business. We make a provision for a liability relating to legal matters when it is both probable that aliability has been incurred and the amount of the loss can be reasonably estimated. These provisions are reviewedand adjusted to reflect the impacts of negotiations, estimated settlements, legal rulings, advice of legal counsel andother information and events pertaining to a particular matter.
We are not aware of any pending legal proceedings that, individually or in the aggregate, would havematerial adverse effect on our business, operating results, or financial condition. We may in the future be party tolitigation arising in the ordinary course of business, including claims that we allegedly infringe upon third partyintellectual property rights. Such claims, even if not meritorious, could result in the expenditure of significantfinancial and management resources.
81
Note 8. Retirement Plan
We offer a salary deferral 401(k) plan for our U.S. employees. The plan allows employees to contribute apercentage of their pretax earnings annually, subject to limitations imposed by the IRS. The plan also allows us tomake matching contributions, subject to certain limitations. We contributed approximately $1.8 million for the yearended December 31, 2014. For the years ended December 31, 2013 and 2012, we made no contributions to theplan.
Note 9. Segments and Information about Revenues by Geographic Area
The following table presents our revenues by geographic region of end users who purchased products orservices for the periods presented below:
Year Ended December 31,2014 2013 2012
(in thousands)United States and Canada $ 318,835 $ 186,725 $ 106,177International 93,781 45,715 21,556Total revenues $ 412,616 $ 232,440 $ 127,733
Substantially all of our long-lived assets are located in the United States as of December 31, 2014 and2013.
Note 10. Net Income Per Share Immediately prior to the closing of our IPO, all outstanding shares of Series A preferred stock and Series B
preferred stock were converted to shares of Class B common stock. We issued 6,230,000 shares of Class Acommon stock in the IPO. In addition, 3,200,000 shares of Class B common stock (including 2,000,000 shares ofClass B common stock issued upon the conversion of our preferred stock) held by our existing stockholders wereconverted into Class A common stock and sold in the IPO. As a result, as of December 31, 2014 and 2013, Class Aand Class B common stock are the only outstanding classes of capital stock of the Company.
For the year ended December 31, 2012, net income per share attributable to common stockholders ispresented in conformity with the two-class method required for participating securities for periods in which we havenet income. Holders of Series A preferred stock and Series B preferred stock were entitled to receive non-cumulative dividends at the per annum rate of $0.0282 and $0.1374 per share, payable prior and in preference toany dividends on any other shares of our stock. Holders of Series A preferred stock and Series B preferred stock didnot have a contractual obligation to share in our losses. We considered our convertible preferred stock to beparticipating securities and, in accordance with the two-class method, earnings allocated to preferred stock and therelated number of outstanding shares of preferred stock have been excluded from the computation of basic anddiluted net income per common share. The computation of diluted net income per share does not assumeconversion or exercise of potentially dilutive securities that would have an anti-dilutive effect on earnings. We utilizethe if-converted method to compute diluted net income (loss) per common share when the if-converted method ismore dilutive than the two-class method.
Under the two-class method, net income attributable to common stockholders is determined by allocatingundistributed earnings, calculated as net income less current period Series A and Series B convertible preferredstock non-cumulative dividends, between common stock and Series A and Series B convertible preferred stock. Incomputing diluted net income attributable to common stockholders, undistributed earnings are re-allocated to reflectthe potential impact of dilutive securities. Basic net income per share attributable to common stockholders iscomputed by dividing the net income attributable to common stockholders by the weighted-average number ofcommon shares outstanding during the period. Diluted net income per share attributable to common stockholders iscomputed by dividing the net income attributable to common stockholders by the weighted-average number ofcommon shares outstanding, including potential dilutive common shares assuming the dilutive effect of outstandingstock options and RSUs using the treasury stock method.
As all shares of Series A and Series B preferred stock were converted into shares of Class B common stockin connection with our IPO, there have been no shares of preferred stock outstanding since the IPO, and thereforethere was no allocation to preferred shares in the years ended December 31, 2014 and 2013.
82
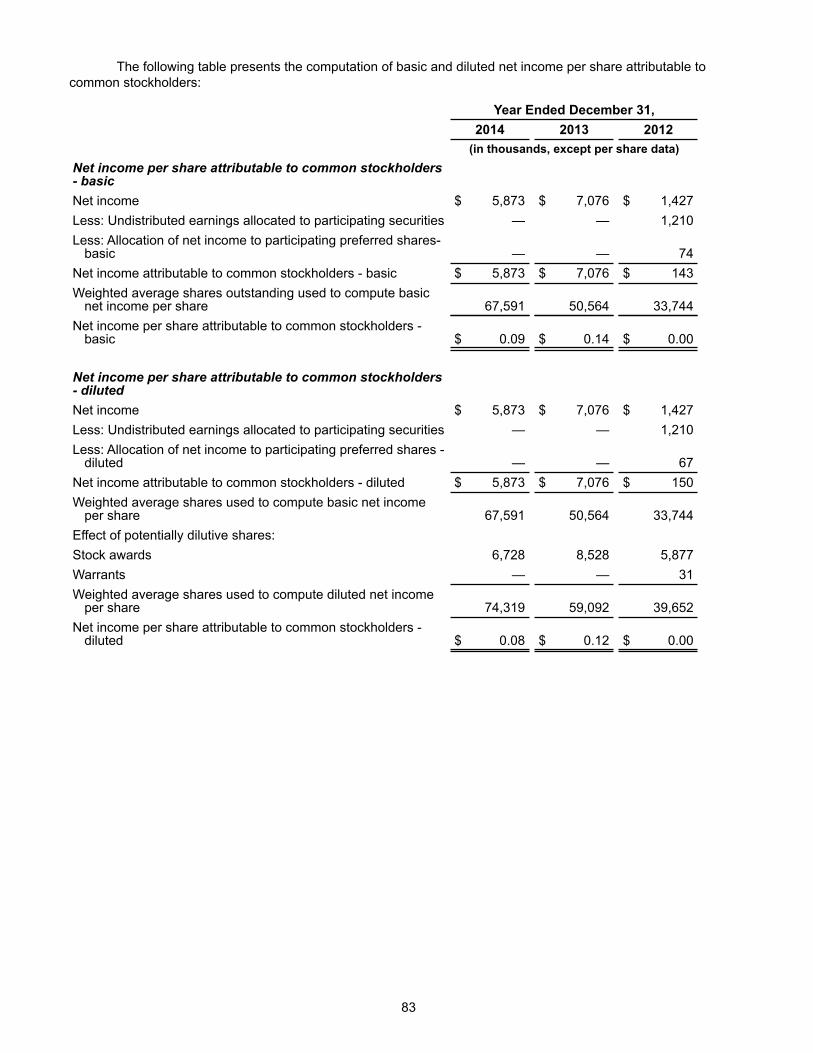
The following table presents the computation of basic and diluted net income per share attributable to
common stockholders:
Year Ended December 31,2014 2013 2012(in thousands, except per share data)
Net income per share attributable to common stockholders- basicNet income $ 5,873 $ 7,076 $ 1,427
Less: Undistributed earnings allocated to participating securities — — 1,210
Less: Allocation of net income to participating preferred shares-basic — — 74
Net income attributable to common stockholders - basic $ 5,873 $ 7,076 $ 143
Weighted average shares outstanding used to compute basicnet income per share 67,591 50,564 33,744
Net income per share attributable to common stockholders -basic $ 0.09 $ 0.14 $ 0.00
Net income per share attributable to common stockholders- dilutedNet income $ 5,873 $ 7,076 $ 1,427
Less: Undistributed earnings allocated to participating securities — — 1,210
Less: Allocation of net income to participating preferred shares -diluted — — 67
Net income attributable to common stockholders - diluted $ 5,873 $ 7,076 $ 150
Weighted average shares used to compute basic net incomeper share 67,591 50,564 33,744
Effect of potentially dilutive shares:
Stock awards 6,728 8,528 5,877
Warrants — — 31
Weighted average shares used to compute diluted net incomeper share 74,319 59,092 39,652
Net income per share attributable to common stockholders -diluted $ 0.08 $ 0.12 $ 0.00
83
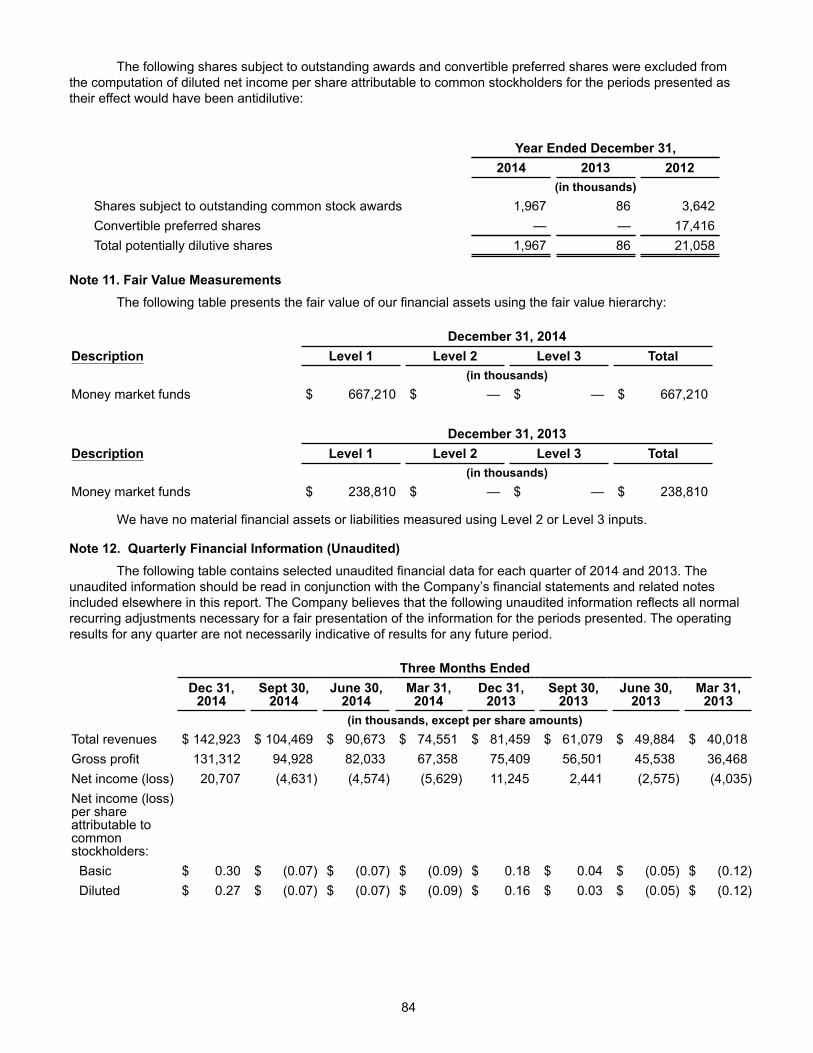
The following shares subject to outstanding awards and convertible preferred shares were excluded fromthe computation of diluted net income per share attributable to common stockholders for the periods presented astheir effect would have been antidilutive:
Year Ended December 31,2014 2013 2012
(in thousands)Shares subject to outstanding common stock awards 1,967 86 3,642Convertible preferred shares — — 17,416Total potentially dilutive shares 1,967 86 21,058
84
Note 11. Fair Value Measurements
The following table presents the fair value of our financial assets using the fair value hierarchy:
December 31, 2014Description Level 1 Level 2 Level 3 Total
(in thousands)Money market funds $ 667,210 $ — $ — $ 667,210
December 31, 2013Description Level 1 Level 2 Level 3 Total
(in thousands)Money market funds $ 238,810 $ — $ — $ 238,810
We have no material financial assets or liabilities measured using Level 2 or Level 3 inputs.
Note 12. Quarterly Financial Information (Unaudited)
The following table contains selected unaudited financial data for each quarter of 2014 and 2013. Theunaudited information should be read in conjunction with the Company’s financial statements and related notesincluded elsewhere in this report. The Company believes that the following unaudited information reflects all normalrecurring adjustments necessary for a fair presentation of the information for the periods presented. The operatingresults for any quarter are not necessarily indicative of results for any future period.
Three Months EndedDec 31,2014
Sept 30,2014
June 30,2014
Mar 31,2014
Dec 31,2013
Sept 30,2013
June 30,2013
Mar 31,2013
(in thousands, except per share amounts)Total revenues $ 142,923 $ 104,469 $ 90,673 $ 74,551 $ 81,459 $ 61,079 $ 49,884 $ 40,018Gross profit 131,312 94,928 82,033 67,358 75,409 56,501 45,538 36,468Net income (loss) 20,707 (4,631) (4,574) (5,629) 11,245 2,441 (2,575) (4,035)Net income (loss)per shareattributable tocommonstockholders:Basic $ 0.30 $ (0.07) $ (0.07) $ (0.09) $ 0.18 $ 0.04 $ (0.05) $ (0.12)Diluted $ 0.27 $ (0.07) $ (0.07) $ (0.09) $ 0.16 $ 0.03 $ (0.05) $ (0.12)
ITEM 9. CHANGES IN AND DISAGREEMENTS WITH ACCOUNTANTS ON ACCOUNTING ANDFINANCIAL DISCLOSURE.
None.
85
ITEM 9A. CONTROLS AND PROCEDURES
Evaluation of Disclosure Controls and Procedures
Under the supervision and with the participation of our principal executive officer and principal financial
officer, our management conducted an evaluation of the effectiveness of the design and operation of our
disclosure controls and procedures, as defined in Rules 13a-15(e) and 15d-15(e) under the Exchange Act, as of
December 31, 2014, the end of the period covered by this report.
In designing and evaluating our disclosure controls and procedures, management recognizes that any
disclosure controls and procedures, no matter how well designed and operated, can provide only reasonable
assurance of achieving the desired control objectives. In addition, the design of disclosure controls and
procedures must reflect the fact that there are resource constraints and that management is required to apply its
judgment in evaluating the benefits of possible controls and procedures relative to their costs.
Based on management’s evaluation, our Chief Executive Officer and Chief Financial Officer concluded
that our disclosure controls and procedures are designed to, and are effective to, provide assurance at a
reasonable level that the information we are required to disclose in reports that we file or submit under the
Exchange Act is recorded, processed, summarized and reported within the time periods specified in SEC rules
and forms, and that such information is accumulated and communicated to our management, including our Chief
Executive Officer and Chief Financial Officer, as appropriate, to allow timely decisions regarding required
disclosures.
Management’s Report on Internal Control Over Financial Reporting
Our management is responsible for establishing and maintaining adequate internal control over financial
reporting, as such term is defined in Exchange Act Rules 13a-15(f) and 15d-15(f). Our management conducted an
evaluation of the effectiveness of our internal control over financial reporting as of December 31, 2014 based on
the criteria established in Internal Control - Integrated Framework (2013) issued by the Committee of SponsoringOrganizations of the Treadway Commission.
Based on the results of its evaluation, management concluded that our internal control over financial
reporting was effective as of December 31, 2014. The effectiveness of our internal control over financial reporting
as of December 31, 2014 has been audited by PricewaterhouseCoopers LLP, an independent registered public
accounting firm, as stated in its report which is included in Item 8 of the Annual Report on Form 10-K.
Changes in Internal Control Over Financial Reporting
There was no change in our internal control over financial reporting identified in connection with the
evaluation required by Rules 13a-15(d) and 15d-15(d) of the Exchange Act that occurred during the three months
ended December 31, 2014 that has materially affected, or is reasonably likely to materially affect, our internal
control over financial reporting.
ITEM 9B. OTHER INFORMATION
Not applicable.
PART III
86
ITEM 10. DIRECTORS, EXECUTIVE OFFICERS AND CORPORATE GOVERNANCE
Information required by this Item is incorporated herein by reference to the sections entitled “ExecutiveOfficers and Other Executive Management,” “Proposal No. 1—Election of Directors,” “Information Regarding theBoard of Directors and Corporate Governance” and “Section 16(a) Beneficial Ownership Reporting Compliance”in our definitive proxy statement with respect to our 2015 Annual Meeting of Stockholders to be filed with the SECwithin 120 days after the end of the fiscal year covered by this Annual Report on Form 10-K.
ITEM 11. EXECUTIVE COMPENSATION
Information required by this Item is incorporated herein by reference to the sections entitled “ExecutiveCompensation”, "Compensation Discussion and Analysis" and “Director Compensation” in our definitive proxystatement with respect to our 2015 Annual Meeting of Stockholders to be filed with the SEC within 120 days afterthe end of the fiscal year covered by this Annual Report on Form 10-K.
ITEM 12. SECURITY OWNERSHIP OF CERTAIN BENEFICIAL OWNERS AND MANAGEMENT ANDRELATED STOCKHOLDER MATTERS
Information required by this Item is incorporated herein by reference to the sections entitled “SecurityOwnership of Certain Beneficial Owners and Management,” and “Equity Compensation Plan Information” in ourdefinitive proxy statement with respect to our 2015 Annual Meeting of Stockholders to be filed with the SEC within120 days after the end of the fiscal year covered by this Annual Report on Form 10-K.
ITEM 13. CERTAIN RELATIONSHIPS AND RELATED TRANSACTIONS AND DIRECTORINDEPENDENCE
Information required by this Item is incorporated herein by reference to the sections entitled “TransactionsWith Related Persons” and “Information Regarding the Board of Directors and Corporate Governance Independenceof the Board of Directors” in our definitive proxy statement with respect to our 2015 Annual Meeting of Stockholdersto be filed with the SEC within 120 days after the end of the fiscal year covered by this Annual Report on Form 10-K.
ITEM 14. PRINCIPAL ACCOUNTANT FEES AND SERVICES
Information required by this Item is incorporated herein by reference to the section entitled "Proposal No. 4— Ratification of Selection of Independent Registered Public Accounting Firm" in our definitive proxy statement withrespect to our 2015 Annual Meeting of Stockholders to be filed with the SEC within 120 days after the end of thefiscal year covered by this Annual Report on Form 10-K.
ITEM 15. EXHIBITS AND FINANCIAL STATEMENT SCHEDULES
(a) The following documents are filed as part of this Annual Report on Form 10-K:
See Index to Consolidated Financial Statements in Item 8 of this Annual Report on Form 10-K. No financialstatement schedules are provided because the information called for is not required or is shown in theconsolidated financial statements or related notes.
(b) Exhibits. The following exhibits are included herein or incorporated by reference:
Incorporated by ReferenceExhibitNo. Description of Exhibit Form File No. Exhibit Filing Date
FiledHerewith
3.1
Amended and Restated Certificateof Incorporation of TableauSoftware, Inc. 8-K 001-35925 3.1 5/23/2013
3.2Amended and Restated Bylaws ofTableau Software, Inc. S-1 333-187683 3.4 4/2/2013
4.1.1Form of Class A Common StockCertificate. S-1/A 333-187683 4.1.1 5/23/2013
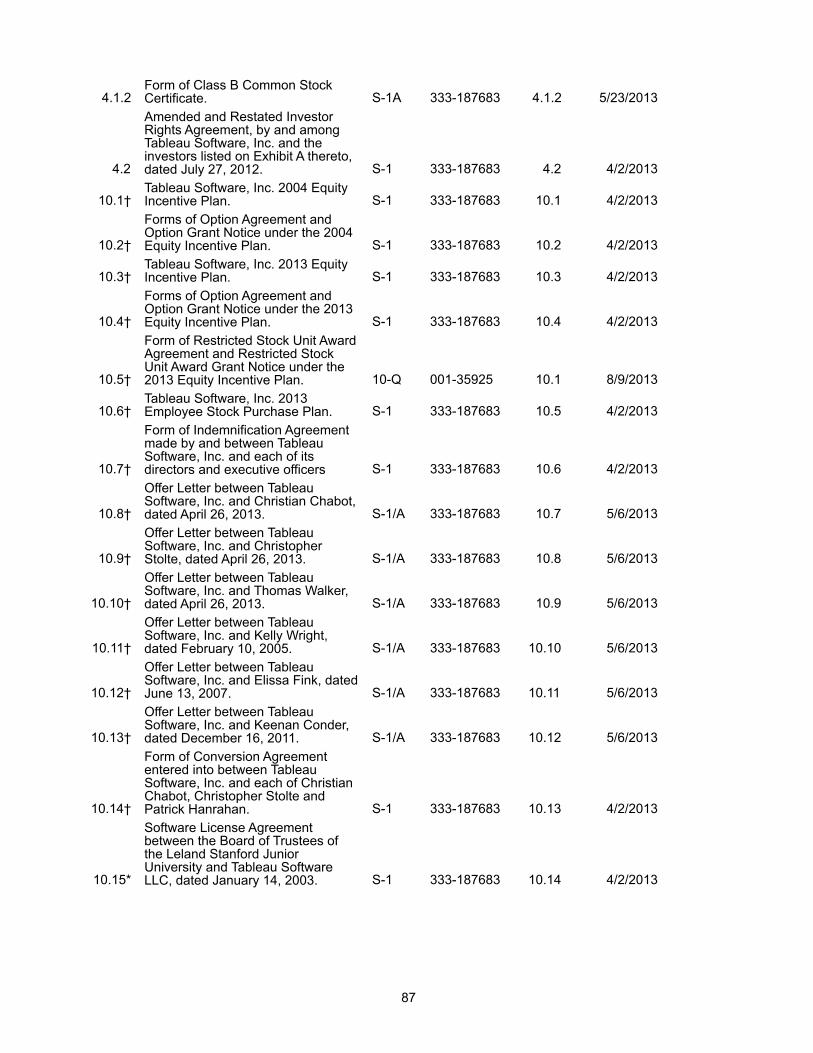
4.1.2Form of Class B Common StockCertificate. S-1A 333-187683 4.1.2 5/23/2013
4.2
Amended and Restated InvestorRights Agreement, by and amongTableau Software, Inc. and theinvestors listed on Exhibit A thereto,dated July 27, 2012. S-1 333-187683 4.2 4/2/2013
10.1†Tableau Software, Inc. 2004 EquityIncentive Plan. S-1 333-187683 10.1 4/2/2013
10.2†
Forms of Option Agreement andOption Grant Notice under the 2004Equity Incentive Plan. S-1 333-187683 10.2 4/2/2013
10.3†Tableau Software, Inc. 2013 EquityIncentive Plan. S-1 333-187683 10.3 4/2/2013
10.4†
Forms of Option Agreement andOption Grant Notice under the 2013Equity Incentive Plan. S-1 333-187683 10.4 4/2/2013
10.5†
Form of Restricted Stock Unit AwardAgreement and Restricted StockUnit Award Grant Notice under the2013 Equity Incentive Plan. 10-Q 001-35925 10.1 8/9/2013
10.6†Tableau Software, Inc. 2013Employee Stock Purchase Plan. S-1 333-187683 10.5 4/2/2013
10.7†
Form of Indemnification Agreementmade by and between TableauSoftware, Inc. and each of itsdirectors and executive officers S-1 333-187683 10.6 4/2/2013
10.8†
Offer Letter between TableauSoftware, Inc. and Christian Chabot,dated April 26, 2013. S-1/A 333-187683 10.7 5/6/2013
10.9†
Offer Letter between TableauSoftware, Inc. and ChristopherStolte, dated April 26, 2013. S-1/A 333-187683 10.8 5/6/2013
10.10†
Offer Letter between TableauSoftware, Inc. and Thomas Walker,dated April 26, 2013. S-1/A 333-187683 10.9 5/6/2013
10.11†
Offer Letter between TableauSoftware, Inc. and Kelly Wright,dated February 10, 2005. S-1/A 333-187683 10.10 5/6/2013
10.12†
Offer Letter between TableauSoftware, Inc. and Elissa Fink, datedJune 13, 2007. S-1/A 333-187683 10.11 5/6/2013
10.13†
Offer Letter between TableauSoftware, Inc. and Keenan Conder,dated December 16, 2011. S-1/A 333-187683 10.12 5/6/2013
10.14†
Form of Conversion Agreemententered into between TableauSoftware, Inc. and each of ChristianChabot, Christopher Stolte andPatrick Hanrahan. S-1 333-187683 10.13 4/2/2013
10.15*
Software License Agreementbetween the Board of Trustees ofthe Leland Stanford JuniorUniversity and Tableau SoftwareLLC, dated January 14, 2003. S-1 333-187683 10.14 4/2/2013
87
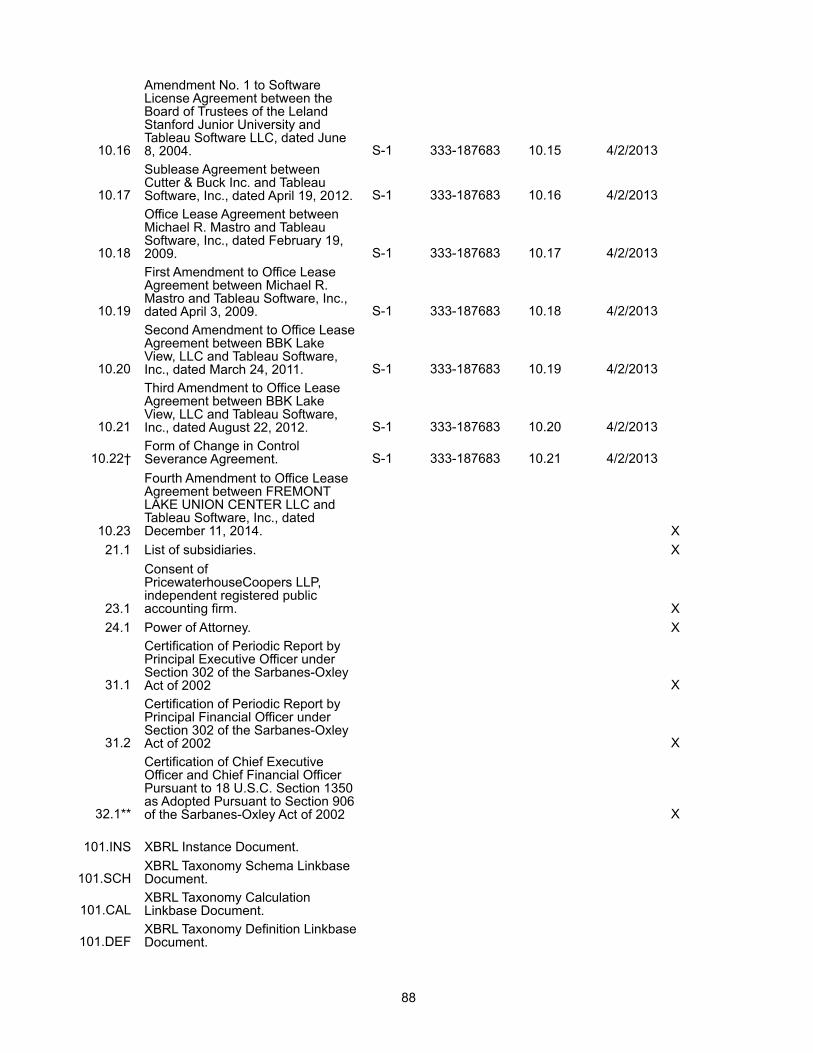
10.16
Amendment No. 1 to SoftwareLicense Agreement between theBoard of Trustees of the LelandStanford Junior University andTableau Software LLC, dated June8, 2004. S-1 333-187683 10.15 4/2/2013
10.17
Sublease Agreement betweenCutter & Buck Inc. and TableauSoftware, Inc., dated April 19, 2012. S-1 333-187683 10.16 4/2/2013
10.18
Office Lease Agreement betweenMichael R. Mastro and TableauSoftware, Inc., dated February 19,2009. S-1 333-187683 10.17 4/2/2013
10.19
First Amendment to Office LeaseAgreement between Michael R.Mastro and Tableau Software, Inc.,dated April 3, 2009. S-1 333-187683 10.18 4/2/2013
10.20
Second Amendment to Office LeaseAgreement between BBK LakeView, LLC and Tableau Software,Inc., dated March 24, 2011. S-1 333-187683 10.19 4/2/2013
10.21
Third Amendment to Office LeaseAgreement between BBK LakeView, LLC and Tableau Software,Inc., dated August 22, 2012. S-1 333-187683 10.20 4/2/2013
10.22†Form of Change in ControlSeverance Agreement. S-1 333-187683 10.21 4/2/2013
10.23
Fourth Amendment to Office LeaseAgreement between FREMONTLAKE UNION CENTER LLC andTableau Software, Inc., datedDecember 11, 2014. X
21.1 List of subsidiaries. X
23.1
Consent ofPricewaterhouseCoopers LLP,independent registered publicaccounting firm. X
24.1 Power of Attorney. X
31.1
Certification of Periodic Report byPrincipal Executive Officer underSection 302 of the Sarbanes-OxleyAct of 2002 X
31.2
Certification of Periodic Report byPrincipal Financial Officer underSection 302 of the Sarbanes-OxleyAct of 2002 X
32.1**
Certification of Chief ExecutiveOfficer and Chief Financial OfficerPursuant to 18 U.S.C. Section 1350as Adopted Pursuant to Section 906of the Sarbanes-Oxley Act of 2002 X
101.INS XBRL Instance Document.
101.SCHXBRL Taxonomy Schema LinkbaseDocument.
101.CALXBRL Taxonomy CalculationLinkbase Document.
101.DEFXBRL Taxonomy Definition LinkbaseDocument.
88
† Indicates management contract or compensatory plan or arrangement.
* Confidential treatment for portions of this exhibit has been granted by the Securities andExchange Commission.
** Document has been furnished, is not deemed filed and is not to be incorporated by reference intoany of the Company's filings under the Securities Act of 1933, as amended, or the Securities Exchange Act of1934, as amended, irrespective of any general incorporation language contained in any such filing.
101.LABXBRL Taxonomy Extension LabelLinkbase Document
101.PREXBRL Taxonomy PresentationLinkbase Document.
89
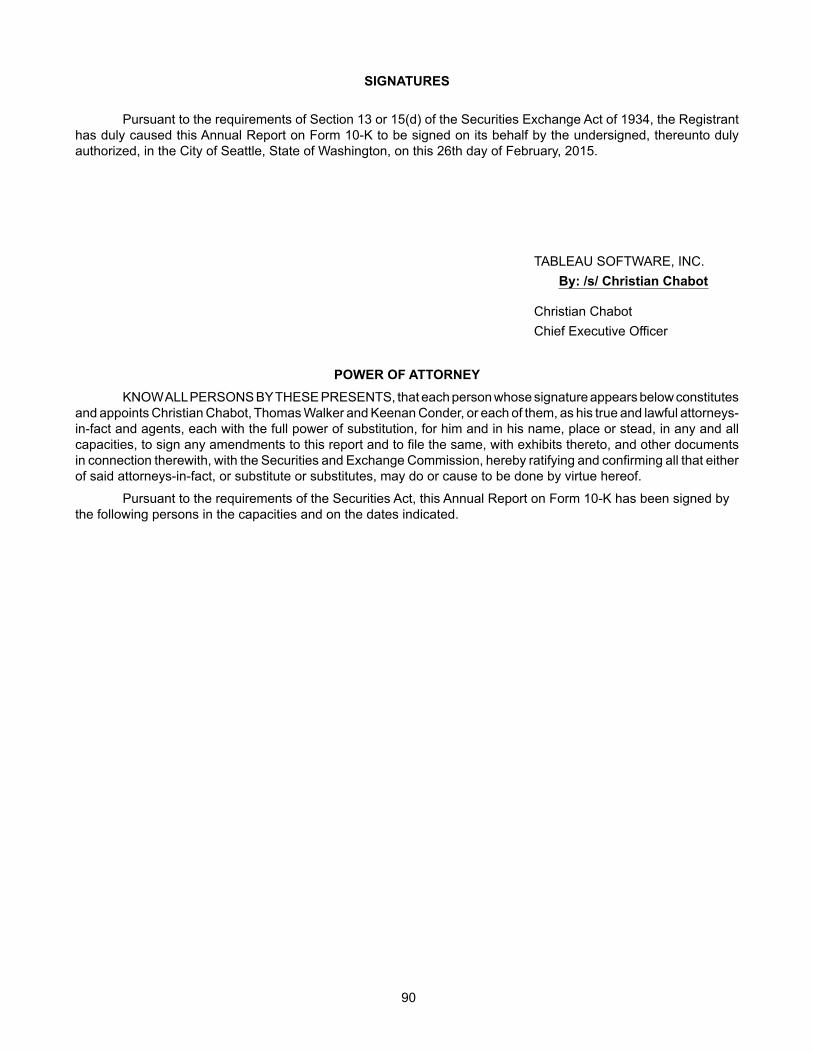
SIGNATURES
Pursuant to the requirements of Section 13 or 15(d) of the Securities Exchange Act of 1934, the Registranthas duly caused this Annual Report on Form 10-K to be signed on its behalf by the undersigned, thereunto dulyauthorized, in the City of Seattle, State of Washington, on this 26th day of February, 2015.
TABLEAU SOFTWARE, INC.By: /s/ Christian Chabot
Christian ChabotChief Executive Officer
POWER OF ATTORNEY KNOW ALL PERSONS BY THESE PRESENTS, that each person whose signature appears below constitutes
and appoints Christian Chabot, Thomas Walker and Keenan Conder, or each of them, as his true and lawful attorneys-in-fact and agents, each with the full power of substitution, for him and in his name, place or stead, in any and allcapacities, to sign any amendments to this report and to file the same, with exhibits thereto, and other documentsin connection therewith, with the Securities and Exchange Commission, hereby ratifying and confirming all that eitherof said attorneys-in-fact, or substitute or substitutes, may do or cause to be done by virtue hereof.
Pursuant to the requirements of the Securities Act, this Annual Report on Form 10-K has been signed bythe following persons in the capacities and on the dates indicated.
90
Signature Title Date
/s/ Christian ChabotChief Executive Officer, Co-founder and Chairmanof the Board (principal executive officer)
February 26,2015
Christian Chabot
/s/ Thomas E. Walker, Jr.Chief Financial Officer (principal financial andaccounting officer)
February 26,2015
Thomas E. Walker, Jr.
/s/ Patrick Hanrahan Chief Scientist, Co-founder and DirectorFebruary 25,
2015Patrick Hanrahan
/s/ Christopher StolteChief Development Officer, Co-founder andDirector
February 25,2015
Christopher Stolte
/s/ Forest Baskett DirectorFebruary 25,
2015Forest Baskett
/s/ Scott Sandell DirectorFebruary 25,
2015Scott Sandell
/s/ Brooke Seawell DirectorFebruary 25,
2015Brooke Seawell
/s/ Elliott Jurgensen, Jr. DirectorFebruary 25,
2015Elliott Jurgensen, Jr.
/s/ John McAdam DirectorFebruary 25,
2015John McAdam
91
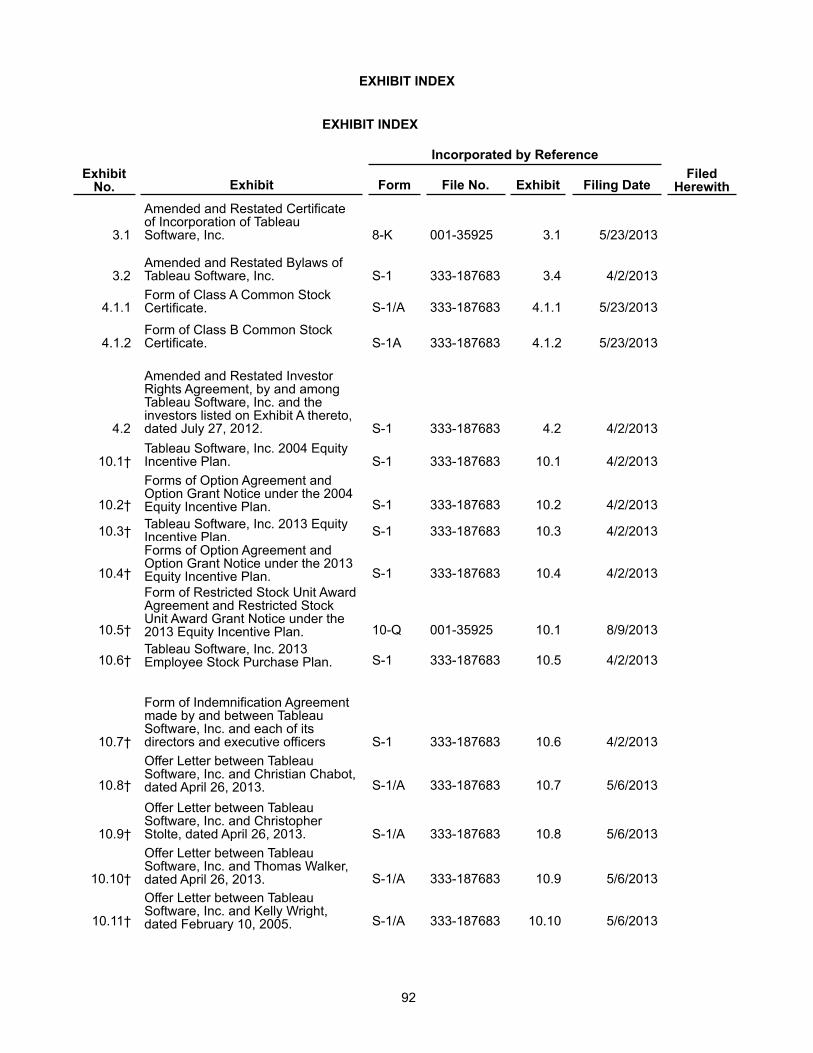
EXHIBIT INDEX
EXHIBIT INDEX
Incorporated by ReferenceExhibitNo. Exhibit Form File No. Exhibit Filing Date
FiledHerewith
3.1
Amended and Restated Certificateof Incorporation of TableauSoftware, Inc. 8-K 001-35925 3.1 5/23/2013
3.2Amended and Restated Bylaws ofTableau Software, Inc. S-1 333-187683 3.4 4/2/2013
4.1.1Form of Class A Common StockCertificate. S-1/A 333-187683 4.1.1 5/23/2013
4.1.2Form of Class B Common StockCertificate. S-1A 333-187683 4.1.2 5/23/2013
4.2
Amended and Restated InvestorRights Agreement, by and amongTableau Software, Inc. and theinvestors listed on Exhibit A thereto,dated July 27, 2012. S-1 333-187683 4.2 4/2/2013
10.1†Tableau Software, Inc. 2004 EquityIncentive Plan. S-1 333-187683 10.1 4/2/2013
10.2†
Forms of Option Agreement andOption Grant Notice under the 2004Equity Incentive Plan. S-1 333-187683 10.2 4/2/2013
10.3† Tableau Software, Inc. 2013 EquityIncentive Plan. S-1 333-187683 10.3 4/2/2013
10.4†
Forms of Option Agreement andOption Grant Notice under the 2013Equity Incentive Plan. S-1 333-187683 10.4 4/2/2013
10.5†
Form of Restricted Stock Unit AwardAgreement and Restricted StockUnit Award Grant Notice under the2013 Equity Incentive Plan. 10-Q 001-35925 10.1 8/9/2013
10.6†Tableau Software, Inc. 2013Employee Stock Purchase Plan. S-1 333-187683 10.5 4/2/2013
10.7†
Form of Indemnification Agreementmade by and between TableauSoftware, Inc. and each of itsdirectors and executive officers S-1 333-187683 10.6 4/2/2013
10.8†
Offer Letter between TableauSoftware, Inc. and Christian Chabot,dated April 26, 2013. S-1/A 333-187683 10.7 5/6/2013
10.9†
Offer Letter between TableauSoftware, Inc. and ChristopherStolte, dated April 26, 2013. S-1/A 333-187683 10.8 5/6/2013
10.10†
Offer Letter between TableauSoftware, Inc. and Thomas Walker,dated April 26, 2013. S-1/A 333-187683 10.9 5/6/2013
10.11†
Offer Letter between TableauSoftware, Inc. and Kelly Wright,dated February 10, 2005. S-1/A 333-187683 10.10 5/6/2013
92
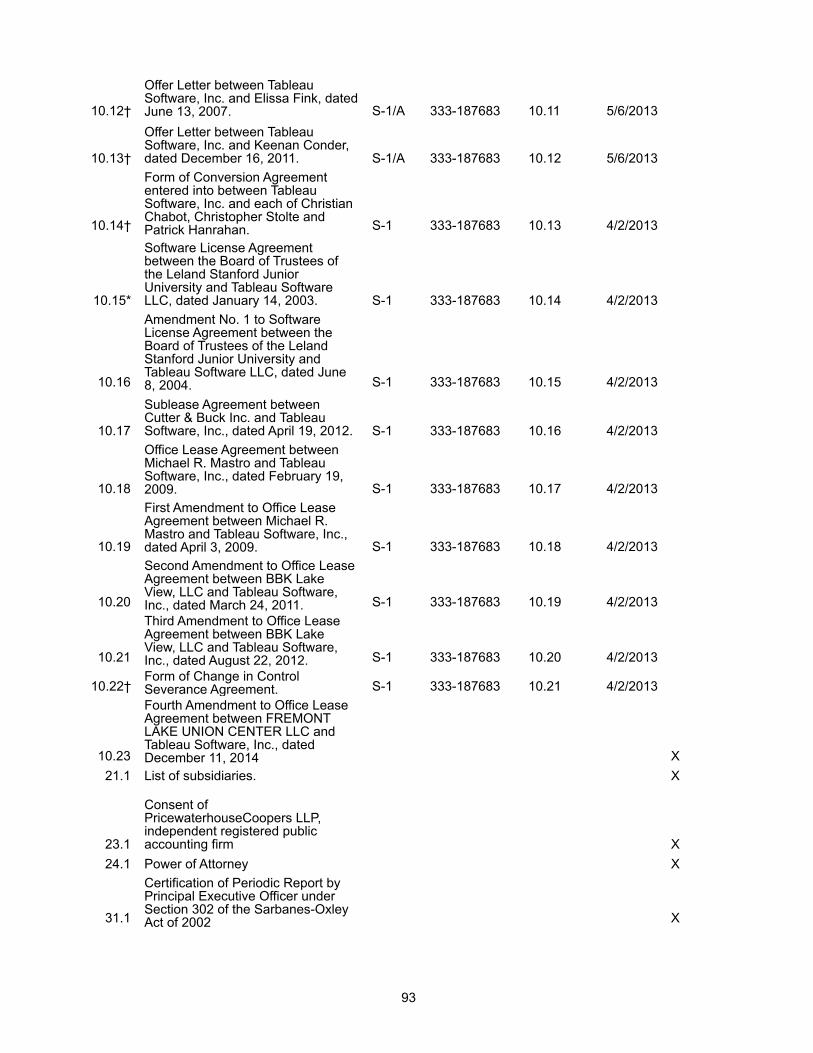
10.12†
Offer Letter between TableauSoftware, Inc. and Elissa Fink, datedJune 13, 2007. S-1/A 333-187683 10.11 5/6/2013
10.13†
Offer Letter between TableauSoftware, Inc. and Keenan Conder,dated December 16, 2011. S-1/A 333-187683 10.12 5/6/2013
10.14†
Form of Conversion Agreemententered into between TableauSoftware, Inc. and each of ChristianChabot, Christopher Stolte andPatrick Hanrahan. S-1 333-187683 10.13 4/2/2013
10.15*
Software License Agreementbetween the Board of Trustees ofthe Leland Stanford JuniorUniversity and Tableau SoftwareLLC, dated January 14, 2003. S-1 333-187683 10.14 4/2/2013
10.16
Amendment No. 1 to SoftwareLicense Agreement between theBoard of Trustees of the LelandStanford Junior University andTableau Software LLC, dated June8, 2004. S-1 333-187683 10.15 4/2/2013
10.17
Sublease Agreement betweenCutter & Buck Inc. and TableauSoftware, Inc., dated April 19, 2012. S-1 333-187683 10.16 4/2/2013
10.18
Office Lease Agreement betweenMichael R. Mastro and TableauSoftware, Inc., dated February 19,2009. S-1 333-187683 10.17 4/2/2013
10.19
First Amendment to Office LeaseAgreement between Michael R.Mastro and Tableau Software, Inc.,dated April 3, 2009. S-1 333-187683 10.18 4/2/2013
10.20
Second Amendment to Office LeaseAgreement between BBK LakeView, LLC and Tableau Software,Inc., dated March 24, 2011. S-1 333-187683 10.19 4/2/2013
10.21
Third Amendment to Office LeaseAgreement between BBK LakeView, LLC and Tableau Software,Inc., dated August 22, 2012. S-1 333-187683 10.20 4/2/2013
10.22†Form of Change in ControlSeverance Agreement. S-1 333-187683 10.21 4/2/2013
10.23
Fourth Amendment to Office LeaseAgreement between FREMONTLAKE UNION CENTER LLC andTableau Software, Inc., datedDecember 11, 2014 X
21.1 List of subsidiaries. X
23.1
Consent ofPricewaterhouseCoopers LLP,independent registered publicaccounting firm X
24.1 Power of Attorney X
31.1
Certification of Periodic Report byPrincipal Executive Officer underSection 302 of the Sarbanes-OxleyAct of 2002 X
93
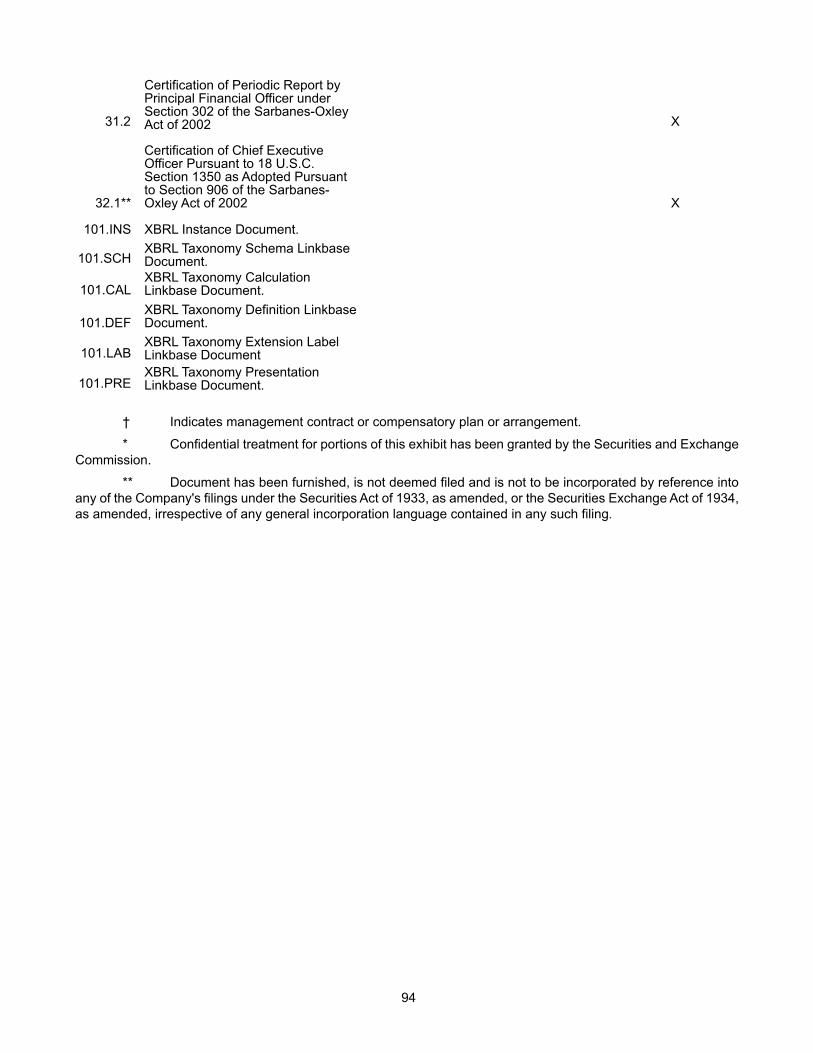
† Indicates management contract or compensatory plan or arrangement.
* Confidential treatment for portions of this exhibit has been granted by the Securities and ExchangeCommission.
** Document has been furnished, is not deemed filed and is not to be incorporated by reference intoany of the Company's filings under the Securities Act of 1933, as amended, or the Securities Exchange Act of 1934,as amended, irrespective of any general incorporation language contained in any such filing.
31.2
Certification of Periodic Report byPrincipal Financial Officer underSection 302 of the Sarbanes-OxleyAct of 2002 X
32.1**
Certification of Chief ExecutiveOfficer Pursuant to 18 U.S.C.Section 1350 as Adopted Pursuantto Section 906 of the Sarbanes-Oxley Act of 2002 X
101.INS XBRL Instance Document.
101.SCHXBRL Taxonomy Schema LinkbaseDocument.
101.CALXBRL Taxonomy CalculationLinkbase Document.
101.DEFXBRL Taxonomy Definition LinkbaseDocument.
101.LABXBRL Taxonomy Extension LabelLinkbase Document
101.PREXBRL Taxonomy PresentationLinkbase Document.
94


TABLEAU SOFTWARE, INC.837 North 34th Street, Suite 200
Seattle, Washington 98103
NOTICE OF ANNUAL MEETING OF STOCKHOLDERS
To Be Held On May 11, 2015
Dear Tableau Software, Inc. Stockholder:
You are cordially invited to attend the Annual Meeting of Stockholders of Tableau Software, Inc., a Delawarecorporation (the “Company”). The meeting will be held on Monday, May 11, 2015 at 11:00 a.m. local time at LakeWashington Rowing Club, 910 North Northlake Way, Seattle, Washington 98103 for the following purposes:
1. To elect the three nominees for director named herein to the Board of Directors to hold office until the2018 Annual Meeting of Stockholders.
2. To approve, on an advisory basis, the compensation of the Company’s named executive officers, asdisclosed in this proxy statement.
3. To indicate, on an advisory basis, the preferred frequency of stockholder advisory votes on thecompensation of the Company’s named executive officers.
4. To ratify the selection by the Audit Committee of the Board of Directors of PricewaterhouseCoopers LLPas the independent registered public accounting firm of the Company for its fiscal year endingDecember 31, 2015.
5. To conduct any other business properly brought before the meeting.
These items of business are more fully described in the proxy statement accompanying this Notice.
The record date for the Annual Meeting is March 18, 2015. Only stockholders of record at the close of businesson that date may vote at the meeting or any adjournment thereof.
Important Notice Regarding the Availability of Proxy Materials for the Stockholders’ Meeting to BeHeld on Monday, May 11, 2015 at 11:00 a.m. local time at Lake Washington Rowing Club,
910 North Northlake Way, Seattle, Washington 98103.
The proxy statement and annual report to stockholdersare available at http://materials.proxyvote.com/87336U.
By Order of the Board of Directors
Keenan ConderVice President, General Counsel and Corporate Secretary
Seattle, WashingtonMarch 31, 2015
You are cordially invited to attend the meeting in person. Whether or not you expect to attend themeeting, please vote over the telephone or the internet or, if you receive a proxy card by mail, bycompleting and returning the proxy card mailed to you, as promptly as possible in order to ensure yourrepresentation at the meeting. Voting instructions are provided in the Notice of Internet Availability ofProxy Materials, or, if you receive a proxy card by mail, the instructions are printed on your proxy cardand included in the accompanying proxy statement. Even if you have voted by proxy, you may still votein person if you attend the meeting. Please note, however, that if your shares are held of record by abroker, bank or other nominee and you wish to vote at the meeting, you must obtain a proxy issued inyour name from that record holder.
TABLE OF CONTENTS
Page
QUESTIONS AND ANSWERS ABOUT THESE PROXY MATERIALS AND VOTING . . . . . . . . . . 1
PROPOSAL NO. 1 ELECTION OF DIRECTORS . . . . . . . . . . . . . . . . . . . . . . . . . . . . . . . . . . . . . . . . . . 6
PROPOSAL NO. 2 ADVISORY VOTE ON EXECUTIVE COMPENSATION . . . . . . . . . . . . . . . . . . . 9
PROPOSAL NO. 3 ADVISORY VOTE ON THE FREQUENCY OF SOLICITATION OFADVISORY STOCKHOLDER VOTE ON EXECUTIVE COMPENSATION . . . . . . . . . . . . . . . . . . 10
PROPOSAL NO. 4 RATIFICATION OF SELECTION OF INDEPENDENT REGISTEREDPUBLIC ACCOUNTING FIRM . . . . . . . . . . . . . . . . . . . . . . . . . . . . . . . . . . . . . . . . . . . . . . . . . . . . . . . . 11
INFORMATION REGARDING THE BOARD OF DIRECTORS AND CORPORATEGOVERNANCE . . . . . . . . . . . . . . . . . . . . . . . . . . . . . . . . . . . . . . . . . . . . . . . . . . . . . . . . . . . . . . . . . . . . . 13
SECURITY OWNERSHIP OF CERTAIN BENEFICIAL OWNERS AND MANAGEMENT . . . . . . 18
SECTION 16(A) BENEFICIAL OWNERSHIP REPORTING COMPLIANCE . . . . . . . . . . . . . . . . . . 20
EXECUTIVE OFFICERS . . . . . . . . . . . . . . . . . . . . . . . . . . . . . . . . . . . . . . . . . . . . . . . . . . . . . . . . . . . . . . . 21
EXECUTIVE COMPENSATION . . . . . . . . . . . . . . . . . . . . . . . . . . . . . . . . . . . . . . . . . . . . . . . . . . . . . . . . . 22
DIRECTOR COMPENSATION . . . . . . . . . . . . . . . . . . . . . . . . . . . . . . . . . . . . . . . . . . . . . . . . . . . . . . . . . . 38
EQUITY COMPENSATION PLAN INFORMATION . . . . . . . . . . . . . . . . . . . . . . . . . . . . . . . . . . . . . . . 39
TRANSACTIONS WITH RELATED PERSONS . . . . . . . . . . . . . . . . . . . . . . . . . . . . . . . . . . . . . . . . . . . . 39
HOUSEHOLDING OF PROXY MATERIALS . . . . . . . . . . . . . . . . . . . . . . . . . . . . . . . . . . . . . . . . . . . . . 40
OTHER MATTERS . . . . . . . . . . . . . . . . . . . . . . . . . . . . . . . . . . . . . . . . . . . . . . . . . . . . . . . . . . . . . . . . . . . . 41
TABLEAU SOFTWARE, INC.837 North 34th Street, Suite 200
Seattle, Washington 98103
PROXY STATEMENTFOR THE 2015 ANNUAL MEETING OF STOCKHOLDERS
May 11, 2015
QUESTIONS AND ANSWERS ABOUT THESE PROXY MATERIALS AND VOTING
Why did I receive a notice regarding the availability of proxy materials on the internet?
We have elected to provide access to our proxy materials over the internet. Accordingly, we have sent you aNotice of Internet Availability of Proxy Materials (the “Notice”) because the Board of Directors (the “Board”) ofTableau Software, Inc. (the “Company” or “Tableau”) is soliciting your proxy to vote at the 2015 AnnualMeeting of Stockholders, including at any adjournments or postponements of the meeting. All stockholders willhave the ability to access the proxy materials on the website referred to in the Notice or request to receive aprinted set of the proxy materials. Instructions on how to access the proxy materials over the internet or torequest a printed copy may be found in the Notice.
We intend to mail the Notice on or about March 31, 2015 to all stockholders of record entitled to vote at theAnnual Meeting. We may send you a proxy card, along with a second Notice, on or after April 10, 2015.
How do I attend the Annual Meeting?
The meeting will be held on Monday, May 11, 2015 at 11:00 a.m. local time at Lake Washington Rowing Club,910 North Northlake Way, Seattle, Washington 98103. Information on how to vote in person at the meeting isdiscussed below.
Who can vote at the Annual Meeting?
Only stockholders of record at the close of business on March 18, 2015 will be entitled to vote at the meeting. Onthis record date, there were 71,126,531 shares of common stock outstanding and entitled to vote.
Stockholder of Record: Shares Registered in Your Name
If on March 18, 2015 your shares were registered directly in your name with our transfer agent, American StockTransfer & Trust Company, LLC, then you are a stockholder of record. As a stockholder of record, you may votein person at the meeting or vote by proxy over the telephone, through the internet or by using a proxy card thatyou may request or that we may elect to deliver at a later time. Whether or not you plan to attend the meeting, weurge you to vote by proxy to ensure your vote is counted.
Beneficial Owner: Shares Registered in the Name of a Broker or Bank
If on March 18, 2015 your shares were held, not in your name, but rather in an account at a brokerage firm, bank,dealer or other similar organization, then you are the beneficial owner of shares held in “street name” and theNotice is being forwarded to you by that organization. The organization holding your account is considered to bethe stockholder of record for purposes of voting at the Annual Meeting. As a beneficial owner, you have the rightto direct your broker or other agent regarding how to vote the shares in your account. You are also invited toattend the Annual Meeting. However, since you are not the stockholder of record, you may not vote your sharesin person at the meeting unless you request and obtain a valid proxy from your broker or other agent.
1
What am I voting on?
There are four matters scheduled for a vote:
• Election of three directors;
• Advisory approval of the compensation of our named executive officers, as disclosed in this proxystatement;
• Advisory indication of the preferred frequency of stockholder advisory votes on the compensation of ournamed executive officers; and
• Ratification of selection by the Audit Committee of the Board of PricewaterhouseCoopers LLP as ourindependent registered public accounting firm for the fiscal year ending December 31, 2015.
What if another matter is properly brought before the meeting?
The Board knows of no other matters that will be presented for consideration at the Annual Meeting. If any othermatters are properly brought before the meeting, it is the intention of the persons named in the accompanyingproxy to vote on those matters in accordance with their best judgment.
How do I vote?
You may either vote “For” all the nominees to the Board or you may “Withhold” your vote for any nominee youspecify. With regard to your advisory vote on how frequently we should solicit stockholder advisory approval ofexecutive compensation, you may vote for any one of the following: one year, two years or three years, or youmay abstain from voting on that matter. For your advisory vote on the compensation of our named executiveofficers and the ratification of the selection of PricewaterhouseCoopers LLP as the Company’s independentregistered public accounting firm, you may vote “For” or “Against” or abstain from voting.
The procedures for voting are as follows:
Stockholder of Record: Shares Registered in Your Name
If you are a stockholder of record, you may vote by proxy over the telephone, through the internet, or by using aproxy card that you may request or that we may elect to deliver at a later time, or you may vote in person at theAnnual Meeting. Whether or not you plan to attend the meeting, we urge you to vote by proxy to ensure yourvote is counted. You may still attend the Annual Meeting and vote in person even if you have already voted byproxy.
• To vote over the telephone, dial toll-free 1-800-690-6903 using a touch-tone phone and follow the recordedinstructions. You will be asked to provide the company number and control number from the Notice. Yourtelephone vote must be received by 11:59 p.m., Eastern Time on May 10, 2015 to be counted.
• To vote through the internet, go to http://materials.proxyvote.com/87336U to complete an electronic proxycard. You will be asked to provide the company number and control number from the Notice. Your internetvote must be received by 11:59 p.m., Eastern Time on May 10, 2015 to be counted.
• To vote using the proxy card that may be delivered to you, simply complete, sign and date the proxy cardand return it promptly in the envelope provided. If you return your signed proxy card to us before theAnnual Meeting, we will vote your shares as you direct.
• To vote in person, come to the Annual Meeting and request a ballot when you arrive.
Beneficial Owner: Shares Registered in the Name of Broker or Bank
If you are a beneficial owner of shares registered in the name of your broker, bank or other agent, you shouldhave received a Notice containing voting instructions from that organization rather than from us. Simply follow
2
the voting instructions in the Notice to ensure that your vote is counted. To vote in person at the Annual Meeting,you must obtain a valid proxy from your broker, bank or other agent. Follow the instructions from your broker orbank included with these proxy materials, or contact your broker or bank to request a proxy form.
Internet proxy voting is being provided to allow you to vote your shares online, with procedures designedto ensure the authenticity and correctness of your proxy vote instructions. However, please be aware thatyou must bear any costs associated with your internet access, such as usage charges from internet accessproviders and telephone companies.
How many votes do I have?
On each matter to be voted upon, you have one vote for each share of Class A Common Stock and ten votes foreach share of Class B Common Stock you owned as of March 18, 2015. The Class A Common Stock and Class BCommon Stock will vote together as a single class on all proposals described in this proxy statement.
What happens if I do not vote?
Stockholder of Record: Shares Registered in Your Name
If you are a stockholder of record and do not vote by telephone, through the internet, by completing the proxycard that may be delivered to you or in person at the Annual Meeting, your shares will not be voted.
Beneficial Owner: Shares Registered in the Name of Broker or Bank
If you are a beneficial owner and do not instruct your broker, bank or other agent how to vote your shares, thequestion of whether your broker or nominee will still be able to vote your shares depends on whether the NewYork Stock Exchange (“NYSE”) deems the particular proposal to be a “routine” matter. Brokers and nomineescan use their discretion to vote “uninstructed” shares with respect to matters that are considered to be “routine,”but not with respect to “non-routine” matters. Under the rules and interpretations of the NYSE, “non-routine”matters are matters that may substantially affect the rights or privileges of stockholders, such as mergers,stockholder proposals, elections of directors (even if not contested), executive compensation (including anyadvisory stockholder votes on executive compensation and on the frequency of stockholder votes on executivecompensation), and certain corporate governance proposals, even if management-supported. Accordingly, yourbroker or nominee may not vote your shares on Proposal Nos. 1, 2 and 3 without your instructions, but may voteyour shares on Proposal No. 4, even in the absence of your instruction.
What if I return a proxy card or otherwise vote but do not make specific choices?
If you return a signed and dated proxy card or otherwise vote without marking voting selections, your shares willbe voted, as applicable, “For” the election of all three nominees for director, “For” the advisory approval ofnamed executive officer compensation, for “One Year” as the preferred frequency of advisory votes to approvenamed executive officer compensation and “For” the ratification of the selection of PricewaterhouseCoopers LLPas the Company’s independent registered public accounting firm for the fiscal year ending December 31, 2015. Ifany other matter is properly presented at the meeting, your proxyholder (one of the individuals named on yourproxy card) will vote your shares using his or her best judgment.
Who is paying for this proxy solicitation?
We will pay for the entire cost of soliciting proxies. In addition to these proxy materials, our directors andemployees may also solicit proxies in person, by telephone, or by other means of communication. Directors andemployees will not be paid any additional compensation for soliciting proxies. We may also reimburse brokeragefirms, banks and other agents for the cost of forwarding proxy materials to beneficial owners.
3
What does it mean if I receive more than one Notice?
If you receive more than one Notice, your shares may be registered in more than one name or in differentaccounts. Please follow the voting instructions on each of the Notices to ensure that all of your shares are voted.
Can I change my vote after submitting my proxy?
Stockholder of Record: Shares Registered in Your Name
Yes. You can revoke your proxy at any time before the final vote at the meeting. If you are the record holder ofyour shares, you may revoke your proxy in any one of the following ways:
• You may submit another properly completed proxy card with a later date.
• You may grant a subsequent proxy by telephone or through the internet.
• You may send a timely written notice that you are revoking your proxy to our Corporate Secretary at837 North 34th Street, Suite 200, Seattle, Washington 98103.
• You may attend the Annual Meeting and vote in person. Simply attending the meeting will not, by itself,revoke your proxy.
Your most current proxy card or telephone or internet proxy is the one that is counted.
Beneficial Owner: Shares Registered in the Name of Broker or Bank
If your shares are held by your broker or bank as a nominee or agent, you should follow the instructions providedby your broker or bank.
When are stockholder proposals and director nominations due for next year’s Annual Meeting?
To be considered for inclusion in next year’s proxy materials, your proposal must be submitted in writing byDecember 3, 2015 to our Corporate Secretary at 837 North 34th Street, Suite 200, Seattle, Washington 98103,and must comply with all applicable requirements of Rule 14a-8 promulgated under the Securities Exchange Actof 1934, as amended (the “Exchange Act”); provided, however, that if our 2016 Annual Meeting of Stockholdersis held before April 11, 2016 or after June 10, 2016, then the deadline is a reasonable amount of time prior to thedate we begin to print and mail our proxy statement for the 2016 Annual Meeting of Stockholders. If you wish tosubmit a proposal (including a director nomination) at the 2016 Annual Meeting of Stockholders that is not to beincluded in next year’s proxy materials, the proposal must be received by our Corporate Secretary not later thanthe close of business on February 11, 2016 nor earlier than the close of business on January 12, 2016; provided,however, that if our 2016 Annual Meeting of Stockholders is held before April 11, 2016 or after June 10, 2016,then the proposal must be received not earlier than the close of business on the 120th day prior to such meetingand not later than the close of business on the later of the 90th day prior to such meeting or the 10th dayfollowing the day on which public announcement of the date of such meeting is first made. You are also advisedto review our bylaws, which contain additional requirements about advance notice of stockholder proposals anddirector nominations.
How are votes counted?
Votes will be counted by the inspector of election appointed for the meeting, who will separately count:
• for the proposal to elect directors, votes “For,” “Withhold” and broker non-votes;
• with respect to the proposal regarding frequency of stockholder advisory votes to approve executivecompensation, votes for frequencies of one year, two years or three years, abstentions and broker non-votes;and
• with respect to other proposals, votes “For” and “Against,” abstentions and broker non-votes.
4
What are “broker non-votes”?
As discussed above, when a beneficial owner of shares held in “street name” does not give instructions to thebroker or nominee holding the shares as to how to vote on matters deemed by the NYSE to be “non-routine,” thebroker or nominee cannot vote the shares. These unvoted shares are counted as “broker non-votes.”
How many votes are needed to approve each proposal?
The following table summarizes the minimum vote needed to approve each proposal and the effect of abstentionsand broker non-votes.
ProposalNumber Proposal Description Vote Required for Approval
Effect ofAbstentionsor Withhold
Votes
Effect ofBroker
Non-Votes
1 Election of Directors The three nominees receiving the most“For” votes will be elected
None None
2 Advisory approval of thecompensation of the Company’snamed executive officers
“For” votes from the holders of amajority of shares present in person orrepresented by proxy and entitled tovote on the matter
Against None
3 Advisory vote on the frequency ofstockholder advisory votes onexecutive compensation
The frequency receiving the votes of theholders of a majority of shares present inperson or represented by proxy andentitled to vote on the matter
Against None
4 Ratification of the selection ofPricewaterhouseCoopers LLP as theCompany’s independent registeredpublic accounting firm for the fiscalyear ending December 31, 2015
“For” votes from the holders of amajority of shares present in person orrepresented by proxy and entitled tovote on the matter
Against None
What is the quorum requirement?
A quorum of stockholders is necessary to hold a valid meeting. A quorum will be present if shares representing amajority of the aggregate voting power of shares of Class A Common Stock and Class B Common Stock (votingtogether as a single class) entitled to vote are present at the Annual Meeting in person or represented by proxy.On the March 18, 2015 record date, there were 49,866,678 shares of Class A Common Stock and 21,259,853shares of Class B Common Stock outstanding and entitled to vote. Thus, the holders of shares representing anaggregate of 131,232,605 votes must be present in person or represented by proxy at the Annual Meeting to havea quorum.
Your shares will be counted towards the quorum only if you submit a valid proxy (or one is submitted on yourbehalf by your broker, bank or other nominee) or if you vote in person at the meeting. Abstentions and brokernon-votes will be counted towards the quorum requirement. If there is no quorum, the holders of sharesrepresenting a majority of the voting power present at the Annual Meeting in person or represented by proxy mayadjourn the Annual Meeting to another date.
How can I find out the results of the voting at the Annual Meeting?
Preliminary voting results will be announced at the meeting. In addition, final voting results will be published ina current report on Form 8-K that we expect to file within four business days after the meeting. If final votingresults are not available to us in time to file a Form 8-K within four business days after the meeting, we intend tofile a Form 8-K to publish preliminary results and, within four business days after the final results are known tous, file an amended Form 8-K to publish the final results.
5
PROPOSAL NO. 1
ELECTION OF DIRECTORS
Our Board presently has eight members, divided into three classes. Each class consists, as nearly as possible, ofone-third of the total number of directors, and each class has a three-year term. Vacancies on the Board may befilled only by persons elected by a majority of the remaining directors. A director elected by the Board to fill avacancy in a class, including vacancies created by an increase in the number of directors, shall serve for theremainder of the full term of that class and until the director’s successor is duly elected and qualified.
We invite, but do not require, our directors and nominees for director to attend the Annual Meeting. Two of ourdirectors attended the 2014 Annual Meeting of Stockholders.
The following table sets forth information with respect to our directors, including the three nominees for electionat the Annual Meeting, as of March 18, 2015:
Name AgeDirector
sincePrincipal Occupation/Position held with the Company
Class II Directors—Nominees for Election at the Annual MeetingForest Baskett . . . . . . . . 71 Aug. 2008 General Partner, New Enterprise AssociatesBilly Bosworth . . . . . . . 45 NA Chief Executive Officer, DataStaxPatrick Hanrahan . . . . . . 59 Jan. 2003 Co-founder and Chief Scientist of Tableau
Class III Directors—Continuing in Office until the 2016 Annual MeetingChristian Chabot . . . . . . 43 Jan. 2003 Co-founder, Chief Executive Officer and Chairman of the
Board of Directors of TableauChristopher Stolte . . . . . 42 Jan. 2003 Co-founder and Chief Development Officer of Tableau
Class I Directors—Continuing in Office until the 2017 Annual MeetingElliott Jurgensen, Jr. . . . 70 Sept. 2012 Director of TableauJohn McAdam . . . . . . . . 64 Dec. 2012 President, Chief Executive Officer and Director of F5
Networks, Inc.Brooke Seawell . . . . . . . 67 Nov. 2011 Venture Partner, New Enterprise Associates
Each of the nominees listed below was recommended for election by the Nominating and Corporate GovernanceCommittee of the Board of Directors. Drs. Baskett and Hanrahan are currently directors of the Company andwere elected to the Board prior to our initial public offering pursuant to the provisions of a voting agreemententered into by certain of our stockholders—including our founders, Mr. Chabot, Dr. Stolte and Dr. Hanrahan,and entities affiliated with New Enterprise Associates and Meritech—that terminated upon the completion of ourinitial public offering in 2013. Mr. Bosworth is not currently serving as a member of the Board. If elected,Mr. Bosworth would fill the vacancy that will be left by our current director Scott Sandell, who has indicated hewill not be standing for reelection at the Annual Meeting.
Directors are elected by a plurality of the votes of the holders of shares present in person or represented by proxyand entitled to vote on the election of directors. Accordingly, the three nominees receiving the highest number ofaffirmative votes will be elected. Shares represented by executed proxies will be voted, if authority to do so is notwithheld, for the election of the three nominees named below. If any nominee becomes unavailable for electionas a result of an unexpected occurrence, shares that would have been voted for that nominee instead will be votedfor the election of a substitute nominee proposed by Tableau. Each person nominated for election has agreed toserve if elected. The Company’s management has no reason to believe that any nominee will be unable to serve.
6
The following is a brief biography of each nominee and each director whose term will continue after the AnnualMeeting.
Nominees for Election for a Three-Year Term Expiring at the 2018 Annual Meeting
Forest Baskett has served as a member of our Board since August 2008. Dr. Baskett has been a General Partnerwith New Enterprise Associates, a venture capital firm (“NEA”), since 2004, where he focuses on informationand energy technology investments. Dr. Baskett joined NEA in 1999. From 1986 to 1999, Dr. Baskett served asChief Technology Officer and Senior Vice President, Research and Development of Silicon Graphics Inc.(“SGI”). Prior to joining SGI, he founded and directed the Western Research Laboratory of Digital EquipmentCorporation from 1982 to 1986, and was a professor of Computer Science and Electrical Engineering at StanfordUniversity from 1971 to 1982. Dr. Baskett also serves on the boards of various private technology companies.Dr. Baskett holds a Ph.D. in Computer Science from the University of Texas at Austin and a B.A. from RiceUniversity. He is also a member of the National Academy of Engineering. Dr. Baskett was chosen to serve onour Board due to his extensive experience with a wide range of technology companies and the venture capitalindustry.
Billy Bosworth has served as the President and Chief Executive Officer and as a member of the board ofDataStax, Inc., a provider of open-source and big-data database technology, since May 2011. Prior to joiningDataStax, Mr. Bosworth held positions at Quest Software, a provider of systems management software, fromJune 2005 to May 2011, where his most recent role was Vice President and General Manager of the databasebusiness unit. Mr. Bosworth holds a B.S. in Information Science and Data Processing from the University ofLouisville. Mr. Bosworth was nominated to serve on our Board due to his experience in the database industry,and in particular, his extensive background in product management and development.
Patrick Hanrahan has served as our Chief Scientist and as a member of our Board since our inception in 2003.Dr. Hanrahan is also currently the CANON Professor of Computer Science and Electrical Engineering atStanford University, where he teaches computer graphics and is researching visualization, image synthesis, andgraphics systems and architectures. Dr. Hanrahan is a part-time employee of Tableau, with approximately 20% ofhis professional time currently dedicated to Tableau. Prior to joining us, Dr. Hanrahan served as senior scientistat Pixar Animation Studios. Prior to joining Stanford, Dr. Hanrahan was an Associate Professor at PrincetonUniversity. Dr. Hanrahan holds a Ph.D. in Biophysics and a B.S. from the University of Wisconsin—Madison.Dr. Hanrahan was chosen to serve on our Board because he is a co-founder, a significant stockholder and, as ourChief Scientist, has a deep understanding of our products and technology.
THE BOARD OF DIRECTORS RECOMMENDS
A VOTE IN FAVOR OF EACH NAMED NOMINEE.
Directors Continuing in Office until the 2016 Annual Meeting
Christian Chabot is one of our co-founders and has served as our Chief Executive Officer and Chairman of ourBoard since our inception in 2003. Prior to joining us, Mr. Chabot served as an Associate Partner at SoftbankVenture Capital, a venture capital firm. Prior to Softbank, Mr. Chabot was the President and co-founder ofBeeLine LLC, a visualization software company. He holds an M.B.A. from Stanford University, an M.Sc. fromthe University of Sussex and a B.S. from Stanford University. Mr. Chabot was chosen to serve on our Boardbecause he is a co-founder, a significant stockholder and our Chief Executive Officer.
Christopher Stolte is one of our co-founders and has served as a member of our Board since our inception in2003. Dr. Stolte has served as our Chief Development Officer since May 2010, and prior to that served as ourVice President of Engineering. Prior to joining us, Dr. Stolte was the Chief Technology Officer and co-founderof BeeLine LLC. Dr. Stolte holds a Ph.D. in Computer Science from Stanford University and a B.S. from Simon
7
Fraser University. Dr. Stolte was chosen to serve on our Board because he is a co-founder, a significantstockholder and, as our Chief Development Officer, has a deep understanding of our products and technology.
Directors Continuing in Office until the 2017 Annual Meeting
Elliott Jurgensen, Jr. has served as a member of our Board since September 2012. Mr. Jurgensen retired fromKPMG LLP, an international public accounting firm, in January 2003 after 32 years, including 23 years as anaudit partner. During his public accounting career at KPMG, he held a number of leadership positions, includingManaging Partner of the Bellevue, Washington office from 1982 to 1991 and Managing Partner of the Seattle,Washington office from 1993 to 2002. Mr. Jurgensen currently serves on the boards of BSquare Corporation anda private company. Mr. Jurgensen has a B.S. from California State University, San Jose. Mr. Jurgensen waschosen to serve on our Board due to his substantial financial expertise that includes extensive knowledge of thecomplex financial and operational issues facing publicly-traded companies and a deep understanding ofaccounting principles and financial reporting rules and regulations. He also brings professional service expertise,technology industry experience, experience as a public company board member, and sales and marketingexperience at KPMG.
John McAdam has served as a member of our Board since December 2012. Mr. McAdam has served as thePresident and Chief Executive Officer and a member of the board of directors of F5 Networks, Inc., a provider ofapplication delivery networking technology, since July 2000. Prior to joining F5 Networks, Mr. McAdam servedas General Manager of the Web server sales business at IBM from September 1999 to July 2000. FromJanuary 1995 until August 1999, Mr. McAdam served as the President and Chief Operating Officer of SequentComputer Systems, Inc., a manufacturer of high-end open systems, which was sold to IBM in September 1999.Mr. McAdam holds a B.S. from the University of Glasgow, Scotland. Mr. McAdam was chosen to serve on ourBoard due to his experience in the technology industry, and in particular, his experience managing F5 Networksthrough a period of high growth.
Brooke Seawell has served as a member of our Board since November 2011. Mr. Seawell has been a VenturePartner with NEA since January 2005. Prior to joining NEA, Mr. Seawell was a Partner with TechnologyCrossover Ventures, a venture capital firm, from February 2000 to December 2004. Mr. Seawell also served asExecutive Vice President of NetDynamics Inc., an application server software company that was acquired by SunMicrosystems, Inc., from 1997 to 1998, and Senior Vice President, Finance and Operations and Chief FinancialOfficer of Synopsys, an electronic design automation software company, from 1991 to 1997. Mr. Seawellpreviously served as Vice President, Finance and Production and Chief Financial Officer of Weitek Corporation,a fabless semiconductor company, from 1983 to 1991, and co-founder and Chief Financial Officer of SouthwallTechnologies, Inc., a complex thin film coatings company, from 1979 to 1983. Mr. Seawell currently serves onthe boards of NVIDIA Corporation, Informatica Corporation and various private technology companies.Mr. Seawell also is a member of the Stanford University Athletic Board and previously served on theManagement Board of the Stanford Graduate School of Business. Mr. Seawell holds an M.B.A. from StanfordUniversity and a B.A. from Stanford University. Mr. Seawell was chosen to serve on our Board due to his morethan 30 years of experience in technology finance and operations, including having served as the chief financialofficer of two public companies, his experience in the venture capital industry and his experience as a director ofhigh technology companies.
8
PROPOSAL NO. 2
ADVISORY VOTE ON EXECUTIVE COMPENSATION
The Board recognizes the interests our investors have in the compensation of our named executive officers. Inrecognition of that interest and as required by the Dodd-Frank Wall Street Reform and Consumer Protection Actof 2010 (“the Dodd-Frank Act”) and Section 14A of the Exchange Act, we are providing our stockholders withthe opportunity to vote to approve, on an advisory basis, the compensation of our named executive officers asdisclosed in this proxy statement in accordance with the rules of the Securities and Exchange Commission(“SEC”).
The Compensation Committee of the Board periodically reviews the compensation programs for our namedexecutive officers to ensure they achieve the desired goals of aligning our executive compensation structure withour stockholders’ interests and current market practices. As described in detail in the “Compensation Discussionand Analysis” section of this proxy statement, our compensation programs are designed to motivate ourexecutives to create a successful company. We believe that our compensation programs, with its balance ofshort-term incentives (including cash bonus awards) and long-term incentives (including equity awards that vestover four years) reward sustained performance that is aligned with long-term stockholder interests.
This proposal, commonly known as a “say-on-pay” proposal, gives our stockholders the opportunity to expresstheir views on our named executive officers’ compensation as a whole. This vote is not intended to address anyspecific item of compensation or any specific named executive officer, but rather the overall compensation of allof our named executive officers and the philosophy, policies and practices described in this proxy statement.Accordingly, we ask our stockholders to approve, on an advisory basis, the compensation paid to the namedexecutive officers, as disclosed in this proxy statement for the 2015 Annual Meeting pursuant to thecompensation disclosure rules of the SEC, including the compensation tables and narrative discussion, and otherrelated disclosure by casting a non-binding advisory vote “FOR” the following resolution:
“RESOLVED, that the compensation paid to the Company’s named executive officers, as disclosedpursuant to Item 402 of Regulation S-K, including the Compensation Discussion and Analysis,compensation tables and narrative discussion, is hereby APPROVED.”
As an advisory vote, the result will not be binding on the Board or Compensation Committee. The say-on-payvote will, however, provide information to us regarding investor sentiment about our executive compensationphilosophy, policies and practices, which the Compensation Committee will be able to consider whendetermining executive compensation for the remainder of the current fiscal year and beyond. The Board and theCompensation Committee value the opinions of our stockholders and expect to take into account the outcome ofthe vote when considering future executive compensation decisions to the extent they can determine the cause orcauses of any significant negative voting results.
Advisory approval of this proposal requires the vote of the holders of a majority of shares present in person orrepresented by proxy and entitled to vote at the Annual Meeting.
THE BOARD OF DIRECTORS RECOMMENDS
A VOTE IN FAVOR OF PROPOSAL 2.
9
PROPOSAL NO. 3
ADVISORY VOTE ON THE FREQUENCY OF SOLICITATION OF ADVISORY STOCKHOLDER VOTE ON
EXECUTIVE COMPENSATION
The Dodd-Frank Act and Section 14A of the Exchange Act also enable our stockholders to indicate, at least onceevery six years, how frequently we should seek a non-binding vote on the compensation of our named executiveofficers, as disclosed pursuant to the SEC’s compensation disclosure rules, such as Proposal 2 above. By votingon this Proposal 3, stockholders may indicate whether they would prefer a non-binding vote on named executiveofficer compensation once every one, two or three years.
While our compensation strategies are related to both the short-term and longer-term business outcomes,compensation decisions are made annually. An annual advisory vote on named executive officer compensationwill give us more frequent feedback on our compensation decisions and named executive officer compensationprograms. The Board has determined that holding an advisory vote on named executive officer compensationevery year is the most appropriate policy for us at this time, and recommends that stockholders vote for futureadvisory votes on named executive officer compensation to occur each year.
The frequency that receives the highest number of votes cast will be deemed to be the frequency selected by thestockholders. Because this vote is advisory, it will not be binding on the Board. However, the Board andCompensation Committee will consider the outcome of the stockholder vote, along with other relevant factors,but the Board may decide that it is in the best interests of the stockholders that we hold an advisory vote onexecutive compensation more frequently than the option preferred by the stockholders.
Advisory approval of this proposal requires the vote of the holders of a majority of shares present in person orrepresented by proxy and entitled to vote at the Annual Meeting.
THE BOARD OF DIRECTORS RECOMMENDS
A VOTE IN FAVOR OF “ONE YEAR” FOR PROPOSAL 3.
10
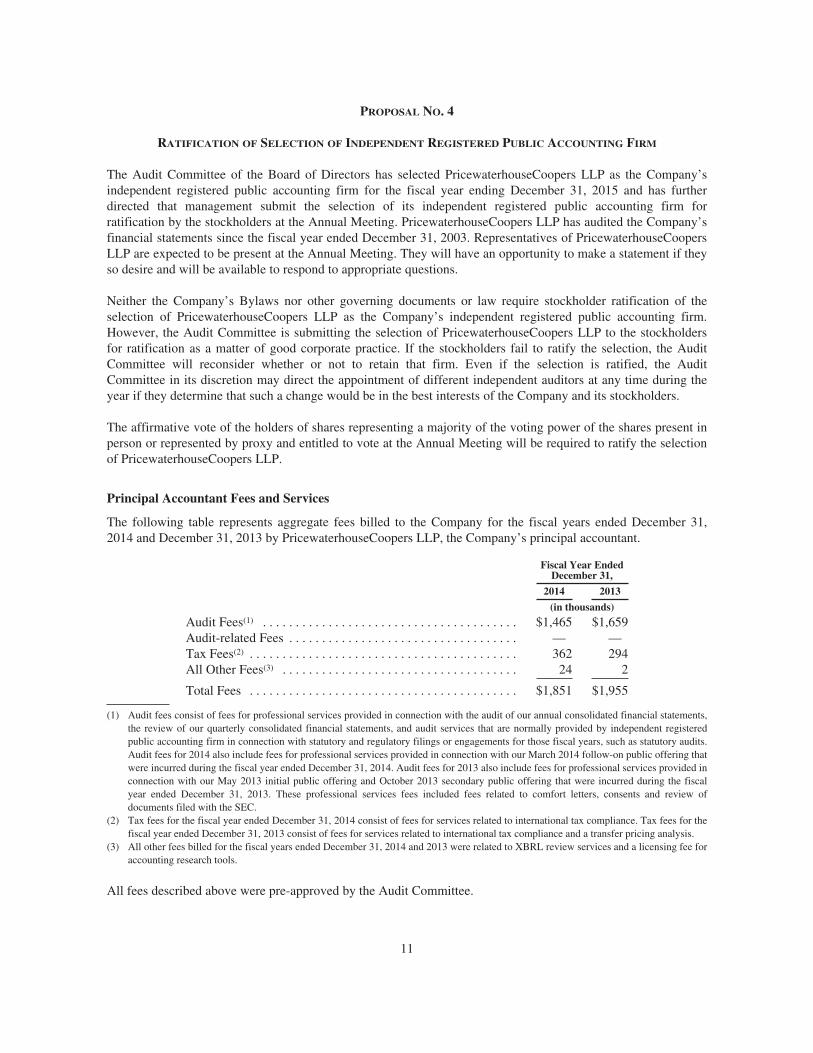
PROPOSAL NO. 4
RATIFICATION OF SELECTION OF INDEPENDENT REGISTERED PUBLIC ACCOUNTING FIRM
The Audit Committee of the Board of Directors has selected PricewaterhouseCoopers LLP as the Company’sindependent registered public accounting firm for the fiscal year ending December 31, 2015 and has furtherdirected that management submit the selection of its independent registered public accounting firm forratification by the stockholders at the Annual Meeting. PricewaterhouseCoopers LLP has audited the Company’sfinancial statements since the fiscal year ended December 31, 2003. Representatives of PricewaterhouseCoopersLLP are expected to be present at the Annual Meeting. They will have an opportunity to make a statement if theyso desire and will be available to respond to appropriate questions.
Neither the Company’s Bylaws nor other governing documents or law require stockholder ratification of theselection of PricewaterhouseCoopers LLP as the Company’s independent registered public accounting firm.However, the Audit Committee is submitting the selection of PricewaterhouseCoopers LLP to the stockholdersfor ratification as a matter of good corporate practice. If the stockholders fail to ratify the selection, the AuditCommittee will reconsider whether or not to retain that firm. Even if the selection is ratified, the AuditCommittee in its discretion may direct the appointment of different independent auditors at any time during theyear if they determine that such a change would be in the best interests of the Company and its stockholders.
The affirmative vote of the holders of shares representing a majority of the voting power of the shares present inperson or represented by proxy and entitled to vote at the Annual Meeting will be required to ratify the selectionof PricewaterhouseCoopers LLP.
Principal Accountant Fees and Services
The following table represents aggregate fees billed to the Company for the fiscal years ended December 31,2014 and December 31, 2013 by PricewaterhouseCoopers LLP, the Company’s principal accountant.
Fiscal Year EndedDecember 31,
2014 2013(in thousands)
Audit Fees(1) . . . . . . . . . . . . . . . . . . . . . . . . . . . . . . . . . . . . . . . $1,465 $1,659Audit-related Fees . . . . . . . . . . . . . . . . . . . . . . . . . . . . . . . . . . . — —Tax Fees(2) . . . . . . . . . . . . . . . . . . . . . . . . . . . . . . . . . . . . . . . . . 362 294All Other Fees(3) . . . . . . . . . . . . . . . . . . . . . . . . . . . . . . . . . . . . 24 2
Total Fees . . . . . . . . . . . . . . . . . . . . . . . . . . . . . . . . . . . . . . . . . $1,851 $1,955
(1) Audit fees consist of fees for professional services provided in connection with the audit of our annual consolidated financial statements,the review of our quarterly consolidated financial statements, and audit services that are normally provided by independent registeredpublic accounting firm in connection with statutory and regulatory filings or engagements for those fiscal years, such as statutory audits.Audit fees for 2014 also include fees for professional services provided in connection with our March 2014 follow-on public offering thatwere incurred during the fiscal year ended December 31, 2014. Audit fees for 2013 also include fees for professional services provided inconnection with our May 2013 initial public offering and October 2013 secondary public offering that were incurred during the fiscalyear ended December 31, 2013. These professional services fees included fees related to comfort letters, consents and review ofdocuments filed with the SEC.
(2) Tax fees for the fiscal year ended December 31, 2014 consist of fees for services related to international tax compliance. Tax fees for thefiscal year ended December 31, 2013 consist of fees for services related to international tax compliance and a transfer pricing analysis.
(3) All other fees billed for the fiscal years ended December 31, 2014 and 2013 were related to XBRL review services and a licensing fee foraccounting research tools.
All fees described above were pre-approved by the Audit Committee.
11
In connection with the audit of the 2014 financial statements, the Company entered into an engagementagreement with PricewaterhouseCoopers LLP that sets forth the terms by which PricewaterhouseCoopers LLPwill perform audit services for the Company. That agreement is subject to alternative dispute resolutionprocedures and an exclusion of punitive damages.
Pre-Approval Policies and Procedures
The Audit Committee has adopted a policy and procedures for the pre-approval of audit and non-audit servicesrendered by the Company’s independent registered public accounting firm, PricewaterhouseCoopers LLP. Thepolicy generally pre-approves specified services in the defined categories of audit services, audit-related servicesand tax services up to specified amounts. Pre-approval may also be given as part of the Audit Committee’sapproval of the scope of the engagement of the independent auditor or on an individual, explicit, case-by-casebasis before the independent auditor is engaged to provide each service. The pre-approval of services has beendelegated to our Audit Committee Chairman up to $100,000, and any such pre-approval is reported to the fullAudit Committee at its next scheduled meeting.
The Audit Committee has determined that the rendering of services other than audit services byPricewaterhouseCoopers LLP is compatible with maintaining the principal accountant’s independence.
THE BOARD OF DIRECTORS RECOMMENDS
A VOTE IN FAVOR OF PROPOSAL NO. 4.
12
INFORMATION REGARDING THE BOARD OF DIRECTORS AND CORPORATE GOVERNANCE
Director Independence
Our Board has undertaken a review of its composition, the composition of its committees and the independenceof each director and nominee for director. Our Board has determined that, other than Mr. Chabot and Drs. Stolteand Hanrahan, by virtue of their positions as Chief Executive Officer, Chief Development Officer and ChiefScientist, respectively, none of our directors or nominees for director has a relationship that would interfere withthe exercise of independent judgment in carrying out the responsibilities of a director and that each is“independent” as that term is defined under the applicable rules and regulations of the SEC and the listingrequirements and rules of the NYSE. Accordingly, a majority of our directors are independent, as required underapplicable NYSE rules. In making this determination, our Board considered the current and prior relationshipsthat each non-employee director has with our company and all other facts and circumstances our Board deemedrelevant in determining their independence, including the beneficial ownership of our capital stock by each non-employee director.
Lead Independent Director
Mr. Sandell currently serves as the Board’s lead independent director, but will cease to serve in that capacitywhen his term expires at the Annual Meeting. Our Board has appointed Mr. McAdam as lead independentdirector, effective at the Annual Meeting. As lead independent director, Mr. McAdam will preside over periodicmeetings of our independent directors, serve as a liaison between our Chairman and the independent directorsand perform such additional duties as our Board may otherwise determine and delegate.
Role of the Board in Risk Oversight
One of the Board’s key functions is informed oversight of the Company’s risk management process. The Boarddoes not have a standing risk management committee, but rather administers this oversight function directlythrough the Board as a whole, as well as through various Board standing committees that address risks inherentin their respective areas of oversight. In particular, our Board is responsible for monitoring and assessingstrategic risk exposure, including a determination of the nature and level of risk appropriate for the Company.Our Audit Committee has the responsibility to consider and discuss our major financial risk exposures and thesteps our management has taken to monitor and control these exposures, including guidelines and policies togovern the process by which risk assessment and management is undertaken. The Audit Committee also monitorscompliance with legal and regulatory requirements, in addition to oversight of the performance of our internalaudit function. Our Nominating and Corporate Governance Committee monitors the effectiveness of ourCorporate Governance Guidelines, including whether they are successful in preventing illegal or improperliability-creating conduct. Our Compensation Committee assesses and monitors whether any of ourcompensation policies and programs has the potential to encourage excessive risk-taking. Typically, the entireBoard meets periodically with senior management responsible for the Company’s risk management, and theapplicable Board committees meet periodically with the employees responsible for risk management in thecommittees’ respective areas of oversight. The Board as a whole and the various standing committees receiveperiodic reports from the head of the Company’s legal and operations groups, as well as incidental reports asmatters may arise. It is the responsibility of the committee chairs to report findings regarding material riskexposures to the Board as quickly as possible.
Meetings of the Board of Directors
The Board met five times during the last fiscal year. Each Board member attended 75% or more of the aggregatenumber of meetings of the Board and of the committees on which he served, held during the portion of the lastfiscal year for which he was a director or committee member.
13
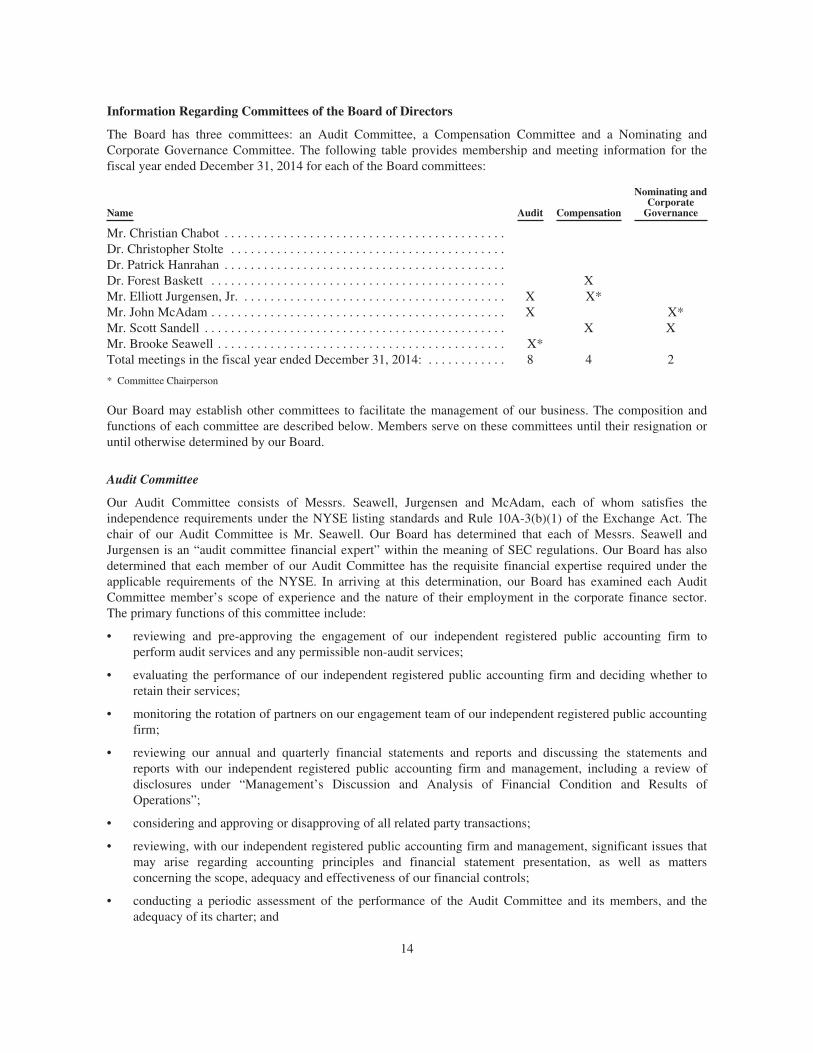
Information Regarding Committees of the Board of Directors
The Board has three committees: an Audit Committee, a Compensation Committee and a Nominating andCorporate Governance Committee. The following table provides membership and meeting information for thefiscal year ended December 31, 2014 for each of the Board committees:
Name Audit Compensation
Nominating andCorporate
Governance
Mr. Christian Chabot . . . . . . . . . . . . . . . . . . . . . . . . . . . . . . . . . . . . . . . . . . .Dr. Christopher Stolte . . . . . . . . . . . . . . . . . . . . . . . . . . . . . . . . . . . . . . . . . .Dr. Patrick Hanrahan . . . . . . . . . . . . . . . . . . . . . . . . . . . . . . . . . . . . . . . . . . .Dr. Forest Baskett . . . . . . . . . . . . . . . . . . . . . . . . . . . . . . . . . . . . . . . . . . . . . XMr. Elliott Jurgensen, Jr. . . . . . . . . . . . . . . . . . . . . . . . . . . . . . . . . . . . . . . . . X X*Mr. John McAdam . . . . . . . . . . . . . . . . . . . . . . . . . . . . . . . . . . . . . . . . . . . . . X X*Mr. Scott Sandell . . . . . . . . . . . . . . . . . . . . . . . . . . . . . . . . . . . . . . . . . . . . . . X XMr. Brooke Seawell . . . . . . . . . . . . . . . . . . . . . . . . . . . . . . . . . . . . . . . . . . . . X*Total meetings in the fiscal year ended December 31, 2014: . . . . . . . . . . . . 8 4 2
* Committee Chairperson
Our Board may establish other committees to facilitate the management of our business. The composition andfunctions of each committee are described below. Members serve on these committees until their resignation oruntil otherwise determined by our Board.
Audit Committee
Our Audit Committee consists of Messrs. Seawell, Jurgensen and McAdam, each of whom satisfies theindependence requirements under the NYSE listing standards and Rule 10A-3(b)(1) of the Exchange Act. Thechair of our Audit Committee is Mr. Seawell. Our Board has determined that each of Messrs. Seawell andJurgensen is an “audit committee financial expert” within the meaning of SEC regulations. Our Board has alsodetermined that each member of our Audit Committee has the requisite financial expertise required under theapplicable requirements of the NYSE. In arriving at this determination, our Board has examined each AuditCommittee member’s scope of experience and the nature of their employment in the corporate finance sector.The primary functions of this committee include:
• reviewing and pre-approving the engagement of our independent registered public accounting firm toperform audit services and any permissible non-audit services;
• evaluating the performance of our independent registered public accounting firm and deciding whether toretain their services;
• monitoring the rotation of partners on our engagement team of our independent registered public accountingfirm;
• reviewing our annual and quarterly financial statements and reports and discussing the statements andreports with our independent registered public accounting firm and management, including a review ofdisclosures under “Management’s Discussion and Analysis of Financial Condition and Results ofOperations”;
• considering and approving or disapproving of all related party transactions;
• reviewing, with our independent registered public accounting firm and management, significant issues thatmay arise regarding accounting principles and financial statement presentation, as well as mattersconcerning the scope, adequacy and effectiveness of our financial controls;
• conducting a periodic assessment of the performance of the Audit Committee and its members, and theadequacy of its charter; and
14
• establishing procedures for the receipt, retention and treatment of complaints received by us regardingfinancial controls, accounting or auditing matters.
The Board has adopted a written Audit Committee charter that is available to stockholders on the Company’swebsite at investors.tableau.com/corporate-governance.
Report of the Audit Committee(1)
The Audit Committee has reviewed and discussed the audited financial statements for the fiscal year endedDecember 31, 2014 with management of the Company. The Audit Committee has discussed with the independentregistered public accounting firm the matters required to be discussed by Auditing Standard No. 16,Communications with Audit Committees, as adopted by the Public Company Accounting Oversight Board(“PCAOB”). The Audit Committee has also received the written disclosures and the letter from the independentregistered public accounting firm required by applicable requirements of the PCAOB regarding the independentaccountants’ communications with the Audit Committee concerning independence, and has discussed with theindependent registered public accounting firm the accounting firm’s independence. Based on the foregoing, theAudit Committee of the Board of Directors has recommended to the Board of Directors that the audited financialstatements be included in the Company’s Annual Report on Form 10-K for the fiscal year ended December 31,2014.
AUDIT COMMITTEE OF THE BOARD OF DIRECTORS
Mr. Brooke SeawellMr. Elliott Jurgensen, Jr.Mr. John McAdam
(1) The material in this report is not “soliciting material,” is not deemed “filed” with the SEC and is not to be incorporated by reference inany filing of the Company under the Securities Act of 1933, as amended (the “Securities Act”) or the Exchange Act, whether madebefore or after the date hereof and irrespective of any general incorporation language in any such filing.
Compensation Committee
Our Compensation Committee currently consists of Mr. Jurgensen, Dr. Baskett and Mr. Sandell, each of whomour Board has determined to be independent under the NYSE listing standards and the rules and regulations ofthe SEC, a “non-employee director” as defined in Rule 16b-3 promulgated under the Exchange Act and an“outside director” as that term is defined in Section 162(m) of the Internal Revenue Code of 1986, as amended.The chair of our Compensation Committee is Mr. Jurgensen. If elected, the Board intends to appointMr. Bosworth to the Compensation Committee. The primary functions of this committee include:
• determining the compensation and other terms of employment of our chief executive officer and our otherexecutive officers and reviewing and approving corporate performance goals and objectives relevant to suchcompensation;
• reviewing and recommending to our Board the compensation of our directors;
• evaluating, adopting and administering the equity incentive plans, compensation plans and similar programsadvisable for us, as well as modification or termination of existing plans and programs;
• establishing policies with respect to equity compensation arrangements;
• reviewing with management our disclosures under the caption “Compensation Discussion and Analysis”and recommending to our Board its inclusion in our periodic reports to be filed with the SEC; and
• reviewing and evaluating, periodically, the performance of the Compensation Committee and the adequacyof its charter.
15
The Board has adopted a written Compensation Committee charter that is available to stockholders on theCompany’s website at investors.tableau.com/corporate-governance.
Additional information regarding the Compensation Committee’s processes and procedures, including the role ofcompensation consultants in evaluating the amount or form of executive and director compensation, can be foundin the “Compensation Discussion and Analysis” section of this proxy statement.
Compensation Committee Interlocks and Insider Participation
None of the members of the Compensation Committee is currently or has been at any time one of our officers oremployees. None of our executive officers currently serves, or has served during the last year, as a member of theboard of directors or Compensation Committee of any entity that has one or more executive officers serving as amember of our Board or Compensation Committee.
Nominating and Corporate Governance Committee
Our Nominating and Corporate Governance Committee consists of Messrs. McAdam and Sandell, each of whomour Board has determined to be independent under the NYSE listing standards. If elected, the Board intends toappoint Mr. Bosworth to the Nominating and Corporate Governance Committee. The chair of our Nominatingand Corporate Governance Committee is Mr. McAdam. The primary functions of this committee include:
• reviewing periodically and evaluating director performance on our Board and its applicable committees, andrecommending to our Board and management areas for improvement;
• reviewing and recommending to our Board any amendments to our corporate governance policies; and
• reviewing and assessing, periodically, the performance of the Nominating and Corporate GovernanceCommittee and the adequacy of its charter.
The Board has adopted a written Nominating and Corporate Governance Committee charter that is available tostockholders on the Company’s website at investors.tableau.com/corporate-governance.
The Nominating and Corporate Governance Committee believes that candidates for director should have certainminimum qualifications, including the ability to read and understand basic financial statements, being over21 years of age and having the highest personal integrity and ethics. The Nominating and Corporate GovernanceCommittee also intends to consider such factors as possessing relevant expertise upon which to be able to offeradvice and guidance to management, having sufficient time to devote to the affairs of the Company,demonstrated excellence in his or her field, having the ability to exercise sound business judgment and having thecommitment to rigorously represent the long-term interests of the Company’s stockholders. However, theNominating and Corporate Governance Committee retains the right to modify these qualifications from time totime. Candidates for director nominees are reviewed in the context of the current composition of the Board, theoperating requirements of the Company and the long-term interests of stockholders. In conducting thisassessment, the Nominating and Corporate Governance Committee typically considers diversity, age, skills andsuch other factors as it deems appropriate, given the current needs of the Board and the Company, to maintain abalance of knowledge, experience and capability. In the case of incumbent directors whose terms of office are setto expire, the Nominating and Corporate Governance Committee reviews these directors’ overall service to theCompany during their terms, including the number of meetings attended, level of participation, quality ofperformance and any other relationships and transactions that might impair the directors’ independence. In thecase of new director candidates, the Nominating and Corporate Governance Committee also determines whetherthe nominee is independent for NYSE purposes, which determination is based upon applicable NYSE listingstandards, applicable SEC rules and regulations and the advice of counsel, if necessary. The Nominating andCorporate Governance Committee may use its network of contacts to compile a list of potential candidates, butmay also engage, if it deems appropriate, a professional search firm. The Nominating and Corporate GovernanceCommittee conducts any appropriate and necessary inquiries into the backgrounds and qualifications of possible
16
candidates after considering the function and needs of the Board. The Nominating and Corporate GovernanceCommittee meets to discuss and consider the candidates’ qualifications and then selects a nominee forrecommendation to the Board.
The Nominating and Corporate Governance Committee will consider director candidates recommended bystockholders. The Nominating and Corporate Governance Committee does not intend to alter the manner in whichit evaluates candidates, including the minimum criteria set forth above, based on whether or not the candidate wasrecommended by a stockholder. Stockholders who wish to recommend individuals for consideration by theNominating and Corporate Governance Committee to become nominees for election to the Board may do so bydelivering a written recommendation to the Nominating and Corporate Governance Committee at the followingaddress: 837 North 34th Street, Suite 200, Seattle, Washington 98103. Submissions must include the full name ofthe proposed nominee, a description of the proposed nominee’s business experience for at least the previous fiveyears, complete biographical information, a description of the proposed nominee’s qualifications as a director anda representation that the nominating stockholder is a beneficial or record holder of the Company’s stock and hasbeen a holder for at least one year. Any such submission must be accompanied by the written consent of theproposed nominee to be named as a nominee and to serve as a director if elected.
Stockholder Communications With the Board of Directors
Our Board has adopted a formal process by which stockholders may communicate with the Board or any of itsdirectors. This information is available on the Company’s website at investors.tableau.com/corporate-governance. In addition, any interested person may communicate directly with the lead independent director orthe independent or non-management directors. Persons interested in communicating directly with theindependent or non-management directors regarding their concerns or issues are referred to the procedures forsuch communications on the Company’s website at investors.tableau.com/corporate-governance.
Code of Business Conduct and Ethics
Our Board has adopted a Code of Business Conduct and Ethics that applies to all officers, directors andemployees. The Code of Business Conduct and Ethics is available on the Company’s website atinvestors.tableau.com/corporate-governance. We intend to disclose any amendments to this code, or any waiversof its requirements, on our website to the extent required by the applicable rules and exchange requirements.
Corporate Governance Guidelines
The Board has adopted Corporate Governance Guidelines to assure that the Board will have the necessaryauthority and practices in place to review and evaluate the Company’s business operations as needed and to makedecisions that are independent of the Company’s management. The guidelines are also intended to align theinterests of directors and management with those of the Company’s stockholders. The Corporate GovernanceGuidelines set forth the practices the Board intends to follow with respect to board composition and selection,board meetings and involvement of senior management, Chief Executive Officer performance evaluation andsuccession planning, and board committees and compensation. The Corporate Governance Guidelines areavailable on the Company’s website at investors.tableau.com/corporate-governance.
Other Policies
Our insider trading policy prohibits our employees and directors from engaging in transactions in publicly-tradedoptions, such as puts and calls, and other derivative securities with respect to the Company’s securities. Thisprohibition extends to any hedging, inherently speculative transaction or similar transaction designed to decreasethe risks associated with holding Company securities. In addition, our directors and executive officers and anyperson required to comply with the blackout periods or pre-clearance requirements under our insider tradingpolicy are prohibited from pledging Company securities as collateral for loans, and may not hold Companysecurities in margin accounts.
17
SECURITY OWNERSHIP OF CERTAIN BENEFICIAL OWNERS AND MANAGEMENT
The following table sets forth, as of March 18, 2015, information regarding beneficial ownership of our capitalstock by:
• each person, or group of affiliated persons, known by us to beneficially own more than 5% of our Class Acommon stock or Class B common stock;
• each of our named executive officers;
• each of our directors and nominees for director; and
• all of our current executive officers and directors as a group.
Beneficial ownership is determined according to the rules of the SEC and generally means that a person hasbeneficial ownership of a security if he, she or it possesses sole or shared voting or investment power of thatsecurity, or has the right to acquire beneficial ownership of that security within 60 days. Except as indicated bythe footnotes below, we believe, based on the information furnished to us, that the persons named in the tablebelow have or will have sole voting and investment power with respect to all shares of Class A common stockand Class B common stock shown that they beneficially own, subject to community property laws whereapplicable.
Our calculation of the percentage of beneficial ownership is based on 49,866,678 shares of our Class A commonstock and 21,259,853 shares of our Class B common stock outstanding as of March 18, 2015. Common stocksubject to stock options currently exercisable or exercisable within 60 days of March 18, 2015, is deemed to beoutstanding for computing the percentage ownership of the person holding these options and the percentageownership of any group of which the holder is a member but is not deemed outstanding for computing thepercentage of any other person.
The table is based upon information supplied by officers, directors and principal stockholders and Schedules 13Dand 13G filed with the SEC. The address of each executive officer and director, unless otherwise indicated byfootnote, is c/o Tableau Software, Inc., 837 North 34th Street, Suite 200, Seattle, Washington 98103.
Class A Common Stock Class B Common Stock % ofTotal
VotingPower†Name of Beneficial Owner
Number ofShares % of Total
Number ofShares % of Total
Named Executive Officers, Directors and Nomineesfor Director:
Christian Chabot(1) . . . . . . . . . . . . . . . . . . . . . . . . . . . . . 1,410 * 6,477,177 29.72% 24.19%Christopher Stolte(1) . . . . . . . . . . . . . . . . . . . . . . . . . . . . 1,410 * 5,599,052 25.69% 20.91%Thomas Walker(2) . . . . . . . . . . . . . . . . . . . . . . . . . . . . . 44,405 * 194,874 * *Kelly Wright(3) . . . . . . . . . . . . . . . . . . . . . . . . . . . . . . . . 177,443 * 265,938 1.24% 1.07%Elissa Fink(4) . . . . . . . . . . . . . . . . . . . . . . . . . . . . . . . . . — — 297,179 1.39% 1.13%Keenan Conder(5) . . . . . . . . . . . . . . . . . . . . . . . . . . . . . . 3,750 * 69,729 * *Forest Baskett(6)(7) . . . . . . . . . . . . . . . . . . . . . . . . . . . . . 43,178 * 1,989,907 9.35% 7.59%Billy Bosworth . . . . . . . . . . . . . . . . . . . . . . . . . . . . . . . . — — 1,000 * *Patrick Hanrahan . . . . . . . . . . . . . . . . . . . . . . . . . . . . . . — — 7,888,278 37.10% 30.05%Elliott Jurgensen, Jr.(8) . . . . . . . . . . . . . . . . . . . . . . . . . . 2,662 * 34,500 * *John McAdam(9) . . . . . . . . . . . . . . . . . . . . . . . . . . . . . . 3,182 * 36,250 * *Scott Sandell(6)(10) . . . . . . . . . . . . . . . . . . . . . . . . . . . . . . 55,705 * 1,989,907 9.35% 7.60%Brooke Seawell(11) . . . . . . . . . . . . . . . . . . . . . . . . . . . . . 796 * 17,500 * *All executive officers and directors as a group
(13 persons)(12) . . . . . . . . . . . . . . . . . . . . . . . . . . . . . . 333,941 * 22,893,051 99.81% 82.10%
Other 5% Stockholders:Vanguard Group Inc.(13) . . . . . . . . . . . . . . . . . . . . . . . . . 2,644,169 5.30% — — *
18
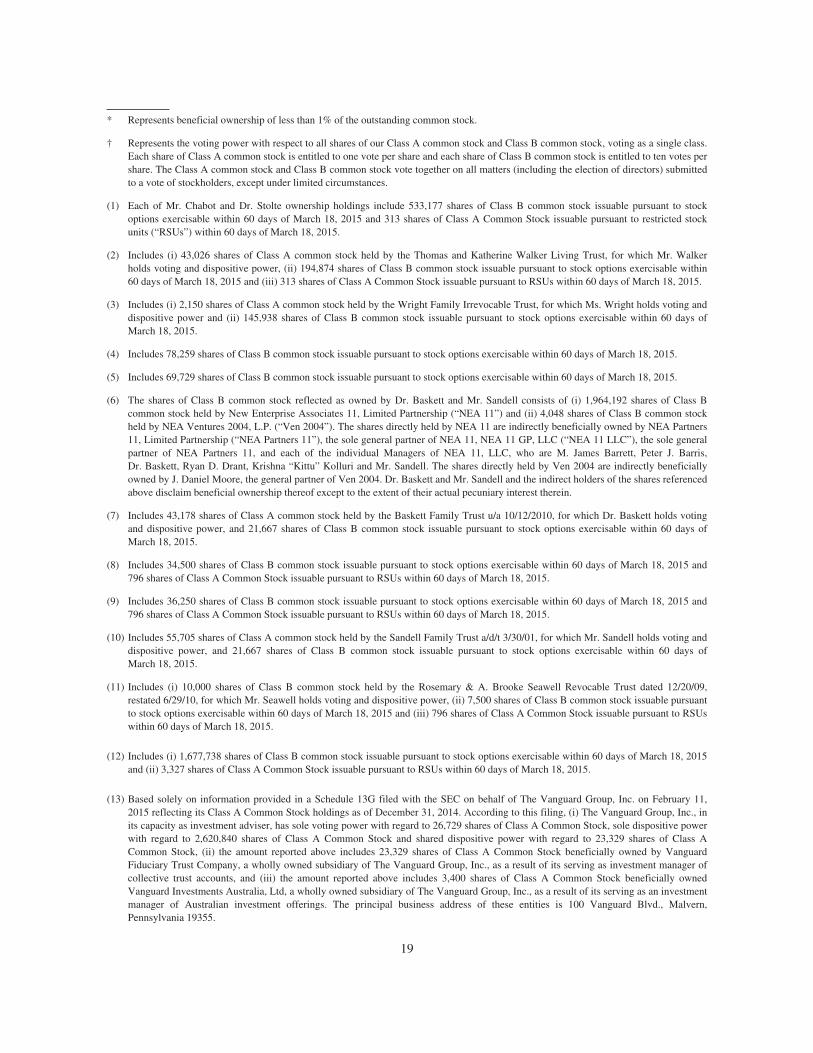
* Represents beneficial ownership of less than 1% of the outstanding common stock.
† Represents the voting power with respect to all shares of our Class A common stock and Class B common stock, voting as a single class.Each share of Class A common stock is entitled to one vote per share and each share of Class B common stock is entitled to ten votes pershare. The Class A common stock and Class B common stock vote together on all matters (including the election of directors) submittedto a vote of stockholders, except under limited circumstances.
(1) Each of Mr. Chabot and Dr. Stolte ownership holdings include 533,177 shares of Class B common stock issuable pursuant to stockoptions exercisable within 60 days of March 18, 2015 and 313 shares of Class A Common Stock issuable pursuant to restricted stockunits (“RSUs”) within 60 days of March 18, 2015.
(2) Includes (i) 43,026 shares of Class A common stock held by the Thomas and Katherine Walker Living Trust, for which Mr. Walkerholds voting and dispositive power, (ii) 194,874 shares of Class B common stock issuable pursuant to stock options exercisable within60 days of March 18, 2015 and (iii) 313 shares of Class A Common Stock issuable pursuant to RSUs within 60 days of March 18, 2015.
(3) Includes (i) 2,150 shares of Class A common stock held by the Wright Family Irrevocable Trust, for which Ms. Wright holds voting anddispositive power and (ii) 145,938 shares of Class B common stock issuable pursuant to stock options exercisable within 60 days ofMarch 18, 2015.
(4) Includes 78,259 shares of Class B common stock issuable pursuant to stock options exercisable within 60 days of March 18, 2015.
(5) Includes 69,729 shares of Class B common stock issuable pursuant to stock options exercisable within 60 days of March 18, 2015.
(6) The shares of Class B common stock reflected as owned by Dr. Baskett and Mr. Sandell consists of (i) 1,964,192 shares of Class Bcommon stock held by New Enterprise Associates 11, Limited Partnership (“NEA 11”) and (ii) 4,048 shares of Class B common stockheld by NEA Ventures 2004, L.P. (“Ven 2004”). The shares directly held by NEA 11 are indirectly beneficially owned by NEA Partners11, Limited Partnership (“NEA Partners 11”), the sole general partner of NEA 11, NEA 11 GP, LLC (“NEA 11 LLC”), the sole generalpartner of NEA Partners 11, and each of the individual Managers of NEA 11, LLC, who are M. James Barrett, Peter J. Barris,Dr. Baskett, Ryan D. Drant, Krishna “Kittu” Kolluri and Mr. Sandell. The shares directly held by Ven 2004 are indirectly beneficiallyowned by J. Daniel Moore, the general partner of Ven 2004. Dr. Baskett and Mr. Sandell and the indirect holders of the shares referencedabove disclaim beneficial ownership thereof except to the extent of their actual pecuniary interest therein.
(7) Includes 43,178 shares of Class A common stock held by the Baskett Family Trust u/a 10/12/2010, for which Dr. Baskett holds votingand dispositive power, and 21,667 shares of Class B common stock issuable pursuant to stock options exercisable within 60 days ofMarch 18, 2015.
(8) Includes 34,500 shares of Class B common stock issuable pursuant to stock options exercisable within 60 days of March 18, 2015 and796 shares of Class A Common Stock issuable pursuant to RSUs within 60 days of March 18, 2015.
(9) Includes 36,250 shares of Class B common stock issuable pursuant to stock options exercisable within 60 days of March 18, 2015 and796 shares of Class A Common Stock issuable pursuant to RSUs within 60 days of March 18, 2015.
(10) Includes 55,705 shares of Class A common stock held by the Sandell Family Trust a/d/t 3/30/01, for which Mr. Sandell holds voting anddispositive power, and 21,667 shares of Class B common stock issuable pursuant to stock options exercisable within 60 days ofMarch 18, 2015.
(11) Includes (i) 10,000 shares of Class B common stock held by the Rosemary & A. Brooke Seawell Revocable Trust dated 12/20/09,restated 6/29/10, for which Mr. Seawell holds voting and dispositive power, (ii) 7,500 shares of Class B common stock issuable pursuantto stock options exercisable within 60 days of March 18, 2015 and (iii) 796 shares of Class A Common Stock issuable pursuant to RSUswithin 60 days of March 18, 2015.
(12) Includes (i) 1,677,738 shares of Class B common stock issuable pursuant to stock options exercisable within 60 days of March 18, 2015and (ii) 3,327 shares of Class A Common Stock issuable pursuant to RSUs within 60 days of March 18, 2015.
(13) Based solely on information provided in a Schedule 13G filed with the SEC on behalf of The Vanguard Group, Inc. on February 11,2015 reflecting its Class A Common Stock holdings as of December 31, 2014. According to this filing, (i) The Vanguard Group, Inc., inits capacity as investment adviser, has sole voting power with regard to 26,729 shares of Class A Common Stock, sole dispositive powerwith regard to 2,620,840 shares of Class A Common Stock and shared dispositive power with regard to 23,329 shares of Class ACommon Stock, (ii) the amount reported above includes 23,329 shares of Class A Common Stock beneficially owned by VanguardFiduciary Trust Company, a wholly owned subsidiary of The Vanguard Group, Inc., as a result of its serving as investment manager ofcollective trust accounts, and (iii) the amount reported above includes 3,400 shares of Class A Common Stock beneficially ownedVanguard Investments Australia, Ltd, a wholly owned subsidiary of The Vanguard Group, Inc., as a result of its serving as an investmentmanager of Australian investment offerings. The principal business address of these entities is 100 Vanguard Blvd., Malvern,Pennsylvania 19355.
19
SECTION 16(A) BENEFICIAL OWNERSHIP REPORTING COMPLIANCE
Section 16(a) of the Exchange Act requires the Company’s directors and executive officers, and persons whoown more than ten percent of a registered class of the Company’s equity securities, to file with the SEC initialreports of ownership and reports of changes in ownership of common stock and other equity securities of theCompany. Officers, directors and greater than ten percent stockholders are required by SEC regulation to furnishthe Company with copies of all Section 16(a) forms they file.
To the Company’s knowledge, based solely on a review of the copies of such reports furnished to the Companyand written representations that no other reports were required, during the fiscal year ended December 31, 2014,all Section 16(a) filing requirements applicable to its officers, directors and greater than ten percent beneficialowners were complied with.
20
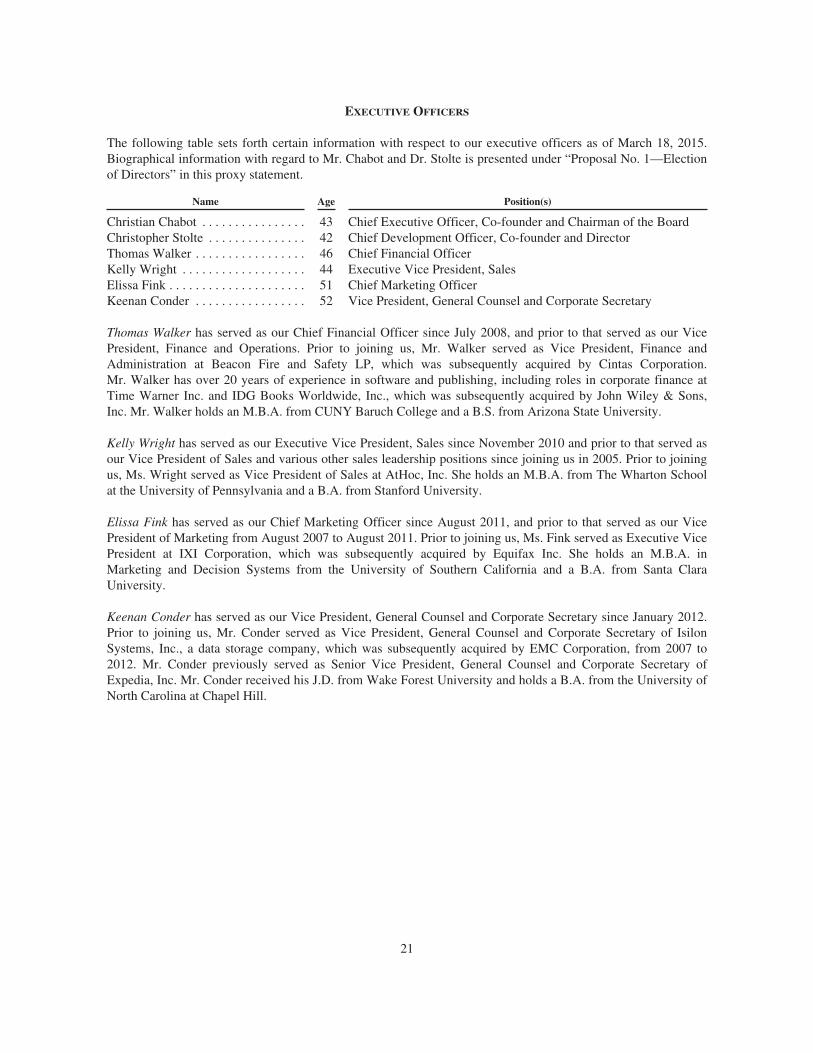
EXECUTIVE OFFICERS
The following table sets forth certain information with respect to our executive officers as of March 18, 2015.Biographical information with regard to Mr. Chabot and Dr. Stolte is presented under “Proposal No. 1—Electionof Directors” in this proxy statement.
Name Age Position(s)
Christian Chabot . . . . . . . . . . . . . . . . 43 Chief Executive Officer, Co-founder and Chairman of the BoardChristopher Stolte . . . . . . . . . . . . . . . 42 Chief Development Officer, Co-founder and DirectorThomas Walker . . . . . . . . . . . . . . . . . 46 Chief Financial OfficerKelly Wright . . . . . . . . . . . . . . . . . . . 44 Executive Vice President, SalesElissa Fink . . . . . . . . . . . . . . . . . . . . . 51 Chief Marketing OfficerKeenan Conder . . . . . . . . . . . . . . . . . 52 Vice President, General Counsel and Corporate Secretary
Thomas Walker has served as our Chief Financial Officer since July 2008, and prior to that served as our VicePresident, Finance and Operations. Prior to joining us, Mr. Walker served as Vice President, Finance andAdministration at Beacon Fire and Safety LP, which was subsequently acquired by Cintas Corporation.Mr. Walker has over 20 years of experience in software and publishing, including roles in corporate finance atTime Warner Inc. and IDG Books Worldwide, Inc., which was subsequently acquired by John Wiley & Sons,Inc. Mr. Walker holds an M.B.A. from CUNY Baruch College and a B.S. from Arizona State University.
Kelly Wright has served as our Executive Vice President, Sales since November 2010 and prior to that served asour Vice President of Sales and various other sales leadership positions since joining us in 2005. Prior to joiningus, Ms. Wright served as Vice President of Sales at AtHoc, Inc. She holds an M.B.A. from The Wharton Schoolat the University of Pennsylvania and a B.A. from Stanford University.
Elissa Fink has served as our Chief Marketing Officer since August 2011, and prior to that served as our VicePresident of Marketing from August 2007 to August 2011. Prior to joining us, Ms. Fink served as Executive VicePresident at IXI Corporation, which was subsequently acquired by Equifax Inc. She holds an M.B.A. inMarketing and Decision Systems from the University of Southern California and a B.A. from Santa ClaraUniversity.
Keenan Conder has served as our Vice President, General Counsel and Corporate Secretary since January 2012.Prior to joining us, Mr. Conder served as Vice President, General Counsel and Corporate Secretary of IsilonSystems, Inc., a data storage company, which was subsequently acquired by EMC Corporation, from 2007 to2012. Mr. Conder previously served as Senior Vice President, General Counsel and Corporate Secretary ofExpedia, Inc. Mr. Conder received his J.D. from Wake Forest University and holds a B.A. from the University ofNorth Carolina at Chapel Hill.
21
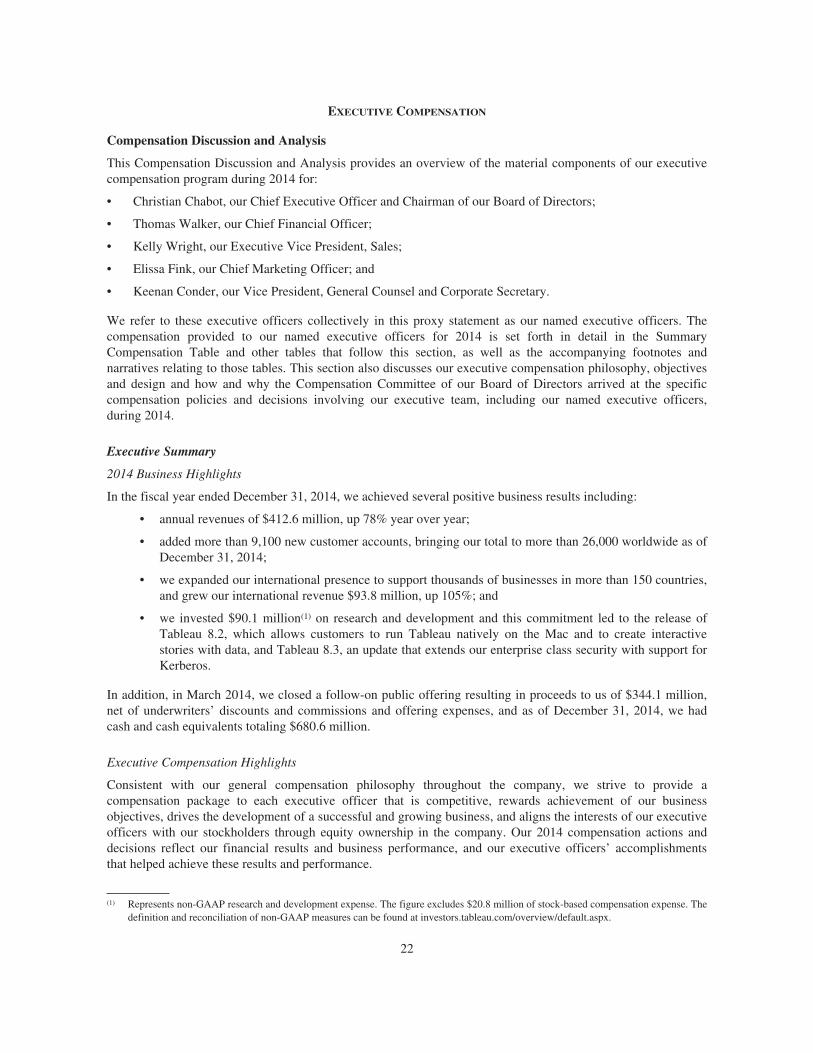
EXECUTIVE COMPENSATION
Compensation Discussion and Analysis
This Compensation Discussion and Analysis provides an overview of the material components of our executivecompensation program during 2014 for:
• Christian Chabot, our Chief Executive Officer and Chairman of our Board of Directors;
• Thomas Walker, our Chief Financial Officer;
• Kelly Wright, our Executive Vice President, Sales;
• Elissa Fink, our Chief Marketing Officer; and
• Keenan Conder, our Vice President, General Counsel and Corporate Secretary.
We refer to these executive officers collectively in this proxy statement as our named executive officers. Thecompensation provided to our named executive officers for 2014 is set forth in detail in the SummaryCompensation Table and other tables that follow this section, as well as the accompanying footnotes andnarratives relating to those tables. This section also discusses our executive compensation philosophy, objectivesand design and how and why the Compensation Committee of our Board of Directors arrived at the specificcompensation policies and decisions involving our executive team, including our named executive officers,during 2014.
Executive Summary
2014 Business Highlights
In the fiscal year ended December 31, 2014, we achieved several positive business results including:
• annual revenues of $412.6 million, up 78% year over year;
• added more than 9,100 new customer accounts, bringing our total to more than 26,000 worldwide as ofDecember 31, 2014;
• we expanded our international presence to support thousands of businesses in more than 150 countries,and grew our international revenue $93.8 million, up 105%; and
• we invested $90.1 million(1) on research and development and this commitment led to the release ofTableau 8.2, which allows customers to run Tableau natively on the Mac and to create interactivestories with data, and Tableau 8.3, an update that extends our enterprise class security with support forKerberos.
In addition, in March 2014, we closed a follow-on public offering resulting in proceeds to us of $344.1 million,net of underwriters’ discounts and commissions and offering expenses, and as of December 31, 2014, we hadcash and cash equivalents totaling $680.6 million.
Executive Compensation Highlights
Consistent with our general compensation philosophy throughout the company, we strive to provide acompensation package to each executive officer that is competitive, rewards achievement of our businessobjectives, drives the development of a successful and growing business, and aligns the interests of our executiveofficers with our stockholders through equity ownership in the company. Our 2014 compensation actions anddecisions reflect our financial results and business performance, and our executive officers’ accomplishmentsthat helped achieve these results and performance.
(1) Represents non-GAAP research and development expense. The figure excludes $20.8 million of stock-based compensation expense. Thedefinition and reconciliation of non-GAAP measures can be found at investors.tableau.com/overview/default.aspx.
22
The Compensation Committee took the following actions in 2014 with respect to the compensation of our namedexecutive officers:
• We identified a peer group of comparable public companies, selected with the assistance of an independentcompensation consultant, to inform our decision making process and assist in ensuring that our executivecompensation program is positioned to be competitive and aligned with our business objectives at this stageof the company’s growth;
• As a result of our overall review, including comparisons against our peer group, we increased the base salaryfor all of our named executive officers, and target cash incentive compensation opportunities for our namedexecutive officers other than for our Chief Executive Officer, who, along with our co-founder and ChiefDevelopment Officer, have historically elected to not participate in any annual bonus opportunities; and
• We approved equity awards to our named executive officers at levels that met competitive market concerns,satisfied our retention objectives and rewarded individual performance.
We endeavor to maintain good governance standards in our executive compensation policies and practices. TheCompensation Committee evaluates our executive compensation program annually to ensure that it is consistentwith our short-term and long-term goals given the dynamic nature of our business and the market in which wecompete for executive talent. The following policies and practices were either adopted or in effect during 2014:
• Independent Compensation Committee. The Compensation Committee consists solely of independentdirectors and is responsible for making all executive compensation decisions.
• Annual Executive Compensation Review. The Compensation Committee conducts an annual review andapproval of our compensation strategy, including a review of our compensation peer group and a review ofour compensation-related risk profile.
• Compensation At-Risk. Our executive compensation program is designed so that a significant portion ofcompensation is “at risk” based on corporate performance and is equity-based to align the interests of ournamed executive officers and stockholders. Equity awards granted to our executive officers vest or areearned over four-year periods, consistent with current market practice and our retention objectives.
• No “Single-Trigger” Change-in-Control Arrangements. Our change-in-control payments and benefits forexecutive officers are reasonable and are based on a “double trigger”—that is, each named executive officeris eligible to receive payments and benefits in connection with a change in control of Tableau only if theemployment of such named executive officer terminates without cause or for good reason on or within aspecified period after the change in control.
• No Retirement Benefits. We do not provide or promise post-termination retirement- or pension-type non-cash benefits for our executive officers that are not available to our employees generally.
• Restrictions on Transactions in Our Securities. Our insider trading policy prohibits our employees fromconducting, among other things, short sales, hedging of stock ownership positions and transactions inderivative securities relating to our capital stock.
Executive Compensation Philosophy, Objectives and Design
The market opportunity for our products is highly competitive and subject to rapidly changing technology andevolving standards, and we expect competition among companies in this broad market sector to continue toincrease. To grow our business successfully in this dynamic environment, we must continually develop andenhance our products to stay ahead of customer needs and challenges. Our ability to compete and succeed isdirectly correlated to our ability to recruit, incentivize and retain skilled teams in research and development,sales, marketing, operations, and other business professionals. We also face intense competition both within thesoftware industry and from other technology companies for highly qualified personnel. Our compensationphilosophy is designed to establish and maintain a compensation program that attracts and rewards talentedindividuals who possess the skills necessary to create long-term value for our stockholders, expand our businessand assist in the achievement of our strategic goals.
23
The key elements of our philosophy include the following:
• Company Ownership. We believe that equity ownership in Tableau by employees including our executiveofficers is a critical retention tool, and equity awards also emphasize long-term results and align the interestsof our employees, executive officers and stockholders.
• Pay for Performance. Our executive compensation program is weighted towards at risk, performance-basedcompensation. A significant portion of our named executive officers’ compensation is at risk and dependentupon our company’s performance or an increase in the market price of Tableau’s Class A common stock.
• Fair, Flexible and Results-Oriented. We design our compensation structure to reward results and to driveexcellence and consistency across our departmental organizations – development, sales, marketing andoperations. All named executive officers (other than our Chief Executive Officer and our Executive VicePresident, Sales) participate in the same broad-based incentive bonus plan as our other non-sales employees,and our Executive Vice President, Sales participates in the same commission plan as other sales employees.We also offer discretionary bonus opportunities to our non-sales named executive officers (other than ourChief Executive Officer) to reward departmental and individual performance.
Our executive compensation program has been heavily weighted towards equity. Our Compensation Committeedetermined that compensation in the form of equity helps to align our executives with the long-term interests ofour stockholders by driving achievement of our strategic and financial goals. Prior to our becoming a publiccompany in May 2013, our equity compensation program was largely in the form of stock option grants.Following our initial public offering, we shifted to the use of restricted stock units (“RSUs”) settled in shares ofour Class A common stock as our primary equity vehicle for all employees including our named executiveofficers. We believe that RSUs can align the interests of employees with stockholders and provide a longer-termfocus through a multi-year vesting schedule, while managing dilution to existing investors and providing greatertransparency and predictability to employees in the value of their compensation.
To maintain a competitive compensation program, we have also offered cash compensation in the form of basesalaries and discretionary annual cash bonuses and commissions. All non-sales employees, including our non-sales named executive officers (other than Christian Chabot, our Chief Executive Officer, who historically hasnot participated), are eligible to receive a target cash bonus under our annual incentive bonus plan equal to 10%of their base salary based on achievement of corporate financial goals. In addition, our non-sales namedexecutive officers are eligible to receive discretionary cash bonuses if certain threshold corporate financial goalsare achieved, and where the actual amount of the bonus will be determined based on the achievement ofsubjective departmental and individual performance criteria. Our sales professionals earn commissions based onachievement of quotas in keeping with market practices to promote revenue growth.
Compensation Decision Process
Before our initial public offering in May 2013, compensation decisions for our named executive officers weredetermined by our Board of Directors (including our co-founder, Chairman and Chief Executive Officer and ourco-founder and Chief Development Officer), in consultation with management. At the beginning of each fiscalyear, recommendations from management were made to our Chief Executive Officer and Chief DevelopmentOfficer, who then made recommendations to the Board of Directors on compensation for executive officers(other than themselves) based on their evaluation of such executive officer’s performance relative to expectationsand to the performance of our other employees. Our Chief Executive Officer’s and Chief Development Officer’scompensation was determined by our Board of Directors.
Since our initial public offering, compensation decisions for our named executive officers have been determinedby our Compensation Committee, with input from compensation consultants and, as appropriate, management(including our Chief Executive Officer). Our Compensation Committee reviews the compensation of ourexecutive officers, including our named executive officers, on annual basis to ensure the executives are properlyincentivized, and makes adjustments as necessary.
24
In June 2013, the Compensation Committee engaged Compensia as an independent compensation consultant,after taking into account the six factors prescribed by the SEC and NYSE. The Compensation Committeerequested that Compensia:
• evaluate the efficacy of our existing compensation strategy and practices in supporting and reinforcing ourlong-term strategic goals;
• develop a peer group of companies to understand competitive market compensation practices;
• review and assess our current executive officer compensation practices and equity profile relative to ourpeers; and
• develop a board of directors compensation policy appropriate for a publicly-held company.
The Chairman of the Compensation Committee and its members also met in executive session with our ChiefExecutive Officer and Chief Financial Officer periodically to discuss our compensation history, philosophy, keyperformance metrics and strategic goals. Compensia ultimately developed recommendations that were submittedto the Compensation Committee for its consideration. At the beginning of 2014, following an active dialoguewith Compensia and further discussions with management, the Compensation Committee ultimately madeadjustments to the cash compensation for certain of our executive officers and granted RSUs to our executiveofficers to promote executive retention and align ourselves with our peer companies in a competitive technologyemployment market.
Role of Compensation Committee
Pursuant to its charter, the Compensation Committee is primarily responsible for establishing, approving andadjusting compensation arrangements for our named executive officers, including our Chief Executive Officer,and for reviewing and approving corporate goals and objectives relevant to these compensation arrangements,evaluating executive performance and considering factors related to the performance of the company, includingaccomplishment of our long-term business and financial goals. Under its charter, the Compensation Committeemay form, and delegate authority to, subcommittees as appropriate. For additional information about ourCompensation Committee, see the section entitled “Information Regarding the Board of Directors and CorporateGovernance—Board Committees—Compensation Committee” elsewhere in this proxy statement.
The Compensation Committee has the authority to engage its own advisors to assist it in carrying out itsresponsibilities. The Compensation Committee has previously retained Compensia and Radford to review andassess our executive employee compensation practices relative to market compensation practices and to providemarket compensation data. For additional information on these engagements, see the section entitled “—Role ofCompensation Consultants” below.
Role of Management
In carrying out its responsibilities, our Compensation Committee works with members of our management,including our Chief Executive Officer, Chief Financial Officer and General Counsel, and our human resources,finance, equity and legal professionals. Typically, our management assists the Compensation Committee byproviding information on corporate and individual performance and management’s perspective andrecommendations on compensation matters. Our Chief Executive Officer, Chief Financial Officer and GeneralCounsel may attend meetings of the Compensation Committee to present information and answer questions. OurChief Executive Officer may also make recommendations to the Compensation Committee regardingcompensation for our executive officers other than for himself because of his daily involvement with ourexecutive officers. Our Compensation Committee solicits and reviews our Chief Executive Officer’srecommendations as one of several factors in making compensation decisions, along with recommendations andmarket data obtained by compensation consultants, and the Compensation Committee’s own independentjudgment. No executive officer participates directly in the final deliberations or determinations regarding his orher own compensation package.
25
Role of Compensation Consultants
Our Compensation Committee has the authority to retain the services and obtain the advice of external advisors,including compensation consultants, legal counsel or other advisors to assist in the evaluation of executive officercompensation. Our Compensation Committee engaged Compensia in June 2013 to review our executivecompensation policies and practices and to conduct an executive compensation market analysis for the fiscal yearended December 31, 2014. In August 2014, our Compensation Committee engaged Radford to assist with ourexecutive and board compensation planning for 2015, including providing data for our overall equity andincentive plan targets and an analysis of our equity usage. Based on the consideration of the various factors as setforth in the rules of the SEC, the Compensation Committee does not believe that its relationships withCompensia or Radford and the work of Compensia and Radford on behalf of the Compensation Committee andmanagement has raised any conflict of interest. The Compensation Committee reviews these factors on an annualbasis and receives written confirmation from its independent compensation consultants stating their belief thatthey remain independent compensation consultants to the Compensation Committee.
Competitive Positioning
In July 2013, our Compensation Committee determined to use the following peer group of companies thatoperate in the applications software, systems software, or adjacent Internet software and services markets, withsimilar revenues, revenue growth, proximity to an initial public offering and market capitalization to inform itsdecisions for executive compensation for 2014:
Cornerstone OnDemand Inc.Guidewire Software Inc.Imperva Inc.Infoblox Inc.Jive Software Inc.
Microstrategy Inc.NetSuite Inc.Qlik Technologies Inc.ServiceNow Inc.SolarWinds Inc.
Sourcefire Inc.Splunk Inc.Workday Inc.Zillow Inc.
Our Compensation Committee believes that peer group comparisons are useful guidelines to measure thecompetitiveness of our compensation practices. However, the Compensation Committee has not adopted anyformal benchmarking guidelines and maintains discretion to set levels of executive compensation above or belowpeer levels based upon distinguishing factors such as our internal pay equity and compensation budget, individualperformance and contribution to the Company, an executive’s level of experience and responsibilities, andcomparability of roles within other peer companies.
Components of Named Executive Officer Compensation
The compensation program for our named executive officers consists of:
• base salary;
• cash incentive compensation;
• long-term equity compensation;
• severance and change in control-related benefits; and
• employee benefits and perquisites.
Each named executive officer’s compensation has been designed to provide a combination of compensation thatis tied to achievement of our short- and long-term objectives. As our needs evolve, we intend to continue toevaluate our philosophy and compensation programs as circumstances require, and at a minimum, we expect toreview our executive compensation program at least annually.
26
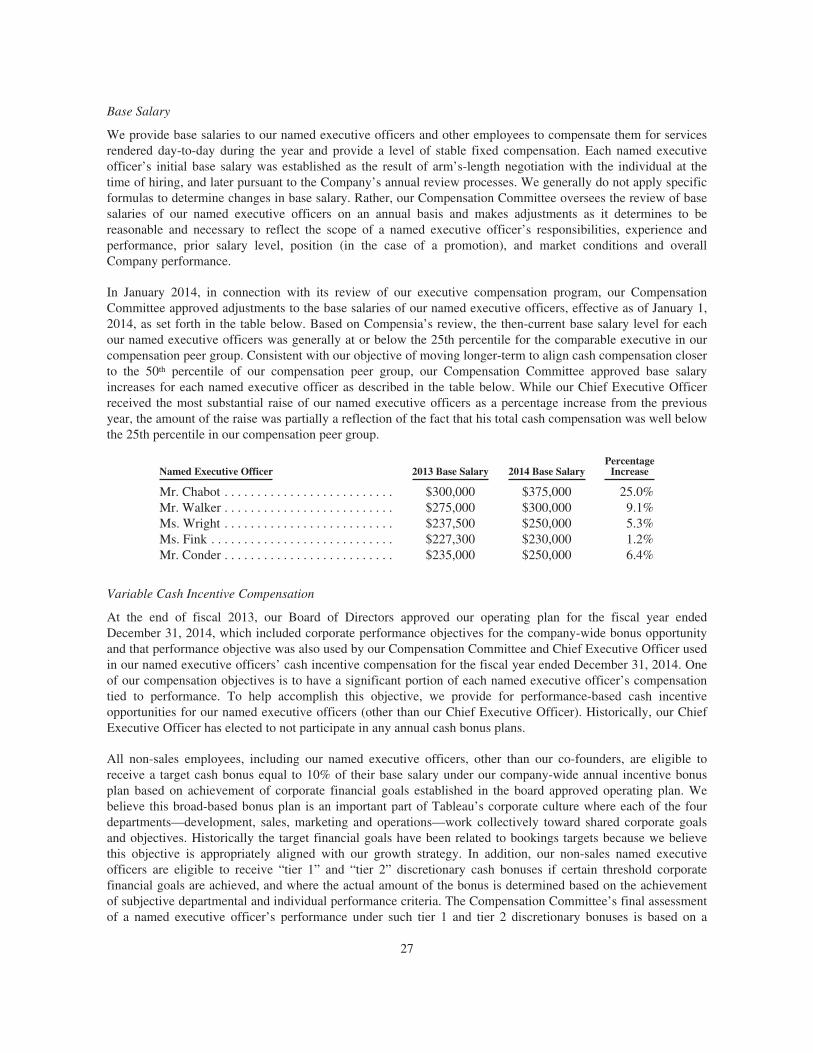
Base Salary
We provide base salaries to our named executive officers and other employees to compensate them for servicesrendered day-to-day during the year and provide a level of stable fixed compensation. Each named executiveofficer’s initial base salary was established as the result of arm’s-length negotiation with the individual at thetime of hiring, and later pursuant to the Company’s annual review processes. We generally do not apply specificformulas to determine changes in base salary. Rather, our Compensation Committee oversees the review of basesalaries of our named executive officers on an annual basis and makes adjustments as it determines to bereasonable and necessary to reflect the scope of a named executive officer’s responsibilities, experience andperformance, prior salary level, position (in the case of a promotion), and market conditions and overallCompany performance.
In January 2014, in connection with its review of our executive compensation program, our CompensationCommittee approved adjustments to the base salaries of our named executive officers, effective as of January 1,2014, as set forth in the table below. Based on Compensia’s review, the then-current base salary level for eachour named executive officers was generally at or below the 25th percentile for the comparable executive in ourcompensation peer group. Consistent with our objective of moving longer-term to align cash compensation closerto the 50th percentile of our compensation peer group, our Compensation Committee approved base salaryincreases for each named executive officer as described in the table below. While our Chief Executive Officerreceived the most substantial raise of our named executive officers as a percentage increase from the previousyear, the amount of the raise was partially a reflection of the fact that his total cash compensation was well belowthe 25th percentile in our compensation peer group.
Named Executive Officer 2013 Base Salary 2014 Base SalaryPercentage
Increase
Mr. Chabot . . . . . . . . . . . . . . . . . . . . . . . . . . $300,000 $375,000 25.0%Mr. Walker . . . . . . . . . . . . . . . . . . . . . . . . . . $275,000 $300,000 9.1%Ms. Wright . . . . . . . . . . . . . . . . . . . . . . . . . . $237,500 $250,000 5.3%Ms. Fink . . . . . . . . . . . . . . . . . . . . . . . . . . . . $227,300 $230,000 1.2%Mr. Conder . . . . . . . . . . . . . . . . . . . . . . . . . . $235,000 $250,000 6.4%
Variable Cash Incentive Compensation
At the end of fiscal 2013, our Board of Directors approved our operating plan for the fiscal year endedDecember 31, 2014, which included corporate performance objectives for the company-wide bonus opportunityand that performance objective was also used by our Compensation Committee and Chief Executive Officer usedin our named executive officers’ cash incentive compensation for the fiscal year ended December 31, 2014. Oneof our compensation objectives is to have a significant portion of each named executive officer’s compensationtied to performance. To help accomplish this objective, we provide for performance-based cash incentiveopportunities for our named executive officers (other than our Chief Executive Officer). Historically, our ChiefExecutive Officer has elected to not participate in any annual cash bonus plans.
All non-sales employees, including our named executive officers, other than our co-founders, are eligible toreceive a target cash bonus equal to 10% of their base salary under our company-wide annual incentive bonusplan based on achievement of corporate financial goals established in the board approved operating plan. Webelieve this broad-based bonus plan is an important part of Tableau’s corporate culture where each of the fourdepartments—development, sales, marketing and operations—work collectively toward shared corporate goalsand objectives. Historically the target financial goals have been related to bookings targets because we believethis objective is appropriately aligned with our growth strategy. In addition, our non-sales named executiveofficers are eligible to receive “tier 1” and “tier 2” discretionary cash bonuses if certain threshold corporatefinancial goals are achieved, and where the actual amount of the bonus is determined based on the achievementof subjective departmental and individual performance criteria. The Compensation Committee’s final assessmentof a named executive officer’s performance under such tier 1 and tier 2 discretionary bonuses is based on a
27
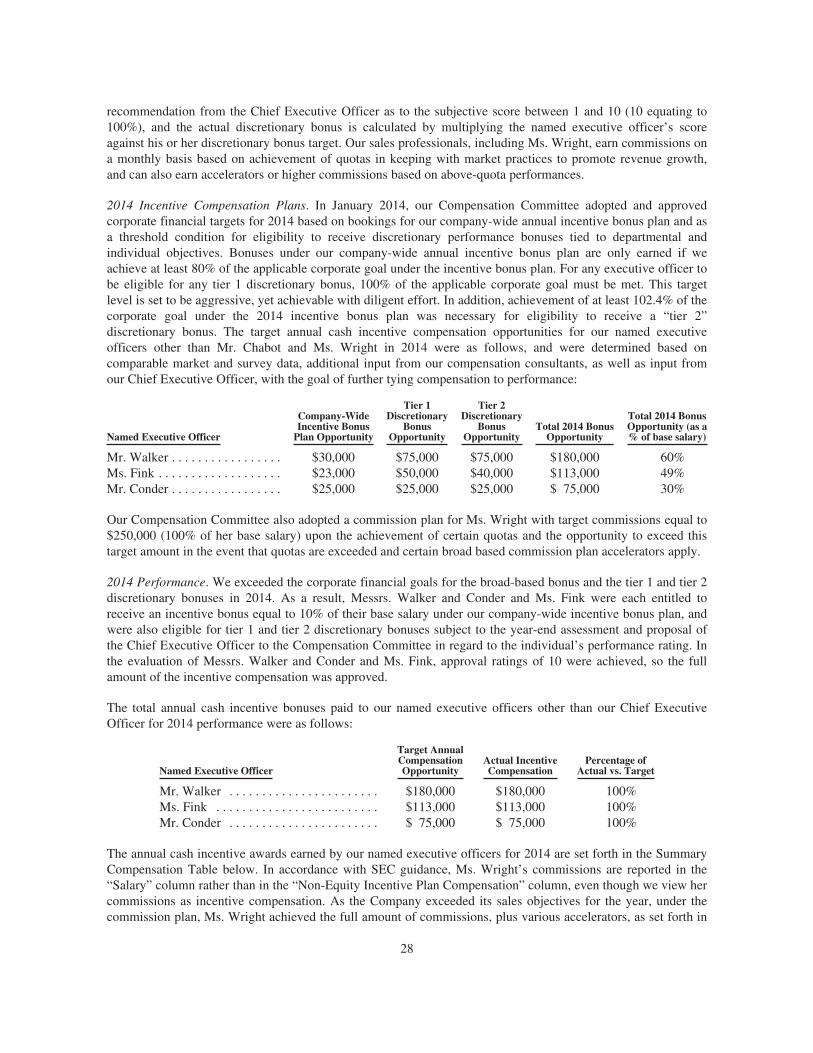
recommendation from the Chief Executive Officer as to the subjective score between 1 and 10 (10 equating to100%), and the actual discretionary bonus is calculated by multiplying the named executive officer’s scoreagainst his or her discretionary bonus target. Our sales professionals, including Ms. Wright, earn commissions ona monthly basis based on achievement of quotas in keeping with market practices to promote revenue growth,and can also earn accelerators or higher commissions based on above-quota performances.
2014 Incentive Compensation Plans. In January 2014, our Compensation Committee adopted and approvedcorporate financial targets for 2014 based on bookings for our company-wide annual incentive bonus plan and asa threshold condition for eligibility to receive discretionary performance bonuses tied to departmental andindividual objectives. Bonuses under our company-wide annual incentive bonus plan are only earned if weachieve at least 80% of the applicable corporate goal under the incentive bonus plan. For any executive officer tobe eligible for any tier 1 discretionary bonus, 100% of the applicable corporate goal must be met. This targetlevel is set to be aggressive, yet achievable with diligent effort. In addition, achievement of at least 102.4% of thecorporate goal under the 2014 incentive bonus plan was necessary for eligibility to receive a “tier 2”discretionary bonus. The target annual cash incentive compensation opportunities for our named executiveofficers other than Mr. Chabot and Ms. Wright in 2014 were as follows, and were determined based oncomparable market and survey data, additional input from our compensation consultants, as well as input fromour Chief Executive Officer, with the goal of further tying compensation to performance:
Named Executive Officer
Company-WideIncentive Bonus
Plan Opportunity
Tier 1Discretionary
BonusOpportunity
Tier 2Discretionary
BonusOpportunity
Total 2014 BonusOpportunity
Total 2014 BonusOpportunity (as a% of base salary)
Mr. Walker . . . . . . . . . . . . . . . . . $30,000 $75,000 $75,000 $180,000 60%Ms. Fink . . . . . . . . . . . . . . . . . . . $23,000 $50,000 $40,000 $113,000 49%Mr. Conder . . . . . . . . . . . . . . . . . $25,000 $25,000 $25,000 $ 75,000 30%
Our Compensation Committee also adopted a commission plan for Ms. Wright with target commissions equal to$250,000 (100% of her base salary) upon the achievement of certain quotas and the opportunity to exceed thistarget amount in the event that quotas are exceeded and certain broad based commission plan accelerators apply.
2014 Performance. We exceeded the corporate financial goals for the broad-based bonus and the tier 1 and tier 2discretionary bonuses in 2014. As a result, Messrs. Walker and Conder and Ms. Fink were each entitled toreceive an incentive bonus equal to 10% of their base salary under our company-wide incentive bonus plan, andwere also eligible for tier 1 and tier 2 discretionary bonuses subject to the year-end assessment and proposal ofthe Chief Executive Officer to the Compensation Committee in regard to the individual’s performance rating. Inthe evaluation of Messrs. Walker and Conder and Ms. Fink, approval ratings of 10 were achieved, so the fullamount of the incentive compensation was approved.
The total annual cash incentive bonuses paid to our named executive officers other than our Chief ExecutiveOfficer for 2014 performance were as follows:
Named Executive Officer
Target AnnualCompensationOpportunity
Actual IncentiveCompensation
Percentage ofActual vs. Target
Mr. Walker . . . . . . . . . . . . . . . . . . . . . . . $180,000 $180,000 100%Ms. Fink . . . . . . . . . . . . . . . . . . . . . . . . . $113,000 $113,000 100%Mr. Conder . . . . . . . . . . . . . . . . . . . . . . . $ 75,000 $ 75,000 100%
The annual cash incentive awards earned by our named executive officers for 2014 are set forth in the SummaryCompensation Table below. In accordance with SEC guidance, Ms. Wright’s commissions are reported in the“Salary” column rather than in the “Non-Equity Incentive Plan Compensation” column, even though we view hercommissions as incentive compensation. As the Company exceeded its sales objectives for the year, under thecommission plan, Ms. Wright achieved the full amount of commissions, plus various accelerators, as set forth in
28
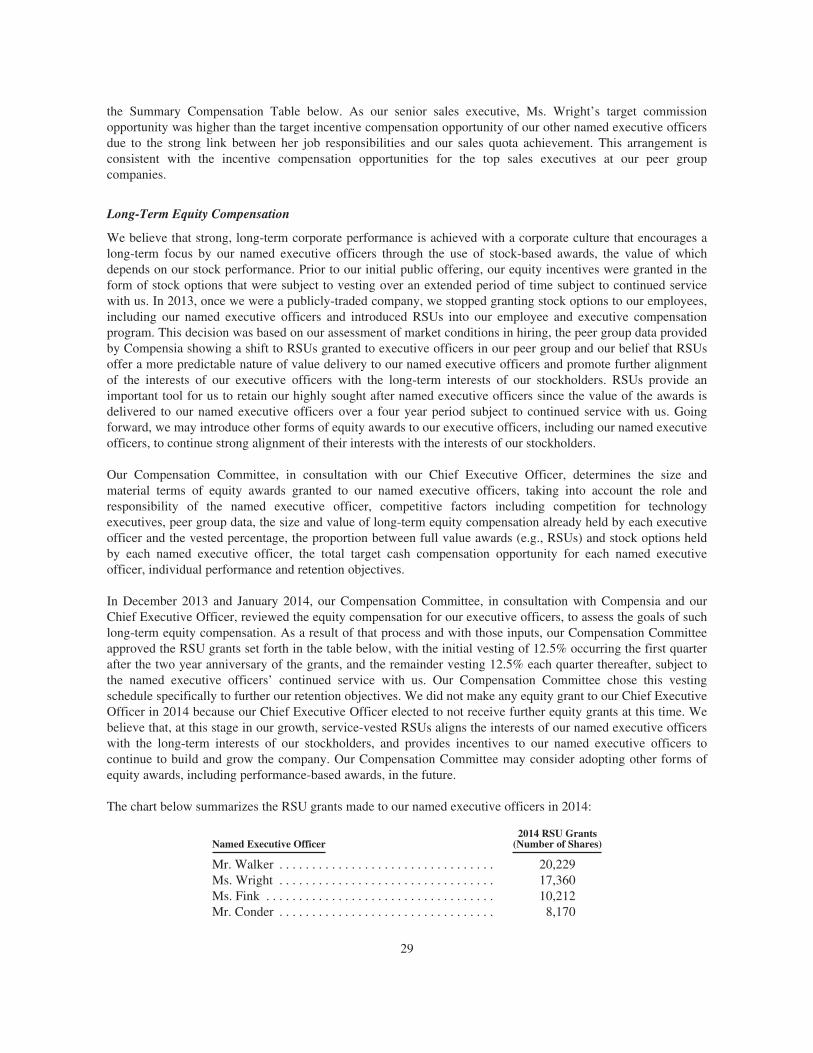
the Summary Compensation Table below. As our senior sales executive, Ms. Wright’s target commissionopportunity was higher than the target incentive compensation opportunity of our other named executive officersdue to the strong link between her job responsibilities and our sales quota achievement. This arrangement isconsistent with the incentive compensation opportunities for the top sales executives at our peer groupcompanies.
Long-Term Equity Compensation
We believe that strong, long-term corporate performance is achieved with a corporate culture that encourages along-term focus by our named executive officers through the use of stock-based awards, the value of whichdepends on our stock performance. Prior to our initial public offering, our equity incentives were granted in theform of stock options that were subject to vesting over an extended period of time subject to continued servicewith us. In 2013, once we were a publicly-traded company, we stopped granting stock options to our employees,including our named executive officers and introduced RSUs into our employee and executive compensationprogram. This decision was based on our assessment of market conditions in hiring, the peer group data providedby Compensia showing a shift to RSUs granted to executive officers in our peer group and our belief that RSUsoffer a more predictable nature of value delivery to our named executive officers and promote further alignmentof the interests of our executive officers with the long-term interests of our stockholders. RSUs provide animportant tool for us to retain our highly sought after named executive officers since the value of the awards isdelivered to our named executive officers over a four year period subject to continued service with us. Goingforward, we may introduce other forms of equity awards to our executive officers, including our named executiveofficers, to continue strong alignment of their interests with the interests of our stockholders.
Our Compensation Committee, in consultation with our Chief Executive Officer, determines the size andmaterial terms of equity awards granted to our named executive officers, taking into account the role andresponsibility of the named executive officer, competitive factors including competition for technologyexecutives, peer group data, the size and value of long-term equity compensation already held by each executiveofficer and the vested percentage, the proportion between full value awards (e.g., RSUs) and stock options heldby each named executive officer, the total target cash compensation opportunity for each named executiveofficer, individual performance and retention objectives.
In December 2013 and January 2014, our Compensation Committee, in consultation with Compensia and ourChief Executive Officer, reviewed the equity compensation for our executive officers, to assess the goals of suchlong-term equity compensation. As a result of that process and with those inputs, our Compensation Committeeapproved the RSU grants set forth in the table below, with the initial vesting of 12.5% occurring the first quarterafter the two year anniversary of the grants, and the remainder vesting 12.5% each quarter thereafter, subject tothe named executive officers’ continued service with us. Our Compensation Committee chose this vestingschedule specifically to further our retention objectives. We did not make any equity grant to our Chief ExecutiveOfficer in 2014 because our Chief Executive Officer elected to not receive further equity grants at this time. Webelieve that, at this stage in our growth, service-vested RSUs aligns the interests of our named executive officerswith the long-term interests of our stockholders, and provides incentives to our named executive officers tocontinue to build and grow the company. Our Compensation Committee may consider adopting other forms ofequity awards, including performance-based awards, in the future.
The chart below summarizes the RSU grants made to our named executive officers in 2014:
Named Executive Officer2014 RSU Grants
(Number of Shares)
Mr. Walker . . . . . . . . . . . . . . . . . . . . . . . . . . . . . . . . . 20,229Ms. Wright . . . . . . . . . . . . . . . . . . . . . . . . . . . . . . . . . 17,360Ms. Fink . . . . . . . . . . . . . . . . . . . . . . . . . . . . . . . . . . . 10,212Mr. Conder . . . . . . . . . . . . . . . . . . . . . . . . . . . . . . . . . 8,170
29
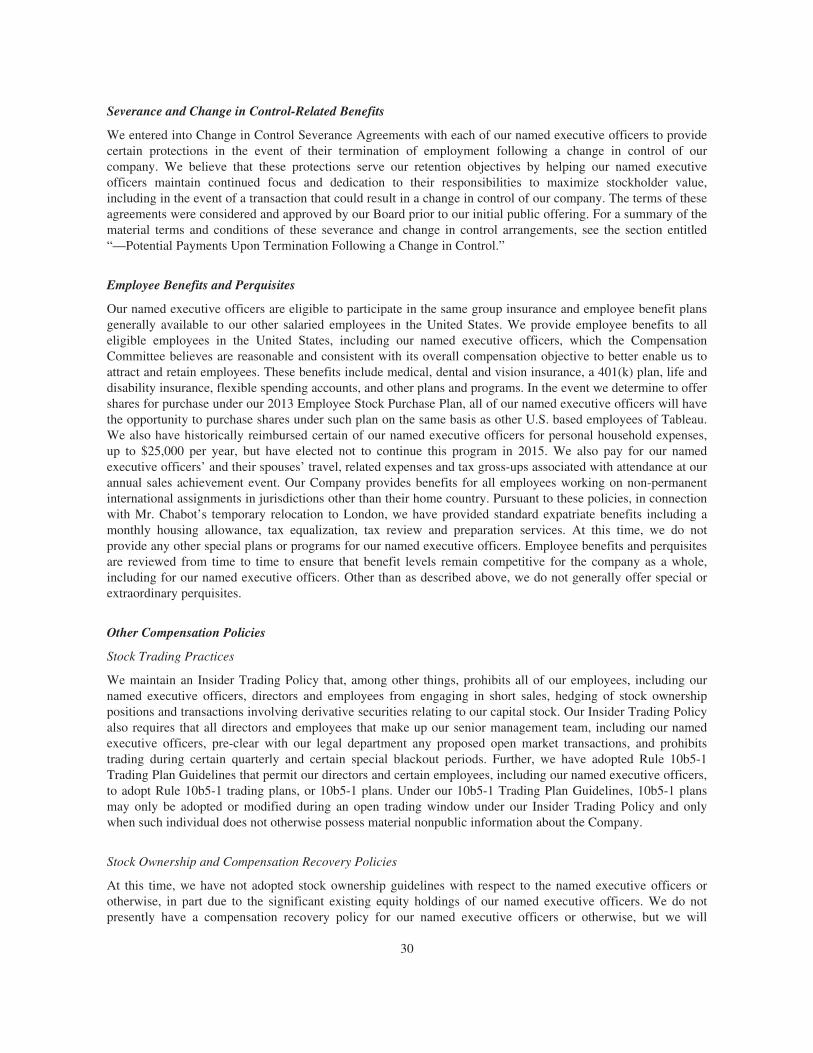
Severance and Change in Control-Related Benefits
We entered into Change in Control Severance Agreements with each of our named executive officers to providecertain protections in the event of their termination of employment following a change in control of ourcompany. We believe that these protections serve our retention objectives by helping our named executiveofficers maintain continued focus and dedication to their responsibilities to maximize stockholder value,including in the event of a transaction that could result in a change in control of our company. The terms of theseagreements were considered and approved by our Board prior to our initial public offering. For a summary of thematerial terms and conditions of these severance and change in control arrangements, see the section entitled“—Potential Payments Upon Termination Following a Change in Control.”
Employee Benefits and Perquisites
Our named executive officers are eligible to participate in the same group insurance and employee benefit plansgenerally available to our other salaried employees in the United States. We provide employee benefits to alleligible employees in the United States, including our named executive officers, which the CompensationCommittee believes are reasonable and consistent with its overall compensation objective to better enable us toattract and retain employees. These benefits include medical, dental and vision insurance, a 401(k) plan, life anddisability insurance, flexible spending accounts, and other plans and programs. In the event we determine to offershares for purchase under our 2013 Employee Stock Purchase Plan, all of our named executive officers will havethe opportunity to purchase shares under such plan on the same basis as other U.S. based employees of Tableau.We also have historically reimbursed certain of our named executive officers for personal household expenses,up to $25,000 per year, but have elected not to continue this program in 2015. We also pay for our namedexecutive officers’ and their spouses’ travel, related expenses and tax gross-ups associated with attendance at ourannual sales achievement event. Our Company provides benefits for all employees working on non-permanentinternational assignments in jurisdictions other than their home country. Pursuant to these policies, in connectionwith Mr. Chabot’s temporary relocation to London, we have provided standard expatriate benefits including amonthly housing allowance, tax equalization, tax review and preparation services. At this time, we do notprovide any other special plans or programs for our named executive officers. Employee benefits and perquisitesare reviewed from time to time to ensure that benefit levels remain competitive for the company as a whole,including for our named executive officers. Other than as described above, we do not generally offer special orextraordinary perquisites.
Other Compensation Policies
Stock Trading Practices
We maintain an Insider Trading Policy that, among other things, prohibits all of our employees, including ournamed executive officers, directors and employees from engaging in short sales, hedging of stock ownershippositions and transactions involving derivative securities relating to our capital stock. Our Insider Trading Policyalso requires that all directors and employees that make up our senior management team, including our namedexecutive officers, pre-clear with our legal department any proposed open market transactions, and prohibitstrading during certain quarterly and certain special blackout periods. Further, we have adopted Rule 10b5-1Trading Plan Guidelines that permit our directors and certain employees, including our named executive officers,to adopt Rule 10b5-1 trading plans, or 10b5-1 plans. Under our 10b5-1 Trading Plan Guidelines, 10b5-1 plansmay only be adopted or modified during an open trading window under our Insider Trading Policy and onlywhen such individual does not otherwise possess material nonpublic information about the Company.
Stock Ownership and Compensation Recovery Policies
At this time, we have not adopted stock ownership guidelines with respect to the named executive officers orotherwise, in part due to the significant existing equity holdings of our named executive officers. We do notpresently have a compensation recovery policy for our named executive officers or otherwise, but we will
30
comply with the requirements of the Dodd-Frank Wall Street Reform and Consumer Protection Act and adopt acompensation recovery policy to the extent required by law once the SEC adopts final regulations on the subject.
Tax and Accounting Treatment of Compensation
Deductibility of Executive Compensation
Generally, Section 162(m) of the Internal Revenue Code of 1986, as amended (the “Code”) disallows a taxdeduction to any publicly-held corporation for any remuneration in excess of $1 million paid in any taxable yearto its chief executive officer and to certain other highly compensated officers. Remuneration in excess of$1 million may be deducted if, among other things, it qualifies as “performance-based compensation” within themeaning of the Code.
We have not previously taken the deductibility limit imposed by Section 162(m) into consideration in settingcompensation for our named executive officers. Further, under a certain Section 162(m) exception, certaincompensation paid pursuant to a compensation plan in existence before the effective date of our initial publicoffering will not be subject to the $1 million limitation until the earliest of: (i) the expiration of the compensationplan, (ii) a material modification of the compensation plan (as determined under Section 162(m)), (iii) theissuance of all the employer stock and other compensation allocated under the compensation plan, and (iv) our2017 Annual Meeting of Stockholders. Our Compensation Committee may, in its judgment, authorizecompensation payments that do not comply with an exemption from the deductibility limit when it believes thatsuch payments are appropriate to attract and retain executive talent.
Taxation of “Parachute” Payments and Deferred Compensation
We did not provide any executive officer, including any named executive officer, with a “gross-up” or otherreimbursement payment for any tax liability that he or she might owe as a result of the application ofSections 280G, 4999, or 409A of the Code during 2014, and we have not agreed and are not otherwise obligatedto provide any named executive officer with such a “gross-up” or other reimbursement. Sections 280G and 4999of the Code provide that executive officers and directors who hold significant equity interests and certain otherservice providers may be subject to an excise tax if they receive payments or benefits in connection with achange in control that exceeds certain prescribed limits, and that the company, or a successor, may forfeit adeduction on the amounts subject to this additional tax. Section 409A also imposes additional significant taxes onthe individual in the event that an executive officer, director or other service provider receives “deferredcompensation” that does not meet the requirements of Section 409A of the Code.
Accounting for Stock-Based Compensation
We follow Financial Accounting Standards Board Accounting Standards Codification Topic 718 (“ASCTopic 718”) to account for the expense of our stock-based awards. ASC Topic 718 requires companies tomeasure the compensation expense for all share-based payment awards made to employees and directors,including stock options and restricted stock awards, based on the grant date “fair value” of these awards. Thiscalculation is performed for accounting purposes and reported in the compensation tables below, even though ournamed executive officers may never realize any value from their awards. ASC Topic 718 also requires companiesto recognize the compensation cost of their stock-based compensation awards in their income statements over theperiod that a named executive officer is required to render service in exchange for the option or other award.
Compensation Risk Assessment
Our Compensation Committee has reviewed our compensation policies and believes that our policies do notencourage excessive or inappropriate risk taking and that the level of risk that they do encourage is notreasonably likely to have a material adverse effect on the company. As part of its assessment, the Compensation
31
Committee considered, among other factors, the allocation of compensation among base salary and short- andlong-term compensation, our approach to establishing company-wide and individual financial, departmental andother performance targets, our bonus structure of payouts and the nature of our key performance metrics. Webelieve these practices encourage our employees to focus on sustained long-term company growth, which webelieve will ultimately contribute to the creation of stockholder value.
Report of the Compensation Committee(1)
The Compensation Committee of the Board of Directors has reviewed and discussed the CompensationDiscussion and Analysis required by Item 402(b) of Regulation S-K with management and, based on such reviewand discussions, the Compensation Committee recommended to the Board of Directors that the CompensationDiscussion and Analysis be included in this proxy statement.
COMPENSATION COMMITTEE OF THE BOARD OF DIRECTORS
Mr. Elliott Jurgensen, Jr.Dr. Forest BaskettMr. Scott Sandell
(1) The material in this report is not “soliciting material,” is not deemed “filed” with the SEC and is not to be incorporated by reference inany filing of the Company under the Securities Act or the Exchange Act, whether made before or after the date hereof and irrespective ofany general incorporation language in any such filing.
32
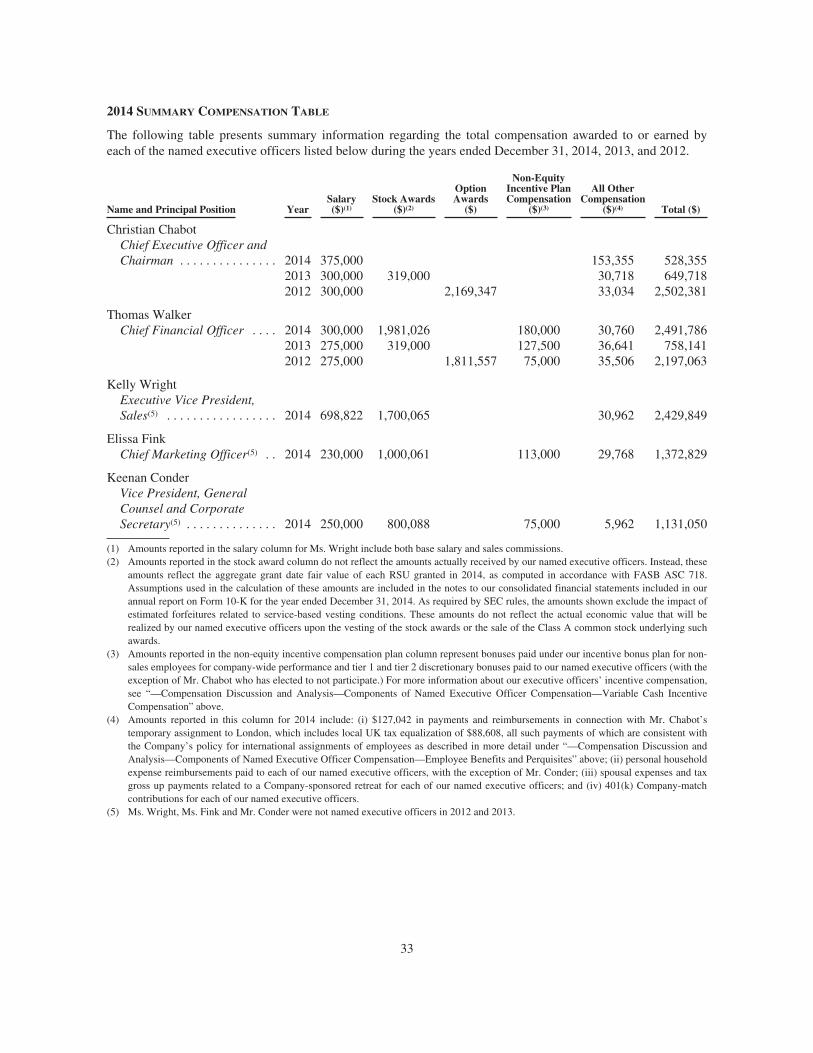
2014 SUMMARY COMPENSATION TABLE
The following table presents summary information regarding the total compensation awarded to or earned byeach of the named executive officers listed below during the years ended December 31, 2014, 2013, and 2012.
Name and Principal Position YearSalary($)(1)
Stock Awards($)(2)
OptionAwards
($)
Non-EquityIncentive PlanCompensation
($)(3)
All OtherCompensation
($)(4) Total ($)
Christian ChabotChief Executive Officer andChairman . . . . . . . . . . . . . . . 2014 375,000 153,355 528,355
2013 300,000 319,000 30,718 649,7182012 300,000 2,169,347 33,034 2,502,381
Thomas WalkerChief Financial Officer . . . . 2014 300,000 1,981,026 180,000 30,760 2,491,786
2013 275,000 319,000 127,500 36,641 758,1412012 275,000 1,811,557 75,000 35,506 2,197,063
Kelly WrightExecutive Vice President,Sales(5) . . . . . . . . . . . . . . . . . 2014 698,822 1,700,065 30,962 2,429,849
Elissa FinkChief Marketing Officer(5) . . 2014 230,000 1,000,061 113,000 29,768 1,372,829
Keenan ConderVice President, GeneralCounsel and CorporateSecretary(5) . . . . . . . . . . . . . . 2014 250,000 800,088 75,000 5,962 1,131,050
(1) Amounts reported in the salary column for Ms. Wright include both base salary and sales commissions.(2) Amounts reported in the stock award column do not reflect the amounts actually received by our named executive officers. Instead, these
amounts reflect the aggregate grant date fair value of each RSU granted in 2014, as computed in accordance with FASB ASC 718.Assumptions used in the calculation of these amounts are included in the notes to our consolidated financial statements included in ourannual report on Form 10-K for the year ended December 31, 2014. As required by SEC rules, the amounts shown exclude the impact ofestimated forfeitures related to service-based vesting conditions. These amounts do not reflect the actual economic value that will berealized by our named executive officers upon the vesting of the stock awards or the sale of the Class A common stock underlying suchawards.
(3) Amounts reported in the non-equity incentive compensation plan column represent bonuses paid under our incentive bonus plan for non-sales employees for company-wide performance and tier 1 and tier 2 discretionary bonuses paid to our named executive officers (with theexception of Mr. Chabot who has elected to not participate.) For more information about our executive officers’ incentive compensation,see “—Compensation Discussion and Analysis—Components of Named Executive Officer Compensation—Variable Cash IncentiveCompensation” above.
(4) Amounts reported in this column for 2014 include: (i) $127,042 in payments and reimbursements in connection with Mr. Chabot’stemporary assignment to London, which includes local UK tax equalization of $88,608, all such payments of which are consistent withthe Company’s policy for international assignments of employees as described in more detail under “—Compensation Discussion andAnalysis—Components of Named Executive Officer Compensation—Employee Benefits and Perquisites” above; (ii) personal householdexpense reimbursements paid to each of our named executive officers, with the exception of Mr. Conder; (iii) spousal expenses and taxgross up payments related to a Company-sponsored retreat for each of our named executive officers; and (iv) 401(k) Company-matchcontributions for each of our named executive officers.
(5) Ms. Wright, Ms. Fink and Mr. Conder were not named executive officers in 2012 and 2013.
33
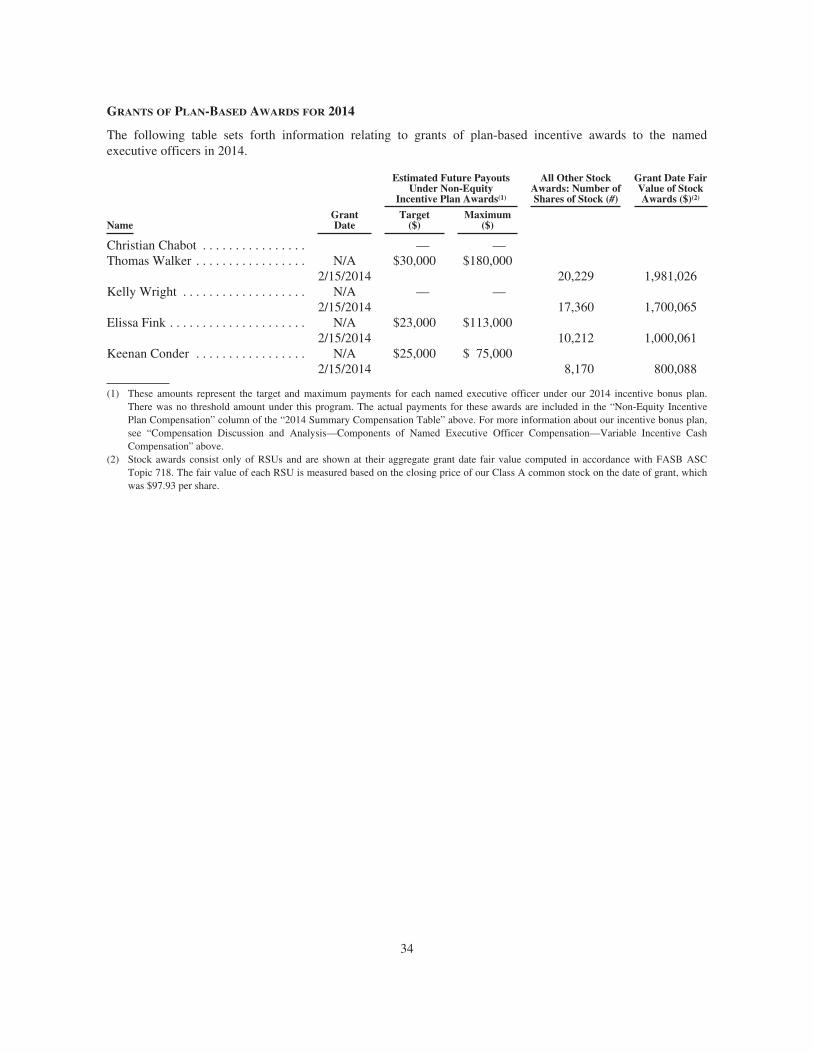
GRANTS OF PLAN-BASED AWARDS FOR 2014
The following table sets forth information relating to grants of plan-based incentive awards to the namedexecutive officers in 2014.
Estimated Future PayoutsUnder Non-Equity
Incentive Plan Awards(1)
All Other StockAwards: Number ofShares of Stock (#)
Grant Date FairValue of StockAwards ($)(2)
NameGrantDate
Target($)
Maximum($)
Christian Chabot . . . . . . . . . . . . . . . . — —Thomas Walker . . . . . . . . . . . . . . . . . N/A
2/15/2014$30,000 $180,000
20,229 1,981,026Kelly Wright . . . . . . . . . . . . . . . . . . . N/A
2/15/2014— —
17,360 1,700,065Elissa Fink . . . . . . . . . . . . . . . . . . . . . N/A
2/15/2014$23,000 $113,000
10,212 1,000,061Keenan Conder . . . . . . . . . . . . . . . . . N/A
2/15/2014$25,000 $ 75,000
8,170 800,088
(1) These amounts represent the target and maximum payments for each named executive officer under our 2014 incentive bonus plan.There was no threshold amount under this program. The actual payments for these awards are included in the “Non-Equity IncentivePlan Compensation” column of the “2014 Summary Compensation Table” above. For more information about our incentive bonus plan,see “Compensation Discussion and Analysis—Components of Named Executive Officer Compensation—Variable Incentive CashCompensation” above.
(2) Stock awards consist only of RSUs and are shown at their aggregate grant date fair value computed in accordance with FASB ASCTopic 718. The fair value of each RSU is measured based on the closing price of our Class A common stock on the date of grant, whichwas $97.93 per share.
34
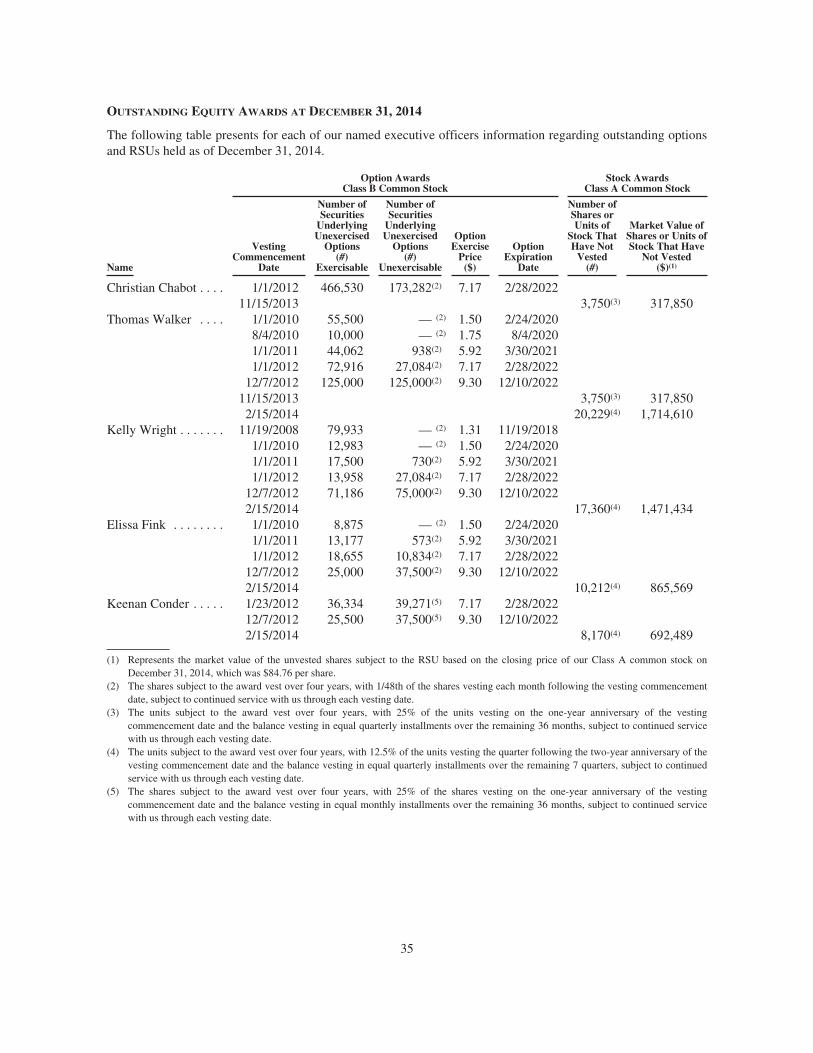
OUTSTANDING EQUITY AWARDS AT DECEMBER 31, 2014
The following table presents for each of our named executive officers information regarding outstanding optionsand RSUs held as of December 31, 2014.
Option AwardsClass B Common Stock
Stock AwardsClass A Common Stock
Name
VestingCommencement
Date
Number ofSecurities
UnderlyingUnexercised
Options(#)
Exercisable
Number ofSecurities
UnderlyingUnexercised
Options(#)
Unexercisable
OptionExercise
Price($)
OptionExpiration
Date
Number ofShares orUnits of
Stock ThatHave Not
Vested(#)
Market Value ofShares or Units ofStock That Have
Not Vested($)(1)
Christian Chabot . . . . 1/1/2012 466,530 173,282(2) 7.17 2/28/202211/15/2013 3,750(3) 317,850
Thomas Walker . . . . 1/1/2010 55,500 — (2) 1.50 2/24/20208/4/2010 10,000 — (2) 1.75 8/4/20201/1/2011 44,062 938(2) 5.92 3/30/20211/1/2012 72,916 27,084(2) 7.17 2/28/2022
12/7/2012 125,000 125,000(2) 9.30 12/10/202211/15/2013 3,750(3) 317,850
2/15/2014 20,229(4) 1,714,610Kelly Wright . . . . . . . 11/19/2008 79,933 — (2) 1.31 11/19/2018
1/1/2010 12,983 — (2) 1.50 2/24/20201/1/2011 17,500 730(2) 5.92 3/30/20211/1/2012 13,958 27,084(2) 7.17 2/28/2022
12/7/2012 71,186 75,000(2) 9.30 12/10/20222/15/2014 17,360(4) 1,471,434
Elissa Fink . . . . . . . . 1/1/2010 8,875 — (2) 1.50 2/24/20201/1/2011 13,177 573(2) 5.92 3/30/20211/1/2012 18,655 10,834(2) 7.17 2/28/2022
12/7/2012 25,000 37,500(2) 9.30 12/10/20222/15/2014 10,212(4) 865,569
Keenan Conder . . . . . 1/23/2012 36,334 39,271(5) 7.17 2/28/202212/7/2012 25,500 37,500(5) 9.30 12/10/20222/15/2014 8,170(4) 692,489
(1) Represents the market value of the unvested shares subject to the RSU based on the closing price of our Class A common stock onDecember 31, 2014, which was $84.76 per share.
(2) The shares subject to the award vest over four years, with 1/48th of the shares vesting each month following the vesting commencementdate, subject to continued service with us through each vesting date.
(3) The units subject to the award vest over four years, with 25% of the units vesting on the one-year anniversary of the vestingcommencement date and the balance vesting in equal quarterly installments over the remaining 36 months, subject to continued servicewith us through each vesting date.
(4) The units subject to the award vest over four years, with 12.5% of the units vesting the quarter following the two-year anniversary of thevesting commencement date and the balance vesting in equal quarterly installments over the remaining 7 quarters, subject to continuedservice with us through each vesting date.
(5) The shares subject to the award vest over four years, with 25% of the shares vesting on the one-year anniversary of the vestingcommencement date and the balance vesting in equal monthly installments over the remaining 36 months, subject to continued servicewith us through each vesting date.
35
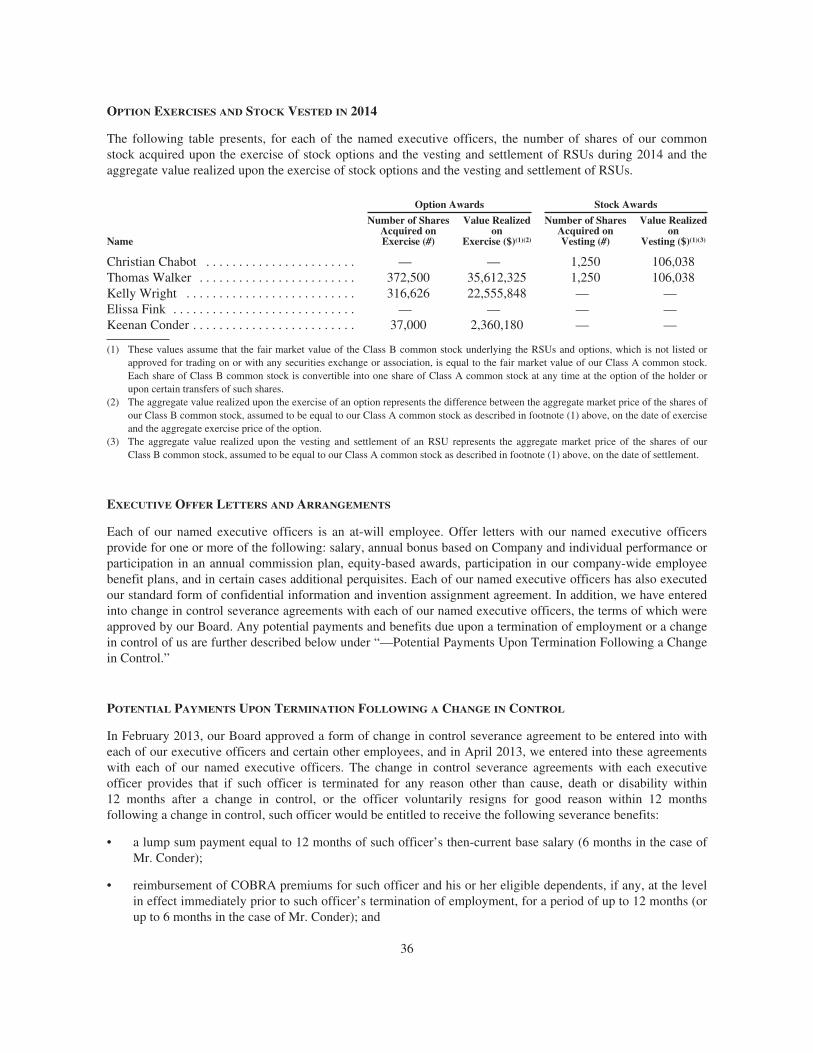
OPTION EXERCISES AND STOCK VESTED IN 2014
The following table presents, for each of the named executive officers, the number of shares of our commonstock acquired upon the exercise of stock options and the vesting and settlement of RSUs during 2014 and theaggregate value realized upon the exercise of stock options and the vesting and settlement of RSUs.
Option Awards Stock Awards
Name
Number of SharesAcquired onExercise (#)
Value Realizedon
Exercise ($)(1)(2)
Number of SharesAcquired onVesting (#)
Value Realizedon
Vesting ($)(1)(3)
Christian Chabot . . . . . . . . . . . . . . . . . . . . . . . — — 1,250 106,038Thomas Walker . . . . . . . . . . . . . . . . . . . . . . . . 372,500 35,612,325 1,250 106,038Kelly Wright . . . . . . . . . . . . . . . . . . . . . . . . . . 316,626 22,555,848 — —Elissa Fink . . . . . . . . . . . . . . . . . . . . . . . . . . . . — — — —Keenan Conder . . . . . . . . . . . . . . . . . . . . . . . . . 37,000 2,360,180 — —
(1) These values assume that the fair market value of the Class B common stock underlying the RSUs and options, which is not listed orapproved for trading on or with any securities exchange or association, is equal to the fair market value of our Class A common stock.Each share of Class B common stock is convertible into one share of Class A common stock at any time at the option of the holder orupon certain transfers of such shares.
(2) The aggregate value realized upon the exercise of an option represents the difference between the aggregate market price of the shares ofour Class B common stock, assumed to be equal to our Class A common stock as described in footnote (1) above, on the date of exerciseand the aggregate exercise price of the option.
(3) The aggregate value realized upon the vesting and settlement of an RSU represents the aggregate market price of the shares of ourClass B common stock, assumed to be equal to our Class A common stock as described in footnote (1) above, on the date of settlement.
EXECUTIVE OFFER LETTERS AND ARRANGEMENTS
Each of our named executive officers is an at-will employee. Offer letters with our named executive officersprovide for one or more of the following: salary, annual bonus based on Company and individual performance orparticipation in an annual commission plan, equity-based awards, participation in our company-wide employeebenefit plans, and in certain cases additional perquisites. Each of our named executive officers has also executedour standard form of confidential information and invention assignment agreement. In addition, we have enteredinto change in control severance agreements with each of our named executive officers, the terms of which wereapproved by our Board. Any potential payments and benefits due upon a termination of employment or a changein control of us are further described below under “—Potential Payments Upon Termination Following a Changein Control.”
POTENTIAL PAYMENTS UPON TERMINATION FOLLOWING A CHANGE IN CONTROL
In February 2013, our Board approved a form of change in control severance agreement to be entered into witheach of our executive officers and certain other employees, and in April 2013, we entered into these agreementswith each of our named executive officers. The change in control severance agreements with each executiveofficer provides that if such officer is terminated for any reason other than cause, death or disability within12 months after a change in control, or the officer voluntarily resigns for good reason within 12 monthsfollowing a change in control, such officer would be entitled to receive the following severance benefits:
• a lump sum payment equal to 12 months of such officer’s then-current base salary (6 months in the case ofMr. Conder);
• reimbursement of COBRA premiums for such officer and his or her eligible dependents, if any, at the levelin effect immediately prior to such officer’s termination of employment, for a period of up to 12 months (orup to 6 months in the case of Mr. Conder); and
36
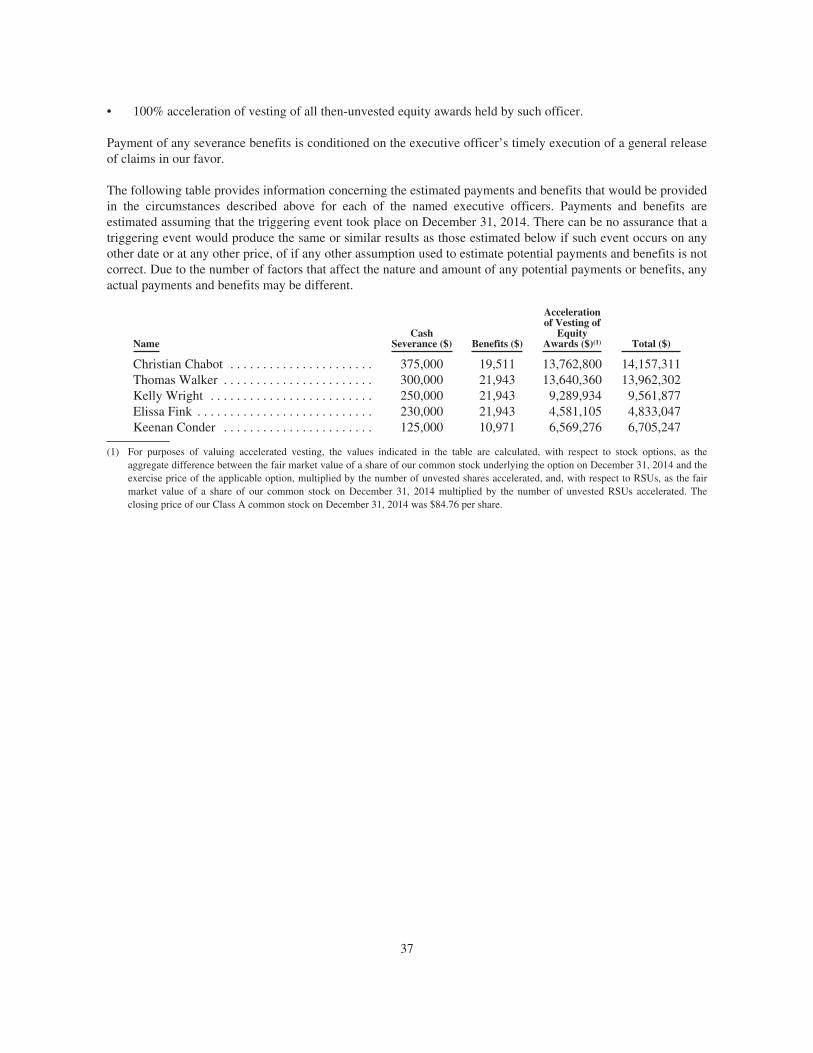
• 100% acceleration of vesting of all then-unvested equity awards held by such officer.
Payment of any severance benefits is conditioned on the executive officer’s timely execution of a general releaseof claims in our favor.
The following table provides information concerning the estimated payments and benefits that would be providedin the circumstances described above for each of the named executive officers. Payments and benefits areestimated assuming that the triggering event took place on December 31, 2014. There can be no assurance that atriggering event would produce the same or similar results as those estimated below if such event occurs on anyother date or at any other price, of if any other assumption used to estimate potential payments and benefits is notcorrect. Due to the number of factors that affect the nature and amount of any potential payments or benefits, anyactual payments and benefits may be different.
NameCash
Severance ($) Benefits ($)
Accelerationof Vesting of
EquityAwards ($)(1) Total ($)
Christian Chabot . . . . . . . . . . . . . . . . . . . . . . 375,000 19,511 13,762,800 14,157,311Thomas Walker . . . . . . . . . . . . . . . . . . . . . . . 300,000 21,943 13,640,360 13,962,302Kelly Wright . . . . . . . . . . . . . . . . . . . . . . . . . 250,000 21,943 9,289,934 9,561,877Elissa Fink . . . . . . . . . . . . . . . . . . . . . . . . . . . 230,000 21,943 4,581,105 4,833,047Keenan Conder . . . . . . . . . . . . . . . . . . . . . . . 125,000 10,971 6,569,276 6,705,247
(1) For purposes of valuing accelerated vesting, the values indicated in the table are calculated, with respect to stock options, as theaggregate difference between the fair market value of a share of our common stock underlying the option on December 31, 2014 and theexercise price of the applicable option, multiplied by the number of unvested shares accelerated, and, with respect to RSUs, as the fairmarket value of a share of our common stock on December 31, 2014 multiplied by the number of unvested RSUs accelerated. Theclosing price of our Class A common stock on December 31, 2014 was $84.76 per share.
37
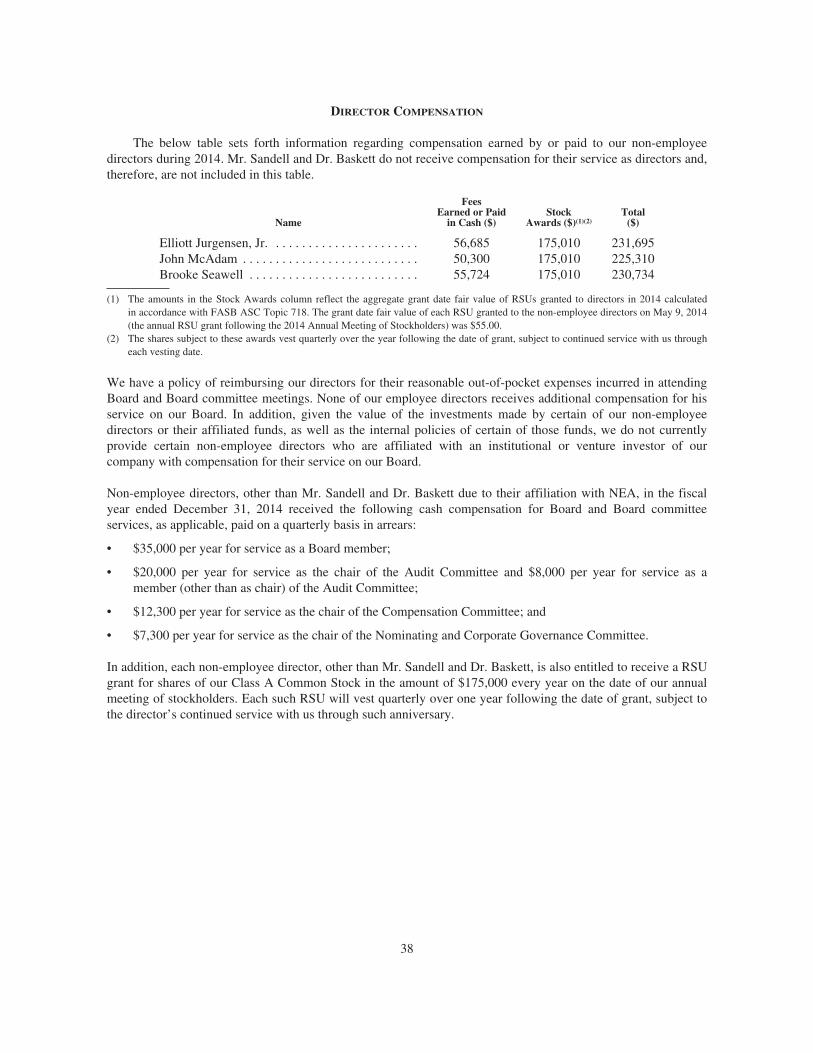
DIRECTOR COMPENSATION
The below table sets forth information regarding compensation earned by or paid to our non-employeedirectors during 2014. Mr. Sandell and Dr. Baskett do not receive compensation for their service as directors and,therefore, are not included in this table.
Name
FeesEarned or Paid
in Cash ($)Stock
Awards ($)(1)(2)Total
($)
Elliott Jurgensen, Jr. . . . . . . . . . . . . . . . . . . . . . . 56,685 175,010 231,695John McAdam . . . . . . . . . . . . . . . . . . . . . . . . . . . 50,300 175,010 225,310Brooke Seawell . . . . . . . . . . . . . . . . . . . . . . . . . . 55,724 175,010 230,734
(1) The amounts in the Stock Awards column reflect the aggregate grant date fair value of RSUs granted to directors in 2014 calculatedin accordance with FASB ASC Topic 718. The grant date fair value of each RSU granted to the non-employee directors on May 9, 2014(the annual RSU grant following the 2014 Annual Meeting of Stockholders) was $55.00.
(2) The shares subject to these awards vest quarterly over the year following the date of grant, subject to continued service with us througheach vesting date.
We have a policy of reimbursing our directors for their reasonable out-of-pocket expenses incurred in attendingBoard and Board committee meetings. None of our employee directors receives additional compensation for hisservice on our Board. In addition, given the value of the investments made by certain of our non-employeedirectors or their affiliated funds, as well as the internal policies of certain of those funds, we do not currentlyprovide certain non-employee directors who are affiliated with an institutional or venture investor of ourcompany with compensation for their service on our Board.
Non-employee directors, other than Mr. Sandell and Dr. Baskett due to their affiliation with NEA, in the fiscalyear ended December 31, 2014 received the following cash compensation for Board and Board committeeservices, as applicable, paid on a quarterly basis in arrears:
• $35,000 per year for service as a Board member;
• $20,000 per year for service as the chair of the Audit Committee and $8,000 per year for service as amember (other than as chair) of the Audit Committee;
• $12,300 per year for service as the chair of the Compensation Committee; and
• $7,300 per year for service as the chair of the Nominating and Corporate Governance Committee.
In addition, each non-employee director, other than Mr. Sandell and Dr. Baskett, is also entitled to receive a RSUgrant for shares of our Class A Common Stock in the amount of $175,000 every year on the date of our annualmeeting of stockholders. Each such RSU will vest quarterly over one year following the date of grant, subject tothe director’s continued service with us through such anniversary.
38
EQUITY COMPENSATION PLAN INFORMATION
The following table provides certain information with respect to all of the Company’s equity compensation plansin effect as of December 31, 2014.
Plan Category
Number of Securitiesto be Issued upon
Exercise ofOutstanding Options
and RSUs(2)
Weighted AverageExercise Price of
Outstanding Options(3)
Number of SecuritiesRemaining Available for
Future Issuance Under EquityCompensation Plans(4)
Equity Compensation Plans Approved ByStockholders(1) . . . . . . . . . . . . . . . . . . . . 11,334,540 $8.76 8,851,878
Equity Compensation Plans Not ApprovedBy Stockholders . . . . . . . . . . . . . . . . . . . — — —
Total . . . . . . . . . . . . . . . . . . . . . . . . . . . . . . 11,334,540 $8.76 8,851,878
(1) Includes securities issuable under our 2004 Equity Incentive Plan (the “2004 Plan”), 2013 Equity Incentive Plan (the “2013 Plan”) and2013 Employee Stock Purchase Plan (the “2013 ESPP”).
(2) Consists of (i) options to purchase 231,912 shares of Class A common stock under our 2013 Plan and 8,283,967 shares of Class Bcommon stock under our 2004 Plan, and (ii) 2,818,661 shares of our Class A common stock subject to restricted stock unit awards underour 2013 Plan.
(3) Excludes restricted stock unit awards because they have no exercise price.(4) Includes 6,229,892 and 2,621,986 shares of Class A common stock available for issuance under the 2013 Plan and 2013 ESPP,
respectively. As of the date of our initial public offering, no further shares were available for issuance under the 2004 Plan. As ofDecember 31, 2014, we had not commenced any offering under the 2013 ESPP. Pursuant to the terms of our 2013 Plan and 2013 ESPP,an additional 3,493,410 and 698,682 shares of Class A common stock were added to the 2013 Plan and 2013 ESPP, respectively,effective January 1, 2015.
TRANSACTIONS WITH RELATED PERSONS
Please see Executive Compensation and Director Compensation for a description of compensation arrangementswith our named executive officers and directors.
Investor Rights Agreement
In July 2012, we entered into an Amended and Restated Investor Rights Agreement with the holders of ouroutstanding preferred stock and certain holders of our outstanding Class B common stock, including entities withwhich certain of our directors are affiliated. As of December 31, 2014, the holders of approximately 3.5 millionshares of our Class A and Class B common stock were entitled to rights with respect to the registration of theirshares.
Conversion Agreements
We have entered into conversion agreements with each of our founders, Christian Chabot, Christopher Stolte andPatrick Hanrahan, pursuant to which each founder has agreed to effect conversion of his shares of Class Bcommon stock into Class A common stock, effective automatically upon the termination of such founder’scontinuous service for any reason whatsoever, subject only to approval of our Board. In the conversionagreements, continuous service is defined to mean that the founder’s service with us, whether as an employee, amember of our Board or a consultant, is not interrupted or terminated. A mere change in capacity from employeeand member of our Board to that of a consultant would not result in a termination of continuous service as longas there is no interruption in service to us.
39
Indemnification Agreements
Our amended and restated certificate of incorporation and amended and restated bylaws provide that we willindemnify our directors and officers, and may indemnify our employees and other agents, to the fullest extentpermitted by the Delaware General Corporation Law. In addition, we have entered into indemnificationagreements with each of our current directors, officers and some of our employees. These agreements provide forthe indemnification of such persons for all reasonable expenses and liabilities incurred in connection with anyaction or proceeding brought against them by reason of the fact that they are or were serving in such capacity.We have obtained director and officer liability insurance to cover liabilities our directors and officers may incurin connection with their services to us.
Policies and Procedures for Transactions with Related Persons
We have adopted a policy that our executive officers, directors, nominees for election as a director, beneficialowners of more than 5% of any class of our common stock and any members of the immediate family of any ofthe foregoing persons are not permitted to enter into a related person transaction with us without the prior consentof our Audit Committee. Any request for us to enter into a transaction with an executive officer, director,nominee for election as a director, beneficial owner of more than 5% of any class of our common stock or anymember of the immediate family of any of the foregoing persons, in which the amount involved exceeds$100,000 and such person would have a direct or indirect interest, must first be presented to our AuditCommittee for review, consideration and approval. In approving or rejecting any such proposal, our AuditCommittee is to consider the material facts of the transaction, including, but not limited to, whether thetransaction is on terms no less favorable than terms generally available to an unaffiliated third party under thesame or similar circumstances and the extent of the related person’s interest in the transaction.
HOUSEHOLDING OF PROXY MATERIALS
The SEC has adopted rules that permit companies and intermediaries (e.g., brokers) to satisfy the deliveryrequirements for Notices of Internet Availability of Proxy Materials or other Annual Meeting materials withrespect to two or more stockholders sharing the same address by delivering a single Notice of InternetAvailability of Proxy Materials or other Annual Meeting materials addressed to those stockholders. This process,which is commonly referred to as “householding,” potentially means extra convenience for stockholders and costsavings for companies.
This year, a number of brokers with account holders who are Tableau stockholders will be “householding” theCompany’s proxy materials. A single Notice of Internet Availability of Proxy Materials will be delivered tomultiple stockholders sharing an address unless contrary instructions have been received from the affectedstockholders. Once you have received notice from us (if you are a stockholder of record) or from your broker (ifyou are a beneficial owner) that we or they will be “householding” communications to your address,“householding” will continue until you are notified otherwise or until you revoke your consent. If, at any time,you no longer wish to participate in “householding” and would prefer to receive a separate Notice of InternetAvailability of Proxy Materials, or if you currently receive multiple copies and would like to request“householding” of your communications, please notify your broker or the Company. Direct your written requestto the Company to our Corporate Secretary at Tableau Software, Inc., 837 North 34th Street, Suite 200, Seattle,Washington 98103, or contact our Corporate Secretary at (206) 633-3400.
40
OTHER MATTERS
The Board of Directors knows of no other matters that will be presented for consideration at the Annual Meeting.If any other matters are properly brought before the meeting, it is the intention of the persons named in theaccompanying proxy to vote on such matters in accordance with their best judgment.
By Order of the Board of Directors
Keenan ConderVice President, General Counsel and Corporate Secretary
March 31, 2015
A copy of the Company’s Annual Report on Form 10-K for the fiscal year ended December 31, 2014 filedwith the SEC is available without charge upon written request to: Tableau Software, Inc., Attn: CorporateSecretary, 837 North 34th Street, Suite 200, Seattle, Washington 98103.
41