Embed Size (px)
Citation preview


To Our Shareholders and Friends:
������������� ������������ ����
�� �����������������The Wizard of Oz
Webster defines wizard as: “Having unique or special powers; a magician, a master or expert; outstandingly clever in some specified field or fields; one who performs skillfully or with special powers”.
Some were broken and needed repair. Others had unrealized strengths and potentials that just needed some skillful guidance.
� All were, in our unique vision, fixable and growable.

� �� ������������������� ���Our journey began with a combination of good solid business fundamentals strengthened by criteria that have become our identity over the years.
magical one for JJSF.
��� ����������������� ��������� ����� ���
������������ ����������������
Sincerely,

UNITED STATESSECURITIES AND EXCHANGE COMMISSION
Washington, D.C. 20549
FORM 10-K
H ANNUAL REPORT PURSUANT TO SECTION 13 OR 15(d) OF THE SECURITIESEXCHANGE ACT OF 1934 FOR THE FISCAL YEAR ENDED SEPTEMBER 25, 2010
h TRANSITION REPORT PURSUANT TO SECTION 13 OR 15 (d) OF THE SECURITIESEXCHANGE ACT OF 1934 FOR THE TRANSITION PERIOD FROM __________TO __________
Commission File No. 0-14616
J & J SNACK FOODS CORP.(Exact name of registrant as specified in its charter)
New Jersey(State or other jurisdiction ofincorporation or organization)
22-1935537(I.R.S. Employer Identification No.)
6000 Central Highway, Pennsauken, New Jersey(Address of principal executive offices)
08109(Zip Code)
Registrant’s telephone number, including area code: (856) 665-9533Securities Registered Pursuant to Section 12(b) of the Act:
Title of Each Class Name of Each Exchange on Which RegisteredCommon Stock, no par value The NASDAQ Global Select Exchange
Securities Registered Pursuant to Section 12(g) of the Act: NoneIndicate by check mark if the registrant is a well-known seasoned issuer, as defined in Rule 405 of the Securities Act. Yes h No H
Indicate by check mark if the registrant is not required to file reports pursuant to Section 13 or 15(d) of the Act. Yes h No H
Indicate by check mark whether the registrant (1) has filed all reports required to be filed by Section 13 or 15(d) of the SecuritiesExchange Act of 1934 during the preceding 12 months (or such shorter period that the registrant was required to file such reports),and (2) has been subject to such filing requirements for the past 90 days. Yes H No h
Indicate by check mark whether the registrant has submitted electronically and posted on its corporate Web site, if any, everyInteractive Data File required to be submitted and posted pursuant to Rule 405 of Regulation S-T (§232.405 of this chapter) duringthe preceding 12 months (or for such shorter period that the registrant was required to submit and post such files).
Yes h No h
Indicate by check mark if disclosure of delinquent filers pursuant to Item 405 of Regulation S-K (229.405 of this chapter)is not contained herein, and will not be contained, to the best of Registrant’s knowledge, in definitive proxy or information statementsincorporated by reference in Part III of this Form 10-K or any amendment to this Form 10-K. H
Indicate by check mark whether the registrant is a large accelerated filer, an accelerated filer, a non-accelerated filer, or a smallerreporting company. See the definitions of “large accelerated filer,” “accelerated filer,” “non-accelerated filer” and “smaller reportingcompany” in Rule 12b-2 of the Exchange Act. (Check one):
Large accelerated filer h Accelerated filer HNon-accelerated filer h Smaller reporting company h(Do not check if a smaller reportingcompany)
Indicate by check mark whether the registrant is a shell company (as defined in Rule 12b-2 of the ExchangeAct). Yes h No H
As of November 26, 2010, the latest practicable date, 18,511,537 shares of the Registrant’s common stock were issued andoutstanding. The aggregate market value of shares held by non-affiliates of the Registrant on such date was $634,133,219 basedon the last sale price on March 26, 2010 of $44.32 per share. March 26, 2010 was the last business day of the registrant’s mostrecently completed second fiscal quarter.
DOCUMENTS INCORPORATED BY REFERENCEPortions of the registrant’s definitive proxy statement for its Annual Meeting of Shareholders scheduled for February 9,
2011 are incorporated by reference into Part III of this report.

J & J SNACK FOODS CORP.2010 FORM 10-K ANNUAL REPORT
TABLE OF CONTENTS
Page
PART IItem 1 Business . . . . . . . . . . . . . . . . . . . . . . . . . . . . . . . . . . . . . . . . . . . . . . . . . . . . . . . . . . . . . . . . . . . . . . . . . . . . . . . . . . . . . . . . 1
Item 1A Risk Factors . . . . . . . . . . . . . . . . . . . . . . . . . . . . . . . . . . . . . . . . . . . . . . . . . . . . . . . . . . . . . . . . . . . . . . . . . . . . . . . . . . . . 6
Item 1B Unresolved Staff Comments . . . . . . . . . . . . . . . . . . . . . . . . . . . . . . . . . . . . . . . . . . . . . . . . . . . . . . . . . . . . . . . . . . . . 8
Item 2 Properties . . . . . . . . . . . . . . . . . . . . . . . . . . . . . . . . . . . . . . . . . . . . . . . . . . . . . . . . . . . . . . . . . . . . . . . . . . . . . . . . . . . . . . . 8
Item 3 Legal Proceedings . . . . . . . . . . . . . . . . . . . . . . . . . . . . . . . . . . . . . . . . . . . . . . . . . . . . . . . . . . . . . . . . . . . . . . . . . . . . . . 10
Item 4 Submission Of Matters To A Vote Of Security Holders . . . . . . . . . . . . . . . . . . . . . . . . . . . . . . . . . . . . . . . . . 10
PART IIItem 5 Market For Registrant’s Common Equity, Related Stockholder Matters And Issuer
Purchases Of Equity Securities . . . . . . . . . . . . . . . . . . . . . . . . . . . . . . . . . . . . . . . . . . . . . . . . . . . . . . . . . . . . . . . . . 11
Item 6 Selected Financial Data . . . . . . . . . . . . . . . . . . . . . . . . . . . . . . . . . . . . . . . . . . . . . . . . . . . . . . . . . . . . . . . . . . . . . . . . . 12
Item 7 Management’s Discussion And Analysis Of Financial Condition And Results Of Operations . . . 13
Item 7A Quantitative And Qualitative Disclosures About Market Risk . . . . . . . . . . . . . . . . . . . . . . . . . . . . . . . . . . . 23
Item 8 Financial Statements And Supplementary Data . . . . . . . . . . . . . . . . . . . . . . . . . . . . . . . . . . . . . . . . . . . . . . . . . 23
Item 9 Changes In And Disagreements With Accountants On Accounting And Financial Disclosure . . . 24
Item 9A Controls and Procedures . . . . . . . . . . . . . . . . . . . . . . . . . . . . . . . . . . . . . . . . . . . . . . . . . . . . . . . . . . . . . . . . . . . . . . . . 24
Item 9B Other Information . . . . . . . . . . . . . . . . . . . . . . . . . . . . . . . . . . . . . . . . . . . . . . . . . . . . . . . . . . . . . . . . . . . . . . . . . . . . . . 25
PART IIIItem 10 Directors, Executive Officers and Corporate Governance . . . . . . . . . . . . . . . . . . . . . . . . . . . . . . . . . . . . . . . 25
Item 11 Executive Compensation . . . . . . . . . . . . . . . . . . . . . . . . . . . . . . . . . . . . . . . . . . . . . . . . . . . . . . . . . . . . . . . . . . . . . . . . 25
Item 12 Security Ownership Of Certain Beneficial Owners And Management And RelatedStockholder Matters . . . . . . . . . . . . . . . . . . . . . . . . . . . . . . . . . . . . . . . . . . . . . . . . . . . . . . . . . . . . . . . . . . . . . . . . . . . . 26
Item 13 Certain Relationships And Related Transactions, and Director Independence . . . . . . . . . . . . . . . . . . . 26
Item 14 Principal Accountant Fees and Services . . . . . . . . . . . . . . . . . . . . . . . . . . . . . . . . . . . . . . . . . . . . . . . . . . . . . . . . 26
PART IVItem 15 Exhibits, Financial Statement Schedules. . . . . . . . . . . . . . . . . . . . . . . . . . . . . . . . . . . . . . . . . . . . . . . . . . . . . . . . 26
In addition to historical information, this document and analysis contains forward-looking statements. Theforward-looking statements contained herein are subject to certain risks and uncertainties that could cause actual resultsto differ materially from those projected in the forward-looking statements. Important factors that might cause sucha difference include, but are not limited to, those discussed in the “Management’s Discussion and Analysis of FinancialCondition and Results of Operations.” Readers are cautioned not to place undue reliance on these forward-lookingstatements, which reflect management’s analysis only as of the date hereof. We undertake no obligation to publiclyrevise or update these forward-looking statements to reflect events or circumstances that arise after the date hereof.

PART I
Item 1. Business
General
J & J Snack Foods Corp. (the “Company” or “J & J”) manufactures nutritional snack foods and distributesfrozen beverages which it markets nationally to the food service and retail supermarket industries. The Company’sprincipal snack food products are soft pretzels marketed primarily under the brand name SUPERPRETZEL andfrozen juice treats and desserts marketed primarily under the LUIGI’S, FRUIT-A-FREEZE, WHOLE FRUIT, ICEE,BARQ’S* and MINUTE MAID** brand names. J & J believes it is the largest manufacturer of soft pretzels inthe United States, Mexico and Canada. Other snack food products include churros (an Hispanic pastry), funnel cakeand bakery products. The Company’s principal frozen beverage products are the ICEE brand frozen carbonatedbeverage and the SLUSH PUPPIE brand frozen uncarbonated beverage.
The Company’s Food Service and Frozen Beverages sales are made primarily to food service customersincluding snack bar and food stand locations in leading chain, department, discount, warehouse club andconvenience stores; malls and shopping centers; fast food outlets; stadiums and sports arenas; leisure and themeparks; movie theatres; independent retailers; and schools, colleges and other institutions. The Company’s retailsupermarket customers are primarily supermarket chains. The Company’s restaurant group sells direct to the publicthrough its specialty snack food retail outlets, BAVARIAN PRETZEL BAKERY. At September 25, 2010, twooutlets remained open.
The Company was incorporated in 1971 under the laws of the State of New Jersey.
The Company has made acquisitions in 2010 and in prior years as described in “Management’s Discussionand Analysis of Financial Condition and Results of Operations” and our consolidated financial statements andrelated notes thereto.
The Company operates in four business segments: Food Service, Retail Supermarkets, The Restaurant Groupand Frozen Beverages. These segments are described below.
The Chief Operating Decision Maker for Food Service, Retail Supermarkets and The Restaurant Group andthe Chief Operating Decision Maker for Frozen Beverages monthly review detailed operating income statementsand sales reports in order to assess performance and allocate resources to each individual segment. Sales isconsidered to be the one and only key variable monitored by the Chief Operating Decision Makers and managementwhen determining each segment’s and the company’s financial condition and operating performance. In addition,the Chief Operating Decision Makers review and evaluate depreciation, capital spending and assets of each segmenton a quarterly basis to monitor cash flow and asset needs of each segment (see Item 7 — Management’s Discussionand Analysis of Financial Condition and Results of Operations and Item 8 — Financial Statements andSupplementary Data for financial information about segments).
Food Service
The primary products sold by the food service segment are soft pretzels, frozen juice treats and desserts, churrosand baked goods. Our customers in the food service segment include snack bars and food stands in chain, departmentand discount stores; malls and shopping centers; fast food outlets; stadiums and sports arenas; leisure and themeparks; convenience stores; movie theatres; warehouse club stores; schools, colleges and other institutions.Within the food service industry, our products are purchased by the consumer primarily for consumption at thepoint-of-sale.
* BARQ’S is a registered trademark of Barq’s Inc.** MINUTE MAID is a registered trademark of the Coca-Cola Company
1

Retail Supermarkets
The primary products sold to the retail supermarket channel are soft pretzel products — includingSUPERPRETZEL, frozen juice treats and desserts including LUIGI’S Real Italian Ice, MINUTE MAID Juice Barsand Soft Frozen Lemonade, WHOLE FRUIT frozen fruit bars and sorbet, ICEE Squeeze-Up Tubes, TIO PEPE’SChurros and CALIFORNIA CHURROS. Within the retail supermarket channel, our frozen and prepackagedproducts are purchased by the consumer for consumption at home.
The Restaurant Group
We sell direct to the public through our Restaurant Group, which operates BAVARIAN PRETZEL BAKERY.At September 25, 2010, we had two retail stores.
Frozen Beverages
We sell frozen beverages to the food service industry primarily under the names ICEE, SLUSH PUPPIE,PARROT ICE and ARCTIC BLAST in the United States, Mexico and Canada. We also provide repair andmaintenance service to customers for customers’ owned equipment.
Products
Soft Pretzels
The Company’s soft pretzels are sold under many brand names; some of which are: SUPERPRETZEL,PRETZEL FILLERS, PRETZELFILS, GOURMET TWISTS, MR. TWISTER, SOFT PRETZEL BITES,SOFTSTIX, SOFT PRETZEL BUNS, HOT KNOTS, DUTCH TWIST, TEXAS TWIST, SANDWICH TWIST,CINNAPRETZEL* and SERIOUSLY TWISTED!; and, to a lesser extent, under private labels. Soft pretzels aresold in the Food Service, Retail Supermarket and The Restaurant Group segments. Soft pretzel sales amounted to19% of the Company’s revenue in fiscal year 2010, 20% in 2009, and 20% in 2008.
The Company’s soft pretzels qualify under USDAregulations as the nutritional equivalent of bread for purposesof the USDA school lunch program, thereby enabling a participating school to obtain partial reimbursement of thecost of the Company’s soft pretzels from the USDA.
The Company’s soft pretzels are manufactured according to a proprietary formula. Soft pretzels, ranging insize from one to ten ounces in weight, are shaped and formed by the Company’s twister machines. These soft pretzeltying machines are automated, high-speed machines for twisting dough into the traditional pretzel shape.Additionally, we make soft pretzels which are extruded or shaped by hand. Soft pretzels, after processing, areprimarily quick-frozen in either raw or baked form and packaged for delivery.
The Company’s principal marketing program in the Food Service segment includes supplying ovens, mobilemerchandisers, display cases, warmers and similar merchandising equipment to the retailer to prepare and promotethe sale of soft pretzels. Some of this equipment is proprietary, including combination warmer and display casesthat reconstitute frozen soft pretzels while displaying them, thus eliminating the need for an oven. The Companyretains ownership of the equipment placed in customer locations, and as a result, customers are not required to makean investment in equipment.
Frozen Juice Treats and Desserts
The Company’s frozen juice treats and desserts are marketed primarily under the LUIGI’S, FRUIT-A-FREEZE, WHOLE FRUIT, ICEE, BARQ’S and MINUTE MAID brand names. Frozen juice treats and dessertsare sold in the Food Service and Retail Supermarkets segments. Frozen juice treats and dessert sales were 14%of the Company’s revenue in 2010, 13% in fiscal year 2009 and 13% in 2008.
The Company’s school food service MINUTE MAID and WHOLE FRUIT frozen juice fruit bars aremanufactured from an apple or pear juice base to which water, sweeteners, coloring (in some cases) and flavorings
* CINNAPRETZEL is a registered trademark of Cinnabon, Inc.
2

are added. The juice bars contain two to three ounces of apple or pear juice and the minimum daily requirementof vitamin C, and qualify as reimbursable items under the USDA school lunch program. The juice bars are producedin various flavors and are packaged in a sealed push-up paper container referred to as the Milliken M-pak, whichthe Company believes has certain sanitary and safety advantages.
The balance of the Company’s frozen juice treats and desserts products are manufactured from water, sweetenersand fruit juice concentrates in various flavors and packaging including cups, tubes, sticks, M-paks, pints and tubs.Several of the products contain ice cream and FRUIT-A-FREEZE and WHOLE FRUIT contain pieces of fruit.
Churros
The Company’s churros are sold primarily under the LA CHURROS, TIO PEPE’S and CALIFORNIACHURROS brand names. Churros are sold to the Food Service and Retail Supermarkets segments. Churro saleswere 5% of the Company’s sales in fiscal year 2010, 5% in 2009 and 4% in 2008. Churros are Hispanic pastriesin stick form which the Company produces in several sizes according to a proprietary formula. The churros aredeep fried, frozen and packaged. At food service point-of-sale they are reheated and topped with a cinnamon sugarmixture. The Company also sells fruit and creme-filled churros. The Company supplies churro merchandisingequipment similar to that used for its soft pretzels.
Bakery Products
The Company’s bakery products are marketed under the MRS. GOODCOOKIE, CAMDEN CREEKBAKERY, READI-BAKE, COUNTRY HOME, MARY B’S, DADDY RAY’S and PRETZEL COOKIE brandnames, and under private labels. Bakery products include primarily biscuits, fig and fruit bars, cookies, muffinsand donuts. Bakery products are sold to the Food Service segment. Bakery products sales amounted to 34% of theCompany’s sales in fiscal year 2010, 35% in 2009 and 35% in 2008.
Frozen Beverages
The Company markets frozen beverages primarily under the names ICEE, SLUSH PUPPIE, PARROT ICEand ARCTIC BLAST in the United States, Mexico and Canada. Additional frozen beverages are JAVA FREEZEand CALIFORNIA NATURAL. Frozen beverages are sold in The Restaurant Group and Frozen Beveragessegments.
Frozen beverage sales amounted to 18% of revenue in fiscal 2010, 17% in 2009 and 18% in 2008.
Under the Company’s principal marketing program for frozen carbonated beverages, it installs frozen beveragedispensers for its ICEE and ARCTIC BLAST brands at customer locations and thereafter services the machines,arranges to supply customers with ingredients required for production of the frozen beverages, and supportscustomer retail sales efforts with in-store promotions and point-of-sale materials. In most cases, the Company retainsownership of its dispensers, and as a result, customers are not required to make an investment in equipment orarrange for the ingredients and supplies necessary to produce and market the frozen beverages. The Company alsoprovides repair and maintenance service to customers for customers’ owned equipment and sells equipment in itsFrozen Beverages segment, revenue from which amounted to 8% of sales in 2010, 8% of sales in 2009 and 9%of the Company’s sales in fiscal year 2008. The Company sells frozen uncarbonated beverages under the SLUSHPUPPIE and PARROT ICE brands through a distributor network and through its own distribution network.
Each new frozen carbonated customer location requires a frozen beverage dispenser supplied by the Companyor by the customer. Company-supplied frozen carbonated dispensers are purchased from outside vendors, built newor rebuilt by the Company.
The Company provides managed service and/or products to approximately 75,000 Company-owned andcustomer-owned dispensers.
The Company has the rights to market and distribute frozen beverages under the name ICEE to the entirecontinental United States (except for portions of nine states) as well as internationally.
3

Other Products
Other products sold by the Company include soft drinks, funnel cakes sold under the FUNNEL CAKEFACTORY brand name and smaller amounts of various other food products. These products are sold in the FoodService, The Restaurant Group and Frozen Beverages segments.
Customers
The Company sells its products to two principal channels: food service and retail supermarkets. The primaryproducts sold to the food service channel are soft pretzels, frozen beverages, frozen juice treats and desserts, churrosand baked goods. The primary products sold to the retail supermarket channel are soft pretzels and frozen juicetreats and desserts. Additionally, the Company sells soft pretzels, frozen beverages and various other food productsdirect to the public through its Restaurant Group, which operates BAVARIAN PRETZEL BAKERY. AtSeptember 25, 2010, we had two retail stores.
We have several large customers that account for a significant portion of our sales. Our top ten customersaccounted for 42%, 43% and 42% of our sales during fiscal years 2010, 2009 and 2008, respectively, with our largestcustomer accounting for 8% of our sales in 2010, 9% in 2009 and 9% in 2008. Three of the ten customers are fooddistributors who sell our product to many end users. The loss of one or more of our large customers could adverselyaffect our results of operations. These customers typically do not enter into long-term contracts and make purchasedecisions based on a combination of price, product quality, consumer demand and customer service performance.If our sales to one or more of these customers are reduced, this reduction may adversely affect our business. Ifreceivables from one or more of these customers become uncollectible, our operating income would be adverselyimpacted.
The Food Service and the Frozen Beverages segments sell primarily to food service channels. The RetailSupermarkets segment sells to the retail supermarket channel.
The Company’s customers in the food service segment include snack bars and food stands in chain, departmentand mass merchandising stores, malls and shopping centers, fast food outlets, stadiums and sports arenas, leisureand theme parks, convenience stores, movie theatres, warehouse club stores, schools, colleges and other institutions,and independent retailers. Machines and machine parts are sold to other food and beverage companies. Within thefood service industry, the Company’s products are purchased by the consumer primarily for consumption at thepoint-of-sale.
The Company sells its products to an estimated 85-90% of supermarkets in the United States. Products soldto retail supermarket customers are primarily soft pretzel products, including SUPERPRETZEL, frozen juice treatsand desserts including LUIGI’S Real Italian Ice, MINUTE MAID Juice Bars and Soft Frozen Lemonade, WHOLEFRUIT frozen fruit bars, WHOLE FRUIT Sorbet, MARY B’S biscuits and dumplings, DADDY RAY’S fig andfruit bars, ICEE Squeeze-Up Tubes and TIO PEPE’S Churros. Within the retail supermarket industry, the Company’sfrozen and prepackaged products are purchased by the consumer for consumption at home.
Marketing and Distribution
The Company has developed a national marketing program for its products. For Food Service and FrozenBeverages segments’ customers, this marketing program includes providing ovens, mobile merchandisers, displaycases, warmers, frozen beverage dispensers and other merchandising equipment for the individual customer’srequirements and point-of-sale materials as well as participating in trade shows and in-store demonstrations.The Company’s ongoing advertising and promotional campaigns for its Retail Supermarket segment’s productsinclude trade shows, newspaper advertisements with coupons, in-store demonstrations and consumer advertisingcampaigns.
The Company develops and introduces new products on a routine basis. The Company evaluates the successof new product introductions on the basis of sales levels, which are reviewed no less frequently than monthly bythe Company’s Chief Operating Decision Makers.
The Company’s products are sold through a network of about 200 food brokers and over 1,000 independentsales distributors and the Company’s own direct sales force. For its snack food products, the Company maintains
4

warehouse and distribution facilities in Pennsauken, Bellmawr and Bridgeport, New Jersey; Vernon (Los Angeles)and Colton, California; Scranton, Pittsburgh, Hatfield and Lancaster, Pennsylvania; Carrollton (Dallas), Texas;Atlanta, Georgia; Moscow Mills (St. Louis), Missouri; Pensacola, Florida; and Solon, Ohio. Frozen beverages aredistributed from 130 Company managed warehouse and distribution facilities located in 44 states, Mexico andCanada, which allow the Company to directly service its customers in the surrounding areas. The Company’sproducts are shipped in refrigerated and other vehicles from the Company’s manufacturing and warehouse facilitieson a fleet of Company operated tractor-trailers, trucks and vans, as well as by independent carriers.
Seasonality
The Company’s sales are seasonal because frozen beverage sales and frozen juice treats and desserts sales aregenerally higher during the warmer months.
Trademarks and Patents
The Company has numerous trademarks, the most important of which are SUPERPRETZEL, DUTCH TWIST,TEXAS TWIST, MR. TWISTER, SOFT PRETZEL BITES, SOFTSTIX, PRETZEL FILLERS and PRETZELFILSfor its pretzel products; FROSTAR, SHAPE-UPS, MAMA TISH’S, FRUIT-A-FREEZE, WHOLE FRUIT andLUIGI’S for its frozen juice treats and desserts; TIO PEPE’S and CALIFORNIA CHURROS for its churros;ARCTIC BLAST, SLUSH PUPPIE and PARROT ICE for its frozen beverages; FUNNEL CAKE FACTORY forits funnel cake products, and MRS. GOODCOOKIE, READI-BAKE, COUNTRY HOME, CAMDEN CREEK,MARY B’S and DADDY RAY’S for its bakery products.
The Company markets frozen beverages under the trademark ICEE in all of the continental United States,except for portions of nine states, and in Mexico and Canada. Additionally, the Company has the international rightsto the trademark ICEE.
The trademarks, when renewed and continuously used, have an indefinite term and are considered importantto the Company as a means of identifying its products. The Company considers its trademarks important to thesuccess of its business.
The Company has numerous patents related to the manufacturing and marketing of its product.
Supplies
The Company’s manufactured products are produced from raw materials which are readily available fromnumerous sources. With the exception of the Company’s soft pretzel twisting equipment and funnel cake productionequipment, which are made for J & J by independent third parties, and certain specialized packaging equipment,the Company’s manufacturing equipment is readily available from various sources. Syrup for frozen beverages ispurchased primarily from The Coca-Cola Company, Dr Pepper/Seven Up, Inc., the Pepsi Cola Company, and Jogue,Inc. Cups, straws and lids are readily available from various suppliers. Parts for frozen beverage dispensingmachines are purchased from several sources. Frozen beverage dispensers are purchased primarily from IMICornelius, Inc. and FBD Partnership.
Competition
Snack food and bakery products markets are highly competitive. The Company’s principal products competeagainst similar and different food products manufactured and sold by numerous other companies, some of whichare substantially larger and have greater resources than the Company. As the soft pretzel, frozen juice treat anddessert, bakery products and related markets grow, additional competitors and new competing products may enterthe markets. Competitive factors in these markets include product quality, customer service, taste, price, identityand brand name awareness, method of distribution and sales promotions.
The Company believes it is the only national distributor of soft pretzels. However, there are numerous regionaland local manufacturers of food service and retail supermarket soft pretzels as well as several chains of retailpretzel stores.
In Frozen Beverages the Company competes directly with other frozen beverage companies. These includeseveral companies which have the right to use the ICEE name in portions of nine states. There are many other
5

regional frozen beverage competitors throughout the country and one large retail chain which uses its own frozenbeverage brand.
The Company competes with large soft drink manufacturers for counter and floor space for its frozen beveragedispensing machines at retail locations and with products which are more widely known than the ICEE, SLUSHPUPPIE, PARROT ICE and ARCTIC BLAST frozen beverages.
The Company competes with a number of other companies in the frozen juice treat and dessert and bakeryproducts markets.
Risks Associated with Foreign Operations
Foreign operations generally involve greater risk than doing business in the United States. Foreign economiesdiffer favorably or unfavorably from the United States’ economy in such respects as the level of inflation and debt,which may result in fluctuations in the value of the country’s currency and real property. Sales of our foreignoperations were $14,301,000, $11,658,000 and $11,078,000 in fiscal years 2010, 2009 and 2008, respectively.At September 25, 2010, the total assets of our foreign operations were approximately $10.4 million or 2% oftotal assets.
Employees
The Company has approximately 2,700 full and part time employees as of September 25, 2010. Certainproduction and distribution employees at the Pennsauken and Bridgeport, New Jersey plants are covered by acollective bargaining agreement which expires in September 2013.
The production employees at our Atlanta, Georgia plant are covered by a collective bargaining agreementwhich expires in January 2011. The Company considers its employee relations to be good.
Available Information
The Company’s internet address is www.jjsnack.com. On the investor relations section of its website, theCompany provides free access to its annual report on Form 10-K, quarterly reports on Form 10-Q, current reportson Form 8-K and any amendments to these reports, as soon as reasonably practicable after such material iselectronically filed with, or furnished to, the Securities and Exchange Commission (“SEC”). The information onthe website listed above is not and should not be considered part of this annual report on Form 10-K and is notincorporated by reference in this document.
Item 1A. Risk Factors
You should carefully consider the risks described below, together with all of the other information includedin this report, in considering our business and prospects. The risks and uncertainties described below are not theonly ones facing us. Additional risks and uncertainties not presently known to us or that we currently deeminsignificant may also impair our business operations. Following is a discussion of known potentially significantrisks which could result in harm to our business, financial condition or results of operations.
Risks of Shortages or Increased Cost of Raw Materials
We are exposed to the market risks arising from adverse changes in commodity prices, affecting the cost ofour raw materials and energy. The raw materials and energy which we use for the production and distribution ofour products are largely commodities that are subject to price volatility and fluctuations in availability caused bychanges in global supply and demand, weather conditions, agricultural uncertainty or governmental controls. Wepurchase these materials and energy mainly in the open market. If commodity price changes result in increasesin raw materials and energy costs, we may not be able to increase our prices to offset these increased costs withoutsuffering reduced volume, revenue and operating income.
6

General Risks of the Food Industry
Food processors are subject to the risks of adverse changes in general economic conditions; evolving consumerpreferences and nutritional and health-related concerns; changes in food distribution channels; federal, state andlocal food processing controls or other mandates; consumer product liability claims; and risks of product tampering.The increased buying power of large supermarket chains, other retail outlets and wholesale food vendors couldresult in greater resistance to price increases and could alter the pattern of customer inventory levels and accessto shelf space.
Environmental Risks
The disposal of solid and liquid waste material resulting from the preparation and processing of foods aresubject to various federal, state and local laws and regulations relating to the protection of the environment. Suchlaws and regulations have an important effect on the food processing industry as a whole, requiring substantiallyall firms in the industry to incur material expenditures for modification of existing processing facilities and forconstruction of upgraded or new waste treatment facilities.
We cannot predict what environmental legislation or regulations will be enacted in the future, how existingor future laws or regulations will be administered or interpreted or what environmental conditions may be foundto exist. Enactment of more stringent laws or regulations or more strict interpretation of existing laws and regulationsmay require additional expenditures by us, some of which could be material.
Risks Resulting from Several Large Customers
We have several large customers that account for a significant portion of our sales. Our top ten customersaccounted for 42%, 43% and 42% of our sales during fiscal years 2010, 2009 and 2008, respectively, with our largestcustomer accounting for 8% of our sales in 2010, 9% in 2009 and 9% in 2008. Three of the ten customers arefood distributors who sell our product to many end users. The loss of one or more of our large customers couldadversely affect our results of operations. These customers typically do not enter into long-term contracts and makepurchase decisions based on a combination of price, product quality, consumer demand and customer serviceperformance. If our sales to one or more of these customers are reduced, this reduction may adversely affect ourbusiness. If receivables from one or more of these customers become uncollectible, our operating income wouldbe adversely impacted.
Competition
Our businesses operate in highly competitive markets. We compete against national and regional manufacturersand distributors on the basis of price, quality, product variety and effective distribution. Many of our majorcompetitors in the market are larger and have greater financial and marketing resources than we do. Increasedcompetition and anticipated actions by our competitors could lead to downward pressure on prices and/or a declinein our market share, either of which could adversely affect our results. See “Competition” in Item 1 for moreinformation about our competitors.
Risks Relating to Manufacturing
Our ability to purchase, manufacture and distribute products is critical to our success. Damage or disruptionto our manufacturing or distribution capabilities due to weather, natural disaster, fire or explosion, terrorism,pandemic, political upheaval, strikes or other reasons could impair our ability to manufacture or distribute ourproducts.
Our Certificate of Incorporation may inhibit a change in control that you may favor
Our Certificate of Incorporation contains provisions that may delay, deter or inhibit a future acquisition ofJ & J Snack Foods Corp. not approved by our Board of Directors. This could occur even if our shareholders are offeredan attractive value for their shares or if a substantial number or even a majority of our shareholders believe thetakeover is in their best interest. These provisions are intended to encourage any person interested in acquiring us
7

to negotiate with and obtain the approval of our Board of Directors in connection with the transaction. Provisionsthat could delay, deter or inhibit a future acquisition include the following:
— a classified Board of Directors;
— the requirement that our shareholders may only remove Directors for cause;
— limitations on share holdings and voting of certain persons;
— special Director voting rights; and
— the ability of the Board of Directors to consider the interests of various constituencies, including our employees,customers, suppliers, creditors and the local communities in which we operate.
Risks Relating to the Control by Gerald B. Shreiber
Gerald B. Shreiber is the founder of the Company and the current beneficial owner of 22% of its outstandingstock. Our Certificate of Incorporation provides that he has three votes on the Board of Directors (subject to certainadjustments). Therefore, he and one other director have voting control of the Board. The performance of thisCompany is greatly impacted by his leadership and decisions. His voting control reduces the restrictions on hisactions. His retirement, disability or death may have a significant impact on our future operations.
Risk Related to Product Changes
There are risks in the marketplace related to trade and consumer acceptance of product improvements, packinginitiatives and new product introductions.
Risks Related to Change in the Business
Our ability to successfully manage changes to our business processes, including selling, distribution, productcapacity, information management systems and the integration of acquisitions, will directly affect our results ofoperations.
Risks Associated with Foreign Operations
Foreign operations generally involve greater risk than doing business in the United States. Foreign economiesdiffer favorably or unfavorably from the United States’ economy in such respects as the level of inflation and debt,which may result in fluctuations in the value of the country’s currency and real property. Further, there may be lessgovernment regulation in various countries, and difficulty in enforcing legal rights outside the United States.Additionally, in some foreign countries, there is the possibility of expropriation or confiscatory taxation limitationson the removal of property or other assets, political or social instability or diplomatic developments which couldaffect the operations and assets of U.S. companies doing business in that country. Sales of our foreign operationswere $14,301,000, $11,658,000, and $11,078,000 in fiscal years 2010, 2009 and 2008, respectively. AtSeptember 25, 2010, the total assets of our foreign operations were approximately $10.4 million or 2% of total assets.
Seasonality and Quarterly Fluctuations
Our sales are affected by the seasonal demand for our products. Demand is greater during the summer monthsprimarily as a result of the warm weather demand for our ICEE and frozen juice treats and desserts products. Becauseof seasonal fluctuations, there can be no assurance that the results of any particular quarter will be indicative ofresults for the full year or for future years.
Item 1B. Unresolved Staff Comments
We have no unresolved SEC staff comments to report.
Item 2. Properties
The Company’s primary east coast manufacturing facility is located in Pennsauken, New Jersey in a 70,000square foot building on a two-acre lot. Soft pretzels are manufactured at this Company-owned facility which alsoserves as the Company’s corporate headquarters. This facility operates at approximately 65% of capacity. The
8

Company owns a 128,000 square foot building adjacent to its manufacturing facility in Pennsauken, New Jersey.The Company has constructed a large freezer within this facility for warehousing and distribution purposes. Thewarehouse has a utilization rate of 80–90% depending on product demand. The Company also leases, throughJanuary 2022, 52,000 square feet of office and warehouse space located next to the Pennsauken, New Jersey plant.
The Company owns a 150,000 square foot building on eight acres in Bellmawr, New Jersey. The facility isused by the Company to manufacture some of its products including funnel cake, pretzels, churros and cookies.The facility operates at about 85% of capacity.
The Company’s primary west coast manufacturing facility is located in Vernon (Los Angeles), California. Itconsists of a 137,000 square foot facility in which soft pretzels, churros and various lines of baked goods areproduced and warehoused. Included in the 137,000 square foot facility is a 30,000 square foot freezer used forwarehousing and distribution purposes which was constructed in 1996. The facility is leased through November2030. The Company leases an additional 80,000 square feet of office and warehouse space, adjacent to itsmanufacturing facility, through November 2030. The manufacturing facility operates at approximately 45%of capacity.
The Company leases through June 2015 a 45,000 square foot churros manufacturing facility located in Colton,California which operates at approximately 70% of capacity.
The Company leases through November 2017 a 25,000 square foot frozen juice treat and dessert manufacturingfacility located in Norwalk (Los Angeles), California which operates at approximately 40% of capacity.
The Company leases an 85,000 square foot bakery manufacturing facility located inAtlanta, Georgia. The leaseruns through December 2020. The facility operates at about 50% of capacity.
The Company owns a 46,000 square foot frozen juice treat and dessert manufacturing facility and a 42,000square foot dry storage warehouse located on six acres in Scranton, Pennsylvania. The manufacturing facility, whichwas expanded from 26,000 square feet in 1998, operates at approximately 65% of capacity.
The Company leases a 29,600 square foot soft pretzel manufacturing facility located in Hatfield, Pennsylvania.The lease runs through June 2017. The facility operates at approximately 65% of capacity.
The Company leases a 19,200 square foot soft pretzel manufacturing facility located in Carrollton, Texas. Thelease runs through April 2016. The facility operates at approximately 60% of capacity. The Company leases anadditional property containing a 6,500 square foot storage freezer across the street from the manufacturing facility,which lease expires May 2016.
The Company leases an 18,000 square foot soft pretzel manufacturing facility located in Chambersburg,Pennsylvania. The lease runs through September 2010 with options to extend the term. The facility operates atapproximately 45% of capacity.
The Company’s fresh bakery products manufacturing facility and offices are located in Bridgeport, New Jerseyin three buildings totaling 133,000 square feet. The buildings are leased through December 2015. The manufacturingfacility operates at approximately 45% of capacity.
The Company owns a 65,000 square foot fig and fruit bar manufacturing facility located on 91⁄2 acres inMoscow Mills (St. Louis), Missouri. The facility operates at about 80% of capacity.
The Company leases a building in Pensacola, Florida for the manufacturing, packing and warehousing ofdumplings. The building is approximately 14,000 square feet and the lease runs through December 2013. Themanufacturing facility operates at approximately 75% of capacity.
The Company’s Bavarian Pretzel Bakery headquarters and warehouse and distribution facilities are owned andlocated in an 11,000 square foot building in Lancaster, Pennsylvania.
The Company also leases approximately 136 warehouse and distribution facilities in 44 states, Mexicoand Canada.
9

Item 3. Legal Proceedings
The Company has no material pending legal proceedings, other than ordinary routine litigation incidental tothe business, to which the Company or any of its subsidiaries is a party or of which any of their property is subject.
Item 4. Submission Of Matters To A Vote Of Security Holders
There were no matters submitted to a vote of the security holders during the quarter ended September 25, 2010.
10

PART II
Item 5. Market For Registrant’s Common Equity, Related Stockholder Matters And Issuer Purchases OfEquity Securities
The Company’s common stock is traded on the NASDAQ Global Select Market under the symbol “JJSF.”The following table sets forth the high and low sale price quotations as reported by NASDAQ and dividendinformation for the common stock for each quarter of the years ended September 26, 2009 and September 25, 2010.
Common Stock Market Price
High LowDividendDeclared
Fiscal 2009First quarter . . . . . . . . . . . . . . . . . . . . . . . . . . . . . . . . . . . . . . . . . . . . . . . . . . . . . . . . . . . $34.50 $24.07 $.0975Second quarter . . . . . . . . . . . . . . . . . . . . . . . . . . . . . . . . . . . . . . . . . . . . . . . . . . . . . . . . 36.57 30.12 .0975Third quarter . . . . . . . . . . . . . . . . . . . . . . . . . . . . . . . . . . . . . . . . . . . . . . . . . . . . . . . . . . 40.14 32.10 .0975Fourth quarter . . . . . . . . . . . . . . . . . . . . . . . . . . . . . . . . . . . . . . . . . . . . . . . . . . . . . . . . 44.75 35.17 .0975
Fiscal 2010First quarter . . . . . . . . . . . . . . . . . . . . . . . . . . . . . . . . . . . . . . . . . . . . . . . . . . . . . . . . . . . $44.00 $35.19 $.1075Second quarter . . . . . . . . . . . . . . . . . . . . . . . . . . . . . . . . . . . . . . . . . . . . . . . . . . . . . . . . 44.90 36.80 .1075Third quarter . . . . . . . . . . . . . . . . . . . . . . . . . . . . . . . . . . . . . . . . . . . . . . . . . . . . . . . . . . 48.51 42.56 .1075Fourth quarter . . . . . . . . . . . . . . . . . . . . . . . . . . . . . . . . . . . . . . . . . . . . . . . . . . . . . . . . 45.22 37.00 .1075
As of November 26, 2010, there were about 7,700 beneficial shareholders.
In our fiscal year ended September 25, 2010, we purchased and retired 203,507 shares of our common stockat a cost of $7,768,000 under a million share buyback authorization approved by the Company’s Board of Directorsin February 2008. 49,804 shares were purchased in the fourth quarter of 2010 at a cost of $1,874,000. There remains210,772 shares that can be purchased under the existing authorization.
In our fiscal year ended September 26, 2009, we purchased and retired 450,597 shares of our common stockat a cost of $12,510,000. Of the shares purchased and retired in 2009, 400,000 shares were purchased at the purchaseprice of $27.90 per share from Gerald B. Shreiber, Chairman of the Board, Chief Executive Officer and Directorof the Company.
In our 2008 fiscal year ended September 27, 2008, we purchased and retired 135,124 shares of our commonstock at a cost of $3,539,000.
For information on the Company’s Equity Compensation Plans, please see Item 12 herein.
11

Stock Performance Graph
Item 6. Selected Financial Data
The selected financial data for the last five years was derived from our audited consolidated financialstatements. The following selected financial data should be read in conjunction with “Management’s Discussionand Analysis of Financial Condition and Results of Operations” and our consolidated financial statements andrelated notes thereto, especially as the information pertains to fiscal 2008, 2009 and 2010.
Fiscal year ended in September(In thousands except per share data)
2010 2009 2008 2007 2006
Net Sales . . . . . . . . . . . . . . . . . . . . . . . . . . . . . . . . . . . . . $696,703 $653,047 $629,359 $568,901 $514,831Net Earnings . . . . . . . . . . . . . . . . . . . . . . . . . . . . . . . . . . $ 48,409 $ 41,312 $ 27,908 $ 32,112 $ 29,450Total Assets . . . . . . . . . . . . . . . . . . . . . . . . . . . . . . . . . . . $483,994 $439,827 $408,408 $380,288 $340,808Long-Term Debt . . . . . . . . . . . . . . . . . . . . . . . . . . . . . . $ — $ — $ — $ — $ —Capital Lease Obligations . . . . . . . . . . . . . . . . . . . . . $ 863 $ 381 $ 474 $ 565 $ —Stockholders’ Equity . . . . . . . . . . . . . . . . . . . . . . . . . . $380,575 $342,844 $316,778 $295,582 $263,656Common Share Data . . . . . . . . . . . . . . . . . . . . . . . . . .Earnings Per Diluted Share . . . . . . . . . . . . . . . . . . . $ 2.59 $ 2.21 $ 1.47 $ 1.69 $ 1.57Earnings Per Basic Share . . . . . . . . . . . . . . . . . . . . . $ 2.61 $ 2.23 $ 1.49 $ 1.72 $ 1.60Book Value Per Share . . . . . . . . . . . . . . . . . . . . . . . . $ 20.58 $ 18.51 $ 16.90 $ 15.80 $ 14.28Common Shares Outstanding At Year End . . . . 18,491 18,526 18,748 18,702 18,468Cash Dividends Declared Per
Common Share . . . . . . . . . . . . . . . . . . . . . . . . . . . . . $ .43 $ .39 $ .37 $ .34 $ .30
COMPARISON OF 5 YEAR CUMULATIVE TOTAL RETURN*Among J & J Snack Foods Corp., the NASDAQ Composite Index
and the S&P Packaged Foods & Meats Index
$0
$20
$40
$60
$80
$100
$120
$140
$160
$180
9/05 9/06 9/07 9/08 9/09 9/10
J & J Snack Foods Corp. NASDAQ Composite S&P Packaged Foods & Meats
*$100 invested on 9/30/05 in stock or index, including reinvestment of dividends.Fiscal year ending September 30.
Copyright© 2010 S&P, a division of The McGraw-Hill Companies Inc. All rights reserved.
12

Item 7. Management’s Discussion And Analysis Of Financial Condition And Results Of Operations
In addition to historical information, this document and analysis contains forward-looking statements. Theforward-looking statements contained herein are subject to certain risks and uncertainties that could cause actualresults to differ materially from those projected in the forward-looking statements. Important factors that mightcause such a difference include, but are not limited to, those discussed in the “Management’s Discussion andAnalysis of Financial Condition and Results of Operations.” Readers are cautioned not to place undue reliance onthese forward-looking statements, which reflect management’s analysis only as of the date hereof. We undertakeno obligation to publicly revise or update these forward-looking statements to reflect events or circumstances thatarise after the date hereof.
Critical Accounting Policies, Judgments and Estimates
We prepare our financial statements in conformity with accounting principles generally accepted in the UnitedStates of America. The preparation of such financial statements requires management to make estimates andassumptions that affect the reported amounts of assets and liabilities and disclosures of contingent assets andliabilities at the date of those financial statements and the reported amounts of revenues and expenses during thereporting period. Actual results could differ from those estimates.
The Company discloses its significant accounting policies in the accompanying notes to its auditedconsolidated financial statements.
Judgments and estimates of uncertainties are required in applying the Company’s accounting policies in certainareas. Following are some of the areas requiring significant judgments and estimates: revenue recognition, accountsreceivable, cash flow and valuation assumptions in performing asset impairment tests of long-lived assets, estimatesof the useful lives of intangible assets and insurance reserves.
There are numerous critical assumptions that may influence accounting estimates in these and other areas. Webase our critical assumptions on historical experience, third-party data and various other estimates we believe tobe reasonable. A description of the aforementioned policies follows:
Revenue Recognition — We recognize revenue from our products when the products are shipped to ourcustomers. Repair and maintenance equipment service revenue is recorded when it is performed provided thecustomer terms are that the customer is to be charged on a time and material basis or on a straight-line basis overthe term of the contract when the customer has signed a service contract. Revenue is recognized only wherepersuasive evidence of an arrangement exists, our price is fixed or estimable and collectability is reasonably assured.We record offsets to revenue for allowances, end-user pricing adjustments, trade spending, coupon redemption costsand returned product. Customers generally do not have the right to return product unless it is damaged or defective.Off-invoice allowances are deducted directly from the amount invoiced to our customer when our products areshipped to the customer. Offsets to revenue for allowances, end-user pricing adjustments and trade spending arerecorded primarily as a reduction of accounts receivable based on our estimates of liability which are based oncustomer programs and historical experience. These offsets to revenue are based primarily on the quantity of productpurchased over specific time periods. For our Retail Supermarket and Frozen Beverages segments, we accrue forthe liability based on products sold multiplied by per product offsets. Offsets to revenue for our Food Servicesegment are calculated in a similar manner for offsets owed to our direct customers; however, because shipmentsto end-users are unknown to us until reported by our direct customers or by the end-users, there is a greater degreeof uncertainty as to the accuracy of the amounts accrued for end-user offsets. Additional uncertainty may occuras customers take deductions when they make payments to us. This creates complexities because our customersdo not always provide reasons for the deductions taken. Additionally, customers may take deductions to which theyare not entitled and the length of time customers take deductions to which they are entitled can vary from two weeksto well over a year. Because of the aforementioned uncertainties, the process to determine these estimates requiresjudgment. We feel that due to constant monitoring of the process, including but not limited to comparing actualresults to estimates made on a monthly basis, these estimates are reasonable in all material respects. Our recordedliability for allowances, end-user pricing adjustments and trade spending was approximately $13 million and $14million at September 25, 2010 and September 26, 2009, respectively.
Accounts Receivable — We record accounts receivable at the time revenue is recognized. Bad debt expenseis recorded in marketing and administrative expenses. The amount of the allowance for doubtful accounts is based
13

on our estimate of the accounts receivable amount that is uncollectable. It is comprised of a general reserve basedon historical experience and amounts for specific customers’ accounts receivable balances that we believe are atrisk due to our knowledge of facts regarding the customer(s). We continually monitor our estimate of the allowancefor doubtful accounts and adjust it monthly. We usually have approximately 10 customers with accounts receivablebalances of between $1 million to $7 million. Failure of these customers, and others with lesser balances, to payus the amounts owed, could have a material impact on our consolidated financial statements.
Accounts receivable due from any of our customers is subject to risk. Our total bad debt expense was $493,000,$492,000 and $502,000 for the fiscal years 2010, 2009 and 2008, respectively. At September 25, 2010 andSeptember 26, 2009, our accounts receivables were $68,183,000 and $59,734,000, net of an allowance for doubtfulaccounts of $591,000 and $623,000.
Asset Impairment — We have three reporting units with goodwill totaling $70,070,000 as of September 25,2010. We utilize historical reporting unit cash flows (defined as reporting unit operating income plus depreciationand amortization) as a proxy for expected future reporting unit cash flows to evaluate the fair value of these reportingunits. If the fair value estimated substantially exceeds the carrying value of the reporting unit, including the goodwill,if any, associated with that unit, we do not recognize any impairment loss. We generally do not engage a third partyto assist in this analysis as we believe that our in-house expertise is adequate to perform the analysis.
Licenses and rights, customer relationships and non compete agreements are being amortized by the straight-line method over periods ranging from 3 to 20 years and amortization expense is reflected throughout operatingexpenses. Long-lived assets, including fixed assets and intangibles, are reviewed for impairment as events orchanges in circumstances occur indicating that the carrying amount of the asset may not be recoverable. Cash flowanalyses are used to assess impairment. The estimates of future cash flows involve considerable managementjudgment and are based upon assumptions about expected future operating performance. Assumptions used in theseforecasts are consistent with internal planning. The actual cash flows could differ from management’s estimatesdue to changes in business conditions, operating performance, economic conditions, competition and consumerpreferences.
Useful Lives of Intangible Assets — Most of our trade names which have carrying value have been assignedan indefinite life and are not amortized because we plan to receive the benefit from them indefinitely. If we decideto curtail or eliminate the use of any of the trade names or if sales that are generated from any particular trade namedo not support the carrying value of the trade name, then we would record an impairment or assign an estimateduseful life and amortize over the remaining useful life. Rights such as prepaid licenses and non compete agreementsare amortized over contractual periods. The useful lives of customer relationships are based on the discounted cashflows expected to be received from sales to the customers adjusted for an attrition rate. The loss of a major customeror declining sales in general could create an impairment charge.
Insurance Reserves — We have a self-insured medical plan which covers approximately 1,200 of ouremployees. We record a liability for incurred but not yet reported or paid claims based on our historical experienceof claims payments and a calculated lag time period. We maintain a spreadsheet that includes claims payments madeeach month according to the date the claim was incurred. This enables us to have an historical record of claimsincurred but not yet paid at any point in the past. We then compare our accrued liability to the more recent claimsincurred but not yet paid amounts and adjust our recorded liability up or down accordingly. Our recorded liabilityat September 25, 2010 and September 26, 2009 was $1,106,000 and $1,157,000, respectively. Considering that wehave stop loss coverage of $175,000 for each individual plan subscriber, the general consistency of claims paymentsand the short time lag, we believe that there is not a material exposure for this liability. Because of the foregoing,we do not engage a third party actuary to assist in this analysis.
We self-insure, up to loss limits, worker’s compensation and automobile liability claims. Accruals for claimsunder our self-insurance program are recorded on a claims-incurred basis. Under this program, the estimated liabilityfor claims incurred but unpaid in fiscal years 2010 and 2009 was $2,200,000 and $2,300,000, respectively. Ourtotal recorded liability for all years’ claims incurred but not yet paid was $7,300,000 and $7,100,000 atSeptember 25, 2010 and September 26, 2009, respectively. We estimate the liability based on total incurred claimsand paid claims adjusting for loss development factors which account for the development of open claims overtime. We estimate the amounts we expect to pay for some insurance years by multiplying incurred losses by a loss
14

development factor which is based on insurance industry averages and the age of the incurred claims; our estimatedliability is then the difference between the amounts we expect to pay and the amounts we have already paid forthose years. Loss development factors that we use range from 1.0 to 2.0. However, for some years, the estimatedliability is the difference between the amounts we have already paid for that year and the maximum we could payunder the program in effect for that particular year because the calculated amount we expect to pay is higher thanthe maximum. For other years, where there are few claims open, the estimated liability we record is the amountthe insurance company has reserved for those claims. We evaluate our estimated liability on a continuing basis andadjust it accordingly. Due to the multi-year length of these insurance programs, there is exposure to claims comingin lower or higher than anticipated; however, due to constant monitoring and stop loss coverage of $350,000 onindividual claims, we believe our exposure is not material. Because of the foregoing, we do not engage a third partyactuary to assist in this analysis. In connection with these self-insurance agreements, we customarily enter into lettersof credit arrangements with our insurers. At September 25, 2010 and September 26, 2009, we had outstanding lettersof credit totaling $8,175,000 and $8,675,000, respectively.
Refer to Note A to the accompanying consolidated financial statements for additional information on ouraccounting policies.
RESULTS OF OPERATIONS
Fiscal 2010 (52 weeks) Compared to Fiscal 2009 (52 weeks)
Net sales increased $43,656,000, or 7%, to $696,703,000 in fiscal 2010 from $653,047,000 in fiscal 2009.
Excluding sales from the acquisition of Parrot Ice in February 2010 and California Churros in June 2010, salesincreased 6% for the year.
Approximately $12.7 million, or 29%, of the increased sales were sales of funnel cake fries to one customer,which is carrying the product in virtually all of its domestic locations. Although we are not able to provide anestimate of the sales going forward, we anticipate that these sales will be significantly less in fiscal year 2011.
We have four reportable segments, as disclosed in the accompanying notes to the consolidated financialstatements: Food Service, Retail Supermarkets, The Restaurant Group and Frozen Beverages.
The Chief Operating Decision Maker for Food Service, Retail Supermarkets and The Restaurant Group andthe Chief Operating Decision Maker for Frozen Beverages monthly review detailed operating income statementsand sales reports in order to assess performance and allocate resources to each individual segment. Sales isconsidered to be the one and only key variable monitored by the Chief Operating Decision Makers and managementwhen determining each segment’s and the company’s financial condition and operating performance. In addition,the Chief Operating Decision Makers review and evaluate depreciation, capital spending and assets of each segmenton a quarterly basis to monitor cash flow and asset needs of each segment.
Food Service
Sales to food service customers increased $19,206,000, or 5%, to $436,959,000 in fiscal 2010. Excluding salesfrom the acquisition of California Churros, food service sales would have increased 4% for the year. Sales of funnelcake fries to one customer accounted for over 66% of the food service sales increase. Soft pretzel sales to the foodservice market increased 1% to $100,694,000 for the year. Frozen juice bar and ices sales decreased $2,999,000,or 6%, to $47,273,000 for the year primarily as the result of lower sales to one contract packing customer and toschool food service accounts. Churro sales to food service customers increased 8% to $31,732,000 in 2010. Withoutsales from California Churros, churro sales for the year would have been down about 1⁄2 of one percent. Sales ofbakery products, excluding biscuit and dumpling sales and fruit and fig bar sales, increased $5,606,000, or 3%,for the year due primarily to increased sales to private label customers. Biscuit and dumpling sales increased 1%to $33,326,000. Sales of fig and fruit bars decreased 4% to $31,715,000 due primarily to lower sales to one customerwho discontinued a particular product. Funnel cake and related funnel cake product sales increased by $14,083,000to $22,804,000 primarily due to sales to one customer. Sales of new products in the first twelve months since their
15

introduction were approximately $29 million in fiscal year 2010. Net volume increases, including new product salesas defined above and sales resulting from the acquisition of California Churros, accounted for all but approximately$1,500,000 of the sales increases this year. Price increases accounted for the remaining $1,500,000. Operatingincome in our Food Service segment increased from $45,024,000 in 2009 to $50,255,000 in 2010 primarily as aresult of increased volume as discussed above and lower ingredients and packaging costs of about $2 million.
Retail Supermarkets
Sales of products to retail supermarkets increased $10,961,000 or 17% to $76,119,000 in fiscal year 2010.Soft pretzel sales to retail supermarkets were $30,463,000 compared to $30,506,000 in 2009 on a unit volumedecrease of less than 1%. This makes the third consecutive year of flat or modestly up or down unit sales. Salesof frozen juices and ices increased $10,469,000 or 28% to $48,288,000 on a unit volume increase of 24%. Reducedtrade spending of $1.5 million for the introduction of new frozen novelty items and a shift in product mix increasedsales dollars in relation to the overall unit volume increases. Coupon redemption costs, a reduction of sales,decreased 9% or about $354,000 for the year. Sales of products in the first twelve months since their introductionwere approximately $4.2 million in fiscal year 2010. Net volume increases, including new product sales as definedabove and net of decreased coupon costs and reduced trade spending for new product introductions, accounted forvirtually all of the sales increases in 2010. Operating income in our Retail Supermarkets segment increased from$7,442,000 in 2009 to $11,281,000 in 2010 primarily as a result of volume increases and reduced trade spendingfor the introduction of new frozen novelty items.
The Restaurant Group
Sales of our Restaurant Group decreased 33% to $847,000 primarily due to the closing of stores in fiscal years2009 and 2010 and by lower sales in general. Sales of our two stores open for both years were down about 7%from last year. Operating loss in our Restaurant Group segment decreased from $64,000 in 2009 to $35,000 in 2010.
Frozen Beverages
Frozen beverage and related product sales increased 8% to $182,778,000 in fiscal 2010. Excluding sales fromthe acquisition of Parrot Ice, sales would have increased 7% for the year. Beverage sales alone increased 13% to$128,125,000 for the year with increased sales to two new customers and one existing customer, sales from ParrotIce and a 26% increase in sales in Mexico accounting for over 80% of the increase. Gallon sales were up 10%in our base ICEE business with sales to three customers accounting for almost all of the increase. Service revenuedecreased 4% to $40,410,000 for the year with declines spread across our customer base. Sales of beveragemachines, which tend to fluctuate from year to year while following no specific trend, increased from $11,729,000in 2009 to $11,964,000 in 2010. The estimated number of Company owned frozen beverage dispensers was 38,600and 35,700 at September 25, 2010 and September 26, 2009, respectively. Operating income in our Frozen Beveragesegment increased from $14,536,000 in 2009 to $15,661,000 in 2010 as a result of increased volume as discussedabove. Higher gasoline costs of approximately $867,000 impacted the year’s operating income.
Consolidated
Other than as commented upon above by segment, there are no material specific reasons for the reported salesincreases or decreases. Sales levels can be impacted by the appeal of our products to our customers and consumersand their changing tastes, competitive and pricing pressures, sales execution, marketing programs, seasonal weather,customer stability and general economic conditions.
Gross profit as a percentage of sales increased to 32.69% in 2010 from 31.98% in 2009. Lower ingredientand packaging costs compared to last year of approximately $2.2 million, the benefit of higher volumes leveragingour fixed manufacturing costs and reduced trade spending for new product introductions in our Retail Supermarketsegment were primarily responsible for the increased gross profit percentage. Ingredient and packaging costs canbe extremely volatile and may be significantly different from what we are presently expecting and therefore wecannot project the impact of ingredient and packaging costs on our business going forward; however, there has beena very significant increase in the market cost of flour and other commodities over the past six months which we
16
anticipate will result in higher costs over some portions of our fiscal year 2011. The impact of these higher costsand increased costs in operational areas may result in lower net earnings in 2011 than in 2010.
Total operating expenses increased $8,712,000 to $150,618,000 in fiscal 2010 and as a percentage of salesdecreased .11 of a percentage point and remained at 22% of sales. Marketing expenses decreased .29 percentagepoints to 10% of sales. Distribution expenses decreased .13 percentage points to 7% of sales. Administrativeexpenses were about 31⁄2% of sales in both years. Other general expense of $2,087,000 this year compared to othergeneral income of $5,000 in 2009. Included in other general expense this year is $1.6 million for an unclaimedproperty assessment and $577,000 of acquisition costs.
Operating income increased $10,224,000 or 15% to $77,162,000 in fiscal year 2010 as a result of theaforementioned items.
Investment income decreased by $272,000 to $1,114,000 due to the general decline in the level of interestrates.
The effective income tax rate decreased 1.42 percentage points to 38% from 39% last year. About 2/3 of thisdecrease was from the reduction of $750,000 of unrecognized tax benefits.
Net earnings increased $7,097,000, or 17%, in fiscal 2010 to $48,409,000, or $2.59 per diluted share as a resultof the aforementioned items.
There are many factors which can impact our net earnings from year to year and in the long run, among whichare the supply and cost of raw materials and labor, insurance costs, factors impacting sales as noted above, thecontinuing consolidation of our customers, our ability to manage our manufacturing, marketing and distributionactivities, our ability to make and integrate acquisitions and changes in tax laws and interest rates.
RESULTS OF OPERATIONS
Fiscal 2009 (52 weeks) Compared to Fiscal 2008 (52 weeks)
Net sales increased $23,688,000, or 4%, to $653,047,000 in fiscal 2009 from $629,359,000 in fiscal 2008.
We have four reportable segments, as disclosed in the accompanying notes to the consolidated financialstatements: Food Service, Retail Supermarkets, The Restaurant Group and Frozen Beverages.
The Chief Operating Decision Maker for Food Service, Retail Supermarkets and The Restaurant Group andthe Chief Operating Decision Maker for Frozen Beverages monthly review detailed operating income statementsand sales reports in order to assess performance and allocate resources to each individual segment. Sales isconsidered to be the one and only key variable monitored by the Chief Operating Decision Makers and managementwhen determining each segment’s and the company’s financial condition and operating performance. In addition,the Chief Operating Decision Makers review and evaluate depreciation, capital spending and assets of each segmenton a quarterly basis to monitor cash flow and asset needs of each segment.
Food Service
Sales to food service customers increased $17,559,000, or 4%, to $417,753,000 in fiscal 2009. Soft pretzelsales to the food service market decreased $313,000, or about 1/3 of one percent, to $99,471,000 for the year. Unitsales of soft pretzels were down 3% for the year which is a continuation of a multi-year trend of flat or modestlyup or down sales. Sales of bakery products excluding biscuit and dumpling sales and fruit and fig bar sales, increased$6,607,000, or 4%, for the year. Biscuit and dumpling sales were up 8% to $32,845,000 due to increased distributionand new product offerings. Sales of fig and fruit bars increased 11% to $29,497,000 due to strong volume growthspread across our customer base. Churro sales were up 16% for the year with $29,404,000 of sales in 2009 withover 80% of the sales increase coming from sales to one customer who previously had not been a purchaser ofchurros. Frozen juice bar and ices sales decreased $934,000 or 2% to $50,272,000 for the year. Our sales of frozenjuice bar and ices to school food service have been impacted and we expect them to continue to be impacted bynutritional concerns. Sales of our funnel cake products were up $2,872,000, or 49%, with sales to one customerwho previously had not been a purchaser of funnel cake products accounting for about one-half of the increase
17

and sales of funnel cake fries, a product introduced in the fourth quarter of fiscal 2008, accounting for the balance.Sales of new products in the first twelve months since their introduction were approximately $12,600,000 in fiscalyear 2009. Price increases accounted for estimated sales of $13,700,000 in fiscal year 2009 and net volume increases,including new product sales as defined above, accounted for approximately $3,900,000 of sales in fiscal 2009.Operating Income in our Food Service segment increased from $24,784,000 in 2008 to $45,024,000 in 2009primarily as a result of price increases and increased volume as discussed above and lower commodity costs ofapproximately $10,000,000.
Retail Supermarkets
Sales of products to retail supermarkets increased $8,046,000 or 14% to $65,158,000 in fiscal 2009. Total softpretzel sales to retail supermarkets were $30,506,000, an increase of 11% from fiscal 2008, on a unit volumedecrease of 2%. Sales of frozen juice bars and ices increased 19% to $37,819,000 in 2009 on a case volume increaseof 25%. Increased trade spending of $1.3 million for the introduction of new frozen novelty items and a shift inproduct mix reduced sales dollars in relation to the unit volume increases. Coupon redemption costs, a reductionof sales, increased 38% or about $1,029,000 for the year as we increased couponing in light of a trend towardincreased use of coupons by shoppers. Sales of products in the first twelve months since their introduction wereapproximately $6,300,000 in fiscal year 2009. Price increases accounted for estimated sales of $2,400,000 in fiscalyear 2009 and net volume increases, including new product sales as defined above and net of increased couponcosts, accounted for approximately $5,600,000 of sales in fiscal 2009. Operating Income in our Retail Supermarketssegment increased from $4,665,000 in 2008 to $7,442,000 in 2009 primarily as a result of price and volumeincreases.
The Restaurant Group
Sales of our Restaurant Group, which operates BAVARIAN PRETZEL BAKERY and PRETZEL GOURMETretail stores in the Mid-Atlantic region, declined by 23% primarily due to closings or licensings of stores in thepast year. At September 26, 2009, we had 4 stores open. Sales of stores open for both years were down 7% forthe year. Operating Loss in our Restaurant Group segment decreased from $140,000 in 2008 to $64,000 in 2009primarily resulting from a decline in store closing costs.
Frozen Beverages
Frozen beverage and related product sales decreased $1,539,000 or 1% to $168,879,000 in fiscal 2009.Beverage sales alone were down 1% for the year. Gallon sales were down 2% for the year in our base ICEE businesswhich is a continuation of a multi-year trend. Service revenue increased $3,210,000, or 8%, to $42,013,000 forthe year as we continue to grow this part of our business to new and existing customers. Sales of beverage machines,which tend to fluctuate from year to year while following no specific trend, decreased $3,065,000 to $11,729,000for the year. The estimated number of company owned frozen beverage dispensers was 35,700 and 33,400 atSeptember 26, 2009 and September 27, 2008, respectively. Operating Income in our Frozen Beverages segmentincreased from $14,027,000 in 2008 to $14,536,000 in 2009.
Consolidated
Other than as commented upon above by segment, there are no material specific reasons for the reported salesincreases or decreases. Sales levels can be impacted by the appeal of our products to our customers and consumersand their changing tastes, competitive and pricing pressures, sales execution, marketing programs, seasonal weather,customer stability and general economic conditions.
Gross profit as a percent of sales increased 2.28 percentage points in 2009 from 2008 to 32%.
Lower commodity costs in excess of $11,000,000, higher pricing and increased efficiencies due to volumein some of our product lines partially offset by higher workers’ compensation and group health benefit expensewere the primary drivers causing the gross profit percentage increase. We presently expect commodity costs to belower on a year to year comparison basis over the next several quarters; however, commodity costs can be extremelyvolatile and may be significantly different from what we are presently expecting. As we are self incurred for mostof our workers compensation costs and group health benefit costs, they may go up or down without notice.
18

Total operating expenses decreased $1,665,000 to $141,906,000 in fiscal 2009 and as a percentage of salesdecreased 1.08 percentage points to 22% of sales in 2009. Other general income was $5,000 this year. Other generalincome of $375,000 last year primarily consisted of gains on the disposition of assets and insurance gains in ourFood Service and Frozen Beverages segments offset by store closing costs in our Restaurant Group segment of$102,000. Marketing expenses decreased .45 percentage points and remained at 11% of sales. Controlled spendingin our Food Service and Frozen Beverages segments accounted for the overall decline. Distribution expensesdecreased .75 of a percentage point and remained at 8% of sales due to lower freight and fuel costs. Administrativeexpenses were about 31⁄2% of sales in both years.
Operating income increased $23,602,000, or 54%, to $66,938,000 in fiscal 2009 as a result of theaforementioned items.
Investment income decreased by $1,279,000 to $1,386,000 due to the general decline in the level ofinterest rates.
The effective income tax rate was 39% in both fiscal years.
Net earnings increased $13,404,000, or 48%, in fiscal 2009 to $41,312,000, or $2.21 per diluted share as aresult of the aforementioned items.
There are many factors which can impact our net earnings from year to year and in the long run, among whichare the supply and cost of raw materials and labor, insurance costs, factors impacting sales as noted above, thecontinuing consolidation of our customers, our ability to manage our manufacturing, marketing and distributionactivities, our ability to make and integrate acquisitions and changes in tax laws and interest rates.
ACQUISITIONS
On January 31, 2006, we acquired the stock of ICEE of Hawaii. ICEE of Hawaii, headquartered in Waipahu,Hawaii, distributes ICEE frozen beverages and related products throughout the Hawaiian islands.
On May 26, 2006, The ICEE Company, our frozen carbonated beverage distribution company, acquired theSLUSH PUPPIE branded business from Dr. Pepper/Seven Up, Inc., a Cadbury Schweppes Americas BeveragesCompany for $18.1 million plus approximately $4.3 million in working capital. SLUSH PUPPIE, North America’sleading brand for frozen non-carbonated beverages, is sold through an existing established distributor network toover 20,000 locations in the United States and Canada as well as to certain international markets.
On January 9, 2007, we acquired the assets of Hom/Ade Foods, Inc. Hom/Ade Foods, Inc., based in Pensacola,Florida is a manufacturer and distributor of biscuits and dumplings sold under the MARY B’s and private labelstore brands predominantly to the retail supermarket trade. Annual sales of the business were approximately $30million for the year ended December 2006.
On January 31, 2007, we acquired the assets of Radar, Inc. Radar, Inc. is a manufacturer and seller of fig andfruit bars selling its products under the brand DADDY RAY’S. Headquartered and with its manufacturing facilityin Moscow Mills, Missouri (outside of St. Louis), Radar, Inc. had annual sales of approximately $23 million dollarsselling to the retail grocery segment and mass merchandisers, both branded and private label.
On April 2, 2007, we acquired the WHOLE FRUIT Sorbet and FRUIT-A-FREEZE Frozen Fruit Bar brands,along with related assets including a manufacturing facility located in Norwalk, California, selling primarily to thesupermarket industry. Sales for 2007 were $2,429,000.
On June 25, 2007, we acquired the assets of an ICEE distributor in Kansas with annual sales of less than$1 million.
In February 2010, we acquired the assets of Parrot Ice, a manufacturer and distributor of a premium brandfrozen beverage sold primarily in convenience stores. Revenues from Parrot Ice were approximately $1.5 millionfor our 2010 fiscal year.
On June 10, 2010 we acquired the assets of California Churros, Inc., a manufacturer and seller of premiumbrand churros selling its products under the brand CALIFORNIA CHURROS. Headquartered and with its
19
manufacturing facility in Colton, CA, California Churros had sales of approximately $2.5 million in our 2010fiscal year.
These acquisitions were accounted for under the purchase method of accounting, and their operations areincluded in the accompanying consolidated financial statements from their respective acquisition dates.
LIQUIDITY AND CAPITAL RESOURCES
Although there are many factors that could impact our operating cash flow, most notably net earnings, webelieve that our future operating cash flow, along with our borrowing capacity, our current cash and cash equivalentbalances and our investment securities is sufficient to fund future growth and expansion. See Note C to thesefinancial statements for a discussion of our investment securities.
Fluctuations in the value of the Mexican and Canadian currencies and the resulting translation of the net assetsof our Mexican and Canadian subsidiaries caused a decrease of $577,000 in accumulated other comprehensive lossin 2010 and an increase of $1,428,000 in 2009 and a decrease of $3,000 in 2008. In 2010, sales of the two subsidiarieswere $14,301,000 as compared to $11,658,000 in 2009 and $11,078,000 in 2008.
In our fiscal year ended September 25, 2010, we purchased and retired 203,507 shares of our common stockat a cost of $7,768,000 under a million share buyback authorization approved by the Company’s Board of Directorsin February 2008. 49,804 shares were purchased in the fourth quarter of 2010 at a cost of $1,874,000. There remains210,772 shares that can be purchased under the existing authorization.
In our fiscal year ended September 26, 2009, we purchased and retired 450,597 shares of our common stockat a cost of $12,510,000. Of the shares purchased and retired in 2009, 400,000 shares were purchased at the purchaseprice of $27.90 per share from Gerald B. Shreiber, Chairman of the Board, Chief Executive Officer and Directorof the Company.
In our 2008 fiscal year ended September 27, 2008, we purchased and retired 135,124 shares of our commonstock at a cost of $3,539,000.
In December 2006, we entered into an amended and restated loan agreement with our existing banks whichprovides for up to a $50,000,000 revolving credit facility repayable in December 2011. The agreement containsrestrictive covenants and requires commitment fees in accordance with standard banking practice. There were nooutstanding balances under the facility at September 25, 2010 and September 26, 2009. The significant financialcovenants are:
• Earnings before interest expense and income taxes divided by interest expense shall not be less than1.5 to 1.
• Tangible net worth must initially be more than $170 million.
• Total funded indebtedness divided by earnings before interest expense, income taxes, depreciation andamortization shall not be greater than 2.25 to 1.
• Total liabilities divided by tangible net worth shall not be more than 2.0 to 1.
We were in compliance with the financial covenants described above at September 25, 2010.
We self-insure, up to loss limits, certain insurable risks such as worker’s compensation and automobile liabilityclaims. Accruals for claims under our self-insurance program are recorded on a claims-incurred basis. Under thisprogram, the estimated liability for claims incurred but unpaid in fiscal years 2010 and 2009 was $2,200,000 and$2,300,000, respectively. In connection with certain self-insurance agreements, we customarily enter into lettersof credit arrangements with our insurers. At September 25, 2010 and September 26, 2009, we had outstanding lettersof credit totaling $8,175,000 and $8,675,000, respectively.
20

The following table presents our contractual cash flow commitments on long-term debt, operating leases andpurchase commitments for raw materials and packaging. See Notes to the consolidated financial statements foradditional information on our long-term debt and operating leases.
Payments Due by Period(in thousands)
Total
LessThan
1 Year1–3
Years4–5
YearsAfter
5 Years
Long-term debt,including current maturities . . . . . . . . . . . . . . . . $ — $ — $ — $ — $ —
Capitalized lease obligations . . . . . . . . . . . . . . . . . . 863 244 491 128 —Purchase commitments . . . . . . . . . . . . . . . . . . . . . . . . 44,000 44,000 — — —Operating leases . . . . . . . . . . . . . . . . . . . . . . . . . . . . . . 52,272 8,913 12,892 8,134 22,333
Total . . . . . . . . . . . . . . . . . . . . . . . . . . . . . . . . . . . . . . . . . . $97,135 $53,157 $13,383 $8,262 $22,333
The purchase commitments do not exceed our projected requirements over the related terms and are in thenormal course of business.
Fiscal 2010 Compared to Fiscal 2009
Cash and cash equivalents and marketable securities held to maturity decreased $2,544,000, or 2%, to$116,446,000 from a year ago.
Trade receivables increased $8,449,000, or 14%, to $68,183,000 in 2010 due primarily to increased sales levelsin our fourth quarter. Inventories increased $4,626,000 or 10% to $50,630,000 in 2010 due to increased sales levelsand an increase in equipment parts needed to support our frozen beverage business.
Prepaid expenses and other increased to $6,067,000 from $1,910,000 last year because of estimated federalincome tax payments made prior to the enactment of the law extending bonus depreciation.
Net property, plant and equipment increased $12,919,000 to $110,092,000 because purchases of fixed assetsfor the improvement and expansion of our manufacturing capabilities and frozen carbonated beverage businessexceeded depreciation on existing assets, and because of the addition of $3,508,000 in fixed assets acquired inacquisitions and the purchase of a distribution freezer warehouse building which had previously been leased, fora purchase price of $5,794,000.
Other intangible assets, less accumulated amortization increased $6,159,000 to $55,284,000 due to intangibleassets of $10,846,000 acquired in acquisitions net of amortization of $4,687,000.
Goodwill increased $9,756,000 to $70,070,000 from September 26, 2009 to September 25, 2010 as a resultof the acquisition of California Churros.
Accounts payable and accrued liabilities increased $2,484,000 due to increased levels of business.
Accrued compensation expense increased 5% to $12,244,000 due to an increase in our employee base, a generalincrease in the level of pay rates and higher bonuses due to be paid.
Deferred income tax liabilities increased by $3,368,000 to $30,401,000 which related primarily to amortizationof goodwill and other intangible assets and depreciation of property, plant and equipment.
Other long-term liabilities at September 25, 2010 include $1,249,000 of gross unrecognized tax benefits whichdecreased from $1,895,000 a year ago due to reductions for tax positions of prior years.
Common stock decreased $3,324,000 to $38,453,000 in 2010 because increases totalling $4,444,000 from theexercise of incentive and nonqualified stock options, stock issued under our stock purchase plan for employees,stock issued under our deferred stock plan and share-based compensation expense were less than the repurchaseof common stock of $7,768,000 by $3,324,000.
Net cash provided by operating activities decreased $12,625,000 to $68,008,000 in 2010 primarily becauseof increases in accounts receivable, inventories and prepaid expenses and other of $8,629,000, $4,422,000 and
21

$4,101,000, respectively, compared to decreases in accounts receivable, inventories and prepaid expenses and otherin 2009 of $1,144,000, $2,993,000 and $37,000, respectively. The net change in accounts receivable and inventoriesof $21,326,000 was partially offset by higher net earnings of $7,097,000 and higher depreciation and amortizationof fixed assets of $1,835,000.
Net cash used in investing activities decreased $6,370,000 to $41,455,000 in 2010 from $47,825,000 in 2009primarily because of increased proceeds from marketable securities, net of purchases, which netted $16,866,000compared to net purchases of marketable securities of $20,976,000 in 2009; which were partially offset by paymentsfor purchases of companies, net of cash acquired in 2010, of $25,185,000 and by increased purchases of property,plant and equipment of $6,341,000 in 2010 compared to 2009.
Net cash used in financing activities of $12,609,000 in 2010 compared to net cash used by financingactivities of $15,740,000 in 2009. The decrease was caused by a decrease of $4,742,000 in payments to repurchasecommon stock.
In 2010, the major variables in determining our net increase in cash and cash equivalents and marketablesecurities were our net earnings, depreciation and amortization of fixed assets, purchases of property, plant andequipment, purchases of companies, payments of cash dividend and the repurchase of common stock. Othervariables which in the past have had a significant impact on our change in cash and cash equivalents are proceedsfrom borrowings and payments of long-term debt. As discussed in results of operations, our net earnings may beinfluenced by many factors. Depreciation and amortization of fixed assets is primarily determined by past purchasesof property, plant and equipment although it could be impacted by a significant acquisition. Purchases of property,plant and equipment are primarily determined by our ongoing normal manufacturing and marketing requirementsbut could be increased significantly for manufacturing expansion requirements or large frozen beverage customerneeds. From time to time, we have repurchased common stock and we anticipate that we will do so again in thefuture. We are actively seeking acquisitions that could be a significant use of cash. Although the balance of ourlong-term debt is $0 at September 25, 2010, we may borrow in the future depending on our needs.
Fiscal 2009 Compared to Fiscal 2008
Cash and cash equivalents and marketable securities held to maturity net of a decline in auction marketpreferred stock increased $37,055,000, or 45%, to $118,990,000 from a year ago primarily because net cashprovided by operating activities of $80,633,000 was more than cash used for purchases of property, plant andequipment by $53,443,000, which was partially offset by cash used in financing activities of $15,740,000.
Trade receivables decreased $1,442,000, or 2%, to $59,734,000 in 2009 due primarily to better managementof receivables. Inventories decreased $3,091,000 or 6% to $46,004,000 in 2009 due to lower unit costs ofinventories, improved management and timing.
Net property, plant and equipment increased $4,109,000 to $97,173,000 because purchases of fixed assets forthe improvement and expansion of our manufacturing capabilities and frozen carbonated beverage businessexceeded depreciation on existing assets.
Other intangible assets, less accumulated amortization decreased $4,508,000 to $49,125,000 due completelyto amortization.
Goodwill was unchanged at $60,314,000 from September 27, 2008 to September 26, 2009.
Accounts payable and accrued liabilities decreased $14,000.
Accrued compensation expense increased 14% to $11,656,000 due to an increase in our employee base, ageneral increase in the level of pay rates and higher bonuses due to be paid.
Deferred income tax liabilities increased by $3,977,000 to $27,033,000 which related primarily to amortizationof goodwill and other intangible assets and depreciation of property, plant and equipment.
Other long-term liabilities at September 26, 2009 include $1,895,000 of gross unrecognized tax benefits.
22

Common stock decreased $6,638,000 to $41,777,000 in 2009 because increases totalling $4,923,000 from theexercise of incentive and nonqualified stock options, stock issued under our stock purchase plan for employees andshare-based compensation expense were less than the repurchase of common stock of $12,510,000 by $6,638,000.
Net cash provided by operating activities increased $25,736,000 to $80,633,000 in 2009 primarily becauseof the increase to net earnings of $13,404,000 and decreases in accounts receivable, inventories and prepaidexpenses totalling $4,174,000 compared to increases in those assets totalling $7,686,000 last year.
Net cash used in investing activities increased $28,971,000 to $47,825,000 in 2009 from $18,854,000 in2008 primarily because of increased purchases of marketable securities, net of proceeds.
Net cash used in financing activities of $15,740,000 in 2009 compared to net cash used by financing activitiesof $7,600,000 in 2008. The increase was caused primarily by an increase of $8,971,000 in payments to repurchasecommon stock.
In 2009, the major variables in determining our net increase in cash and cash equivalents and marketablesecurities were our net earnings, depreciation and amortization of fixed assets, purchases of property, plant andequipment and the repurchase of common stock. Other variables which in the past have had a significant impacton our change in cash and cash equivalents are payments for the purchase of companies, proceeds from borrowingsand payments of long-term debt. As discussed in results of operations, our net earnings may be influenced by manyfactors. Depreciation and amortization of fixed assets is primarily determined by past purchases of property, plantand equipment although it could be impacted by a significant acquisition. Purchases of property, plant and equipmentare primarily determined by our ongoing normal manufacturing and marketing requirements but could be increasedsignificantly for manufacturing expansion requirements or large frozen beverage customer needs. From time to time,we have repurchased common stock and we anticipate that we will do so again in the future. We are actively seekingacquisitions that could be a significant use of cash. Although the balance of our long-term debt is $0 at September 26,2009, we may borrow in the future depending on our needs.
Item 7A. Quantitative And Qualitative Disclosures About Market Risk
The following is the Company’s quantitative and qualitative analysis of its financial market risk:
Interest Rate Sensitivity
The Company has in the past entered into interest rate swaps to limit its exposure to interest rate risk and maydo so in the future if the Board of Directors feels that such non-trading purpose is in the best interest of the Companyand its shareholders. As of September 25, 2010, the Company had no interest rate swap contracts.
Interest Rate Risk
At September 25, 2010, the Company had no long-term debt obligations.
Purchasing Risk
The Company’s most significant raw material requirements include flour, shortening, corn syrup, sugar, juice,cheese, chocolate, and a variety of nuts. The Company attempts to minimize the effect of future price fluctuationsrelated to the purchase of raw materials primarily through forward purchasing to cover future manufacturingrequirements, generally for periods from 1 to 12 months. Future contracts are not used in combination with forwardpurchasing of these raw materials. The Company’s procurement practices are intended to reduce the risk of futureprice increases, but also may potentially limit the ability to benefit from possible price decreases.
Foreign Exchange Rate Risk
The Company has not entered into any forward exchange contracts to hedge its foreign currency rate risk asof September 25, 2010 because it does not believe its foreign exchange exposure is significant.
Item 8. Financial Statements And Supplementary Data
The financial statements of the Company are filed under this Item 8, beginning on page F-1 of this report.
23

Item 9. Changes In And Disagreements With Accountants On Accounting And Financial Disclosure
None.
Item 9A. Controls And Procedures
Disclosure Controls and Procedures
We carried out an evaluation under the supervision and with the participation of our management, includingour chief executive officer and chief financial officer, of the effectiveness of the design and operation of ourdisclosure controls and procedures, as such term is defined under Rule 13a-15(e) promulgated under the SecuritiesExchange Act of 1934 (the “Exchange Act”), as amended for financial reporting, as of September 25, 2010. Basedon that evaluation, our chief executive officer and chief financial officer concluded that these controls and proceduresare effective to ensure that information required to be disclosed by the Company in reports that it files or submitsunder the Exchange Act is recorded, processed, summarized, and reported as specified in Securities and ExchangeCommission rules and forms. There were no changes in these controls or procedures identified in connection withthe evaluation of such controls or procedures that occurred during our last fiscal quarter, or in other factors thathave materially affected, or are reasonably likely to materially affect these controls or procedures. There were nochanges in the Company’s internal controls over financial reporting that occurred during our last fiscal quarter.
Our disclosure controls and procedures are designed to provide reasonable assurance that information requiredto be disclosed by us in the reports that we file or submit under the ExchangeAct is recorded, processed, summarized,and reported, within the time periods specified in the rules and forms of the Securities and Exchange Commission.These disclosure controls and procedures include, among other things, controls and procedures designed to providereasonable assurance that information required to be disclosed by us in the reports that we file under the ExchangeAct is accumulated and communicated to our management, including our chief executive officer and chief financialofficer, as appropriate to allow timely decisions regarding required disclosure.
Management’s Report on Internal Control over Financial Reporting
Our management is responsible for establishing and maintaining adequate internal control over financialreporting. Internal control over financial reporting is defined in Rule 13a-15(f) and 15d-15(f) under the ExchangeAct as a process designed by, or under the supervision of, the chief executive officer and chief financial officerand effected by the board of directors and management to provide reasonable assurance regarding the reliabilityof financial reporting and the preparation of financial statements for external purposes in accordance with generallyaccepted accounting principles and includes those policies and procedures that:
• Pertain to the maintenance of records that in reasonable detail accurately and fairly reflect the transactionsand dispositions of our assets;
• Provide reasonable assurance that transactions are recorded as necessary to permit preparation of financialstatements in accordance with generally accepted accounting principles, and that receipts and expendituresof the company are being made only in accordance with authorizations of our management and boardof directors;
• Provide reasonable assurance regarding prevention or timely detection of unauthorized acquisition, useor disposition of our assets that could have a material effect on the financial statements.
Because of its inherent limitations, internal control over financial reporting may not prevent or detectmisstatements. Projections of any evaluation of effectiveness to future periods are subject to the risks that controlsmay become inadequate because of changes in conditions, or that the degree of compliance with the policies orprocedures may deteriorate.
Our management assessed the effectiveness of our internal control over financial reporting as of September 25,2010. In making this assessment, our management used the criteria set forth by the Committee of SponsoringOrganizations of the Treadway Commission (COSO) in Internal Control-Integrated Framework.
Based on our assessment, our management believes that, as of September 25, 2010, our internal control overfinancial reporting is effective. There have been no changes that occurred during our fourth quarter that havematerially affected, or are reasonably likely to materially affect, our internal control over financial reporting.
24

Our independent registered public accounting firm, Grant Thornton LLP, audited our internal control overfinancial reporting as of September 25, 2010. Their report, dated December 7, 2010, expressed an unqualifiedopinion on our internal control over financial reporting. That report appears in Item 15 of Part IV of this AnnualReport on Form 10-K and is incorporated by reference to this Item 9A.
Item 9B. Other Information
There was no information required on Form 8-K during the quarter that was not reported.
PART III
Item 10. Directors, Executive Officers and Corporate Governance
Portions of the information concerning directors and executive officers, appearing under the captions“Information Concerning Nominees For Election To Board” and “Information Concerning Continuing DirectorsAnd Executive Officers” and information concerning Section 16(a) Compliance appearing under the caption“Compliance with Section 16(a) of the Securities Exchange Act of 1934” in the Company’s Proxy Statement filedwith the Securities and Exchange Commission in connection with the Annual Meeting of Shareholders to be heldon February 9, 2011 (“2010 Proxy Statement”) is incorporated herein by reference.
Portions of the information concerning theAudit Committee, the requirement for anAudit Committee FinancialExpert and the Nominating Committee in the Company’s 2010 Proxy Statement filed with the Securities andExchange Commission in connection with the Annual Meeting of Shareholders to be held on February 9, 2011,is incorporated herein by reference.
The Company has adopted a Code of Ethics pursuant to Section 406 of the Sarbanes-Oxley Act of 2002, whichapplies to the Company’s principal executive officer and senior financial officers. The Company has also adopteda Code of Business Conduct and Ethics which applies to all employees. The Company will furnish any person,without charge, a copy of the Code of Ethics upon written request to J & J Snack Foods Corp., 6000 Central Highway,Pennsauken, New Jersey 08109, Attn: Dennis Moore. A copy of the Code of Ethics can also be found on our websiteat www.jjsnack.com. Any waiver of any provision of the Code of Ethics granted to the principal executive officeror senior financial officer may only be granted by a majority of the Company’s disinterested directors. If a waiveris granted, information concerning the waiver will be posted on our website www.jjsnack.com for a period of12 months.
Item 11. Executive Compensation
Information concerning executive compensation appearing in the Company’s 2010 Proxy Statement under thecaption “Management Remuneration” is incorporated herein by reference.
The following is a list of the executive officers of the Company and their principal past occupations oremployment. All such persons serve at the pleasure of the Board of Directors and have been elected to serve untilthe Annual Meeting of Shareholders on February 9, 2011 or until their successors are duly elected.
Name Age Position
Gerald B. Shreiber 69 Chairman of the Board, President, Chief Executive Officerand Director
Dennis G. Moore 55 Senior Vice President, Chief Financial Officer, Secretary, Treasurerand Director
Robert M. Radano 61 Senior Vice President, Sales and Chief Operating Officer
Dan Fachner 50 President of The ICEE Company Subsidiary
Gerard G. Law 36 Senior Vice President, Western Operations
Robert J. Pape 53 Senior Vice President, Sales and Marketing
25

Gerald B. Shreiber is the founder of the Company and has served as its Chairman of the Board, President,and Chief Executive Officer since its inception in 1971. His term as a director expires in 2015.
Dennis G. Moore joined the Company in 1984. He served in various controllership functions prior to becomingthe Chief Financial Officer in June 1992. His term as a director expires in 2012.
Robert M. Radano joined the Company in 1972 and in May 1996 was named Chief Operating Officer of theCompany. Prior to becoming Chief Operating Officer, he was Senior Vice President, Sales responsible for nationalfood service sales of J & J.
Dan Fachner has been an employee of ICEE-USA Corp., which was acquired by the Company in May 1987,since 1979. He was named Senior Vice President of The ICEE Company in April 1994 and became President inMay 1997.
Gerard G. Law joined the Company in 1992. He served in various manufacturing and sales managementcapacities prior to becoming Senior Vice President, Western Operations in 2009.
Robert J. Pape joined the Company in 1998. He served in various sales and sales management capacities priorto becoming Senior Vice President, Sales and Marketing in 2010.
Item 12. Security Ownership Of Certain Beneficial Owners And Management And RelatedStockholder Matters
Information concerning the security ownership of certain beneficial owners and management appearing in theCompany’s 2010 Proxy Statement under the caption “Security Ownership of Certain Beneficial Owners andManagement” is incorporated herein by reference.
The following table details information regarding the Company’s existing equity compensation plans as ofSeptember 25, 2010.
(a) (b) (c)
Plan Category
Number ofsecurities to
be issued uponexercise of
outstandingoptions, warrants
and rights
Weighted-averageexercise priceof outstanding
options, warrantsand rights
Number ofsecurities remainingavailable for future
issuance underequity compensation
plans (excludingsecurities reflected
in column (a))
Equity compensation plans approvedby security holders . . . . . . . . . . . . . . . . . . . . . . . . . . . . . . . . 672,000 $28.22 1,207,000
Equity compensation plans not approvedby security holders . . . . . . . . . . . . . . . . . . . . . . . . . . . . . . . . — — —
Total . . . . . . . . . . . . . . . . . . . . . . . . . . . . . . . . . . . . . . . . . . . . . . . . . 672,000 $28.22 1,207,000
Item 13. Certain Relationships And Related Transactions, and Director Independence
Information concerning the Certain Relationships and Related Transactions, and Director Independence in theCompany’s 2010 Proxy Statement is incorporated herein by reference.
Item 14. Principal Accounting Fees And Services
Information concerning the Principal Accountant Fees and Services in the Company’s 2010 Proxy Statementis incorporated herein by reference.
PART IV
Item 15. Exhibits, Financial Statement Schedules
(a) The following documents are filed as part of this Report:
(1) Financial Statements
26

The financial statements filed as part of this report are listed on the Index to Consolidated FinancialStatements and Financial Statements Schedule on page F-1.
(2) Financial Statement Schedule — Page S-1
Schedule II — Valuation and Qualifying Accounts
All other schedules are omitted either because they are not applicable or because the information required iscontained in the financial statements or notes thereto.
(b) Exhibits
3.1 Amended and Restated Certificate of Incorporation filed February 28, 1990 (Incorporated byreference from the Company’s Form 10-Q dated May 4, 1990).
3.2 Revised Bylaws adopted May 17, 2006 (Incorporated by reference from the Company’s Form 10-Kdated December 6, 2006).
4.3 Amended and Restated Loan Agreement dated December 1, 2006 by and among J & J Snack FoodsCorp. and Certain of its Subsidiaries and Citizens Bank of Pennsylvania, as Agent (Incorporated byreference from the Company’s Form 10-K dated December 6, 2006).
10.1 Proprietary Exclusive Manufacturing Agreement dated July 17, 1984 between J & J Snack FoodsCorp. and Wisco Industries, Inc. (Incorporated by reference from the Company’s Form S-1 datedFebruary 4, 1986, file no. 33-2296).
10.2* J & J Snack Foods Corp. Stock Option Plan (Incorporated by reference from the Company’sDefinitive Proxy Statement dated December 19, 2002).
10.3* Adoption Agreement for MFS Retirement Services, Inc. Non-Standardized 401(K) Profit SharingPlan and Trust, effective September 1, 2004 (Incorporated by reference from the Company’s Form10-K dated December 6, 2006).
10.4* J & J Snack Foods Corp. Directors’ and Consultants’ Deferred Compensation Plan adoptedNovember 21, 2005 (Incorporated by reference from the Company’s Form 10-K dated December 6,2006).
10.7 Lease dated August 29, 1995 between J & J Snack Foods Corp. and 5353 Downey Associated Ltd.for the lease of the Vernon, CA facility (Incorporated by reference from the Company’s Form 10-Kdated December 21, 1995).
10.8* J & J Snack Foods Corp. Employee Stock Purchase Plan (Incorporated by reference from theCompany’s Form S-8 dated May 16, 1996).
10.11 Amendment No. 1 to Lease dated August 29, 1995 between J & J Snack Foods Corp. and 5353Downey Associated Ltd. for the lease of the Vernon, CA facility (Incorporated by reference fromthe Company’s Form 10-K dated December 18, 2002).
10.14 Leases and amendments to leases between Liberty Venture I, LP and J & J Snack Foods Corp. forthe three buildings located in Bridgeport, New Jersey (Incorporated by reference from the Company’sForm 10-K dated December 8, 2009).
10.15** Amendment No. 2 to Lease dated August 29, 1995 between J & J Snack Foods Corp. and 5353Downey Associated Ltd. for the lease of the Vernon, CA facility.
10.16** Amendment to Lease dated January 1, 1996 between Country Home Bakers, LLC and BorckAssociates Limited Partnership for the lease of the Atlanta, GA facility.
14.1 Code of Ethics Pursuant to Section 406 of the Sarbanes-OxleyAct of 2002 (Incorporated by referencefrom the Company’s 10-Q dated July 20, 2004).
21.1** Subsidiaries of J & J Snack Foods Corp.
27

23.1** Consent of Independent Registered Public Accounting Firm.
31.1** Certification Pursuant to Section 302 of the Sarbanes-Oxley Act of 2002.
31.2** Certification Pursuant to Section 302 of the Sarbanes-Oxley Act of 2002.
32.1** Certification Pursuant to 18 U.S.C. Section 1350, As Adopted Pursuant To Section 906 Of TheSarbanes-Oxley Act of 2002.
32.2** Certification Pursuant to 18 U.S.C. Section 1350, As Adopted Pursuant To Section 906 Of TheSarbanes-Oxley Act of 2002.
* Compensatory Plan** Filed Herewith
28

SIGNATURES
Pursuant to the requirements of Section 13(a) or 15(d) of the Securities Exchange Act of 1934, the Registranthas duly caused report to be signed on its behalf by the undersigned, thereunto duly authorized.
J & J SNACK FOODS CORP.
December 7, 2010 By /s/ Gerald B. ShreiberGerald B. Shreiber,Chairman of the Board,President, Chief ExecutiveOfficer and Director(Principal Executive Officer)
Pursuant to the requirements of the Securities Exchange Act of 1934, this report has been signed below bythe following persons on behalf of the Registrant and in the capacities and on the dates indicated.
December 7, 2010 /s/ Gerald B. ShreiberGerald B. Shreiber,Chairman of the Board,President, Chief ExecutiveOfficer and Director(Principal Executive Officer)
December 7, 2010 /s/ Dennis G. MooreDennis G. Moore, Senior VicePresident, Chief FinancialOfficer and Director(Principal Financial Officer)(Principal Accounting Officer)
December 7, 2010 /s/ Sidney R. BrownSidney R. Brown, Director
December 7, 2010 /s/ Peter G. StanleyPeter G. Stanley, Director
December 7, 2010 /s/ Leonard M. LodishLeonard M. Lodish, Director
29


J & J SNACK FOODS CORP.INDEX TO CONSOLIDATED FINANCIAL STATEMENTS
AND FINANCIAL STATEMENT SCHEDULE
Financial Statements:
Report of Independent Registered Public Accounting Firm . . . . . . . . . . . . . . . . . . . . . . . . . . . . . . . . . . . . . . . . . . . . . . F-2
Consolidated Balance Sheets as of September 25, 2010 and September 26, 2009 . . . . . . . . . . . . . . . . . . . . . . . F-3
Consolidated Statements of Earnings for fiscal years ended September 25, 2010, September 26, 2009and September 27, 2008 . . . . . . . . . . . . . . . . . . . . . . . . . . . . . . . . . . . . . . . . . . . . . . . . . . . . . . . . . . . . . . . . . . . . . . . . . . . . . . F-4
Consolidated Statement of Changes in Stockholders’ Equity for the fiscal years ended September 25,2010, September 26, 2009 and September 27, 2008 . . . . . . . . . . . . . . . . . . . . . . . . . . . . . . . . . . . . . . . . . . . . . . . . . . F-5
Consolidated Statements of Cash Flows for fiscal years ended September 25, 2010, September 26,2009 and September 27, 2008 . . . . . . . . . . . . . . . . . . . . . . . . . . . . . . . . . . . . . . . . . . . . . . . . . . . . . . . . . . . . . . . . . . . . . . . . F-6
Notes to Consolidated Financial Statements . . . . . . . . . . . . . . . . . . . . . . . . . . . . . . . . . . . . . . . . . . . . . . . . . . . . . . . . . . . . . F-7
Financial Statement Schedule:
Schedule II — Valuation and Qualifying Accounts . . . . . . . . . . . . . . . . . . . . . . . . . . . . . . . . . . . . . . . . . . . . . . . . . . . . . . S-1
F-1

Report of Independent Registered Public Accounting Firm
Shareholders and Board of DirectorsJ & J Snack Foods Corp. and Subsidiaries
We have audited the accompanying consolidated balance sheets of J & J Snack Foods Corp. and Subsidiaries as ofSeptember 25, 2010 and September 26, 2009, and the related consolidated statements of earnings, changes in stockholders’equity, and cash flows for each of the three fiscal years in the period ended September 25, 2010 (52 weeks, 52 weeks,and 52 weeks, respectively). Our audits of the basic financial statements included the financial statement schedule listedin the index appearing under Item 15. We have also audited J & J Snack Foods Corp. and Subsidiaries’ internal controlover financial reporting as of September 25, 2010, based on criteria established in Internal Control-Integrated Frameworkissued by the Committee of Sponsoring Organizations of the Treadway Commission (COSO). J & J Snack Foods Corp.and Subsidiaries’ management is responsible for these financial statements and financial statement schedule, formaintaining effective internal control over financial reporting, and for its assessment of the effectiveness of internal controlover financial reporting, included in the accompanying Management’s Report on Internal Control over FinancialReporting. Our responsibility is to express an opinion on these financial statements and financial statement schedule andan opinion on J & J Snack Foods Corp. and Subsidiaries’ internal control over financial reporting based on our audits.
We conducted our audits in accordance with the standards of the Public Company Accounting Oversight Board(United States). Those standards require that we plan and perform the audits to obtain reasonable assurance about whetherthe financial statements are free of material misstatement and whether effective internal control over financial reportingwas maintained in all material respects. Our audits of the financial statements included examining, on a test basis, evidencesupporting the amounts and disclosures in the financial statements, assessing the accounting principles used and significantestimates made by management, and evaluating the overall financial statement presentation. Our audit of internal controlover financial reporting included obtaining an understanding of internal control over financial reporting, assessing therisk that a material weakness exists, and testing and evaluating the design and operating effectiveness of internal controlbased on the assessed risk. Our audits also included performing such other procedures as we considered necessary inthe circumstances. We believe that our audits provide a reasonable basis for our opinions.
A company’s internal control over financial reporting is a process designed to provide reasonable assurance regardingthe reliability of financial reporting and the preparation of financial statements for external purposes in accordance withgenerally accepted accounting principles. A company’s internal control over financial reporting includes those policiesand procedures that (1) pertain to the maintenance of records that, in reasonable detail, accurately and fairly reflect thetransactions and dispositions of the assets of the company; (2) provide reasonable assurance that transactions are recordedas necessary to permit preparation of financial statements in accordance with generally accepted accounting principles,and that receipts and expenditures of the company are being made only in accordance with authorizations of managementand directors of the company; and (3) provide reasonable assurance regarding prevention or timely detection ofunauthorized acquisition, use, or disposition of the company’s assets that could have a material effect on the financialstatements.
Because of its inherent limitations, internal control over financial reporting may not prevent or detect misstatements. Also,projections of any evaluation of effectiveness to future periods are subject to the risk that controls may become inadequatebecause of changes in conditions, or that the degree of compliance with the policies or procedures may deteriorate.
In our opinion, the consolidated financial statements referred to above present fairly, in all material respects, theconsolidated financial position of J & J Snack Foods Corp. and Subsidiaries as of September 25, 2010 and September 26,2009, and the consolidated results of its operations and its consolidated cash flows for each of the three fiscal years inthe period ended September 25, 2010 (52 weeks, 52 weeks and 52 weeks) in conformity with accounting principlesgenerally accepted in the United States of America. Also, in our opinion, the related financial statement schedule, whenconsidered in relation to the basic financial statements taken as a whole, presents fairly, in all material respects, theinformation set forth therein. In our opinion, J & J Snack Foods Corp. and Subsidiaries maintained, in all material respects,effective internal control over financial reporting as of September 25, 2010, based on criteria established in InternalControl-Integrated Framework issued by COSO.
/s/ Grant Thornton LLP
Philadelphia, Pennsylvania
December 7, 2010
F-2

J & J SNACK FOODS CORP. AND SUBSIDIARIESCONSOLIDATED BALANCE SHEETS
September 25,2010
September 26,2009
(in thousands, except share amounts)
AssetsCurrent Assets
Cash and cash equivalents . . . . . . . . . . . . . . . . . . . . . . . . . . . . . . . . . . . . . . . . . . . . . . . . . . . $ 74,665 $ 60,343Marketable securities held to maturity . . . . . . . . . . . . . . . . . . . . . . . . . . . . . . . . . . . . . . . . 15,481 38,653Receivables
Trade, less allowances of $591 and $623, respectively . . . . . . . . . . . . . . . . . . . . . . . 68,183 59,734Other . . . . . . . . . . . . . . . . . . . . . . . . . . . . . . . . . . . . . . . . . . . . . . . . . . . . . . . . . . . . . . . . . . . . 1,692 808
Inventories . . . . . . . . . . . . . . . . . . . . . . . . . . . . . . . . . . . . . . . . . . . . . . . . . . . . . . . . . . . . . . . . . 50,630 46,004Prepaid expenses and other . . . . . . . . . . . . . . . . . . . . . . . . . . . . . . . . . . . . . . . . . . . . . . . . . . 6,067 1,910Deferred income taxes . . . . . . . . . . . . . . . . . . . . . . . . . . . . . . . . . . . . . . . . . . . . . . . . . . . . . . . 3,813 3,659
Total current assets . . . . . . . . . . . . . . . . . . . . . . . . . . . . . . . . . . . . . . . . . . . . . . . . . . . . . 220,531 211,111
Property, Plant and Equipment, at cost . . . . . . . . . . . . . . . . . . . . . . . . . . . . . . . . . . . . . . . . . . 414,403 383,156Less accumulated depreciation and amortization . . . . . . . . . . . . . . . . . . . . . . . . . . . . . . . 304,311 285,983
110,092 97,173
Other AssetsGoodwill . . . . . . . . . . . . . . . . . . . . . . . . . . . . . . . . . . . . . . . . . . . . . . . . . . . . . . . . . . . . . . . . . . . 70,070 60,314Other intangible assets, net . . . . . . . . . . . . . . . . . . . . . . . . . . . . . . . . . . . . . . . . . . . . . . . . . . . 55,284 49,125Marketable securities held to maturity . . . . . . . . . . . . . . . . . . . . . . . . . . . . . . . . . . . . . . . . 26,300 19,994Other . . . . . . . . . . . . . . . . . . . . . . . . . . . . . . . . . . . . . . . . . . . . . . . . . . . . . . . . . . . . . . . . . . . . . . 1,717 2,110
153,371 131,543
$483,994 $439,827
Liabilities and Stockholders’ EquityCurrent Liabilities
Current obligations under capital leases . . . . . . . . . . . . . . . . . . . . . . . . . . . . . . . . . . . . . . . $ 244 $ 96Accounts payable . . . . . . . . . . . . . . . . . . . . . . . . . . . . . . . . . . . . . . . . . . . . . . . . . . . . . . . . . . . 52,338 48,204Accrued liabilities . . . . . . . . . . . . . . . . . . . . . . . . . . . . . . . . . . . . . . . . . . . . . . . . . . . . . . . . . . . 4,269 5,919Accrued compensation expense . . . . . . . . . . . . . . . . . . . . . . . . . . . . . . . . . . . . . . . . . . . . . . . 12,244 11,656Dividends payable . . . . . . . . . . . . . . . . . . . . . . . . . . . . . . . . . . . . . . . . . . . . . . . . . . . . . . . . . . 1,986 1,804
Total current liabilities . . . . . . . . . . . . . . . . . . . . . . . . . . . . . . . . . . . . . . . . . . . . . . . . . . 71,081 67,679
Long-term obligations under capital leases . . . . . . . . . . . . . . . . . . . . . . . . . . . . . . . . . . . . . . . 619 285Deferred income taxes . . . . . . . . . . . . . . . . . . . . . . . . . . . . . . . . . . . . . . . . . . . . . . . . . . . . . . . . . 30,401 27,033Other long-term liabilities . . . . . . . . . . . . . . . . . . . . . . . . . . . . . . . . . . . . . . . . . . . . . . . . . . . . . . 1,318 1,986
Stockholders’ EquityPreferred stock, $1 par value; authorized, 10,000,000 shares; none issued . . . . . . . . . . — —Common stock, no par value; authorized, 50,000,000 shares; issued and outstanding
18,491,000 and 18,526,000 respectively . . . . . . . . . . . . . . . . . . . . . . . . . . . . . . . . . . . . . . . 38,453 41,777Accumulated other comprehensive loss . . . . . . . . . . . . . . . . . . . . . . . . . . . . . . . . . . . . . . . . . . (2,854) (3,431)Retained earnings . . . . . . . . . . . . . . . . . . . . . . . . . . . . . . . . . . . . . . . . . . . . . . . . . . . . . . . . . . . . . 344,976 304,498
380,575 342,844
$483,994 $439,827
The accompanying notes are an integral part of these statements.
F-3
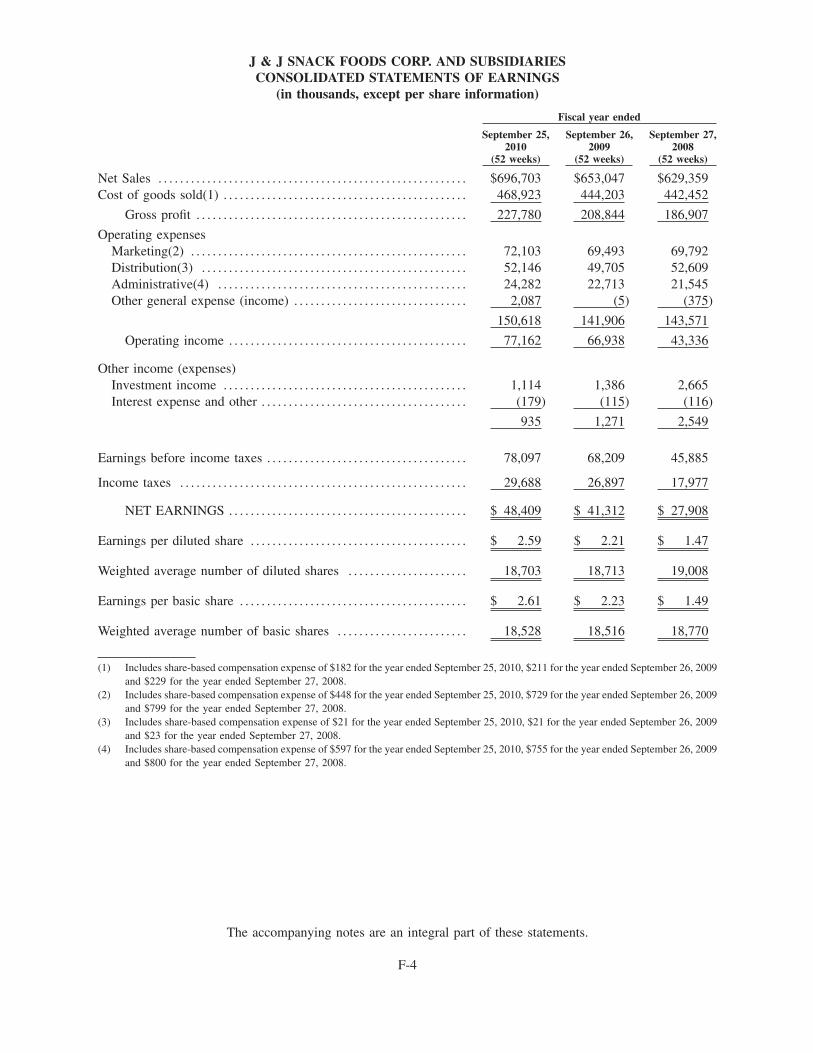
J & J SNACK FOODS CORP. AND SUBSIDIARIESCONSOLIDATED STATEMENTS OF EARNINGS
(in thousands, except per share information)
Fiscal year ended
September 25,2010
(52 weeks)
September 26,2009
(52 weeks)
September 27,2008
(52 weeks)
Net Sales . . . . . . . . . . . . . . . . . . . . . . . . . . . . . . . . . . . . . . . . . . . . . . . . . . . . . . . . . $696,703 $653,047 $629,359Cost of goods sold(1) . . . . . . . . . . . . . . . . . . . . . . . . . . . . . . . . . . . . . . . . . . . . . 468,923 444,203 442,452
Gross profit . . . . . . . . . . . . . . . . . . . . . . . . . . . . . . . . . . . . . . . . . . . . . . . . . . 227,780 208,844 186,907
Operating expensesMarketing(2) . . . . . . . . . . . . . . . . . . . . . . . . . . . . . . . . . . . . . . . . . . . . . . . . . . . 72,103 69,493 69,792Distribution(3) . . . . . . . . . . . . . . . . . . . . . . . . . . . . . . . . . . . . . . . . . . . . . . . . . 52,146 49,705 52,609Administrative(4) . . . . . . . . . . . . . . . . . . . . . . . . . . . . . . . . . . . . . . . . . . . . . . 24,282 22,713 21,545Other general expense (income) . . . . . . . . . . . . . . . . . . . . . . . . . . . . . . . . 2,087 (5) (375)
150,618 141,906 143,571
Operating income . . . . . . . . . . . . . . . . . . . . . . . . . . . . . . . . . . . . . . . . . . . . 77,162 66,938 43,336
Other income (expenses)Investment income . . . . . . . . . . . . . . . . . . . . . . . . . . . . . . . . . . . . . . . . . . . . . 1,114 1,386 2,665Interest expense and other . . . . . . . . . . . . . . . . . . . . . . . . . . . . . . . . . . . . . . (179) (115) (116)
935 1,271 2,549
Earnings before income taxes . . . . . . . . . . . . . . . . . . . . . . . . . . . . . . . . . . . . . 78,097 68,209 45,885
Income taxes . . . . . . . . . . . . . . . . . . . . . . . . . . . . . . . . . . . . . . . . . . . . . . . . . . . . . 29,688 26,897 17,977
NET EARNINGS . . . . . . . . . . . . . . . . . . . . . . . . . . . . . . . . . . . . . . . . . . . . $ 48,409 $ 41,312 $ 27,908
Earnings per diluted share . . . . . . . . . . . . . . . . . . . . . . . . . . . . . . . . . . . . . . . . $ 2.59 $ 2.21 $ 1.47
Weighted average number of diluted shares . . . . . . . . . . . . . . . . . . . . . . 18,703 18,713 19,008
Earnings per basic share . . . . . . . . . . . . . . . . . . . . . . . . . . . . . . . . . . . . . . . . . . $ 2.61 $ 2.23 $ 1.49
Weighted average number of basic shares . . . . . . . . . . . . . . . . . . . . . . . . 18,528 18,516 18,770
(1) Includes share-based compensation expense of $182 for the year ended September 25, 2010, $211 for the year ended September 26, 2009and $229 for the year ended September 27, 2008.
(2) Includes share-based compensation expense of $448 for the year ended September 25, 2010, $729 for the year ended September 26, 2009and $799 for the year ended September 27, 2008.
(3) Includes share-based compensation expense of $21 for the year ended September 25, 2010, $21 for the year ended September 26, 2009and $23 for the year ended September 27, 2008.
(4) Includes share-based compensation expense of $597 for the year ended September 25, 2010, $755 for the year ended September 26, 2009and $800 for the year ended September 27, 2008.
The accompanying notes are an integral part of these statements.
F-4

J & J Snack Foods Corp. and SubsidiariesConsolidated Statement of Changes in Stockholders’ Equity
(in thousands)
Common StockShares Amount
AccumulatedOther
ComprehensiveLoss
RetainedEarnings Total
ComprehensiveIncome
Balance at September 30, 2007 . . . . . 18,702 $ 47,280 $(2,006) $250,308 $295,582Cumulative effective of change in
accounting for income taxes . . . — — — (925) (925)Issuance of common stock upon
exercise of stock options . . . . . . 150 2,029 — — 2,029Issuance of common stock for
employee stock purchase plan . 31 782 — — 782Foreign currency translation
adjustment . . . . . . . . . . . . . . . . . . . . . — — 3 — 3 $ 3Issuance of common stock under
deferred stock plan . . . . . . . . . . . . — 388 — — 388Dividends declared . . . . . . . . . . . . . . — — — (6,925) (6,925)Share-based compensation . . . . . . . — 1,475 — — 1,475Repurchase of common stock . . . . (135) (3,539) — — (3,539)Net earnings . . . . . . . . . . . . . . . . . . . . . — — — 27,908 27,908 27,908Comprehensive income . . . . . . . . . . — — — — — $27,911
Balance at September 27, 2008 . . . . . 18,748 $ 48,415 $(2,003) $270,366 $316,778Issuance of common stock upon
exercise of stock options . . . . . . 198 3,284 — — 3,284Issuance of common stock for
employee stock purchase plan . 26 687 — — 687Foreign currency translation
adjustment . . . . . . . . . . . . . . . . . . . . . — — (1,428) — (1,428) $ (1,428)Issuance of common stock under
deferred stock plan . . . . . . . . . . . . 5 368 — — 368Dividends declared . . . . . . . . . . . . . . — — — (7,180) (7,180)Share-based compensation . . . . . . . — 1,533 — — 1,533Repurchase of common stock . . . . (451) (12,510) — — (12,510)Net earnings . . . . . . . . . . . . . . . . . . . . . — — — 41,312 41,312 41,312Comprehensive income . . . . . . . . . . — — — — — $39,884
Balance at September 26, 2009 . . . . . 18,526 $ 41,777 $(3,431) $304,498 $342,844Issuance of common stock upon
exercise of stock options . . . . . . 142 2,325 — — 2,325Issuance of common stock for
employee stock purchase plan . 22 726 — — 726Foreign currency translation
adjustment . . . . . . . . . . . . . . . . . . . . . — — 577 — 577 $ 577Issuance of common stock under
deferred stock plan . . . . . . . . . . . . 5 280 — — 280Dividends declared . . . . . . . . . . . . . . — — — (7,931) (7,931)Share-based compensation . . . . . . . — 1,113 — — 1,113Repurchase of common stock . . . . (204) (7,768) — — (7,768)Net earnings . . . . . . . . . . . . . . . . . . . . . — — — 48,409 48,409 48,409Comprehensive income . . . . . . . . . . — — — — — $48,986
Balance at September 25, 2010 . . . . . 18,491 $ 38,453 $(2,854) $344,976 $380,575
The accompanying notes are an integral part of these statements.
F-5

J & J SNACK FOODS CORP. AND SUBSIDIARIESCONSOLIDATED STATEMENTS OF CASH FLOWS
(in thousands)
Fiscal year ended
September 25,2010
(52 weeks)
September 26,2009
(52 weeks)
September 27,2008
(52 weeks)
Operating activities:Net earnings . . . . . . . . . . . . . . . . . . . . . . . . . . . . . . . . . . . . . . . . . . . . . . . . . . . $ 48,409 $ 41,312 $ 27,908Adjustments to reconcile net earnings to net cash provided by
operating activities:Depreciation and amortization of fixed assets . . . . . . . . . . . . . . . . 24,498 22,663 22,181Amortization of intangibles and deferred costs . . . . . . . . . . . . . . 5,354 5,090 5,289Gains from disposals and impairment of property &
equipment . . . . . . . . . . . . . . . . . . . . . . . . . . . . . . . . . . . . . . . . . . . . . . . . . (14) (31) (174)Share-based compensation . . . . . . . . . . . . . . . . . . . . . . . . . . . . . . . . . . . 1,248 1,716 1,851Deferred income taxes . . . . . . . . . . . . . . . . . . . . . . . . . . . . . . . . . . . . . . . 3,219 3,839 3,446Changes in assets and liabilities, net of effects from
purchase of companies:(Increase) decrease in accounts receivable . . . . . . . . . . . . . . . . (8,629) 1,144 (4,701)(Increase) decrease in inventories . . . . . . . . . . . . . . . . . . . . . . . . . (4,422) 2,993 (2,448)(Increase) decrease in prepaid expenses and other . . . . . . . . (4,101) 37 (537)Increase in accounts payable and accrued liabilities . . . . . . . 2,446 1,870 2,082
Net cash provided by operating activities . . . . . . . . . . . . . . . . . . . . 68,008 80,633 54,897
Investing activities:Purchases of property, plant and equipment . . . . . . . . . . . . . . . . . . . . (33,531) (27,190) (22,781)Payments for purchases of companies, net of cash acquired . . . . (25,185) — —Purchase of marketable securities . . . . . . . . . . . . . . . . . . . . . . . . . . . . . . (50,496) (66,380) (2,470)Proceeds from redemption and sales of marketable securities . . 67,362 10,204 —Purchase of auction market preferred stock . . . . . . . . . . . . . . . . . . . . — — (10,500)Proceeds from redemption and sales of auction market
preferred stock . . . . . . . . . . . . . . . . . . . . . . . . . . . . . . . . . . . . . . . . . . . . . . . — 35,200 16,500Proceeds from disposal of property and equipment . . . . . . . . . . . . . 407 326 932Other . . . . . . . . . . . . . . . . . . . . . . . . . . . . . . . . . . . . . . . . . . . . . . . . . . . . . . . . . . . (12) 15 (535)
Net cash used in investing activities . . . . . . . . . . . . . . . . . . . . . . . . . (41,455) (47,825) (18,854)
Financing activities:Payments to repurchase common stock . . . . . . . . . . . . . . . . . . . . . . . . (7,768) (12,510) (3,539)Proceeds from issuance of common stock . . . . . . . . . . . . . . . . . . . . . . 3,051 3,971 2,811Payments of cash dividend . . . . . . . . . . . . . . . . . . . . . . . . . . . . . . . . . . . . . (7,749) (7,108) (6,781)Payments on capitalized lease obligations . . . . . . . . . . . . . . . . . . . . . . (143) (93) (91)
Net cash used in financing activities . . . . . . . . . . . . . . . . . . . . . . . . . (12,609) (15,740) (7,600)Effect of exchange rate on cash and cash equivalents . . . . . . . 378 (990) 3
Net increase in cash and cash equivalents . . . . . . . . . . . . . . . . . . . 14,322 16,078 28,446Cash and cash equivalents at beginning of year . . . . . . . . . . . . . . . . . . 60,343 44,265 15,819
Cash and cash equivalents at end of year . . . . . . . . . . . . . . . . . . . . . . . . . $ 74,665 $ 60,343 $ 44,265
The accompanying notes are an integral part of these statements.
F-6

NOTE A — SUMMARY OF SIGNIFICANT ACCOUNTING POLICIES
J & J Snack Foods Corp. and Subsidiaries (the Company) manufactures, markets and distributes a variety ofnutritional snack foods and beverages to the food service and retail supermarket industries. A summary of thesignificant accounting policies consistently applied in the preparation of the accompanying consolidated financialstatements follows.
1. Principles of Consolidation
The consolidated financial statements include the accounts of J & J Snack Foods Corp. and its wholly-ownedsubsidiaries. Intercompany balances and transactions have been eliminated in the consolidated financial statements.
2. Revenue Recognition
We recognize revenue from our products when the products are shipped to our customers. Repair andmaintenance equipment service revenue is recorded when it is performed provided the customer terms are that thecustomer is to be charged on a time and material basis or on a straight-line basis over the term of the contract whenthe customer has signed a service contract. Revenue is recognized only where persuasive evidence of an arrangementexists, our price is fixed or estimable and collectability is reasonably assured. We record offsets to revenue forallowances, end-user pricing adjustments, trade spending, coupon redemption costs and returned product.Customers generally do not have the right to return product unless it is damaged or defective.
All amounts billed to customers related to shipping and handling are classified as revenues. Our product costsinclude amounts for shipping and handling, therefore, we charge our customers shipping and handling fees at thetime the products are shipped or when services are performed. The cost of shipping products to the customer isrecognized at the time the products are shipped to the customer and our policy is to classify them as Distributionexpenses. The cost of shipping products to the customer classified as Distribution expenses was $52,146,000,$49,705,000 and $52,609,000 for the fiscal years ended 2010, 2009 and 2008, respectively.
During the years ended September 25, 2010, September 26, 2009 and September 27, 2008, we sold$16,185,000, $16,745,000 and $11,881,000, respectively, of repair and maintenance service contracts related tofrozen beverage machines. At September 25, 2010 and September 26, 2009, deferred income on repair andmaintenance service contracts was $1,416,000 and $1,424,000, respectively, of which $67,000 and $90,000 isincluded in other long-term liabilities as of September 25, 2010 and September 26, 2009, respectively and thebalance is reflected as short-term and included in accrued liabilities on the consolidated balance sheet. Repair andmaintenance service contract income of $16,192,000, $16,451,000 and $11,911,000 was recognized for the fiscalyears ended 2010, 2009 and 2008, respectively.
3. Foreign Currency
Assets and liabilities in foreign currencies are translated into U.S. dollars at the rate of exchange prevailingat the balance sheet date. Revenues and expenses are translated at the average rate of exchange for the period. Thecumulative translation adjustment is recorded as a separate component of stockholders’ equity and changes to suchare included in comprehensive income.
4. Use of Estimates
In preparing financial statements in conformity with accounting principles generally accepted in the UnitedStates of America, management is required to make estimates and assumptions that affect the reported amountsof assets and liabilities, the disclosure of contingent assets and liabilities at the date of the financial statements,and the reported amounts of revenues and expenses during the reporting period. Actual results could differ fromthose estimates.
5. Cash Equivalents
Cash equivalents are short-term, highly liquid investments with original maturities of three months or less.
J & J SNACK FOODS CORP. AND SUBSIDIARIESNOTES TO CONSOLIDATED FINANCIAL STATEMENTS
F-7
6. Concentrations of Credit Risk and Accounts Receivable
We maintain cash balances at financial institutions located in various states. Some of our accounts are insuredby the Federal Deposit Insurance Corporation up to $250,000. We customarily maintain cash balances in excessof these insurance limits. Some of our cash is in bank accounts which are insured by the Federal Deposit InsuranceCorporation with no limit.
Other financial instruments that could potentially subject us to concentrations of credit risk are trade accountsreceivable; however, such risks are limited due to the large number of customers comprising our customer baseand their dispersion across geographic regions. We usually have approximately 10 customers with accountsreceivable balances of between $1 million and $7 million.
We have several large customers that account for a significant portion of our sales. Our top ten customersaccounted for 42%, 43% and 42% of our sales during fiscal years 2010, 2009 and 2008, respectively, with our largestcustomer accounting for 8% of our sales in 2010, 9% in 2009 and 9% in 2008. Three of the ten customers are fooddistributors who sell our product to many end users.
The majority of our accounts receivable are due from trade customers. Credit is extended based on evaluationof our customers’ financial condition and collateral is not required. Accounts receivable payment terms vary andare stated in the financial statements at amounts due from customers net of an allowance for doubtful accounts.Accounts outstanding longer than the payment terms are considered past due. We determine our allowance byconsidering a number of factors, including the length of time trade accounts receivable are past due, our previousloss history, customers’ current ability to pay their obligations to us, and the condition of the general economy andthe industry as a whole. We write off accounts receivable when they become uncollectible, and paymentssubsequently received on such receivables are credited to the allowance for doubtful accounts.
7. Inventories
Inventories are valued at the lower of cost (determined by the first-in, first-out or weighted-average method)or market. We recognize abnormal amounts of idle facilities, freight, handling costs, and spoilage as charges ofthe current period. Additionally, we allocate fixed production overheads to inventories based on the normal capacityof our production facilities. We calculate normal capacity as the production expected to be achieved over a numberof periods or seasons under normal circumstances, taking into account the loss of capacity resulting from plannedmaintenance. This requires us to use judgment to determine when production is outside the range of expectedvariation in production (either abnormally low or abnormally high). In periods of abnormally low production (forexample, periods in which there is significantly lower demand, labor and material shortages exist, or there isunplanned equipment downtime) the amount of fixed overhead allocated to each unit of production is not increased.However, in periods of abnormally high production the amount of fixed overhead allocated to each unit of productionis decreased to assure inventories are not measured above cost.
We review for slow moving and obsolete inventory and a reserve is established for the value of inventory thatwe estimate will not be used. At September 25, 2010 and September 26, 2009, our reserve for inventory was$4,189,000 and $4,209,000, respectively.
8. Investment Securities
We classify our investment securities in one of three categories: held to maturity, trading, or available for sale;however, we have classified our auction market preferred stock separately in our statement of cash flows becauseof the failure of the auction market beginning in February 2008. The balance of our investment portfolio consistssolely of investments classified as held to maturity. See Note C for further information on our holdings of investmentsecurities.
J & J SNACK FOODS CORP. AND SUBSIDIARIESNOTES TO CONSOLIDATED FINANCIAL STATEMENTS
NOTE A — SUMMARY OF SIGNIFICANT ACCOUNTING POLICIES (Continued)
F-8

9. Depreciation and Amortization
Depreciation of equipment and buildings is provided for by the straight-line method over the assets’ estimateduseful lives. We review our equipment and buildings to ensure that they provide economic benefit and are notimpaired.
Amortization of improvements is provided for by the straight-line method over the term of the lease or theassets’ estimated useful lives, whichever is shorter. Licenses and rights arising from acquisitions are amortized bythe straight-line method over periods ranging from 3 to 20 years.
We use market value tests and discounted cash flow models to test goodwill and other intangible assets forimpairment. These assets are reviewed for impairment annually or more frequently as a triggering event, such asthe loss of a major customer, might occur.
10. Fair Value of Financial Instruments
The carrying value of our short-term financial instruments, such as accounts receivables and accounts payable,approximate their fair values, based on the short-term maturities of these instruments.
11. Income Taxes
We account for our income taxes under the liability method. Under the liability method, deferred tax assetsand liabilities are determined based on the difference between the financial statement and tax bases of assets andliabilities as measured by the enacted tax rates that will be in effect when these differences reverse. Deferred taxexpense is the result of changes in deferred tax assets and liabilities.
Additionally, we recognize a liability for income taxes and associated penalties and interest for tax positionstaken or expected to be taken in a tax return which are more likely than not to be overturned by taxing authorities(“uncertain tax positions”). We have not recognized a tax benefit in our financial statements for these uncertaintax positions.
On September 30, 2007, the first day of the 2008 fiscal year, we recognized a $925,000 decrease to openingretained earnings from the cumulative effect of recognizing a liability for uncertain tax positions. As ofSeptember 25, 2010 and September 26, 2009, the total amount of gross unrecognized tax benefits is $1,249,000and $1,895,000, respectively, all of which would impact our effective tax rate over time, if recognized. We recognizeinterest and penalties related to income tax matters as a part of the provision for income taxes. The Company had$429,000 and $742,000 of accrued interest and penalties as of September 25, 2010 and September 26, 2009,respectively. We recognized $7,000 and $3,000 of penalties and interest in the years ended September 25, 2010and September 26, 2009, respectively. A reconciliation of the beginning and ending amount of unrecognized taxbenefits is as follows:
(in thousands)
Balance at September 26, 2009 . . . . . . . . . . . . . . . . . . . . . . . . . . . . . . . . . . . . . . $1,895Additions based on tax positions related to the current year . . . . . . . . . 158Reductions for tax positions of prior years . . . . . . . . . . . . . . . . . . . . . . . . . . (750)Settlements . . . . . . . . . . . . . . . . . . . . . . . . . . . . . . . . . . . . . . . . . . . . . . . . . . . . . . . . . . (54)
Balance at September 25, 2010 . . . . . . . . . . . . . . . . . . . . . . . . . . . . . . . . . . . . . . $1,249
In addition to our federal tax return and tax returns for Mexico and Canada, we file tax returns in all statesthat have a corporate income tax. Virtually all the returns noted above are open for examination for three to fouryears.
J & J SNACK FOODS CORP. AND SUBSIDIARIESNOTES TO CONSOLIDATED FINANCIAL STATEMENTS
NOTE A — SUMMARY OF SIGNIFICANT ACCOUNTING POLICIES (Continued)
F-9

12. Earnings Per Common Share
Basic earnings per common share (EPS) excludes dilution and is computed by dividing income available tocommon shareholders by the weighted average common shares outstanding during the period. Diluted EPS takesinto consideration the potential dilution that could occur if securities (stock options) or other contracts to issuecommon stock were exercised and converted into common stock.
Our calculation of EPS is as follows:
Fiscal Year Ended September 25, 2010
Income(Numerator)
Shares(Denominator)
Per ShareAmount
(in thousands, except per share amounts)
Earnings Per Basic ShareNet Income available to common stockholders . . . . . . . . . . . . . . . . . . . . . . . $48,409 18,528 $2.61
Effect of Dilutive SecuritiesOptions . . . . . . . . . . . . . . . . . . . . . . . . . . . . . . . . . . . . . . . . . . . . . . . . . . . . . . . . . . . . . . . — 175 (.02)
Earnings Per Diluted ShareNet Income available to common stockholders plus assumed
conversions . . . . . . . . . . . . . . . . . . . . . . . . . . . . . . . . . . . . . . . . . . . . . . . . . . . . . . . . . $48,409 18,703 $2.59
110,900 anti-dilutive shares have been excluded in the computation of 2010 diluted EPS because the options’exercise price is greater than the average market price of the common stock.
Fiscal Year Ended September 26, 2009
Income(Numerator)
Shares(Denominator)
Per ShareAmount
(in thousands, except per share amounts)
Earnings Per Basic ShareNet Income available to common stockholders . . . . . . . . . . . . . . . . . . . . . . . $41,312 18,516 $2.23
Effect of Dilutive SecuritiesOptions . . . . . . . . . . . . . . . . . . . . . . . . . . . . . . . . . . . . . . . . . . . . . . . . . . . . . . . . . . . . . . . — 197 (.02)
Earnings Per Diluted ShareNet Income available to common stockholders plus assumed
conversions . . . . . . . . . . . . . . . . . . . . . . . . . . . . . . . . . . . . . . . . . . . . . . . . . . . . . . . . . $41,312 18,713 $2.21
114,236 anti-dilutive shares have been excluded in the computation of 2009 diluted EPS because the options’exercise price is greater than the average market price of the common stock.
Fiscal Year Ended September 27, 2008
Income(Numerator)
Shares(Denominator)
Per ShareAmount
(in thousands, except per share amounts)
Earnings Per Basic ShareNet Income available to common stockholders . . . . . . . . . . . . . . . . . . . . . . . $27,908 18,770 $1.49
Effect of Dilutive SecuritiesOptions . . . . . . . . . . . . . . . . . . . . . . . . . . . . . . . . . . . . . . . . . . . . . . . . . . . . . . . . . . . . . . . — 238 (.02)
Earnings Per Diluted ShareNet Income available to common stockholders plus assumed
conversions . . . . . . . . . . . . . . . . . . . . . . . . . . . . . . . . . . . . . . . . . . . . . . . . . . . . . . . . . $27,908 19,008 $1.47
273,471 anti-dilutive shares have been excluded in the computation of 2008 diluted EPS because the options’exercise price is greater than the average market price of the common stock.
J & J SNACK FOODS CORP. AND SUBSIDIARIESNOTES TO CONSOLIDATED FINANCIAL STATEMENTS
NOTE A — SUMMARY OF SIGNIFICANT ACCOUNTING POLICIES (Continued)
F-10

13. Accounting for Stock-Based Compensation
At September 25, 2010, the Company has three stock-based employee compensation plans. Share-basedcompensation was recognized as follows:
Fiscal year ended
September 25,2010
September 26,2009
September 27,2008
(in thousands, except per share amounts)
Stock options . . . . . . . . . . . . . . . . . . . . . . . . . . . . . . . . . . . . . . . . . . . . . . . . . . . . . . . . . $592 $508 $1,019Stock purchase plan . . . . . . . . . . . . . . . . . . . . . . . . . . . . . . . . . . . . . . . . . . . . . . . . . . 184 237 137Deferred stock issued to outside directors . . . . . . . . . . . . . . . . . . . . . . . . . . . . . 138 138 138Restricted stock issued to an employee . . . . . . . . . . . . . . . . . . . . . . . . . . . . . . . 28 87 100
$942 $970 $1,394
Per diluted share . . . . . . . . . . . . . . . . . . . . . . . . . . . . . . . . . . . . . . . . . . . . . . . . . . . . . . $ .05 $ .05 $ .07
The above compensation is net of tax benefits . . . . . . . . . . . . . . . . . . . . . . . . $306 $746 $ 457
At September 25, 2010, the Company has unrecognized compensation expense of approximately $960,000to be recognized over the next three fiscal years.
The fair value of each option grant is estimated on the date of grant using the Black-Scholes options-pricingmodel with the following weighted average assumptions used for grants in fiscal 2010, 2009 and 2008: expectedvolatility of 29.0% for fiscal year 2010, 23.3% for year 2009 and 25.2% for year 2008; weighted average risk-freeinterest rates of 2.21%, 2.70% and 3.60%; dividend rate of 1.2%, 1.2% and 1.1% and expected lives ranging between5 and 10 years for all years. An expected forfeiture rate of 13% was used for fiscal year 2010, and 15% was usedfor 2009 and 2008.
Expected volatility is based on the historical volatility of the price of our common shares over the past 50to 54 months for 5 year options and 10 years for 10 year options. We use historical information to estimate expectedlife and forfeitures within the valuation model. The expected term of awards represents the period of time thatoptions granted are expected to be outstanding. The risk-free rate for periods within the expected life of the optionis based on the U.S. Treasury yield curve in effect at the time of grant. Compensation cost is recognized using astraight-line method over the vesting or service period and is net of estimated forfeitures.
14. Advertising Costs
Advertising costs are expensed as incurred. Total advertising expense was $2,751,000, $2,267,000, and$1,666,000 for the fiscal years 2010, 2009 and 2008, respectively.
15. Commodity Price Risk Management
Our most significant raw material requirements include flour, shortening, corn syrup, sugar, juice, cheese,chocolate, and a variety of nuts. We attempt to minimize the effect of future price fluctuations related to the purchaseof raw materials primarily through forward purchasing to cover future manufacturing requirements, generally forperiods from 1 to 12 months. As of September 25, 2010, we have approximately $44 million of such commitments.Futures contracts are not used in combination with forward purchasing of these raw materials. Our procurementpractices are intended to reduce the risk of future price increases, but also may potentially limit the ability to benefitfrom possible price decreases. Our policy is to recognize estimated losses on purchase commitments when theyoccur. At each of the last three fiscal year ends, we did not have any material losses on our purchase commitments.
J & J SNACK FOODS CORP. AND SUBSIDIARIESNOTES TO CONSOLIDATED FINANCIAL STATEMENTS
NOTE A — SUMMARY OF SIGNIFICANT ACCOUNTING POLICIES (Continued)
F-11

16. Research and Development Costs
Research and development costs are expensed as incurred. Total research and development expense was$866,000, $761,000 and $571,000 for the fiscal years 2010, 2009 and 2008, respectively.
17. Recent Accounting Pronouncements
In December 2007, the FASB issued guidance expanding the definition of a business combination and requiringthe fair value of the purchase price of an acquisition, including the issuance of equity securities, to be determinedon the acquisition date. The guidance also requires that all assets, liabilities, contingent considerations, andcontingencies of an acquired business be recorded at fair value at the acquisition date. In addition, the guidancerequires that acquisition costs generally be expensed in the period incurred and changes in accounting for deferredtax asset valuation allowances and acquired income tax uncertainties after the measurement period to impact incometax expense. We adopted this guidance for the acquisitions we made in our fiscal year 2010.
In August 2008, the FASB issued guidance that revises the factors that a company should consider to developrenewal or extension assumptions used in estimating the useful life of a recognized intangible asset. The newguidance will apply to all intangible assets acquired after the guidance’s effective date. The guidance also requiresnew disclosures for all intangible assets recognized as of, and subsequent to, the effective date. The underlyingpurpose of the guidance is to improve the consistency between the period of expected cash flows used to measurethe fair value of a recognized intangible asset and the useful life of an intangible asset. This guidance was effectivefor our 2010 fiscal year. The adoption of this guidance had no impact on our consolidated financial statements.
In April 2009, the FASB issued guidance that amends the provisions in its guidance issued in December 2007for the initial recognition and measurement, subsequent measurement and accounting, and disclosures for assetsand liabilities arising from contingencies in business combinations. This revised guidance eliminates the distinctionbetween contractual and non-contractual contingencies, including the initial recognition and measurement criteria,included in the December 2007 guidance and carries forward most of the provisions related to acquiredcontingencies in its June 2001 guidance. This guidance was effective for contingent assets and contingent liabilitiesacquired in business combinations for which the acquisition date was on or after the beginning of our fiscal year2010. The effect of this guidance on our consolidated financial statements will depend upon the nature, terms andsize of any acquired contingencies consummated in fiscal year 2010 or later. For the acquisitions we made in fiscalyear 2010, the adoption of this guidance had no effect on our consolidated financial statements.
18. Reclassifications
Certain prior year financial statement amounts have been reclassified to be consistent with the presentationfor the current year.
NOTE B — ACQUISITIONS
On January 31, 2006, we acquired the stock of ICEE of Hawaii. ICEE of Hawaii, headquartered in Waipahu,Hawaii, distributes ICEE frozen beverages and related products throughout the Hawaiian islands.
On May 26, 2006, The ICEE Company, our frozen carbonated beverage distribution company, acquired theSLUSH PUPPIE branded business from Dr. Pepper/Seven Up, Inc., a Cadbury Schweppes Americas BeveragesCompany for $18.1 million plus approximately $4.3 million in working capital. SLUSH PUPPIE, North America’sleading brand for frozen non-carbonated beverages, is sold through an existing established distributor network toover 20,000 locations in the United States and Canada as well as to certain international markets.
On January 9, 2007 we acquired the assets of Hom/Ade Foods, Inc., a manufacturer and distributor of biscuitsand dumplings sold under the MARY B’S and private label store brands to the supermarket industry. Hom/Adeis headquartered in Pensacola, Florida.
J & J SNACK FOODS CORP. AND SUBSIDIARIESNOTES TO CONSOLIDATED FINANCIAL STATEMENTS
NOTE A — SUMMARY OF SIGNIFICANT ACCOUNTING POLICIES (Continued)
F-12

On January 31, 2007 we acquired the assets of Radar Inc., a manufacturer and seller of fig and fruit bars sellingits products under the brand DADDY RAY’S. Headquartered and with its manufacturing facility in Moscow Mills,Missouri (outside of St. Louis), Radar, Inc. sells to the retail grocery segment and mass merchandisers, both brandedand private label.
On April 2, 2007, we acquired the WHOLE FRUIT Sorbet and FRUIT-A-FREEZE Fruit Bar brands, alongwith related assets including a manufacturing facility located in Norwalk, California which sells primarily to thesupermarket industry.
On June 25, 2007, we acquired the assets of an ICEE distributor in Kansas.
In February 2010, we acquired the assets of Parrot Ice, a manufacturer and distributor of a premium brandfrozen beverage sold primarily in convenience stores. Revenues from Parrot Ice were approximately $1.5 millionfor our 2010 fiscal year.
In June 2010, we acquired the assets of California Churros, a manufacturer and distributor of a premium brandchurro. Revenues from California Churros were approximately $2.5 million for our 2010 fiscal year.
The purchase price allocation for the California Churros acquisition and other acquisitions, including ParrotIce, which were made during the 2010 fiscal year is as follows:
CaliforniaChurros Other
(in thousands)
Working Capital . . . . . . . . . . . . . . . . . . . . . . . . . . . . . . . . . . . . . . . . . . . . . . . . . . . . . . . . . . . . $ 1,075 $ —Property, plant & equipment . . . . . . . . . . . . . . . . . . . . . . . . . . . . . . . . . . . . . . . . . . . . . . . . 2,373 1,135Trade Names . . . . . . . . . . . . . . . . . . . . . . . . . . . . . . . . . . . . . . . . . . . . . . . . . . . . . . . . . . . . . . . . 4,024 —Customer Relationships . . . . . . . . . . . . . . . . . . . . . . . . . . . . . . . . . . . . . . . . . . . . . . . . . . . . . 6,737 —Covenant not to Compete . . . . . . . . . . . . . . . . . . . . . . . . . . . . . . . . . . . . . . . . . . . . . . . . . . . 35 50Goodwill . . . . . . . . . . . . . . . . . . . . . . . . . . . . . . . . . . . . . . . . . . . . . . . . . . . . . . . . . . . . . . . . . . . . 9,756 —
$24,000 $1,185
The goodwill and intangible assets acquired in the business combinations are recorded at fair value. To measurefair value for such assets, we use techniques including discounted expected future cash flows (Level 3 input).
Acquisition costs of $184,000 for these acquisitions is included in administrative and other general expense.
NOTE C — INVESTMENT SECURITIES
We have classified our investment securities as marketable securities held to maturity and auction marketpreferred stock (AMPS). The FASB defines fair value as the price that would be received from selling an assetor paid to transfer a liability in an orderly transaction between market participants. As such, fair value is a market-based measurement that should be determined based on assumptions that market participants would use in pricingan asset or liability. As a basis for considering such assumptions, the FASB has established three levels of inputsthat may be used to measure fair value:
Level 1 Observable inputs such as quoted prices in active markets for identical assets or liabilities;Level 2 Observable inputs, other than Level 1 inputs in active markets, that are observable either directly
or indirectly; andLevel 3 Unobservable inputs for which there is little or no market data, which require the reporting entity
to develop its own assumptions.
We have concluded that the carrying value of certificates of deposit placed through the Certificate of DepositAccount Registry Service equals fair market value. Other marketable securities held to maturity values are derivedsolely from level 1 inputs.
J & J SNACK FOODS CORP. AND SUBSIDIARIESNOTES TO CONSOLIDATED FINANCIAL STATEMENTS
NOTE B — ACQUISITIONS (Continued)
F-13

The amortized cost, unrealized gains and losses, and fair market values of our investment securities held tomaturity at September 25, 2010 are summarized as follows:
AmortizedCost
GrossUnrealized
Gains
FairUnrealized
LossesMarketValue
(in thousands)
US Government Agency Debt . . . . . . . . . . . . . . . . . . . . . . . . . . . . . . . . . . $ 8,000 $ 53 $— $ 8,053FDIC Backed Corporate Debt . . . . . . . . . . . . . . . . . . . . . . . . . . . . . . . . . . 13,107 144 — 13,251Certificates of Deposit . . . . . . . . . . . . . . . . . . . . . . . . . . . . . . . . . . . . . . . . . . 20,674 5 — 20,679
$41,781 $202 $— $41,983
All of the certificates of deposit are within the FDIC limits for insurance coverage.
The amortized cost, unrealized gains and losses, and fair market values of our investment securities held tomaturity at September 26, 2009 are summarized as follows:
AmortizedCost
GrossUnrealized
Gains
FairUnrealized
LossesMarketValue
(in thousands)
US Government Agency Debt . . . . . . . . . . . . . . . . . . . . . . . . . . . . . . . . . . $ 6,009 $ 22 $ 1 $ 6,030FDIC Backed Corporate Debt . . . . . . . . . . . . . . . . . . . . . . . . . . . . . . . . . . 13,213 198 — 13,411Certificates of Deposit . . . . . . . . . . . . . . . . . . . . . . . . . . . . . . . . . . . . . . . . . . 39,425 21 3 39,443
$58,647 $241 $ 4 $58,884
All of the certificates of deposit are within the FDIC limits for insurance coverage.
The amortized cost and fair value of the Company’s held to maturity securities by contractual maturity atSeptember 25, 2010 and September 26, 2009 are summarized as follows:
September 25, 2010 September 26, 2009
AmortizedCost
FairMarketValue
AmortizedCost
FairMarketValue
(in thousands)
Due in one year or less . . . . . . . . . . . . . . . . . . . . . . . . . . . . . . . . . . . . . . . . . $15,481 $15,501 $38,653 $38,668Due after one year through five years . . . . . . . . . . . . . . . . . . . . . . . . . . . 26,300 26,482 19,994 20,216
Total held to maturity securities . . . . . . . . . . . . . . . . . . . . . . . . . . . . . . . . $41,781 $41,983 $58,647 $58,884Less current portion . . . . . . . . . . . . . . . . . . . . . . . . . . . . . . . . . . . . . . . . . . . . 15,481 15,501 38,653 38,668
Long term held to maturity securities . . . . . . . . . . . . . . . . . . . . . . . . . . . $26,300 $26,482 $19,994 $20,216
Proceeds from the sale and redemption of marketable securities were $67,362,000 and $10,204,000 in the yearsended September 25, 2010 and September 26, 2009, respectively, and none in the year ended September 27, 2008,with no gain or loss recorded. We use the specific identification method to determine the cost of securities sold.
J & J SNACK FOODS CORP. AND SUBSIDIARIESNOTES TO CONSOLIDATED FINANCIAL STATEMENTS
NOTE C — INVESTMENT SECURITIES (Continued)
F-14

NOTE D — INVENTORIES
Inventories consist of the following:
September 25,2010
September 26,2009
(in thousands)
Finished goods . . . . . . . . . . . . . . . . . . . . . . . . . . . . . . . . . . . . . . . . . . . . . . . . . . . . . . . . . . . . . . $22,171 $19,913Raw materials . . . . . . . . . . . . . . . . . . . . . . . . . . . . . . . . . . . . . . . . . . . . . . . . . . . . . . . . . . . . . . 8,702 8,060Packaging materials . . . . . . . . . . . . . . . . . . . . . . . . . . . . . . . . . . . . . . . . . . . . . . . . . . . . . . . . . 4,727 5,141Equipment parts and other . . . . . . . . . . . . . . . . . . . . . . . . . . . . . . . . . . . . . . . . . . . . . . . . . . 15,030 12,890
$50,630 $46,004
Inventory is presented net of an allowance for obsolescence of $4,189,000 and $4,209,000 as of fiscal yearends 2010 and 2009, respectively.
NOTE E — PROPERTY, PLANT AND EQUIPMENT
Property, plant and equipment consist of the following:
September 25,2010
September 26,2009
EstimatedUseful Lives
(in thousands)
Land . . . . . . . . . . . . . . . . . . . . . . . . . . . . . . . . . . . . . . . . . . . . . . . . . . . . . . . . . . . . $ 2,016 $ 1,416 —Buildings . . . . . . . . . . . . . . . . . . . . . . . . . . . . . . . . . . . . . . . . . . . . . . . . . . . . . . . 13,266 8,672 15–39.5 yearsPlant machinery and equipment . . . . . . . . . . . . . . . . . . . . . . . . . . . . . . . . . 144,697 133,758 5–20 yearsMarketing equipment . . . . . . . . . . . . . . . . . . . . . . . . . . . . . . . . . . . . . . . . . . . 214,545 202,708 5–7 yearsTransportation equipment . . . . . . . . . . . . . . . . . . . . . . . . . . . . . . . . . . . . . . . 3,785 2,733 5 yearsOffice equipment . . . . . . . . . . . . . . . . . . . . . . . . . . . . . . . . . . . . . . . . . . . . . . . 12,690 11,461 3–5 yearsImprovements . . . . . . . . . . . . . . . . . . . . . . . . . . . . . . . . . . . . . . . . . . . . . . . . . . . 19,590 18,454 5–20 yearsConstruction in progress . . . . . . . . . . . . . . . . . . . . . . . . . . . . . . . . . . . . . . . . 3,814 3,954 —
$414,403 $383,156
NOTE F — GOODWILL AND INTANGIBLE ASSETS
Our four reporting units, which are also reportable segments, are Food Service, Retail Supermarket, TheRestaurant Group and Frozen Beverages.
The carrying amount of acquired intangible assets for the reportable segments are as follows:
September 25, 2010 September 26, 2009
GrossCarryingAmount
AccumulatedAmortization
GrossCarryingAmount
AccumulatedAmortization
(in thousands)
Food ServiceIndefinite lived intangible assets
Trade Names . . . . . . . . . . . . . . . . . . . . . . . . . . . . . . . . . . . . . . . . . . . $12,204 $ — $ 8,180 $ —
Amortized intangible assetsNon compete agreements . . . . . . . . . . . . . . . . . . . . . . . . . . . . . . . 470 351 435 282Customer relationships . . . . . . . . . . . . . . . . . . . . . . . . . . . . . . . . . 40,024 15,160 33,287 11,526Licenses and rights . . . . . . . . . . . . . . . . . . . . . . . . . . . . . . . . . . . . . 3,606 2,287 3,606 2,061
$56,304 $17,798 $45,508 $13,869
J & J SNACK FOODS CORP. AND SUBSIDIARIESNOTES TO CONSOLIDATED FINANCIAL STATEMENTS
F-15

September 25, 2010 September 26, 2009
GrossCarryingAmount
AccumulatedAmortization
GrossCarryingAmount
AccumulatedAmortization
(in thousands)
Retail SupermarketIndefinite lived intangible assets
Trade Names . . . . . . . . . . . . . . . . . . . . . . . . . . . . . . . . . . . . . . . . . . . $ 2,731 $ — $ 2,731 $ —
The Restaurant GroupAmortized intangible assets
Licenses and rights . . . . . . . . . . . . . . . . . . . . . . . . . . . . . . . . . . . . . $ — $ — $ — $ —
Frozen BeveragesIndefinite lived intangible assets
Trade Names . . . . . . . . . . . . . . . . . . . . . . . . . . . . . . . . . . . . . . . . . . . $ 9,315 $ — $ 9,315 $ —
Amortized intangible assetsNon compete agreements . . . . . . . . . . . . . . . . . . . . . . . . . . . . . . . 198 165 148 141Customer relationships . . . . . . . . . . . . . . . . . . . . . . . . . . . . . . . . . 6,478 2,876 6,478 2,212Licenses and rights . . . . . . . . . . . . . . . . . . . . . . . . . . . . . . . . . . . . . $ 1,601 $ 504 $ 1,601 $ 434
$17,592 $3,545 $17,542 $2,787
The gross carrying amount of intangible assets is determined by applying a discounted cash flow model tothe future sales and earnings associated with each intangible asset or is set by contract cost. The amortization periodused for definite lived intangible assets is set by contract period or by the period over which the bulk of the discountedcash flow is expected to be generated. We currently believe that we will receive the benefit from the use of thetrade names classified as indefinite lived intangible assets indefinitely and they are therefore not amortized.
Licenses and rights are being amortized by the straight-line method over periods ranging from 3 to 20 yearsand amortization expense is reflected throughout operating expenses.
Intangible assets of $10,796,000 were acquired in the food service segment in the California Churrosacquisition in fiscal year 2010.
Aggregate amortization expense of intangible assets for the fiscal years 2010, 2009 and 2008 was $4,687,000,$4,508,000 and $4,700,000.
Estimated amortization expense for the next five fiscal years is approximately $4,800,000 in 2011, $4,400,000in 2012, 2013 and 2014 and $4,300,000 in 2015. The weighted average amortization period of the intangible assetsis 10.1 years.
Goodwill
The carrying amounts of goodwill for the reportable segments are as follows:
FoodService
RetailSupermarkets
RestaurantGroup
FrozenBeverages Total
(in thousands)
Balance atSeptember 25, 2010 . . . . . . . . . . . . . . . . . . . . . $33,744 $— $386 $35,940 $70,070
Balance atSeptember 26, 2009 . . . . . . . . . . . . . . . . . . . . . $23,988 $— $386 $35,940 $60,314
J & J SNACK FOODS CORP. AND SUBSIDIARIESNOTES TO CONSOLIDATED FINANCIAL STATEMENTS
NOTE F — GOODWILL AND INTANGIBLE ASSETS (Continued)
F-16

The carrying value of goodwill is determined based on the excess of the purchase price of acquisitions overthe estimated fair value of tangible and intangible net assets. Goodwill is not amortized but is evaluated annuallyby management for impairment. Our analysis is based on a combination of the income approach, which estimatesthe fair value based on future discounted cash flows, and the market approach, which estimates the fair value basedon comparable market prices. Under the income approach the Company used a discounted cash flow which requiresLevel 3 inputs such as: annual growth rates, discount rates based upon the weighted average cost of capital andterminal values based upon our stock market multiples. There were no impairment charges in 2010, 2009 or 2008.
Goodwill of $9,756,000 was acquired in the food service segment in the California Churros acquisition in fiscalyear 2010.
NOTE G — LONG-TERM DEBT
In December 2006, we entered into an amended and restated loan agreement with our existing banks whichprovides for up to a $50,000,000 revolving credit facility repayable in December 2011, with the availability ofrepayments without penalty. The agreement contains restrictive covenants and requires commitment fees inaccordance with standard banking practice. As of September 25, 2010 and September 26, 2009, there were nooutstanding balances under the facility.
NOTE H — OBLIGATIONS UNDER CAPITAL LEASES
Obligations under capital leases consist of the following:
September 25,2010
September 26,2009
(in thousands)
Capital lease obligations, with interest at 5.8%, payable in monthlyinstallments of $14,625, through May 2014 . . . . . . . . . . . . . . . . . . . . . . . . . . . . . . . $578 $ —
Capital lease obligations, with interest at 2.6%, payable in monthlyinstallments of $8,700, through August 2013 . . . . . . . . . . . . . . . . . . . . . . . . . . . . . 285 381
863 381Less current portion . . . . . . . . . . . . . . . . . . . . . . . . . . . . . . . . . . . . . . . . . . . . . . . . . . . . . . . . 244 96
$619 $285
NOTE I — INCOME TAXES
Income tax expense (benefit) is as follows:
Fiscal year ended
September 25,2010
September 26,2009
September 27,2008
(in thousands)
CurrentU.S. Federal . . . . . . . . . . . . . . . . . . . . . . . . . . . . . . . . . . . . . . . . . . . . . . . . . . $21,020 $18,574 $11,417Foreign . . . . . . . . . . . . . . . . . . . . . . . . . . . . . . . . . . . . . . . . . . . . . . . . . . . . . . . 970 706 844State . . . . . . . . . . . . . . . . . . . . . . . . . . . . . . . . . . . . . . . . . . . . . . . . . . . . . . . . . . 4,484 3,744 2,270
26,474 23,024 14,531
J & J SNACK FOODS CORP. AND SUBSIDIARIESNOTES TO CONSOLIDATED FINANCIAL STATEMENTS
NOTE F — GOODWILL AND INTANGIBLE ASSETS (Continued)
F-17

Fiscal year ended
September 25,2010
September 26,2009
September 27,2008
DeferredU.S. Federal . . . . . . . . . . . . . . . . . . . . . . . . . . . . . . . . . . . . . . . . . . . . . . . . . . $ 2,692 $ 3,106 $ 2,983Foreign . . . . . . . . . . . . . . . . . . . . . . . . . . . . . . . . . . . . . . . . . . . . . . . . . . . . . . . (48) 109 (168)State . . . . . . . . . . . . . . . . . . . . . . . . . . . . . . . . . . . . . . . . . . . . . . . . . . . . . . . . . . 570 658 631
3,214 3,873 3,446
$29,688 $26,897 $17,977
The provisions for income taxes differ from the amounts computed by applying the statutory federal incometax rate of approximately 35% to earnings before income taxes for the following reasons:
Fiscal year ended
September 25,2010
September 26,2009
September 27,2008
(in thousands)
Income taxes at statutory rates . . . . . . . . . . . . . . . . . . . . . . . . . . . . . . . . . . $27,334 $23,873 $16,059Increase (decrease) in taxes resulting from:
State income taxes, net of federal income tax benefit . . . . . . . . 3,403 2,958 1,918Domestic production activities deduction . . . . . . . . . . . . . . . . . . . . . (850) (400) (450)Other, net . . . . . . . . . . . . . . . . . . . . . . . . . . . . . . . . . . . . . . . . . . . . . . . . . . . . (199) 466 450
$29,688 $26,897 $17,977
Deferred tax assets and liabilities consist of the following:
September 25,2010
September 26,2009
(in thousands)
Deferred tax assetsVacation accrual . . . . . . . . . . . . . . . . . . . . . . . . . . . . . . . . . . . . . . . . . . . . . . . . . . . . . . . . . . $ 1,334 $ 1,233Insurance accrual . . . . . . . . . . . . . . . . . . . . . . . . . . . . . . . . . . . . . . . . . . . . . . . . . . . . . . . . . 3,098 2,943Deferred income . . . . . . . . . . . . . . . . . . . . . . . . . . . . . . . . . . . . . . . . . . . . . . . . . . . . . . . . . 60 67Allowances . . . . . . . . . . . . . . . . . . . . . . . . . . . . . . . . . . . . . . . . . . . . . . . . . . . . . . . . . . . . . . . 1,881 1,902Inventory capitalization . . . . . . . . . . . . . . . . . . . . . . . . . . . . . . . . . . . . . . . . . . . . . . . . . . . 573 499Share-based compensation . . . . . . . . . . . . . . . . . . . . . . . . . . . . . . . . . . . . . . . . . . . . . . . . 1,209 1,113Other, net . . . . . . . . . . . . . . . . . . . . . . . . . . . . . . . . . . . . . . . . . . . . . . . . . . . . . . . . . . . . . . . . 56 65
8,211 7,822
Deferred tax liabilitiesAmortization of goodwill and other intangible assets . . . . . . . . . . . . . . . . . . . . . 14,885 13,388Depreciation of property and equipment . . . . . . . . . . . . . . . . . . . . . . . . . . . . . . . . . . 19,907 17,793Other, net . . . . . . . . . . . . . . . . . . . . . . . . . . . . . . . . . . . . . . . . . . . . . . . . . . . . . . . . . . . . . . . . 7 15
34,799 31,196
$26,588 $23,374
J & J SNACK FOODS CORP. AND SUBSIDIARIESNOTES TO CONSOLIDATED FINANCIAL STATEMENTS
NOTE I — INCOME TAXES (Continued)
F-18
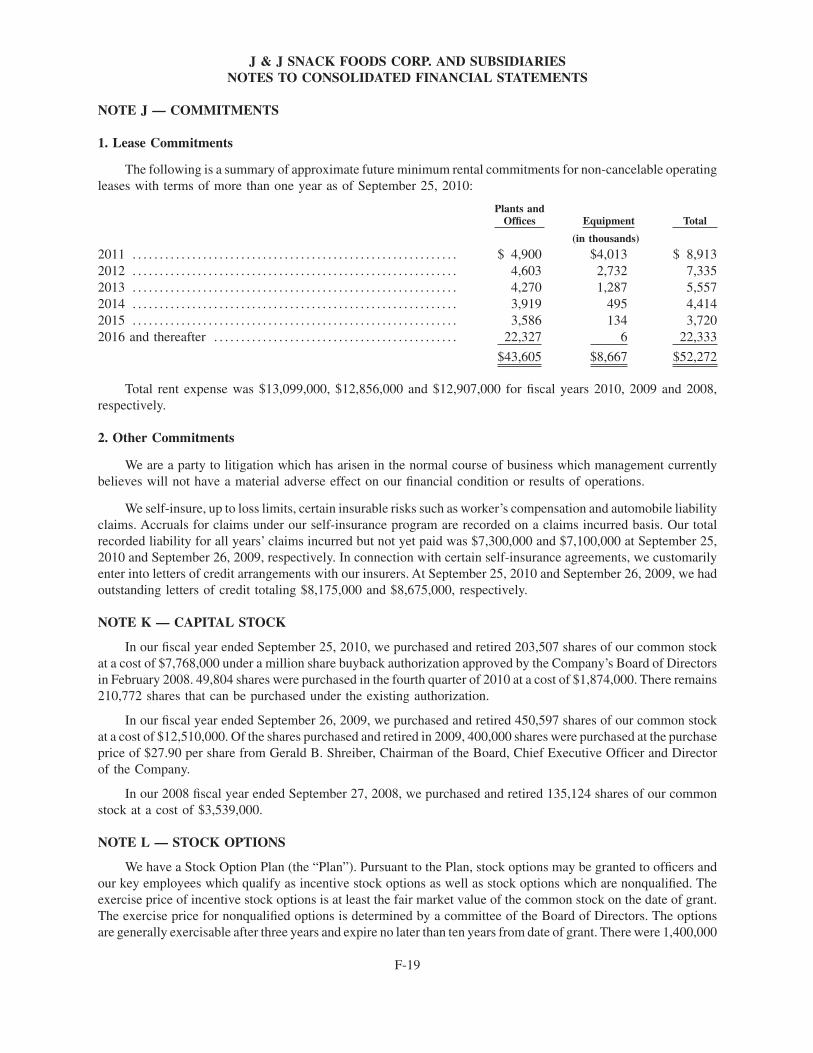
NOTE J — COMMITMENTS
1. Lease Commitments
The following is a summary of approximate future minimum rental commitments for non-cancelable operatingleases with terms of more than one year as of September 25, 2010:
Plants andOffices Equipment Total
(in thousands)
2011 . . . . . . . . . . . . . . . . . . . . . . . . . . . . . . . . . . . . . . . . . . . . . . . . . . . . . . . . . . . . $ 4,900 $4,013 $ 8,9132012 . . . . . . . . . . . . . . . . . . . . . . . . . . . . . . . . . . . . . . . . . . . . . . . . . . . . . . . . . . . . 4,603 2,732 7,3352013 . . . . . . . . . . . . . . . . . . . . . . . . . . . . . . . . . . . . . . . . . . . . . . . . . . . . . . . . . . . . 4,270 1,287 5,5572014 . . . . . . . . . . . . . . . . . . . . . . . . . . . . . . . . . . . . . . . . . . . . . . . . . . . . . . . . . . . . 3,919 495 4,4142015 . . . . . . . . . . . . . . . . . . . . . . . . . . . . . . . . . . . . . . . . . . . . . . . . . . . . . . . . . . . . 3,586 134 3,7202016 and thereafter . . . . . . . . . . . . . . . . . . . . . . . . . . . . . . . . . . . . . . . . . . . . . 22,327 6 22,333
$43,605 $8,667 $52,272
Total rent expense was $13,099,000, $12,856,000 and $12,907,000 for fiscal years 2010, 2009 and 2008,respectively.
2. Other Commitments
We are a party to litigation which has arisen in the normal course of business which management currentlybelieves will not have a material adverse effect on our financial condition or results of operations.
We self-insure, up to loss limits, certain insurable risks such as worker’s compensation and automobile liabilityclaims. Accruals for claims under our self-insurance program are recorded on a claims incurred basis. Our totalrecorded liability for all years’ claims incurred but not yet paid was $7,300,000 and $7,100,000 at September 25,2010 and September 26, 2009, respectively. In connection with certain self-insurance agreements, we customarilyenter into letters of credit arrangements with our insurers. At September 25, 2010 and September 26, 2009, we hadoutstanding letters of credit totaling $8,175,000 and $8,675,000, respectively.
NOTE K — CAPITAL STOCK
In our fiscal year ended September 25, 2010, we purchased and retired 203,507 shares of our common stockat a cost of $7,768,000 under a million share buyback authorization approved by the Company’s Board of Directorsin February 2008. 49,804 shares were purchased in the fourth quarter of 2010 at a cost of $1,874,000. There remains210,772 shares that can be purchased under the existing authorization.
In our fiscal year ended September 26, 2009, we purchased and retired 450,597 shares of our common stockat a cost of $12,510,000. Of the shares purchased and retired in 2009, 400,000 shares were purchased at the purchaseprice of $27.90 per share from Gerald B. Shreiber, Chairman of the Board, Chief Executive Officer and Directorof the Company.
In our 2008 fiscal year ended September 27, 2008, we purchased and retired 135,124 shares of our commonstock at a cost of $3,539,000.
NOTE L — STOCK OPTIONS
We have a Stock Option Plan (the “Plan”). Pursuant to the Plan, stock options may be granted to officers andour key employees which qualify as incentive stock options as well as stock options which are nonqualified. Theexercise price of incentive stock options is at least the fair market value of the common stock on the date of grant.The exercise price for nonqualified options is determined by a committee of the Board of Directors. The optionsare generally exercisable after three years and expire no later than ten years from date of grant. There were 1,400,000
J & J SNACK FOODS CORP. AND SUBSIDIARIESNOTES TO CONSOLIDATED FINANCIAL STATEMENTS
F-19

shares reserved under the Plan; options for 610,000 shares remain unissued as of September 25, 2010. There areoptions that were issued under an option plan that has since expired that are still outstanding.
We have an Employee Stock Purchase Plan (“ESPP”) whereby employees purchase stock by makingcontributions through payroll deductions for six month periods. The purchase price of the stock is 85% of the lowerof the market price of the stock at the beginning of the six-month period or the end of the six-month period. Infiscal years 2010, 2009 and 2008 employees purchased 22,143, 25,803 and 31,366 shares at average purchase pricesof $32.70, $26.63 and $24.93, respectively. ESPP expense of $184,000, $237,000 and $137,000 was recognizedfor fiscal years 2010, 2000 and 2008, respectively.
A summary of the status of our stock option plans as of fiscal years 2010, 2009 and 2008 and the changesduring the years ended on those dates is represented below:
Incentive Stock Options Nonqualified Stock Options
StockOptions
Outstanding
Weighted-AverageExercise
Price
StockOptions
Outstanding
Weighted-AverageExercise
Price
Balance, September 30, 2007 . . . . . . . . . . . . . . . . . . . . . . . 673,405 $21.87 459,354 $16.12Granted . . . . . . . . . . . . . . . . . . . . . . . . . . . . . . . . . . . . . . . . . . 96,345 33.22 20,000 34.17Exercised . . . . . . . . . . . . . . . . . . . . . . . . . . . . . . . . . . . . . . . . . (111,768) 16.57 (77,000) 9.66Cancelled . . . . . . . . . . . . . . . . . . . . . . . . . . . . . . . . . . . . . . . . . (44,150) 26.36 (5,000) 38.54
Balance, September 27, 2008 . . . . . . . . . . . . . . . . . . . . . . . 613,832 24.29 397,354 18.00Granted . . . . . . . . . . . . . . . . . . . . . . . . . . . . . . . . . . . . . . . . . . 4,500 32.13 — —Exercised . . . . . . . . . . . . . . . . . . . . . . . . . . . . . . . . . . . . . . . . . (169,388) 18.73 (71,000) 10.70Cancelled . . . . . . . . . . . . . . . . . . . . . . . . . . . . . . . . . . . . . . . . . (20,000) 26.79 (20,000) 20.02
Balance, September 26, 2009 . . . . . . . . . . . . . . . . . . . . . . . 428,944 26.45 306,354 19.55Granted . . . . . . . . . . . . . . . . . . . . . . . . . . . . . . . . . . . . . . . . . . 101,330 36.77 20,000 41.75Exercised . . . . . . . . . . . . . . . . . . . . . . . . . . . . . . . . . . . . . . . . . (92,760) 16.40 (72,354) 10.12Cancelled . . . . . . . . . . . . . . . . . . . . . . . . . . . . . . . . . . . . . . . . . (19,505) 33.47 (10,000) 38.81
Balance, September 25, 2010 . . . . . . . . . . . . . . . . . . . . . 418,009 $30.86 244,000 $23.38Exercisable Options, September 25, 2010 . . . . . . . . 235,089 184,000
The weighted-average fair value of incentive options granted during fiscal years ended September 25, 2010,September 26, 2009 and September 27, 2008 was $9.12, $7.13 and $7.99, respectively. The weighted-average fairvalue of non-qualified stock options granted during the fiscal years ended September 25, 2010 and September 27,2008 was $17.33 and $15.21, respectively. There were no non-qualified options granted during the fiscal year endedSeptember 26, 2009. The total intrinsic value of stock options exercised was $5.1 million, $5.4 million and $3.2million in fiscal years 2010, 2009 and 2008, respectively.
J & J SNACK FOODS CORP. AND SUBSIDIARIESNOTES TO CONSOLIDATED FINANCIAL STATEMENTS
NOTE L — STOCK OPTIONS (Continued)
F-20

The following table summarizes information about incentive stock options outstanding at September 25, 2010:
Options Outstanding Options Exercisable
Range ofExercise Prices
NumberOutstanding
atSeptember 25,
2010
Weighted-Average
RemainingContractual
Life
WeightedAverageExercise
Price
NumberExercisable
atSeptember 25,
2010
Weighted-AverageExercise
Price
$10.60 – $10.60 82,632 .9 years $10.60 82,632 $10.60$27.45 – $41.06 245,477 2.5 years $33.74 62,557 $29.94$41.50 – $41.60 89,900 1.2 years $41.60 89,900 $41.60
418,009 235,089
The following table summarizes information about nonqualified stock options outstanding at September 25,2010:
Options Outstanding Options Exercisable
Range ofExercise Prices
NumberOutstanding
atSeptember 25,
2010
Weighted-Average
RemainingContractual
Life
WeightedAverageExercise
Price
NumberExercisable
atSeptember 25,
2010
Weighted-AverageExercise
Price
$10.30 – $10.30 62,000 .6 years $10.30 62,000 $10.30$19.77 – $20.43 82,000 2.2 years $19.93 82,000 $19.93$29.78 – $41.75 100,000 7.2 years $34.32 40,000 $30.44
244,000 184,000
NOTE M — 401(k) PROFIT-SHARING PLAN
We maintain a 401(k) profit-sharing plan for our employees. Under this plan, we may make discretionary profit-sharing and matching 401(k) contributions. Contributions of $1,436,000, $1,354,000 and $1,411,000 were madein fiscal years 2010, 2009 and 2008, respectively.
NOTE N — CASH FLOW INFORMATION
The following is supplemental cash flow information:
Fiscal Year Ended
September 25,2010
September 26,2009
September 27,2008
(in thousands)
Cash paid for:Interest . . . . . . . . . . . . . . . . . . . . . . . . . . . . . . . . . . . . . . . . . . . . . . . . . . . . . . . $ 76 $ 14 $ 21Income taxes . . . . . . . . . . . . . . . . . . . . . . . . . . . . . . . . . . . . . . . . . . . . . . . . . 31,379 21,345 13,896
Non cash items:Capital leases . . . . . . . . . . . . . . . . . . . . . . . . . . . . . . . . . . . . . . . . . . . . . . . . . $ 625 $ — $ —
NOTE O — SEGMENT REPORTING
We principally sell our products to the food service and retail supermarket industries. We also distribute ourproducts directly to the consumer through our chain of retail stores referred to as The Restaurant Group. Sales andresults of our frozen beverages business are monitored separately from the balance of our food service businessand restaurant group because of different distribution and capital requirements. We maintain separate and discretefinancial information for the four operating segments mentioned above which is available to our Chief Operating
J & J SNACK FOODS CORP. AND SUBSIDIARIESNOTES TO CONSOLIDATED FINANCIAL STATEMENTS
NOTE L — STOCK OPTIONS (Continued)
F-21

NOTE O — SEGMENT REPORTING (Continued)
Decision Makers. We have applied no aggregate criteria to any of these operating segments in order to determinereportable segments. Our four reportable segments are Food Service, Retail Supermarkets, The Restaurant Groupand Frozen Beverages. All inter-segment net sales and expenses have been eliminated in computing net sales andoperating income (loss). These segments are described below.
Food Service
The primary products sold by the food service segment are soft pretzels, frozen juice treats and desserts, churrosand baked goods. Our customers in the food service segment include snack bars and food stands in chain, departmentand discount stores; malls and shopping centers; fast food outlets; stadiums and sports arenas; leisure and themeparks; convenience stores; movie theatres; warehouse club stores; schools, colleges and other institutions. Withinthe food service channel, our products are purchased by the consumer primarily for consumption at the point-of-sale.
Retail Supermarkets
The primary products sold by the retail supermarket segment are soft pretzel products — includingSUPERPRETZEL, frozen juice treats and desserts including LUIGI’S Real Italian Ice, MINUTE MAID Juice Barsand Soft Frozen Lemonade, WHOLE FRUIT frozen fruit bars, WHOLE FRUIT Sorbet, ICEE Squeeze-Up Tubesand TIO PEPE’S Churros. Within the retail supermarket channel, our frozen and prepackaged products arepurchased by the consumer for consumption at home.
The Restaurant Group
We sell direct to the consumer through our Restaurant Group, which operates two BAVARIAN PRETZELBAKERY retail stores.
Frozen Beverages
We sell frozen beverages and related products and beverage machines to the food service channel, and ourRestaurant Group, primarily under the names ICEE, SLUSH PUPPIE, PARROT ICE and ARCTIC BLAST in theUnited States, Mexico and Canada. We also provide repair and maintenance service to customers for customers’owned equipment.
The Chief Operating Decision Maker for Food Service, Retail Supermarkets and The Restaurant Group andthe Chief Operating Decision Maker for Frozen Beverages monthly review detailed operating income statementsand sales reports in order to assess performance and allocate resources to each individual segment. Sales isconsidered to be the one and only key variable monitored by the Chief Operating Decision Makers and managementwhen determining each segment’s and the company’s financial condition and operating performance. In addition,the Chief Operating Decision Makers review and evaluate depreciation, capital spending and assets of each segmenton a quarterly basis to monitor cash flow and asset needs of each segment. Information regarding the operationsin these four reportable segments is as follows:
Fiscal year ended
September 25,2010
September 26,2009
September 27,2008
(in thousands)
Sales to External Customers:Food Service
Soft pretzels . . . . . . . . . . . . . . . . . . . . . . . . . . . . . . . . . . . . . . . . . . . . . . . $100,694 $ 99,471 $ 99,784Frozen juices and ices . . . . . . . . . . . . . . . . . . . . . . . . . . . . . . . . . . . . . 47,273 50,272 51,206Churros . . . . . . . . . . . . . . . . . . . . . . . . . . . . . . . . . . . . . . . . . . . . . . . . . . . . 31,732 29,404 25,286Bakery . . . . . . . . . . . . . . . . . . . . . . . . . . . . . . . . . . . . . . . . . . . . . . . . . . . . . 234,032 229,371 217,398Other . . . . . . . . . . . . . . . . . . . . . . . . . . . . . . . . . . . . . . . . . . . . . . . . . . . . . . 23,228 9,235 6,520
$436,959 $417,753 $400,194
J & J SNACK FOODS CORP. AND SUBSIDIARIESNOTES TO CONSOLIDATED FINANCIAL STATEMENTS
F-22

NOTE O — SEGMENT REPORTING (Continued)Fiscal year ended
September 25,2010
September 26,2009
September 27,2008
(in thousands)
Retail SupermarketSoft pretzels . . . . . . . . . . . . . . . . . . . . . . . . . . . . . . . . . . . . . . . . . . . . . . . $ 30,463 $ 30,506 $ 27,559Frozen juices and ices . . . . . . . . . . . . . . . . . . . . . . . . . . . . . . . . . . . . . 48,288 37,819 31,742Coupon redemption . . . . . . . . . . . . . . . . . . . . . . . . . . . . . . . . . . . . . . . . (3,399) (3,753) (2,722)Other . . . . . . . . . . . . . . . . . . . . . . . . . . . . . . . . . . . . . . . . . . . . . . . . . . . . . . 767 586 533
$ 76,119 $ 65,158 $ 57,112
The Restaurant Group . . . . . . . . . . . . . . . . . . . . . . . . . . . . . . . . . . . . . . . . $ 847 $ 1,257 $ 1,635
Frozen BeveragesBeverages . . . . . . . . . . . . . . . . . . . . . . . . . . . . . . . . . . . . . . . . . . . . . . . . . . $128,125 $112,983 $113,903Repair and maintenance service . . . . . . . . . . . . . . . . . . . . . . . . . . . . 40,410 42,013 38,803Machine sales . . . . . . . . . . . . . . . . . . . . . . . . . . . . . . . . . . . . . . . . . . . . . . 11,964 11,729 14,794Other . . . . . . . . . . . . . . . . . . . . . . . . . . . . . . . . . . . . . . . . . . . . . . . . . . . . . . 2,279 2,154 2,918
$182,778 $168,879 $170,418
Consolidated Sales . . . . . . . . . . . . . . . . . . . . . . . . . . . . . . . . . . . . . . . . . . . $696,703 $653,047 $629,359
Depreciation and Amortization:Food Service . . . . . . . . . . . . . . . . . . . . . . . . . . . . . . . . . . . . . . . . . . . . . . . . . $ 17,221 $ 16,530 $ 16,655Retail Supermarket . . . . . . . . . . . . . . . . . . . . . . . . . . . . . . . . . . . . . . . . . . . — — —The Restaurant Group . . . . . . . . . . . . . . . . . . . . . . . . . . . . . . . . . . . . . . . . 31 33 54Frozen Beverages . . . . . . . . . . . . . . . . . . . . . . . . . . . . . . . . . . . . . . . . . . . . 12,600 11,190 10,761
$ 29,852 $ 27,753 $ 27,470
Operating Income(Loss):Food Service . . . . . . . . . . . . . . . . . . . . . . . . . . . . . . . . . . . . . . . . . . . . . . . . . $ 50,255 $ 45,024 $ 24,784Retail Supermarket . . . . . . . . . . . . . . . . . . . . . . . . . . . . . . . . . . . . . . . . . . . 11,281 7,442 4,665The Restaurant Group . . . . . . . . . . . . . . . . . . . . . . . . . . . . . . . . . . . . . . . . (35) (64) (140)Frozen Beverages . . . . . . . . . . . . . . . . . . . . . . . . . . . . . . . . . . . . . . . . . . . . 15,661 14,536 14,027
$ 77,162 $ 66,938 $ 43,336
Capital Expenditures:Food Service . . . . . . . . . . . . . . . . . . . . . . . . . . . . . . . . . . . . . . . . . . . . . . . . . $ 18,392 $ 14,979 $ 11,898Retail Supermarket . . . . . . . . . . . . . . . . . . . . . . . . . . . . . . . . . . . . . . . . . . . — — —The Restaurant Group . . . . . . . . . . . . . . . . . . . . . . . . . . . . . . . . . . . . . . . . — — —Frozen Beverages . . . . . . . . . . . . . . . . . . . . . . . . . . . . . . . . . . . . . . . . . . . . 15,139 12,211 10,883
$ 33,531 $ 27,190 $ 22,781
Assets:Food Service . . . . . . . . . . . . . . . . . . . . . . . . . . . . . . . . . . . . . . . . . . . . . . . . . $343,513 $309,988 $277,481Retail Supermarket . . . . . . . . . . . . . . . . . . . . . . . . . . . . . . . . . . . . . . . . . . . — — —The Restaurant Group . . . . . . . . . . . . . . . . . . . . . . . . . . . . . . . . . . . . . . . . 503 557 629Frozen Beverages . . . . . . . . . . . . . . . . . . . . . . . . . . . . . . . . . . . . . . . . . . . . 139,978 129,282 130,298
$483,994 $439,827 $408,408
J & J SNACK FOODS CORP. AND SUBSIDIARIESNOTES TO CONSOLIDATED FINANCIAL STATEMENTS
F-23

NOTE P — QUARTERLY FINANCIAL DATA (UNAUDITED)
Fiscal Year Ended September 25, 2010
Net SalesGrossProfit
NetEarnings
Net EarningsPer
DilutedShare(1)
(in thousands, except per share information)
1st Quarter . . . . . . . . . . . . . . . . . . . . . . . . . . . . . . . . . . . . $149,102 $ 46,019 $ 7,091 $ .382nd Quarter . . . . . . . . . . . . . . . . . . . . . . . . . . . . . . . . . . . 157,361 49,797 9,000 .483rd Quarter . . . . . . . . . . . . . . . . . . . . . . . . . . . . . . . . . . . . 189,729 65,031 15,861 .854th Quarter . . . . . . . . . . . . . . . . . . . . . . . . . . . . . . . . . . . . 200,511 66,933 16,457 .88
Total . . . . . . . . . . . . . . . . . . . . . . . . . . . . . . . . . . . . . . . . . . $696,703 $227,780 $48,409 $2.59
Fiscal Year Ended September 26, 2009
Net SalesGrossProfit
NetEarnings
Net EarningsPer
DilutedShare(1)
(in thousands, except per share information)
1st Quarter . . . . . . . . . . . . . . . . . . . . . . . . . . . . . . . . . . . . $141,142 $ 40,682 $ 4,319 $ .232nd Quarter . . . . . . . . . . . . . . . . . . . . . . . . . . . . . . . . . . . 149,352 45,377 7,244 .393rd Quarter . . . . . . . . . . . . . . . . . . . . . . . . . . . . . . . . . . . . 179,761 61,034 14,929 .804th Quarter . . . . . . . . . . . . . . . . . . . . . . . . . . . . . . . . . . . . 182,792 61,751 14,820 .79
Total . . . . . . . . . . . . . . . . . . . . . . . . . . . . . . . . . . . . . . . . . . $653,047 $208,844 $41,312 $2.21
(1) Total of quarterly amounts do not necessarily agree to the annual report amounts due to separate quarterly calculations of weighted averageshares outstanding
J & J SNACK FOODS CORP. AND SUBSIDIARIESNOTES TO CONSOLIDATED FINANCIAL STATEMENTS
F-24
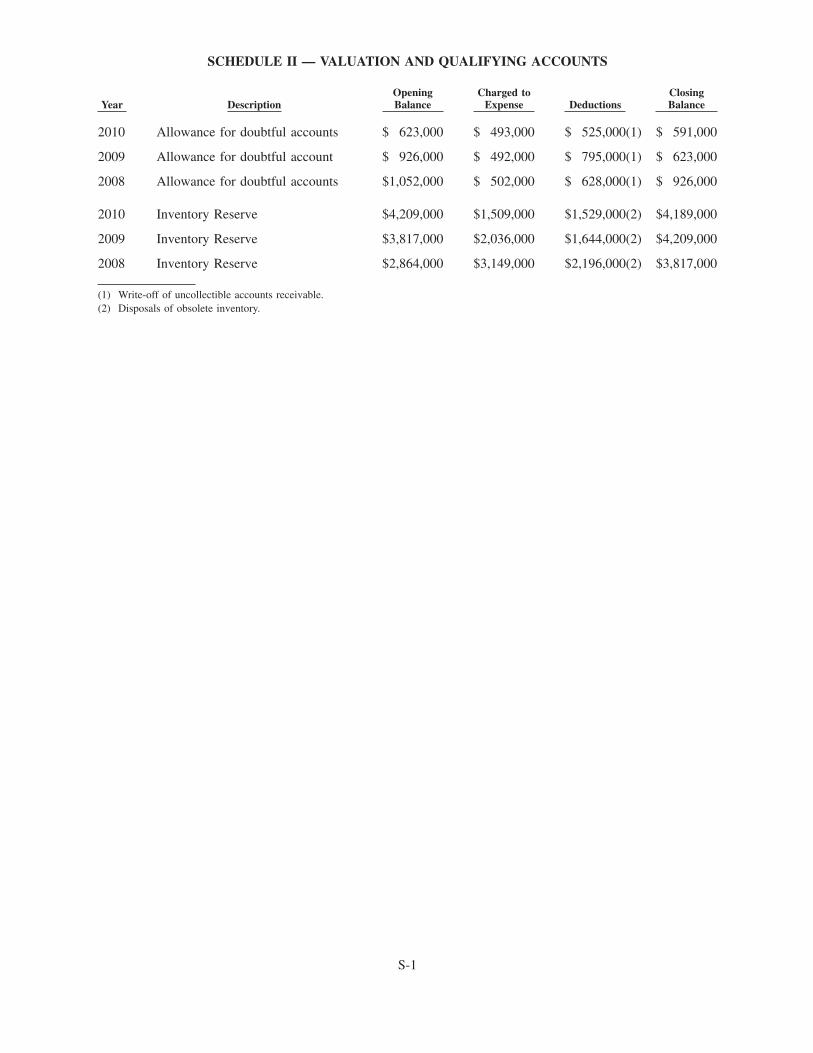
SCHEDULE II — VALUATION AND QUALIFYING ACCOUNTS
Year DescriptionOpeningBalance
Charged toExpense Deductions
ClosingBalance
2010 Allowance for doubtful accounts $ 623,000 $ 493,000 $ 525,000(1) $ 591,000
2009 Allowance for doubtful account $ 926,000 $ 492,000 $ 795,000(1) $ 623,000
2008 Allowance for doubtful accounts $1,052,000 $ 502,000 $ 628,000(1) $ 926,000
2010 Inventory Reserve $4,209,000 $1,509,000 $1,529,000(2) $4,189,000
2009 Inventory Reserve $3,817,000 $2,036,000 $1,644,000(2) $4,209,000
2008 Inventory Reserve $2,864,000 $3,149,000 $2,196,000(2) $3,817,000
(1) Write-off of uncollectible accounts receivable.(2) Disposals of obsolete inventory.
S-1