Embed Size (px)
Citation preview

VALUE ENGINEERING METHODOLOGY TO IMPROVE BUILDING SUSTAINABILITY OUTCOMES
By
JOEL OCHIENG WAO
A DISSERTATION PRESENTED TO THE GRADUATE SCHOOL OF THE UNIVERSITY OF FLORIDA IN PARTIAL FULFILLMENT
OF THE REQUIREMENTS FOR THE DEGREE OF DOCTOR OF PHILOSOPHY
UNIVERSITY OF FLORIDA
2014

© 2014 Joel Ochieng Wao

To my mama, family and friends who have supported me in this journey thus far

4
ACKNOWLEDGMENTS
I thank my committee members Drs. Robert Ries, Ian Flood, Charles Kibert, and
Randy Chow for their unrelenting guide throughout the PhD pursuit. Special thanks go
to my committee chair Dr. Ries, who worked with me very closely, and co-chair Dr.
Flood for their thoughtful direction during the inception and trudging along with me to
completion. I also thank the spring 2013 value engineering class for their excellent work
in the value engineering course project reports which forms part of data source for my
research. Special appreciation goes to the sustainability experts, Drs. Charles Kibert,
Abdol Chini, Ravi Srinivasan, and James Sullivan for their in-depth evaluation of the
students’ value engineering reports. Also, my heartfelt appreciation goes to the value
engineering practitioners mainly from SAVE International, James Guyette, Richard
Lambert, Ashley Carson, Dr. Walid Shublaq, Dr. Richard Sievert, Kurt Fuber, David
Hamilton, and Maria Houle, for their invaluable contribution to my research. Special
acknowledgment goes to the M.E. Rinker, Sr. School of Construction Management and
the College of Design, Construction, and Planning personnel, Maria Gavidia, Andrew
Wehle, and Pat De Jong for their continued support without which this work would not
have been accomplished. Final appreciation goes to Farah Charles, Peter Donkor,
Hesborn Otieno, Merilin Aluoch, and Sandeep Shrivastava for their moral support right
from the inception.

5
TABLE OF CONTENTS page
ACKNOWLEDGMENTS .................................................................................................. 4
LIST OF TABLES ............................................................................................................ 9
LIST OF FIGURES ........................................................................................................ 11
LIST OF ABBREVIATIONS ........................................................................................... 12
ABSTRACT ................................................................................................................... 13
CHAPTER
1 INTRODUCTION .................................................................................................... 15
1.1 Background ....................................................................................................... 15
1.2 Problem Statement ........................................................................................... 16 1.3 Scope of this research ...................................................................................... 17 1.4 Aim, Objectives, and Significance of the Research .......................................... 18
1.5 Summary of Introduction ................................................................................... 19
2 LITERATURE REVIEW .......................................................................................... 20
2.1 Overview ........................................................................................................... 20
2.2 History of Value Engineering Methodology ....................................................... 20
2.3 Definition and Objective of Value Engineering .................................................. 22 2.4 Ideal Value Engineering Team .......................................................................... 26 2.5 Value Engineering Critical Success Factors ..................................................... 28
2.6 Reasons for Poor Value in Value Engineering .................................................. 29 2.7 Implementing Value Engineering ...................................................................... 30
2.8 Job Phases in Value Engineering Methodology ................................................ 31 2.9 Value Engineering Function Analysis System Technique (FAST) .................... 33 2.10 The Concept of Value in Value Engineering ................................................... 35
2.11 Cost, Worth, and the Cost-worth Ratio ........................................................... 37 2.12 Summary of the Value Engineering Process .................................................. 38 2.13 Value Engineering and Sustainable Building Design ...................................... 40
2.13.1 Overview ............................................................................................... 40
2.13.2 Principle of Sustainable Development and Sustainable Construction ... 41 2.13.3 Green Building Construction .................................................................. 42 2.13.4 Motivation for Building Green ................................................................ 44
2.14 Decision Making for Green Building ................................................................ 45 2.15 Decision Support System for Green Building Construction ............................. 46
2.16 Multi-Criteria Decision Methods and Sound Decision Making Approaches ..... 47 2.16.1 Overview ............................................................................................... 47
2.16.2 Definition of Terms in MCDM ................................................................ 47

6
2.16.3 Goal Programming (GP) ........................................................................ 50
2.16.4 Utility Theory (UT) ................................................................................. 52 2.16.5 Weighted Sum Method (WSM) .............................................................. 54
2.16.6 Weighted Product Method (WPM) ......................................................... 55 2.16.7 Analytical Hierarchy Process (AHP) ...................................................... 56 2.16.8 ELECTRE Method ................................................................................. 58 2.16.9 Choosing by Advantages (CBA) ............................................................ 59 2.16.10 Neuro-Linguistic Programming (NLP) .................................................. 66
2.17 Building Sustainability Rating Tools ................................................................ 73 2.17.1 Overview ............................................................................................... 73 2.17.2 Building Research Establishment Environmental Assessment
Method (BREEAM) ........................................................................................ 75 2.17.3 Comprehensive Assessment System for Built Environmental
Efficiency (CASBEE) ..................................................................................... 76 2.17.4 Green Mark ........................................................................................... 78
2.17.5 Green Globes ........................................................................................ 79
2.17.6 Green Star ............................................................................................. 80 2.17.7 Hong-Kong Building Environmental Assessment Method (HK BEAM) .. 81 2.17.8 Green Building Tool (GB Tool) .............................................................. 81
2.17.9 Sustainable Building Tool (SB Tool or SB Method) ............................... 82 2.17.10 German Sustainable Building Certification .......................................... 82
2.17.11 Leadership in Energy and Environmental Design (LEED) ................... 83 2.17.12 Comparison of Principal Building Sustainability Rating Systems ......... 87
2.18 Cost of Greening ............................................................................................. 90
2.19 Summary of Literature Review ........................................................................ 91
3 RESEARCH METHODOLOGY ............................................................................. 102
3.1 Overview ......................................................................................................... 102 3.2 Research Aim ................................................................................................. 102
3.3 Research Objectives ....................................................................................... 103 3.4 Choice of Decision Making Method and Sustainability Rating System ........... 104 3.5 Research Variables......................................................................................... 105
3.5.1 Objective Variables................................................................................ 105 3.5.2 Independent Variables ........................................................................... 105 3.5.3 Performance Variable ............................................................................ 106
3.6 Hypothesis Development ................................................................................ 107 3.7 Significance of the Research .......................................................................... 107
3.8 Limitations in the Conventional VE Relative to Sustainable Construction ....... 108
3.9 Proposed Approaches to Modify Conventional VE ......................................... 109 3.9.1 Pre-study and/or Information Phase (Determining Factors by CBA) ..... 110 3.9.2 Function Analysis Phase (Cost-Worth to Performance-Worth) .............. 110
3.9.3 Creativity Phase (Enhancing Creativity of the VE Team) ...................... 113 3.9.4 Evaluation Phase (Benefits of Incorporating CBA) ................................ 114 3.9.5 Summary of the Limitations and Modifications of Conventional VE ....... 114
3.10 Case Study Approach and Overview ............................................................ 115 3.11 Case Study Stage One ................................................................................. 116

7
3.11.1 Case Study Building Project Description ............................................. 116
3.11.2 Students Involvement in the Case Study ............................................. 118 3.12 Case Study Stage Two ................................................................................. 121
3.13 Study Stage Three ........................................................................................ 122 3.14 Data Analysis Plan ........................................................................................ 124 3.15 Summary of Research Methodology ............................................................. 125
4 RESULTS ............................................................................................................. 131
4.1 Overview ......................................................................................................... 131
4.2 Reliability of the Students Survey Data ........................................................... 131 4.3 Descriptive Statistics of Students Survey Data ............................................... 132
4.3.1 Level of Difficulty of the VE Method (Q.2) .............................................. 132 4.3.2 Level of Effectiveness the VE Method (Q.3) .......................................... 132
4.3.3 Successfulness of the VE Method (Q.5) ................................................ 133 4.3.4 Agreement with the VE Method in Improving Building Sustainability
(Q.6) ............................................................................................................ 133 4.3.5 Assessment of the Final VE Project Outcome (Q.8) .............................. 134
4.3.6 Summary of the Students Ratings Supported with Qualitative Data ...... 134 4.4 Analysis of Variance of the Students Survey Data .......................................... 137 4.5 Faculty Evaluation of Students VE Final Reports ........................................... 139
4.6 Descriptive Statistics of the Recommended Systems ..................................... 140 4.6.1 Energy and Atmosphere ........................................................................ 140
4.6.2 Materials and Resources ....................................................................... 140 4.6.3 Indoor Environmental Quality ................................................................ 141 4.6.4 Summary of the Faculty Ratings of the Systems’ Contributions to the
LEED Credits Categories and Overall Sustainability Measure .................... 141 4.7 Analysis of Variance of the Faculty Evaluations ............................................. 142
4.8 VE Practitioners Presentation and Survey Feedback ..................................... 144 4.8.1 Demographics of the VE Practitioners ................................................... 144
4.8.2 Reliability of the VE Practitioners Survey Data ...................................... 145 4.8.3 Descriptive and Logistic Regression Analysis of the Limitations of
Conventional VE and their Impact on Green Building Outcomes ................ 146
4.8.4 Descriptive Statistics of the Levels of Satisfaction with the VE Method Combinations to Improve Building Sustainability Outcomes ....................... 150
4.8.5 Summary of the VE Practitioners’ Levels of Satisfaction with VE Method Combinations to Improve Building Sustainability Outcomes .......... 151
4.8.6 Analysis of Variance of the VE Methods towards Improving Sustainability ............................................................................................... 152
5 DISCUSSION, RECOMMENDATIONS, AND CONCLUSION .............................. 162
5.1 Research Summary ........................................................................................ 162 5.2 Discussion of Findings .................................................................................... 164
5.2.1 Findings from the Survey of VE Students .............................................. 164 5.2.2 Limitations in the Findings from the Survey of VE Students .................. 167
5.2.3 Findings from the Faculty Evaluation of VE Final Reports ..................... 167

8
5.2.4 Limitations in the Findings from the Faculty Evaluation of VE Reports . 169
5.2.5 Findings from the Presentation and Survey of VE Practitioners ............ 170 5.2.6 Limitations in the Findings from the Presentation and Survey of VE
Practitioners ................................................................................................ 172 5.3 Recommendations .......................................................................................... 173 5.4 Areas for Future Research .............................................................................. 173 5.5 Conclusion ...................................................................................................... 174
APPENDIX
A STUDENTS SURVEY ADMINISTRATION AND RECOMMENDED SYSTEMS ... 177
A-1 Survey Informed Consent Form ..................................................................... 177 A-2 Survey Questionnaire to VE Students ............................................................ 178
A-3 Similar Systems Recommended by VE Students ........................................... 182
B FACULTY FORM FOR EVALUATING STUDENTS REPORTS ........................... 183
B-1 LEED Checklist for Rating Whole Building Sustainability Outcome ............... 183 B-2 LEED Checklist for Rating Recommended Building Systems ........................ 184
C VALUE ENGINEERS SURVEY ADMINISTRATION AND COMMENTS .............. 185
C-1 Survey Informed Consent Form ..................................................................... 185 C-2 Online Survey Questionnaire ......................................................................... 186
C-3 Value Engineers Comments .......................................................................... 188
LIST OF REFERENCES ............................................................................................. 190
BIOGRAPHICAL SKETCH .......................................................................................... 203

9
LIST OF TABLES
Table page 1-1 Projection of energy consumption by sector for the year 2010 – 2040
(Quadrillion, Btu). ................................................................................................ 18
2-1 Comparison of VE job plan phases as described by various standards, organizations, and researchers. ......................................................................... 96
2-2 Function analysis noun-verb connection. ........................................................... 97
2-3 Certification levels according to Green Globes. .................................................. 97
2-4 Major rating tools by country of origin. ................................................................ 97
3-1 Summary of the limitations and approaches to counter the limitations in the conventional VE method. .................................................................................. 127
3-2 Summary of research experimental design involving VE students. .................. 128
3-3 Students’ survey question levels. ..................................................................... 128
3-4 Survey questions specific to VE and green building outcome .......................... 129
4-1 Acceptable reliability estimates for a psychometric test. ................................... 153
4-2 Reliability coefficients for survey question items for evaluating the VE methods. ........................................................................................................... 153
4-3 Level of difficulty of the VE method. ................................................................. 154
4-4 Level of effectiveness of the VE method. ......................................................... 154
4-5 Successfulness of the VE method in achieving building sustainability. ............ 154
4-6 Relative agreement with the VE method in improving building sustainability outcome. ........................................................................................................... 155
4-7 Level of assessment of the final VE project outcome. ...................................... 155
4-8 Summary of the students’ average ratings of the quantitative survey items. .... 155
4-9 Summary of ANOVA results from students’ survey. ......................................... 155
4-10 Duncan's Multiple Range Test of the VE final project outcome. ....................... 156
4-11 Systems contributions towards energy and atmosphere LEED credit category. ........................................................................................................... 156

10
4-12 Systems contributions towards materials and resources LEED credit category. ........................................................................................................... 156
4-13 Systems contributions towards indoor environmental quality LEED credit category. ........................................................................................................... 157
4-14 Summary of faculty ratings of systems contributions towards the LEED credits categories and sustainability measure. ................................................. 157
4-15 Summary of ANOVA results from faculty evaluations. ...................................... 157
4-16 Duncan’s Multiple Range Test for the materials and resources LEED credit category ratings. ............................................................................................... 158
4-17 Reliability coefficients of specific question items for VE practitioners. .............. 158
4-18 Responses to the limitations in the conventional VE based on Practitioners’ industrial experiences. ...................................................................................... 158
4-19 Responses to the limitations in the conventional VE relative to negatively impacting green building outcomes. ................................................................. 159
4-20 Levels of satisfaction with the VE method combinations in improving sustainability. .................................................................................................... 160
4-21 Summary of the VE Practitioners’ average rating of their satisfaction with the VE methods in improving green building outcomes. ......................................... 160
4-22 Summary of ANOVA results of VE practitioners’ feedback on improving building sustainability. ....................................................................................... 160
4-23 Duncan’s Multiple Range Test for the sustainability objective of VE methods. . 160

11
LIST OF FIGURES
Figure page 1-1 Average projection of energy consumption by sector (Quads) ........................... 18
2-1 Communication levels of team members. ........................................................... 97
2-2 VE team, job plan, and desired outcome. ........................................................... 98
2-3 ASTM E1699-10: Value engineering study plan. ................................................ 98
2-4 Technical FAST or function logic diagram. ......................................................... 99
2-5 Cumulative worth vs cost curve showing the cumulative increase in worth from value engineering three systems. ............................................................... 99
2-6 Analytical hierarchy process structure. ............................................................. 100
2-7 Structure of the CBA model .............................................................................. 100
2-8 CBA for decisions when alternatives have unequal cost and cost is important to decision ........................................................................................................ 100
2-9 Sustainability ranking by BEE. .......................................................................... 101
2-10 Four basic tools of assessment in CASBEE as applied at each stage of building life........................................................................................................ 101
2-11 Comparison of principal sustainable building rating systems ........................... 101
3-1 Summary of the areas where changes occur to attain sustainable building. .... 130
4-1 Graphical plot of probability estimates and degree of agreement with the VE limitations in negatively impacting green building outcomes. ........................... 161
5-1 Data supporting the recommendations. ............................................................ 175
5-2 Framework for the modified VE methodology. .................................................. 176

12
LIST OF ABBREVIATIONS
ASTM American Society for Testing and Materials
BREEAM Building Research Establishment Environmental Assessment Method
CASBEE Comprehensive Assessment System for Built Environmental Efficiency
CBA Choosing By Advantages
DGNB German Sustainable Building Council
FAST Function Analysis System Technique
LEED Leadership in Energy and Environmental Design
MCDM Multi-Criteria Decision making Method
NLP Neuro-Linguistic Programming
PW Performance Worth
SAS Statistical Analysis System
USGBC United States Green Building Council
VA Value Analysis
VE Value Engineering
VM Value Management
VP Value Planning

13
Abstract of Dissertation Presented to the Graduate School of the University of Florida in Partial Fulfillment of the Requirements for the Degree of Doctor of Philosophy
VALUE ENGINEERING METHODOLOGY TO IMPROVE BUILDING SUSTAINABILITY
OUTCOMES
By
Joel Ochieng Wao
May 2014
Chair: Robert Ries Cochair: Ian Flood Major: Design Construction and Planning
Optimum cost, performance and quality are the main drivers in building
construction. Increasing and changing requirements of building owners have motivated
significant quests for methods to improve the value of sustainable buildings. Methods
that have been developed so far such as total quality management, quality function
deployment or management by objective have not comprehensively addressed building
sustainability outcomes. In fact, there is no value-focused procedure available to steer
sustainable building construction. As a result, owners are not provided with adequate
value for their buildings. Value engineering is a potential tool to achieve this goal.
Therefore, the research aim was to develop value engineering methodology that can be
used to improve building sustainability outcomes. The objectives were to develop a new
value engineering model and to evaluate the new method with a case study building
and expert opinions. The value engineering methods investigated involved conducting
value analysis of building systems using conventional value engineering process, i.e.,
the value analysis standard E1699-10 as the baseline, and the alternative value
engineering methods such as performance worth in the function analysis phase, neuro-

14
linguistic programming in the creativity phase, and choosing by advantages in the
evaluation phase. The methods were combined and investigated. It was hypothesized
that the alternative value engineering methods would improve building sustainability
outcomes. The research involved students performing value analysis of an academic
and research building facility after being randomly assigned to different teams
representing different value engineering methods and/or combinations. Students were
surveyed about their opinions of the methods. Also, sustainability faculty experts
evaluated the reports of the students relative to achieving building sustainability
outcomes by using the LEED assessment checklist. The final stage involved
presentations to value engineering practitioners who provided feedback through
teleconference discussions and online surveys about the potential limitations identified
in the conventional value engineering process and the alternative value engineering
methods developed to counter the limitations relative to achieving improved building
sustainability outcomes. The findings supported the hypothesis. A framework for
modified value engineering methodology was presented to provide avenues that may be
followed to achieve improved building sustainability outcomes.

15
CHAPTER 1 INTRODUCTION
1.1 Background
Optimum cost, performance and quality requirements for buildings, their
components and/or materials are the main objectives in almost every
construction project. In fact, there are growing and changing demands from
building owners on the nature of the buildings they need based on the above
three indicators. Various concepts and ideas have been developed to help
owners meet these needs, including value engineering, total quality
management, management by objectives, and quality function deployment.
However, each of these concepts in one way or the other has not
comprehensively addressed meeting building sustainability outcomes.
Value engineering came into existence around World War II as a strategic
methodology to be used to deliver products meeting three criteria simultaneously,
i.e., products of lower cost with improved quality and performance standards.
Miles (1947) was the original initiator of the value engineering (VE) process and
methodology. This technique has been widely applied in various fields including
manufacturing, transport, and construction. Special emphasis has been placed
on VE by Federal agencies which have proposed and developed procedures that
require mandatory use of VE in highway construction over $25 million dollars
(FHWA, 1997), which may be increased to $50 million dollars (FHWA, 2013).
Specifically, it is proposed that Title 23 of United States Code of Federal
Regulations Part 627 to contain a mandate requiring State Departments of
Transportation to conduct a minimum of one (1) VE study for each federally
funded project on National Highway Systems (NHS) costing $50 million or more

16
for highway projects and $40 million (originally $20 million under FHWA, 1997)
for bridge projects. Further, Section 106 requires State Departments of
Transportation to establish a program that reduces cost and improves quality of
project, promote innovation, remove design elements that are unreasonably
costly and ensure efficient investments by calling for VE studies (Project
Development Procedures Manual Chapter 19, 2013). Also, government policy A-
131 calls for all US federal agencies and departments to use VE methodology as
a tool for management, where necessary, to reduce acquisition and program
costs (Keen, 2013).
Building owners’ demands are increasing and changing, including greater
interest in sustainable construction and development. This has led to VE being
proposed as a potential tool or methodology to deliver sustainable building
projects. The concept has not been extensively embraced and put into practice
around the world (Yasser & Hanan, 2009). Part of the reason behind VE’s
unpopularity is that it is perceived as first cost reduction approach to building
construction, and many are not familiar with its potential applications in
sustainable design and construction.
1.2 Problem Statement
Research has shown that quality, cost, and performance of buildings are
the most important considerations when building owners make decisions (Jariti &
Zergodi, 2008). Suitable building conditions, for example, favorable indoor
environmental or air quality and energy levels, have positive correlations with
learning levels of students in academic building environments (Mitchell, 2010).
Building sector energy accounting indicates that buildings, i.e., both residential

17
and commercial buildings, will consume an average of about 21.1 quads of
energy per year between the years 2011-2040 (US Energy Information
Administration 2013, p. 94-95). This is shown in Table 1-1 and Figure 1-1.
Consequently, building facilities which consume optimum energy and
those with greater healthy indoor environments should be preferred. Measures
(or metrics) often used do not evaluate building costs and qualities appropriately,
leading to opting for lower cost alternatives that compromise indoor air quality
and therefore impair occupant’s performance (Annappa & Pandritao, 2012).
Sustainable design, construction, and engineering methods can be used
to address indoor environmental quality and energy consumption. Building
owners may not readily accept sustainable strategies since they may result in
increased building first cost. Some research has shown that sustainable building
construction can result in a total building cost increase of about 30% (Morris,
2007). Thus, there is need for understanding the values of sustainable strategies
in new construction or building renovation and incorporate them into decision
making. Integrating VE with green building process could be an approach to
achieve the aforementioned goals.
The purpose of this research is to develop a VE decision tool that can be
used to improve green building outcomes. The decision tool is expected to be
robust and one that meets the requirements of the building owners for cost,
quality, and performance.
1.3 Scope of this research
The scope of this research is limited to the analysis of current VE
methodologies and the analysis of the potential to change the process to better

18
incorporate sustainable green building principles and improve sustainability
outcomes. VE methodology will be revised in detail and a case study building will
be used to test it.
Table 1-1. Projection of energy consumption by sector for the year 2010 – 2040 (Quadrillion, Btu).
Figure 1-1. Average projection of energy consumption by sector (Quads).
Source: US Energy Information Administration (EIA), Annual Energy Outlook, 2013. The data for the sectors were sourced from Inter-industry Forecasting Project at the University of Maryland (INFORUM) which had energy data for all the sectors from 2011-2035. IHS Global Insight inc. (IHSGI) data were not preferred because it did not have the industrial sector data except it had the year 2040 building sector data over the forecast period.
1.4 Aim, Objectives, and Significance of the Research
The aim of this research is to develop a robust VE tool that can be used to
improve building sustainability outcomes. There are two research objectives
Sector 2011 2025 2035 Average consumption
Residential buildings 11.5 11.5 11.9 11.63
Commercial buildings 8.6 9.5 10.3 9.47
Industrial 23.6 25.4 26.8 25.27
Transportation 27.2 27.5 28.8 27.83
Electric Power 39.2 42.6 44.1 41.97

19
needed to meet this aim. One objective is to develop a new VE model to improve
building sustainability outcomes. This will be achieved by refocusing the current
or conventional VE towards meeting building sustainability outcomes. The other
objective is to test the new VE approach by use of case study building and
opinions of value engineers from the construction industry.
Arriving at the new VE model will require testing the conventional VE and
other alternative VE approaches through a range of experimental designs
involving students, sustainability experts, and value engineers. The outcomes will
be compared. The best approach in achieving superior building sustainability
outcomes will be the new VE approach. It is hypothesized that the alternative VE
method will provide better VE-sustainability oriented outcomes than the
conventional VE method from a sustainable design and construction viewpoint.
The new VE tool will be important to construction professionals as it will
assist them in making key decisions targeting superior building sustainability
outcomes. Also, the VE tool will assist building owners by providing them with a
value focused methodology to improve sustainable building outcomes.
1.5 Summary of Introduction
The introduction section has identified VE as a potential tool that can be
used to improve building sustainability outcomes. Developing new VE approach
using case study building and expert opinions has been identified as significant
milestone to meet the sustainability need. In the next section, VE, Multi-criteria
decision making methods, and sustainable building assessment tools will be
reviewed. Also, potential VE enhancing decision making methods such as
choosing by advantages and neuro-linguistic programming will be reviewed.

20
CHAPTER 2 LITERATURE REVIEW
2.1 Overview
The literature review included an analysis of VE history, its definition and
objectives, VE’s specific attributes, benefits, and success factors, which are
typically defined by the characteristics of the VE team. Special emphasis was
placed on the function analysis phase as one of the key success factors in the
VE process. Reasons for possible poor value were reviewed before the past
research studies on the integration of VE and sustainability principles were
comprehensively reviewed. Alignment with sustainable building and construction
and sustainability rating systems such as Green Globes were also explored. In
terms of decision making approaches, Multi-Criteria Decision making Methods
(MCDM), Choosing by Advantages (CBA), and Neuro-Linguistic Programming
(NLP) were reviewed. A summary of the literature is included in the last section.
2.2 History of Value Engineering Methodology
VE methodology can be traced back to Lawrence D. Miles. He is popularly
known as the pioneer of VE which is also called value management, value
analysis or value planning.
In 1947, General Electric experienced a shortage of materials and was
forced to search for avenues to produce products using smaller amount of
materials (Younker, 2003). Miles was working at General Electric, a major
defense contractor, where they faced shortage of the strategic materials required
to produce items during World War II. Miles, with the idea of value and
management, constructed a function analysis concept which was later called
value analysis. He highly held the notion that products are bought for a specific

21
purpose, for what they could do best, including providing aesthetic quality to user
(Abdulaziz, 2006; Miles, 1947). As value methodology became popular, a group
of practitioners decided to form a learning society to share their ideas and to
improve their capabilities. Thus, the Society of American Value Engineers
(SAVE) was formed in 1959 to further VE principles (Chen et al., 2010; SAVE
International, 2007; Younker, 2003). The first US government program to
implement VE methodology was the Department of Defense (DOD) Bureau of
Ships (now Navy Ships System Command). They called the program VE to
reflect the emphasis on their objectives and the nature of the organization which
was engineering specific. The VE name is the most widely accepted since the
inception of SAVE in 1959. However, it was not until late 1961 that the VE
program was officially implemented throughout the DOD in the USA. The DOD
instituted VE programs by staffing fulltime value engineers and by introducing VE
incentive clauses into their construction contracts, allowing contractors to prepare
VE changes and share the savings realized from its applications. A study was
conducted in 1965 by the US DOD to find more possible opportunities for
applying VE methodology (Burah, 2002). The VE process and methodologies
became embraced in the USA due to its benefits which included cost savings in
projects. In 1988, it was introduced to federal departments and agencies. In fact,
the governors of Minnesota in 1987 and Indiana in 1988 declared a VE Week
(Younker, 2003).
SAVE grew within the USA and it was thought that it should be expanded
to the international community so that the global community could also benefit.
Thus, in 1996, SAVE International was formed (Abdulaziz, 2006). The Ontario

22
Highway Industry in North America introduced VE into their system that same
year for the construction project delivery processes which included VE in
highway safety programs (Road talk, 2000). In 2010, British government and
Alberta infrastructure adopted value management program (Rabbi, 2012). SAVE
International is currently working with many agencies to further the
understanding, training, knowledge, facilitation, and improvement of VE
methodologies all over the world.
Since the conception of VE, a range of projects have employed and
benefited from it. These include projects which are costly, repetitive, complex in
construction, subject to external audit, and those implementing design
modifications or changes in materials or components (Annappa & Panditrao,
2012). The applications are in areas of increased costs which entail expensive
materials, complicated designs or an increase in the variety of components which
require analysis of appropriate alternatives (Annappa & Panditrao, 2012).
2.3 Definition and Objective of Value Engineering
Different researchers and VE reports use ‘VE’, ‘value analysis’, ‘value
planning’, and ‘value management’ as synonymous and interchangeable terms.
For example, the California Department of Transportation (Caltrans) refers to VE
as value analysis (Bremmer Consulting, 2010). Also, the VE approach is
sometimes called value control, value assurance or value improvement.
However, ASTM E1699-10 uses the term ‘value planning’ to mean value analysis
of systems or project at the earliest stage of the VE process. Nonetheless, the
focus is similar and the main aim is to reduce cost while maintaining or improving
the performance and quality of projects.

23
SAVE International defines VE as a systematic application of recognized
techniques which identify the function of a product or service at lowest overall
cost (Rohn, 2004; SAVE, 2007). Other definitions bring in the concept of humans
as the prime managers in the VE process. Thus, VE in this scenario is defined as
an organized application of both technical knowledge and common sense
directed at finding and eliminating unnecessary costs and providing best overall
value especially for public projects (Chen et al., 2010; Rohn, 2004). Abdulaziz
(2006) reinforces the human factor by injecting teamwork, which forms the
cornerstone of the success of the VE process and defines VE as an organized
team effort which is focused on analyzing project functions and quality in order to
generate realistic cost-effective alternatives that meet or exceed the needs of the
customer. In fact, the specific characteristic of people is paramount to the
success of VE, such as good leadership skills, superior verbal and
communication skills, participation, and recognition of team members (Chung et
al., 2009). The team is better when it is multidisciplinary in nature. Thus, VE can
also be defined as a systematic approach of recognized techniques by
multidisciplinary team(s) that identifies the function of a product or service,
determines a worth for that function, generates realistic alternatives by using
creative thinking of the team, and provides required functions, reliably at the
lowest overall cost (Sharma & Srivastava, 2011).
In the Departments of Defense (DOD) and Transportation (DOT), VE is
defined as a function oriented technique. Specifically, the DOD Handbook
defines VE as a systematic effort aimed at analyzing the functional requirements
of DOD systems, equipment, facilities, procedures, and supplies for the purpose

24
of achieving necessary functions at the lowest total costs, consistent with the
required performance, safety, reliability, quality, and maintainability (Benstin et
al., 2011). This definition is related to the Rohn (2004) definition which highlights
VE as a function oriented management technique for improved design and
construction. Noteworthy, in the United States of America, VE is implemented to
reduce costs without reducing the levels of performance while India’s focus on
VE is tied to any alternative design with the main objective of cutting the cost of
the project (Annappa & Pandritao, 2012). This can create a misconception of the
VE process and its use in projects.
Considering the VE definitions above, value management (VM) poses
similar definitions save for the fact that some researchers have concluded that it
is a management style using VE methodologies. Thus, Male (2007) defines VM
as a style of management with the aim of reconciling differences in views
between stakeholders and customers as to the true meaning of value. According
to Male (2007), this is achieved through a structured, systematic, analytical
function-oriented and managed process which involves a representative,
multidisciplinary team brought together in a participatory workshop situation. That
is, VE is a management technique that has a main objective of achieving the best
functional balance between cost, reliability, quality, and performance of a
product, project, process or building system. Hence, VM is a methodological
management style for improving value in construction projects upon delivery.
Noteworthy, there is no standard definition of VM in the literature. European
standards only define it as a management style (Male, 2007).

25
In as much as VE has been identified as a methodology to solve
construction problems, reduce costs, improve quality and performance (Younker,
2003), it is also important to understand what VE is not. VE is neither a
suggestion program nor a typical cost reduction program used to cut corners in
building construction (Srivastava & Sharma, 2011). Other VE myths are that VE
is just cost cutting tool dealing with functions rather than products, i.e., it delays
projects, criticizes designs, focuses on initial costs, and diminishes quality
(Bremmer Consulting, 2010).
It is evident that VE has a range of definitions. The common aspects are:
multi-disciplinary team, structured approach, function orientation, and creative
thinking. In fact, VE is not just a cost cutting methodology but a decision-making,
consensus-based problem solving and value improvement methodology for
multidisciplinary teams (Kmetty, 2013).
From the definitions, the objectives of VE can be inferred clearly. The
prime objective of VE has been to reduce cost while maintaining or improving
performance and quality requirements. Retrospectively, from the start of VE,
Miles (1962) recognized the objective of VE as an important aspect for achieving
better approaches to quality and reliability of products at a reduced cost. Some
researchers identify VE as a cost reduction tool (Dlugatch, 1973; Heggade, 2002;
Tohidi, 2011), while others echo the cost effectiveness without neglecting
performance (Benstin et al., 2011; Dlugatch, 1973; Huber, 2012). Others state
that there are three aspects of value, namely, function, quality, and cost, which
are important objectives. Specifically, improving quality, minimizing total costs,

26
reducing construction time, ensuring safe operations, and ensuring ecological
and environmental goals are met (Abdulaziz, 2006; Rohn, 2004).
Nonetheless, VE still remains a systematic application of recognized
techniques which identify the function of a system, establish the worth of those
functions and then provide only the necessary functions that meet or exceed the
needed performance level at the lowest overall cost (Wixson, 2004). Rohn
defines it as a proactive process employed in the design phase to avoid
problems in later stages of construction and operation where producing superior
designs is the main objective (Rohn, 2004). Male defines it as a proactive
problem solving and seeking service which maximizes the functional value of a
project or system by managing its development from concept to use through
structured team approach (Male, 1998). The team makes explicit decisions
through constant reference to the value requirements of the owners. Male et al.
(2007) affirmed this notion by stating that VE and VM derives its power from
being a team oriented methodology using function analysis to examine and
deliver a product, service, or project at optimum whole life performance and cost
without devaluing quality.
2.4 Ideal Value Engineering Team
Past research shows that there are varied numbers of members that can
form a typical VE team. Engineering News Record (1990) showed that the team
members with diverse backgrounds may vary from 5-25 depending on the
complexity of the project with larger projects requiring more specialist members.
This coincides with the conclusion from another study in which the size of the
team and length of the study depends on the size and cost of the project (Road

27
talk, 2000). However, a VE team of 5-7 members with diverse areas of expertise
and wide range of experience has been found to typically give the best results
(Rohn, 2004). The team needs to include experts who are knowledgeable in
management, cost, procurement, financing, construction, and operation of similar
buildings in the study (ASTM E1699-10).
Overall, the VE team leader should control the dynamics of the
multidisciplinary team with effective communication and creativity. ASTM E1699-
10 maintains that the team leader should be an individual with strong leadership,
management, and communication skills. The level of communication is expected
to be high. This is characterized by high levels of trust and better member
cooperation which enhances and activates maximum idea creation. Typically, the
synergistic level of communication should be aimed at in any VE process. The
phase is characterized by team maximum cooperation and maximum trust.
Maximum creation of ideas and good communication are also major features of
the phase (Figure 2-1).
The VE leader should be trained in VE principles and have experience as
a team member, a leader or a facilitator of a previous VE project or study. The
team leader should be able to diffuse any friction among members into a high
level of creativity. Attention should be paid to function analysis and Function
Analysis System Technique (FAST) diagram methods because FAST is a vital
technique for integrating and coordinating the VE team. FAST is also a good
communication and coordination tool for use in the function analysis phase. This
is because it can connect both the requirements of the owner and technical

28
know-how of multidisciplinary team members into a single unit (Chen et al.,
2010). These should be streamlined to get the desired outcome (Figure 2-2).
2.5 Value Engineering Critical Success Factors
The success of a VE process depends on facilitated and guided team
effort, upper management support, active participation of the clients and/or
owners, competence of the facilitator, and enlisting a senior manager as a
champion and program leader of the project (Chung et al., 2009; Sharma &
Srivastava, 2011). Heggade brings in an important aspect, which says that VE
must incorporate a multidisciplinary team of professionals in which the results
must have quantitative measures so as to improve communication among the
team members (Boock & Chau, 2007; Heggade, 2002).
Others argue that the success of VE in a project depends on the
personality of the team leader, client input, relationship with the design team and
the nature of the project itself since some VE teams can have a large number of
participants (Chen et al., 2010). Success depends mainly on the relationship of
the VE multidisciplinary team which is chiefly determined by effective
communications and the strategic actions of the team members. Nonetheless,
Male (2007) points out that the success of VE is determined by the elements of
the VE process which include the study process, commitment by team members
involved in the project, management of the VE process, executive commitment,
and efficient facilitation.

29
2.6 Reasons for Poor Value in Value Engineering
Construction may result in poor building value especially when the VE
process is not followed correctly. These can include not following required ethical
VE standards or inducing errors in the VE process.
Team leaders writing final reports without the consensus of the team
members can induce poor value. This is because the members have no
ownership of the final VE report, likely to cause conflict among them (Smith,
1999). Too many decisions based on feelings rather than facts can negatively
impact the outcome of VE process. Lack of organized effort, highly compressed
time frame, lack of yardsticks for measuring value, wrong beliefs, habitual
thinking, rigidity without consideration for changing technology, function and
value among other factors, may result in poor value (Sharma & Srivastava,
2011). Other factors to avoid include: unwillingness to look for advice, failure to
accept lack of knowledge of certain specialized aspects of project development,
negative attitudes such as failure to recognize creativity or innovations, lack of
good communication among team members, jealousy, misunderstandings, and
friction among members (Sharma & Srivastava, 2011).
The influence of traditional methods of construction project cost reduction
can infiltrate into the VE process. These must be screened off completely
because such methods can easily inhibit creativity from team members (Tohidi,
2011).
Overall, anything that can lead to poor value should be avoided as much
as possible. This is because they can impair the implementation plan and
process of VE methodology in projects leading to undesirable outcomes.

30
2.7 Implementing Value Engineering
The main reason for implementing VE in projects is to remove
unnecessary costs while maintaining or improving performance and quality
levels. In doing this, there seems to be no single understanding of when in the
design and construction process it is best used. But one important aspect is that
VE implementation should start early in the project schedule (SAVE International,
2007; Sharma & Srivastava, 2011) and that VE studies should not be
implemented when more than 50-60% of design has been completed.
Advantages attached to early VE use include more units affected by saving
actions and also lower implementation costs both in the short run and long run.
The VE methodology can be used in three stages of building project:
planning and design, which is the most important stage to apply VE, construction,
and maintenance and operation. Some research has shown that VE should be
ongoing over the life cycle of a project while others show that VE is effective after
the start of construction (Chung et al., 2009). A report in Engineering News
Record (1990) showed that when the VE process was conducted during
construction, a change from square columns to less expensive round columns at
a Chicago building saved about $250,000.
One thing that is critical to the implementation of the VE process in
construction is that it should not affect the schedule. The VE process should not
add time to the schedule, that is, it should not affect the critical path of the project
schedule.
Areas of VE application may include: engineering, e.g., design and
product improvement; manufacturing, e.g., material handling, equipment design

31
and production; purchasing, e.g., new product information; sales, e.g., reduced
sales of a product; construction, e.g., planning, scheduling, and labor; systems
and procedures, e.g., reproduction services; maintenance, e.g., work scheduling;
and energy conversion, e.g., procedures and life cycle cost assessment.
Overall, appropriate implementation of VE should focus on engaging in VE
success factors and avoid the avenues that can induce poor value or lay down a
plan for alleviating poor value should it arise during the VE process.
Understanding the VE job plan or phases is important for the excellent execution
or implementation of VE methodology.
2.8 Job Phases in Value Engineering Methodology
Different VE studies use different steps or phases. Dlogatch research
(1973) reported seven steps while SAVE International structures VE as a six step
process. The Environmental Protection Agency (2005) documented six phases of
VE methodology: information, creativity, analysis, development, presentation,
and implementation. Benstin et al. (2011) reported eight VE phases: orientation,
information, function analysis, creative, evaluation, development, presentation,
and implementation. The American Society for Testing and Materials (ASTM)
standard E1699-10 defines the VE process as eight phases and pre-workshop
preparation step (ASTM E1699-10). These phases are:
Information phase (What is it and what does it cost?): Here, there is identification of the problem to be solved, evaluation of the feasibility of implementing VE study for the problem, gathering necessary data or information about the problem, and allocating the needed resources and team to accomplish the study.
Function analysis phase (What does it do?): The VE team identifies and analyzes functions, determine worth, and know the new implications in terms of time, quality, safety, aesthetics, energy, environmental impact, and other owner requirements.

32
Speculative or creative phase (What else will it do?): The team involve in a brainstorming session. Free flow of ideas is encouraged and judgment is suspended until the ideas have been exhausted. From the list of ideas, the team develops alternative ways of meeting the owner’s requirements.
Evaluation phase (Will it work? What does it cost?): The team conduct analysis and evaluations of the alternatives developed. The criteria for evaluation are listed out including the advantages and disadvantages of each alternative. A ranking procedure is established. The top ranking usually becomes the best alternative which meets the owner’s requirements.
Development phase (What work best from among the alternatives?): The best alternative is selected. The feasibility of the best alternative is determined. This include initial estimated costs, life cycle costs, and necessary technical information about the best alternative.
Presentation phase (What are the specific ideas? Can ideas be grouped?): The VE team present the alternatives developed to the design professionals and/or the owner so that they fully understand the importance of the alternatives before implementation. Written report is prepared which spell out the cost savings in addition to other supporting documentations. Communication is important here and to the overall success of VE process.
Implementation phase (Can approval be obtained?): The VE team prepares implementation plan and schedule to ensure that implementation is carried out effectively. The owner and design professionals meet to decide on the final outlook of the alternatives.
Final acceptance phase (Which alternatives can be accepted?): The design professionals are responsible for determining technical feasibility of each alternative and also implementing those alternatives that meet the requirements of the owner. In the event of any alternative not fully meeting the function or requirement of the owner at a particular time, the owner may instruct the design professionals to conduct further analysis so as to determine the feasibility of implementing such alternatives. If some specific alternatives are not implemented, the design professionals are responsible for documenting reasons for non-implementation. These must be communicated to the VE team and the owner.
These are illustrated in Figure 2-3.
Some VE studies combine some of the phases defined in ASTM E1699-
10. The five phases of the VE process defined by (Abdulaziz, 2006) are: the
information phase, the speculation or creative phase, the evaluation or analytical

33
phase, the development or recommendation phase, the report, and the
implementation phase. Male (2007) identifies only three phases: orientation and
diagnostic phase, workshop phase, and implementation phase. The phases that
have been used in VE studies are summarized in Table 2-1.
The exact number of phases is not critical but it is important that all the
important steps in the VE process are captured. These key steps are: information
gathering, function analysis, creativity, evaluation, development, presentation,
and implementation. In order to achieve this, teamwork and good utilization of
resources is encouraged while brainstorming with a high level creativity (Tohidi,
2011). The focus of the VE team should be on creating the best value through
attention to cost, performance, and quality levels. FAST is an important tool for
achieving the best value.
2.9 Value Engineering Function Analysis System Technique (FAST)
The core of a VE exercise is in the analysis of the functions of systems.
The function analysis guarantees an understanding of what the building
component or system does. It moves the team from a general understanding to
precise deeper understandings that may lead to better value. It is this
characteristic that makes the VE process unique and different from other problem
solving techniques or disciplines (SAVE, 1998). Specifically, function analysis is
concerned with specific project requirements and determining the value of the
project by identifying necessary functions and potentially unnecessary costs.
Therefore, it is important to spend a significant amount of time on the function
analysis. This is because the most important function is not always immediately
clear and that an inappropriate or unsound selection from a range of alternatives

34
can lead to a very different solution which could lead to cost escalation and
performance failures.
Developed in 1964 by Charles Bytheway, FAST identifies the basic and
secondary functions of systems (Borza, 2011; Bytheway, 2007). ASTM E1699-10
defines basic functions as those that are essential for the project to perform and
must be fulfilled in any project system’s alternatives developed, while secondary
functions are defined as supporting functions that enhance the project
performance, i.e., they describe features, attributes and/or approaches that
implement or enhance the basic functions.
Building system or component functions discovered by a team can be
recorded logically using the FAST method (Nick et al., 2000). FAST and the use
of function as a basic language assist in understanding how and why things work
by eliciting discussion or argument. Functions are described as words, and FAST
links words into sentences and develops arguments using a graphical FAST
diagram (Figure. 2-4). Verb-noun pairs are used as basic linguistic elements to
obtain a clear understanding of the specific system under study. The purpose of
FAST is to build consensus in the VE team on where and how the systems being
analyzed fit in the scheme of the building (Bytheway, 2007; Kmetty, 2013).
The sequential procedure of function analysis is to select a building
component, define the needs and desires (functions), classify the functions,
allocate cost to each function, and analyze the importance and expected
performance level of the functions (ASTM E2013-12). The process involves
describing the function using a verb followed by a noun. The pair should be an

35
action verb followed by a measurable noun. This enables the function to be
quantified effectively. An example is illustrated in Table 2-2.
The FAST diagram helps the users calculate the ratio of total cost to
critical path function cost, i.e., the VE value index. The purpose in a project is the
higher order function (Figure 2-4). The relationship between a higher order
function and lower order function is determined by asking ‘Why’ the function
performs as it does. The answer constitutes the higher order function. The logic
check must be completed by asking ‘How’ the higher order function is realized.
The answer must be the lower order function. The basic function is to the right of
the left hand scope line and the secondary functions are to the right hand of the
basic function and continue to the lower order function by asking ‘How’ questions
(ASTM E2013-12; Kasi, 2009).
Overall, the main goal of function analysis is to develop a full
understanding of the building system’s or project’s purpose. Once there is
complete understanding of the functions, the project team members can then
select areas for maximum return on the value study resources that are available
for the project, i.e., areas of maximum value to the owner (SAVE, 1998).
2.10 The Concept of Value in Value Engineering
Value has different meaning to different people. It may be a reflection of
people’s feelings and needs at a particular time. It can be subjective in some
cases in that what is considered to be of good value for one may not necessarily
be of good value to another. For example, if you feel that you have your money
or quality or performance worth then you have 100% value (Kasi, 2009). Also, if
you feel that if something costs more than you think it should, then there is a

36
tendency to improve the value or reduce the cost. Some may confuse value with
cost or price. It is a mistaken belief that when something costs more, it is worth
more, i.e., it has a high value. But value is not synonymous to cost. It may be
perceived as a ratio of positive and negative aspects of system or project.
Miles (1962) concluded that value analysis is the efficient or effective
identification of unnecessary costs, i.e., costs which provide neither quality nor
use, nor life, nor appearance, nor customer features. Thus, value can be
considered as a composite of quality and cost (more like worth or utility). The
ratio of quality to cost can be treated as the value of a product, service, or
system. If cost can be reduced for the same quality or quality can be increased
for same cost, then value improvement is said to have occurred.
SAVE International (2007) views value as a fair return in goods, services
or money for system or product exchanged. Achieving true value is the objective,
and it is met by analyzing functions of systems and resources available for use to
fulfill the functions. SAVE International (2007) recommends that the function
should be measured by performance requirements while resources to be
measured in materials, labor, prices or cost, time, or other. Kasi (2009) stated
that value is achieved when the project has a high performance while reaching a
desired acceptance at a reasonable cost. Typically, value is maximized by
optimizing the equation:
Value = function ÷ cost = worth to you ÷ price you pay = performance ÷ cost = function ÷ resources (2-1)
The main goal is to achieve a ratio of 1:1 or greater which represents good
value.
37
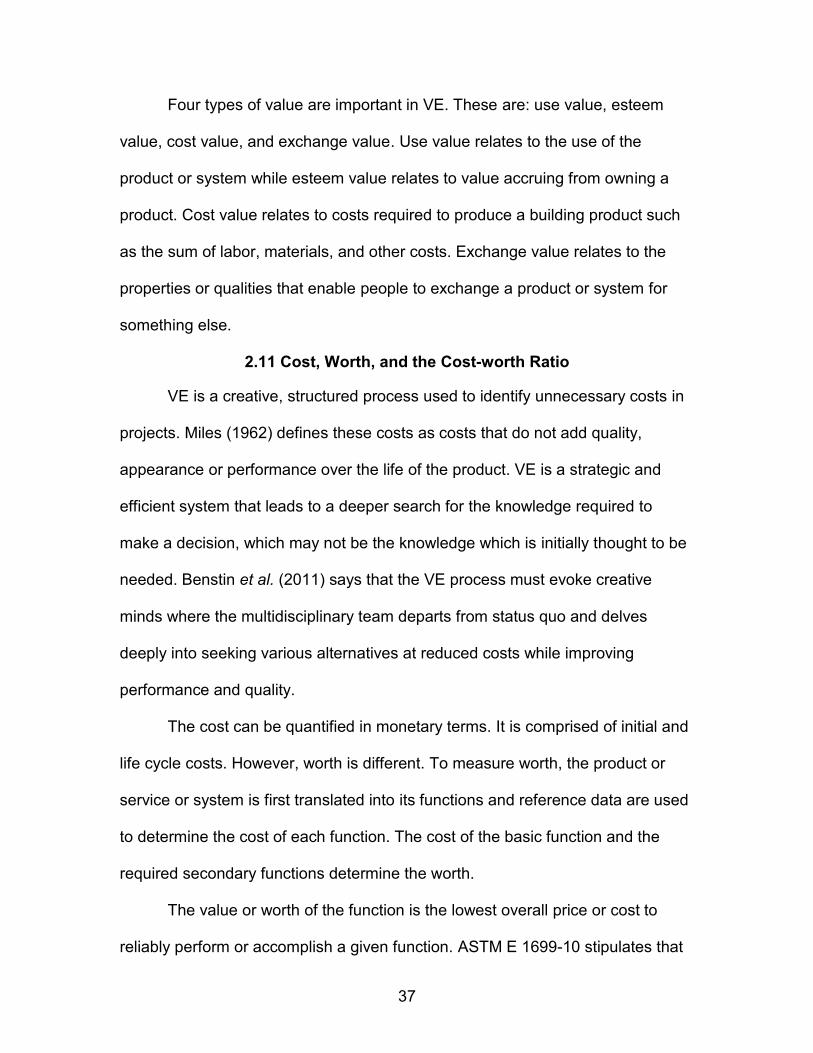
Four types of value are important in VE. These are: use value, esteem
value, cost value, and exchange value. Use value relates to the use of the
product or system while esteem value relates to value accruing from owning a
product. Cost value relates to costs required to produce a building product such
as the sum of labor, materials, and other costs. Exchange value relates to the
properties or qualities that enable people to exchange a product or system for
something else.
2.11 Cost, Worth, and the Cost-worth Ratio
VE is a creative, structured process used to identify unnecessary costs in
projects. Miles (1962) defines these costs as costs that do not add quality,
appearance or performance over the life of the product. VE is a strategic and
efficient system that leads to a deeper search for the knowledge required to
make a decision, which may not be the knowledge which is initially thought to be
needed. Benstin et al. (2011) says that the VE process must evoke creative
minds where the multidisciplinary team departs from status quo and delves
deeply into seeking various alternatives at reduced costs while improving
performance and quality.
The cost can be quantified in monetary terms. It is comprised of initial and
life cycle costs. However, worth is different. To measure worth, the product or
service or system is first translated into its functions and reference data are used
to determine the cost of each function. The cost of the basic function and the
required secondary functions determine the worth.
The value or worth of the function is the lowest overall price or cost to
reliably perform or accomplish a given function. ASTM E 1699-10 stipulates that

38
the VE team sets the cost targets or the worth for each system function. The
worth is the VE team’s estimation of the least cost required to perform the
required function. The cost is the estimated cost for providing the function in a
given case. Comparing function cost to function worth helps in identifying areas
for potential value improvement in projects. Dividing the estimated cost for a
given system or functional group by the VE team’s benchmark cost for providing
the function constitutes the cost-to-worth ratio. A ratio greater than 1:1 presents
potential opportunity to improve value of a system or project.
Figure 2-5 shows a graphical illustration where value can be improved by
either improving worth without changing cost (A) or retaining same worth for less
cost (C) or combining improved worth with less cost (B).
The value estimates depend on the accuracy of the available information
and the thoroughness of the VE study. The VE team and the design
professionals should be in full agreement on the systems requiring value
improvement.
Some studies have shown that utilizing VE methodologies have typically
resulted in about 5-35% cost savings with a return on investment (ROI) of about
200-222% (Chung et al., 2009). Other studies show that well executed VE
processes could have savings of up to 25-35% (Smith, 2009) while others have
shown cost reductions in the range of 15 -20% (Heggade, 2002).
2.12 Summary of the Value Engineering Process
Obtaining maximum benefits has been the main reason or objective
behind implementing VE procedures in construction. According to Odum (1991),
the concept of maximum benefit is manifested in maximizing yield and profits,

39
i.e., generating building system alternatives which contribute to higher output
while costing less and therefore providing maximum benefits in performance and
quality. These benefits can manifest themselves in design improvements, cost
savings, continuous improvement, accelerated inclusion of new materials and
improved construction methods, employee enthusiasm from participation in
decision making processes, improved skills accruing from team participation,
optimized quality and performance requirements, and improved functional
reliability and system performance (Rohn, 2004). Achieving these benefits
require greater understanding of human dynamics and facilitation skills, i.e.,
understanding team dynamics to get the most output from the team.
Successful VE projects have shown the importance of incorporating a
good multidisciplinary team of engineers or builders right from the beginning of a
project. Synergistic team communications have been identified as important to
the success of a VE team.
As described earlier, the VE team uses FAST to fully understand the
project in terms of functions. The actual cost of each function is determined,
aggregated, and compared to reference data, which is typically the VE teams’
estimation of benchmark costs. This determines the value or cost-worth of
systems. A system’s cost-worth ratio greater than 1:1 implies that the system
needs value improvement. Value is realized when the cost of new system
developed by VE team to provide the function is less than the original system.
The VE team will identify areas of poor or low value, which may be done
through a function-cost matrix. If a function accounts for a large percentage of
building or product cost, then it is a potential area for value improvement. By

40
determining alternative ways to achieve a function, the cost can potentially be
reduced and the value improved.
However, not all system or services are linked to cost only. In an analysis,
a system can be linked to its performance or quality in which VE can be used to
find potential areas for quality or performance improvements. In building
construction, the concept of sustainable or green building construction and
development is an avenue to address quality or performance requirements of
building systems. VE is a process to enhance performance and quality outcomes
of green buildings.
2.13 Value Engineering and Sustainable Building Design
2.13.1 Overview
Sustainability and VE can be considered to be the best combination of
green building principles, life cycle cost (LCC), and quality that satisfies human
needs throughout the life cycle of project (Abdulaziz, 2006). This combination
encourages the use of tools and techniques to create purposeful realistic cost
changes rather than changes happening accidentally in projects. It links with
SAVE International standard VE methodology and techniques which are used to
improve planning for sustainable construction during the conceptual and design
stages of project (Abidin & Pasquire, 2007).
A structured VE job plan can be used to steer the sustainability agenda in
building construction. For example, sustainability can be a basic function for the
building project or system. Multidisciplinary teams working together in a
coordinated VE process would raise the chances of sustainability being
considered effectively in the building project.

41
Overall, consideration for sustainability issues in a VE process depends
entirely on the interest and commitment of the owner and the knowledge of the
VE team. The process needs to ingrain sustainability principles early in the
project and maintain its focus throughout the decision making and execution
phases of the project (Leung & Liu, 1998).
2.13.2 Principle of Sustainable Development and Sustainable Construction
Sustainable construction denotes the application of sustainable
development principles in the construction industry. Sustainable construction
may be defined as the creation and the responsible management of healthy built
environment based on resource efficient and ecological principles (Kibert, 2008).
Sustainable building design and construction acknowledges the prime effect of
the life cycle of the building, including its operation on the health of occupants
and the immediate environment. The World Commission on Sustainable
Development (1987) defined sustainable development as “development that
meets the needs of the present population without compromising the ability of the
future generations to meet their own needs.’’ Hajek (2002) expounds further that
sustainable development addresses quality of the environment, economic
constraints, social equity, and cultural issues. It should be accompanied with
changes that are focused on improving the quality of human lives in buildings
and the environment. In essence, sustainability or sustainable development is an
effort to achieve project economic success while protecting the ecological
systems and providing improved quality of life for users.
The development must strike a balance on use of resources, that is,
economic progress and environmental conservation (Al-Yami & Price, 2006;

42
Langdon & Mackley, 1998). VE methodology can have a focus on achieving
sustainability goals in green building projects.
Sustainability is affected by the environmental impact of economic
development in the built environment. Environmental issues impacted by the built
environment are numerous, e.g., natural resources and global warming (Kibert et
al., 1991).
2.13.3 Green Building Construction
Green building construction, sustainable construction, and high
performance building construction are terms that have been used
interchangeably. Green building can refer to the qualities and characteristics of
buildings constructed using sustainable construction principles, that is, healthy
buildings constructed in a resource efficient manner using ecologically focused
principles (Kibert, 2008). Specifically, green building construction is the practice
aimed at increasing the efficiency with which buildings use energy, water, and
materials and their effectiveness in protecting and restoring human health and
environmental quality throughout the life cycle of building, that is, siting, design,
construction, operation, maintenance, renovation, and deconstruction (Abdulaziz,
2006b). For example, a green building may be characterized by healthy indoor
environment with minimal pollutants, i.e., reduced production of emissions.
United States Green Building Council (USGBC) was formed in 1993 to
improve the sustainability of buildings and thus improve building value. Green
building was implemented by the USGBC through the LEED rating system. Thus,
LEED has been a useful decision tool in gauging the level of sustainability of
green buildings (Matthiessen & Morris, 2004).

43
It has been estimated that the building sector will consume 21.1 quads of
energy per year on average from 2011-2040 (US EIA, 2013). This estimated
value translates to billions of dollars to be spent in meeting the energy
requirement, calling for green building construction that can significantly reduce
energy use. VE can be an approach to realize optimal energy consumption and
to achieve good green building outcomes.
Green building has been ingrained into US policy by Federal Executive
Order (FEO) 13423. This executive order strengthens Federal leadership in high
performance and sustainable buildings (Keysar & Pearce, 2008). FEO 13423
makes the USGBC’s LEED silver rating mandatory for all buildings under new
construction since the beginning fiscal year 2008 for US Army building projects.
Overall, the term green building refers to improved sustainable
approaches to planning, designing, and constructing buildings. These kinds of
buildings are constructed with environmental impact and occupant wellbeing or
healthy indoor environmental quality in mind (Kibert, 2008; Keysar & Pearce,
2008). The Office of Federal Environmental Executive (OFEE, 2003) defined
green building as: 1) increasing the efficiency with which buildings and their site
use energy, water, and materials and 2) reducing the building impacts in human
health and environment through better siting, design, construction, operation,
maintenance, renovation, and deconstruction. This notion is consistent with
green building design philosophy focusing on increasing the efficiency of
resource use and reducing overall building impacts (Pan et al., 2011). Benefits of
green buildings are: environmental, i.e., improved air quality; economic, i.e.,
improved occupants’ productivity and optimized life-cycle performance; and

44
socio-cultural benefits, i.e., enhanced comfort of occupants, satisfaction and
health, increased aesthetics, and improved overall quality of life.
2.13.4 Motivation for Building Green
Building owners have different motivations regarding green building
construction. Consider the following examples. A hospital building board may opt
for green features or a green building because green features promote healing,
e.g., through outside views, while commercial office property managers may
promote a green initiative so as to speed up lease-out and thus lower carrying
costs. Federal agencies may desire green ideas in buildings to improve
employee morale and increase retention while owners may look strictly at
financial benefits of building green (Wilson, 2005).
An interview conducted with sustainable leaders found out that most
important factor driving green building is ROI. Lower cost was identified by
governmental agencies as an important factor. Building owners reported that
there are benefits attached to savings in energy, water, waste, and lower
operating costs of green buildings (Smarter Buildings, 2012).
Sustainable materials are increasingly becoming more affordable by
owners, sustainable building design elements are becoming widely accepted in
the construction designs and building owners are beginning to demand and value
green building features and sustainable construction goals (Morris, 2007). The
acceptance of green building features by owners is important for VE applications.
According to Wilson (2005), green building features have a range of benefits
including reduced building operating costs such as lower energy and water costs,
economic benefits such as increased property value and positive public image,

45
health and productivity benefits because most Americans spend 85-95% of their
average day indoors. Also, it manifests itself in improved worker productivity and
faster recovery from illness, community benefits such as reduced erosion and
storm water runoff, environmental benefits such as reduced global warming and
ozone depletion, reduced toxic emissions, protection of diversity, and increased
environmental awareness. Lastly, the social benefits of green building are linked
to or manifested in the support of sustainable economies and companies with
socially responsible policies (Wilson, 2005). There is a need for building
professionals to convince clients to pursue green buildings that have greater
savings in energy, water, waste water, and reduced building operating costs
among other factors (McGrawhill-Construction, 2012; Wilson, 2005).
In spite of the above motivational factors, there is still resistance to
adopting green initiatives from some building owners. This can be attributed to
resource (budgetary and scheduling) constraints (Keysar & Pearce, 2008; Kibert,
2008). A study has shown that greening buildings increase building cost by about
30% and is also characterized by increased first costs (Morris, 2007).
Stakeholders may have little or no formal green building project experience but
might want to meet standards of building green (Kibert, 2008).
2.14 Decision Making for Green Building
Green building construction requires an effective decision making tool to
facilitate the selection of best building systems from alternatives available. This
will aid in constructing a building which is most sustainable, profitable, and cost
effective (Pan et al., 2011). The process requires appropriate decision support
system.

46
2.15 Decision Support System for Green Building Construction
A decision support system is an interactive method that aids the users in
judgment and choice. It is a tool or system that informs the decision making
process by assisting the users to know the consequences of diverse choices or
decisions they make.
Decision analysis is applicable to green building decisions because they
typically involve multiple criteria and stakeholders, and significant tradeoffs
between short term and long term pay-offs (Baker & Ewing, 2009). This may
incorporate value elicitation to assign quantifiable values on qualitative
characteristics such as educational value or environmental impact in, for
example, academic building (Baker & Ewing, 2009).
Consideration for decision tools include the relative advantages
associated with them, compatibility (cultural), complexity (ease of understanding),
and observeability (of results and outcomes). Tools to support green building
implementation must evolve as well as realize success in achieving sustainability
goals across the projects and people adopting it (Keysar & Pearce, 2008).
Overall, it is prudent to create a decision tool that allows quick and effective
evaluation of different alternatives or options (as an example) to arrive at
investment decisions that permit meeting the stated project goals (Baker &
Ewing, 2009).
An example of a decision support framework is the Choosing by
Advantages (CBA) framework developed for the US Department of Agriculture’s
Forest Service to help make complex resource allocation decisions in multiple

47
stakeholder situations (Suhr, 1999). Neuro-Lingusitic Programming (NLP) may
assist creativity and aid in value improvement (Elder & Elder, 1998).
VE decision support systems for green building such as Multi-Criteria
Decision-making Methods (MCDM), CBA, and NLP systems will be reviewed in
the following section. These are methods that can form an integral part of the VE
process in projects.
2.16 Multi-Criteria Decision Methods and Sound Decision Making Approaches
2.16.1 Overview
Multi-Criteria Decision Methods (MCDM) have been used in VE for
selection of building system alternatives which provide best value for owners.
There are many variations that have similar characteristics including Goal
Programming (GP), Utility Theory (UT), Weighted Sum Method (WSM), Weighted
Product Method (WPM), ELECTRE method, Analytical Hierarchy Process (AHP),
CBA, and NLP.
2.16.2 Definition of Terms in MCDM
Alternatives are diverse choices of actions accessible to decision maker. These are usually many and are screened, prioritized, and eventually ranked.
Attributes are goals or decision criteria which can be arranged hierarchically.
Conflicting alternatives are attributes that represent different types of alternatives that can conflict with each other, e.g., cost conflicting with profit.
Incommensurable units are different attributes that maybe associated with different measurement units, e.g., cost ($) and mileage (miles). Having to deal with different units makes Multi-Attribute Decision Method (MADM) attributes hard to estimate.
(Adapted from Triantaphyllou et al., 1998)

48
Criterion is one measure to quantify the goodness of any solution to a decision problem. It includes performance of system, individual preferences, safety consideration, or profit. The decision problem with more than one criterion is called multi-criteria decision making or multi-criteria decision aid. Criteria space is the space formed by a set of criteria (Jones & Tamiz 2010).
Objective is a criterion with more information regarding the direction which the decision maker prefers, e.g., minimize or maximize the objective relative to a system. Multi-objective optimization problem is a decision problem with a set of objectives to be maximized and minimized (Jones & Tamiz, 2010).
Feasible region is the set of solutions in a decision space that satisfy all the requirements of the decision problem (Jones & Tamiz, 2010). A solution to a problem that falls within the feasible region is implemented.
Satisficing describes a behavior in which decision making team aim to arrive at a set of goals. If they meet the goals, then this suffices for them in that decision situation and they are satisfied. It is an alternative to optimization where people are more interested in reaching goals than in abstract idea of optimizing outcome of the decision problem (Ignizio & Romero, 2003; Jones &Tamiz, 2010).
Optimizing is finding a solution which yields the best value of a measure from a set of decisions. Theory of optimizing in the presence of many objectives is explained by adapting Pareto concept into the field of decision making process. Pareto in 1896 concluded that a society is in an optimal state if no person can become richer without making another one poorer. This leads to definition of Pareto optimality in a multi-objective model (Jones & Tamiz, 2010).
Ordering and ranking is when the maximization of unwanted deviations from goals takes place according to weaker order. Here, weak ranking of goals in terms of importance exists and is known (or can be estimated) by the decision team (Jones &Tamiz, 2010).
Robustness is the ability of a solution to cope with uncertainties including those that may be unanticipated (Wallenius et al., 2008). In multi-objective optimization, the concept of robustness is defined by considering stability of the optimal solution relative to the errors in the objective function parameters (Cromvik et al., 2011; Soares et al., 2009).
In relation to VE, MCDM refers to situations where there exists more than
one objective or goal. Typically, these objectives do conflict and the team must
arrive at decisions by taking them into consideration. MCDM involves the

49
selection of multiple alternatives to achieve an overall result based on the
appropriateness of those alternatives when compared to a set of criteria (Farhad,
2006). The decision criteria will be weighted in terms of their value to the decision
making team because criteria are rarely of equal value or importance. When a
suitable process is applied to the problem, a rating of alternatives can be formed
into a rank, based on preference (Farhad, 2006). Thus, MCDM involves:
Determining relevant criteria and alternatives.
Linking numerical values or measures to the relevant importance of the criteria and to impacts of criteria and alternatives.
Processing numerical values to determine a ranking of each alternative.
Decision in the presence of multiple and conflicting criteria can be
classified in two types: 1) selection of an alternative from a menu of prioritized
attributes of alternatives or MADM characterized by decision problems in which
the decision space is continuous, e.g., a decision making problem with many
objective functions, and 2) synthesis of an alternative or alternatives on the basis
of prioritized objectives or Multiple Objective Decision Making (MODM) which
focuses on problems with a discrete decision space. In these types of problems,
a set of decision alternatives has been pre-determined (Triantaphyllou et al.,
1998).
Special importance is placed on methods for eliciting data for MCDM
problems and also in processing such data in the VE process. The overall
assumption of MCDM in the VE process is that the decision maker is to choose
an alternative from a set of alternatives whose objective function values or
attributes are confidently known (Dyer et al., 1992).

50
2.16.3 Goal Programming (GP)
2.16.3.1 History. “Man is a goal seeking animal. His life only has meaning
if he is reaching out and striving for his goals” Aristotle 384-322 BC. This quote
shows that goal oriented behavior and decision making process has a long
history. This goal focused philosophy has been formalized in contemporary fields
such as engineering and sciences by goal programming techniques.
Goal programming was first used in the executive compensation at
General Electric in the 1950s. During those times, the term constrained
regression was used and the model was a variation of linear programming
method. Ignizio (1976) brought the technique to operations research. This led to
several reports in literature concerning its increased applications from the mid-
1970s onwards.
2.16.3.2 Definition of Goal Programming. When faced with a problem
which has multiple objectives, goal programming is one of the techniques that
can be used in such situations for solving MCDM and MODM problems by finding
a set of satisfying solutions (Hassan & Loon, 2012; Iglizio & Romero, 2003;
Wiston, 2007). It is used in general engineering designs and processes to find
compromised solutions which will simultaneously satisfy a number of design
goals (Deb, 1998). In attaining goal programming problem solution, classical
methods reduce the multiple goal achievement problems into a single objective
function of minimizing a weighted sum of deviations from goals. It is based on
mathematical models and algorithms.
2.16.3.3 Objective of Goal Programming. The main objective of goal
programming is to find solutions that attain a predefined target for one or more

51
criterion function. If no solution exists which achieves targets in all criterion
functions, then the task is to find solutions which minimize deviations from targets
(Deb, 1998). In goal programming, the aim is to find a valuable, realistic,
implementable, and feasible solution rather than one that satisfies
mathematician’s desire for global community (Ignizio & Romero, 2003). This
alludes to satisficing. In fact, two concepts that differentiate goal programming
from other conventional or single objective methods of optimization are the
inclusion of flexibility in constraint functions and close adherence to ‘satisficing’
principle rather than optimizing.
2.16.3.4 Approach to Goal Programming. Goal programming
establishes a specific numerical goal for each of the objectives, formulates an
objective function for each of the objectives, and then seeks a solution that
minimizes the weighted sum of deviations of the objective functions from their
respective goals.
Three types of goals are here:
A lower, one sided goal which sets a lower boundary not to fall under but going above it is permitted.
An upper, one sided goal which sets an upper boundary not to exceed but falling under the boundary is permitted.
A two sided goal sets a specific target you do not want to miss on either side.
Overall, goal programming can be grouped according to the type of
mathematical program model, e.g., linear programming, integer programming,
and non-linear programming that fits it best. Another grouping is according to
how the goals compare in levels of importance. In the non-preemptive goal
programming, all goals are of approximately comparable in importance. In

52
another type called pre-emptive goal programming, a hierarchy of priority levels
for goals exists so that the goals of primary importance receive first priority, those
of secondary importance receive secondary priority and so on.
2.16.3.5 Strength. Goal programming’s strengths are that it is satisficing
and based on mathematical procedures and algorithms.
2.16.3.6 Weakness. Users of goal programming need to know the
mathematical procedures and algorithms. It requires the user to specify a set of
weights signifying the relative importance of each criterion. This makes the
method more subjective. The weighted approach may have difficulty finding
solutions in problems that have curvilinear feasible decision spaces.
2.16.4 Utility Theory (UT)
This technique is based on the utilitarian theory that states that the value
of a system can be reduced to a single entity. According to the theory, all moral
decisions should attempt to maximize the total amount of utility hence the
numerical representation of value (Wallenius et al., 2008). Numerically
represented values or utilities are easy to use in decision making. The decision
rule is to select the alternative which has the highest utility. However, this rule
cannot be directly applied if there are more than two alternatives with maximum
value. The rule is also based on satisficing theory which states that you choose
the alternative that has sufficient utility.
UT was developed to fill in the gaps that other alternative multi-criteria
decision techniques do not adequately capture, especially the risks associated
with decisions relative to the decision makers risk tolerance level. Common
deterministic methods of comparing alternatives such as net present value and

53
cost benefit analysis generally are not set up to consider risk or uncertainty in
their analysis (Chastian, 2010). Thus, if a decision maker is aware of risk and
does not include it in the analysis process, then the strength of the final decision
may be less (Chastian, 2010).
UT assumes that the goal of the decision making team is to maximize a
utility or value function that depends on specific criteria or attributes. Where
uncertainty exists, the problem is typically to maximize the expected value of a
utility function (Wallenius et al., 2008). According to Katsikopoulous and
Gigerenzer (2008), the assumptions of expected utility theory are:
Independent variations: every option has a value that is measured by a single number, i.e., alternatives are not evaluated in comparison to other alternatives.
Trade-offs which state that in order to determine an alternative’s true value, low values on one attribute such as value can be compensated by high values on another attribute such as probability.
2.16.4.1 Multiple Attribute Utility Theory (MAUT). Multiple attribute
utility theory can sometimes be classified under MCDM. It can be treated
separately when risks or uncertainties have a significant role in the definition and
assessment of alternatives. MAUT encompasses a large body of engineering
mathematical theories for utility models and techniques. The role of the value
function differentiates MAUT from MCDM. If value function is made explicit, then
the method is MAUT. However, if value function is implicitly stated, i.e., assumed
to be existing but in actuality unknown, then the method is classified as MCDM
(Wallenius et al., 2008).
In using utility function in decision making, MAUT converts the different
criteria, e.g., cost, risks, and stakeholder’s level of acceptance, into one common

54
dimensionless scale of utility, usually between 0 and 1. Utility functions for each
criteria convert units into the 0-1 utility scale and are combined with weighting
functions within the overall decision to form a decision score for each alternative
(Kiker et al., 2005).
MAUT is based on the assumptions that the team of decision makers is
rational, i.e., getting more utility is preferred to less, that preferences do not
usually change over time, that the team has perfect knowledge of all the
variables under consideration, and that they are consistent in judgment. The
objective of the team is to achieve high utility or value from the variables being
considered (Kiker et al., 2005).
2.15.3.2 Strength. A major strength of UT is its ability to capture risks in
the decision making processes, i.e., it is able to treat uncertainties that may arise
in decisions among given alternatives. Also, it is supported by strong
mathematical models or methods.
2.15.3.3 Weakness. The assumption of a rational being in decision
making is somewhat impractical. This can be attributed to the fact that
preferences change as a function of time in the real world.
2.16.5 Weighted Sum Method (WSM)
This MCDM is the first decision making method used. Typically, it is used
when the units of measurement are the same. The score of an alternative is the
weighted sum of the evaluation ratings of the alternative where the weights are
usually the importance weights associated with the attributes (Triantaphyllou et
al., 1998).
55
In multi objective optimization, the decision making team consider multiple
objectives before arriving at a decision. Since it is not possible to simultaneously
optimize for all objectives, each objective is given a positive weight by
importance and the decision is arrived at by optimizing a weighted sum of
objectives (Hu & Mehrotra, 2011). An optimal solution in a weighted sum function
is a Pareto optimal and non-dominant solution, which implies that the solution is
not highly dominated by any other solution (Hu & Mehistra, 2011). The higher the
weights, the better a criterion is and the criterion is assumed to be in relation to
other criterion weights based on their importance (Sarika, 2012).
2.16.5.1 Strength. It is the easiest to use and is the most widely used
MCDM.
2.16.5.2 Weakness. Difficulty arises where it is applied in multiple-
dimensional decision making problems requiring robust solutions (Matteo, 2012).
2.16.6 Weighted Product Method (WPM)
This MCDM is a modification of the weighted sum method and has been
developed to overcome the weakness of WSM. The major difference between
WPM and WSM is that multiplication is used instead of sum. The score of an
alternative is equal to the sum of the performance of an alternative under each
criterion multiplied by the relative weight assigned to that criterion. The
alternative with the optimal score represents the optimal choice based on the
calculation of the worth of the alternative (Sarika, 2012). WPM can also be
referred to as dimensionless analysis, i.e., its structure eliminates any units of
measurement.
56
2.16.6.1 Strength. Instead of using actual measures, it utilizes relative
measures (Triantaphyllou et al., 1998). The elimination of units of measure
makes it user friendly.
2.16.6.2 Weakness. The simplistic nature of WPM may not allow it to
incorporate uncertainties in making best decisions about alternatives developed
in a typical VE process.
2.16.7 Analytical Hierarchy Process (AHP)
This MCDM was invented by Saaty (1980, 1983, 1990, & 1994). Expert
Choice introduced in 1990 has resulted in its wide acceptance in value decision
making (Saaty, 1994). AHP approach gives a comprehensive and coherent
framework to structure decision problems by representing and quantifying
elements, relating those elements to overall goals, and evaluating alternative
solutions (Kunz, 2010). Specifically, it is a structured approach for dealing with
complex decisions based on mathematical and psychological principles where it
decomposes complex MCDM problems into a system of hierarchies (Kunz,
2010). It is based on pair-wise comparisons, use of ratio scales in preference
judgments, and Eigen vector methods (Triantaphyllou & Mann, 1995).
The analytical hierarchy process permits inconsistencies in judgments
and provides avenues to reduce inconsistencies in decision making. The process
begins with development of alternative options, specifications of values and
criteria, and concludes with evaluation and recommendation of options (Farkas,
2010). The structure consists of three levels. Goals are set at the top level,
followed by criteria at the second level and alternatives at the third level. Figure
2-6 shows the arrangement. AHP’s structure makes it possible to critique the

57
importance of the elements in a given level while comparing them with other
elements in the adjacent levels. Noteworthy is that most of the creativity task in
decision making is in deciding what to include in the hierarchy structure or
hierarchy (Farkas, 2010).
The main aim of AHP is to help decision making team in organizing ideas,
judgments, and evaluations in order to make more useful decisions (Kunz, 2010).
It operates by developing alternatives and criteria used to evaluate or decide on
the alternatives. Priorities are derived based on the pair-wise assessments using
expert judgments or ratio measurement scales. A weighting and summing
approach is used to get total or overall priorities for the alternatives based on
their contributions to the goals (Kunz, 2010).
2.16.7.1 Strength. AHP utilizes relative values instead of actual values,
similar to WSM. AHP can be used in both single and multi-dimensional decision
making scenarios. MAUT and AHP are optimization approaches to decision
making. They utilize numerical scores to convey the importance of one
alternative in comparison to others on the same scale. Scores are developed
from the performance of alternatives with respect to an individual criterion and
then summed up into an overall total score (Kiker et al., 2005). Lastly, AHP is
based on the premise that people are more capable of making relative judgments
than fixed judgments. So judgment is more relaxed in AHP than MAUT.
2.16.7.2 Weakness. Stakeholder requirements for value are often treated
as one attribute among others such as reduction of cost or risk (Kiker et al.,
2005). It would be better to have all values as required. AHP has been criticized
on the way pair-wise comparisons are used and in the way alternatives are

58
evaluated (Kunz, 2010). Rank reversal may occur in AHP. Belton and Gear
observed that reverse ranking of alternatives may occur in AHP when an
alternative identical to an already existing one is introduced in the decision
making model (Belton & Gear, 1983).
2.16.8 ELECTRE Method
The word ELECTRE stands for Elimination and Choice Translating
Reality, as translated from French (Benayoun et al., 1966). ELECTRE method
uses separate pair-wise comparisons of individual criterion among alternatives.
Alternatives are dominated if another alternative exists which exceeds the others
in one or more criteria and/or is equal in the remaining criteria.
ELECTRE method begins with pair-wise comparisons of alternatives
under each criterion. Next, the decision maker assigns weights or importance
factors to the criteria do as to determine their relative importance (Triantaphyllou
et al., 1998). With a string of repeated assessments of ranking relationships
among alternatives, ELECTRE elicits a concordance index, i.e., the amount of
evidence to support the conclusion that one alternative outranks the other.
2.16.8.1 Strength. The ELECTRE method has an express view of all the
alternatives in the decision model by eliminating less preferred alternatives
(Triantaphyllou et al., 1998).
2.16.8.2 Weakness. The ELECTRE method at times may be unable to
identify the preferred alternative after evaluations. It may only produce leading
alternatives which can be problematic when making sound decisions.

59
2.16.9 Choosing by Advantages (CBA)
2.16.9.1 Overview. Choosing by Advantages (CBA) is a decision making
process not an individual method, i.e., it is a collection of methods which are
grouped together by a set of definitions, principles, and a model, which is a
distinct difference from the other decision methods reviewed here.
The CBA decision method deliberately identifies only the advantages of
alternatives rather than both the advantages and disadvantages. This is to avoid
double (or multiple) counting, omissions, and complications from negative values.
The major short coming is that cost is not included in the decision framework
(Grant & Jones, 2008). The evaluation phase of the conventional VE process
utilizes both advantages and disadvantages of alternative building systems to
select best alternatives (ASTM E1699-10). This makes CBA significantly different
from conventional VE process.
CBA is also called reality based decision making, congruent decision
making, effective decision making, integrity-based decision making, and
successful decision making system or method (Adams, 2004). It creates a
distinction between sound and unsound decision making systems.
CBA is called a sound decision making system because it uses well
defined vocabulary to ensure clarity in decision-making (Parrish & Tommelein,
2009). It is also called a sound decision making approach because of its
sequential process. This process includes method-decision-action-outcome. As
pointed out by Suhr, the sequence is based on the logical premise that sound
decision making methods will produce sound decisions more frequently than
unsound methods (Suhr, 1999). It follows that sound decisions will usually result

60
in better actions. Finally, better actions will ultimately yield better results or
outcomes. This means that the genesis of bad results or outcomes is the use of
unsound methods in decision making. Therefore, CBA is considered a sound
decision-making system or method.
2.16.9.2 CBA vocabulary. CBA uses five specific terms, namely,
alternatives, attribute, advantage, factor, and criterion. According to Arroyo et al.
(2012) and Suhr (2009), the following are the definitions of the terms:
Alternatives: are two or more construction materials, methods, techniques, building design or construction systems from which only one must be chosen.
Attribute: refers to a characteristic, quality or consequence of one alternative, e.g., construction methods or materials.
Advantage: refers to a beneficial difference between attributes of two alternatives.
Factor: refers to an element, part or component of a decision, which in a conventional VE process would be called a performance criterion. Factor is the container for criteria, attributes, advantages. In a sound decision making process, factors are not developed before the alternatives are developed.
Criterion: refers to a decision rule or a guideline. Conventional VE process would call this a design standard or program requirement which guides decision making. A ‘must’ criterion represent conditions which each alternative must satisfy while a ‘want’ criterion represent preferences of one or multiple decision-makers.
Overall, it is important to indentify or determine the factors which will
produce significant positive differences among alternatives and not which factors
will be important in decisions (Adams, 2004; Suhr, 2003). This is because CBA is
based on advantages.

61
2.16.9.3 Principles of CBA. CBA is based on four main principles, also
called the basic principles of sound decision making. According to Suhr (1999, p.
4), the CBA principles include:
The fundamental rule of sound decision making: States that decision made must be based on the importance of advantages. The advantages are the positive differences between attributes of two alternatives.
The foundation principle of sound decision making (method principle): States that decision made must be based on the importance of the differences among the given alternatives. Notably, different types of decisions require different methods of decision making and a method that is suitably sound for one maybe unsound for the other.
The principle of anchoring. Decisions made must be based on relevant facts, i.e., decisions made must be anchored to relevant facts.
The pivotal or critically important sound decision making principle or the cornerstone principle: Decision makers must learn and skillfully use sound methods of decision making if they want to consistently make sound decisions. Notably, sound decisions must never assign numerical weights to factors, which are often labeled as criteria.
According to the fundamental rule of sound decision making, decisions
must be made based only on advantages and not both advantages and
disadvantages. Usually, a disadvantage of one alternative will be an advantage
of another alternative in the same evaluation plan. So listing both advantages
and disadvantages or pros and cons will lead to an unsound decision making
approach which is characterized by double or multiple counting factors,
omissions, distortions, and confusion (Adams, 2003). Finding the advantages
paves the way for the next step which is finding the importance of the
advantages through the comparison of the advantages. CBA does not compare
factors or performance criteria as in the WPM approach. The CBA weighting
process is focused only on the advantages and not criteria, attributes or other
types of data. CBA is based on the premise of comparing system’s alternatives

62
based on the importance of advantages of alternatives (Adams, 2003; Arroyo et
al., 2012; Suhr, 1999).
2.16.9.4 CBA models and methods. The CBA method is based on a
cause-effect model, generalizing-specifying model, and sound decision-making
model. These models assist in producing better results.
CBA has two principal variations, one for simple decisions and one for
complex decisions. For simple decisions, a tabular two-list or instant CBA
approach is used. There are special methods for complex and very complex
decisions such as monetary decisions. Figure 2-7 shows the typical structure of a
CBA model.
In CBA, the following sequential process is used (Adams, 2004):
Identification of alternatives: The team identifies all the possible alternatives based on the requirements of the owner and the analysis of functions.
Identification of factors: The choice of factors is based on the areas where the team finds significant differences among alternatives. The factors are not developed prior to the alternatives being developed. Noteworthy, it is important that the team collects as many pieces of information as possible about the alternatives.
Summarizing the attributes: The attributes for each of the factors are summarized. The attributes are sometimes measurable quantitatively while sometimes they are not. The unique and important characteristic of CBA method is that it can accommodate both quantitative and qualitative attributes.
Deciding the advantages: The team underlines the least preferred attribute. Thereafter, the positive differences between the least preferred and other attributes is recorded for each factor.
Establishing an importance scale: The team circles the most preferred advantage for each factor and then chooses the paramount advantage, i.e., one of the most preferred advantages. This advantage is assigned the highest quantitative measure, e.g., 50, 100 or 200.

63
Deciding the importance of each advantage: The team rates each circled advantage against the paramount advantage. For example, an evaluation of 95 would mean that that advantage is 95% as important as the paramount advantage. The evaluators then complete deciding importance ratings for each of the circled advantages and then proceed to assign importance ratings for all other un-circled advantages.
Some important ideas can be noted. First, the judgments are subjective. CBA has the potential of incorporating both quantitative and qualitative metrics in equal proportion. Second, the importance of each advantage is measured against one paramount advantage. Third, there is a tendency to interpret the results to imply that one factor is more important than the other. This is WPM thinking. It is the importance of the advantages of one alternative over another that is being compared in CBA.
Choosing the preferred alternative: Sum the importance numbers for each alternative. The largest total sum is the preferred alternative and this value is double underlined to distinguish it from the rest of the alternatives.
The CBA process above is intended for decisions where alternatives have
equal cost or where cost is not considered. CBA has advanced and complex
procedures for situations when costs are unequal or where costs are considered.
In essence, the advanced CBA process proceeds from where the total
importance points have been computed for each alternative.
2.16.9.5 Choosing by advantages for decisions including cost. This
version of CBA is used when alternatives have unequal costs. The cost decision
is made after the evaluations have been completed and the total importance of
advantages have been determined. CBA utilizes the total importance of
advantages against alternatives and costs in a graphical plot (Figure 2-8).
From the left side, if the slope of the line representing the increment is
nearly vertical, then the alternative on the left is easily excluded. From the right
side, if the slope of the line representing the increment is negative, horizontal or
nearly horizontal, then the alternative on the right is easily excluded. Therefore,
in Figure 2-8, both A0 and A3 will be excluded. When all the easy to exclude

64
alternatives have been eliminated, there will be only one remaining, i.e., A2, as
the preferred alternative.
2.16.9.6 Steps of the CBA process. According to Suhr (2009), there are
five recommended steps in the CBA process:
Learn just one set of CBA definitions, principles, models, and methods at a time.
Unlearn or learn to not use the corresponding unsound concepts and methods that the CBA concepts and methods are replacing.
Relearn the CBA concepts and methods.
Practice and consistently use the CBA concepts and methods that you have learnt so far.
Teach the CBA concepts and methods to other people. This will benefit you and them. Then return to step 1 and learn more consistently.
2.16.9.7 CBA and value engineering methodology. The conventional
value analysis based approaches use weights and scores to make a model of
decision makers’ preferences in the form of a value function. CBA requires
decision-makers to identify the advantages of alternatives prior to constructing
their preferences (Arroyo et al., 2012). CBA refers to cost as a priority. It does not
use the term value or performance at a given cost. The sum of importance
scores for a given alternative is called total importance scores.
In relation to the VE job plan (ASTM E1699-10), CBA points out certain
unsound decision making practices. These include:
Determining evaluation criteria in the information or pre-study phase and using them during the evaluation phase.
Ranking and rating of alternatives using both advantages and disadvantages of alternatives, use of pair-wise comparisons, and weighted analysis approaches. There is considerable over-emphasis on minor advantages and considerable under-emphasis of the major advantages among alternatives in the decision process (Adams, 2004). In the real

65
world, the advantages and disadvantages of systems generally have an equal measure of importance.
Ranking and rating of alternatives developed during the development phase.
In contrast, as discussed earlier, CBA determines the importance of
advantages after the alternatives have been determined and their advantages
identified. CBA also uses strategies other than weighted factors to select among
alternatives. Specifically, the shortcoming of weighting factors or criteria is that
they are expressed in abstract terms which require the team to provide details to
fill in gaps caused by missing information that will allow them to arrive at a
weighted judgment. Such an outcome is an unanchored judgment and not based
on facts and therefore multi-criteria decision processes are unsound decision
making approaches (Adams, 2003).
CBA would change some of the phases of the VE process. In the pre-
workshop phase, CBA does not identify evaluation criteria and recommend
preparation of cost and worth models because unanchored judgments are
unsound. There should be no discussion of factors in this phase because the
alternatives have not been developed yet. In the information phase, CBA process
does not recommend identification of evaluation criteria or weighting of criteria
using paired comparisons. At this level, alternatives have not been developed
yet. CBA would change the evaluation phase because only advantages would be
discussed. Team members use CBA to choose the most preferred alternative or
alternatives. In the development phase, the selection of preferred alternative is
considered and if required, additional factors or alternatives may be generated.
Reconsideration is an additional part of CBA which is intended to assure the

66
congruity and effectiveness of the decision. CBA does not impact the function
analysis and creative phase of the VE job plan (Adams, 2003).
2.16.9.8 Advantages of CBA in value engineering. There are specific
important advantages of CBA decision making method when used in VE (Adams,
2004; Suhr, 2009):
CBA is simpler and for some types of decisions, CBA enhances interpersonal relationships and produces happier people.
CBA can result in relatively better decisions and better decisions usually generate relatively better outcomes.
CBA can result in correct and sound decisions which can manifest in better resource allocations in projects.
CBA can result in higher levels of job satisfaction, less conflict, and less stress levels because decisions are satisfying.
Overall, sound decisions are more likely to be accepted and implemented.
2.16.10 Neuro-Linguistic Programming (NLP)
2.16.10.1 Overview. Neuro-Linguistic Programming (NLP) was initiated by
Richard Bandler and John Grinder in the 1970s in the discipline of human
behavior, communication, and change (Bandler & Grinder, 1982). It is considered
a powerful approach to communication, change, and excellent performance
(Smart, 2006). NLP refers to the nervous system or neuro, i.e., the brain, the five
senses, and the happenings in our minds; linguistic, i.e., verbal and non verbal
communications; and programming, i.e., the ability to organize our neurology and
linguistic patterns or developments to arrive at preferred results or outcomes
(Burn, 2005). NLP is based on the premise that no one has the exact same
reality map of the world and an effective team can utilize the understanding of

67
their different realities to improve their communication and produce better results
in the quickest, most effective and fun way (Beale, 2012).
2.16.10.2 Presuppositions of NLP. There are about nine presuppositions
of NLP. Each is unique and important to NLP and to overall understanding.
According to Adams (2004) and Burn (2005), the presuppositions are:
The map is not the territory, i.e., a person’s mental map of the world is different from the other. Practicing NLP involves changing the map and not reality.
Experience has a structure. Different people have different levels of experience.
The mind and the body are under the same system. If you affect one, you affect the other.
If one person can do something, anyone can learn to do it and even better.
People already have all the resources they need to achieve what they want.
You cannot not communicate.
The meaning coming out of your communication is the response you will get. People will respond to what they think you mean from your communication, which can be an accurate or inaccurate interpretation of your intended meaning. Therefore, communication includes both verbal and non-verbal signs.
Every behavior has a positive intention.
If what you are doing is not working, do something else.
2.16.10.3 NLP modeling. The modeling process of NLP requires
systematical coding and transferring behaviors or attitudes and strategies from
one person to another. It is based on the premise of emulating characteristics
that successful people have shown in order to get results in specific areas, i.e.,
combining both logical and intuitive approaches (Beale, 2012). In essence, NLP

68
modeling is a exclusive approach to identify and replicate unconscious skills of
naturally talented excellent performers then teaching others.
The modeling process involves building physical rapport, i.e., mirroring
and matching, posture, movement, speed, but not mimicking, and verbal rapport
through representational systems, e.g., visual/sight, auditory/sound,
kinesthetic/touch, olfactory/smell, and gustatory/taste. Verbal rapport manifests in
phrases which are visual, e.g., I can see what you mean or the building system
looks good, auditory, e.g., loud and clear or unheard of, kinesthetic, e.g., I can
grasp the idea or I will get in touch with you soon, olfactory and gustatory, e.g., a
sweet person or that is bitter sweet. Noteworthy, the knowledge of a team
member’s meta-program is important in NLP as it aids in understanding
preferences which help in building team rapport and effective communication.
In executing the NLP modeling process, certain words need to be used
with caution (Burn, 2005):
But: This negates everything before it. Instead use, “and next time, or let’s…”
Should: This creates an instruction and a sense of guilt.
Don’t: This leads the brain to associate with the negative aspect first before getting to hear the real message, e.g., “don’t think about the project yet.” Instead encourage the listener to think about the project first, in order to stop thinking about it.
Try: This carries the expectation that you may fail to do something.
Why: This implies that you need to justify something. Alternatively use how?
2.16.10.4 Key principles of NLP. According to Strong (2006) and Burn
(2005), the NLP method is based on four fundamental principles which are
unique and are the success factors of NLP:

69
Know the outcome or direction or mission: The main focus of NLP is what is desired in the end. The human nervous system is goal seeking and people tend to focus on what they want. One of the principles of NLP is to understand the goals or outcomes. Having clear intentions helps in creating the outcome desired. These may include what is to be improved or which aspects of work are to be improved. It may also prompt an individual to look for ways to improve communication with others. These thoughts are important when exploring NLP principles. Having clear outcomes ensures greater focus on thoughts and subsequently ensures effective communication. It assists in making decisions that are right. Setting outcomes involves taking time to consider the goal. The SMART (Specific, Measurable, Achievable, Realistic, and within Time frame) goal setting strategy provides clear focus with an agreed time frame. In addition to SMART goal setting, well structured NLP process can produce a well-informed outcome. This is because it employs SCORE model from DeLozier and Dilts (Smith, 2008). SCORE resolves issues in relation to achieving goals and moving from difficult or challenging situations to the required goal. Symptoms are problem states or what needs to be changed in the current problem state; Causes are where the problem comes from; Outcomes are the wants or goals; Resources are the requirements to solve the problem such as tools, skills, and beliefs; and Effects are the longer term effects of the achieving the outcomes.
Capture the attention of the unconscious mind (rapport): “The map is not the territory’’. One must start from where the person to be influenced is located presently and develop from there. Rapport is the ability to capture the attention and trust of the unconscious mind. Noteworthy is that it is important to get rapport with oneself first, i.e., feeling at ease with your actions before building rapport in conversations and in subsequent interactions with others. In these, body language, speed or pace of communication and creating an understanding of situations from other people’s perspective is imperative. Rapport is vital for efficient communication and requires mutual respect between people and is often achieved naturally. It involves showing genuine interest, observing how a person reacts to what another says, the actions, body language, and identifying key words or phrases used.
Know whether you’re getting the required outcome (sensory acuity): There is need to evaluate the validity and reliability of the outcome once the outcome is achieved, known or quantified. Sensory acuity, i.e., vision and sight, hearing and sound, feelings and touch, smell and aroma, and taste, refers to the ability to notice that the outcome is as expected.
Adjust what you are doing accordingly (behavioral flexibility): It is said that insanity is doing the same thing repeatedly while expecting a different result. The implication is that when not getting the expected outcome, it is prudent to be flexible enough to change the strategy. Intelligence constitutes having a fixed goal and being flexible on how to achieve the

70
desired goal. It is not necessarily the person that exercises the most influence or the most brute force but the most flexible that becomes more successful. This includes being flexible in the approach to situations, to create new perspectives, and understanding the differences in interpretations of situations among people. Therefore, flexibility is about acknowledging the differences in interpretation of situations through different perceptions, thereby creating your own reality. Also, flexibility is about selecting from many alternatives. Being flexible allows information gathering from a variety of sources, from different perspectives, and from different points of view.
2.16.10.5 Steps in NLP. According to Beale (2012), NLP method has
eight important steps which are followed in sequence:
Beginning frame: It is important that a team work on same map to avoid misunderstandings which may culminate in failure. NLP questions and draw attention to assumptions and expectations.
State: It is beneficial to have appropriate mood through physical change and mental preparation when working with a team. In NLP, people recognize their own habits and the effects their habits may have on others they interact with.
Outcome: NLP trains people to phrase their outcomes in the most exciting and genuine terms. In NLP, goals can be articulated in sensory terms. This ensures that the goal is grounded in the physical world, has emotional resources, and sets the direction which is motivating and rewarding.
Rapport: An honest connection and open communication between two or more people. Rapport in NLP is shown by matching and mirroring, i.e., people that click well with one another begins to display similar postures, gestures, and language trails.
Current strategy: This is the understanding of what is currently done in order to reach the required goal.
Techniques or tasks: This states the requirements to be fulfilled so as to reach the desired goal.
Future pace: Exercise that connects to the real world to bring about the desired action.
End frame: This is the concluding and closing interaction to issues raised at the beginning frame. It is where the desired goal has been reached.

71
2.16.10.6 NLP and the value engineering process. NLP can be an
important tool to improve creativity in VE process (Elder & Elder, 1998). This tool
can be used to enhance understanding, develop new ideas, and for effective VE
team communication. In essence, it is a method of representing mental
processes of excellence and how they translate into observable results. It utilizes
five creative elements, namely, fluency, flexibility, originality, awareness, and
drive to develop positive results. In a typical VE study, this could improve the
team leader’s and member’s interactions.
Barlow (1999) held that ideas are best created when not judged at first.
When ideas are allowed to flow out easily without being immediately judged for a
longer period of time and then judged later on, the result is a large volume of
ideas available for use which may provide greater value towards the final goal.
This creativity revolves around better communication and an improved thinking
process. In VE, creativity manifests in thinking about value rather than cost,
thinking about function rather than action, and thinking about creativity rather
than judgment (Barlow, 1999).
The NLP strategy can be used by the VE team to create rapport, e.g.,
mutual trust between leader and team and to gain access to maximum team
creative abilities, thereby realizing better outcomes. Specifically, the process can
provide powerful ways to stimulate free thinking and greater creativity by turning
problems into signals and signals into language and communication of the target
creation (Elder & Elder, 1998). NLP states that the way people communicate with
others will determine the kind of response they receive. Therefore, creativity in

72
VE is at its best when communication is clear and effective and with appropriate
feedback.
An effective VE team leader needs to possess excellent communication
skills and have a good understanding of how language may affect human
behavior. The team leader should maintain interpersonal flexibility and an open
mind when dealing with VE team members. The team leader should also create
good rapport with team members. Building rapport comes from respecting each
other’s points of view while still being true to the main objectives. Rapport is
effective when there is a smooth flow of the VE study characterized by
interpersonal enthusiasm and well-being.
Overall, learning a new strategy of communication through the use of NLP
can help improve language skills, build team rapport, and improve the idea
creation in VE. Improved team leader effectiveness will lead to better VE study
outcomes.
2.16.10.7 Benefits of NLP intervention. The benefits of using NLP
method are:
Helps users to control their state of minds when working towards a goal.
Users can develop powerful persuasive communication skills.
It can significantly help users arrive at the outcome they need.
Users can have more success, happier, joyous, and experience more fulfillments in life.
Users can learn the tools or avenues of freedom.
Helps users define and solve their problems. NLP techniques can assist users in becoming aware of their reactions that they are anchoring in other people and in themselves. Then they can control the anchoring so that it best serves them and their goals.

73
NLP would be used in the creative phase of VE. It will enhance team effort
towards superior creation of ideas. Such creative ideas in VE may include efforts
to include better green features in building construction or incorporating favorable
sustainability rating tools used in measuring building sustainability outcomes.
Selecting building systems or materials that are environmentally friendly
can be a difficult task. It requires the use of suitable green building rating tools
which must be chosen appropriately to help in selecting better alternatives.
2.17 Building Sustainability Rating Tools
This section reviews popular green building rating systems that can be
used to measure sustainability outcomes. Specifically, the rating tools would be
useful in building performance evaluation and in overall decision making for
green buildings.
2.17.1 Overview
A wide range of rating tools exists for rating building sustainability. There
are a multitude of tools and certification systems available (Hirigoyen et al.,
2008). As of March 2010, about 382 registered building software tools were
available for use in evaluating or quantifying building energy efficiency,
renewable energy, and building sustainability (Nguyen, 2011). However, few of
these tools are widely acknowledged and recognized for setting standards for
sustainable building design and construction (Nguyen & Altan, 2011).
Examples of sustainable building rating systems include the Building
Research Establishment Environmental Assessment Method (BREEAM),
Leadership in Energy and Environmental Design (LEED), Comprehensive
Assessment System for Built Environmental Efficiency (CASBEE), Green
74
Building Tool (GB Tool), Green Star, German Sustainable Building Certification
(DGNB), Green Mark, Green Globes, and Hong Kong Building Environmental
Assessment Method (HK BEAM). These systems are considered the most
popular, highly influential, and more technically advanced assessment methods
available (Nguyen, 2011). Some of them have gained international recognition in
evaluating or rating sustainable buildings. Their use generally requires various
levels of specialized knowledge in building sustainable design so that they can
be used effectively in achieving high quality and low environmental impact
buildings (Fowler & Rauch, 2006).
Generally, the goals for rating systems are to alleviate the negative life
cycle impacts of buildings on the environment, enable buildings to be recognized
according to their environmental benefits, provide a realistic environmental label
for buildings, and increase the needs for sustainable buildings (Neama &
Shaban, 2012; Vickers, 2001). These are the main reasons which influence
building owners to pursue green.
Building rating systems have been developed to meet certain principles
(Neama & Shaban, 2012):
Ensuring environmental and building quality through use of complete measures of environmental impacts.
Using quantifiable measures to determine environmental and building quality.
Using best available science and best practice as the basis for quantifying and calibrating effective performance standards for defining environmental and building quality.
Identifying the social and economic benefits of meeting the environmental and building objectives.

75
Providing a common framework of assessment that is tailored to meet the local context including local regulation, climate, and building practices.
In addition to meeting the above principles and aims, different individuals
have different motives for using building rating systems. Developers and the
building industry use rating systems to gain credit for investing in sustainable
building materials and practices, government and civic activists use building
rating systems to regulate and encourage sustainable practices, and consumers
use rating systems to compare different building products (Abramson, 2013).
Meeting these objectives requires the use of the best rating system so as to
achieve the best building sustainability outcome. Comparing rating systems can
determine which rating system would be best for a given use and to understand
the relationship among different rating systems including their contextual usages
such as geography, climate, and economy.
The following sustainable building rating tools or systems were compared
and their distinguishing characteristics identified. Such comparisons may
influence the choice of a rating tool depending on the owner’s requirements,
aims, and geographical location of the building under study.
2.17.2 Building Research Establishment Environmental Assessment Method (BREEAM)
This is one of the earliest and most extensively used environmental
assessment methods for building systems (Nguyen, 2011). It was first developed
in 1990 in the United Kingdom where it has been used extensively and with
annual updates; it is used infrequently in the USA (Fowler & Rauch, 2006). It is
considered the building environmental assessment system with the longest track
record. Versions include BREEAM Design and Procurement (D&P), Post

76
Construction Review (PCR), Fit out Assessment, and Management and
Operation (M&O). Ratings in BREEAM are: outstanding (85 and above),
excellent (70 - 84), very good (55 - 69), good (45 - 54), pass (30 - 44), and
unclassified (less than 30).
BREEAM areas of assessment include: energy, i.e., operation energy and
CO2; management ,i.e., management policies, commissions, site managements,
and procurement; transport, i.e., transport related CO2; materials, i.e., impacts of
building materials including life cycle impacts and CO2; water, i.e., water
consumption and efficiency both inside and outside of the building; waste, i.e.,
construction resource efficiency and operational waste management and
minimization; ecology, i.e., ecological value, conservation and enhancement of
building site; pollution, i.e., external air and water pollution; and land use, i.e.,
type of site and building footprint.
2.17.3 Comprehensive Assessment System for Built Environmental Efficiency (CASBEE)
This building sustainability assessment or rating system, available in
English and Japanese, was developed in Japan for the Japanese building
market. It was developed as a result of the collaboration of academia, industrial,
and governmental initiatives in forming the Japanese Sustainable Building
Consortium (JSBC). It is a system not yet officially tested for use in the USA
(Fowler & Rauch, 2006).
There seems to be no exact date of first creation of this assessment tool
because literature shows that it was developed between the years 2001-2004.
Kawazu et al. (2005) reported it being developed in the year 2004 while Fowler
and Rauch (2006) documented it being created in the year 2001.

77
In spite of the inconsistencies in the dates of its development, the main
objective of CASBEE has been to raise awareness about the environmental
performance of buildings. It has presented a new concept for assessing
sustainable building that differentiates environmental load from the building
performance quality. By presenting these two factors on a graph, where
environmental load is in one axis and quality on the other axis (Figure 2-9),
CASBEE results are presented as a measure of eco-efficiency, also called
Building Environmental Efficiency (BEE). The best building will fall in the section
represented by lowest environmental load and highest quality level (Fowler &
Rauch, 2006).
Each criterion is scored or rated from level 1 to 5 where 1 denotes a rating
meeting minimum requirements, level 3 denotes a rating meeting typical
technical and social levels at the assessment time, and level 5 denotes a rating
meeting highest level of achievement (Fowler & Rauch, 2006).
The major principles in CASBEE are (Akimoto, 2010):
Consideration of the life cycle stages of buildings.
Two environmental aspects are calculated: environmental load (L) and quality of the building performance (Q).
BEE is the indicator and is based on an eco-efficiency concept where BEE is defined as Q (quality of building) divided by L (building environmental load). Thus, BEE is an indicator for achieving higher quality with lower environmental load through calculations of Q and L (Abramson, 2013; Akimoto, 2010).
CASBEE has four sustainable building assessment tools for pre-design,
new construction, renovation, and existing buildings. Figure 2-10 shows the
variations of the tools.
78
Tool 0 and Tool 1 would be useful to the construction professionals during
design and construction stage. Tool 2 and Tool 3 would be useful to owners after
the building is completed and submitted to the owners.
According to Fowler and Rauch (2006), CASBEE’s major criteria
categories are:
Building environmental quality and performance, defined by:
i) Q1: Indoor environment including noise, acoustics, thermal comfort, lighting and illumination, and air quality.
ii) Q2: Quality of services determined by functionality and usability, durability and reliability, flexibility, and adaptability.
iii) Q3: Outdoor environment onsite specifically preservation and creation of the biotope.
Building environmental loading defined by:
i) L1: Energy including thermal load, use of natural energy, efficiency of systems and their relative operations.
ii) L2: Resources and materials such as water conservation, recycled content, and material with low health risks.
iii) L3: Re-use and avoidance of chlorofluorocarbons (CFCs) and other risks.
Overall, certification according to CASBEE is based on the BEE score
(Q/L) whereby the more aggressive the BEE strategy is, the higher the points
awarded. This certification requires clear documentation of quantifiable
sustainable design achievements. These are assessed by trained architects who
have passed CASBEE examinations (Fowler & Rauch, 2006).
2.17.4 Green Mark
This building rating system was developed in 2005 by the Building and
Construction Authority (BCA) of Singapore and supported by the National
Environmental Agency. Its aim is to promote green building designs,

79
construction, and technologies that improve energy efficiencies and reduce
overall impact of buildings on environment (Keung, 2012).
The government of Singapore has supported its use in rating sustainable
buildings. Consequently, they have laid out plans to green at least 80% of the
total number of buildings in Singapore by the year 2030, thus popularizing its
usage worldwide which is shown by its adoption by more than 10 countries
(Keung, 2012).
Green Mark’s assessment areas include: energy efficiency, water
efficiency, environmental protection, indoor environmental quality, and other
green features and innovations. The building certification scales are: Green Mark
Certified (50 - 74), Green Mark Gold (75 - 84), Green Mark Gold Plus (85 - 89),
and Green Mark Platinum (90 and above). In Green Mark Platinum rating, a
building can achieve more than 30% energy savings compared to a building build
to codes (Green Building Master Plan, n.d.d.).
2.17.5 Green Globes
Green Globes evolved from BREEAM where it was developed as a web
based version combining both BREEAM Canada and Green Leaf. It is currently
competing with USGBC’s LEED rating system (Fowler & Rauch, 2006). It was
launched in 2000 by Green Building Initiative as an online building sustainability
rating tool designed for use by architects and builders in the construction
industry.
Variations include Green Globes for New Construction (NC) and Green
Globes for Continual Improvement of Existing Buildings (CIEB). Preliminary

80
building assessment may occur after conceptual design phase while final
assessment may occur after the construction document phase.
In the rating process, Green Globes applies a complete approach to
energy performance thus providing a comprehensive and precise assessment
approach to energy savings for new construction and existing buildings. Usually,
this can be achieved by using Energy Star to benchmark and rate energy
performance based on actual regionalized energy performance data. Energy
conservation is important in the Green Globes assessment systems, and
represents 38% of the total points accumulated in new constructions and 35% in
existing buildings (Komalirani, 2010).
Projects earn points and get rated from 1 to 4 Green Globes as shown in
Table 2-3. Green Globes major assessment categories include: project
management, site, energy, water, emissions, indoor environment, resource,
building materials, and solid waste (Fowler & Rauch, 2006).
2.17.6 Green Star
This sustainable building rating system is a voluntary system launched by
the Green Building Council of Australia (GBCA) in 2003 to evaluate the
environmental design and construction of Australian buildings (Driedger, 2009;
Nguyen & Altan, 2011). The system is based on a wide range of sustainable
building issues while also focusing on health of occupants, productivity, and cost
savings (Nguyen, 2011). The rating tool is partly based on LEED and BREEAM.
Variations include Green Star for education, Green Star for health care, Green
Star for retail centers, Green Star for mixed use, Green Star for conventional
centers, Green Star for multi-unit residential, and Green Star for offices.

81
Assessment areas are: management, indoor environmental quality,
energy, transport, water, materials, land use and ecology, emissions, and
innovations. Certification ratings in Green Star are not certified from 1 - 3 Stars, 4
Star certified for a score of 45 - 59 implying ‘best practice’ in sustainability, 5 Star
certified for a score of 60 - 74 implying ‘excellence’ in sustainability, and 6 Star
certified for a score of 75 - 100 implying ‘world leadership’ in sustainability.
2.17.7 Hong-Kong Building Environmental Assessment Method (HK BEAM)
This rating system was developed in 1996 in Hong Kong by Building
Environmental Assessment Method (BEAM). The aim was to promote voluntary
approaches that can be used to measure, improve, and label the environmental
performance of buildings on the basis of environmental sustainability (Nguyen &
Altan, 2011). The system rates sustainable buildings as fair, good, very good,
and excellent (Hirigoyen et al., (2008).
2.17.8 Green Building Tool (GB Tool)
GB Tool is an international flexible building rating system developed by
National Resources Canada under the auspices of the International Framework
Committee (IFC) for the Green Building Challenge (Fowler & Rauch, 2006;
Kawazu et al., 2005). The tool is used in evaluating US buildings for the Green
Building Challenge. It consists of two spreadsheets; one spreadsheet is for data
entry completed by the project team and the other is for establishing weights and
benchmarks and completing the building assessment by a third party sponsor or
assessor (Fowler & Rauch, 2006).
The assessment areas in Green Building Tool include:
Energy and resource consumption assessed through material use.

82
Environmental loadings which include greenhouse gas emissions, other atmospheric emissions, storm water, waste water, solid wastes, site impacts, and other local and regional impacts.
Indoor environmental quality assessed through indoor air quality, ventilation, temperature and relative humidity, daylight and illumination, noise, and acoustics.
Other criteria including appropriate site selection, project planning and development, urban design, building controls flexibility and adaptability, and functionality: long term and performance and socio-economic aspects.
A building can be scored a -1 if it is below typical sustainability practice, or
from +1 representing good performance to +5 representing very high level of
performance. All criteria in the evaluation or rating must be scored in order to
provide a complete building sustainability assessment.
2.17.9 Sustainable Building Tool (SB Tool or SB Method)
This green building rating system was created by Sustainable Building
Challenge (SBC) formerly the Green Building Challenge in 2007/2008 and
superseded the Green Building Challenge. It takes into account the embodied
energy of a building. The assessment areas are: site, indoor environmental
quality, socio-economic, and cultural perceptions. Its building acceptable
certifications are scaled as: -1 = 71% or below practice, 0 = 75% or acceptable
practice, +3 = 87% or good practice, and +5 = 95% or best practice.
2.17.10 German Sustainable Building Certification
This sustainable building assessment system was developed in 2009 by
the German Sustainable Building Council (DGNB) in collaboration with the
Federal Ministry of Transport, Building, and Urban Development. It is considered
to be one of the most extensive building certification processes worldwide and
was developed to assess building quality and/or environmental performance,

83
technology, and products available for sustainable buildings (Nelson & Rakau,
2010). The rating system takes into account varied building sustainability issues
such as cost and value issues, functionality, and commissioning.
The sustainability variations in DGNB include: ecological quality,
economical quality, socio-cultural and functional quality, technical quality, quality
of process, and quality of location. A building can be scored as: Bronze (50 -
64.9%), Silver (65 - 79.9%), and Gold (80% and above).
2.17.11 Leadership in Energy and Environmental Design (LEED)
The LEED rating system is a commonly referenced system in the United
States (OFEE, 2003; USGBC, 2013). It is a point based assessment system
developed and maintained by the USGBC to provide the means to measure
sustainability using universally accepted standards and methodologies and often
using cost and quantities as prime determinants (Matthiessen & Morris, 2004). It
is a sustainable building rating or assessment system not a building standard.
The rating system has been used as a performance measure to assess how
green or sustainable a building is (Pulaski, 2004). Its development by the
USGBC took four years. It was first piloted in 1998 with LEED version 1.0. LEED
V.2 (2000) had bronze as the lowest certification level. This lowest level was later
changed to ‘certified’ in LEED V.2.1 (2003). The latest update to the LEED rating
systems, LEED V.4 (2013), has raised the bar. Changes from the previous LEED
2009 are in three major areas: new market sectors, improved technical rigor, and
more streamlined services. The building certifications are according to the
number of LEED points attained. These are: Certified (40 - 49), Silver (50 - 59),
Gold (60 - 79), and Platinum (80 and above).

84
The LEED rating system is structured around categories which include
sustainable sites, water efficiency, energy and atmosphere, materials and
resources, indoor environmental quality, and innovation in design process
(USGBC, 2013). Its usage may require different decision support tools such as
energy simulation for the energy and atmosphere category for optimizing energy
performance. LEED is most efficient during identification and preparation stages
of a building project where it can be used to communicate environmental,
economic, health, and community benefits to owners of buildings, users and the
overall community (Mitchell, 2010).
Building to LEED standards implies following the LEED guidelines but not
necessarily going through the formal building certification process (Mitchell,
2010). US Army, Navy and Air Force have encouraged LEED certification
(Snavely, 2007). Twenty two US states have incorporated LEED certification.
Maryland requires that all projects greater than 5,000 square feet in the state
capital meet LEED certification. Also, state and local governments are
increasingly offering tax credit incentives to developers. For example, from 2005-
09, New York State gave out $25,000 in tax credits to firms involved in the
construction of green buildings (Snavely, 2007).
2.17.11.1 High performance buildings. High performance building is a
term synonymous to green building in the United States (Kibert, 2008). US Office
of Energy Efficiency and Renewable Energy (EERE) stipulates that high
performance building design “uses whole building design to achieve energy,
economic, and environmental performances that is significantly better than
average or standard practice.’’ This requires full collaboration of building design

85
and construction team right from inception of a project to completion, i.e., a
process referred to as integrated design (Kibert, 2008).
Specifically, high performance green buildings are building delivery
systems that satisfy the needs of the owner while meeting the sustainability
design principles of economic, environmental, and social impacts over the life
cycle of buildings. According to Kibert (2008), high performance green buildings
are defined as:
buildings with healthy indoor environmental; buildings that are resource and energy efficient; building projects that educate building occupants and users to the philosophies, strategies, and controls included in the design, construction, and maintenance of the project; buildings that use resources efficiently and maximizes use of local materials; building projects that are created by the cooperation among building owners, facility managers, users, designers and construction professionals through a collaborative team effort; and building projects that when undertaken effectively can bring efficiencies to improved mechanical operations and better human performances.
The strategies involved in construction of high performance buildings also
incorporate principles in green building rating systems. It revolves around the
idea that high performance buildings are designed, constructed, and well
operated for a purpose. In academic buildings, they are characterized by better
student performance, reduced operating costs, reduced liability exposures,
positive influence to environment, increased daily attendances, increased
teacher satisfaction and retention, and ability to use the facility as a teaching tool
(Mitchell, 2010; Ronsivalli, 2013).
The high performance building concept was the cornerstone of the U.S.
Energy Policy Act of 2005 and the Energy Independence and Security Act of
2007. It focused on reducing building-related energy consumption levels and

86
dependence on foreign energy sources (Ronsivalli, 2013). The Energy Policy Act
of 2005 and the Energy Independence and Security Act of 2007 had
requirements for energy efficiency and sustainable design for federal buildings.
High performance buildings have standards which are created,
measured, and validated continually to deliver recognized outcomes within
specific tolerance levels in buildings. The standards are typically set for energy
and water consumption, system reliability, environmental compliance, indoor air
quality and occupant health, safety, and comfort. Standards should be set and
priorities established with the building owner and therefore the VE team’s primary
mission and key success factors in mind. The standards should be set high
enough that the building ranks among the best-performing buildings in its class,
as measured against established standards and benchmarks (Ronsivalli, 2013).
The characteristics of high performance buildings include (Ronsivalli,
2013; Kibert, 2008):
Cost effectiveness: First cost is always a major consideration. Better measures are life cycle cost, cost-benefit analysis, and ROI over the life cycle of building.
Safety and security: Safety and security of building occupants is improved.
Sustainability: Sustainability philosophy is based on integrated design principles, reduced energy consumption, improved water conservation and indoor environmental quality, and lower impacts on materials.
Accessibility: Improved productivity by recognizing the needs of people with disabilities and others with different building accessibility needs.
Functionality: Must meet the intended purpose or needs of occupants.
Productivity: Occupants should be able to work effectively and achieve goals.

87
Aesthetics: Aesthetics of the building contribute to productivity of employees, the reputation of the owner, and the quality of life in community.
Visual comfort: Rich visual environment with lighting of each room. Daylight and electric light are integrated and optimized accordingly while glare is reduced significantly if not eliminated.
Day lighting: Provide as much natural daylight as possible especially in academic buildings. Day-lighting systems designed to avoid excess heat loss or gain and reduce glare.
Energy: Building design to reduce short term and long term energy costs while maintaining comfortable and efficient learning environment.
2.17.12 Comparison of Principal Building Sustainability Rating Systems
2.17.12.1 Overview. According to Hoseini et al. (2013) and Kapsalaki et
al. (2012), buildings consume about 30 - 40% of overall energy in developed
countries. Energy conservation and reduction requires an efficient green building
design (Hoseini et al., 2013; Kibert, 2008). In addition to energy consumption,
buildings are main CO2 emitters and contribute significantly to ozone depletion
and climate change (Reed & Wilkinson, 2006; Wilkinson et al., 2008). This notion
is based on the buildings’ environmental footprint, especially when considering
the high reliance on resources resulting from heating, ventilating and air
conditioning (HVAC). Also, it has been demonstrated that the value of a building
can be linked to the building’s perceived levels of sustainability (Myer et al.,
2008).
It is important to distinguish the levels of sustainability in buildings so as to
have a reliable comparison of buildings and/or sustainability rating tools (Reed et
al., 2009). Noteworthy is that a rating system or tool does not make a building
certified, but rather aids the builders and/or owner in planning, construction,
operation, and maintenance of green buildings by providing formal standards.

88
Some of the outstanding building sustainability rating tools are presented in
Table 2-4, showing geographical areas in which they are predominantly used.
2.17.12.2 Similarities and differences among the major sustainability
rating tools. Inasmuch as the different rating tools differ in their approaches to
measuring building sustainability, they all have the major goal of promoting green
building principles as well as reducing environmental impact and improving
building standards. Incorporating sustainability principles early in the project has
long term benefits of meeting sustainability needs including the rating of the final
finished project.
Compared to other building rating tools, BREEAM rating system has been
found to deliver the highest building sustainability rating (Parker, 2009; Reed et
al., 2009). Figure 2-11 shows a summary of some popular building rating or
assessment tools.
Therefore, a building built to LEED Platinum, Six Green Star, Four Green
Globes or CASBEE Sustainable level, as the highest rating level has a lower
level of sustainability compared to BREEAM’s Excellent rating. In the hierarchy of
meeting superior sustainability outcomes, BREEAM’s Excellent is the highest,
followed by LEED’s Platinum, Four Green Globes’, Six Green Star’s, and
CASBEE’s Sustainable.
It is worth noting that Green Globes is currently giving LEED stiff
competition in rating sustainable buildings. Therefore, it may be difficult for
building owners to choose between them. Compared to LEED, Green Globes
can be preferred in some cases considering its flexibility for non applicable
criteria, ability to incorporate life cycle assessment, and in providing sustainability

89
recommendations and automated report (Green Building Initiative, 2013). Also,
Green Globes documentation takes a relatively shorter time to complete and
costs relatively less compared to LEED. In spite of the profound advantages,
LEED is still more popular in the USA and Canada and leads Green Globes in
overall usage or implementation by building owners. This could be attributed to
the widespread knowledge base, LEED’s longer existence and wider use
compared to Green Globes which is comparatively new in the USA and Canada.
In the international arena, LEED and BREEAM are increasingly being
used. One of the reasons for LEED’s international recognition is that it can be
used in various stages of building process which include design and construction,
core and shell, post construction review, refurbishment, and existing building,
operation and maintenance. Green Star and BREEAM are not applicable for core
and shell while Green Globes can only be applied in the design and construction,
refurbishment and in existing building, operation, and maintenance (Hirigoyen et
al., 2008). Noteworthy is that BREEAM tops LEED in rating levels and it has
sought to produce ratings that are comparable across countries and to use
robust rating system which accommodates local challenges and opportunities
(Hirigoyen et al., 2008). In order to have uniform and consistent rating,
international sustainability networks such as World Green Building Council
(WGBC), Sustainable Green Building Alliance (SB Alliance), and International
Initiative for Sustainable Built Environment (iiSBE) have been formed to establish
common metrics and/or indicators for green buildings (Nelson, 2008).
In terms of complexity, the most recent rating tool, DGNB, is considered
to be one of the most extensive and complex rating system because it

90
incorporates a range of sustainability criteria that both LEED and BREEAM do
not accommodate. Examples of the sustainability criteria include indoor hygiene,
cost issues, e.g., life cycle consideration and value stability, and functionality
issues, e.g., flexibility or adaptability in use (Nelson & Rakau, 2010). Only Green
Globes can be comparable to DGNB in some of the criteria such as life cycle
assessments.
Even though BREEAM is currently the highest and strictest rating system,
DGNB indicates more sustainability breadth considering the added sustainability
criteria. Therefore, as DGNB rating system continues to gain more international
recognition as one of the outstanding building sustainability rating tools, more
research is needed to find the higher and stricter rating system between DGNB
and BREEAM.
2.18 Cost of Greening
The cost of sustainable design is equivalent to the cost of meeting each
level of green building certification when compared to non green building. The
cost of including sustainable building design elements depend on building type,
location of the project, climate, site conditions, and the familiarity of project team,
including the VE team, with sustainable design principles.
Overall, the benefits attached to green building are: reduced operating
costs, increased worker productivity, reduced potential liability resulting from
indoor environmental quality problems, ecosystem and biodiversity protection,
and reduced harmful emissions into the atmosphere. The greener the building,
the less the carbon emissions and the more the building occupancy rates
realized. However, greening can be linked to higher first costs. In the long run, it

91
is highly likely that the life cycle cost will be lower for green building compared to
non green building.
2.19 Summary of Literature Review
The literature review began with the inception of VE by Miles, where the
concept of value analysis was used to optimize material usage in the event of
shortages, up to the current emerging areas of VE and its potential use in
sustainable building design, construction, and development. Different terms have
been used to refer to VE such as value analysis, value planning, VM, value
methodology, value assurance, value control, and value improvement but the
literature has shown that these terms are more or less synonymous. The
literature review has shown that the VE process is valid for any project situation
as long as it includes an organized approach, function orientation or analysis of
systems, and creative multidisciplinary team thinking process.
VE has been identified as a unique decision tool in that it identifies the
building system ‘function’ as the most important aspect especially in building
constructions. FAST helps in correctly identifying the building system functions
and leads to identifying the best solution for system. It is recommended that the
VE teams spend a significant amount of time in the function analysis phase of VE
so that they do not miss the most important aspects of a project. Failure to
identify appropriate functions could have critical implications to the overall cost,
quality, and performance of the project.
Through function analysis, the building worth is determined. The
expression of sustainable green building system functions early in the design
process minimizes misconceptions, miscommunications, and re-designs which
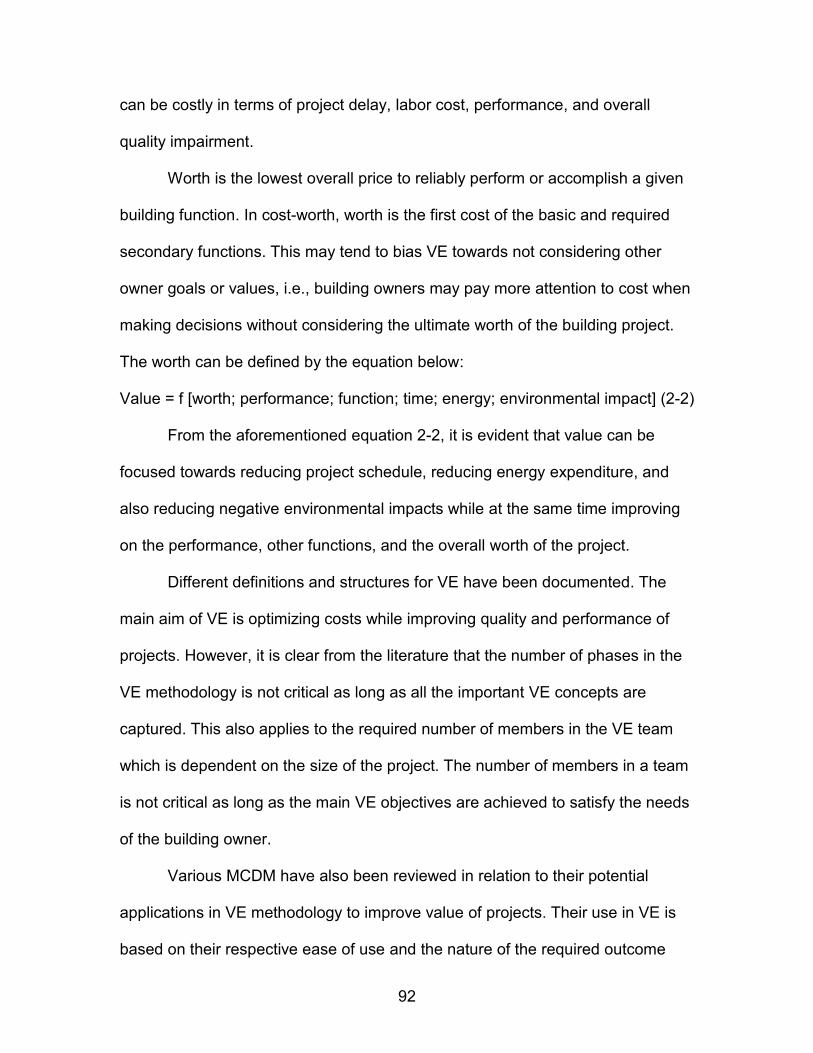
92
can be costly in terms of project delay, labor cost, performance, and overall
quality impairment.
Worth is the lowest overall price to reliably perform or accomplish a given
building function. In cost-worth, worth is the first cost of the basic and required
secondary functions. This may tend to bias VE towards not considering other
owner goals or values, i.e., building owners may pay more attention to cost when
making decisions without considering the ultimate worth of the building project.
The worth can be defined by the equation below:
Value = f [worth; performance; function; time; energy; environmental impact] (2-2)
From the aforementioned equation 2-2, it is evident that value can be
focused towards reducing project schedule, reducing energy expenditure, and
also reducing negative environmental impacts while at the same time improving
on the performance, other functions, and the overall worth of the project.
Different definitions and structures for VE have been documented. The
main aim of VE is optimizing costs while improving quality and performance of
projects. However, it is clear from the literature that the number of phases in the
VE methodology is not critical as long as all the important VE concepts are
captured. This also applies to the required number of members in the VE team
which is dependent on the size of the project. The number of members in a team
is not critical as long as the main VE objectives are achieved to satisfy the needs
of the building owner.
Various MCDM have also been reviewed in relation to their potential
applications in VE methodology to improve value of projects. Their use in VE is
based on their respective ease of use and the nature of the required outcome

93
depending on respective objectives of the VE process and the requirements of
the owner. From the review, it is evident that utility theory, including MAUT, is the
only method which tackles uncertainties in decision making. But it is important to
note that MCDM assumes certainty in decisions, e.g., absolute development and
selection of best alternative building system in VE process. Also, it is important to
note that pair-wise comparison concept in AHP as developed by Saaty is the
cornerstone of most MCDM processes including the conventional VE’s WPM
where it is used to determine the relative importance of each alternative based
on each criterion. In it, decision makers have to choose their opinion about the
value of one single pair-wise comparison at a time.
The problem with pair-wise comparison is that the quantification is based
on a scale. The scale is a mapping of a set of discrete linguistic choices available
to the decision making team and a discrete set of numbers representing the
importance or weights of previous choices (Triantaphyllou et al., 1998). Also,
there is an abstract allocation of weights in comparisons where negative or zero
values are realized. These are major drawbacks of pair-wise comparisons when
used in MCDM. When team decisions are taken when stakeholders are in full
attendance, MCDM can result in complete understanding of team views and
values with almost no disagreement, which is an objective of VE.
Sustainable development and construction have been explored and it is
evident that it can be useful to building owners when it is focused on improving
quality and performance. The USGBC has been encouraging sustainability
oriented outcomes in construction by recommending green building construction
using LEED, although Green Globes is also gaining in popularity. This

94
competition trend was shown in a report in the Environmental Building News that
indicated that both Green Globes and LEED projects’ ability to meet federal
standards without more effort is fairly equal (Melton, 2012). Various other
building sustainability rating systems are available, including BREEAM,
CASBEE, Green Star, and DGNB. Among other rating systems, BREEAM is the
strictest to achieve and a building that can achieve the highest BREEAM rating
would be considered the most sustainable compared with the highest rating in
other prominent building sustainability rating systems. The new rating tool,
DGNB, developed in 2009 is considered a complex rating considering some of its
sustainability criteria such as value stability and indoor hygiene. Noteworthy is
that both LEED and BREEAM have more international recognition compared to
other rating systems.
An array of benefits have been attached to building green and these
include but are not limited to favorable indoor environmental air quality and
efficient energy usage in buildings. However, it has been reported that building
project owners are hesitant to integrate sustainable construction due to added
building costs, especially first cost. On the other hand, the current trend shows
that sustainable materials are increasingly becoming affordable and widely
accepted, with building owners increasing the demand for sustainable and green
building features.
Various studies have made recommendations for cost reduction so as to
motivate building owners to realize the benefits of sustainability in building
construction. VE methodology could be used as the decision tool in this context.
However, given that VE has historically focused on cost as the primary driver for

95
value, there is need to re-examine the VE methodology such that it can be
refocused to positively impact sustainability across the life cycle of the project
while at the same time improving quality and other performance criteria of the
building project.
Therefore, this research is aimed at modifying VE such that it can be
effectively used for sustainable green building outcomes. The main focus is to
improve building sustainability oriented outcomes using a VE approach.
An array of decision tools have been reviewed, including CBA, which can
be integrated in the evaluation phase of VE. CBA is a promising alternative to
typical weighted methods because it focuses predominantly on the advantages of
alternative building systems. When implemented appropriately, CBA avoids
double or multiple counting, omissions, and other possible complications arising
from negative values. NLP can be applied in the creativity phase of the VE
process. This strategy elicits or enhances creative thinking through good team
rapport for effective communication aimed at efficient idea creation and may
enhance the success of VE process.

96
Table 2-1. Comparison of VE job plan phases as described by various standards, organizations, and researchers. VE Job Plan (Phases) Study
Orientation Information Function analysis
Creative / Speculative
Evaluation / Analysis / judgment
Development / recommendation
Presentation Implementation
Benstin et al. (2011)
√
√
√
√
√
√
√
√
ASTM E 1699-10
- √ √ √ √ √ √ √
SAVE (2007) - √ √ √ √ √ √ - Male (2007) √ √ √ √ √ √ √ - Abdulaziz (2006)
- √ - √ √ √ √
EPA (2005) - √ - √ √ √ √ Male (1998) - √ - √ √ √ √ - Dell’ I sola (1997)
- √ √ √ √ √ - -
Fallon (1980) - √ √ √ √ - √ √ Miles (1972) - √ √ √ √ √ - -

97
Table 2-2. Function analysis noun-verb connection. Subject under study Verb Noun
Paint Prevents Corrosion
Lamp Illuminates Space
Table 2-3. Certification levels according to Green Globes. Percent ratings
Globe level
Interpretation of Gobles achieved
85-100% 4 Globes High level of recognition and commitment to energy and environmental design practices
70-84% 3 Globes Excellence in achieving eco-efficiency results by use of best practices in energy and environmental design
55-69% 2 Globes LEED practices and dedication to continuous advancement and leadership
35-54% 1 Globe Used for selected building designs serving as national or world leaders in environmental and energy performance.
Table 2-4. Major rating tools by country of origin. Europe Americas World
- BREEAM (UK) - DGNB (Germany)
- LEED (US and Canada) - BREEAM Canada (Canada) - Green Globes (US and Canada)
- Green Star (Australia) - GB Tool (South Africa) - CASBEE (Japan) - Hong Kong BEAM (Hong-Kong) - Green Mark (Singapore)
Figure 2-1. Communication levels of team members. Source: Value engineering
and creativity, Nader (n. d. d.).

98
Figure 2-2. VE team, job plan, and desired outcome.
Figure 2-3. ASTM E1699-10: Value engineering study plan.

99
Figure 2-4. Technical FAST or function logic diagram. Source: ASTM E2013-12.
Figure 2-5. Cumulative worth vs cost curve showing the cumulative increase in
worth from value engineering three systems.
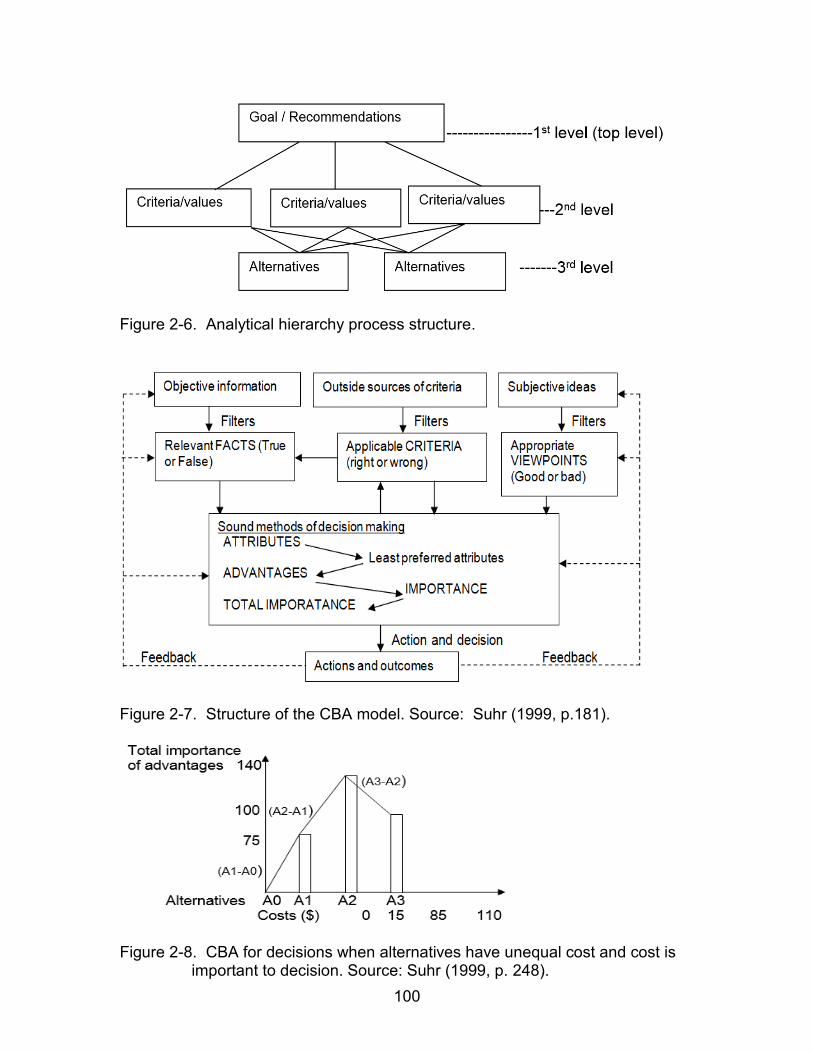
100
Figure 2-6. Analytical hierarchy process structure.
Figure 2-7. Structure of the CBA model. Source: Suhr (1999, p.181).
Figure 2-8. CBA for decisions when alternatives have unequal cost and cost is
important to decision. Source: Suhr (1999, p. 248).

101
Figure 2-9. Sustainability ranking by BEE. Source: Abramson (2013) and
Akimoto (2010).
Figure 2-10. Four basic tools of assessment in CASBEE as applied at each
stage of building life. Source: Akimoto (2010).
Figure 2-11. Comparison of principal sustainable building rating systems.
Source: Reed et al. (2009) and BRE (2008).

102
CHAPTER 3 RESEARCH METHODOLOGY
3.1 Overview
Modification of the VE process so as to better improve sustainable green
building outcomes in the construction of new buildings or renovation of existing
buildings will benefit building owners in making timely decisions that have
positive and tangible impact in quality and other performance criteria. This
chapter will describe the methodology used to develop a framework that
integrates new approaches into the VE process, and how it was tested using
case study building.
The first objective is to identify the limitations in the current or conventional
VE process as it relates to green building projects. The identification of limitations
will lay down the venue and avenue for modification.
3.2 Research Aim
The specific aim of this research is to develop a robust VE decision tool
that focuses on improving quality and performance of building systems, that is,
VE approach that is aimed at improving the sustainability oriented outcome of
green buildings. The research will entail:
Developing a new VE methodology with new decision techniques, integrate sustainable green building design principles or methods in the process so as to improve sustainability oriented outcomes. Function analysis will be at the center of this process.
Applying the modified VE methodology to case study building so as to test the effect (validity and/or reliability) of the new VE process on owner’s building sustainability requirements or outcomes. The impact of the process will be evaluated based on the selected building components’ quality and performance indicators; which are the main objectives of VE process in buildings.

103
A VE process, also known as a VE job plan, will be presented in three (3)
major phases where VE tasks will be grouped into manageable components.
This will entail a pre-workshop/preparation effort phase, workshop effort phase,
and post workshop study phase.
3.3 Research Objectives
The following objectives will be central in this research:
To provide a modified VE model with new sound decision methods that integrate building sustainability objectives into the VE process
To evaluate the impact of the new VE methodology through building case study and expert opinions.
The objectives will be met as follows:
Objective 1. Provide a modified VE model.
Meeting this objective will entail presentation of a new summative VE
decision making framework that is robust for the analysis of building systems and
one that can be used to improve sustainable green building outcomes. This will
require identification of appropriate decision making method and green building
rating system to be used as a measure of sustainability outcome and using the
new VE approach to achieve the superior building sustainability outcome.
Objective 2. To evaluate the impact of the new VE methodology through case
study and expert opinions.
Meeting this objective will require comparison of the results from the new
or alternative VE processes and the conventional VE approach. Physical building
will be used as case study to evaluate the effect of the new VE decision making
tool or framework. VE expert opinions will be used to validate the method.

104
3.4 Choice of Decision Making Method and Sustainability Rating System
The VE decision method and building sustainability rating system were to
meet the following requirements:
Acceptance: Ability of the users or stakeholders to embrace or agree to use the decision method and building assessment or rating system.
Complexity: The level of user-friendliness or the ease of understanding and using the decision method and rating system by the stakeholders.
Observability of the results and outcomes, particularly sustainability outcomes: This relates to the ability of the decision tool and rating system to yield results which are valid and reliable, specifically in the green building area.
Cultural compatibility: This is the ability of the decision method and rating system to be easily assimilated within the VE team culture or to become highly popular within groups of individuals.
Relative advantages: This relates to the level of benefits that accrue from using the decision making method and sustainable building rating system.
From the CBA method and MCDM which include weighted sum method,
weighted product method, utility theory, analytical hierarchy process, goal
programming and ELECTRE method, CBA method was the chosen decision
making method to be integrated in the VE process. This, in addition to meeting
the requirements, is because of its characteristics that are linked to sound
decision making.
From the building sustainability rating systems which included BREEAM,
CASBEE, LEED, Green Star, Green Mark, DGNB, and Green Globe, LEED was
most preferred rating method for measuring green building outcomes. This, in
addition to meeting the requirements, is because most of the buildings in the
geographical region where the case study building was situated encouraged the
use of LEED as the main sustainable building rating system. Noteworthy is that

105
LEED may not be a perfect measure of sustainability on a global perspective.
Other rating or assessment methods such as DGN or BREEAM may be preferred
to LEED depending on the level of sustainability requirements.
3.5 Research Variables
3.5.1 Objective Variables
Objective variables are the dependent variables which the research was
focused on. They are;
Sustainable building quality: The main focus of the modified VE methodology is to improve performance and quality levels in buildings as opposed to the conventional VE process which is cost focused. Specifically, the conventional VE method is focused on reducing first cost of building systems or components. The goal of new VE approach is to attain high performance building where the VE team uses modified VE process and sustainability principles so as to achieve the desired improved sustainability oriented goals. Such building is characterized by better indoor air or environmental quality. For example, in academic buildings, good indoor environmental quality is depicted by good indoor conditions which may result in better student performance, reduced liability exposure, increased daily attendance, increased teacher satisfaction, and retention.
Building energy: Building energy is pertinent to construction of sustainable building, i.e., environmentally friendly building must be characterized by optimum energy performance. Thus, energy performance is a prime objective variable in the modified VE process. The main objective is to diversify avenues for optimal energy consumptions in buildings by use of appropriate VE approach.
3.5.2 Independent Variables
These are variables which when changed or altered will logically impact
the objective variables aforementioned in the research study. The independent
variables in the study included:
Climatic conditions: Different climatic conditions can affect the levels of building indoor environmental quality and energy requirements or consumptions. Current trend of globalization has been characterized by frequent erratic climatic changes and ozone depletion which have initiated differential climatic conditions between low and high latitude regions.

106
Building construction objective is to have buildings which have excellent indoor environmental quality conditions and optimum energy consumptions. However, this depends on the climatic conditions the buildings are situated.
Building location and orientation: In addition to differences in climatic conditions where buildings are situated, physical location of buildings can also impact the level of indoor environmental quality or optimum building energy consumption. Building orientation can have significant impact on lighting and/or energy requirements in buildings especially where passive lighting and heating can be achieved through better choice of building orientation. Similar buildings in different locations and orientations can have different outcomes in terms of quality and energy performance requirements.
Level of coordination, communication, and rapport in the VE team: According to ASTM E1699-10, the VE team leader should have strong leadership, management, and communication skills. The level of team communication, cooperation, and trust need to be high. This culminates into maximum idea creation and good outcomes. Thus, if the VE team’s level of coordination, communication, and rapport creation is not at the required level, then the VE outcome variables may not reflect best outcome, e.g., sustainability oriented outcomes. That is, increasing the level of rapport and communication elicits better idea creation in the modified VE process which results in desired VE outcomes.
Choice of VE decision method and building rating system: Inclination towards using multi-criteria decision methods (MCDM) that utilize weighting, rating, and calculating would give a different result on dependent variables from when an alternate approach is used. Also, different sustainability rating systems have different levels of green and acceptability for use in different geographical regions.
3.5.3 Performance Variable
The LEED rating system is the leading rating system in the USA.
Therefore, the sustainability performance measure is the total number of LEED
points accumulated. VE teams on projects in other countries may opt to use
other building sustainability rating systems such as Building Research
Establishment Environmental Assessment Method (BREEAM) which is widely
used green building decision tool in UK and is also adopted in Canada and
Hong-Kong; the Comprehensive Assessment System for Building Environment

107
Efficiency (CASBEE) which is used in Asian countries; the Australian Green Star
rating system developed by the Australian Green Building Council; Singapore
Green Building Council (SGBC)’s Green Building Product Certification Scheme
and Green Mark; and DGNB used in Germany and is being adopted in other
European countries.
3.6 Hypothesis Development
The research hypothesis is that the alternative VE method will result in
better VE-sustainability oriented outcome than the conventional VE from a
sustainable design and construction perspective. This hypothesis will be tested
from the outcomes arising from the experimental designs, i.e., results from
students’ VE reports and survey feedback, faculty evaluations of VE reports, and
the feedback from VE practitioners.
3.7 Significance of the Research
This research study presents a modified VE decision making framework
which incorporates sustainable building principles and strategies. Employing this
tool will assist building owners, construction and design personnel involved in the
building construction project (whether new construction or renovation works) by
providing a systematic value focused methodology for improving sustainable
green building design and construction outcomes. It will also help provide a
benchmark for decision making especially after testing of the framework with the
help of the case study, i.e., deciding which sustainable green building design
principle(s) or strategy(ies) is appropriate for a specific circumstance(s). For
example, it will determine whether the use of sun shading devices in buildings
will meet owner’s requirements better than use of skylights.

108
3.8 Limitations in the Conventional VE Relative to Sustainable Construction
The main objective of VE methodology in building construction is to
remove unnecessary costs while improving performance and quality levels that
meet or satisfy the needs of the owner. Three key aspects of VE are to reduce
cost while maintaining or improving quality and performance levels of building
systems. However, conventional VE methodology has some weaknesses or
limitations that cannot make it achieve the desired sustainability oriented
outcomes. These are:
Over-emphasis on cost: Conventional VE methodology has shifted its focus and often leans towards reducing costs of systems as opposed to improving the quality and performance level of systems. It is deduced that most building owners are more inclined to reduce first cost, especially considering the SAVE International’s focus on VE as a tool used to identify functions of systems at lowest costs. At times, this cost can be over-emphasized by owners to the extent of compromising other prime VE objectives such as improving quality and performance levels of building systems. The accepted standard practice for performing VE of building and building systems (ASTM, 2010) is cost-oriented. In fact, conventional VE methodology has sections and subsections detailing the cost worth procedure in VE. Section 6.3.2 of the ASTM E1699-10 details out the importance of relating function to cost and offering approach for improvement of system in the event of cost escalation. Also, the ASTM E2013-12, the Function Analysis System Technique (FAST) construction guide (ASTM, 2012) describes a value index, which is cost focused. It is evident that sustainability oriented outcomes such as favorable indoor environmental quality levels in buildings are not part of the primary considerations of VE. More attention is focused on the cost of systems, i.e., the monetary cost of meeting the functions of building systems.
Determination of criteria in the pre-study and/or information phase: Conventional VE methodology requires the determination of criteria for the evaluation of building system’s alternatives in the pre-study phase of the VE process. This is an unsound process towards attaining required sustainability-oriented outcomes. It is unsound decision approach because alternatives are not developed in the pre-study phase. It is not until the creative phase of VE process when alternatives are developed. At this point, evaluation criteria can be determined.
Using pair-wise comparison to determine relative importance of each alternative: VE procedure of using pair-wise comparison of criteria and

109
selection of best alternatives typically operates in abstract terms. These may not yield sound building sustainability oriented outcomes.
Abstract allocation of weights to criteria: The conventional VE method relies on abstractions. In pair-wise comparison of criteria from quality model, it awards positive values to criterion which has positive preference and zero (0) to one with negative preference. Further, where the difference between two criteria is zero (0), it assumes equal preference and awards one (1) or equal rating for both. Interpreted differently, when two criteria are compared it awards a zero (0) when the result after the pair-wise comparison is a negative value and one (1) when the summation of weights equal to zero. The abstractions require VE team to fill in the gaps caused by missing information so as to arrive at decisions. Such decisions are unanchored and not based on relevant facts.
Using advantages and disadvantages to rank and/or rate alternatives: The evaluation of alternatives is based on considerations of both advantages and disadvantages. This can be erroneous since an advantage of one alternative may be a disadvantage of another alternative and vice versa. This may introduce double or multiple counting of advantages leading to errors in evaluation, selection process, and in the final VE outcome.
Does not promote or improve creativity: Sustainability oriented outcomes, as a relatively new concept in building construction, needs new approaches that improve team communication and idea creation in addition to the ones already proposed in the VE process like brainstorming (ASTM, 2010). The main objective is to improve green building outcomes using improved creative abilities.
There are potential avenues that can be used to alleviate the limitations so
as to acquire improved VE outcomes. Such avenues can be ingrained in the VE
process to form a new or modified VE process.
3.9 Proposed Approaches to Modify Conventional VE
Sustainability is defined by the building’s performance and quality
outcomes as measured by LEED rating system. This section presents avenues
for modifying the conventional VE so as to improve building sustainability
oriented outcomes. The specific VE phases and/or areas for improvement are
identified and then the improving methods are proposed. These are presented in
the subsequent sections.

110
3.9.1 Pre-study and/or Information Phase (Determining Factors by CBA)
The VE pre-study phase section 6.2.5 of the ASTM E1699-10 requires the
owner, design professionals, and the construction manager to develop criteria for
evaluating alternatives during the evaluation phase. There are no alternatives
already developed that require specification of criteria for evaluation in this
phase, rather only the owner and/or project requirements are collected in this
phase. Therefore, this section needs to be modified by excluding the criteria
development in the pre-study phase and delay it until the evaluation phase after
the alternatives have been generated. CBA addresses this limitation of
conventional VE by proposing that the factors, which are labeled as criteria in
conventional VE, be developed at the evaluation phase when the alternatives are
available.
3.9.2 Function Analysis Phase (Cost-Worth to Performance-Worth)
It has been stated that there is tendency by owners to over-emphasize on
the cost reduction in VE. Cost-worth analysis typically occurs in the workshop-
function analysis phase. ASTM E2013-12 stipulates that FAST data in the
function analysis VE phase helps to identify the building system’s alternatives
with respect to their function costs. In the conventional VE practices, cost-worth
is typically first-cost driven. Specifically, the cost-worth ratio is used to identify the
building systems that require detailed review in the subsequent steps in the VE
process, i.e., to determine those building systems that may need improvement
based on their cost-worth ratios.
ASTM E1699-10 subsection 6.3.2.5 of the function identification and
analysis phase defines worth as the VE team’s estimation of the least costs, i.e.,

111
initial cost, presented in the cost estimate, needed to perform a specific building
system function. Subsection 6.3.2.6 defines the cost-worth ratio. It stipulates that
the cost-worth ratio is calculated by dividing the design professional’s cost for
each system or functional group by the basic worth (the VE team’s cost
estimation). If the resulting ratio is greater than 1:1, i.e., the cost is higher in the
estimate than the VE team’s estimate, then there is potential opportunity for cost
improvement. Overall, this VE section concludes that the greater the ratio, the
greater the opportunity for improvement in the typical VE methodology (ASTM
2010). This results in selecting the building systems using first-cost.
However, worth may also be defined as the VE team’s best or highest
estimation of quality or performance as defined by selected quality and
performance indicators for the project or building system. The quality-worth or
performance-worth maybe calculated by dividing the projected performance
indicators by the VE team’s target worth as represented by quality and
performance indicators. A ratio less than 1:1, i.e., less performance or quality
realized from the design than the VE team’s estimate represents a potential
opportunity for quality or performance improvements.
The second VE step to be modified is the function identification and
analysis phase, section 6.3.2, subsections 6.3.2.4-7 detailing the importance of
relating function to costs of the components or building systems. Subsections
dealing with cost components as the main objective will be refocused and/or
substituted with performance or quality indicators which are represented by
sustainable green objectives that enhance quality, safety, or energy
performance. For example, compare the professionals’ projected number of

112
LEED points accumulated for building indoor construction materials and the VE
team’s targeted LEED points for indoor construction materials. The subsections
that discuss cost-worth will be substituted with new concepts such as
performance-worth or quality-worth. This will shift the over-emphasis on cost
which has been identified as a weakness in the conventional VE to performance
and quality improvement objectives.
Worth in this case is the worth in both the basic and required secondary
functions. The formulation is summarized as:
Worth = Benchmark performance level (projected) ÷ (3-1) Performance actual (VE team’s target level)
The benchmark is the building owner’s or design professional’s quality or
performance indicators score on a measurement scale, e.g., accumulated LEED
points. The performance actual is the worth derived from the VE team’s target
estimate of performance and quality on a similar scale.
A performance-worth or quality-worth ratio less than 1:1 represents
potential areas for quality and performance improvements, i.e., the smaller the
ratio, the greater the opportunity for value improvement under the modified VE
procedure. Note that best or higher(est) levels of building performance and
greater quality levels are the main goals in sustainable green building
construction.
The third VE section to be modified is the section 6.6.10.2 of the ASTM
E2013-12 which defines the value index of the technical FAST as the ratio of the
total cost, i.e., summation of all costs as distributed to all functions in the
technical FAST, to the cost of critical path functions, i.e., costs associated with
building functions along the critical path (Critical path is the path from higher

113
order functions to the lower order functions). Typically, this value index varies
from 1.5 to 6 (ASTM, 2012). The higher ratio implies greater opportunity to
reduce cost for the selected building system. A value of 1.5 means a design with
minimum cost in supporting functions, i.e., most of the total cost is spent on the
critical path functions (basic and secondary functions). The modified VE
procedure will utilize a value index that is defined as the total performance or
quality estimate which is the summation of all performance or quality levels as
defined by respective building functions in the FAST diagram divided by the
critical path performance or quality estimates. The higher the value index ratio
the greater the opportunity to improve the performance or quality of the selected
building system or component.
3.9.3 Creativity Phase (Enhancing Creativity of the VE Team)
The fourth VE step identified to be modified in the ASTM E1699-10 is the
creative phase section 6.3.3 with subsections that state the use of the proven
methods for stimulating creativity such as brainstorming, multiple objective
analysis, and nominal group techniques. The modified VE procedure will add in
another technique to the existing methods of creativity in the creative phase to
enhance the creativity process. Neuro-Linguistic Programming (NLP) can be a
strategy for improving communication and creativity in the VE process. NLP can
enhance or create mutual trust between a team leader and team members and
lead to an effective creativity phase and thereby achieve success VE process
relative to sustainable design and construction. It is a process that facilitates free
thinking and stimulates creativity by turning problems into signals and signals into
language and communication. NLP states that the way we communicate with

114
others will influence the nature of the feedback we get, i.e., the meaning people
attach to your communication style will determine the response you receive.
Thus, creativity can be enhanced or improved when language is accessed using
NLP processes. NLP strategy may improve development of alternative system in
the creativity phase.
3.9.4 Evaluation Phase (Benefits of Incorporating CBA)
The fifth VE step identified for modification is the evaluation phase section
6.3.4 with subsections that state the criteria for evaluating building system
alternatives using advantages and disadvantages. The modified VE procedure
capitalizes on CBA method by Suhr (1999) which is focused on using only
advantages between attributes of alternatives during the evaluation process.
Specifically, CBA is based on the premise that decisions must be made on
importance of advantages, and those decisions must be anchored on relevant
facts. Also, decision makers must continue to learn and skillfully use sound
methods of decision making. In doing this, CBA does not allow for use of
Weighting, Rating and Calculating (WRC) principle of MCDM or conventional VE
which is based on use of abstract terms, abstract allocation of weights to criteria,
pair-wise comparisons of criteria, and use of both advantages and disadvantages
in evaluating alternatives. This is because they are unsound methods employed
during evaluation of alternatives.
3.9.5 Summary of the Limitations and Modifications of Conventional VE
Limitations in the conventional VE process have been identified and listed.
Potential avenues to counter the limitations have also been identified especially
considering their ability to achieve improved building sustainability oriented

115
outcomes. The alternative avenues ingrained in the conventional VE process
results into a modified VE process.
The modified VE methodology will employ new approaches in the key VE
phases to ensure better sustainability outcomes. It will be dubbed ‘an optimistic’
modified VE methodology because it will focus on conducting summative building
system functions, creativity, and evaluations which are supported by sound
decision making approaches such as CBA and NLP. The performance-worth
approach will re-orient the process, away from the routine over-emphasis on first
cost. Table 3-1 shows a summary of the limitations and alternative VE avenues.
3.10 Case Study Approach and Overview
Case study building will be identified and investigated. There will be
identification of the constraints and requirements of the building owner. Master’s
education level students in construction management program will be part of the
building case study process. The students will be offered training on the
alternative VE methods or approaches. They will employ the approaches to
conduct VE study of the building and then submit final VE report. Survey
questionnaire will be administered to the students in order find out their opinions
about the alternative VE methods they used. The VE alternatives to be tested or
investigated are conventional VE methods, performance worth, NLP, and CBA,
specifically including the combination of these VE approaches.
Thereafter, the VE reports will be distributed to the faculty members who
will evaluate the extent to which the systems developed and recommended in the
VE reports achieved sustainability outcomes, i.e., the level in which the systems
attained LEED credit categories relative to the VE method used. Statistical

116
Analysis System (SAS v9.3) software, mainly employing Analysis of Variance
(ANOVA) in addition to descriptive statistical analysis, will be used to analyze the
students’ survey feedback and faculty evaluations. The purpose of the ANOVA
will be to investigate the level of difference in the variance of results obtained.
Presentation will be made to respective VE practitioners who will then
provide their opinions, via teleconference discussions and through online survey,
about the validity, reliability or authenticity of the VE methods employed. The
survey will be based on their level of agreement with the limitations of the
conventional VE method and how the new VE approaches fulfill the limitations
relative to achieving better sustainable design and construction outcomes. SAS
software employing Analysis of Variance (ANOVA), descriptive statistical
analysis, and logistic regression analysis will be used to analyze the VE
practitioners’ survey feedback. The purpose of the ANOVA will be to investigate
the level of difference in the variance of results obtained for the different VE
methods. Logistic regression analysis will be used to predict the likelihood of VE
practitioners’ agreement with the limitations in conventional VE as true limitations
and the ability of the limitations to negatively impact green building outcomes.
3.11 Case Study Stage One
3.11.1 Case Study Building Project Description
The Clinical and Translational Research (CTR) building at the University
of Florida (UF), Gainesville, Florida, was used as the case study building. The
building was used to investigate the effectiveness of different VE methods in
measuring and/or improving building sustainability outcomes. It was in the
construction stage, i.e., approximately 90% complete.

117
CTR is located on the North East corner of Gale Lemerand drive and
Mowry Road. The $45 million building project has an area of 120,000 square feet
and serves as the headquarters for clinical and translational services at UF. The
building has three wings which house the Institute of Aging, the Department of
Epidemiology, the Department of Health Outcomes and Policy, and the
Department of Biostatistics among other research departments and clinical
programs. The building also hosts conferences and training.
UF quest for sustainability indicate that UF has more LEED certified
buildings than any other university in the USA. Rinker Hall was the first to attain
LEED Gold certification in 2003 in the whole of Florida. In 2006, Silver
certification was made a mandatory requirement for all new constructions in UF.
The sustainability bar was raised to Gold certification in 2009 and to LEED
Platinum in 2013. Therefore, CTR building was designed with the goal of meeting
the highest achievable standard of sustainability as defined by LEED Platinum
Plus accreditation, i.e., a level a little higher than LEED Platinum.
The building design and construction was focused on incorporating high-
levels of sustainability principles so as to ensure adequate user comfort as well
as inducing a sense of pride at UF and the immediate community considering
that the building has the highest LEED certification rating. The sustainability
principles include efficient energy production, use of photo-voltaic energy
generation, use of daylight responsive dimming, and water conservation
technologies. The equipment and materials favored or improved indoor and
outdoor environmental quality through the use of low-emission materials and the
reduction of ambient exterior light pollution.

118
3.11.1.1 Building performance requirements. The following
performance requirements were defined by the owner:
Building image and marketing: Building sustainably enhanced the image of the building, i.e., LEED Platinum Plus certification aided in donor appeal for contributors.
LEED Platinum accreditation
Energy performance: Building energy efficiency was one of the major requirements for UF.
Sustainability standards: This entailed incorporating building systems that met UF sustainability standards.
Maintainability: The University requiring a building facility that was easy to maintain during operations.
Durability: The University has a goal of using durable materials that are expected to have more than 50 years of life expectancy.
Carbon neutrality: The University has a goal of becoming carbon neutral by the year 2025.
Schedule: The University required the building to be constructed according to the schedule.
Sustainable building: Flexibility to suit present and potential future user needs. UF needed a building that is easily adjustable to meet the future research needs of the donors or contributors.
3.11.2 Students Involvement in the Case Study
During the early part of spring 2013 semester, the VE students made two
field trips to the CTR building in order to become familiar with the building and to
have opportunities to discuss the project with the construction team, including the
VE professionals and owner’s representative. The main aim of the visits was to
determine the project requirements especially from a sustainability perspective
so that the VE studies could be conducted to deliver a building with superior
sustainability outcomes. Up to the midterm of the semester, the students had
demonstrated competency in conventional VE methodology.

119
3.11.2.1 Research experimental design and sample size. The students
were divided into eight teams which were then randomly assigned in four VE
methods comprising of two teams each, i.e., each VE method was to be
investigated or tested with two teams. Three or four students formed a team, i.e.,
the minimum requirement for VE team. Table 3-2 shows the study design.
A total of 26 students (N = 26) was the convenient sample for this study.
Each VE method was uniquely different from the other methods. The following
were the VE methods used by the students.
Method 1 (Control VE method): The teams utilized the typical conventional VE process, i.e., VE analysis process which entailed developing quality model, pair-wise comparisons of criteria, and weighting, rating, and calculating methods in VE. They employed cost-worth approach in the function analysis and evaluating building systems for potential improvements.
Method 2 [Conventional VE method and Performance-Worth (PW) method]: The teams utilized the conventional VE approaches except in the function analysis VE phase where they incorporated performance-worth approach in place of cost-worth approach used in conventional VE procedure.
Method 3 [Choosing by Advantages (CBA) and Performance-Worth (PW) method]: The teams used completely new approaches. They used CBA method and performance-worth method to select systems to be improved. According to PW, achieving higher performance and quality levels of building systems were the main goals as opposed to lower first cost of building systems in the conventional VE approach. CBA was chiefly an evaluation tool.
Method 4 [Choosing by Advantages (CBA), Performance-Worth (PW), and Neuro-Linguistic Programming (NLP) method]: This approach incorporated NLP in addition to the CBA and PW methods to enhance VE team communications and better creativity during VE. Importance was placed in the VE creative phase and evaluations of developed alternatives.
3.11.2.2 Students training and analysis of systems. VE teams 1A and
1B were not offered any training because they were the control VE method using
120
the conventional VE (method 1) and at this point in time, all the teams were
competent in using conventional VE. The other VE teams 2A, 2B, 3A, 3B, 4A,
and 4B were offered special trainings on alternative VE approaches.
Firstly, all the other student teams were trained on using PW in VE
process. This is because PW is a common approach included in all the
alternative VE methods 2, 3, and 4. Thereafter, teams using method 2 were
allowed to proceed with their VE study. VE teams using method 3 and method 4
were then grouped together and offered training in CBA. Again, CBA is a
common VE alternative method here. Lastly, VE teams using method 4 were
offered training in NLP. This is because the effect of NLP was only tested in the
VE method 4. Finally, all the VE teams were allowed to perform value analysis of
the systems and to prepare the final VE report of the CTR building. They were
free to select building systems for analysis towards improving the building.
Towards the end of the semester, the eight student teams were allowed to
present their VE findings to the class, i.e., the owner, whereupon different class
members asked questions and clarifications from the respective VE team
presentations and/or presenters.
3.11.2.3 Survey instrument and administration. During the last two
weeks of the spring semester, i.e., at the end of the last class presentation, an
opinion paper based survey was administered to the students. Prior to the survey
administration, the University of Florida Institutional Review Board (IRB) offered
consent and approval to proceed with the survey research study. The purpose of
the survey was to gather information about the VE processes or methods the
students used and their overall evaluations of the VE final project outcomes in

121
achieving sustainability outcomes. The survey questionnaire was stratified
according to the respective VE methods used, i.e., method 1, method 2, method
3, and method 4. Therefore, each VE team that used a particular VE method had
the survey questionnaire tailored to that specific VE method. Overall the survey
questions traversed questions or factors shown in Appendix A and Table 3-3.
The surveys were matched with respective VE teams and methods so as
to ease analysis process and interpretation of results. The survey questionnaire
was scaled in a one (1) to five (5) - point Likert scale, i.e., 1 as the least score
and 5 as the best score in the preference scale. The summary is in Table 3-3.
3.12 Case Study Stage Two
This stage of the research was undertaken after the students submitted
their VE final report. The researcher reviewed the reports and documented the
LEED points accumulated from the recommended systems so as to give an idea
of how the different VE methods performed relative to sustainable construction.
Thereafter, the students VE reports were forwarded for evaluation by a team of
four professionals from the academia (N = 4), i.e., faculty members, with
expertise in sustainable construction and development. They were not required
to be experts in VE. Specifically, the academic professionals were those who had
prior experience in working with LEED as a sustainable building rating system.
They rated the VE final reports based on two major approaches (Appendix B):
Overall building sustainability achievement: This approach required the faculty expert to rate the VE report based on the sustainability principles and /or building systems that the students developed to enhance or improve building sustainability. The rating criteria were defined as; basic = 1, somewhat basic = 2, intermediate = 3, somewhat advanced = 4, and advanced = 5. These ratings were to be applied according to the overall contribution of sustainability principles and/or building systems to LEED credits areas such as sustainable sites, water efficiency, energy and

122
atmosphere, materials and resources, indoor environmental quality, and innovation and design process.
Sustainability achievement which is building systems specific: This approach required the faculty members to rate the VE reports based on the level of contribution of the recommended building systems to achieve building sustainability. They used the respective LEED credit categories such as sustainable sites, water efficiency, energy and atmosphere, materials and resources, indoor environmental quality, and innovation and design process. The faculty members rated the contribution of the recommended systems to the LEED credits or sustainability, by using the rating scale: somewhat fair contribution = 1, fair contribution = 2, good contribution = 3, very good contribution = 4 and excellent contribution = 5.
The main purpose of the faculty reviews and ratings of the VE reports was
to offer expert feedback about the level of contribution of the various VE
approaches used in developing final reports to achieve building sustainability
outcomes. They used the aforementioned rating scales for the whole building
analysis and for the recommended building systems analysis. It was later
concluded that the recommended systems rating approach in the second bullet
above would offer the best information to the evaluation and/or analysis of the VE
methods used to achieve building sustainability. Special attention was placed on
the energy issues and sustainable building quality because they were the major
dependent variables in the study. Sustainability measure was also considered.
3.13 Study Stage Three
In order to provide a definitive validation of the VE methodology
approaches employed in the research to develop a definitive modified VE
methodology, a group of VE practitioners (N = 7) were requested to take part in
research requiring them to offer their opinions about some alternative VE
methods aimed at improving building sustainability. Most of the participants were
sourced from SAVE International website, whereupon, the listed professionals
123
were approved module 1 or Module 2 or both VE trainers towards SAVE
certifications. An e-mail was sent asking them to take part in a VE research study
focusing on improving building sustainability outcomes.
Prior to the presentation, written informed consent form from the UF’s
Institution Review Board (IRB) was e-mailed to each one of them so that they
could append their signatures and return the signed consent form to the
researcher as an indication that they had agreed to take part in the research.
They were also informed of the possibility of the presentation sessions being
recorded so as to provide data for future references.
The presentation detailed out the limitations of the conventional VE
method and the avenues that were proposed to counter the limitations relative to
improving building sustainability outcomes. The presentation was executed and
recorded via gotomeeting teleconference software. Immediately after the
conclusion of the presentation and question and answers sessions, the VE
practitioners were sent online survey questionnaire via Qualtrix so as to gather
their opinions about the limitations of conventional VE method and the proposed
new approaches for the new modified VE methodology.
The survey questionnaire entailed collection of the VE practitioners’
demographic data such as number of years in construction industry, number of
years involved with VE or building sustainability assessment tool. Specific
emphasis was placed on VE specific questions. Table 3-4 gives a summary of
those questions. Details of the questions are shown in Appendix C.
After the analysis of the practitioners’ feedback, the study proceeded to
discuss the findings and to recommend the VE methods that may be used to

124
improve green building outcomes. This was based on the three areas of
obtaining data, i.e., the triangulation method of data collection and analysis.
3.14 Data Analysis Plan
Before starting the main statistical data analysis, the reliability of the
students and VE practitioners’ surveys were tested using Cronbach’s alpha
measure. Thereafter, various descriptive statistical analyses, ANOVA, and
logistic regression were conducted on the data. The analyses provided the basis
for selecting the best VE method that has the best sustainability outcomes.
Specifically, SAS was used in the analysis. In addition to descriptive statistics of
the student ratings, faculty ratings, and VE practitioners’ survey feedback, One-
way ANOVA utilizing Duncan’s Multiple Comparisons was used to test if there
was any significant difference among the different VE methods. Statistically
significant variables were further investigated using t-test statistical measure in
order to find out the level of significant difference between the variables.
Qualitative themes was developed and discussed from the survey feedback of
the VE practitioners. Also, logistic regression was employed in the analysis of
the VE practitioners’ survey results to investigate whether their agreement with
the identified VE limitations in negatively impacting green building outcome had
significant effect on their ability to accept the identified limitations as true or
actual limitations in the conventional VE.
3.14.1 Assumptions. As with any univariate or multivariate statistical
process, the statistical analysis procedure involved in this study was based on
several key assumptions. One of assumption was that the observations were
independent. It was assumed that there were no interactions of students in the

125
event of answering the survey questionnaires. Each student answered the
questionnaire without any form of consultation with the team members.
The procedure also depended on the assumption that the observations on
the variables followed a normal distribution and that there was random
assignment, sampling, and placement of subjects in the study groups, methods
or teams. Also, there was no systematic missed data. Thus, the data and results
were considered representative of a wider population of interest.
3.15 Summary of Research Methodology
The research methodology section has documented the avenues for the
VE research. CBA decision method and LEED rating method has been chosen
as the significant VE decision method and building sustainability outcome
measure respectively. Various limitations of conventional VE methods have been
presented and the respective avenues for countering the limitations have also
been documented. The alternative VE methods or approaches and respective
combinations have been proposed and presented in the experimental study
design. For example, the PW approach has been proposed to re-orient VE
process towards enhancing performance and quality improvements. Also, NLP
has been proposed to enhance team effort in creativity phase while CBA method
is to improve evaluation process of alternatives in the evaluation phase.
CTR building has been identified as the case study building. The VE
students employed the alternative VE approaches as well as the conventional VE
process, also called the control VE process, to prepare and present VE final
project reports. The objective is to use the case study in testing the effectiveness

126
of the different VE methods in achieving building sustainability outcomes. A
survey is administered to the students to get their opinions of the VE methods.
Further, the research methodology stipulates the inclusion of faculty
member evaluators whose duties are to review and rate the reports based on
sustainability criteria. Special emphasis is placed on the contribution of the
recommended systems to improving sustainability outcomes. Statistical analysis
of the ratings and students’ surveys is used to decide on the VE method that is
superior in achieving building sustainability outcomes. These are summarized in
Figure 3-1.
In Figure 3-1, the building sustainability drivers are considered in the
modified VE process through coordinated team effort. The major areas for
changes in the VE methods are marked with green color in the VE methodology
section, i.e., job plan. There are alternative VE approaches and combinations
which are tested in the VE job plan. It is hypothesized that the alternative VE
methodology will yield a sustainable building outcome with better value for the
owner considering the performance and quality requirements, i.e., sustainable
building quality requirements, optimal energy use, and other significant indicators
based on the owner’s project requirements.
The VE practitioners from the construction industry have been outlined to
form the platform for validating the VE methodology. A presentation to the
practitioners about the limitations of conventional VE, the characteristics of the
new VE methods and an online survey are central to getting their feedbacks
about the validity and reliability of the modified VE methodology.

127
Table 3-1. Summary of the limitations and approaches to counter the limitations in the conventional VE method. VE phases Conventional VE Modified VE
Function analysis phase
1. Over-emphasis on cost, sometimes at the expense of performance and quality.
1. Uses PW approach to re-orient VE from over-emphasis on costs to performance or quality thinking.
Creativity phase 1. Does not promote creativity. 1. Uses NLP to promote or improve VE team effort and idea creation.
Evaluation phase
1. Determining criteria in the pre-study phase and using them in evaluation phase.
1. CBA does not use criteria in evaluation and delays generation of factors till creativity or evaluation phase when alternatives have been developed.
2. Uses pair-wise comparisons to determine relative importance of each alternative.
3. Abstract allocation of weights to criteria.
2. CBA uses factors in place of criteria and does not use pair-wise comparison method which operates on abstract terms and abstract allocation of weights to criteria.
4. Uses both advantages and disadvantages of alternatives in evaluation.
3. CBA focuses only on advantages.
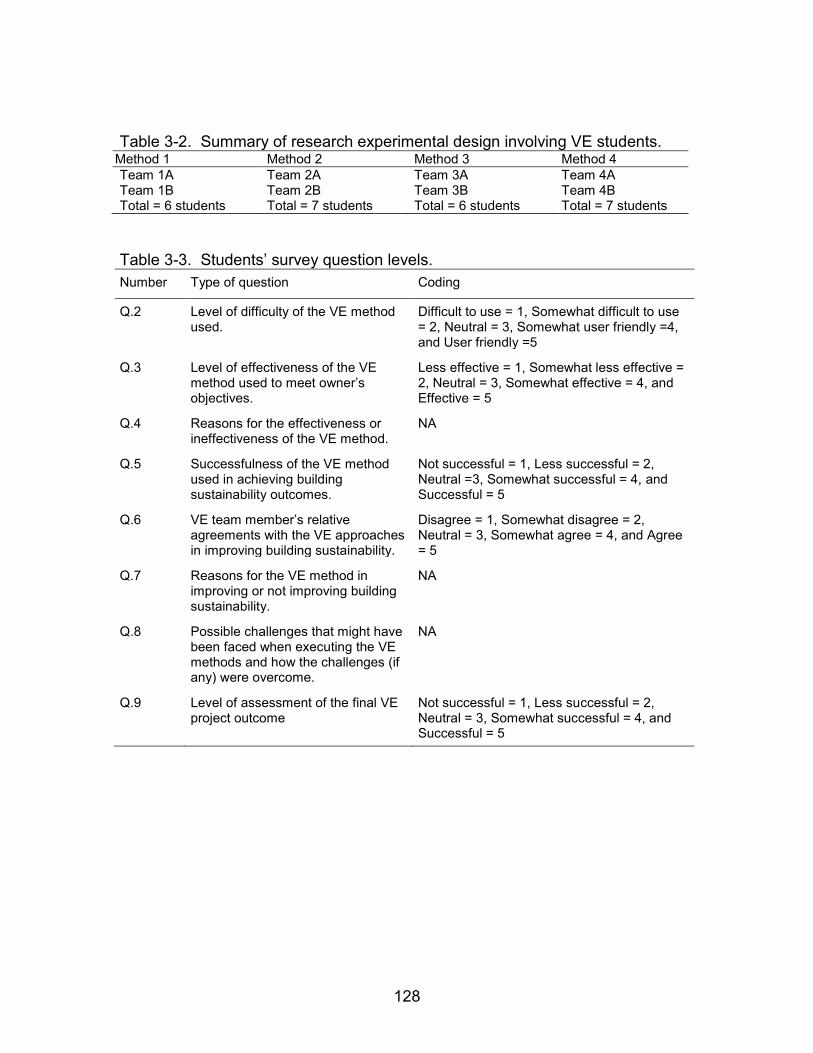
128
Table 3-2. Summary of research experimental design involving VE students.
Method 1 Method 2 Method 3 Method 4
Team 1A Team 2A Team 3A Team 4A Team 1B Team 2B Team 3B Team 4B Total = 6 students Total = 7 students Total = 6 students Total = 7 students
Table 3-3. Students’ survey question levels.
Number Type of question Coding
Q.2 Level of difficulty of the VE method used.
Difficult to use = 1, Somewhat difficult to use = 2, Neutral = 3, Somewhat user friendly =4, and User friendly =5
Q.3 Level of effectiveness of the VE method used to meet owner’s objectives.
Less effective = 1, Somewhat less effective = 2, Neutral = 3, Somewhat effective = 4, and Effective = 5
Q.4 Reasons for the effectiveness or ineffectiveness of the VE method.
NA
Q.5 Successfulness of the VE method used in achieving building sustainability outcomes.
Not successful = 1, Less successful = 2, Neutral =3, Somewhat successful = 4, and Successful = 5
Q.6 VE team member’s relative agreements with the VE approaches in improving building sustainability.
Disagree = 1, Somewhat disagree = 2, Neutral = 3, Somewhat agree = 4, and Agree = 5
Q.7 Reasons for the VE method in improving or not improving building sustainability.
NA
Q.8 Possible challenges that might have been faced when executing the VE methods and how the challenges (if any) were overcome.
NA
Q.9 Level of assessment of the final VE project outcome
Not successful = 1, Less successful = 2, Neutral = 3, Somewhat successful = 4, and Successful = 5

129
Table 3-4. Survey questions specific to VE and green building outcome
Number Type of question Coding
Q.9 Whether or not to accept the various limitations in conventional VE process.
Yes = 1, No = 0
Q.10 Degree of agreement with the various limitations in conventional VE process in negatively impacting green building outcomes.
Strongly disagree = 1, Disagree = 2, Neither agree or Disagree = 3, Agree = 4, and Strongly agree = 5
Q.11 Level of satisfaction with the VE methods in meeting or improving building sustainability outcomes.
Very dissatisfied = 1, Dissatisfied = 2, Somewhat dissatisfied = 3, Neutral = 4, Somewhat satisfied = 5, Satisfied = 6, and Very satisfied = 7
Q.12 Additional thoughts or comments on VE and green building. NA

130
Figure 3-1. Summary of the areas where changes occur to attain sustainable
building.

131
CHAPTER 4 RESULTS
4.1 Overview
This section will present the results from the data analysis. Both
quantitative and quantitative data analysis results will be presented. The results
will aid in concluding on the best VE approach that focuses on improving building
sustainability outcomes.
First, there will be presentation of the results of reliability analysis of the
quantitative data for each of the VE methods investigated. This will be followed
by presentation of the descriptive statistics of the survey question variables for
each method. Analysis of variance will be conducted to test the level of difference
among the various VE methods based on the survey question variables and
building sustainability variables. The ANOVA results will be presented,
whereupon the significant results will be further investigated and presented using
t-test statistics.
4.2 Reliability of the Students Survey Data
The reliability of data was tested using Cronbach’s alpha as a measure or
coefficient of reliability. Table 4-1 gives acceptable levels of the reliability
coefficients.
Cronbach’s alpha was calculated for the survey questions. Table 4-2
shows the results of the reliability estimates of the four quantitative or numerical
survey questions results. The questions pertained to the level of difficulty of the
VE method, the effectiveness of the VE method, and the successfulness of the
VE method in meeting objectives and improving building sustainability. Table 4-2
gives the results from the reliability analysis of the survey questions.

132
The reliability coefficients showed results ranging from 0.68 to 0.95 which
implied that the questions and scaling could be minimally accepted in some
cases or could be shortened in others. Overall, the average value of reliability
coefficient (α = 0.81) for the VE methods implied very good level of reliability
according to the tabulated criteria of interpretation of the reliability coefficients
(Devellis, 1991).
4.3 Descriptive Statistics of Students Survey Data
Statistical analysis, using Statistical Analysis System (SAS v9.3) software,
was conducted on the quantitative aspect of the students’ survey questionnaire.
Each of the quantitative type of question items will be presented in this section. A
summary of the questions descriptive statistics will be presented at the end.
4.3.1 Level of Difficulty of the VE Method (Q.2)
Table 4-3 shows the results of the frequency distribution of the
respondents’ responses on the difficulty level of the VE methods they used. In
terms of the level of difficulty of the methods, about one third of the respondents
(33.3%) found method 1 easy to use, 28.6% found method 2 user friendly, 41.7%
found method 3 easy to use, and 23. 8% found method 4 easy to use. Further,
about 16.7%, 21.4%, 41.7%, and 28.6% found the methods 1, 2, 3, and 4
respectively somewhat easy to use. A very negligible number of respondents
using method 2 (7.1%) and method 4 (4.8%) found the respective VE methods
difficult to use.
4.3.2 Level of Effectiveness the VE Method (Q.3)
Table 4-4 reports the frequency distribution for the level of effectiveness of
the VE methods used. About 33.3%, 14.3%, 16.7%, and 4.8% of the respondents

133
found methods 1, 2, 3, and 4 respectively effective in meeting owner’s objectives.
Half of the respondents (50%) using method 1 were neutral in evaluating the
effectiveness of the VE method. Almost half of the respondents (42.9%) using
method 2 believed it was somewhat effective. More than half of the respondents
(58.3%) found method 3 somewhat effective while about 38% of the method 4
users were neutral in the level of effectiveness of the method. A very negligible
number of respondents found method 4 less effective (4.8%).
4.3.3 Successfulness of the VE Method (Q.5)
Table 4-5 shows the frequency distribution for the variable pertaining to
the successfulness of the VE method in achieving building sustainability
outcomes. About 50% of the respondents who used method 1 believed that the
method was successful in achieving building sustainability outcomes. More than
half of the respondents who used method 2 (61.5%) believed that the method
was somewhat successful in achieving sustainability outcomes. About 58.3% of
those who used method 3 believed that the method was successful while those
who used method 4 were neutral in their assessments of success of the methods
(33.3%). Also, about 33.3% of those who used method 4 believed that it was
somewhat successful in achieving building sustainability. Very negligible number
of respondents in method 4 found the method less successful (9.6%).
4.3.4 Agreement with the VE Method in Improving Building Sustainability (Q.6)
Table 4-6 presents the frequency distribution for the level of agreement
with the VE method in improving sustainability in the building. About one third of
those who used method 1 (33.3%) agreed that the method could improve
building sustainability. About 40% of the respondents who used methods 2 and 3

134
respectively also agreed with the aim of the VE method. Method 4 users also
agreed in a relatively modest proportion (28.6%) with the VE method in improving
building sustainability. Fewer respondents who used method 4 somewhat
disagreed with the VE method in improving sustainability outcomes (9.5%).
4.3.5 Assessment of the Final VE Project Outcome (Q.8)
Table 4-7 shows the respondents’ level of assessment of the final VE
project outcome. Majority of the respondents who used method 1 (83.3%) and all
who used method 2 (100%) believed that their VE final project outcome was
successful. About 60% and 40% of the respondents who used method 3 believed
the final project outcome was successful and somewhat successful respectively.
Only 20% of those who used method 4 believed that their project outcome was
successful, with about 60% reporting that the outcome was somewhat
successful.
4.3.6 Summary of the Students Ratings Supported with Qualitative Data
Table 4-8 shows the averages of the ratings. The averages are presented
and also supported with qualitative data from the survey.
The averages for the teams 1A and 1B that used method 1, i.e., the
control teams that used conventional VE, showed that the method was relatively
user friendly (M = 3.50, SD = 1.38) and that it was relatively effective in meeting
owner’s requirements (M = 3.83, SD = 0.98). The qualitative survey data showed
that good level of team effort and the use of cost-worth approach were the main
avenues that contributed to appreciable level of effectiveness of the method to
meet owner’s objectives. The averages also showed that method 1 was
somewhat successful in achieving building sustainability oriented outcomes (M =

135
3.83, SD = 0.98). An appreciably high level of agreement with the VE method in
improving building sustainability was recorded (M = 4.00, SD = 0.89). However,
respondents reported some challenges in finding accurate information and real
worth of building systems. Qualitative survey data showed a notable challenge in
finding cost data of the various building systems. Teams reported their attempts
to remedy the challenges. This included separating or decomposing the systems
into different parts for analysis purposes and comparing among different systems
to select the best ones. Overall, the respondents believed that method 1 resulted
in a successful VE final report (M = 4.83, SD = 0.41).
The teams 2A and 2B that used method 2, i.e., the teams that used
conventional VE and PW, found the method to be relatively user friendly (M =
3.50, SD = 1.29). Noteworthy, they found the VE approach to exhibit great
potential of success when used with the aim of achieving building sustainability
outcomes (M = 4.08, SD = 0.64). This was further shown by their higher rating of
the level of agreement with the VE method in improving building sustainability
outcomes (M = 4.20, SD = 0.79). However, respondents appeared indifferent in
their evaluations on the level of effectiveness of the VE method in meeting
owner’s requirements (M = 3.36, SD = 1.28). Nonetheless, qualitative data from
the survey showed a considerable number of respondents who held that PW was
effective in identifying systems for evaluations with the main aim of achieving
building superior sustainability outcomes. Challenges in using the method 2 were
reported by respondents, which included inability to identify and calculate the
number of LEED points associated with some specific building systems as well
as difficulty in determining performance criteria of some building systems. In spite

136
of the challenges, the teams believed that method 2 fully facilitated their
completion of final VE project and that it was successful in meeting owner’s
requirements (M = 5.00, SD = 0.00).
The teams 3A and 3B that used method 3, i.e., teams that used CBA and
PW, indicated that the method was relatively easy to use (M = 4.08, SD = 1.08)
and that it was relatively successful in achieving building sustainability outcomes
(M = 4.25, SD = 0.97). Contingent to this success was the teams’ greater level of
agreement with the method in improving building sustainability outcomes (M =
4.17, SD = 0.83). Qualitative survey data showed that the method allowed the
teams to focus more on sustainability factors rather than the budget.
Respondents reported that they achieved successful final VE project outcomes
(M = 4.60, SD = 0.55). However, the teams cited a major challenge in using the
CBA process and this was in determining the importance of advantage points
which they said was difficult to quantify and largely depended on the experience
of the team members.
The last group of teams 4A and 4B that used method 4, i.e., method
utilizing CBA, PW, and NLP, recorded an average of 3.38 (SD = 1.28) on the
level of difficulty scale implying that there was a considerable level of indifference
in the assessment of the difficulty level of method 4 employed. The survey
respondents were found to be neutral concerning the level of effectiveness of the
method used in meeting owner’s needs, i.e., the level of effectiveness of the
method used could have or could have not significantly influenced the VE
outcomes (M = 3.05, SD = 0.97). Method 4 was relatively successful in achieving
building sustainability (M = 3.71, SD = 0.97). The respondents showed a

137
considerably good level of agreement with the method in improving building
sustainability (M = 3.76, SD = 1.00). Qualitative survey data from the
respondents stated that NLP required more time to be more effective in the VE
process. Thus, they concluded that the VE final project outcome was not as
successful as expected (M = 4.00, SD = 0.71). Qualitative data also showed that
some of the team members in teams 4A and 4B faced challenges in determining
the importance of advantage points in CBA method and in identifying LEED
points for determining PW. Also, some members stated that CBA was subjective
and lacked a standard scale of measurement. Other members of teams 4A and
4B held that the CBA method was very easy to use once there is mastery of the
procedure. Teams evaluated the method and concluded that it required good
level of experience and continuous practice beyond class projects so as to fully
master it. Respondents reported that the NLP approach aided in improving
method 4 by improving communication and understanding among VE team
members and thereby enhancing creativity.
4.4 Analysis of Variance of the Students Survey Data
An analysis of variance (ANOVA) statistical test was conducted so as to
investigate the level of difference in the variance of results obtained from the
students’ quantitative survey data about the VE methods they used, i.e., methods
1, 2, 3, and 4. One-way analysis of variance results showed that the question
level that pertained to the respondents’ assessment of final VE outcome was
statistically significant, [F (3, 17) = 4.10, p = .023]. However, there was no
statistically significant difference (p > 0.05) among the VE methods for the
question levels that pertained to the level of difficulty of the VE method, [F (3, 49)

138
= 0.85, p = .474], the effectiveness of the method to meet the owner’s objectives,
[F (3, 49) = 1.86, p = .148], the successfulness of the VE method in achieving
sustainability, [F (3, 48) = 1.06, p = .375], and the level of agreement by the VE
team member with the method in improving building sustainability, [F (3, 45) =
0.77, p = .517]. Table 4-9 shows a summary of the ANOVA results.
The statistically significant result variable was presented to show the
nature and/or level of significant difference among the different VE methods.
Table 4-10 gives a summary of the results, whereupon Duncan’s Multiple Range
Test was used to illustrate the differences.
The results from Duncan’s Multiple Range Test (at p = 0.05) for
assessment of final VE project outcome variable showed that method 2 was
superior to all the other methods, i.e., it had the highest average value. Table 4-
10 shows that even though the method 2 was the highest in average, it was not
significantly different from method 1 and method 3 because of the existence of
same letter grouping A. However, method 4 was found to be significantly different
(at p < 0 .05) from the other two VE methods 1 and 2. Follow-up comparison
tests were conducted to determine their levels of differences with method 4.
4.4.1 Follow-up comparison tests. The methods 1 and 2 were
compared with method 4. Critical review showed that method 3 was not
significantly different from method 4 due to same letter grouping and so was not
investigated. The t-test statistics was the basis of the pair-wise comparisons.
Statistically significant different results were recorded for the two pair-wise
tests at p < 0.5. A higher p-value was recorded for the analysis between method
1 and method 4, [t (9) = 2.45, p = .037] while a lower p-value was recorded for

139
the analysis between method 2 and method 4, [t (8) = 3.16, p = .013]. This
implied that method 2 was more significantly different than method 3 when
compared to method 4.
4.5 Faculty Evaluation of Students VE Final Reports
Results of the analysis of the VE final reports showed that similar building
systems were developed and recommended for construction by various teams
1A, 1B, 2A, 2B, 3A, 3B, 4A, and 4B using methods 1, 2, 3, and 4 respectively.
The similar systems developed included curtain wall systems, Heating Ventilating
and Air Conditioning (HVAC), plumbing, lighting, window, flooring, and ceiling
systems. Summary of the recommended systems are shown in Appendix A.
The data from faculty evaluations were quantitative. They evaluated the
VE reports and rated the reports using pre-set criteria. The analysis of the ratings
was focused on three areas of sustainability from the LEED rating system
perspective, i.e., energy and atmosphere, materials and resources, and indoor
environmental quality LEED credit categories. This is because these areas were
aligned with the dependent variables for this research, i.e., building energy and
building sustainable quality. Also, a variable called sustainability measure was
created by aggregating the data in the three categories. The goal of the
sustainability measure variable was to determine how the VE methods performed
relative to improving overall building sustainability outcomes. The descriptive
statistics and ANOVA results of the sustainability variables and VE methods are
presented in this section.

140
4.6 Descriptive Statistics of the Recommended Systems
Statistical analysis, using SAS v9.3 software, was conducted for the
faculty rating data and/or variables. Each of the variables will be presented in this
section. A summary of the descriptive statistics will be presented at the end
before presentation of ANOVA and t-test results.
4.6.1 Energy and Atmosphere
Table 4-11 contains the descriptive frequency distribution for the building
systems that were developed to contribute towards energy and atmosphere
LEED credit category. The teams that used method 1 developed systems that
majorly contributed fairly towards this sustainability credit category (44.5%) while
method 2 and method 3 users developed systems that mainly had good
contribution (28.6%). Method 4 users developed systems that mainly had a
somewhat fair contribution (46.2%). About 11.1% of systems developed by
method 1, 23.8% of systems developed by method 2, 20% of systems developed
by method 3, and 23% of systems developed by method 4 users contributed
excellently to this LEED credit category. An appreciable number of systems
developed by method 2 also showed a very good contribution (23.8%). The
results showed a considerable level of contribution of systems to energy and
atmosphere credits, thus meeting the sustainability objective of optimum energy
use or consumption.
4.6.2 Materials and Resources
Table 4-12 shows the frequency distribution for the contribution of systems
that were developed towards achieving materials and resources LEED credit
category. Majority of systems developed by method 1 and method 3 users had

141
fair contribution to the LEED credit category (38.7%). Teams that used method 2
developed systems that had little contributions to the sustainability credit
(69.2%). Method 4 users developed systems that culminated in relatively high
levels of contributions to the credit category (26.3%). Noteworthy is that the users
of methods 1, 2, and 3 did not develop systems that contributed excellently
towards this sustainability LEED credit category, only method 4 did but in a
negligible amount (5.2%).
4.6.3 Indoor Environmental Quality
Table 4-13 shows the frequency distribution for systems developed to
contribute towards indoor environmental quality LEED credits. Majority of
systems developed by methods 1, 2 and 3 users had fair contribution to the
LEED credit category while systems developed by method 4 recorded good level
of contribution. Noteworthy is that the systems developed by methods 1, 2, and 3
did not contribute excellently to this LEED credit category, only method 4 users
did but with a small proportion (5.9%). Method 2 users followed closely with
about 30% of systems recording a relatively high level of contribution to this
sustainability credit category.
4.6.4 Summary of the Faculty Ratings of the Systems’ Contributions to the LEED Credits Categories and Overall Sustainability Measure
Table 4-14 shows a summary of descriptive statistics for the three LEED
credit categories and overall sustainability measure outcome. On average,
method 1 teams developed systems that had good contribution towards energy
and atmosphere LEED credit category (M = 2.56, SD = 1.38). It fairly contributed
towards materials and resources credits (M = 2.14, SD = 0.95), indoor and
environmental quality credits (M = 2.17, SD = 0.83) and overall sustainability

142
measure (M = 2.32, SD = 1.22). Those teams that used method 2 developed
systems which on average had good contribution towards energy and
atmosphere credits (M = 3.43, SD = 1.21), indoor environmental quality credits
(M = 2.70, SD = 1.06) and overall sustainability measure (M = 2.75, SD = 1.35)
and a fair contribution to materials and resources LEED credit category (M =
1.69, SD = 1.11). Method 3 teams’ systems recorded relatively good contribution
to energy and atmosphere credit category (M = 2.95, SD = 1.43) and fair
contribution for both materials and resources (M = 1.69, SD = 0.63) and indoor
environmental quality credit categories (M = 1.75, SD = 0.75). The VE method
also contributed fairly to overall sustainability outcome measure (M = 2.27, SD =
1.23). Method 4 teams developed systems that had relatively good contribution
to energy and atmosphere (M = 2.54, SD = 1.76), materials and resources
credits (M = 2.74, SD = 1.24) and overall sustainability measure (M = 2.57, SD =
1.37) and a fair contribution to indoor environmental quality LEED credit category
(M = 2.41, SD = 1.23).
4.7 Analysis of Variance of the Faculty Evaluations
An analysis of variance was conducted to find out the level of significant
differences among the methods in achieving the sustainability outcomes as
quantified from the respective contributions of different building systems to
various LEED credit categories. The results showed that materials and resources
LEED credit category was statistically significant, [F (3, 55) = 3.73, p =.0164],
while energy and atmosphere, [F (3, 68) = 1.60, p =.197], and indoor
environmental quality, [F (3, 47) = 1.81, p =.159] LEED credit categories were not
statistically significant. Also, overall sustainability measure variable was not

143
significantly different among the methods, [F (3, 178) = 1.40, p =.244]. Table 4-15
shows a summary of ANOVA results.
In order to investigate the differences among the methods for the
materials and resources credit which was statistically significant, Duncan’s
Multiple Range Test was conducted. The results were summarized in Table 4-16.
Duncan’s multiple range tests results showed that method 4 was superior
to all other methods in achieving sustainability outcomes under LEED credit
category of materials and resources. From Table 4-16, it can be deduced that
method 4 was significantly different from methods 2 and 3 because they had
different letter groupings, and not significantly different from method1 because
they shared letter A. The levels of significant differences between the two VE
methods were further investigated using pair-wise comparisons.
4.7.1 Follow-up Comparison Tests for the Materials and Resources
Credits. Methods 2 and 3 were compared with method 4 so as to quantify the
level of statistical significant differences. As previously mentioned, method 1 was
not significantly different from method 4 and so was not investigated. The t-test
statistics was the basis of the pair-wise comparisons.
Statistically significant results were obtained for the two pair-wise
comparison tests at p = 0.5. A higher p-value was recorded for the analysis
between method 2 and method 4, [t (30) = -2.44, p = .0208] while a lower p-value
was recorded for the analysis between method 3 and method 4, [t (30) = -2.79, p
= .0091]. This implied that method 3 was more significantly different than method
2 when both were each compared to method 4.

144
4.8 VE Practitioners Presentation and Survey Feedback
The data from the survey of VE practitioners from construction industry
were analyzed. Prior to the analysis, e-mail was sent to about 55 VE
practitioners. Out of the 55, 13 expressed their interest and willingness to take
part in the research. Of the 13 who accepted, 8 attended the presentation.
However, only 7 completed the survey which was administered immediately after
the presentation. Therefore, the study comprised of only seven VE practitioners
(N = 7) who actually completed the full requirements of the research.
The data were both quantitative and qualitative types (mixed method).
Data analysis was mainly focused on the limitations of the conventional VE and
the ability of the VE method combinations in meeting or improving building
sustainability outcomes, i.e., the methods as presented in the survey were
combined to match the methods as presented in the previous experimental
design. The descriptive statistics, ANOVA, and logistic regression results of the
conventional VE and alternative VE combinations are presented in this section.
4.8.1 Demographics of the VE Practitioners
Those who completed the survey were Certified Value Specialists (CVS),
professors from universities, directors and presidents of companies, construction
managers, and civil engineers. They were from different regions, i.e., from USA,
Europe, South Africa, Saudi Arabia, and Australia.
About 72% of the respondents had over 20 years of experience working in
construction industry while 14% of them were 6-10 years and 11-15 years of
experience respectively. Considering all their experience levels, 100% of the
respondents had used VE in their projects while 57% had used LEED or other

145
green building rating systems. Of those who had used VE in their projects, about
72% of them were over 20 years of experience working with VE while 14% of
them had 11-15 years and 16-20 years of experience respectively. For those who
had worked with green building assessment tools like LEED, approximately 50%
of them had 6-10 years of experience working with it while 25% had 2-5 years
and 16-20 years respectively in working with the building sustainability tool.
The respondents were also asked about the description of their respective
construction companies. A complete 100% of the respondents reported that their
companies specialized in VE while construction management and cost
engineering areas of specialization accounted for 29% of the respondents
respectively. About 14% were involved in general contracting while about 29%
were in business management and risk management field. Their company
projects were mainly commercial (57%) and industrial (57%). Others were heavy
civil (29%), manufacturing and mining (29%), and residential projects (14%).
4.8.2 Reliability of the VE Practitioners Survey Data
Cronbach’s alpha was the measure of reliability. Table 4-1 from Devellis
(1991) shows acceptable reliability coefficients relevant for this research.
Cronbach’s alpha was calculated for the survey questions. Table 4-17
shows the results of the reliability estimates for the three major quantitative
survey question areas. The questions pertained to the limitations in the
conventional VE process and they were; a) whether or not the VE practitioners
agreed with the limitations identified in the presentation and survey as actual or
true limitations in the conventional VE methods process based on their
experience from the field, b) VE practitioners’ levels of agreement with the

146
identified limitations relative to negatively impacting green building outcomes,
and c) the VE practitioners’ levels of satisfaction with the VE methods
combinations in improving green building outcomes. Table 4-17 gives the
summary of reliability indices and analysis of the survey questions.
The reliability coefficients ranged from 0.51 to 0.81 which implied that the
questions and scaling were unacceptable in some cases and very good in others.
Noteworthy is that the most important question item on VE methods was highly
reliable (α = 0.81) according to the tabulated criteria of interpretation of the
reliability coefficients (Devellis, 1991). It can be deduced that the low reliability
indices for Q.9 and Q.10 could have resulted from the VE practitioners’
unwillingness to accept potential drawbacks in their routine VE practices.
4.8.3 Descriptive and Logistic Regression Analysis of the Limitations of Conventional VE and their Impact on Green Building Outcomes
With ASTM E1699-10 as the basis of reference for the conventional VE,
the following limitations were identified:
Determining criteria in the pre-study phase and using them in the evaluation phase.
Over-emphasis on cost, sometimes at the expense of performance and quality.
Does not promote or improve creativity.
Use of pair-wise comparisons to determine relative importance of each alternative.
Abstract allocation of weights to criteria.
Use of both advantages and disadvantages in evaluation phase.
The VE practitioners were asked whether or not they accepted the
limitations identified in the conventional VE process as actual or true limitations

147
based on their industrial or field VE experiences. Also, they were asked whether
or not the identified limitations would negatively impact green building outcomes
based on their opinions from the presentations and field experiences.
Considering the responses to the limitations on whether or not they were
true or actual limitations, more than half of the respondents (57.1%) each
believed that the criteria determination in the pre-study phase and over-emphasis
on cost were indeed limitations. A similar percentage (57.1%) believed that the
conventional VE method does not promote or improve creativity and that it uses
abstract allocation of weights to criteria. Noteworthy, majority of respondents
believed that pair-wise comparisons (71.4%) and use of both advantages and
disadvantages in evaluation (85.7%) were not limitations in the conventional VE.
The responses to the limitations were summarized in Table 4-18.
Considering the negative impact of the limitations to green building
outcomes, varied opinions existed about the criteria determination in the pre-
study phase. The results were relatively well spread concerning the level of
agreement with the limitation in reducing sustainability outcomes (M = 3.43, SD =
1.27). About half of the respondents (42.9%) disagreed with the limitation
pertaining to over-emphasis on cost while about 28.6% strongly agreed that it
was actually a limitation relative to negatively impacting green building outcomes
(M = 3.29, SD = 1.38). The limitation pertaining to the conventional VE not
promoting or improving creativity was somewhat received with skeptism.
However, about 28.6% of the respondents were in agreement with it being a
limitation (M = 2.57, SD = 1.27). A near similar response was recorded for pair-
wise comparisons of criteria as a limitation except 42.9% who disagreed (M =
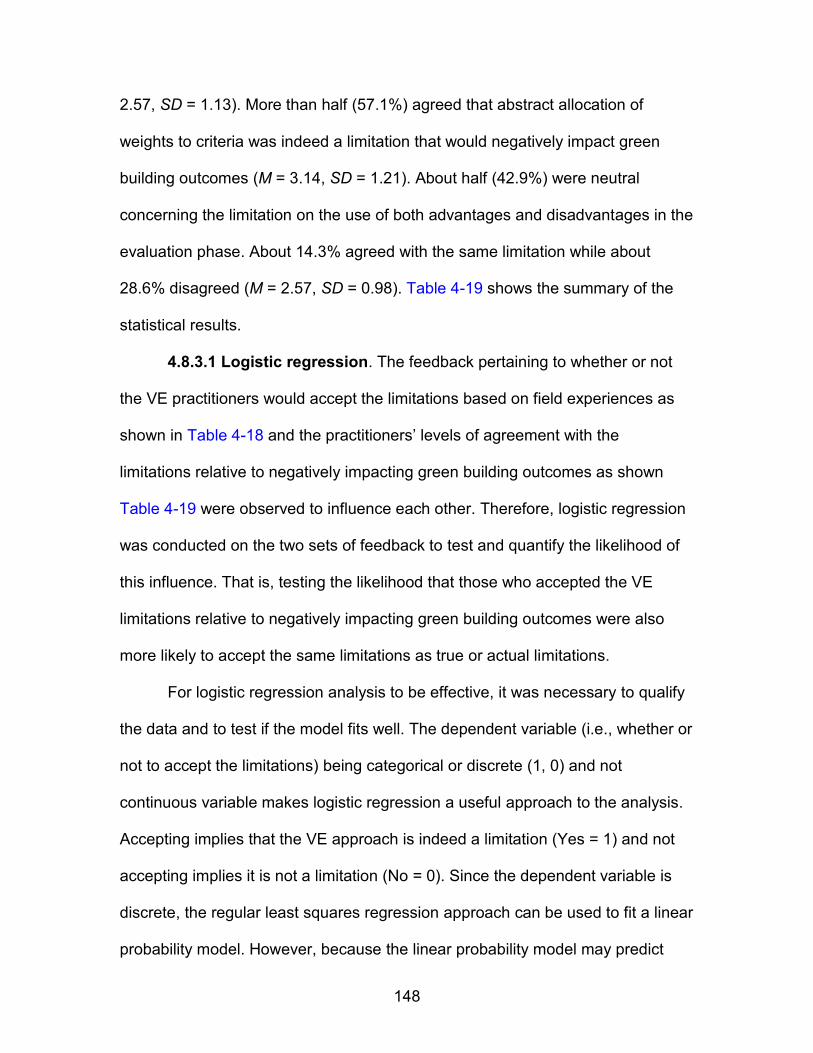
148
2.57, SD = 1.13). More than half (57.1%) agreed that abstract allocation of
weights to criteria was indeed a limitation that would negatively impact green
building outcomes (M = 3.14, SD = 1.21). About half (42.9%) were neutral
concerning the limitation on the use of both advantages and disadvantages in the
evaluation phase. About 14.3% agreed with the same limitation while about
28.6% disagreed (M = 2.57, SD = 0.98). Table 4-19 shows the summary of the
statistical results.
4.8.3.1 Logistic regression. The feedback pertaining to whether or not
the VE practitioners would accept the limitations based on field experiences as
shown in Table 4-18 and the practitioners’ levels of agreement with the
limitations relative to negatively impacting green building outcomes as shown
Table 4-19 were observed to influence each other. Therefore, logistic regression
was conducted on the two sets of feedback to test and quantify the likelihood of
this influence. That is, testing the likelihood that those who accepted the VE
limitations relative to negatively impacting green building outcomes were also
more likely to accept the same limitations as true or actual limitations.
For logistic regression analysis to be effective, it was necessary to qualify
the data and to test if the model fits well. The dependent variable (i.e., whether or
not to accept the limitations) being categorical or discrete (1, 0) and not
continuous variable makes logistic regression a useful approach to the analysis.
Accepting implies that the VE approach is indeed a limitation (Yes = 1) and not
accepting implies it is not a limitation (No = 0). Since the dependent variable is
discrete, the regular least squares regression approach can be used to fit a linear
probability model. However, because the linear probability model may predict

149
probabilities exceeding the 0-1 range, logistic regression approach is used to
estimate the likelihood or factors that influence the relative decisions.
Hosmer-Lemeshow Goodness-of-Fit Test is a statistics that test the null
hypothesis that the logistic regression fits well, i.e., H0 = logistic regression fits
well. The analysis result showed a p-value = 0.5431 from the hypothesis test.
Thus, the non statistical significance test result leads to a conclusion that the
model fits well. So it is okay to use logistic regression. The estimated odds ratio
for the ‘sustainability outcome’ variable coefficient is 6.12 with a 95% confidence
limit of (2.21, 16.93) suggesting that the VE practitioners who, in overall, agreed
with the limitations in negatively impacting green building outcomes were about 6
times more likely to accept the limitations as true or actual limitations in the
conventional VE than those who relatively disagreed with them.
The maximum likelihood estimates, i.e., estimates of beta-0 (intercept) is -
5.94 while beta-1 (slope of sustainability) is 1.811, showing positive slope. A
likelihood ratio test of null hypothesis is conducted, i.e., H0: beta-1 = 0. Since the
p value is very small, i.e., p <. 0001, we reject the null hypothesis and conclude
that the VE practitioners’ decisions pertaining to the limitations negatively
impacting green building outcomes had a significant effect on the probability of
the VE practitioners accepting the limitations as actual or true limitations in
conventional VE based on their experiences from the field. Thus, those VE
practitioners who were more likely to strongly agree (rating = 5) that the
limitations had negative impact to green building outcomes were more likely to
accept the limitations as true limitations in the conventional VE (probability~1).
Figure 4-1 shows a graphical plot of the probability estimates.

150
4.8.4 Descriptive Statistics of the Levels of Satisfaction with the VE Method Combinations to Improve Building Sustainability Outcomes
VE method combinations were identified as potential avenues to counter
the limitations in the conventional VE. VE practitioners were offered a
presentation and then given survey in order to document their opinions about the
authenticity of the VE approaches, especially their efforts to counter the
limitations relative to improving green building outcomes. The data for the level of
satisfaction with the VE methods combinations to improve building sustainability
were analyzed using SAS v9.3. Specifically, frequency distributions of the
different response categories were analyzed and presented. They were in 7-point
Likert scale: Very dissatisfied = 1, Dissatisfied = 2, Somewhat dissatisfied = 3,
Neutral = 4, Somewhat satisfied = 5, Satisfied = 6, and Very satisfied = 7.
Table 4-20 shows the frequency distribution of the practitioners’ levels of
satisfaction with the VE methods in improving building sustainability. Majority of
respondents (71.4%) expressed satisfaction with method 1 while 14.3% of the
respondents were somewhat satisfied and very satisfied respectively implying
that the method was sustainability oriented. Method 2 recorded about 64.3%
while method 3 and 4 had 50% and 47.6% of the respondents implying that
majority of the respondents were satisfied with the method. About 21.4% in
method 2 and 3 respectively and 14.3% each in method 1 and 4 expressed high
levels of satisfaction with the method implying that the VE methods had greater
potential to greening. In spite of these high levels of improvement capabilities of
the VE methods, about 4.8% of the respondents expressed dissatisfaction with
the VE method 4 implying relative inability to improve green building outcomes.

151
4.8.5 Summary of the VE Practitioners’ Levels of Satisfaction with VE Method Combinations to Improve Building Sustainability Outcomes
Table 4-21 shows the average results of the ratings for the level of
satisfaction with the VE methods. The averages are presented and supported
with qualitative data from the survey. From the table, it can be deduced that VE
practitioners believed that both method 1 (M = 6.00, SD = 0.58) and method 2 (M
= 6.00, SD = 0.78) were relatively better in improving green building outcomes
considering their relatively higher averages compared to method 3 (M = 5.71, SD
= 1.07) and method 4 (M = 5.43, SD = 1.16). This could be because of the
potential limitations as identified from the qualitative data. The data stipulate that
in as much as VE provides a systematic approach for studying alternatives to
improve performance, techniques like CBA work well for value planning studies
but not so much to VE studies on projects that are closer to design completion.
Some respondents held that CBA does improve the outcomes as it focuses on
the attributes in order to select the best one. Also, the qualitative data showed
that CBA includes subjective information (abstract rankings) which can introduce
potential flaw in the value analysis process. Specifically, a respondent held that
the alternatives should be identified early to provide needed guidance for the VE
team especially during brainstorming. Further, some held that using both CBA
and performance based VE with criteria based attributes will allow full approval of
the owner towards overall completion of the project, thus meeting owner’s needs.
Notably, the respondents upheld that NLP can be a good approach to creativity
especially when it is used in the context of a VE study as would many other
behavioral science methods.

152
The qualitative data also showed that value planning and VM are more
encouraged as opposed to VE. Some respondents held that VE has for a long
time been focused on reducing or cutting cost. Therefore, value planning and VM
are preferred concepts aimed at improving systems’ performance and quality
levels using function analysis as the basis of value analysis. Contingent to the
performance objective is where a respondent held that the biggest optimization in
the VE process can be achieved through the use of performance based attributes
weighted by the client prior to the start of the VE workshop. Function analysis
stimulates creativity and is easy to understand where teams use it in defining
things rather than as an activity like in critical path method.
On another stand point, some respondents held that VE, VM, and VA are
terms used and applied in different project stages. For example, VM is typically
applied as early as possible in the project with the aim of optimizing costs, VE is
applicable in all project stages and may be used for assessment of project
alternatives or refinement of systems, while VA may be applied at design stages.
Noteworthy is that they are all aimed at refining, reducing cost, and improving
performance of systems. Appendix C has value engineers’ comments on these
differences and more comments for the alternative VE approaches.
4.8.6 Analysis of Variance of the VE Methods towards Improving Sustainability
Analysis of variance was conducted to find the level of difference among
the VE methods in improving green building outcomes based on the satisfaction
data. There was no significant difference among the VE methods for the
sustainability outcome, [F (3, 52) = 1.14, p =.341]. Summary of the results are
shown in Table 4-22.

153
Duncan’s Multiple Range Test was conducted in order to characterize the
statistically significant differences among the VE methods. The results were
summarized in Table 4-23.
The results of Duncan’s multiple range tests showed that method 1 was
superior on average when compared to the other VE methods relative to
improving green building outcomes. Method 4, the method with all new variables
(NLP, PW, and CBA) recorded the lowest average. Noteworthy is that the
differences in means were not statistically significant as depicted from the same
letter groupings of the Duncan’s Multiple Range Test statistical results.
Table 4-1. Acceptable reliability estimates for a psychometric test.
Alpha coefficients Implied Reliability
Below 0.60 Unacceptable
Between 0.60 and 0.65 Undesirable
Between 0.65 and 0.70 Minimally acceptable
Between 0.70 and 0.80 Respectable
Between 0.80 and 0.90 Very good
Much above 0.90 Consider shortening the scale
*Source: Scale Development, Devellis (1991, p. 85).
Table 4-2. Reliability coefficients for survey question items for evaluating the VE
methods.
VE method/group Reliability coefficient Interpretation
Method 1 0.95 Consider shortening the scale
Method 2 0.68 Minimally acceptable
Method 3 0.81 Very good
Method 4 0.78 Respectable

154
Table 4-3. Level of difficulty of the VE method.
Method 1 Method 2 Method 3 Method 4
Difficulty Level
Number Percent Number Percent Number Percent Number Percent
1 1 7.1% 1 4.7%
2 2 33.3% 2 14.3% 2 16.6% 6 28.6%
3 1 16.7% 4 28.6% 3 14.3%
4 1 16.7% 3 21.4% 5 41.7% 6 28.6%
5 2 33.3% 4 28.6% 5 41.7% 5 23.8%
Total 6 100% 14 100% 12 100% 21 100%
Table 4-4. Level of effectiveness of the VE method.
Method 1 Method 2 Method 3 Method 4
Effectiveness Number Percent Number Percent Number Percent Number Percent
1 2 14.3% 1 4.8%
2 1 7.1% 1 8.3% 5 23.8%
3 3 50.0% 3 21.4% 2 16.7% 8 38.0%
4 1 16.7% 6 42.9% 7 58.3% 6 28.6%
5 2 33.3% 2 14.3% 2 16.7% 1 4.8%
Total 6 100% 14 100% 12 100% 21 100%
Table 4-5. Successfulness of the VE method in achieving building sustainability.
Method 1 Method 2 Method 3 Method 4
Successfulness Number Percent Number Percent Number Percent Number Percent
2 2 9.6%
3 3 50.0% 3 15.4% 4 33.4% 7 33.3%
4 1 16.7% 8 61.5% 1 8.3% 7 33.3%
5 2 33.3% 3 23.1% 7 58.3% 5 23.8%
Total 6 100% 13 100% 12 100% 21 100%
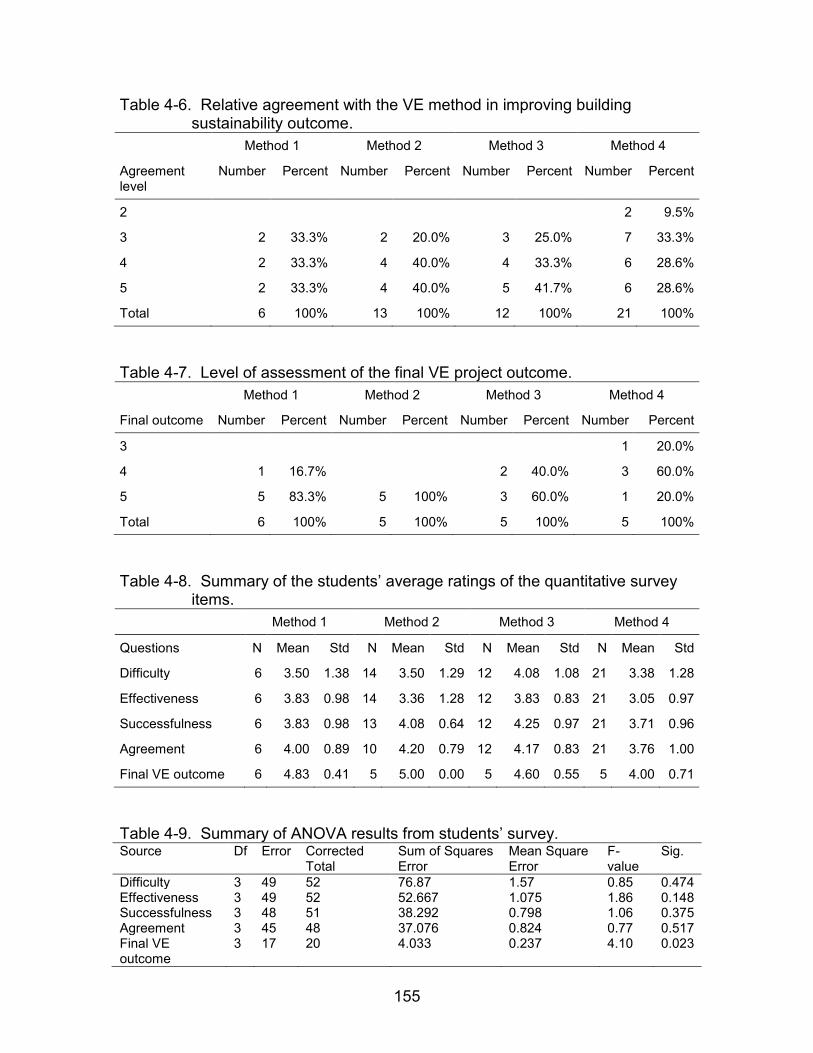
155
Table 4-6. Relative agreement with the VE method in improving building sustainability outcome.
Method 1 Method 2 Method 3 Method 4
Agreement level
Number Percent Number Percent Number Percent Number Percent
2 2 9.5%
3 2 33.3% 2 20.0% 3 25.0% 7 33.3%
4 2 33.3% 4 40.0% 4 33.3% 6 28.6%
5 2 33.3% 4 40.0% 5 41.7% 6 28.6%
Total 6 100% 13 100% 12 100% 21 100%
Table 4-7. Level of assessment of the final VE project outcome.
Method 1 Method 2 Method 3 Method 4
Final outcome Number Percent Number Percent Number Percent Number Percent
3 1 20.0%
4 1 16.7% 2 40.0% 3 60.0%
5 5 83.3% 5 100% 3 60.0% 1 20.0%
Total 6 100% 5 100% 5 100% 5 100%
Table 4-8. Summary of the students’ average ratings of the quantitative survey
items.
Method 1 Method 2 Method 3 Method 4
Questions N Mean Std N Mean Std N Mean Std N Mean Std
Difficulty 6 3.50 1.38 14 3.50 1.29 12 4.08 1.08 21 3.38 1.28
Effectiveness 6 3.83 0.98 14 3.36 1.28 12 3.83 0.83 21 3.05 0.97
Successfulness 6 3.83 0.98 13 4.08 0.64 12 4.25 0.97 21 3.71 0.96
Agreement 6 4.00 0.89 10 4.20 0.79 12 4.17 0.83 21 3.76 1.00
Final VE outcome 6 4.83 0.41 5 5.00 0.00 5 4.60 0.55 5 4.00 0.71
Table 4-9. Summary of ANOVA results from students’ survey. Source Df Error Corrected
Total Sum of Squares Error
Mean Square Error
F-value
Sig.
Difficulty 3 49 52 76.87 1.57 0.85 0.474 Effectiveness 3 49 52 52.667 1.075 1.86 0.148 Successfulness 3 48 51 38.292 0.798 1.06 0.375 Agreement 3 45 48 37.076 0.824 0.77 0.517 Final VE outcome
3 17 20 4.033 0.237 4.10 0.023

156
Table 4-10. Duncan's Multiple Range Test of the VE final project outcome.
Duncan Grouping Mean(M) Sample size (N) VE methods
A 5.00 5 2
A
A 4.83 6 1
A
B A 4.60 5 3
B
B 4.00 5 4
*Note that the means with the same letter groupings are not significantly different. Table 4-11. Systems contributions towards energy and atmosphere LEED credit
category.
Method 1 Method 2 Method 3 Method 4
Level of contribution
Number Percent Number Percent Number Percent Number Percent
1 4 22.2% 1 4.8% 4 20.0% 6 46.2%
2 8 44.5% 4 19.0% 4 20.0% 2 15.4%
3 6 28.6% 5 25.0%
4 4 22.2% 5 23.8% 3 15.0% 2 15.4%
5 2 11.1% 5 23.8% 4 20.0% 3 23.0%
Total 18 100% 21 100% 20 100% 13 100%
Table 4-12. Systems contributions towards materials and resources LEED credit
category.
Method 1 Method 2 Method 3 Method 4
Level of contribution Number Percent Number Percent Number Percent Number Percent
1 4 28.6% 9 69.2% 5 38.4% 4 21.1%
2 5 38.7% 7 53.9% 4 21.1%
3 4 28.6% 3 23.1% 1 7.7% 5 26.3%
4 1 7.1% 1 7.7% 5 26.3%
5 1 5.2%
Total 14 100% 13 100% 13 100% 19 100%

157
Table 4-13. Systems contributions towards indoor environmental quality LEED credit category.
Method 1 Method 2 Method 3 Method 4
Level of contribution
Number Percent Number Percent Number Percent Number Percent
1 3 25.0% 1 10.0% 5 41.7% 5 29.4%
2 4 33.3% 4 40.0% 5 41.7% 4 23.5%
3 5 41.7% 2 20.0% 2 16.6% 5 29.4%
4 3 30.0% 2 11.8%
5 1 5.9%
Total 12 100% 10 100% 12 100% 17 100%
Table 4-14. Summary of faculty ratings of systems contributions towards the
LEED credits categories and sustainability measure.
Method 1 Method 2 Method 3 Method 4
Category N Mean Std N Mean Std N Mean Std N Mean Std
Energy and Atmosphere
18 2.56 1.38 21 3.43 1.21 20 2.95 1.43 13 2.54 1.76
Materials and Resources
14 2.14 0.95 13 1.69 1.11 13 1.69 0.63 19 2.74 1.24
Indoor Environmental Quality
12 2.17 0.83 10 2.70 1.06 12 1.75 0.75 17 2.41 1.23
Sustainability Measure
44 2.32 1.22 44 2.75 1.35 45 2.27 1.23 49 2.57 1.37
Table 4-15. Summary of ANOVA results from faculty evaluations. Source Df Error Corrected
Total Sum of Squares Error
Mean Square Error
F-value Sig.
Energy and Atmosphere
3 68 71 137.77 2.03 1.60 0.197
Materials and Resources
3 55 58 58.94 1.07 3.73 0.0164
Indoor Environmental Quality
3 47 50 48.13 1.02 1.81 0.159
Sustainability Measure
3 178 181 295.41 1.62 1.40 0.244

158
Table 4-16. Duncan’s Multiple Range Test for the materials and resources LEED credit category ratings.
Duncan Grouping Mean Sample size (N) VE Methods
A 2.74 19 4
A
B A 2.14 14 1
B
B 1.69 13 3
B
B 1.69 13 2
*Note that the means with the same letter are not significantly different.
Table 4-17. Reliability coefficients of specific question items for VE practitioners.
Question item Reliability coefficient
Interpretation
Q.9 Whether or not the limitations identified are actual or true VE limitations
0.58 Unacceptable
Q.10 Level of agreement with the limitations in negatively impacting green building outcomes
0.51 Unacceptable
Q.11 Satisfaction with the VE methods combinations in improving sustainability outcomes
0.81 Very good
Table 4-18. Responses to the limitations in the conventional VE based on
Practitioners’ industrial experiences.
Yes No Total
Limitations Number Percent Number Percent Number Percent
1. Criteria determination in pre-study phase
4 57.1% 3 42.9% 7 100%
2. Over-emphasis on cost 4 57.1% 3 42.9% 7 100%
3. Does not improve creativity
3 42.9% 4 57.1% 7 100%
4. Use of pair-wise comparisons
2 28.6% 5 71.4% 7 100%
5. Abstract allocation of weights to criteria
4 57.1% 3 42.9% 7 100%
6. Use of both advantages and disadvantages
1 14.3% 6 85.7% 7 100%

159
Table 4-19. Responses to the limitations in the conventional VE relative to negatively impacting green building outcomes.
Strongly disagree
Disagree Neutral Agree Strongly Agree Total
Limitations in Conventional VE
Number Percent Number Percent Number Percent Number Percent Number Percent Number Percent
1. Criteria determination in pre-study phase
2 28.6% 2 28.6% 1 14.2% 2 28.6% 7 100%
2. Over-emphasis on cost
3 42.9% 1 14.2% 1 14.2% 2 28.6% 7 100%
3. Does not improve creativity
2 28.6% 1 14.2% 2 28.6% 2 28.6% 7 100%
4. Use of pair-wise comparisons
1 14.2% 3 42.9% 1 14.2% 2 28.6% 7 100%
5. Abstract allocation of weights to criteria
1 14.2% 1 14.2% 1 14.2% 4 57.4% 7 100%
6. Use of both advantages and disadvantages
1 14.2% 2 28.6% 3 42.9% 1 14.2% 7 100%

160
Table 4-20. Levels of satisfaction with the VE method combinations in improving
sustainability.
Method 1 Method 2 Method 3 Method 4
Satisfaction level
Number Percent Number Percent Number Percent Number Percent
3 1 4.8%
4 1 7.1% 3 21.4% 5 23.8%
5 1 14.3% 1 7.1% 1 7.1% 2 9.5%
6 5 71.4% 9 64.3% 7 50.0% 10 47.6%
7 1 14.3% 3 21.5% 3 21.5% 3 14.3%
Total 7 100% 14 100% 14 100% 21 100%
Table 4-21. Summary of the VE Practitioners’ average rating of their satisfaction
with the VE methods in improving green building outcomes.
Method 1 Method 2 Method 3 Method 4
Category N Mean Std N Mean Std N Mean Std N Mean Std
Sustainability improvement
7 6.00 0.58 14 6.00 0.78 14 5.71 1.07 21 5.43 1.16
Table 4-22. Summary of ANOVA results of VE practitioners’ feedback on
improving building sustainability. Source Df Error Corrected
Total Sum of Squares Error
Mean Square Error
F-value Sig.
Sustainability improvement
3 52 55 52.00 1.143 1.14 0.341
Table 4-23. Duncan’s Multiple Range Test for the sustainability objective of VE
methods.
Duncan Grouping Mean Sample size (N) VE Methods
A 6.00 7 1
A 6.00 14 2
A 5.71 14 3
A 5.43 21 4
*Note that the means with the same letter are not significantly different.

161
0
0.1
0.2
0.3
0.4
0.5
0.6
0.7
0.8
0.9
1
1 2 3 4 5
Level of agreement with the VE limitations
Estim
ate
d p
roba
bili
ty o
f acce
ptin
g t
he
limitatio
ns
Upper estimate Predicted estimate Lower estimate
Figure 4-1. Graphical plot of probability estimates and degree of agreement with the VE limitations in negatively impacting green building outcomes.

162
CHAPTER 5 DISCUSSION, RECOMMENDATIONS, AND CONCLUSION
5.1 Research Summary
In this research, VE methodology was extensively explored considering its
main objectives of reducing costs and improving performance and quality of
building systems. The literature review focused on the progression of VE from
the time when it was conceived by L.D. Miles, how it has changed over time, its
prime objectives, and the value analysis methods employed in it or associated
with it especially during the critical stages such as function, creativity, and
evaluation phases of the VE process. Specific emphasis was placed on ASTM
E1699-10 standard as the basis of reference for VE process and activities.
From the literature review, it was evident that VE emphasizes the cost of
systems or building projects, a cost which can compromise performance and
quality of the same systems or project parameters. This laid the foundation on to
which this study was built. Having a sustainability objective for example, was an
area which could ensure that adequate building performance and quality
objectives are achieved in the VE process. Thus, the study was aimed at
developing a robust VE decision tool that is focused on improving green building
or sustainability oriented outcomes by providing a modified VE model and
evaluating the impact of the new VE methodology through a case study building.
In order to achieve this aim and the associated objectives, various
limitations in conventional VE were identified. In depth avenues on how to
alleviate the VE limitations were developed. These new avenues, otherwise
called alternative VE methods, were identified and were introduced at the critical
phases of the conventional VE job plan. Combinations of these methods were

163
tested by VE students who were first trained on how to apply these new VE
methods in the analysis plan or process. Then they used the modified VE
methods to analyze the case study building and to prepare VE final reports. A
survey was administered to the students so as to document their opinions about
the VE methods they used relative to meeting or improving building sustainability
outcomes. Their reports were evaluated by faculty members who were
considered to be building sustainability experts, using the USGBC LEED building
rating system as the evaluation criteria. The final stage of the research involved a
review and feedback from VE practitioners. A presentation on the limitations in
conventional VE relative to sustainable building outcomes and potential avenues
to counter them was given to VE practitioners. A survey was administered to the
practitioners to document their acceptance (or lack of acceptance) of the
limitations and the level of agreement with the limitations relative to green
building outcomes.
This chapter discusses the results of the study as guided by the literature,
surveys, and evaluations, all aimed at testing the research hypothesis that the
alternative VE methods will result in better VE- sustainability outcomes compared
to conventional VE from a sustainable design and construction perspective.
Recommendations for future research are also highlighted in this chapter.
The analysis of the surveys administered and evaluation of the VE reports
employed quantitative statistical analysis methods such as descriptive statistics,
ANOVA, and logistic regression. The latter was employed in the analysis of the
limitations in the VE practitioners’ feedback relative to meeting sustainability
objectives. The analysis of results showed that there were no significant

164
differences in some variables. Noteworthy is that other variables showed
significant statistical differences among the different VE methods.
In the survey of students, PW was the outstanding VE method while the
faculty evaluations showed that PW, CBA and NLP were key VE methods that
can potentially be used to realize improved building sustainability. Specifically for
the faculty evaluation results, the findings show that use of NLP in the creativity
phase is of paramount importance or a worthy addition to CBA and PW methods,
i.e., both CBA and PW cannot work efficiently without the inclusion of NLP.
5.2 Discussion of Findings
VE methods were developed and tested with conventional VE as the
control or the VE method of reference. The present study has shown that in as
much as there could be no significant differences between the alternative VE
methods proposed and conventional VE in some of the building sustainability
variables tested, a number of other sustainability objective variables in the study
phases showed significant results among the VE methods. These differences
among conventional VE, PW, CBA and NLP will be discussed in the following
sections, specifically referring to method 1 (conventional VE), method 2
(conventional VE and PW, i.e., where PW replaces cost worth in the conventional
VE), method 3 (CBA and PW), and method 4 (PW, CBA, and PW).
5.2.1 Findings from the Survey of VE Students
The Cronbach’s alpha estimate showed that the data on which the
findings were based on were reliable considering the ‘very good’ alpha outcome
as interpreted from the psychometric chart by Devellis (1991). The findings show
that the VE methods tested were relatively user friendly (easy) and effective in

165
meeting sustainability objectives. A good level of team effort and correct use of
function-worth approach were the main drivers that significantly contributed to the
levels of effectiveness of the VE methods to meet the objectives of the owner.
This finding is in accordance with the literature that stipulates strategic actions
and commitment of the team members as key drivers of success in value
focused or VE activities (Chen et al., 2010).
Reviewing the results of VE methods and the associated sustainability
oriented variables showed that VE method 2 was relatively superior to the
conventional VE approaches and the other alternative VE methods tested
relative to meeting or improving green building outcomes. One approach that is
unique to VE method 2 is the inclusion of performance-worth (PW) in the VE, i.e.,
PW is the only different method when compared to conventional VE. Since
conventional VE came after method 2 in the ranking, it is evident that the PW had
a significant positive impact on the VE process towards achieving improved
building sustainability outcomes. Therefore, high sustainability oriented building
systems can invariably be identified using the PW approach just as cost-worth
approach can identify high cost areas in conventional VE. The only difference in
this approach is that for the cost-worth approach, the high cost areas will or may
be removed while for the PW approach, the high sustainability areas will or may
be retained or recommended for inclusion in sustainable building construction.
Methods 3 and 4 which were only differentiated by the inclusion of NLP in
method 4 in which it showed that that NLP had a relatively negative impact on
the outcomes of the VE study. Thus, method 4 was ranked lowest in significance
as shown in Table 4-10. This could be attributable to the fact that the VE team

166
effort might have been affected by the storming characteristics on the path to
realizing a cohesive team. The lowest ranking of method 4 was supported by the
notion from the qualitative data that stated NLP requiring more time to get
ingrained in the VE process in order to achieve its highest level of effectiveness
within teams. Nonetheless, method 4 still achieved a relatively modest average
value because of the inclusion and/or impact of the positive aspects of NLP in
some teams. This is evident from the qualitative data that inferred that NLP
approach aided method 4 by improving communication and understanding
among team members and thereby enhancing creativity, a concept that was
noted in Smart (2006).
The findings also show that inclusion of CBA had a relatively modest
contribution in methods 3 and 4. In as much as some teams believed that the
CBA approach to evaluation of systems is subjective and lacks a standard scale
of measurement, it is important to note that some teams recognized the merits of
CBA, i.e., it can be very easy to implement once a good mastery level is
achieved. This notion is reinforced by Suhr (1999) which stated that it is very
easy for CBA users to think that that CBA method as used in the evaluation of
systems is subjective when in a real sense it is the only sound decision system
that incorporates both subjective and objective measurements or information on
the same scale. This is its strength and is what makes CBA a viable tool in the
evaluation phase of VE studies.
Overall, the effects of NLP and CBA were found to be low relative to
improving building sustainability outcomes from student perspectives. PW is an
approach that should be integrated fully in the VE process from the students’

167
stand-point. PW has the highest potential to improve building sustainability
outcomes, followed by CBA and NLP.
5.2.2 Limitations in the Findings from the Survey of VE Students
CBA and NLP integration into the VE model need to be done with caution
as their effects or outcomes could have some limitations. In fact, these limitations
may relate to the integration of all new VE approaches in the VE process. First,
the qualitative data show that the introduction of completely new and unique VE
processes needed sufficient time to grasp and practice. Secondly, these
responses were from students who had limited experience in working with VE.
Thirdly, the teams could have been affected by group dynamics. Lastly, even
though the students had their team members’ support, some of them had no prior
familiarity with LEED as a building assessment tool. All these factors may limit
the level of generalizing the results from the students.
5.2.3 Findings from the Faculty Evaluation of VE Final Reports
This section of the research mainly dwelt on the application of LEED as a
green building assessment tool, i.e., the LEED credit categories and checklist
was used as the basis for rating the building systems developed in the VE
reports. Systems developed in the VE reports were identified and evaluated by
the faculty sustainability experts. The quantitative data focused on energy and
atmosphere, materials and resources, and indoor environmental quality LEED
credit categories. The findings showed that the systems developed had greater
contribution to energy and atmosphere LEED credits when compared with the
other two LEED credits categories. This is in line with the fact that optimum
energy performance in buildings is a key factor being sought in new building

168
construction and renovation. Also, the US EIA (2013) has documented energy
benchmarks and has forecast data for building energy consumption for up to year
2040, thus making this research objective variable an important area of focus in
construction.
VE method 4 was outstanding in achieving excellent contributions across
all of the LEED categories investigated while the energy and atmosphere credit
was highly achieved by method 2. This highlights the finding which is consistent
with the student research study phase that showed that PW, which is the
characteristic of VE method 2, has significant positive impact towards achieving
improved building sustainability outcomes. Noteworthy is that the materials and
resources and indoor environmental quality LEED credits categories did not
score relatively well across the VE methods investigated. This could be
attributable to the students’ lack of experience with the LEED assessment tool
and so they could not develop the systems which best meet this LEED credit
category.
In spite of the relatively greater energy and atmosphere LEED credit
contributions among the different VE methods, the materials and resources
LEED credit category recorded a statistically significant difference among the VE
methods. Method 4 was the best VE method that could be tailored towards
improving building sustainability outcomes. From this result, it is hypothesized
that NLP contributes towards achieving building sustainability. This is contrary to
the students’ perspectives which rated NLP contribution the lowest. This result is
understandable since NLP is about relationships in the team and the students
might have not reached that maturity as a typical VE team.

169
The findings show that method 2 (conventional VE and PW) was the last
in the significance Table 4-16 and that they are relatively at the same level of
sustainability contribution with method 3 (CBA and PW). Between method 2 and
3, it is clear that PW is the only common variable attempting to improve the VE
outcomes. Earlier findings showed that PW in method 2 was superior in energy
and atmosphere credit contribution and a similar trend is also evident here where
the positive impact of PW is seen especially in method 4. With method 4, the only
difference from method 3 is the NLP method. Thus, it can be concluded that NLP
is a worthy supplement to the PW and CBA approaches, i.e., the VE
methodology or process would be successful in achieving or improving building
sustainability outcomes or goals when PW, NLP, and CBA are present in the VE
decision model or job plan.
5.2.4 Limitations in the Findings from the Faculty Evaluation of VE Reports
It can be deduced that the outcomes from the faculty evaluations resolved
some of the problems or inconsistencies in the students’ results, such as the
students’ unfamiliarity with LEED as an assessment tool. This research phase
saw the sustainability experts strictly and thoroughly evaluate the building
systems developed. However, the generalization of the results solely from the
students’ standpoint could be misleading as the sample size was small with
limited statistical power. Also, students may not be as innovative compared to
experts from the sustainable construction field. The results need to be interpreted
with caution in order to reduce technical bias when generalizing the results.

170
5.2.5 Findings from the Presentation and Survey of VE Practitioners
The last phase of the research dealt with VE practitioners who had mostly
worked with LEED as a sustainability assessment or rating tool. From the
presentation administered to the practitioners, it was evident that the term VE
was not uniformly utilized across all professionals. Some preferred to call VE VM
so as to distance themselves from the long conceived notion of cost reduction as
the main goal of VE. Others held that there is a clear distinction between VA, VE,
and VM specifying that they are used at specific building project stages while
others held that VE is applicable at all stages of a project. This inconsistency in
the definition and constituents of VE are supported by the literature, where it was
evident that VE, VA, VM, and VP are terms being used by researchers as
synonymous and interchangeable terms. Noteworthy, the findings showed that
the purpose of function analysis in VE is to identify and improve value to owners.
This finding is consistent with the main purpose of VE as defined by SAVE
International (2007) and ASTM (2010).
Looking at the survey items for practitioners, Cronbach’s alpha estimate
for the question items was acceptable on average implying that the data were
reliable. The VE practitioners’ opinions about whether or not the limitations
identified were actually limitations showed a mixed response. However, on
average, the practitioners maintained that the presented limitations could not fully
qualify to be conventional VE limitations based on their many years of field
experiences with VE. The majority of practitioners agree that determination of
criteria in the pre-study phase, over-emphasis on cost, and abstract allocation of
weights to criteria are the true limitations in conventional VE. This was consistent

171
with the literature which stipulated that owners typically dwell on cost, i.e., first
cost, which in the end potentially harms the performance and quality of projects
or systems.
In reviewing the degree of agreement regarding the limitations in
conventional VE in negatively impacting green building outcomes, the findings
showed that the majority of the practitioners agreed, which supported the
research hypothesis and the need to identify new approaches to improve green
building outcomes. Noteworthy is that the agreement on the limitations in
negatively impacting green building outcomes had a significant effect on whether
or not the limitations were accepted as true. It showed that those VE practitioners
who were more likely to agree that the limitations had negative impact on green
building outcomes were also more likely to accept the limitations presented as
actual limitations in conventional VE. These findings pertaining to the limitations
supported the avenues to counter the limitations through the developed
alternative VE methods, i.e., a validation process for the study.
The findings from the analysis of the practitioners’ feedback on the various
VE methods for improved green building outcomes showed that there was no
statistically significant difference among the VE methods. This implied that any
VE method could be used to achieve superior green building outcomes. In as
much as there was no statistically significant difference, the findings showed that
on average methods 2 and 1 were preferred for meeting sustainability building
goals followed by methods 3 and 4. This would lead to an indication that PW may
be a viable VE method, which is reinforced in method 4 by the fact that the
results among the different VE methods are not statistically significant. The

172
findings from this phase of the study are generally consistent with the findings
from the students and the faculty subject experts.
5.2.6 Limitations in the Findings from the Presentation and Survey of VE Practitioners
The data from the practitioners were useful in validating the avenues to
develop a VE method oriented towards improved building sustainability
outcomes. However, certain limitations were apparent. It was evident that 100%
of the practitioners were value engineers while 57% had used LEED or other
sustainability rating tool. Thus, the results on the sustainability objective variable
result as the main objective in this phase of research in addition to and
acceptance of the VE limitations need to be inferred or concluded with caution.
This is because some of the practitioners had not used a sustainability
assessment tool and could not have a complete and satisfying decision on its
effect when integrated in a VE process.
In summary, the findings in this study indicate that there are varied
limitations in the VE methodology being employed currently in the construction
industry. However, some of the practitioners have not realized the existence of
these limitations as they engage in routine VE activities. Some of these
conventional VE limitations have been identified in literature, e.g., emphasis on
cost, but they have not been tested nor have comprehensive alternatives been
developed, especially relative to improving building sustainability outcomes. This
research has comprehensively investigated potential avenues that could be
incorporated in VE through identification of important VE procedures in various
phases of the VE job plan. Overall, the findings have shown that PW is a viable
method across all the research phases.

173
5.3 Recommendations
From the students’ research and survey and in comparison with the
conventional VE, it was evident that PW was the best VE method that could be
incorporated in VE for improved building sustainability outcomes. The faculty
evaluations of the VE reports came to the conclusion that a VE approach that
incorporates PW, CBA, and NLP would be a worthy avenue to achieving the
sustainability goal. The VE practitioners’ feedback on the VE methods was
statistically non-significant pertaining to sustainability goal, implying that any VE
method could be used in the quest for improved green building outcomes. Based
on the feedback from the three phases of this research, VE methodology that
incorporates PW, CBA, and NLP would achieve improved building sustainability
or green building outcomes. Two-thirds of the experimental design supports the
conclusion, i.e., faculty evaluations results and VE practitioners’ feedback. The
data supporting the recommendations are summarized in Figure 5-1.
Following the recommendations of the study, Figure 5-2 gives a
framework for the modified VE methodology showing specific phases to include
the alternative VE methods. This modified VE methodology would be a viable
tool to be used for improved green building outcomes.
5.4 Areas for Future Research
This research involved a small sample of students. For better statistical
power, larger samples would be preferred. Thus, this study should be considered
a pilot, and could be replicated with a larger group of students. Further research
may include students from the international community similar to the international
community that SAVE serves and which this new VE approach is to serve.

174
The current research found that NLP in the creativity phase was of
paramount importance to achieve superior green building outcomes. However,
there are different approaches to creative thinking and idea generation or
creation during VE. Different approaches to creativity can be developed and
tested in the VE job plan so as to find the one creativity approach that best suit
the VE process for improved sustainability outcomes.
One of the VE practitioners mentioned during presentation and discussion
that contractors typically do not conduct VE. It would be worthwhile to investigate
the extent of this and document why it would be important for contractors to
incorporate VE in projects. Also, people tend not to think outside the box to an
extent that they may eventually lose their creativity. There is need for rules to
improve creativity and communication during value analysis process. A research
undertaking tailored towards investigating or determining the criteria to be used
to evaluate creativity alternatives in the evaluation phase of the VE job plan
would be worthy improvement to the creativity VE phase.
5.5 Conclusion
This research grew from the concept of the limitations in VE, especially in
achieving or improving green building outcomes, and from the analysis of the
SAVE job plan and ASTM E1699 building standard. Different VE methods were
developed to counter the limitations towards achieving the sustainability goal.
The research hypothesis developed was that the alternative VE methods will
result in better VE-Sustainability oriented outcome compared to conventional VE
from a sustainable design and construction perspective. This hypothesis was
tested by the survey outcomes from the experimental designs which incorporated

175
the various VE methods used by students, the faculty evaluations of students VE
reports, and VE practitioners’ presentation and survey feedback on the limitations
and VE-Sustainability approaches. The finding or recommendation of the
research has supported the hypothesis. A modified value engineering framework
to steer the sustainable building VE process has been presented which could be
used by value engineers, owners, design professionals, and contractors wishing
to improve building sustainability or green building outcomes.
0
2
4
6
8
Research phases towards improved building sustainability
outcomes
Ave
rag
es
Method 1 4.83 2.14 6
Method 2 5 1.69 6
Method 3 4.6 1.69 5.74
Method 4 4 2.74 5.43
Students' survey Faculty evaluationVE practitioners
survey
Figure 5-1. Data supporting the recommendations. The students’ survey
information was from the statistically significant results of the overall outcome of the VE projects. The faculty evaluation information was from the statistically significant results of the materials and resources LEED credit category. The VE practitioners’ survey information was from the variable that pertained to the satisfaction with VE method to improve building sustainability outcomes.

176
Figure 5-2. Framework for the modified VE methodology. PW in the function
analysis phase may have more input than NLP and CBA.

177
APPENDIX A STUDENTS SURVEY ADMINISTRATION AND RECOMMENDED SYSTEMS
A-1 Survey Informed Consent Form
Agreement form specifying the aim and requirements of the survey.

178
A-2 Survey Questionnaire to VE Students
Method 1: Conventional VE (Control) for Teams 1A and 1B, Face to Face Survey.

179
Method 2: Conventional VE and PW for Teams 2A and 2B, Face to Face Survey

180
Method 3: CBA and PW for Teams 3A and 3B, Survey Administered Face to Face.

181
Method 4: CBA PW, and NLP for Teams 4A and 4B, Face to Face Survey.

182
A-3 Similar Systems Recommended by VE Students
Similar building systems recommended with their respective LEED points accumulated (from students and researcher calculations of LEED points).
Control Group/Team Conventional VE & PW Team
CBA and PW Team CBA, NLP and PW Team
Building Systems CIP Team 5 Team 2 Purple Team 4 QingQing Team 1 Team 3
Curtain walls 5 30 18 17 18
HVAC 3 30 26 31
Plumbing 9 10
no LEED points reported
Lighting 13 20 25
Windows 12 20
Flooring 30 5
Ceiling 8 12
Total LEED Points Accumulated 14 28 90 64 61 30 12 43

183
APPENDIX B FACULTY FORM FOR EVALUATING STUDENTS REPORTS
B-1 LEED Checklist for Rating Whole Building Sustainability Outcome
This checklist was used by faculty sustainability experts to rate the building.

184
B-2 LEED Checklist for Rating Recommended Building Systems
This is the checklist used by faculty sustainability experts to rate building recommended systems.
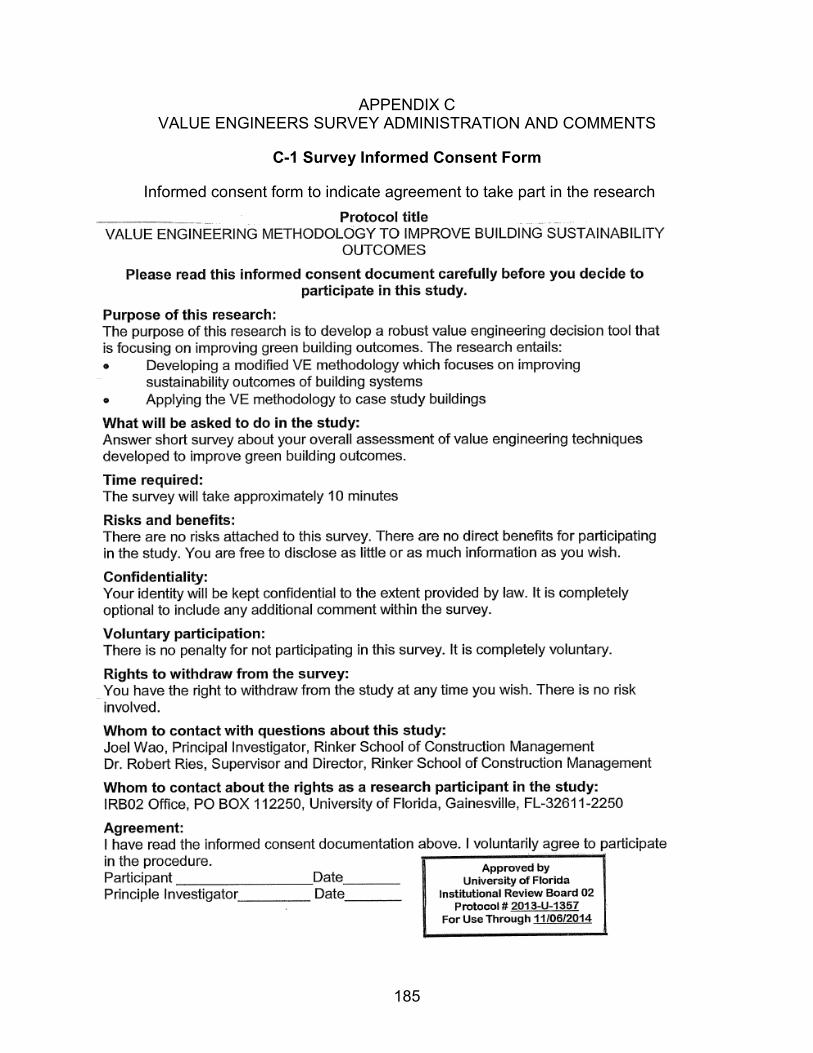
185
APPENDIX C VALUE ENGINEERS SURVEY ADMINISTRATION AND COMMENTS
C-1 Survey Informed Consent Form
Informed consent form to indicate agreement to take part in the research

186
C-2 Online Survey Questionnaire
Questionnaire administered online via Qualtrix after the VE presentation.

187

188
C-3 Value Engineers Comments
Value Engineer 1 Comments I've reviewed your PowerPoint slides and feel your process does indeed improve the outcome of the VE methodology. I have the following
comments based upon my experience in the industry.
The CBA process does improve the basic VE methodology since it focuses on attributes to assist in choosing the best VE alternative, however,
in my opinion, delaying the identification of the attributes until after the
creative phase is too late and does not provide needed guidance for the VE team members before the brainstorming begins. I have used both
CBA and performance based VE and prefer a criteria based attribute which is weighted by the client/owner prior to the start of the VE study.
This allows the client/owner to be actively involved in the process and allows them to set the overall priorities for the project. I have found it very
important for the VE team members to recognize the owners priorities and criteria weights prior to the start of the brainstorming. I have attached
several exhibits for your use.
I agree the Cost/Worth process is severely flawed and has led to "cost cutting" on projects, causing great damage to the functional performance
of projects. I prefer to NOT include Cost/Worth discussions in my VE studies. Calculating Performance/Worth will help the process though, but
identification of the true performance "value" could be illusive.
Improvements to the brainstorming process could be helpful. Brainstorming by function is usually a big help, but investigating other creative
thought methodologies is admirable.
I would suggest you also include measurement of "value improvement" as well as "performance improvement". This will calculate the net
improvement in performance (point and criteria based system) per unit change in project Value (Resources), i.e. cost + schedule. I find it helpful
to allow the client/owner to allocate the importance of both project cost and schedule separately. Sometimes project cost may be very important
(70/30) when compared to schedule, or 10/90 projects driven heavily by schedule. Changes in cost and schedule would need to be prepared
separately for each VE alternative.
Another element that could be improved is that of Risk. I use a technique that includes qualitative risk assessment as part of the Function
Analysis phase. Functions with risk exposure can be brainstormed and mitigation measures identified.

189
Value Engineer 2 Comments I did the survey and below some comments related to your questions. • Over-emphasis on cost, sometimes at the expense of performance and quality: The name Value Engineering has been misused by many organisation (especially by project management houses), where the approach was focused on cost savings only. First the VE methodology was not applied; instead they applied a straight forward design review where opportunities have been identified to reduce only CAPEX. If there is no proof of “functional thinking” there will be no assurance that the VE methodology was applied. Tools like FAST Diagram, Function-Cost Analysis, and Redundancy Analysis needs to be applied. It is also paramount that LCC (Life Cycle Cost) is incorporated into VE. • Does not promote or improve creativity When an product, element, services or system needs to be optimised we determine the functions of such. From there alternative ways to perform the functions are identified. First of all when people realise the actual function of an element, product, service of system they really understand the application and therefore find other ways to perform the function. The old paradigm will be challenged and many times a new / creative solution is found. There is of course the need to determine the correct functional definition. Let’s assume we analyse a Paper Shredder, the function may be identified as “Shred Paper” and from there we may find three or more alternative ways to perform this function. Since “shredding paper” is not the actual function we will be limited in our creativity to find the best solution. Therefore we need to ask the question why we “shred paper”. The answer is to “Destroy Information”. Ask the question again and we may realise that the basic function is to “Ensure Confidentiality”, the solutions will be different as more creative than simply to “Shredding Paper. Hopefully this will explain the shift of thinking and that VE creates the environment for creative solutions. On the other hand, if we want to get the best solution it does not always have to be a “Creative Solution”. We prefer to have the most appropriate solution to the problem / opportunity. (Think out of your box, think within your box – go back to basic). • Evaluation methods not always suitable In VE we apply various tools to determine a good understanding of the problem / opportunity within a system context, then the functional requirements and from there the most appropriate solution to the situation. Depending on the situation the correct tools / methodologies needs to be applied. As a facilitator of such an intervention we need to determine the correct tools / methodologies. No VE study is the same; therefore we need to apply the correct application at the right time. Below some explanation of the various tools used when applying Value Management, Value Engineering and / or Value Analysis: VALUE METHODOLOGY EXPLAINED Value Management; used as early in concept as is practicable, it will optimise the cost of any project or venture, in all areas of technology, commerce or business activity. Value Engineering; applied at the design stage for analysis of need, assessment of alternatives, optimisation of schemes and refinement of detail, again applicable to all areas of business activity. Value Analysis; when applied to existing products will simplify, refine, improve performance and reduce cost.
190
LIST OF REFERENCES
Abdulaziz, S. (2006). Value engineering application benefits in sustainable construction. Retrieved on September 16, 2012 from http://www.pmi-agc.com/techdocs/The%20paper%20-%20Value%20Engineering%20application%20benefits%20in%20Sustainable%20Construction.pdf
Abdulaziz, S. (2006b). The synergies between value engineering and sustainable construction. Retrieved on September 23, 2012 from http://www.value-eng.org/knowledge_bank/attachments/Yousefi%20-%20Synergy%20Between%20VE%20and%20Sustainable%20Construction.pdf
Abidin, N. & Pasquire, C. (2007). Revolutionize value management: A mode towards sustainability. International Journal of Project Management, 25, 275-282.
Abramson, D. (2013). Rating the sustainability of urban development. Comparing LEED for Neighborhood Development and CASBEE Machizukuri-Lessons from China. Retrieved August 8, 2013 from http://www.china-up.com:8080/international/case/case/1307.pdf
Adams, M. (2003). Improving value analysis practice with choosing by advantages decision making. Paper Presented at the Proceeding of VE Conference, Tampa, Florida, AASHTO.
Adams, M. (2004). Stop weighting, rating, and calculating: Choosing by advantages (CBA) and the conventional value analysis (VA) job plan. Paper Presented at the Proceeding of SAVE Conference, SAVE International.
Akimoto, T. (2010). What we learn from CASBEE (Japan’s version of LEED and Green Building in Japan).
Al-Yami, M. & Price, A. (2006). A Framework for implementing sustainable construction in building briefing project. Proceedings in the 22nd Annual ARCOM Conference 4-6 September 2006.
American Society for Testing and Materials (ASTM E2013-12). The standard practice for constructing FAST diagrams and performing function analysis during value analysis study.
American Society for Testing and Materials (ASTM E1699-10). The standard practice for performing value analysis (VA) of buildings and building systems.
Anderson, J. (2008). “The measurement of trace reactive species in the stratosphere: An overview.” In causes and effects of stratospheric ozone depletion: an update, Washington, DC: National Academy Press.

191
Annappa, C. & Panditrao, K. (2012). Application of value engineering for cost reduction-A case study of universal testing machine. International Journal of Advances in Engineering & Technology, 4(1)618-629.
Architectural Institute of Japan (AIJ) 2005. Architecture for a sustainable future-All about the holistic approach-Japan, Institute for Building Environmental and Energy Conservation (IBEC).
Arroyo, P., Tommelein, I. & Ballard, G. (2012). Deciding a sustainable alternative by choosing by advantages in the AEC industry. Proceedings for the 20th Annual Conference of the International Group for Lean Construction.
Baker, E. & Ewing, B. (2009). Development of a green building decision support tool: A collaborative process. Journal of Decision Analysis, 6(3)172-185.
Bandler, R. & Grinder, J. (1982). Reframing Neuro-Linguistic Programming and the Transformation of Meaning. Real People Press,Moab, Utah. Retrieved June 6, 2013 from http://cloud.escuelasuperiordepnl.com/pdf/Reframing%20Neuro-Linguistic%20Programming%20and%20the%20Transformation%20of%20Meaning%20by%20Richard%20Bandler%20and%20John%20Grinder.pdf
Barima, O. (2010). Examination of the best, analogous, competing terms to describe value in construction projects. International journal of project management, 28,195-200.
Barlow, C. (1999). Doing value engineering. The Co-Creativity Institute. Retrieved March 15, 2013 from http://www.cocreativity.com/handouts/doingve.pdf
Beale, M. (2012). NLP Training and Certification Guide. Retrieved March 2, 2013 from https://www.transformdestiny.com/eclasses/nlphome/nlp.pdf
Belton, V. & Gear, T. (1983). On a short-coming of Saaty's method of analytic hierarchies. Omega, 228-230.
Benayoun, R., Roy, B. & Sussman, B. (1966). ELECTRE: Une méthode pour guider le choix en présence de points de vue multiples. SEMA Note 49.
Benstin, M., Benston, D. & Haraburda, S. (2011). Using value engineering to reduce life cycle cost. Defense AT&L: January-February 2011. Retrieved October 12, 2012 from http://www.dtic.mil/cgi-bin/GetTRDoc?AD=ADA535562
Boock, M. & Chau, M. (2007). The use of value engineering in the evaluation and selection of digitization projects. Journal of Evidence Based Library and Information Practice, 2(3)76-86.
Borza, J. (2011). FAST diagrams: The foundation for creating effective function models. Retrieved November 14, 2013 from

192
http://www.aitriz.org/documents/TRIZCON/Proceedings/2011-06_FAST-Diagrams-The-Foundation-for-Creating-Effective-Function-Models.pdf
Bremmer Consulting LLC (2010). Why Use SAVE International value engineering methodology? Retrieved November 21, 2012 from http://bremmerllc.com/wp-content/uploads/2010/09/Why-Use-SAVE-VE- Methodology.pdf
Building Research Establishment (BRE). Assessment of sustainable tools. BRE, Glasgow, 2004.
Building Research Establishment (BRE). A discussion document comparing international environmental assessment methods for buildings. BRE,Glasgow, 2008.
Burah, S. (n.d.d.). Objectives of value engineering. Retrieved September 16, 2012 from http://www.slqs-uae.org/slqs/Article3.pdf
Burn, G. (2005).The NLP pocket book. Management Pocketbooks LTD, UK.
Bytheway, C. (2007). FAST creativity and innovation: Rapidly improving processes, product development and solving complex problems. Retrieved November 16, 2013 from http://www.fastcreativity.com/charlesbytheway.html
Chang, T. (2011). Multi-choice goal programming with utility functions. European Journal of Operation Research, 215, 139-445.
Charres, A., Cooper, W. & Fergusion, R. (1955). Optimal estimation of executive compensation by linear programming. Management Science, 1, 138-151.
Chastain, J. (2010). Decision Making, risk, and utility function. Retrieved February 15, 2013 from http://www.chastainskillman.com/downloads/articles/3Q10DecisionMaking.pdf
Chen, W., Chang, P. & Huang, Y. (2010). Assessing the overall performance of value engineering workshops for construction projects. International Journal of Project Management, 28, 514-527.
Chung, B., Syachrani, S., Jeong, H. & Kwak, Y. (2009). Applying process simulation technique to value engineering model: A case study of hospital building project. Journal of IEEE Transactions on Engineering Management, 56(3), 549-559.
Cody, R. & Smith, J. (1997). Applied statistics and the programming language. Prentice Hall, Upper Saddle River, NJ, 4th edition.
Deb, K. (1995). Optimizing for engineering design. Algorithms and examples: New Delhi, Prentice Hall.

193
Deb, K. (1998). Non linear goal programming using multi-objective genetic algorithms. Department of engineering: Indian Institute of Technology, Kanpur.
Devellis, R. F. (1991). Scale development. Newbury Park, NJ: Sage Publication.
Dlugatch, I. (1973). Methodology for value engineering. Journal of IEEE Transactions on Reliability, R-22 (1)20-23.
Driedger, M. (2009). Choosing the right green building rating system. An analysis of six rating systems and how they measure energy. Perkins & Will Research Journal, 1 (1), 21-41.
Dyer, J., Fishburn, P., Steuer, R., Wallenius, J. & Zionts, S. (1992). Multi-criteria decision making, multi-attribute utility theory: the next 10 years. Management Science, 38 (5), 645-654.
Eiselt, H. & Vladimir,M. (2011). Decision making with multiple criteria and uncertainty. 2011 International Conference on Software and Computer Applications. IPCSIT, 9, IACSIT Press, Singapore.
Elder, K. & Elder, B. (1998). Accessing creativity in value engineering studies through Neuro-Linguistic programming. SAVE International Conference Proceedings.
Engineering News Record (ENR). Magazine, March 1990.
Environmental Protection Agency Value Engineering. Retrieved October 2, 2012 from http://www.epa.gov/superfund/cleanup/pdfs/rdra/valueeng.pdf
Farhad, K. (2006). Multicriteria decision making. Newcastle Engineering Design Center.
Farkas, A. (2010). The use of the AHP in civil engineering projects. MEB 2010-8th International Conference on Management, Enterprise and Benchmarking, June 4-5, 2010, Budapest, Hungary.
Federal Highway Administration (1997). Retrieved on October 20, 2012 from http://www.gpo.gov/fdsys/pkg/FR-1997-02-14/pdf/97-3758.pdf
Federal Highway Administration (2013). Retrieved on September 18, 2013 from http://www.gpo.gov/fdsys/pkg/FR-2013-08-29/pdf/2013-20315.pdf
Fellows, R. & Liu, A. (2003). Research methods for construction. Blackwell Science Publishing, 2nd Edition.
Fowler, K.M. & Rauch, E.M. (2006). Sustainable building rating systems summary. Pacific Northwest National Laboratory. Operated by Battelle for the U.S. Department of Energy.

194
Grant, E. & Jones, J. (2008). A Decision making framework for vegetated roofing system selection. Journal of Green Building, 3(4), 138-153.
Green building benefits need better documentation’ (2012). Environmental Management.
Green Building Initiative: Comparing Green Globes and LEED. Retrieved June 8 2013 from http://www.thegbi.org/green-globes/green-globes-leed-green-building-certification.shtml
Green building. LEED Associate Study Guide 2011 Green.
Green Building Master Plan (n.d.d.). Retrieved December 5, 2013 from http://www.bca.gov.sg/greenMark/others/gbmp2.pdf
Green Building Rating Systems: Singapore. Retrieved on December 5, 2013 from http://www.institutebe.com/InstituteBE/media/Library/Resources/Green%20Buildings/Fact-Sheet_Green-Building-Ratings_Singapore.pdf
Hacking the Mind: NLP and Influence. Retrieved March 6, 2013 from http://www.defcon.org/images/defcon-13/dc13-presentations/DC_13-Mystic.pdf
Hajek, P. (2002). Sustainable Construction through Environment-Based Optimization, IABSE. Symposium Towards a Better Built Environment.
Hassan, N. & Loon, L. (2012). Goal programming with utility function for funding allocation of university library. Applied Mathematical Sciences, 6 (110), 5487-5493.
Heggade, V. (2002). IT propelled value engineering in construction. Indian Concrete Journal, 222-226.
Hirigoyen, J., Ratcliffe, S. & Davey-Attlee, F. (2008). Green building rating system: Going beyond the labels. A Though Leadership Paper from Upstream Sustainability Services.
Hoseini, A., Dahlan, N., Berardi, U., Hoseni, A., Makaremi, N. & Hoseni, M. (2013). Sustainable energy performances of green buildings: A review of current theories, implications and challenges. Renewable and Sustainable Energy Reviews, 25, 1-17.
Hu, J. & Mehrotra, S. (2011). Robust and stochastically weighted multi-objective optimization models and reformulations. Department of industrial engineering and management sciences, Northwestern University.
Huber, K. (2012). Value engineering in projects. Engineering Council of South Africa.
Ignizio, J. (1976). Goal programming and extensions. Lexington, WA: Lexington Books.

195
Ignizio, J. & Romero, C. (2003). Goal programming. Encyclopedia of Information Systems, 2, 489-500.
Improved ROI metrics key to green building market share growth. McGrawhill-Construction Group, New York, (2012).
Jariti, F. & Zegordi, S. (2008). Quality function deployment, value engineering, and target costing, an integrated framework in design cost management: A mathematical programming approach. Journal of Scientia Iranica, 15(3), 405-411.
Jones, D. (2010). History and philosophy of goal programming. International Series in Operation Research and Management Science.
Jones, D. & Tamiz, M. (2010). Practical goal programming. International Series in Operation Research and Management Science, Chapter 1.
Kapsalaki, M, Leal, V. & Santamouris, M. (2012). A methodology for economic efficient design of net zero energy buildings. Energy and Buildings, 55, 765-78.
Kasi, M. (2009). Function approach to transportation projects, a value engineering guide. IUNIVERSE Inc. New York, Bloomington.
Katsikopoulous, K. & Gigerenzer, G. (2008). One-reason decision making: Modeling violations of expected utility theory. Journal of Risk and Uncertainty, 34 (1)35-56.
Keung, J. (2012). JEM Scores Green Mark Platinum. Build Green. Retrieved December 3, 2013 from http://www.bca.gov.sg/GreenMark/others/BGreen20121010.pdf
Kawazu, Y., Shimada, N.,Yokoo, N. & Oka, T. (2005). Comparison of the assessment results of BREEAM, LEED, GBTOOL and CASBEE. The 2005 World Sustainable Building Conference, Tokyo, 27-29 September 2005 (SB05Tokyo).
Keen, L. (2013). SAVE International Interactions, 36 (1), 3.
Kelting, S. (2012). Green building design and construction decision- Making in a multiple stakeholder environment. Proceedings in Third International Conference on Construction in Developing Countries, ‘Advancing Civil, Architectural and Construction Engineering & Management’ July 4-6 2012, Bangkok, Thailand.
Kennett, S. (n.d.d.). BREEAM and LEED to work together on NEW GLOBAL STANDARD. Building UK. www.building.co.uk
Keysar, E. & Pearce, A. (2008). Decision support tools for green building: Facilitating selection among new adopters on public sector projects. Journal of Decision Analysis, 2(3), 1-19.

196
Kibert, C.J., Roudebush, W.H. & Waller, D.L. (1991). Environmental engineering, Value World, 2-5.
Kibert, C. J. (2008). Sustainable Construction. Green Building Design and Delivery,
John Wiley and Sons, New Jersey, 2nd edition.
Kiker, A., Bridges, T., Varghese, A., Seager, T. & Linkov, I. (2005). Application of multi-criteria decision analysis in environmental decision making. Integrated Environmental Assessment and Management, 1 (2), 95-108.
Kirk, S. (2013). Function inspired organizational change at two national research labs. Value World, 36 (2), 30-35.
Kirk, S., Park, G. & Dell’lsola, A. (2004). Sustainability/LEED and life cycle costing-Their role in value based design decision making.
Kmetty, G. (2013). How the functional analysis discipline works. SAVE International Interactions, 36 (1) 7.
Komalirani, Y. (2010). LEED: Green Buildings-Analysis of various rating systems. Retrieved March 23, 2013 from http://climatechange.thinkaboutit.eu/think4/post/green_buildings_analysis_of_various_rating_systems
Konstantinos, V. & Gigerenzer, G. (2008). One reason decision making: Modeling violations of expected utility theory. Risk Uncertainty, 37, 35-56.
Kunz, J. (2010). Analytical hierarchical process.
Langdon, D. (2012). Cost and benefit of achieving green buildings. Innovative thinking in property and construction.
Langston, C. & Mackley, C. (1998). The role of environmental economics in the cost management of projects. AACE.
LEED New version, v4. Retrieved August 5th, 2013 from http://new.usgbc.org/v4 Lehman, T. and Reiser, P. (2000). Maximizing vale and minimizing waste: Value
engineering and lean construction. Lean Construction Institute.
Lee, N. & Burnett, J. (2007). Benchmarking energy use assessment of HK-BEAM, BREEAM and LEED. Building environment.
Lee, S. (1972). Goal programming for decision analysis. Philadelphia: Auerbach Publishers.
Leung, M. & Liu, A. (1998). Developing a value management model - by value-goal system approach. In Proceeding of the 14th Annual Conference of the

197
Association of Researchers in Construction Management, Hughes, W. (ed.), Reading: ARCOM, ISBN 0-9534161-0-0, 2, 496-505.
Male, S., Kelly, J., Frenie, S., Gronqvist, M. & Boyles, G. (1998). Value management: the value amangement benchmark: a good practice framework for clients and practioners. London: Thomas Telford Publishing.
Male, S., Kelly, J., Gronqvist, M. & Graham, D. (2007). Managing value as a management style for projects. International Journal of Project Management, 25, 107-114.
Matteo, J. (2012). Multi-criteria analysis in the renewable energy industry, Green Energy Technology, Springer-Verley, London Limited.
Matthiessen, L. & Morris, P. (2004). Costing green: A comprehensive cost database and budgeting methodology. Davis Langton, July 2004.
McGrawhill-Construction Group, New York 2012.
Melton, P. (2012). Environmental Building News. Green Globes tops LEED in federal review, but barely. Retrieved December 5, 2013 from http://www.buildinggreen.com/auth/article.cfm/2012/5/9/Green-Globes-Tops-LEED-in-Federal-Review-But-Barely/
Miles, L. (1962). Technology of Value Analysis and Engineering. Proceedings of the 6th Annual Inland Empire Quality Control Conference, San Bernardino Section, American Society for Quality Control.
Miles, L. (1972). Techniques of value analysis and engineering. 2nd edition, New York: McGraw-Hill.
Miles, L. (1947). The cost problem and the value engineering approach.
Mitchell, W. (2010). LEEDing the way: Lessons learned from the commitment process of universities in North Carolina building to LEED Standards. Paper submitted to faculty of the University of North Carolina at Chapel Hill in Partial Fulfillment of the Requirements for the degree of Masters in Public Administration.
Morris, P. (2007). What does green really cost? PREA Quarterly, summer 2007.
Myres, G., Reed, R. & Robinson, J. (2008). Sustainable property – The future of the New Zealand market. Pacific Rim Property Research Journal, 14(3), 298-321.
Nader, G. (n.d.d.). Value engineering and creativity. Retrieved February 1, 2013 from http://www.mouhandess.org/fldr/Creativity.pdf
198
Neama, A. & Shaban, W. (2012). Protect the planet through sustainability rating systems with local governmental criteria-LEED in the Middle East. Procedia-Social and Behavioral Sciences, 68,752-766.
Nelson, A. (2008). Globalization and global trends in green real estate. RREEF Research, San Francisco, USA.
Nelson, A. & Rakau, O. (2010). Green Buildings - A niche becomes mainstream. RREEF Research. Retrieved December 3, 2013 from http://www.dbresearch.com/PROD/DBR_MOBILE_EN-PROD/PROD0000000000256216.pdf
Nguyen, B. (2011). Tall building projects sustainable systems summary. PhD Thesis. The University of Sheffield.
Nguyen, B. & Altan, H. (2011). Comparative review of five sustainable rating systems. Procedia Engineering, 21, 376-386.
Nick, R., Matthias, H. & Wirtschaftsing, H. (2000).Value engineering: dissemination of innovation and knowledge management techniques. Retrieved October 24, 2012 from http://www.adi.pt/docs/innoregio_value_analysis.pdf
Odum, T. (1991). Emergy analysis of shrimp mariculture in Ecuodor. University of Rhode Island, Coastal Resources Center.
Office of federal environmental executive (OFEE 2003). Federal Commitment to Green Building: Experience and Expectations. Retrieved on November 10 2012 from http://www.ofee.gov/Resources/Guidance_reports/Guidance_reports_archives/fgb_report.pdf
Pacific Family of Companies (2012).Sustainable Construction: Preserving our future, Issue 62.
Pan, N., Dzeng, R. & Yang, M. (2011). Decision making behaviors in planning green buildings. Proceedings in International Conference on computer Distributed Control and Intelligent Environmental Monitoring, IEE Computer Society.
Parker, J. (2009). BREEAM or LEED-Strengths and weaknesses of two main environmental assessment methods. Retrieved April 3, 2013 from http://www.bsria.co.uk/news/article/breeam-or-leed/
Parrish, K. & Tommelein, I. (2009). Making design decisions using choosing by advantages. Proceedings of the 17th Annual Conference of the International Group for Lean Construction, Taipei, Taiwan.
Pettypool, D. & Karathanos, P (2004). An equity check. EJOR 157,465-470.

199
Podinouvski, V. (2010). Set choice problems with incomplete information about preferences of the decision-maker. European Journal of Operation Research, 207, 371-379.
Project Development Procedures Manual (2013). Retrieved October 20, 2013 from http://www.dot.ca.gov/hq/oppd/pdpm/chap_pdf/chapt19.pdf
Pulaski, M. (2004). Methods to enhance project sustainability: Turning to constructability. Pennsylvania State University. Retrieved August 22, 2013 from http://www.dbia.org/pubs/dateline/archives/2004/0708-04/Features/110708pulaski.htm
Rabbi, M. (2012). Value analysis for excellence in managing projects. Retrieved January 30, 2014 from http://www.apega.ca/members/Presentations/2012/VA101APEGGAPresentationMarch22-2012.pdf
Reed, R., Bilos, A., Wilkinson, S. & Schulte, K. (2009). International comparison of sustainable rating tools. JOSRE, 1 (1), 1-22.
Reed, R. & Wilkinson, S. (2006). Melborne’s 2020 vision: Towards Carbon Neutral Office Space in CBD. Proceedings of Enviro06 Conference, Melborne, 10-12/05/06.
Road Talk (2000). The value engineering. Ontario Transportation Technology Transfer digest, 5(2)1-6.
Rohn, N. (2004). Wisconsin Department of Transportation, Facility Development Manual Section 15: Value engineering. Retrieved September 20, 2012 from http://roadwaystandards.dot.wi.gov/standards/fdm/01-15.pdf
Ronsivalli, L. (2013). High performance buildings: Achieving superior performance for life. Retrieved March 18, 2013 from http://hpb.trane.com/content/dam/highperformancebuildings/Resources/whitepapers/Trane%20White%20Paper%20London_US_eLIB.PDF
Roudebush, W. H. (1992). Environmental value engineering (EVE). A system for analyzing the environmental impact of built environmental alternatives. A Dissertation Presented to the Graduate School of the University of Florida in Partial Fulfillment of the Requirements for the Degree of Doctor of Philosophy.
Rwelamila, P. & Savile, P. (1994). Hybrid value engineering: the challenge of construction project management in the 1990s. International Journal of Project Management, 12 (3) 157-164.
Saaty, T. L. (1980). The analytic hierarchy process. McGraw-Hill International, New York, NY, U.S.A.

200
Saaty, T. L. (1983). Axiomatic foundations of the analytic hierarchy process, Management Science, 32, 841-855.
Saaty, T. L. (1990). An exposition of the AHP in reply to the paper 'Remarks on the Analytic Hierarchy Process', Management Science, 36, 259-268.
Saaty, T. L. (1994). Fundamentals of decision making and priority theory with the AHP. RWS Publications, Pittsburgh, PA, U.S.A.
Sarika, S. (2012). Server selection by using weighted sum and revised weighted sum decision models. International Journal of Information Technology Research, 2 (6), 499-511.
Shades of green tool bench. Advancing framing techniques: Optimum value engineering (OVE). Retrieved September 16, 2012 from www.ybshadesofgreen.org
Sharma, A. & Srivastava, H. (2011). A case study analysis through the implementation of value engineering. International Journal of Engineering Science and Technology, 3 (3), 2204-2213.
Smart, J. (2006). Ten of the coolest, most powerful & most useful NLP techniques I’ve ever learned. Retrieved March 10, 2013 from http://vencergt.com/wp-content/uploads/2010/08/10_of_the_Coolest_Most_Powerful_Useful_NLP_Techniques_Ive_Ever_Learned.pdf
Smarter buildings (2012). Green building solutions. Overview – United Kingdom. Retrieved on November 25, 2012 from http://www.ibm.com/smarterplanet/global/files/smarter_buildings_optimised_building_performance.pdf
Smith, A. (2008). The NLP SCORE model (Part 1: The basics). Coaching Leaders. Retrieved May 24, 2013 from http://coachingleaders.emotional-climate.com/the-nlp-s-c-o-r-e-model-part-1-the-basics/
Smith, K. (1999). Applying value analysis to value engineering program. Proceedings for AAHSTO VE Conference.
Snavely, J. (2007). The US Green building council: Designer of the green building industry. Graduate School of International Relations and Pacific Studies, University of California, San Diego.
Society of American Value Engineers-International (1998, 2007 & 2012).
Strong, K. (2006). NLP in Business and in Life. White Dove Books. Retrieved March 11, 2013 from http://www.campbellmgold.com/archive_ebooks/nlp_business_life.pdf
Suhr, J. (1999).The choosing by advantages decision making system. Westport, CT:The Greenwood Publishing Group/ Quorum Books.

201
Suhr, J. (2003). Basic principles of sound decision making. The Institute of Decision Innovations.
Sustainable Buildings. Go Green. Retrieved December 4 2013 from http://www.itu.int/dms_pub/itu-t/oth/4B/04/T4B0400000B0012PDFE.pdf
Tad, J. (n.d.d.). What is NLP: A model of communication and personality? Retrieved March 8, 2013 from http://www.easynlp.com/NLP_Communication_Model.pdf
TEMI GROUP: Value engineering-A case studies. Retrieved September 16, 2012 from http://temigroup.com/case-studies.php?id=3
Tofallis, C. (2010). Multi criteria ranking using weights which minimize the score range. Retrieved on February 16, 2013 from http://link.springer.com/content/pdf/10.1007%2F978-3-642-10354-4_9.pdf
Tohidi, H. (2011). Review the benefits of using value engineering in information technology project management. Journal of Procedia Computer Science, 3, 917-924.
Triantaphyllou, E. & Mann, S. (1995). Using the analytic hierarchical process for decision making in engineering applications: some challenges. International Journal of Industrial Engineering: Applications and Practice, 2 (1), 35-44.
Triantaphyllou , E., Shu, B., Sanchez, S. & Ray, T. (1998). Multicriteria decision making: An Operation Research Approach. Encyclopedia of Electrical and Electronic Engineering, John Wiley & Sons, New York, 15, 175-186.
US Energy Information Administration, Annual Energy Outlook (2013).
United States Environmental Protection Agency (2005). Value engineering for fund-financed superfund remedial design/remedial action projects. Office of Superfund Remediation and Technology Innovation (OSRTI).
United States Green Building Council (2013). Retrieved October 15, 2013 from http://www.usgbc.org/leed/v4
Unleash the Creative New You! Retrieved March 1, 2013 from http://www.whitedovebooks.co.uk/dml/Creativity.pdf
Value methodology standard and body of knowledge (2007). SAVE International, the Value Society.
Vickers, A. (2001). Handbook of water use and conservative water flow press. Amherst, MAP 140.
Vorakupipat, C., Rezgui, Y. & Hopfe, C. (2010). Value creating construction teams: A case study in the construction sector. Automation in Construction, 19,142-147.

202
Wallenius, J., Dyer, J., Fishburn, P., Steuer, R., Zionts, S. & Deb, K. (2008). Multi-criteria decision making, multi-attribute utility theory: Recent accomplishments and what lies ahead. Management Science, 54 (7), 1336–1349.
Whittle, N. (2012). Value analysis, Functional analysis, Value engineering and Target costing. Chartered Institute of Management Accountants.
Wilkinson, S. Reed, R. & Cadman, D. (2008). Property Development. Taylor and Francis, London.
Wilson, A. (2005). Making the case for green building. Environmental Building News (EBN), 14 (4).
Wiston, W. (2007). Operation Research: Applications and algorithms, Thomson Learning.
Wixson, J. (2004). Value analysis/value engineering: The forgotten lean technique. Retrieved September 3, 2012 from http://www.value-eng.org/knowledge_bank/attachments/VAVE%20the%20Forgotten%20Lean%20Technique%20short.pdf
Wong, S. (2013). CASBEE vs LEED: How is each embraced by its building community? Retrieved August 10, 2013 from http://www.ide.titech.ac.jp/~nabe/wp/casbee-vs-leed-how-is-each-embraced-by-its-building-community/
World Commission on Environment and Development , (WCED), (1987). Our Common Future, Oxford University Press, Oxford.
Yasser, M. & Hanan, M. (2009). The integration of sustainability within value management practices: A study of experienced value managers in the GCC countries. Project Management Journal, 41(2), 50-59.
Younker, D. (2003). Value Engineering: Analysis and Methodology (Cost engineering). New York: Marcel Dekker.
Younker, D. (2005). Creating synergies for sustainable design. ASHRAE Journal.

203
BIOGRAPHICAL SKETCH
Joel Ochieng Wao was born in Homabay, Kenya. He completed grade eight
(Standard 8) in 1994 and grade twelve (Form 4) in 1998 at Kanga Primary School and
Kanga High School respectively, Rongo, Migori County, Kenya. Thereafter, he pursued
further studies in the Faculty of Architecture, Design, and Development at the University
of Nairobi, Kenya, where he successfully completed his undergraduate degree in
building economics on March 11, 2005. He joined the University of South Florida’s
Department of Measurement and Research in the College of Education and graduated
on May 5th 2008 with a master’s degree in curriculum and instruction, concentration in
measurement and evaluation (educational statistics and research methods). Thereafter,
he got admitted into the M.E. Rinker, Sr. School of Construction Management and
graduated on May 2014 with a doctoral degree in design, construction, and planning,
concentration in construction management. Joel is keen on construction management
educational research from the construction industry and academia viewpoint.