Embed Size (px)
Citation preview
We reserve the right to make any changesthat serve to improvethe instrument.
Operating Manual
Spectrophotometer
XION 500
BDA 451Edition 1/2003
2_HB_GB_BDA451 10.02.2003 8:48 Uhr Seite 1

Edition: 3/2001 Operating Manual XION 500
Dear Customer!
Congratulations on your purchase of the XION 500 spectrophotometer, and thank you for placing your trust in our products. The XION 500 is a modern, high-quality analytical instrumentthat will be of considerable benefit in your laboratory.
The XION 500 is a state-of-the-art instrument. It comes complete with a very efficient softwarepackage, which is simple to operate and requires only a short familiarization period. Nevertheless,you should read the general part of this Operating Manual very carefully to ensure that operatingerrors and misunderstandings are avoided from the very start.
The powerful software provides you with the option of supplementing your general routine analysis by programming your own tests for special tasks.
The extensive possibilities of programming, adapting and varying measurements and analysesare described in detail in the XION 500 Operating Manual.
And, of course, you can contact your local Dr. Lange Agency at any time for comprehensive advice.
We wish you lots of success in your work with your XION 500!
Your
Dr. Bruno Lange GmbH & Co. KG
2_HB_GB_BDA451 10.02.2003 8:48 Uhr Seite 2

Chapter Page Edition
Contents
Edition: 1/2003 Operating Manual XION 500
1 Introduction ∑17 3/011.1 Front and back view 1 1/031.2 Setting up and switching on 3 7/011.3 Interfaces 4 3/011.3.1 Serial port (RS 232-C) 4 1/031.3.2 Serial port for scanner 4 1/031.3.3 Parallel port (Centronics-compatible) 4 1/031.4 Printer output 5 3/011.5 Beam path 6 3/011.6 Display and keys 7 3/011.6.1 Entering text with the cursor keys 8 3/011.6.2 Entering numbers with the cursor keys 9 3/011.6.3 Marking a required item in a list of measurement results 10 3/011.6.4 Explanation of the displayed test selection list 10 3/011.6.5 Display of the results data stored in the results databases 11 3/011.6.6 Display during t-scan 12 3/011.7 Lamp compartment 13 3/011.7.1 Changing the lamp 13 7/011.8 Cuvette compartment 14 1/031.9 Database 15 3/011.10 Menu options 16 3/01
2 Analysis ∑24 3/012.1 Evaluation and measurement 1 3/012.2 The measurement procedure 2 3/012.2.1 Control bar (positioning within measurement range) 3 3/012.2.2 Dr. Lange Cuvette Tests with different evaluation options 4 3/012.2.2.1 Resetting
Permanent ? and 5 3/012.3 Creating selection lists 6 3/012.3.1 , enter sample name 7 3/012.3.2 , enter user name 9 3/012.3.3 , enter dilution factor 10 3/012.3.4 , enter units 11 3/012.4 Assigning information to a measurement result 12 3/012.4.1 Recall and input of sample name, dilution, sampling date,
user name and notes 13 3/012.5 Abs/Trans: Absorbance/transmittance measurements 16 3/012.5.1 General information on measuring absorbance and
transmittance 16 3/012.5.2 Carrying out absorbance and transmittance measurements 17 3/012.6 λ -scan, plotting absorbance and transmittance spectra 20 3/012.7 t-scan, time-dependent absorbance/transmittance
measurement 22 3/01
Units
Dilution
User
Sample
w/oYes
2_HB_GB_BDA451 10.02.2003 8:48 Uhr Seite 1

Chapter Page Edition
Contents
Edition: 1/2003 Operating Manual XION 500
3 Edit ∑30 3/013.1 Database function 1 3/013.1.1 Editing the and databases 1 3/013.1.1.1 Selecting measurement results that match specified criteria
in the and databases 2 3/013.1.1.2 Modifying the additional information of an individual
measurement result in the or the databases 4 3/01
3.1.1.3 Simultaneously modifying the additional information of a number of measurement results in the
and databases 6 3/013.1.1.4 Output from the and databases 8 3/013.1.1.5 Deleting measurement results from the and
databases 9 3/013.1.2 Editing the and databases 10 3/013.1.2.1 Modifying the additional information of measurement result
in the or the database 11 3/013.1.2.2 Output from the and database 12 1/033.2 Programming user tests 13 3/013.2.1 General 13 3/013.2.2 Help in developing user methods 13 3/013.2.3 Programming user tests 15 3/013.2.3.1 Principle 15 3/013.2.3.2 Program process options 19 3/013.3 Varying user tests 26 3/013.4 Deleting user tests 28 3/013.5 Copying Dr. Lange Cuvette Tests and Dr. Lange Tests 29 1/033.6 Moving Dr. Lange Tests
(Pipette Tests, Trace Analyses and ”beta“ tests) 30 1/03
4 Update ∑8 3/014.1 Updating with the LangeNET/Dr. Lange Call Centre 1 3/014.1.1 Requesting data and updates from the
LangeNET/Dr. Lange Call Centre 1 3/014.1.2 Exchanging data with a data handset after a data request 4 3/014.1.3 Recycling the battery of the data handset 7 3/014.2 Updating from a diskette 8 3/01
t-scan¬-scan
t-scan¬-scan
t-scan¬-scan
Abs/Trans
Tests
Abs/TransTests
Abs/TransTests
Abs/TransTests
Abs/TransTests
Abs/TransTests
2_HB_GB_BDA451 10.02.2003 8:48 Uhr Seite 2

Chapter Page Edition
Contents
Edition: 1/2003 Operating Manual XION 500
5 Options ∑7 3/015.1 Viewing the instrument status 1 3/015.2 Setting the date and time 1 3/015.3 Printer setting 2 3/015.4 Interfaces, setting the serial interface 5 3/015.5 Password 6 3/015.6 Display contrast 7 3/015.7 Language 7 3/015.8 List function 7 1/03
6 Annex ∑13 3/016.1 Error messages and display messages 1 3/016.2 Inspection and service 5 3/016.2.1 Cleaning the instrument 5 3/016.3 Technical data 6 7/016.4 Glossary 8 3/01
2_HB_GB_BDA451 10.02.2003 8:48 Uhr Seite 3
1.1 Front and back view
Edition: 3/2001 Chapter 1 Introduction / Page 1 of 17
1. In
tro
duc
tio
n
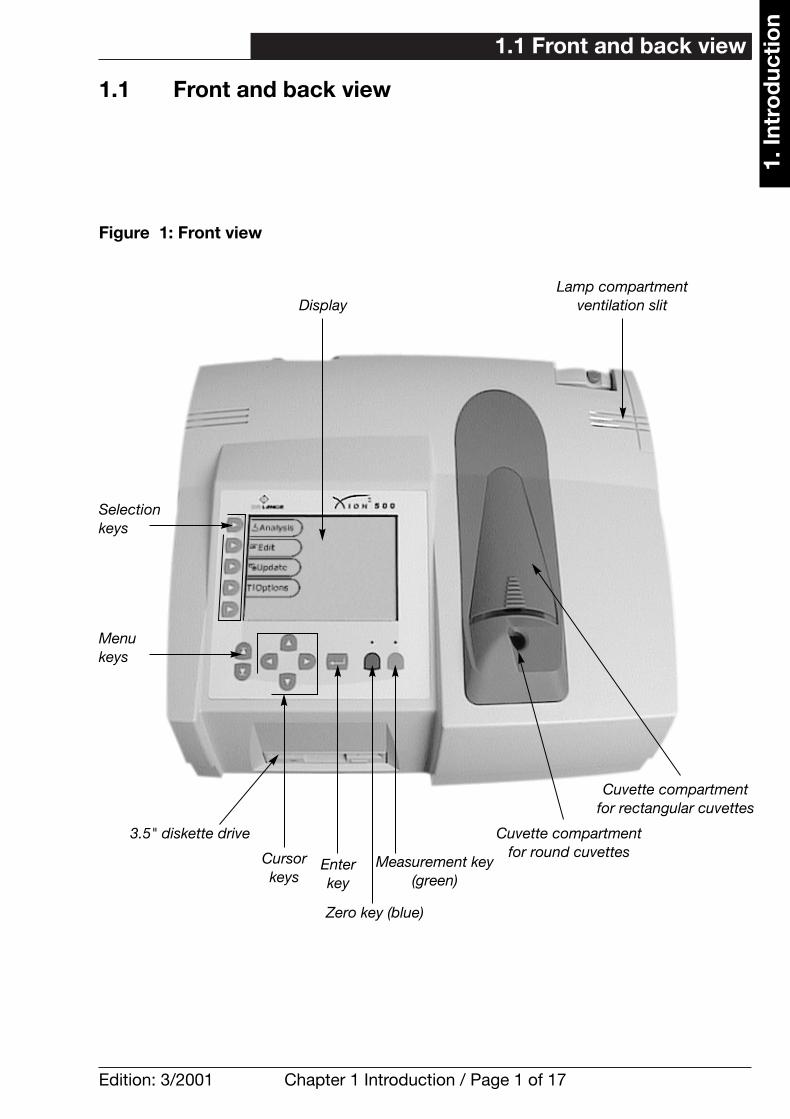
1.1 Front and back view
Figure 1: Front view
Display
Cuvette compartmentfor round cuvettes
3.5" diskette drive
Selection keys
Menu keys
Zero key (blue)
Enterkey
Cursorkeys
Measurement key(green)
Lamp compartmentventilation slit
Cuvette compartmentfor rectangular cuvettes
2_HB_GB_BDA451 10.02.2003 8:48 Uhr Seite 1

1.1 Front and back view
Edition: 1/2003 Chapter 1 Introduction / Page 2 of 17
1. In
tro
duc
tio
n
Figure 2: Back view
Enlarged section
ON/OFF switchData handset
Power cable socketNameplate
Serial port for PC/Dr. Lange LD 500 printer
Serial port for Dr. Lange hand-heldbarcode scanner
Parallel port for DOS-compatible printer
2_HB_GB_BDA451 10.02.2003 8:48 Uhr Seite 2
Edition: 7/2001 Chapter 1 Introduction / Page 3 of 17
1. In
tro
duc
tio
n
1.2 Setting up and switching on
1.2 Setting up and switching on
The XION 500 should stand on a stable, level work surfacewhere it is not exposed to direct sunlight. A power cable issupplied with instrument, with which it can be plugged into amains socket (100 – 240 Volt / 50 – 60 Hz). Please use earthed sockets only and avoid using damaged power cords.The XION 500 is switched on by pressing the toggle switchon the back of the instrument (see chapter 1, page 2, figure 2).Switching on and off in rapid succession should be avoided.Always wait at least 20 seconds before switching on again,otherwise there is a risk that the instrument’s electronic andmechanical systems could be harmed.
The XION 500 spectrophotometer complies with the applicable safety regulations. The user should, however, takenote of the following safety information, both for his own protection and to avoid causing damage to the instrument.
The lamp compartment ventilation slit (see chapter 1, page 1,figure 1) serves to conduct heat away from the lamp andshould therefore not be covered or obstructed in any way.
No objects of any kind should be placed on top of the instrument!
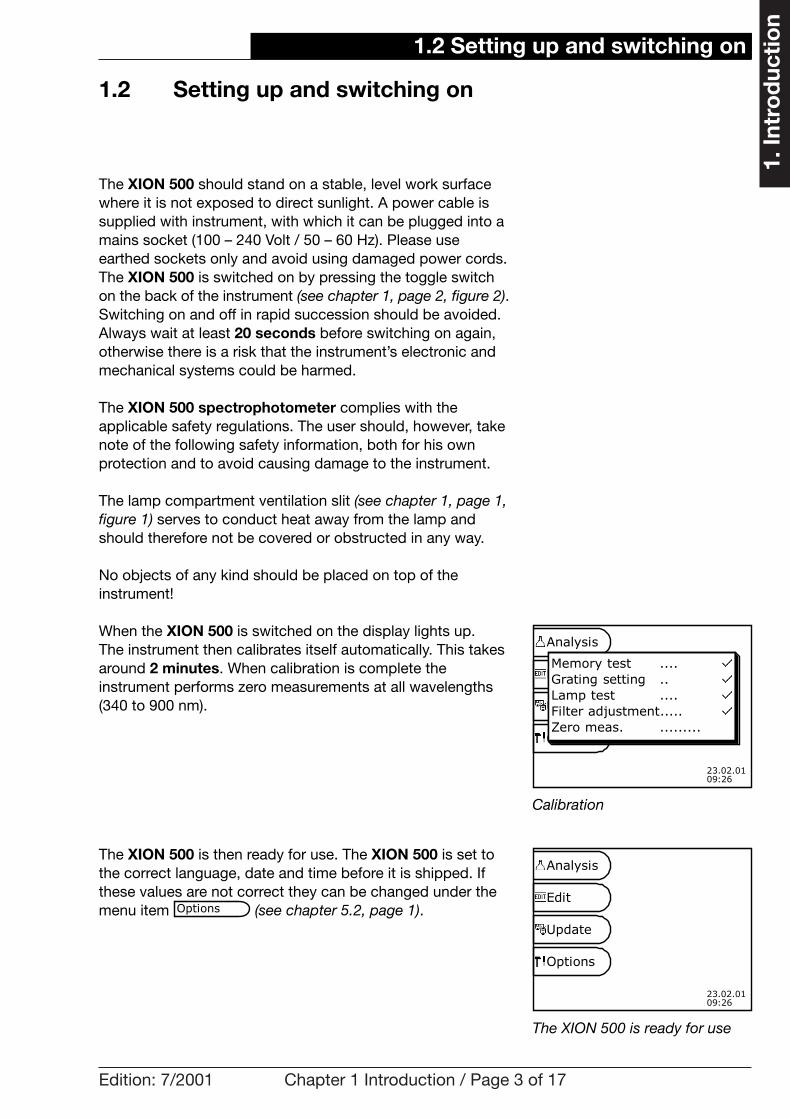
When the XION 500 is switched on the display lights up. The instrument then calibrates itself automatically. This takesaround 2 minutes. When calibration is complete the instrument performs zero measurements at all wavelengths(340 to 900 nm).
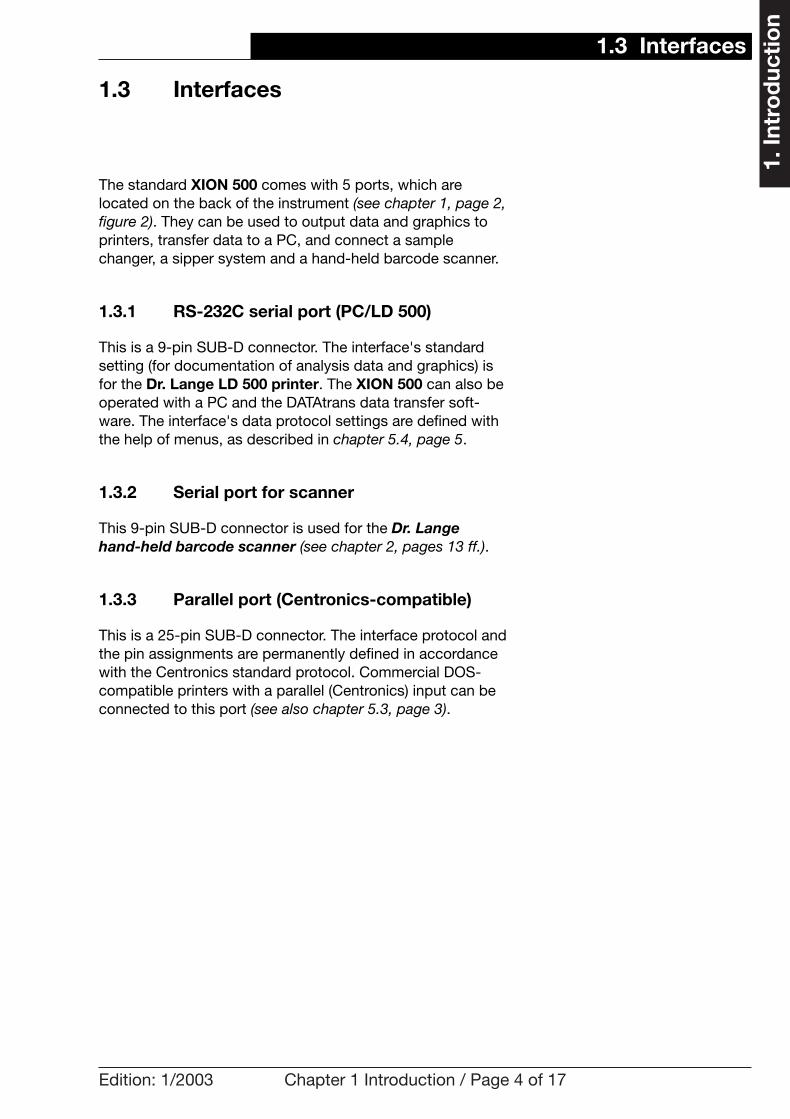
The XION 500 is then ready for use. The XION 500 is set tothe correct language, date and time before it is shipped. Ifthese values are not correct they can be changed under themenu item (see chapter 5.2, page 1).Options
Calibration
The XION 500 is ready for use
Analysis
Edit
Update
Options
23.02.0109:26
Analysis
Edit
Update
Options
23.02.0109:26
Memory test ....Grating setting ..Lamp test ....Filter adjustment.....Zero meas. .........
2_HB_GB_BDA451 10.02.2003 8:48 Uhr Seite 3
Edition: 1/2003 Chapter 1 Introduction / Page 4 of 17
1. In
tro
duc
tio
n
1.3 Interfaces
1.3 Interfaces
The standard XION 500 comes with 5 ports, which are located on the back of the instrument (see chapter 1, page 2,figure 2). They can be used to output data and graphics toprinters, transfer data to a PC, and connect a sample changer, a sipper system and a hand-held barcode scanner.
1.3.1 RS-232C serial port (PC/LD 500)
This is a 9-pin SUB-D connector. The interface's standardsetting (for documentation of analysis data and graphics) isfor the Dr. Lange LD 500 printer. The XION 500 can also beoperated with a PC and the DATAtrans data transfer soft-ware. The interface's data protocol settings are defined withthe help of menus, as described in chapter 5.4, page 5.
1.3.2 Serial port for scanner
This 9-pin SUB-D connector is used for the Dr. Lange hand-held barcode scanner (see chapter 2, pages 13 ff.).
1.3.3 Parallel port (Centronics-compatible)
This is a 25-pin SUB-D connector. The interface protocol andthe pin assignments are permanently defined in accordancewith the Centronics standard protocol. Commercial DOS-compatible printers with a parallel (Centronics) input can beconnected to this port (see also chapter 5.3, page 3).
2_HB_GB_BDA451 10.02.2003 8:48 Uhr Seite 4

Edition: 3/2001 Chapter 1 Introduction / Page 5 of 17
1. In
tro
duc
tio
n
1.4 Printer output
If the XION 500 is connected to a printer and the printer is also switched on, the analysis results are printed as well as displayed. Zero measurements, error messages and additional information are printed together with the analysisresults. The reaction speed of the XION 500 may be slowerduring printing in direct print mode. Direct print mode can bedeactivated for measurements of Dr. Lange Cuvette Tests(with barcode). The analysis results are then printed after thecuvette is removed. This setting is described in detail inchapter 5.3, pages 3 f.
1.4 Printer output
2_HB_GB_BDA451 10.02.2003 8:48 Uhr Seite 5

1.1 Front- und Rückansicht
Edition: 3/2001 Chapter 1 Introduction / Page 6 of 17
1. In
tro
duc
tio
n
1.5 Beam path
1.5 Beam path
The following diagram shows the beam path of the XION 500.
Figure 3: Beam path
0.12Lamp
GridLens Lens
LensPhoto-detector
Cuvette compartment
Cuvette compartment
Reference detector
Lin/logconverter
2_HB_GB_BDA451 10.02.2003 8:48 Uhr Seite 6

1.0001 : 1.5001 : 2.0001 : 4.0001 : 5.0001 : 10.001 : 20.001 : 50.001 : 100.01 : 1000 §
23.02.0109:26
New
Delete
Unit
Meas. range
Save
F2 forE*F1+F2
1.000
0.000 - 17.00
mg/lThe entries areincomplete.
Sample
User
Dilution
23.02.0109:26
Dr. Lange
User
Abs/Trans
–scan
–scan
23.02.0109:26
Edition: 3/2001 Chapter 1 Introduction / Page 7 of 17
1. In
tro
duc
tio
n
1.6 Display and keys
Representation of the keys and display outputs in the Operating Manual
Errors are shown in a window in the display. Error messages must always be confirmed with the menu key otherwise further operation is impossible.
Error messages
Indicates that more selection items are available onanother page. Press the cursor key � to scroll up and press the cursor key � to scroll down.
Navigationarrow � ina selectionlist
Indicates that more options are available on anotherpage. Press the appropriate selection key to pageup or down.
Navigationarrow in the menuwindows
If a menu option is selected with the appropriate selection key, e.g. , another windowopens containing more options.
Menu options
Display zone for current values, data and submenus,and input zone for the individual menu items. The input zone is identified by a window with inputinformation and input indicator.
Display andinput zones
Zero key (blue)Measurement key (green)
Press blue key (blank measurements).Press green key (analysis measurements).
Zero andmeasure-ment keys
Confirm by pressing the key.Enter key
Go one program step forward.Go one program step backward.
Menu keys
Press left, right, upper or lower cursor key.Cursor keys
An option is displayed beside each select key. Select the required option by pressing the associated key.
Selectionkeys and their functions
DescriptionMeaning
1.6 Display and keys
Analysis
Analysis
Edit
2_HB_GB_BDA451 10.02.2003 8:48 Uhr Seite 7

Edition: 3/2001 Chapter 1 Introduction / Page 8 of 17
1. In
tro
duc
tio
n
1.6 Display and keys
1.6.1 Entering text with the cursor keys
�Note:You can exit from the input window at any time without changing anything by pressing the menu key .
Press the appropriate selectionkey to indicate whether youwant upper-case letters, lower-case letters, digits, special characters or numeric subscripts.
You can switch between these options during input by pressing the appropriate selection key. The selectedcharacter set is shown in largertype in the corresponding menu item.
Shows the maximum numberof alphanumeric characters
that can be entered. In this case a maximum of 7characters can be entered.
� marks the input position.Using the cursor keys ,the required character is selected in the underlyingcharacter set. When the position marker isshown inverted �� , a newcharacter can be inserted oran entry can be deleted with the help of the cursorkeys . Press the cursor keys
to shift the position marked with � or �� to
the right or left.
Confirm the text input by pressing the enter key .
Program ƒDelete (all) ƒVariieren ƒDatum/Uhrzeit ƒDruckereinst. ƒSchnittstellen ‚Update ‚
abc
ABC
«?Å
• ™ Ô
123
Password
max 7 charactersԤ characters| @ Move cursor
Xion500‘
Text input window
Selected character set: upper-case letters
23.02.0109:26
23.02.0109:26
Program ƒDelete (all) ƒVariieren ƒDatum/Uhrzeit ƒDruckereinst. ƒSchnittstellen ‚Update ‚
123
abc
«?Å
• ™ Ô
ABC
Password
max 7 charactersԤ characters| @ Move cursor
ABC‘
2_HB_GB_BDA451 10.02.2003 8:48 Uhr Seite 8

Edition: 3/2001 Chapter 1 Introduction / Page 9 of 17
1. In
tro
duc
tio
n
1.6.2 Entering numbers with the cursor keys
�Note:You can exit from the input window at any time without changing anything by pressing the menu key .
1.6 Display and keys
Shows the maximal numberof alphanumeric characters
that can be entered. In this case a maximum of 2characters can be entered.
When numbers are enteredwith the cursor keysthe position marked by � inthe input field is increased ordecreased by 1 or the signswitches from + to – and decimal places (.) are shifted.When the position marker isshown inverted �� , a newcharacter can be inserted oran entry can be deleted withthe help of the cursor keys .
Press the cursor keysto shift the position
marked with � or �� to the right or left.
Confirm the numeric input by pressing the enter key .
Test number input window
Test number
Test name
Wavelength
Std. conc.
Test number
max 2 charactersԤ characters| @ Move cursor
01 ‘
2_HB_GB_BDA451 10.02.2003 8:48 Uhr Seite 9
Edition: 3/2001 Chapter 1 Introduction / Page 10 of 17
1. In
tro
duc
tio
n
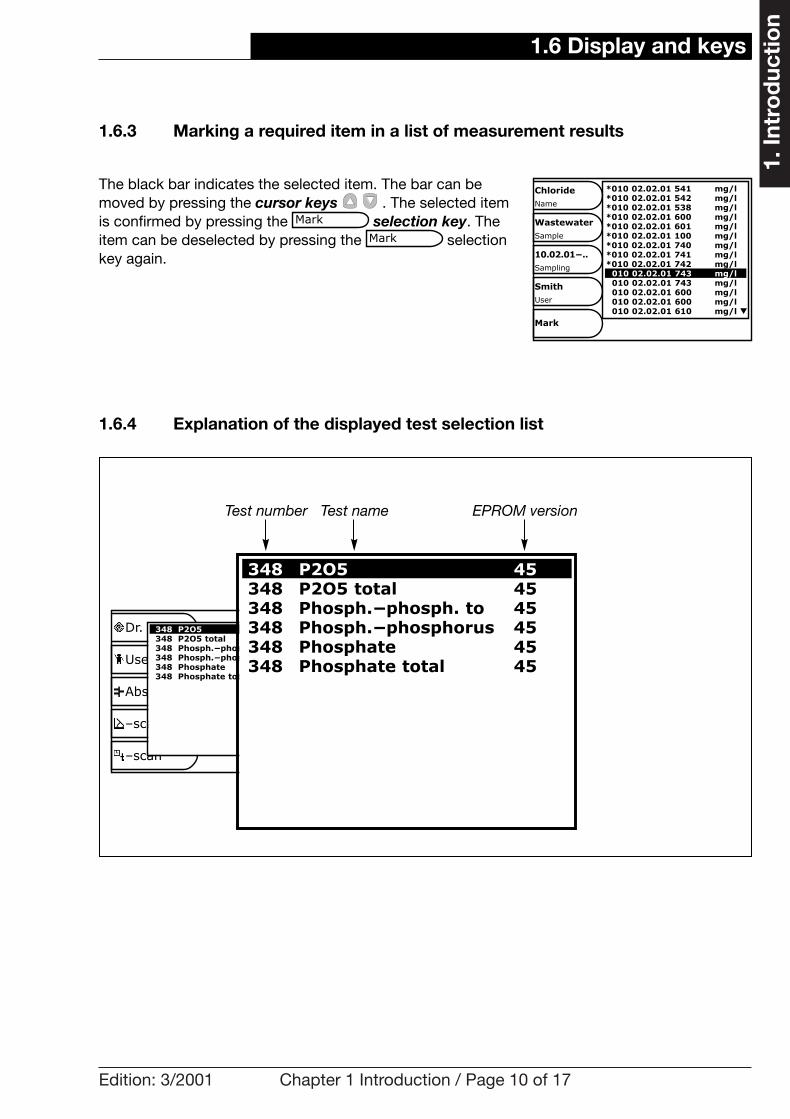
1.6.3 Marking a required item in a list of measurement results
The black bar indicates the selected item. The bar can bemoved by pressing the cursor keys . The selected itemis confirmed by pressing the selection key. Theitem can be deselected by pressing the selectionkey again.
1.6.4 Explanation of the displayed test selection list
Mark
Mark
1.6 Display and keys
ChlorideName
10.02.01-..Sampling
SmithUser
Mark
WastewaterSample
*010 02.02.01 541 mg/l*010 02.02.01 542 mg/l*010 02.02.01 538 mg/l*010 02.02.01 600 mg/l*010 02.02.01 601 mg/l*010 02.02.01 100 mg/l*010 02.02.01 740 mg/l*010 02.02.01 741 mg/l*010 02.02.01 742 mg/l
010 02.02.01 743 mg/l010 02.02.01 743 mg/l010 02.02.01 600 mg/l010 02.02.01 600 mg/l010 02.02.01 610 mg/l §
Dr. Lange
Abs/Trans
User
–scan
–scan
348 P2O5 45348 P2O5 total 45348 Phosph.-phosph.to 45348 Phosph.-phosphorus 45348 Phosphate 45348 Phosphate total 45
348 P2O5 45348 P2O5 total 45348 Phosph.-phosph. to 45348 Phosph.-phosphorus 45348 Phosphate 45348 Phosphate total 45
EPROM versionTest nameTest number
2_HB_GB_BDA451 10.02.2003 8:48 Uhr Seite 10
Edition: 3/2001 Chapter 1 Introduction / Page 11 of 17
1. In
tro
duc
tio
n
1.6 Display and keys
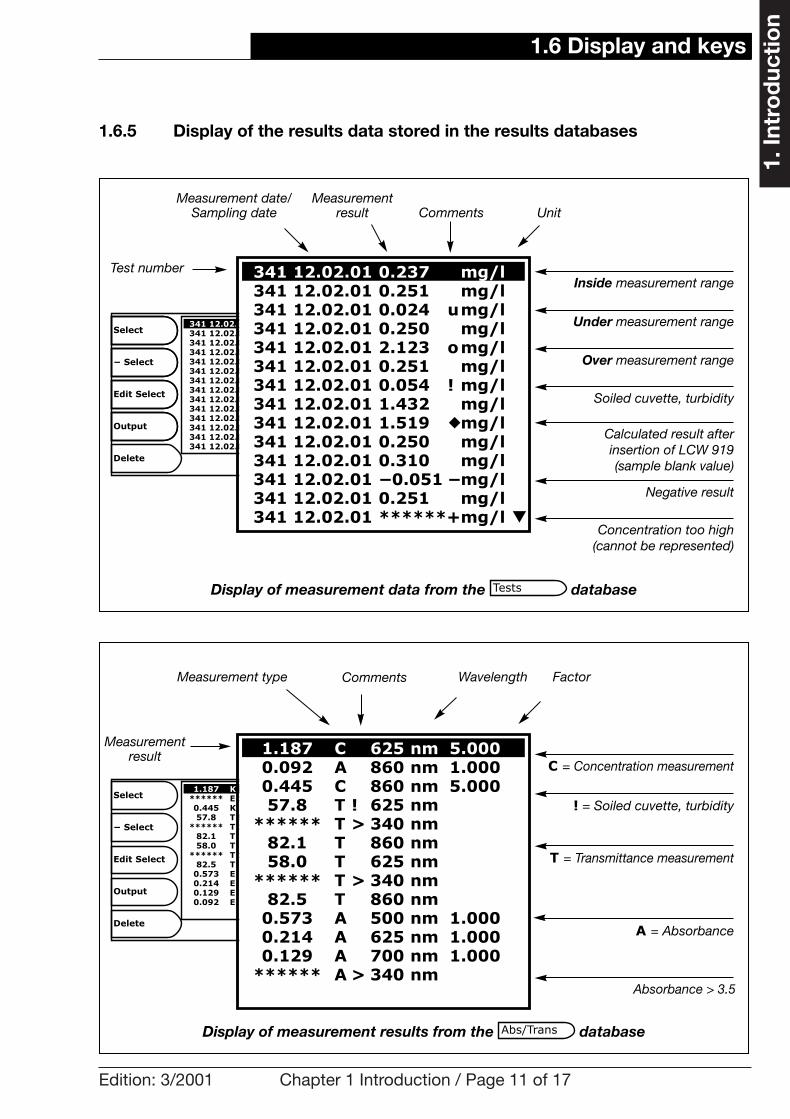
1.6.5 Display of the results data stored in the results databases
Display of measurement data from the databaseTests
341 12.02.01 ******+mg/l §
341 12.02.01 0.237 mg/l341 12.02.01 0.024 umg/l341 12.02.01 0.251 mg/l341 12.02.01 2.123 omg/l341 12.02.01 0.251 mg/l341 12.02.01 0.250 mg/l341 12.02.01 0.054 ! mg/l341 12.02.01 1.432 mg/l341 12.02.01 0.300 mg/l341 12.02.01 1.519 “mg/l341 12.02.01 0.310 mg/l341 12.02.01 0.251 mg/l341 12.02.01 -0.051 -mg/l
341 12.02.01 ******+mg/l §
341 12.02.01 0.237 mg/l341 12.02.01 0.251 mg/l341 12.02.01 0.024 umg/l341 12.02.01 0.250 mg/l341 12.02.01 2.123 omg/l341 12.02.01 0.251 mg/l341 12.02.01 0.054 ! mg/l341 12.02.01 1.432 mg/l341 12.02.01 1.519 “mg/l341 12.02.01 0.250 mg/l341 12.02.01 0.310 mg/l341 12.02.01 -0.051 -mg/l341 12.02.01 0.251 mg/l
Measurement date/ Sampling date Unit
Inside measurement range
Under measurement range
Test number
Measurement result
Over measurement range
Concentration too high (cannot be represented)
Negative result
Soiled cuvette, turbidity
Calculated result after insertion of LCW 919 (sample blank value)
Display of measurement results from the databaseAbs/Trans
C = Concentration measurement
! = Soiled cuvette, turbidity
T = Transmittance measurement
A = Absorbance
Measurement type FactorWavelength
Measurement result
1.187 K 625 nm 5.000****** E > 340 nm0.445 K 860 nm 5.00057.8 T ! 625 nm
****** T > 340 nm82.1 T 860 nm58.0 T 625 nm
****** T > 340 nm82.5 T 860 nm
0.573 E 500 nm 1.0000.214 E 625 nm 1.0000.129 E 700 nm 1.0000.092 E 860 nm 1.000
Select
1.187 C 625 nm 5.0000.092 A 860 nm 1.0000.445 C 860 nm 5.00057.8 T ! 625 nm
****** T > 340 nm82.1 T 860 nm58.0 T 625 nm
****** T > 340 nm82.5 T 860 nm
0.573 A 500 nm 1.0000.214 A 625 nm 1.0000.129 A 700 nm 1.000
****** A > 340 nm
Comments
Comments
Absorbance > 3.5
- Select
Edit Select
Select
- Select
Edit Select
Output
Delete
Delete
Output
2_HB_GB_BDA451 10.02.2003 8:48 Uhr Seite 11

1.6.6 Display during t-scan
1.6 Display and keys
Edition: 3/2001 Chapter 1 Introduction / Page 12 of 17
1. In
tro
duc
tio
n
Elapsed time since start of measurement
Most recent absorbancemeasurement
Time until next measurement
Stop0
3.5
00’00”
0.399Abs
007) 00:00 ’45”
Number of measurementssince start of measurement
Terminate measurement
Absorbance relative to absorbance range
2_HB_GB_BDA451 10.02.2003 8:48 Uhr Seite 12

Edition: 7/2001 Chapter 1 Introduction / Page 13 of 17
1. In
tro
duc
tio
n
1.7 Lamp compartment
The lamp compartment is on the right beside the cuvettecompartment and is provided with ventilation slits on the top of the instrument and in the side wall (see chapter 1,page 1, figure 1).
1.7.1 Changing the lamp
1. Switch off the XION 500. 2. Disconnect from the mains.3. Carefully remove the lamp cover from the
enclosure (pull the top edge of the cover away and down from the instrument and place it to the side).
4. Carefully remove both knurled screws and place them to the side.
5. Remove the lamp unit, including the plug-in board �.6. Carefully unplug the lamp unit from the board �.7. Plug new lamp (order number: LYW 966) unto the board.
(NB: Avoid any contact with the glass of the lamp!) �8. Insert lamp unit with the rounded part pointing down.9. Fasten the unit with the two knurled screws and replace
the lamp cover.
1.7 Lamp compartment
�
�
�
2_HB_GB_BDA451 10.02.2003 8:48 Uhr Seite 13

Edition: 1/2003 Chapter 1 Introduction / Page 14 of 17
1. In
tro
duc
tio
n
1.8 Cuvette compartment
The cuvette compartment of the XION 500 can accommodaterectangular cuvettes with a path length of 10, 20 or 50 mm.Markings indicate how rectangular cuvettes with a path length of 10 or 20 mm should be properly positioned.Round cuvettes can be inserted in the round cuvette compartment.
�Note:The cuvette compartment cover can be left open while a measurement is carried out. However, in dusty environments it is advisable to protect the samples by closing the compartment.
Cuvette compartment
1.8 Cuvette compartment
2_HB_GB_BDA451 10.02.2003 8:48 Uhr Seite 14

Edition: 3/2001 Chapter 1 Introduction / Page 15 of 17
1. In
tro
duc
tio
n
1.9 Database
The XION 500 has 4 databases in which results are stored.All measurement data are saved to these databases and canbe called up or edited.(See chapter 1.6.5, 11 and chapter 3.1, pages 1 ff.)
�NB:When the database is full, the oldest records are overwritten one by one, so the database always contains the most recent records.
�NB:The data in the results databases can be edited after each measurement by pressing or
, .DataEdit
Data
1.9 Database
500Absorbance and transmittance measurements
2500Measurements with Dr. Lange Cuvette Tests, Pipette Tests, Trace Analysis, ”beta“ tests, usertests.
RecordsResults fromDatabase
3t - scan
3¬ - scan
RecordsResults fromDatabase
Tests
Abs/Trans
¬ - scan
t - scan
2_HB_GB_BDA451 10.02.2003 8:48 Uhr Seite 15
Edition: 3/2001 Chapter 1 Introduction / Page 16 of 17
1. In
tro
duc
tio
n
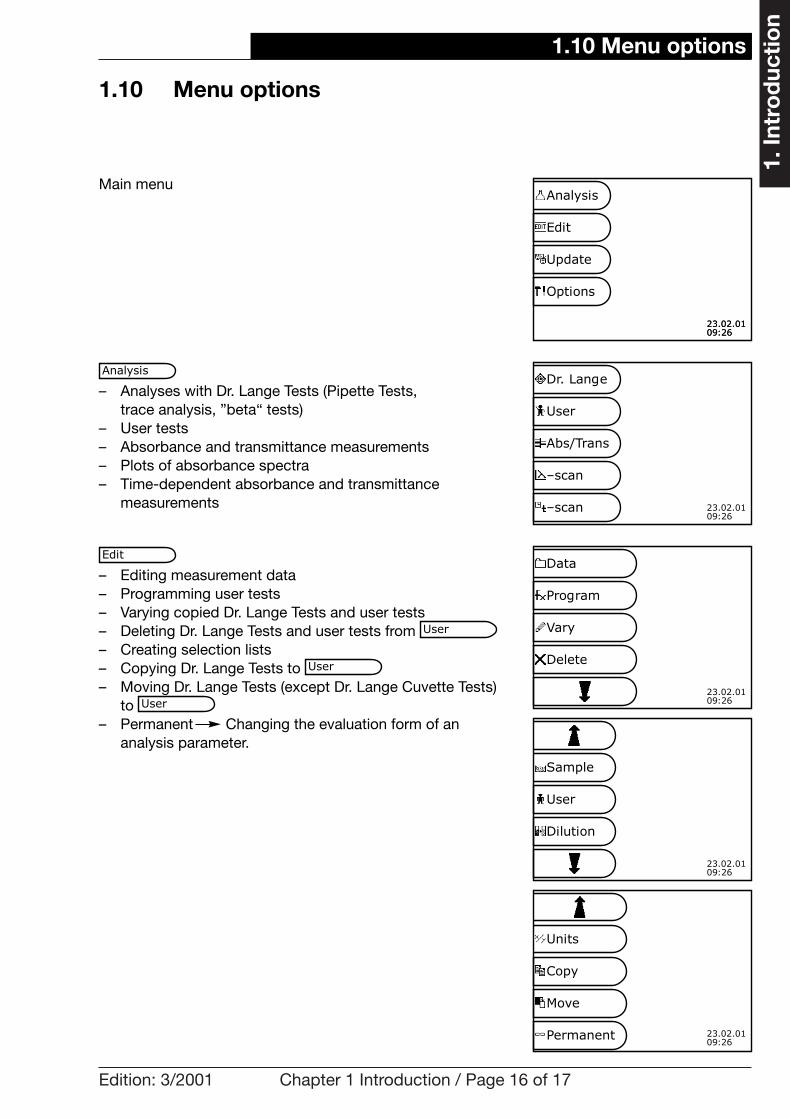
1.10 Menu options
1.10 Menu options
Main menu
– Analyses with Dr. Lange Tests (Pipette Tests, trace analysis, ”beta“ tests)
– User tests– Absorbance and transmittance measurements– Plots of absorbance spectra– Time-dependent absorbance and transmittance
measurements
– Editing measurement data– Programming user tests– Varying copied Dr. Lange Tests and user tests– Deleting Dr. Lange Tests and user tests from – Creating selection lists– Copying Dr. Lange Tests to – Moving Dr. Lange Tests (except Dr. Lange Cuvette Tests)
to – Permanent Changing the evaluation form of an
analysis parameter.
User
User
User
Edit
AnalysisDr. Lange
User
Abs/Trans
–scan
–scan
Data
Program
Vary
Delete
Sample
User
Dilution
Units
Copy
Move
Permanent
23.02.0109:26
23.02.0109:26
23.02.0109:26
23.02.0109:26
23.02.0109:26
Analysis
Edit
Update
Options
23.02.0109:26
2_HB_GB_BDA451 10.02.2003 8:48 Uhr Seite 16

Edition: 3/2001 Chapter 1 Introduction / Page 17 of 17
1. In
tro
duc
tio
n
– Updating data
– Settings– List function for printing test data
Options
Update
1.10 Übersicht der Menüpunkte
LangeNET
Diskette
Info
Date/Time
Printer setting
Interfaces
Contrast
Password
Language
23.02.0109:26
23.02.0109:26
23.02.0109:26
List
2_HB_GB_BDA451 10.02.2003 8:48 Uhr Seite 17

2.1 Evaluation and measurement
Edition: 3/2001 Chapter 2 Analysis / Page 1 of 24
2. A
naly
sis
2.1 Evaluation and measurement
The XION 500 provides a choice of 6 measurement programs.
a) Dr. Lange Cuvette TestsThe measurement program is called up automatically when a cuvette with a barcode label is inserted. This is also the case when the barcode of a user method that makes use of a Dr. Lange blank value cuvette LCW 906 is read.
The information in the barcode enables the instrument to automatically select the wavelength needed for the measurement and calculate the result with the help of the stored factors.
b) Dr. Lange Pipette Tests, Trace Analyses and ”beta“ testsStarting in the main menu, press the and
selection keys. A selection list opens, showing all Dr. Lange Pipette Tests, Trace Analyses and ”beta“ tests in ascending test number order.Use the cursor keys to select the required test from the list and press the enter key to confirm your choice.
c) User testsWhen the XION 500 is shipped, the selection list under the menu option is empty. The user can subsequently build up his own list. He can do this by:• programming his own procedures
(see chapter 3.2, pages 13 ff.)• copying Dr. Lange Tests and then adapting them to his
own needs (see chapter 3.5, page 29)• moving Dr. Lange Tests (only Pipette Tests,
Trace Analyses and ”beta“ tests) (see chapter 3.6, page 30).
d) Absorbance/transmittance measurement (see chapter 2.5, pages 16 ff.)
e) ¬ -scan (absorbance spectra) (see chapter 2.6, pages 20 ff.)
f) t-scan (time-dependent absorbance/transmittance measurements) (see chapter 2.7, pages 22 ff.)
User
Dr. Lange
Analysis
2_HB_GB_BDA451 10.02.2003 8:48 Uhr Seite 1

2.1 Auswertung und Messung
Edition: 3/2001 Chapter 2 Analysis / Page 2 of 24
2. A
naly
sis
2.2 The measurement procedure
Prepare and evaluate the cuvettes in line with the Dr. Langeworking procedures or the user-specific requirements. The result is displayed.
2.2 The measurement procedure
No. : 8 = Control numberControl bar (relationship of measurement tomeasurement range)
150.0 = Upper limit of measurement range
15.00 = Lower limit of measurement range
Edit the results database
Recall or input test information
Display output after a Dr. Lange Cuvette Test has been measured
73.5mg/l
Info 15.00
150.0
Data mg/l
No. :8
314COD
More Pipette Tests, Trace Analyses, ”beta“ tests
Control bar (relationship of measurement tomeasurement range)
Edit the results database
Recall or input test information
Display output after a Dr. Lange Pipette Test has been measured
More user tests
Control bar (relationship of measurement tomeasurement range)
Edit the results database
Recall or input test information
Display output after a user test has been measured
0.123mg/l
Info 0.010
2.000
Data
Dr.Lange
mg/l
No. :7
025Hydrazine
750mg/l
Info 10.00
1000
Data
User
mg/l
No. :5
11XYZ
314 = Test number
COD = Parameter
025 = Test number
Hydrazine = Parameter
No. : 7 = Control number
2.000 = Upper limit of measurement range
0.010 = Lower limit of measurement range
11 = Test number
XYZ = Test name
No. : 5 = Control number
1000 = Upper limit of measurement range
10.00 = Lower limit of measurement range
2_HB_GB_BDA451 10.02.2003 8:48 Uhr Seite 2
2.1 Auswertung und Messung
Edition: 3/2001 Chapter 2 Analysis / Page 3 of 24
2. A
naly
sis
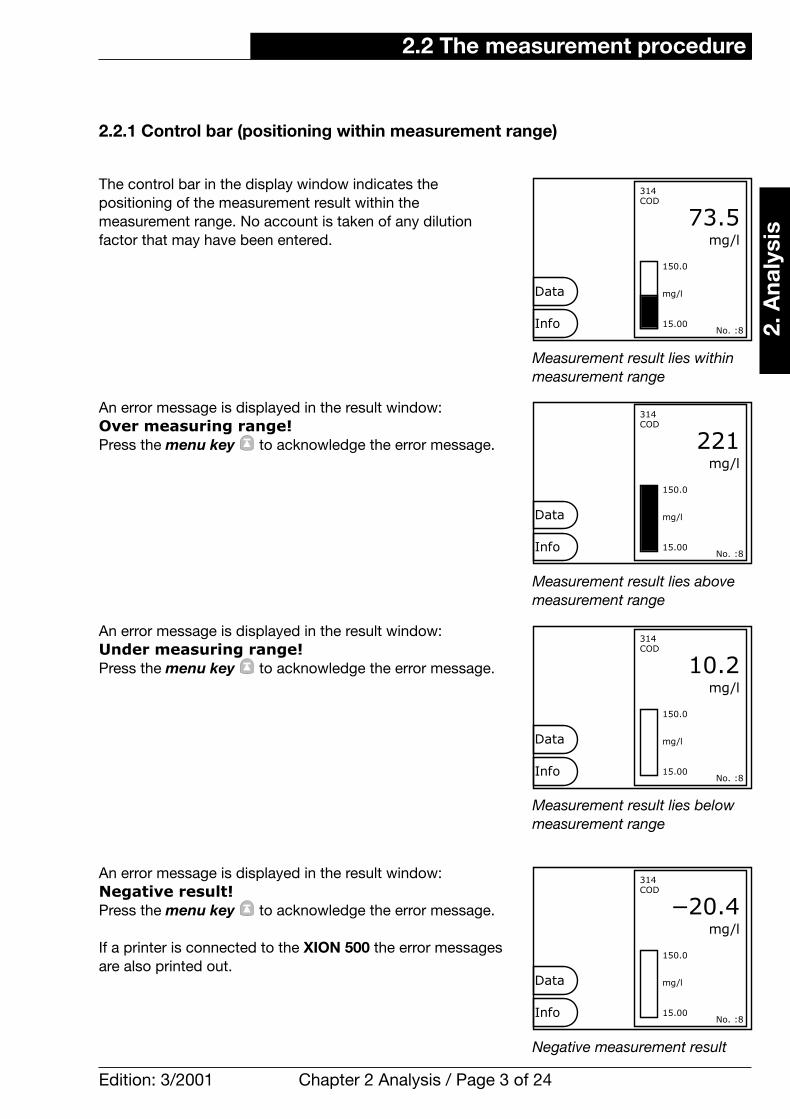
2.2.1 Control bar (positioning within measurement range)
The control bar in the display window indicates the positioning of the measurement result within the measurement range. No account is taken of any dilution factor that may have been entered.
An error message is displayed in the result window:Over measuring range!Press the menu key to acknowledge the error message.
An error message is displayed in the result window:Under measuring range!Press the menu key to acknowledge the error message.
An error message is displayed in the result window:Negative result!Press the menu key to acknowledge the error message.
If a printer is connected to the XION 500 the error messagesare also printed out.
Measurement result lies withinmeasurement range
2.2 The measurement procedure
Measurement result lies abovemeasurement range
Measurement result lies belowmeasurement range
Negative measurement result
73.5mg/l
Info 15.00
150.0
Data mg/l
No. :8
314COD
221mg/l
Info 15.00
150.0
Data mg/l
No. :8
314COD
10.2mg/l
Info 15.00
150.0
Data mg/l
No. :8
314COD
-20.4mg/l
Info 15.00
150.0
Data mg/l
No. :8
314COD
2_HB_GB_BDA451 10.02.2003 8:48 Uhr Seite 3

2.1 Auswertung und Messung
Edition: 3/2001 Chapter 2 Analysis / Page 4 of 24
2. A
naly
sis
2.2.2 Dr. Lange Cuvette Tests with different evaluation options
Some Dr. Lange Tests provide a choice of evaluation optionsfor a parameter. Use the cursor keys to select an evaluation form (see chapter 1.6.4, page 10) and press theenter key to confirm your choice.
If you want the selected evaluation form to apply permanently,press selection key . When this measurement ismade again, the selection list is not displayed.
If is selected, the evaluation form selection list isalways displayed when the test is called, as is the promptPermanent ? , , .
If (without) is selected, the prompt Permanent ?, , is switched off
permanently. This ensures that the evaluation form has to be defined anew for each measurement but no furtherprompts have to be responded to.
� Tip:If the analysis result is always expressed in the same way, it is advisable to select .
� Tip:If the form in which the analysis result is expressed often varies, select to avoid having to respond to any other prompts.
w/o
Yes
Now/oYes
w/o
Now/oYes
No
Yes
Evaluation forms of LCK 348
2.2 The measurement procedure
??.4mg/l
Info 1.000
???.?
Data mg/l
No. :1
348?????348 P2O5 45
348 P2O5 total 45348 Phosph.-phosph.to 45348 Phosph.-phosphorus 45348 Phosphate 45348 Phosphate total 45
Options for defining the evaluation form
0.114mg/l
No 1.500
???.?w/o
Yes
mg/l
No. :1
348Phosphate
P2O5Permanent?
2_HB_GB_BDA451 10.02.2003 8:48 Uhr Seite 4

23.02.0109:26
2.2.2.1 Resetting Permanent ? and
a) During a measurement
After a result has been displayed, press the selection key. When subsequent measurements
are carried out, a choice can again be made between the different evaluation forms.
b) Before a measurement
Press the and selection keys. A selection list appears, containing all parameters that areset to Permanent ? or . Use thecursor keys to select a parameter and confirm yourchoice by pressing the enter key . This confirmation causes the selected evaluation form to be automaticallyreset.
�Note:Parameters that are set to Permanent ? are shown in the selection list with all available evaluation forms. Use the cursor keys to select an evaluation form from this ”group“ and confirm your choice by pressing the enter key . When subsequent measure-ments are carried out the menu options ,
and are again available, so the evaluation form can be redefined.
�Note:Press the menu key to exit from the ,
menus.Permanent
Edit
Now/o
Yes
w/o
w/oYes
PermanentEdit
- Permanent
w/oYes
2.1 Auswertung und Messung
Edition: 3/2001 Chapter 2 Analysis / Page 5 of 24
2. A
naly
sis
Resetting Permanent ? andw/o
Yes
2.2 The measurement procedure
Resetting Permanent ? Yes
5.28mg/l
Info 1.200
11.50-Permanent
mg/l
No. :1
348P2O5
Data
Units
Copy
Move
Permanent
348 Nitrite 45341 Nitrite-nitrogen 45341 Phosphate 45
2_HB_GB_BDA451 10.02.2003 8:48 Uhr Seite 5

Edition: 3/2001 Chapter 2 Analysis / Page 6 of 24
2. A
naly
sis
2.3 Creating selection lists
When the selection key is pressed a submenuappears (see diagram on right - Edit Menu).Additional information about a measurement result can beinput here. The information is stored automatically in the appropriate selection list.
� Advantage:The ability to select from individually created lists means there is no necessity to repeat inputs.
� Tip:The , and input data can be generated and printed with a commercially available barcode creation program and type selection code 39 or 128. These data can be read in by a Dr. Lange hand-held barcode scanner, so that they will subsequently be available in future in the appropriate selection list.
� Tip:Existing commercially available barcode labels (UPC/EAN, Code 39, Code 128, 2/5 Interleaved, 2/5 Industrial, 2/5 Matrix) can be coded with the ,and input data, which can then be scanned in by the Dr. Lange barcode scanner.
Units
UserSample
UnitsUserSample
Edit
2.3 Selection lists
Sample
User
Dilution
23.02.0109:26
Edit menu
Edit menu
23.02.0109:26
Units
Copy
Move
Permanent
2_HB_GB_BDA451 10.02.2003 8:48 Uhr Seite 6

Edition: 3/2001 Chapter 2 Analysis / Page 7 of 24
2. A
naly
sis
2.3.1 , enter sample name
This function can be used to enter additional sample names.Up to 20 sample names can be accommodated in a selectionlist. The list contains two predefined sample definitions fromDr. Lange:
A sample name can be, for example, the exact name of theplace where the sample was taken. The name can be up to10 characters long.
Starting in the main menu, press the selection keysand . Use the cursor keys to
select a line in the selection list where the new sample namewill be positioned.Press the selection key. An input window for thesample name appears (see chapter 1.6.1, page 8 and chapter 1.6.2, page 9). To incorporate the sample name in the list, confirm the input by pressing the enter key .(Exception: No user-defined sample names can be insertedbetween the sample names predefined by Dr. Lange.)Sample names that are no longer needed can be deleted orthey can be selected with the cursor keys , confirmedby pressing the enter key , and then overwritten.
� Tip:Press the selection key when it does not matter where the new sample name is to be positioned in the selection list.
�Note:Press the menu key at any time to exit from the input window without changing anything.
� Tip:If a scanner is connected, sample names can also be scanned in for inclusion in the selection list.
New
New
SampleEdit
Sample
Sample menu
2.3 Selection lists
New
Delete
------AddistaInflowOutflow
Sample name input window
------AddistaZulaufAblaufBecken
ABC
123
«?Å
• ™ Ô
abc Enter sample
max 10 charactersԤ characters| @ Move cursor
Tank‘
No sample name is assigned here– – – – – –
This sample name is used for measurements ofstandard solutions
addista ®
23.02.0109:26
23.02.0109:26
2_HB_GB_BDA451 10.02.2003 8:48 Uhr Seite 7
Edition: 3/2001 Chapter 2 Analysis / Page 8 of 24
2. A
naly
sis
� Tip:The Dr. Lange ProID system can also be used. This consists of hand-held barcode scanners, holders and the differently coloured ProID clips. A ProID clip is fitted to the top of the cuvette. Eight different clip colours represent up to 8 eight different sample identifiers, e.g. different sampling locations. The barcode on the clip is read with the scanner and assigned to a defined sample name in the XION 500. The following analysis of the cuvette is then documented with this sample name and no mix-ups can occur.The exact description can be found in the operating manual of the Dr. Lange ProID system.
Short description of the menu options
= Input (through input window or scanner) of new sample names
= Delete sample names = Return to menu Edit
Delete
New
2.3 Selection lists
2_HB_GB_BDA451 10.02.2003 8:48 Uhr Seite 8

Edition: 3/2001 Chapter 2 Analysis / Page 9 of 24
2. A
naly
sis
2.3.2 , enter user name
This function can be used to enter user names. Up to 20 usernames, each with a length of 10 characters, can be stored ina selection list.
Starting in the main menu, press the selection keysand . Use the cursor keys to
select a line in the selection list where the new user name willbe positioned.Press the selection key. An input window for the user name appears (see chapter 1.6.1, page 8 andchapter 1.6.2, page 9). To incorporate the user name in the list, confirm the input bypressing the enter key .User names that are no longer needed can be deleted or theycan be selected with the cursor keys , confirmed bypressing the enter key , and then overwritten.
� Tip:Press the selection key when it does not matter where the new user name is to be positioned in the selection list.
�Note:Press the menu key at any time to exit from the input window without changing anything.
� Tip:If a scanner is connected, user names can also be scanned in for inclusion in the selection list.
Short description of the menu options
= Input (through input window or scanner) of new user names
= Delete user names = Return to menu Edit
Delete
New
New
New
UserEdit
User
User menu
2.3 Selection lists
User name input window
------SmithMayCoulthard
ABC
123
«?Å
• ™ Ô
abc
23.02.0109:26
23.02.0109:26
New
Delete
------SmithMeierMüllerSchumacher
Enter user
max 10 charactersԤ characters| @ Move cursor
May‘
2_HB_GB_BDA451 10.02.2003 8:48 Uhr Seite 9

Edition: 3/2001 Chapter 2 Analysis / Page 10 of 24
2. A
naly
sis
2.3.3 , enter dilution factor
This function can be used to enter additional dilution factors.Up to 19 dilution factors can be stored in a selection list. Ofthese, 9 are predefined by Dr. Lange.
Starting in the main menu, press the selection keysand . Use the cursor keys to
select a line in the selection list where the new dilution factorwill be positioned.Press the selection key. An input window for thedilution factor appears (see chapter 1.6.2, page 9). To incorporate the dilution factor in the list, confirm the input by pressing the enter key .Dilution factors that are no longer needed can be deleted orthey can be selected with the cursor keys , confirmedby pressing the enter key , and then overwritten.
� Tip:Press the selection key when it does not matter where the new dilution factor is to be positioned in the selection list.
�Note:Press the menu key at any time to exit from the input window without changing anything.
Short description of the menu options
= Input of new dilution factors= Delete dilution factors = Return to menu Edit
Delete
New
New
New
DilutionEdit
Dilution
Dilution menu
2.3 Selection lists
1.0001 : 1.5001 : 2.0001 : 4.0001 : 5.0001 : 10.001 : 20.001 : 50.001 : 100.01 : 1000 §
Dilution factor input window
1.000 ‘1 : 1.5001 : 2.0001 : 4.0001 : 5.0001 : 10.001 : 20.001 : 50.001 : 100.01 : 1000 §
23.02.0109:26
23.02.0109:26
New
Delete
New
Delete
Enter dilution
max 5 charactersԤ characters| @ Move cursor
2.8‘
2_HB_GB_BDA451 10.02.2003 8:48 Uhr Seite 10

Edition: 3/2001 Chapter 2 Analysis / Page 11 of 24
2. A
naly
sis
2.3.4 , enter units
This function can be used to enter the unit in which the measurement result is expressed. Up to 20 units, each with alength of 10 characters, can be stored in a selection list. Ofthese, 18 are predefined by Dr. Lange.
Starting in the main menu, press the selection keysand . Use the cursor keys to
select a line in the selection list where the new unit will bepositioned.Press the selection key. An input window for theunit appears (see chapter 1.6.1, page 8 and chapter 1.6.2,page 9). To incorporate the unit in the list, confirm the inputby pressing the enter key .Units that are no longer needed can be deleted or they can be selected with the cursor keys , confirmed by pressing the enter key , and then overwritten.
� Tip:Press the selection key when it does not matter where the new unit is to be positioned in the selection list.
�Note:Press the menu key at any time to exit from the input window without changing anything.
� Tip:If a scanner is connected, units can also be scanned in for inclusion in the selection list.
Short description of the menu options
= Input (through input window or scanner) of new units
= Delete units = Return to menu Edit
Delete
New
New
New
UnitsEdit
Units
Unit menu
2.3 Selection lists
Nonemg/lStg/lmg/kgg/kg%mmol/lmol/lmg/kgTS §
Unit input window
ABC
123
«?Å
• ™ Ô
abc
Nonemg/lStg/lmg/kgg/kg%mmol/lmol/lmg/kgTS §
Enter unit
max 10 charactersԤ characters| @ Move cursor
g/l‘
23.02.0109:26
23.02.0109:26
New
Delete
2_HB_GB_BDA451 10.02.2003 8:48 Uhr Seite 11
Edition: 3/2001 Chapter 2 Analysis / Page 12 of 24
2. A
naly
sis
2.4 Assigning information to a measurement result
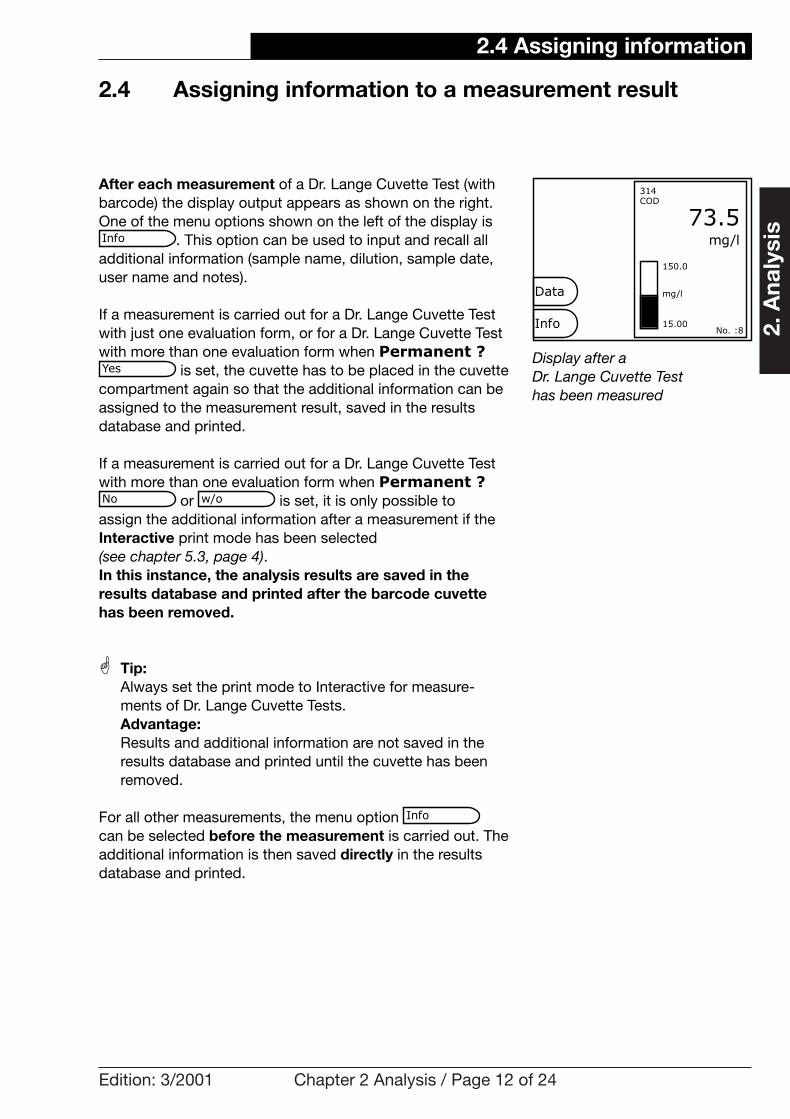
After each measurement of a Dr. Lange Cuvette Test (withbarcode) the display output appears as shown on the right.One of the menu options shown on the left of the display is
. This option can be used to input and recall alladditional information (sample name, dilution, sample date,user name and notes).
If a measurement is carried out for a Dr. Lange Cuvette Testwith just one evaluation form, or for a Dr. Lange Cuvette Testwith more than one evaluation form when Permanent ?
is set, the cuvette has to be placed in the cuvettecompartment again so that the additional information can beassigned to the measurement result, saved in the results database and printed.
If a measurement is carried out for a Dr. Lange Cuvette Testwith more than one evaluation form when Permanent ?
or is set, it is only possible to assign the additional information after a measurement if theInteractive print mode has been selected (see chapter 5.3, page 4). In this instance, the analysis results are saved in the results database and printed after the barcode cuvettehas been removed.
� Tip:Always set the print mode to Interactive for measure-ments of Dr. Lange Cuvette Tests.Advantage:Results and additional information are not saved in the results database and printed until the cuvette has been removed.
For all other measurements, the menu option can be selected before the measurement is carried out. The additional information is then saved directly in the results database and printed.
Info
w/oNo
Yes
Info
Display after a Dr. Lange Cuvette Test has been measured
2.4 Assigning information
73.5mg/l
15.00
150.0
mg/l
No. :8
314COD
Info
Data
2_HB_GB_BDA451 10.02.2003 8:48 Uhr Seite 12

Edition: 3/2001 Chapter 2 Analysis / Page 13 of 24
2. A
naly
sis
2.4.1 Recall and input of sample name, dilution, sampling date, user name and notes
Press the selection key.Press the selection key for the required item of information.
Short description of the menu options
�NB:The information field ”Dilution“ is not available when absorbance/transmittance measurements, λ-scan und t-scan are carried out.
Info
2.4 Assigning information
Blank information fields
------Sample
1.000Dilution
12.08.00Sampling
------User
------Note
73.5mg/l
15.00
150.0
mg/l
No. :8
314COD
Input through input window (see chapter 1.6.1, page 8) or Dr. Langebarcode scanner.
User's notes (max. 60 characters)Note
Use cursor keys to mark the entry in the selection list and confirm bypressing the enter key . Scan in the user name with the Dr. Lange barcode scanner without including it in the selection list.
Assign user nameUser
Enter the sampling date (see chapter 1.6.2, page 9).
Date and time when sample was takenSampling
Use cursor keys to mark the entry in the selection list and confirm bypressing the enter key . Scan in the dilution factor with the Dr. Lange barcode scanner without including it in the selection list.
Assign dilution factorDilution
Use cursor keys to mark the entry in the selection list and confirm bypressing the enter key . Scan in the sample name with the Dr. Lange barcode scanner without including it in the selection list. Use theDr. Lange ProID system.
Assign sample nameSample
Input optionsDescriptionInformation field
2_HB_GB_BDA451 10.02.2003 8:48 Uhr Seite 13

Edition: 3/2001 Chapter 2 Analysis / Page 14 of 24
2. A
naly
sis
The selected information entries are displayed in the appropriate information field and are saved in the results database together with the associated measurement result.
� Tip:The entries for the information fields ,
, and can be created and printed with a commercial barcode creation program and the type selection code 39 or 128.When you create your barcode, enter the following start code to ensure correct assignment:% 1 for Sample% 2 for User% 3 for Note% 4 for DilutionThe start code enables the information to be scanned in directly without selecting the corresponding menu option.
� Tip:Existing commercially available barcode labels (UPC/EAN, Code 39, Code 128, 2/5 Interleaved, 2/5 Industrial, 2/5 Matrix) can be scanned in directly by the Dr. Lange barcode scanner. The information is written in the information field without having to select the menu option .Sample
NoteUserDilution
Sample
2.4 Assigning information
Information fields with entries
OutflowSample
1.000Dilution
12.08.00Sampling
SmithUser
Measure..Note
73.5mg/l
15.00
150.0
mg/l
No. :8
314COD
2_HB_GB_BDA451 10.02.2003 8:48 Uhr Seite 14

Edition: 3/2001 Chapter 2 Analysis / Page 15 of 24
2. A
naly
sis
Entries in the information fields
2.4 Assigning information
WithoutWithoutWithoutWithout
* Switch on* From measurement to measurement* When a parameter is modified* Change of program
Note
System date/timeSystem date/time or own selectionSelection remains the sameSelection remains the same
* Switch on* From measurement to measurement* When a parameter is modified* Change of program
Sampling date
WithoutSelected user nameSelection remains the sameSelection remains the same
* Switch on* From measurement to measurement* When a parameter is modified* Change of program
User name
1.000 1.000 or selected dilution1.000 1.000
* Switch on* From measurement to measurement* When a parameter is modified* Change of program
Dilution
WithoutWithout or selected sample nameWithoutWithout
* Switch on* From measurement to measurement* When a parameter is modified* Change of program
Sample
Information entryActionInformation fields
2_HB_GB_BDA451 10.02.2003 8:48 Uhr Seite 15
Edition: 3/2001 Chapter 2 Analysis / Page 16 of 24
2. A
naly
sis
2.5 Absorbance/transmittance measurements
2.5.1 General information on measuring absorbance and transmittance
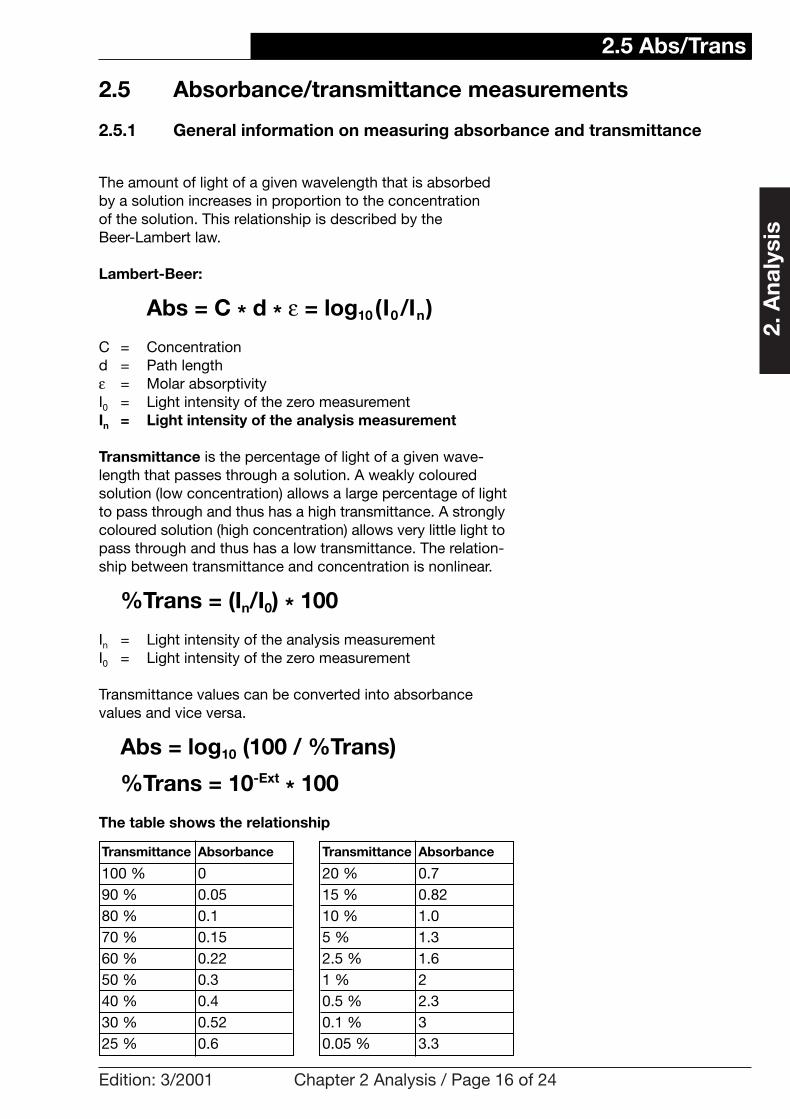
The amount of light of a given wavelength that is absorbedby a solution increases in proportion to the concentration of the solution. This relationship is described by the Beer-Lambert law.
Lambert-Beer:
Abs = C * d * ε = log10(I0/In)
C = Concentrationd = Path lengthε = Molar absorptivityI0 = Light intensity of the zero measurementIn = Light intensity of the analysis measurement
Transmittance is the percentage of light of a given wave-length that passes through a solution. A weakly coloured solution (low concentration) allows a large percentage of lightto pass through and thus has a high transmittance. A stronglycoloured solution (high concentration) allows very little light topass through and thus has a low transmittance. The relation-ship between transmittance and concentration is nonlinear.
%Trans = (In/I0) * 100
In = Light intensity of the analysis measurementI0 = Light intensity of the zero measurement
Transmittance values can be converted into absorbance values and vice versa.
Abs = log10 (100 / %Trans)
%Trans = 10-Ext* 100
The table shows the relationship
2.5 Abs/Trans
0.625 %0.5230 %0.440 %0.350 %0.2260 %0.1570 %0.180 %0.0590 %0100 %
AbsorbanceTransmittance
3.30.05 %30.1 %2.30.5 %21 %1.62.5 %1.35 %1.010 %0.8215 %0.720 %
AbsorbanceTransmittance
2_HB_GB_BDA451 10.02.2003 8:48 Uhr Seite 16

Edition: 3/2001 Chapter 2 Analysis / Page 17 of 24
2. A
naly
sis
2.5.2 Carrying out absorbance and transmittance measurements
The menu item can be used to measure the absorbance or transmittance of any given solution. Starting in the main menu, press the selection keys
and .
Description of the menu options
Measurements in absorbance mode at wavelengths from 340 to 900 nm. The option is selected by pressing the appropriate selection key. The selected setting
is shown in larger type.
Measurements in transmittance mode at wavelengths from 340 to 900 nm. Switch from to by pressing the selection key. The selected setting is shown in largertype.
Wavelength in the range from 340 to 900 nm at which themeasurement is to be carried out. The option is selected bypressing the selection key. A windowopens, showing 3 possible wavelengths.
Wavelength
Wavelength
Transmittance
Transmittance
Absorbance
TransmittanceAbsorbance
Absorbance
AbsorbanceTransmittance
Abs/TransAnalysis
Abs/Trans
Absorbance menu
2.5 Abs/Trans
Transmittance menu
Wavelength menu
Info0
3.5
Data
AbsorbanceTransmittance
340/ /Wavelength
1.000Factor
Info0
100
Data
TransmittanceAbsorbance
340/ /Wavelength
Factor
Delete0
100
¬1 560 nm¬2¬3
2_HB_GB_BDA451 10.02.2003 8:48 Uhr Seite 17

Edition: 3/2001 Chapter 2 Analysis / Page 18 of 24
2. A
naly
sis
2.5 Abs/Trans
If, for example, ¬ 1 is selected with the cursor keysand confirmed with the enter key , a wavelength inputwindow opens (see chapter 1.6.2, page 9). When the wavelength has been entered, pressing the enter keycauses it to be included automatically in the selection list anddisplayed simultaneously in the menu item .Pressing the menu key causes the program to exit fromthe input window.
�Tip:Wavelengths that are no longer needed can be selected with the cursor keys and deleted by pressing the selection key. (Exception: the setting entered under ¬ 1 cannot be deleted.)
� Tip:When up to 3 wavelengths are entered for inclusion in the selection list, the next wavelength is set and measured automatically each time the green measurement key is pressed.
Used to convert absorbance into concentration.Conc (for concentration factor) is shown in the display instead of Abs if the factor is not equal to 1.000. The factor can have any value from +/-0.000 to 99999.Press the selection key. Enter the factor (see chapter 1.6.2, page 9) and confirm by pressing the enter key . The input is automatically displayed in themenu item .
Edit measurement data.Press the selection key (see chapter 1.9, page 15 and chapter 3.1, pages 1 ff.).Press the menu key to exit from this menu option.
Select or input additional information about the measurementresult (see chapter 2.4, pages 12 ff.).Press the selection key.Press the menu key to exit from this menu option.
Info
Info
Data
Data
Factor
Factor
Factor
Delete
Wavelength
Delete0
100
¬1 560 nm¬2 700 nm¬3 860 nm
Wavelength
max 3 charactersԤ characters| @ Move cursor
625‘
Menu with wavelength entry
Factor input window
Info0
3.5
Data
AbsorbanceTransmittance
625/700/860Wavelength
1.000Factor
Factor
max 6 charactersԤ characters| @ Move cursor
+2.547‘
Wavelength input window
Info0
3.5
Data
AbsorbanceTransmittance
625/700/860Wavelength
1.000Factor
2_HB_GB_BDA451 10.02.2003 8:48 Uhr Seite 18

Edition: 3/2001 Chapter 2 Analysis / Page 19 of 24
2. A
naly
sis
Measuring mode1. Insert the zero cuvette (blank value cuvette) and
press the blue zero key.2. Remove the zero cuvette, insert the sample cuvette and
press the green measurement key.3. Insert any further sample cuvettes, pressing the
green measurement key each time.
The result is displayed.
The control bar in the display shows the relationship of themeasurement result to the maximal display range (0 – 3.5 Abs).The bar shows the measured result irrespective of any factorthat may have been entered.
�NB:Absorbance values in excess of 3.5 are not measured. An error message is displayed. All error messages must be acknowledged by pressing the menu key , otherwise it is not possible to proceed.
When transmittance measurements are carried out the controlbar shows the maximal measurement range of 0 – 100%transmittance. It is not possible to carry out an evaluationwith a factor during a transmittance measurement.
�Note:Zero measurements can be repeated at any time by pressing the blue zero key.
�Note:During a measurement series it is possible to switch betweenabsorbance and transmittance measurements at any time.
Measurement result in absorbance mode without factor
2.5 Abs/Trans
Measurement result in absorbance mode with factor
The measured absorbance exceeds 3.5
Measurement result in transmittance mode
0.464Abs
Info0
3.5
560/ /
1.000
560 nm
2.319Conc
Info0
3.5
560/ /
5.000
560 nm
******Abs
Info0
3.5
560/ /
1.000
560 nm
22.0%Trans
Info0
100
560/ /
560 nm
Data
AbsorbanceTransmittance
Wavelength
Factor
Data
AbsorbanceTransmittance
Wavelength
Factor
Data
AbsorbanceTransmittance
Wavelength
Factor
Absorbance > 3.5!
Data
TransmittanceAbsorbance
Wavelength
Factor
2_HB_GB_BDA451 10.02.2003 8:48 Uhr Seite 19

Edition: 3/2001 Chapter 2 Analysis / Page 20 of 24
2. A
naly
sis
2.6 λ-scan, plotting absorbance andtransmittance spectra
The menu option enables the spectrum of anysolution to be plotted. Starting in the main menu, press the
and selection keys.
Description of the menu options
Plot of an absorbance spectrum at wavelengths from 340 to900 nm. Select by pressing the appropriate selection key.The selected setting is shown in larger typein the menu item.
Plot of a transmittance spectrum at wavelengths from 340 to900 nm. Change the setting by pressingthe selection key.The selected setting is shown in larger typein the menu item.
Select by pressing the appropriate selection key. A windowopens, in which the lower and upper limits of the wavelengthrange (340 to 900 nm) and the measurement interval (intervalbetween two measurement points of 1 to 10 nm) can beentered.
If Lower wavelength or Upper wavelength or Interval is selected with the cursor keys and confirmed with the enter key , an input window opens(see chapter 1.6.2, page 9). Press the enter key to confirm the input, which is then shown in larger type in themenu option. Press the menu key to exit from the inputwindow.
Wavelength
Transmittance
Absorbance
TransmittanceAbsorbance
Absorbance
AbsorbanceTransmittance
¬ - scanAnalysis
¬ - scan
2.6 λ-scan
Transmittance menu
Input window for lowerand upper wavelengths andmeasurement interval
Info
Graph
430-800/5
Absorbance menu
Info
Data
Graph
AbsorbanceTransmittance
340-900/10Wavelength
TransmittanceAbsorbance
Wavelength
Info
Data
340-900/10
Graph
TransmittanceAbsorbance
Wavelength
Lower wavelength 430 nmUpper wavelength 800 nmInterval 5 nm
Data
2_HB_GB_BDA451 10.02.2003 8:48 Uhr Seite 20

Edition: 3/2001 Chapter 2 Analysis / Page 21 of 24
2. A
naly
sis
�NB:The lower wavelength must be smaller than the upper wavelength.The lower wavelength is adjusted accordingly if the difference between the upper and lower wavelengths is not a multiple of the interval.Example 1: Lower wavelength 430 nm
Upper wavelength 800 nmInterval 5 nmNo change to the lower wavelength
Example 2: Lower wavelength 430 nmUpper wavelength 800 nmInterval 7 nmThe lower wavelength is adjusted to 429 nm
Press the appropriate selection key to display the graph.
Editing the measurement data.Press the appropriate selection key (see chapter 1.9, page 15 and chapter 3.1, pages 1 ff.).Press the menu key to exit from this menu item.
Select or enter additional information about a measurementresult (see chapter 2.4, pages 12 f.).Select by pressing the appropriate selection key.Press the menu key to exit from this menu item.
Measuring modeInsert blank value cuvette and press the blue zero key. Whilethe blank value is being measured a time bar is displayed,showing the duration of the zero measurement. The photo-meter subsequently switches automatically to measuringmode (the LED on the green measurement key lights up).Insert sample cuvette and press the green measurement keyto start the wavelength-dependent absorbance or trans-mittance measurement. While the measurement is being carriedout a time bar is displayed, showing its duration.After the graph has been displayed, pressing the menu key causes the values to be displayed as a table. Pressthe menu key again to exit from the menu.
Info
Data
Graph
2.6 λ-scan
Measurement wavelength andmeasurement parameters menu
Display of results in the form of a graph
Info
Data
Graph
430-800/5
Info
Daten
Graph
430-800/5
430 - 800 nm / 5 nmT min 88.0 at 695 nmT max 88.0 at 430 nm430 nm 88.0 T435 nm 88.1 T440 nm 88.2 T445 nm 88.3 T450 nm 88.4 T455 nm 88.5 T460 nm 88.6 T465 nm 88.7 T470 nm 88.8 T475 nm 88.9 T480 nm 89.0 T485 nm 89.0 T490 nm 89.1 T495 nm 89.3 T500 nm 89.3 T
Display of results in the form of a table
Info
Data
Graph
430-800/5
430 - 800 nm / 5 nmT min 88.0 at 695 nmT max 90.7 at 430 nm430 nm 88.0 T435 nm 88.1 T440 nm 88.2 T445 nm 88.3 T450 nm 88.4 T455 nm 88.5 T460 nm 88.6 T465 nm 88.7 T470 nm 88.8 T475 nm 88.9 T480 nm 89.0 T485 nm 89.0 T490 nm 89.1 T495 nm 89.3 T500 nm 89.3 T
TransmittanceAbsorbance
Wavelength
TransmittanceAbsorbance
Wavelength
43087.0
88.0
89.0
90.0
91.0
523 615 708 800
%Trans
nm
TransmittanceAbsorbance
Wavelength
2_HB_GB_BDA451 10.02.2003 8:48 Uhr Seite 21

Edition: 3/2001 Chapter 2 Analysis / Page 22 of 24
2. A
naly
sis
2.7 t-scan, time-dependent absorbance/transmittance measurement
The menu option enables the time-dependentabsorbance spectrum of any solution to be plotted. Startingin the main menu, press the and selection keys.
Description of the menu options
Plot of an absorbance spectrum over time. Select by pressing the appropriate selection key.The selected setting is shown in larger typein the appropriate menu item.
Plot of a transmittance spectrum over time. Change the setting by pressing the selection key.The selected setting is shown in larger type in the appropriate menu item.
Select by pressing the appropriate selection key.A window opens, showing the parameters that can be set forthe measurement.
Parameter
Transmittance
Absorbance
TransmittanceAbsorbance
Absorbance
AbsorbanceTransmittance
t-scanAnalysis
t-scan
2.7 t-scan
Absorbance menu
Info
Graph
Parameter
0
3.5
00’05”
Measurement parameter input window
Info
Graph
Parameter
0
3.5
00’05”
AbsorbanceTransmittance
AbsorbanceTransmittanceWavelength 560 nm
Factor 4.000Time Interval 00’05”No. 20Continuous yesprint yes
Data
Data
2_HB_GB_BDA451 10.02.2003 8:48 Uhr Seite 22

Edition: 3/2001 Chapter 2 Analysis / Page 23 of 24
2. A
naly
sis
Parameter description
2.7 t-scan
Yes or NoSelect with cursor keys .Confirm with enter key Yes and Notoggle.
Continuous:Yes = Print the measurement results
and graphsNo = Print the graph
Non-continuous:Yes = Print the measurement resultsNo = Print the start and stop time
Print the measured values and graphs during the measurement
Yes or NoSelect with cursor keys .Confirm with enter key Yes and Notoggle.
Continuous measurement of the samplesin accordance with the number of individualmeasurements until the measurement isterminated manually by selecting themenu option
Continuous
002 – 500Select with cursor keys .Confirm with enter key .Input (see chapter 1.6.2, page 9).
Number of individual measurementsNo.
00’05” – 59’59”Select with cursor keys .Confirm with enter key .Input (see chapter 1.6.2, page 9).
Interval between consecutive measurements’ = minutes” = seconds
Time interval
+/- 0.000 – 99999Select with cursor keys .Confirm with enter key .Input (see chapter 1.6.2, page 9).
Conversion from absorbance to concentrationConc is displayed instead of Abs whenthe factor is not 1
Factor
340 – 900 nmSelect with cursor keys .Confirm with enter key .Input (see chapter 1.6.2, page 9).
Wavelength at which the measurement isto be carried out
Wavelength
OptionsDescriptionDisplay
Stop
2_HB_GB_BDA451 10.02.2003 8:48 Uhr Seite 23

00:01 ’10” 0.400 A
Edition: 3/2001 Chapter 2 Analysis / Page 24 of 24
2. A
naly
sis
00:01 ’10” 100 T
Press the appropriate selection key to display the graph.
Editing the measurement data.Press the appropriate selection key (see chapter 1.9, page 15 and chapter 3.1, pages 1 ff.).Press the menu key to exit from this menu item.
Select or enter additional information about a measurementresult (see chapter 2.4, pages 12 ff.).Select by pressing the appropriate selection key.Press the menu key to exit from this menu item.
Measuring modeInsert blank value cuvette and press the blue zero key. Thephotometer subsequently switches automatically to measuringmode (the LED on the on the green measurement keylights up).Insert sample cuvette and press the green measurement keyto start the time-dependent absorbance or transmittancemeasurement (see chapter 1.6.6, page 12).After the graph has been displayed, pressing the menu key causes the values to be displayed as a table. Press the menu key again to exit from the menu.
�Note:The measurement can be terminated at any time by pressing the menu item .Stop
Info
Data
Graph
2.7 t-scan
Display output during the t-scan
Display of results in the form of a graph
Stop
Info
Daten
Graph
Parameter
560 nm F=1.000A min 0.399 00:00 ’00”A max 0.400 00:00 ’05”
00:00 ’00” 100 T00:00 ’05” 90.9 T00:00 ’10” 91.7 T00:00 ’15” 100 T00:00 ’20” 100 T00:00 ’25” 100 T00:00 ’30” 100 T00:00 ’35” 100 T00:00 ’40” 100 T00:00 ’45” 100 T00:00 ’50” 100 T00:00 ’55” 100 T00:01 ’00” 100 T00:01 ’05” 100 T §
Info
Daten
Graph
Parameter
560 nm F=1.000A min 0.399 00:00 ’00”A max 0.400 00:01 ’05”
00:00 ’00” 0.399 A00:00 ’05” 0.399 A00:00 ’10” 0.399 A00:00 ’15” 0.399 A00:00 ’20” 0.399 A00:00 ’25” 0.399 A00:00 ’30” 0.399 A00:00 ’35” 0.399 A00:00 ’40” 0.399 A00:00 ’45” 0.399 A00:00 ’50” 0.399 A00:00 ’55” 0.399 A00:01 ’00” 0.399 A00:01 ’05” 0.400 A §
Display of results in the form of a table
0
3.5
00’00”
0.399Abs
007) 00:00 ’45”
AbsorbanceTransmittance
00:00’00”0.200
0.275
0.350
0.425
0.500
00:00’45”
Abs
AbsorbanceTransmittance
2_HB_GB_BDA451 10.02.2003 8:48 Uhr Seite 24

Edition: 3/2001 Chapter 3 Edit / Page 1 of 30
3. E
dit
3.1 Database function
The XION 500 has 4 results databases: , , ,
All measurement data are saved in the appropriate databases and can be edited, deleted and printed.
3.1.1 Editing the and databases
The menu shown on the right can be opened immediatelyafter a series of measurements by pressing the selection key.
The data can also be edited, deleted and printed at a latertime. Starting in the main menu, open the same menu bypressing the and selection keys.If the (measurement of Dr. Lange Cuvette Tests,Pipette Tests, Trace Analyses, ”beta“ tests, and user tests;see chapter 1, page 11) or the (absorbance andtransmittance measurement) menu option is selected bypressing the appropriate selection key, a menu with the options , , , and also appears.
Short description of the menu options
Delete
OutputEdit Select- SelectSelect
Abs/Trans
Tests
DataEdit
Data
Abs/TransTests
t-scan¬-scanAbs/TransTests
3.1 Database function
Data menu after measurement of Dr. Lange Cuvette Tests, Pipette Tests, trace analysis,”beta“ tests and user tests
Delete
Output
Edit Select
- Select
Select031 12.02.01 0.156 mmol/l031 12.02.01 0.156 mmol/l341 12.02.01 0.793 mg/l341 12.02.01 -0.051 -mg/l341 12.02.01 0.237 mg/l
Menu after selecting Edit, Data
Tests
Abs/Trans
–scan
–scan
Delete all results or only the marked results (see chapter 3.1.1.5, page 9)Delete
Print all results or only the marked results or save them to diskette or transmit them toa PC with measurement data transfer software (see chapter 3.1.1.4, page 8)
Output
Modify the additional information of all results or only the marked results (see chapter 3.1.1.3, pages 6ff.)
Edit Select
Nullify the selection criteria (see chapter 3.1.1.1, pages 2ff.)- Select
Select measurement results that match specific criteria (see chapter 3.1.1.1, pages 2ff.)
Select
DescriptionMenu option
23.02.0109:26
2_HB_GB_BDA451 10.02.2003 8:48 Uhr Seite 1

Edition: 3/2001 Chapter 3 Edit / Page 2 of 30
3.1.1.1 Selecting measurement results that match specified criteria in the and databases
a) Selecting results that match entries in the information fields
To select measurements that match specified criteria, pressthe selection key. A number of menu options are available and can be combined at will.
Choose the desired menu item by pressing the appropriateselection key, e.g. . A selection list is displayed. Use the cursor keys toselect a criterion, e.g. chloride, and confirm by pressing theenter key . A selection list is now displayed which contains only measurement results for chloride. The criterion”Chloride“ is also shown in the menu item. Define any other desired selection criteria and then exit fromthis menu by pressing the menu key .
Description of the individual menu items
� Tip:The selection can be nullified by pressing the selection key. A list of all available measurement results is again displayed.
� Tip:A specified selection criterion can be cleared by selecting ”– – – – – –“ in the appropriate selection list.
- Select
Name
Name
Select
Abs/TransTests
3.1 Database function
3. E
dit
Select menu
------Name
------Sampling
------User
Mark
------Sample
010 02.02.01 600 mg/l010 02.02.01 605 mg/l341 12.02.01 0.943 mg/l341 12.02.01 0.945 mg/l348 12.02.01 1.450 mg/l348 12.02.01 4.745 mg/l348 12.02.01 9.431 mg/l028 20.02.01 0.015 mg/l028 20.02.01 0.015 mg/l
Unit, Sample, User name:Select from the list with the cursor keys andconfirm with the enter key .Sampling date: Input (see chapter 1.6.2, page 9)
Results of absorbance and transmittance measurements
Name, Sample, User name:Select from the list with the cursor keys andconfirm with the enter key .Sampling date: Input (see chapter 1.6.2, page 9)
Results of Dr. Lange Cuvette Tests (with barcode), Pipette Tests, Trace Analyses, "beta" tests, and user tests
OptionsDatabase
Measurement results after selection
ChlorideName
27.01.01-..Sampling
SmithUser
Mark
WastewaterSample
010 27.01.01 541 mg/l010 27.01.01 542 mg/l010 27.01.01 538 mg/l010 27.01.01 600 mg/l010 30.01.01 601 mg/l010 30.01.01 100 mg/l010 30.01.01 740 mg/l010 30.01.01 741 mg/l010 01.02.01 742 mg/l010 01.02.01 743 mg/l010 01.02.01 743 mg/l010 01.02.01 600 mg/l010 02.02.01 600 mg/l010 02.02.01 610 mg/l §
Tests
Abs/Trans
2_HB_GB_BDA451 10.02.2003 8:48 Uhr Seite 2

Edition: 3/2001 Chapter 3 Edit / Page 3 of 30
3. E
dit
b) Selection by marking measurement results
A list of individually specified measurement results can be compiled by pressing the and selection keys.Use the cursor keys to select the required measure-ment result and then mark it by pressing the selection key (see chapter 1.6.3, page 10).After all required measurement results have been marked,exit from the menu by pressing the menu key . A list containing only the marked results is then displayed.
� Tip:The selection can be nullified by pressing the selection key. A list of all available measurement results is again displayed.
- Select
Mark
MarkSelect
3.1 Database function
List of marked measurement results
------Name
------Sampling
------User
Mark
------Sample
*010 02.02.01 600 mg/l*010 02.02.01 610 mg/l*010 16.02.01 514 mg/l*010 16.02.01 516 mg/l*348 20.02.01 7.548 mg/l*341 20.02.01 1.50 mg/l*341 20.02.01 0.629 mg/l*032 22.02.01 2.33 mg/l*032 22.02.01 2.48 mg/l*010 26.02.01 600 mg/l*010 26.02.01 718 mg/l
2_HB_GB_BDA451 10.02.2003 8:48 Uhr Seite 3

Edition: 3/2001 Chapter 3 Edit / Page 4 of 30
3. E
dit
010 27.01.01 541 mg/l010 27.01.01 542 mg/l010 27.01.01 538 mg/l010 27.01.01 600 mg/l010 30.01.01 601 mg/l010 30.01.01 100 mg/l010 30.01.01 740 mg/l010 30.01.01 741 mg/l010 01.02.01 742 mg/l010 01.02.01 743 mg/l010 01.02.01 743 mg/l010 01.02.01 600 mg/l010 02.02.01 600 mg/l010 02.02.01 610 mg/l §
3.1.1.2 Modifying the additional information of an individual measurement result in the or the database
a) Before measurement results are selected
Select the menu item after a measurement orselect the menu items , , or . A list of measurement results is displayed.Use the cursor keys to select the result whose information is to be modified. A window opens, in which the changes can be entered.
b) After measurement results have been selected
The additional information of the measurement results in aselection list produced as described in chapter 3.1.1.1, pages 2 f. can also be individually modified. Use the cursorkeys to select the results whose information is to bemodified. A window opens, in which the changes can beentered.
�NB:If the changes are such that a result no longer matches the selection criteria (as shown in the menu items), the result will not appear in the selection list after it has been modified. It is of course still present in the database and can be displayed by pressing the selection key again and redefining the selection criteria.
� Tip:The selection can be nullified by pressing the selection key. A complete list of all available results is then displayed.
- Select
Select
Abs/Trans
TestsDataEdit
Data
Abs/TransTests
Modifying a record before measurement results are selected
3.1 Database function
Modifying a record after measurement results have been selected
ChlorideName
27.01.01-..Sampling
SmithUser
Mark
WastewaterSample
Meas.val. 0.087 mmol/lName CLTest no. 010Measuring 02.02.01 11:23Sampling 10.02.01 09:55Dilution 1.000Sample WastewaterUserNote Left tankSave
Delete
Output
Edit Selekt
- Select
Select010 02.02.01 541 mg/l ‘010 02.02.01 542 mg/l010 02.02.01 538 mg/l010 02.02.01 600 mg/l010 02.02.01 601 mg/l010 02.02.01 100 mg/l010 02.02.01 740 mg/l010 02.02.01 741 mg/l010 02.02.01 742 mg/l010 02.02.01 743 mg/l010 02.02.01 743 mg/l010 02.02.01 600 mg/l010 02.02.01 600 mg/l010 02.02.01 610 mg/l §
Meas.val. 0.087 mmol/lName CLTest no. 010Measuring 02.02.01 11:23Sampling 10.02.01 09:55Dilution 1.000Sample WastewaterUser SmithNote Left tankSave
2_HB_GB_BDA451 10.02.2003 8:48 Uhr Seite 4

Edition: 3/2001 Chapter 3 Edit / Page 5 of 30
3. E
dit
Implementing the modification
Use the cursor keys to select the additional informa-tion. Confirm by pressing the enter key . Confirm the selection or input (see chapter 1.6.1, page 8 andchapter 1.6.2, page 9) by pressing the enter key . To save the changes, use the cursor keys to selectSave and then confirm with the enter key . Press the menu key to exit from this menu.
3.1 Database function
Can be changedFactor for converting absorbance to concentration
Factor (only for absorbancemeasurements)
Cannot be changedMeasurement wavelengthWavelength (only for absorbanceand transmittancemeasurements)
Can be changedNotes about the sampleNote
Can be changedUser nameUser name
Can be changedSample name (e.g. addista)Sample
Can be changedDilution of the sampleDilution (not for absorbanceand transmittancemeasurements)
Can be changedPeriod when the sample was takenSampling
Cannot be changedDate of the measurementMeasuring
Cannot be changedSpecific test number with which the testwas selected from the selection list
Test no.
Cannot be changedTest nameName
Cannot be changedMeasurement resultMeas. val.
OptionsDescriptionDisplay
2_HB_GB_BDA451 10.02.2003 8:48 Uhr Seite 5

Edition: 3/2001 Chapter 3 Edit / Page 6 of 30
3. E
dit
3.1.1.3 Simultaneously modifying the additional information of a number of measurement results in the and databases
a) Before measurement results are selected
Select the menu item after a measurement orselect the menu items , and
or . A list of measurement results isdisplayed. Press the selection key. A window opens, in which the changes can be entered.
It is also possible to change the additional information of selected measurement results. Select the menu item after a measurement orselect the menu items , and
or . Press the selection key.
Use the cursor keys and the selection keyto select the measurement results that are to be simultaneouslymodified (see chapter 1.6.3, page 10).Press the menu key to exit from the selection list. Pressthe selection key. A window opens, in which the changes can be entered.
Implementing the modificationUse the cursor keys to select the additional information.Confirm by pressing the enter key . Confirm the selection or input (see chapter 1.6.1, page 8 andchapter 1.6.2, page 9) by pressing the enter key . To save the changes, use the cursor keys to selectSave and then confirm with the enter key . The changes are now present in all the selected measure-ment results. Press the menu key to exit from this menu.
Edit Select
Mark
Select
Abs/TransTests
DataEdit
Data
Edit Select
Abs/TransTests
DataEdit
Data
Abs/TransTests
3.1 Database function
Modifying all records beforemeasurement results are selected
Modifying all marked recordsbefore measurement results areselected
Delete
Output
Edit Selekt
- Select
Select*010 02.02.01 600 mg/l*010 02.02.01 610 mg/l*010 16.02.01 514 mg/l*010 16.02.01 516 mg/l*348 20.02.01 7.548 mg/l*341 20.02.01 1.50 mg/l*341 20.02.01 0.629 mg/l*032 22.02.01 2.33 mg/l*032 22.02.01 2.48 mg/l*010 26.02.01 600 mg/l*010 26.02.01 718 mg/l
SamplingDilutionSampleUserNoteSave
*010 30.01.01 601 mg/l*010 30.01.01 100 mg/l*010 30.01.01 740 mg/l*010 30.01.01 741 mg/l
Delete
Output
Edit Selekt
- Select
Select
SamplingDilutionSampleUserNoteSave
2_HB_GB_BDA451 10.02.2003 8:48 Uhr Seite 6

Edition: 3/2001 Chapter 3 Edit / Page 7 of 30
3. E
dit
b) After measurement results have been selected
After the measurement results have been selected (see chapter 3.1.1.1, page 2), press the menu key and the
selection key to modify all the selected measurement results simultaneously. A window opens, inwhich the changes can be entered.
It is also possible to modify marked measurement results simultaneously after they have been selected (seechapter 3.1.1.1, page 3).The measurement results that are to be modified are selected by using the cursor keys and the selection key (see chapter 1.6.3, page 10). Press the menu key and select . A window opens, in which the changes can be entered.
Implementing the modificationUse the cursor keys to select the additional information.Confirm by pressing the enter key . Confirm the selection or input (see chapter 1.6.1, page 8 andchapter 1.6.2, page 9) by pressing the enter key . To save the changes, use the cursor keys to selectSave and then confirm with the enter key . The changes are now present in all the selected measure-ment results. Press the menu key to exit from this menu.
�NB:If the changes are such that a result no longer matches the selection criteria, the result will not appear in the selection list after it has been modified. It is of course still present in the database and can be displayed by pressing the selection key again and redefining the selection criteria.
� Tip:The selection can be nullified by pressing theselection key. A complete list of all available results is then displayed.
- Select
Select
Edit Select
Mark
Edit Select
3.1 Database function
Changing the additional information of all selected measurement results
010 27.01.01 541 mg/l010 27.01.01 542 mg/l010 27.01.01 538 mg/l010 27.01.01 600 mg/l010 30.01.01 601 mg/l010 30.01.01 100 mg/l010 30.01.01 740 mg/l010 30.01.01 741 mg/l010 01.02.01 742 mg/l010 01.02.01 743 mg/l010 01.02.01 743 mg/l010 01.02.01 600 mg/l010 02.02.01 600 mg/l010 02.02.01 610 mg/l §
ChlorideName
27.01.01-..Sampling
SmithUser
Mark
WastewaterSample
SamplingDilutionSampleUserNoteSave
Changing the additional information of selected and marked measurement results
*010 27.01.01 541 mg/l*010 27.01.01 542 mg/l*010 27.01.01 538 mg/l*010 27.01.01 600 mg/l
010 30.01.01 601 mg/l010 30.01.01 100 mg/l010 30.01.01 740 mg/l010 30.01.01 741 mg/l010 01.02.01 742 mg/l010 01.02.01 743 mg/l010 01.02.01 743 mg/l
*010 01.02.01 600 mg/l*010 02.02.01 600 mg/l*010 02.02.01 610 mg/l §
ChlorideName
27.01.01-..Sampling
SmithUser
Mark
WastewaterSample
SamplingDilutionSampleUserNoteSave
2_HB_GB_BDA451 10.02.2003 8:48 Uhr Seite 7

Edition: 3/2001 Chapter 3 Edit / Page 8 of 30
3. E
dit
3.1.1.4 Output from the and databases
Pressing the selection key enables all availableor marked measurement results in the databases and to be sent to a specified output device. Individual measurement results can also be edited (see chapter 3.1.1.2, page 4).
Short description of the menu options
Abs/Trans
Tests
Output
Abs/TransTests
Output menu
3.1 Database function
Press the Printer selection key to printall available or marked measurement results.
Print the measurement results on a printer with a parallel port.
Printer
Press the PC selection key to send allavailable or marked measurement resultsto a PC.
Send the measurement results to a PC with measurement data transfer software (DATAtrans).
PC
Press the LD 500 selection key to printall available or marked measurement results.
Print the measurement results on the Dr. Lange printer.
LD 500
Press the Diskette selection key to saveall available or marked measurement results to diskette. The data are saved ina D-Base 3 format and can be processedwith a PC and an appropriate program,e.g. Excel._TEST = Test number_SYMBOL = Symbol_VERSION = EPROM version_NO. = Control number_RESULT = Measured value_DILUTION = Dilution_UNIT = Unit_NAME = Parameter name_M.DATE = Measurement date_S.DATE = Sampling date_SAMPLE = Sample name_OPERATOR = User name_COMMENT = Note
Save the measurement results to:
The data are saved under the name TESTERG.dbf.
Save the measurement results to:
The data are saved under the name EXTERG.dbf.
Diskette
OptionsDescriptionDisplay
*010 02.02.01 541 mg/l*010 02.02.01 542 mg/l*010 02.02.01 538 mg/l*010 02.02.01 600 mg/l*010 02.02.01 601 mg/l*010 02.02.01 100 mg/l
010 02.02.01 740 mg/l010 02.02.01 741 mg/l010 02.02.01 742 mg/l010 02.02.01 743 mg/l010 02.02.01 743 mg/l
*010 02.02.01 600 mg/l*010 02.02.01 600 mg/l*010 02.02.01 610 mg/l §
Printer
PC
LD500
Diskette
Abs/Trans
Tests
2_HB_GB_BDA451 10.02.2003 8:48 Uhr Seite 8

Edition: 3/2001 Chapter 3 Edit / Page 9 of 30
3. E
dit
3.1.1.5 Deleting measurement results from the and databases
Press the selection key. The menu shown on theright appears.
Press the selection key to delete all available ormarked measurement results.
Pressing the selection key causes the system toreturn to the menu , , ,
, . DeleteOutput
Edit Select- SelectSelect
No
Yes
Delete
Abs/TransTests
3.1 Database function
Deleting marked measurement results
Yes
No
*010 02.02.01 541 mg/l ‘*010 02.02.01 542 mg/l*010 02.02.01 538 mg/l*010 02.02.01 600 mg/l*010 02.02.01 601 mg/l*010 02.02.01 100 mg/l*010 02.02.01 740 mg/l*010 02.02.01 741 mg/l*010 02.02.01 742 mg/l*010 02.02.01 743 mg/l*010 02.02.01 743 mg/l*010 02.02.01 600 mg/l*010 02.02.01 600 mg/l*010 02.02.01 610 mg/l §
Deletedata?
2_HB_GB_BDA451 10.02.2003 8:48 Uhr Seite 9
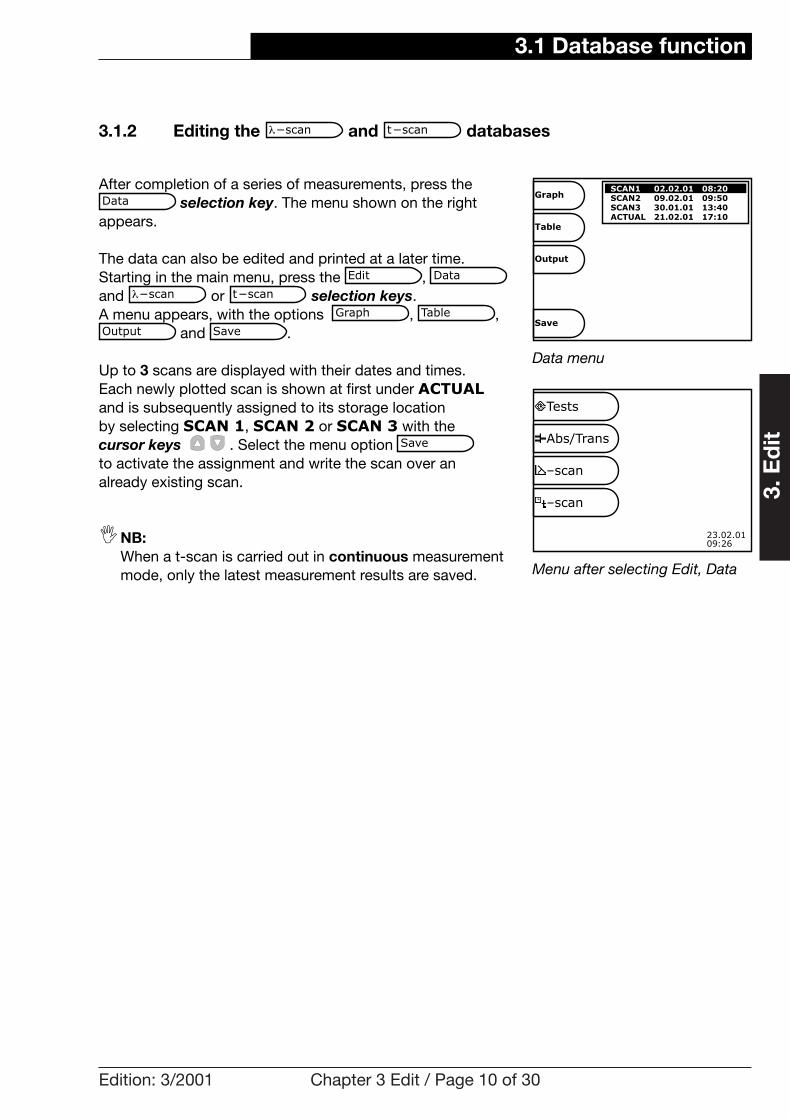
Edition: 3/2001 Chapter 3 Edit / Page 10 of 30
3. E
dit
3.1.2 Editing the and databases
After completion of a series of measurements, press theselection key. The menu shown on the right
appears.
The data can also be edited and printed at a later time. Starting in the main menu, press the , and or selection keys. A menu appears, with the options , ,
and .
Up to 3 scans are displayed with their dates and times. Each newly plotted scan is shown at first under ACTUALand is subsequently assigned to its storage location by selecting SCAN 1, SCAN 2 or SCAN 3 with the cursor keys . Select the menu option to activate the assignment and write the scan over an already existing scan.
�NB:When a t-scan is carried out in continuous measurement mode, only the latest measurement results are saved.
Save
SaveOutput
TableGraph
t-scan¬-scan
DataEdit
Data
t-scan¬-scan
Data menu
3.1 Database function
Menu after selecting Edit, Data
Tests
Abs/Trans
–scan
–scan
SCAN1 02.02.01 08:20SCAN2 09.02.01 09:50SCAN3 30.01.01 13:40ACTUAL 21.02.01 17:10
Output
Table
Graph
Save
23.02.0109:26
2_HB_GB_BDA451 10.02.2003 8:48 Uhr Seite 10

Edition: 3/2001 Chapter 3 Edit / Page 11 of 30
3. E
dit
3.1.2.1 Modifying the additional information of measurement result in the or the database
Use the cursor keys to select a scan, e.g. SCAN 1.Confirm by pressing the enter key . A window opens, inwhich the changes can be entered.
Use the cursor keys to select the additional information.Confirm by pressing the enter key . Confirm the selectionor input (see chapter 1.6.1, page 8 and chapter 1.6.2, page 9)by pressing the enter key . To save the changes, use the cursor keys to select Save and then confirm with the enter key . Press the menu key to exit fromthis menu.
t-scan¬-scan
Record containing additional information
3.1 Database function
Can be changedNotes about the sampleNote
Can be changedUser nameUser
Can be changedSample nameSample
Can be changedDate and time when the sample was taken
Sampling
Cannot be changedDate of the measurementMeasuring
Can be changedFactor for converting from absorbance toconcentration
Factor ( t-scan only)
Cannot be changedTime between two measurement pointsTime interval( t-scan only)
Cannot be changedInterval between two measurement pointsInterval(¬-scan only)
Cannot be changedMeasurement wavelengthWavelength
OptionsDescriptionDisplay
Output
Table
Graph
Save
SCAN1 02.02.01 08:20SCAN2 09.02.01 09:50SCAN3 30.01.01 13:40ACTUAL 07.02.01 15:30
Wavelength 430 - 900 nmInterval 5 nmMeasuring 02.02.01 08:20Sampling 02.02.01 08:20Sample ------User ------NoteSave
2_HB_GB_BDA451 10.02.2003 8:48 Uhr Seite 11

Edition: 1/2003 Chapter 3 Edit / Page 12 of 30
3. E
dit
3.1.2.2 Output from the and databases
Pressing the selection key enables all availablemeasurement results in the databases and
to be sent to a specified output device. Use thecursor keys to select the desired scan.
The data can also be edited (see chapter 3.1.2.1, page 11).
Press the selection key to print the measure-ment results on the Dr. Lange printer or to printthem on a printer with a parallel port.
Short description of the menu options
= Display results in the form of a graph= Display the results in the form of a table = Display the results in both graphic and tabular form= Exit from menu
�NB:When a t-scan is carried out in continuous measurement mode, only the latest measurement results are saved. To print all measurement results, select Print Yes (measurement results and graph) or No (graph only) (see chapter 2, page 23)
� Tip:Pressing the selection key enables all measurement results in the databases to be saved to a diskette. The data are saved in a D-Base 3 format and can be processed with a PC and an appropriate program, e.g. Excel._LAMDA = Wavelength_RESULT = Measured value_UNIT = Unit_DATE/TIME = Date/Time_SAMPLE = Sample name_OPERATOR = User name
¬-scan
Diskette
Graph & Table
Table
Graph
Printer
LD 500
t-scan
¬-scan
Output
t-scan¬-scan
Selection window for results display
3.1 Database function
SCAN1 02.02.01 08:20SCAN2 09.02.01 09:50SCAN3 30.01.01 13:40ACTUAL 21.02.01 15:30
Graph
Graph&Table
Table
2_HB_GB_BDA451 10.02.2003 8:48 Uhr Seite 12

Edition: 3/2001 Chapter 3 Edit / Page 13 of 30
3. E
dit
3.2 Programming user tests
3.2.1 General
The list under menu item is empty when the instrument is shipped. It can be built up by the user to suithis own specific requirements. The analysis procedure mustbe formulated precisely before it can be programmed, i.e. the user must define or determine the program sequences,calculation formulas, measurement wavelengths, factors,measurement range limits, etc. The steps are as follows.
3.2.2 Help in developing user methods
A test method is usually calibrated and measured at the maximum of the absorbance spectrum of the appropriate solution. The analysis measurements are carried out againsta suitable zero solution (e.g. distilled water, reagent blankvalue, solvent or air).
Determining the absorbance maximumStarting in the main menu, press the and
selection keys.
1. Insert the zero cuvette and press the blue zero key.2. Insert the sample cuvette and press the
green measurement key.3. Determine the absorbance maximum.
Calibrating the method The method is calibrated by determining the absorbance values of several standard solutions of known concentrationsagainst the zero solution.
Starting in the main menu, press the andselection keys (see chapter 2.6, pages 20 ff.).
Press the selection key. Press theselection key and enter the absorbance
maximum determined above (see chapter 1.6.2, page 9).Wavelength
Absorbance
Abs/Trans
Analysis
¬-scan
Analysis
User
3.2 Programming
Absorbance spectrum
0.25
0.2
0.15
0.1
0.05
0
300320
340360
380400
420440
460480
500
Absorbance spectrumA
bso
rban
ce
Wavelength
2_HB_GB_BDA451 10.02.2003 8:48 Uhr Seite 13
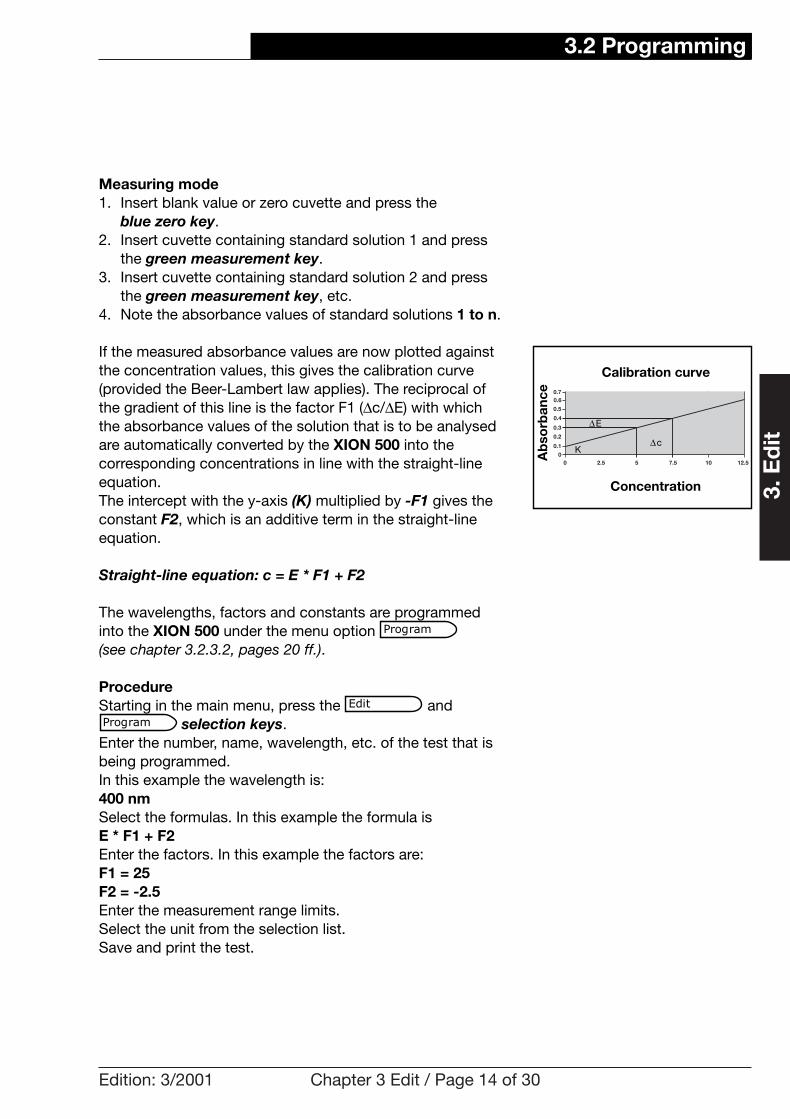
Edition: 3/2001 Chapter 3 Edit / Page 14 of 30
3. E
dit
Measuring mode1. Insert blank value or zero cuvette and press the
blue zero key.2. Insert cuvette containing standard solution 1 and press
the green measurement key.3. Insert cuvette containing standard solution 2 and press
the green measurement key, etc.4. Note the absorbance values of standard solutions 1 to n.
If the measured absorbance values are now plotted againstthe concentration values, this gives the calibration curve(provided the Beer-Lambert law applies). The reciprocal ofthe gradient of this line is the factor F1 (∆c/∆E) with which the absorbance values of the solution that is to be analysedare automatically converted by the XION 500 into the corresponding concentrations in line with the straight-lineequation.The intercept with the y-axis (K) multiplied by -F1 gives theconstant F2, which is an additive term in the straight-lineequation.
Straight-line equation: c = E * F1 + F2
The wavelengths, factors and constants are programmed into the XION 500 under the menu option (see chapter 3.2.3.2, pages 20 ff.).
ProcedureStarting in the main menu, press the and
selection keys. Enter the number, name, wavelength, etc. of the test that isbeing programmed.In this example the wavelength is:400 nmSelect the formulas. In this example the formula isE * F1 + F2Enter the factors. In this example the factors are: F1 = 25F2 = -2.5Enter the measurement range limits.Select the unit from the selection list.Save and print the test.
Program
Edit
Program
3.2 Programming
12.5
0.70.6
0.5
0.4
0.3
0
0.2
0.1
0 2.5 5 7.5 10
Calibration curve
Ab
sorb
ance
Concentration
∆E
∆cK
2_HB_GB_BDA451 10.02.2003 8:48 Uhr Seite 14

Edition: 3/2001 Chapter 3 Edit / Page 15 of 30
3. E
dit
3.2.3 Programming user tests3.2.3.1 Principle
Starting in the main menu, press the andselection keys.
A menu opens, showing the available program processes(see chapter 3.2.3.2, page 19ff).
Example of how to program a user test
Selecting a processPress a selection key to select the program process. (In thiscase .
Entering a test numberPress the selection key.The test number of the parameter that is to be analysed isentered here (see chapter 1.6.2, page 9). Press the enter key to confirm and display the entry.
� Tip:Users can program their own barcoded applications with the help of the Dr. Lange LCW 906 blank value cuvettes. To do this the first digit of the test number must be defined as 9. The following display appears automatically on the screen:Test number: 906
A maximum of 12 user tests can be assigned to this number. The control number of each test programmed under 906 is automatically calculated by the XION 500and is displayed during the measurement.
�NB:A test number can only be assigned once! (The barcoded programs using LCW 906 are an exception;in their case the test name has to be used to identify the test unambiguously)
Test number
Factor meas. E *F1 + F2
Program
Edit
Process options
3.2 Programming
Test number input window
Standard meas.E*K(S)/E(S)
Factor meas.E*F1+F2
Blank measurementL*F1+E*F2+F3
Linear regression
Pol. interpolation
Test number
Test name
Wavelength
F1 forE*F1+F2
Test number
max 2 charactersԤ characters| @ Move cursor
01‘
Test number for barcoded user tests
Test number
Test name
Wavelength
F1 forE*F1+F2
Test number
max 2 charactersԤ characters| @ Move cursor
906‘
23.02.0109:26
2_HB_GB_BDA451 10.02.2003 8:48 Uhr Seite 15

Edition: 3/2001 Chapter 3 Edit / Page 16 of 30
3. E
dit
Entering the test namePress the selection key. Enter the name of the parameter that is to be analysed (see chapter 1.6.1, page 8). Press the enter key to confirm and display the entry.
Entering the wavelengthPress the selection key. Enter the wavelength (see chapter 1.6.2, page 9). Press the enter key to confirm and display the entry.
Entering the factorsPress the selection key. Enter the first factor (see chapter 1.6.2, page 9). Press the enter key to confirm and display the entry.Then press the selection key. Enter the second factor (see chapter 1.6.2, page 9). Press theenter key to confirm and display the entry.
Entering the measurement rangePress the selection key. Enter the lower and upper limits of the measurement range(see chapter 1.6.2, page 9). Press the enter key to confirm and display the entries.
Meas. range
F2 for E *F1 + F2
F1 for E *F1 + F2
Wavelength
Test name
Test name input window
3.2 Programming
Wavelength input window
Factor input window
Input window for the lower and upper limits of themeasurement range
ABC
123
«?Å
• ™ Ô
abc Test name
max 18 charactersԤ characters| @ Move cursor
Phosphate‘
Test number
Test name
Wavelength
F1 forE*F1+F2
Wavelength
max 3 charactersԤ characters| @ Move cursor
400‘
Test number
Test name
Wavelength
F1 forE*F1+F2
Factor
max 6 charactersԤ characters| @ Move cursor
+1.000‘
Unit
Meas. range
Save
F2 forE*F1+F2
lower limit
max 5 charactersԤ characters| @ Move cursor
1.000‘
2_HB_GB_BDA451 10.02.2003 8:48 Uhr Seite 16

Edition: 3/2001 Chapter 3 Edit / Page 17 of 30
3. E
dit
Selecting the unit of measurementPress the selection key. Use the cursor keys to select the unit in which themeasurement result will be expressed. Press the enter key
to confirm and display your choice.
Saving the programPress the selection key. This completes the programming sequence. If a printer isconnected the program will automatically be printed. The testcan be accessed under the menu option .
�Note:If a parameter is not entered during the programming sequence the following message appears:
The entries are incomplete.
Press the menu key to acknowledge the message, then check the entries.
� Tip:You can press the menu key at any time to escape from the programming sequence. Press the selection key (escape) or the selection key(continue programming).
No
Yes
User
Save
Unit
Unit selection window
3.2 Programming
Unit
Meas. range
Save
F2 forE*F1+F2
1.000
0.000 - 17.00
mg/l
Nonemg/lg/lmg/kgg/kg%mmol/lmol/l §
2_HB_GB_BDA451 10.02.2003 8:48 Uhr Seite 17

Edition: 3/2001 Chapter 3 Edit / Page 18 of 30
3. E
dit
3.2 Programming
Selection list containing all valid unitsUnit in which the measurement resultwill be expressed.
Unit
Measurement range limits: 0.000 to 99999
Input of the lower and upper limits of themeasurement range.
Meas. range
340 to 900 nmWavelength at which the measurementwill be carried out.
Wavelength
1 to 18 characters, e.g. NO3-N, Nitrate nitrogen
Chemical symbol or the name of theanalysis parameter (only appears in theselection list).
Test name
1 to 2 digits, e.g. 01 (00 to 89 tests)Test numbers higher than 89 are auto-matically displayed as 906 (LCW 906).Evaluation via barcode.A maximum of 12 tests can be assigned.
Specific test number with which the testcan subsequently be called from the
selection list.
Test number
Factors: +/- 0.000 to 99999Input of the factors. The number of factors displayed depends in the selected formula.
F1 for E * F1 + F2
See chapter 3.2.3.2, pages 19 ff.Exact definition of the evaluation formula with which the test result will be calculated.
Factor meas.E * F1 + F2
OptionsDescriptionDisplay
User
Short description of the menu options
2_HB_GB_BDA451 10.02.2003 8:48 Uhr Seite 18

Edition: 3/2001 Chapter 3 Edit / Page 19 of 30
3. E
dit
3.2.3.2 Program process options
Within the range of applicability of the Beer-Lambert law theconcentration c of the sample can also be determined bycomparison with a standard solution of known concentrationE(S) (standard) with the help of the following equation:
Concentration of sample = E (sample) *K(S)E(S)
E = Absorbance of the sampleK(S) = Concentration of the standardE(S) = Absorbance of the standard
This method requires the concentration of the standard to beclose to the anticipated concentration of the sample.
Procedure:
1. Starting in the main menu, press the , and
selection keys.
2. Press the , , , and
selection keys in sequence and key in the required entry or required option.
3. Press the selection key and enter the standard concentration (see chapter 1.6.2, page 9). Complete the programming sequence by pressing the
selection key.
4. Starting in the main menu, press the and selection keys and select the programmed
test.
5. Press the blue zero key without inserting a cuvette in the cuvette compartment (zeroize against air).
6. Insert standard cuvette and press the blue zero keyagain. E1 (E1 is the absorbance of the standard).
7. Insert a sample cuvette and press the green measure-ment key.
8. Insert further sample cuvettes, pressing the green measurement key in each case.
User
Analysis
Save
Std. conc.
UnitMeas. rangeWavelength
Test nameTest number
Standard meas. E *K(S)/E(S)Program
Edit
Standard meas.E*K(S)/E(S)
3.2 Programming
Test number
Test name
Wavelength
Std. conc.
XYZ
11
540 nm
8
Unit
Meas. range
Save
100.0 - 1000
mg/l
2_HB_GB_BDA451 10.02.2003 8:48 Uhr Seite 19

Edition: 3/2001 Chapter 3 Edit / Page 20 of 30
3. E
dit
Single point measurements can be carried out with the sequence on which this formula is based. The blank value is constant for all samples (and can thus be set to zero). The absorbance of the sample is measured and the analysis result is calculated from the formula.
E = Absorbance of the sampleF1 = Factor with which E is multipliedF2 = compensation for axis intercept
Procedure:
1. Starting in the main menu, press the , and
selection keys.
2. Press the , , , and
selection keys in sequence and key in the required entry or required option.
3. Press the selection key and enter the factor F1. Then press the selection keyand enter the factor F2. Complete the programming sequence by pressing the selection key.
4. Starting in the main menu, press the and selection keys and select the test.
5. Insert the blank value or zero solution cuvette and press the blue zero key.
6. Insert a sample cuvette and press the green measurement key.
7. Insert further sample cuvettes, pressing the green measurement key in each case.
�Note:Another zero measurement can be carried out at any time.
User
Analysis
Save
F2 for E *F1 + F2
F1 for E *F1 + F2
UnitMeas. rangeWavelength
Test nameTest number
Factor meas. E *F1 + F2Program
Edit
Factor meas.E*F1+F2
3.2 Programming
Test number
Test name
Wavelength
F1 forE*F1+F2
XYZ
12
400 nm
25.00
Unit
Meas. range
Save
F2 forE*F1+F2
-2.500
0.000 - 1000
mg/l
2_HB_GB_BDA451 10.02.2003 8:48 Uhr Seite 20
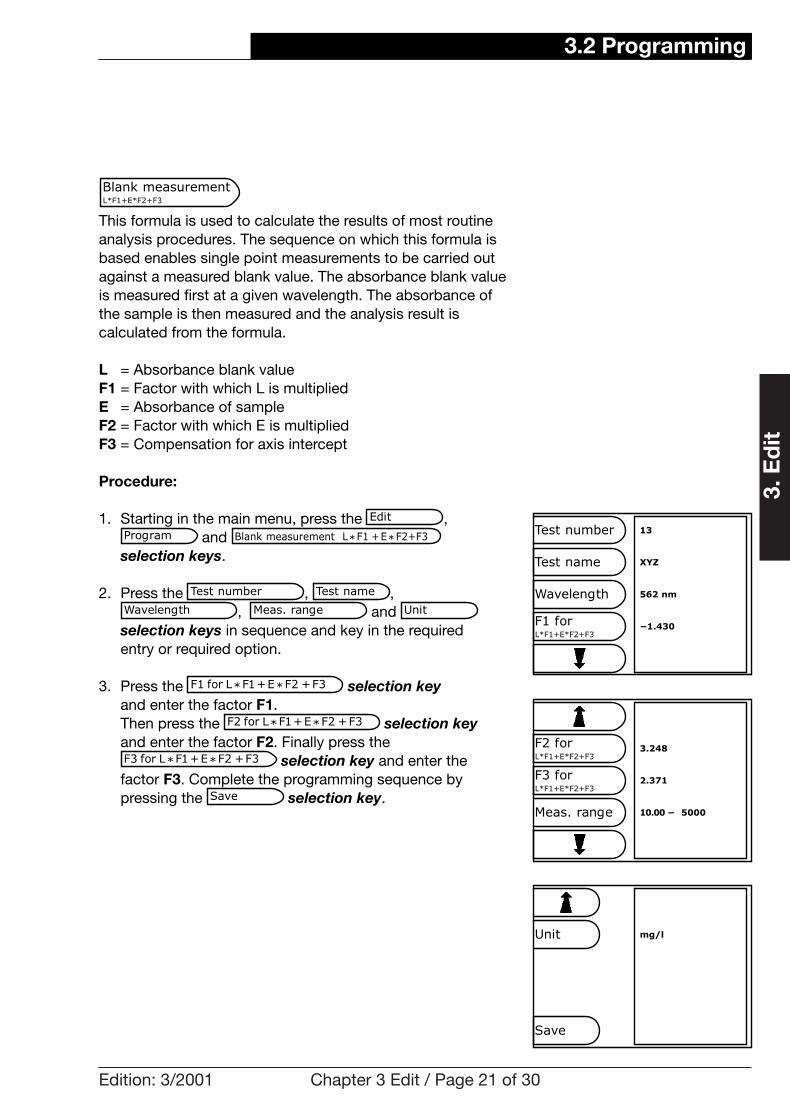
Edition: 3/2001 Chapter 3 Edit / Page 21 of 30
3. E
dit
This formula is used to calculate the results of most routineanalysis procedures. The sequence on which this formula isbased enables single point measurements to be carried outagainst a measured blank value. The absorbance blank valueis measured first at a given wavelength. The absorbance ofthe sample is then measured and the analysis result is calculated from the formula.
L = Absorbance blank valueF1 = Factor with which L is multipliedE = Absorbance of sampleF2 = Factor with which E is multipliedF3 = Compensation for axis intercept
Procedure:
1. Starting in the main menu, press the , and
selection keys.
2. Press the , , , and
selection keys in sequence and key in the required entry or required option.
3. Press the selection keyand enter the factor F1. Then press the selection keyand enter the factor F2. Finally press the
selection key and enter the factor F3. Complete the programming sequence by pressing the selection key.Save
F3 for L *F1 + E *F2 + F3
F2 for L *F1 + E *F2 + F3
F1 for L *F1 + E *F2 + F3
UnitMeas. rangeWavelength
Test nameTest number
Blank measurement L *F1 + E*F2+F3Program
Edit
Blank measurementL*F1+E*F2+F3
3.2 Programming
Test number
Test name
Wavelength
F1 forL*F1+E*F2+F3
XYZ
13
562 nm
-1.430
Meas. range
F2 forL*F1+E*F2+F3
F3 forL*F1+E*F2+F3
3.248
2.371
10.00 - 5000
Unit
Save
mg/l
2_HB_GB_BDA451 10.02.2003 8:48 Uhr Seite 21

Edition: 3/2001 Chapter 3 Edit / Page 22 of 30
3. E
dit
4. Starting in the main menu, press the and selection keys and select the test.
5. Press the blue zero key e.g. without inserting a cuvette in the cuvette compartment (zeroize against air).
6. Insert blank value cuvette and press the blue zero keyagain.
7. Insert a sample cuvette and press the green measurement key.
8. Insert further sample cuvettes, pressing the green measurement key in each case.
�Note:Another zero measurement can be carried out at any time.
� Evaluation of linear standard seriesMeasuring the samples with the help of a reference curve(calibration curve)
If the analysis obeys the Beer-Lambert law the evaluation can be carried out with the help of linear regression. TheXION 500 then gives not only the regression straight lines but also the associated linear formula Conc = a * Abs + b and the correlation coefficient r .
� Evaluation of nonlinear standard seriesMeasuring the samples with the help of a reference curve(calibration curve)
Analyses that are based on nonlinear calibration curves canbe evaluated by polygonal interpolation in log-log space. The XION 500 then displays a graph of the calibration curve.All entered standard values lie on the calibration curve.
Pol. interpolation
Linear regression
User
Analysis
3.2 Programming
Curve with formula
Add
Remove
Graph
End
No. Std. conc. Absorbanc1 1.000 0.1002 2.000 0.2003 3.000 0.3004 4.000 0.440
Conc = 17.13 * Abs -2.00Correlation coefficient = 0.830
Abs.
1.0000.000
0.100
0.200
0.300
0.400
1.500 2.000 2.500 3.000
2_HB_GB_BDA451 10.02.2003 8:48 Uhr Seite 22

Edition: 3/2001 Chapter 3 Edit / Page 23 of 30
3. E
dit
� Entering standard concentrations and entering or measuring standard absorbance values
Instead of entering factors, standard concentrations andstandard absorbance values are entered and measured for linear regression and polygonal interpolation:
a) The absorbance values at standard concentrations are measured beforehand in the menu :
1. Starting in the main menu, press the , and or
selection keys.
2. Press the , and selection keys in sequence and
key in the required entry or required option.
3. Press the selection key. With the cursor keys select the appropriate line in the display, confirm with the enter key and overwrite the predefined standard concentration (see chapter 1.6.2, page 9). A window then opens, in which the standard absorbance can be entered (see chapter 1.6.2, page 9).
4. Press the selection key to display the calibration curve. Press the menu key to blend out the graph and press the selection key.
5. Press the and selection keys in sequence and key in the required entry or required option.
6. Save by pressing the selection key.
�NB:Measurement range limits cannot be entered if polygonal interpolation is selected.
�Note:Standard concentrations should be entered in ascending order, otherwise it is not possible to calculate the curve.
Save
UnitMeas. range
End
Graph
Val. pairs
Wavelength
Test nameTest number
Pol. interpolation
Linear regressionProgram
Edit
Abs/Trans
3.2 Programming
Test number
Test name
Wavelength
Val. pairs
XYZ
14
500 nm
4
Add
Remove
Graph
End
Nr. Std. conc. Absorbanc1 1.000 0.1002 1.500 0.1503 2.000 0.2004 2.500 0.250
3
Unit
Meas. range
Save
0.000 - 2.500
mg/l
2_HB_GB_BDA451 10.02.2003 8:48 Uhr Seite 23
Edition: 3/2001 Chapter 3 Edit / Page 24 of 30
3. E
dit
b) The absorbance values at the standard concentrations should be measured during the programming:
1. Starting in the main menu, press the , and or
selection keys.
2. Press the , and selection keys in sequence and
key in the required entry or required option.
3. Press the selection key.
4. Insert the blank value cuvette and press the blue zero key.
5. With the cursor keys select the appropriate line in the display, confirm with the enter key and overwrite the predefined standard concentration (see chapter 1.6.2, page 9). Press the menu key to close the window in which the standard absorbance can be entered.
6. Insert standard cuvette and press the green measure-ment key. The measured absorbance is automatically incorporated in the table.
7. Press the selection key to display the calibration curve. Press the menu key to blend out the graph and press the selection key.
8. Press the and selection keys in sequence and key in the required entry or required option.
9. Save by pressing the selection key.
�NB:Measurement range limits cannot be entered if polygonal interpolation is selected.
�Note:Standard concentrations should be entered in ascending order, otherwise it is not possible to calculate the curve.
Save
UnitMeas. range
End
Graph
Val. pairs
Wavelength
Test nameTest number
Pol. interpolation
Linear regressionProgram
Edit
3.2 Programming
2_HB_GB_BDA451 10.02.2003 8:48 Uhr Seite 24

Edition: 3/2001 Chapter 3 Edit / Page 25 of 30
3. E
dit
� Tip:The entered or measured values can be overwritten again by using the cursor keys to select an existing line (standard concentration and absorbance) and then pressing the enter key to confirm.
� Tip:If new absorbance values are to be measured for a given standard concentration, use the cursor keys to select the corresponding line in the display window and then press the green measurement key. The measured absorbance is automatically written to the selected line.
Overview of the program steps
3.2 Programming
Press the appropriate selection key.Press the menu key to return to thedisplay of the values in the form of a table.
Display the calibration curveGraph
Use the cursor keys to select an existing line and press the
selection key. The selected line is deleted.
Reduce the table to a minimum of 3 value pairs
Remove
Use the cursor keys to select an existing line and press the
selection key. An additional line is inserted under theselected line.
Extend the table to a maximum of 10 value pairs
Add
Use the cursor keys to select theappropriate line in the display. Press the enter key to confirm. Enter ormeasure standard absorbances to overwrite all predefined standard concen-trations and absorbances one after theother (see chapter 1.6.2, page 9).
The corresponding absorbance is assigned to one of the entered standardconcentrations (enter or measure)
Val. pairs
See chapter 3.2.3.1, pages 15 ff.Test numberTest nameWavelengthMeas. rangeUnit
OptionsDescriptionDisplay
Remove
Add
2_HB_GB_BDA451 10.02.2003 8:48 Uhr Seite 25

23.02.0109:26
Edition: 3/2001 Chapter 3 Edit / Page 26 of 30
3. E
dit
3.3 Varying user tests
This function can be used to change user tests.
Starting in the main menu, press the andselection keys.
A selection window opens, containing all user tests and copied Dr. Lange Tests, sorted in ascending order of testnumber.
Use the cursor keys to select the test that is to bechanged. Press the enter key to confirm.
Press the , , and selection keys, selecting the required options to change the test.
Finally save the changed test by pressing the selection key. The test is then available under the menu option .
�NB:When a copied Dr. Lange Test is to be changed, a window opens after the and selection keys have been pressed, in which the original name of the test is also shown. (The original name is the name under which the original Dr. Lange Test is shown in the selection list of the menu option .)Select
Meas. rangeUnit
User
Save
Variables
Meas. rangeUnitParameter
Vary
Edit
Selection list of tests for varying
3.3 Varying user tests
Implemented change
Data
Program
Vary
Delete
010 Chloride 45014 COD 45100 Standard 5301 Aluminium 45348 Phosphate 2
Parameter
Variables
Meas. range
Unit
Save
mg/l
348XYZ-Phosphate
2.500 - 60.00
3
PO4 , name of test remains unchanged
Parameter
Variables
Meas. range
Unit
Save
mg/l
348Phosphate
1.500 - 15.00
3
PO4 2.500-60.00
2_HB_GB_BDA451 10.02.2003 8:48 Uhr Seite 26

Edition: 3/2001 Chapter 3 Edit / Page 27 of 30
3. E
dit
Short description of the menu options
3.3 Varying user tests
Use the cursor keys to select thedesired factor F1 or F2 or W1. Enter thevariable (chapter 1.6.2, page 9.)Press the menu key to exit from theinput window.
Mathematical element of an evaluationformula (e.g. F1).Wavelength at which the measurement is carried out (W1).
Variables
Enter the lower and upper limits of themeasurement range (chapter 1.6.2, page 9). Press the menu key to exitfrom the input window.
Input of lower and upper limits of measurement range
Meas. range
Use the cursor keys to select thedesired unit from the selection list. Press enter key to confirm. Press the menu key to exit from theinput window.
Definition of the unit in which the result is expressed
Unit
Enter new name, e.g. Nitrate-N (see chapter 1.6.1, page 8 and chapter 1.6.2, page 9).
Detailed description of the analysis parameter
Parameter
OptionsDescriptionDisplay
2_HB_GB_BDA451 10.02.2003 8:48 Uhr Seite 27

23.02.0109:26
Edition: 3/2001 Chapter 3 Edit / Page 28 of 30
3. E
dit
3.4 Deleting user tests
This function can be used to delete user tests (programmed,varied, moved and copied tests) from the menu option
.
Starting in the main menu, press the andselection keys.
A selection list is displayed, containing all programmed, varied, moved and copied tests, sorted in ascending order of test number.
Use the cursor keys to select the test that is to be deleted. Press the enter key to confirm. Respond to the precautionary query by pressing the
or selection key. Press the menu key to exit from the selection list.
�NB:If a moved test is accidentally deleted from the selection list of the menu option , it is automatically available again in the selection list of the menu option
.Dr. Lange
User
NoYes
Delete
Edit
User
Delete menu
3.4 Deleting user tests
Data
Program
Vary
Delete
010 Chloride 45014 COD 45014 COD 3 45301 Aluminium 45348 Phosphate 45348 Phosphate 2 45
2_HB_GB_BDA451 10.02.2003 8:48 Uhr Seite 28

23.02.0109:26
Edition: 1/2003 Chapter 3 Edit / Page 29 of 30
3. E
dit
3.5 Copying Dr. Lange Cuvette Tests and Dr. Lange Tests
This function is used to copy Dr. Lange Cuvette Tests and Dr. Lange Tests (Pipette Tests, Trace Analyses and ”beta“tests) into the selection list of menu option ,where they can be changed to suit the user's requirements.Users can thus take advantage of already existing measure-ment sequences.
Starting in the main menu, press the andselection keys. A selection list is displayed,
containing all Dr. Lange Cuvette Tests and Dr. Lange Tests,sorted by ascending order of test number.
Use the cursor keys to select the test to be copied.Press the enter key to confirm. The copied test is subsequently available in the selection listof the menu option . Press the menu key toexit from the selection list.
�NB:Copies of original Dr. Lange Cuvette Tests and Dr. Lange Tests are not changed when the original tests are updated.
User
Copy
Edit
User
Copy menu
3.5 Copying tests
Units
Copy
Move
Permanent
010 Chloride 49014 COD 49014 HT-COD 49025 Hydrazine 49028 Silicic acid 49028 Silicon 49032 Manganese 10 49032 Manganese 50 49049 P2O5 49049 Phosph.-phosphorus 49049 Phosphate 49053 Sulphide 49054 Sulphite 49058 Hydrogen Peroxide 49114 COD 49 §
2_HB_GB_BDA451 10.02.2003 8:48 Uhr Seite 29

23.02.0109:26
Edition: 1/2003 Chapter 3 Edit / Page 30 of 30
3. E
dit
3.6 Moving Dr. Lange Tests (Pipette Tests, Trace Analyses and ”beta“ tests)
This function is used to move Dr. Lange Tests into the selection list of the menu option , so that an individual specific selection list can be created.
Starting in the main menu, press the andselection keys.
A selection list of Dr. Lange Tests is displayed, sorted in ascending order of test number.
Use the cursor keys to select the test that is to bemoved. Press the enter key to confirm.The moved test is subsequently available in the selection listof the menu option . Press the menu key toexit from the selection list.
�NB:Moved tests can no longer be selected from the selection list of the menu option . However, if a moved test is deleted from the selection list of the menu option
it automatically becomes available again in the selection list of the menu option .
�Note:When an update is carried out, moved tests are also automatically changed and become available again under the menu option .
�Note:Moved tests cannot be changed by the user.
Dr. Lange
Dr. Lange
User
Dr. Lange
User
Move
Edit
User
Move menu
3.6 Moving Tests
Unite
Copy
Move
Permanent
010 Chloride 49025 Hydrazine 49028 Silicic acid 49028 Silicon 49032 Manganese 10 49032 Manganese 50 49053 Sulphide 49054 Sulphite 49058 Hydrogen Peroxide 49313 Chrom.-VI Trace 49313 Total Chrom.Trace 49325 Formaldehyde Trace 49349 P2O5 Trace 49349 P2O5 Trace total 49349 Phosph.-P Trace to 49 §
2_HB_GB_BDA451 10.02.2003 8:48 Uhr Seite 30

4.1 LangeNET/Dr. Lange Call Centre
Edition: 3/2001 Chapter 4 Update / Page 1 of 8
4. U
pd
ate
4.1 Updating with the LangeNET/Dr. Lange Call Centre
Dr. Lange provides an update service in the form of the LangeNET/Dr. Lange Call Centre.
Updates to existing testsImprovements to Dr. Lange Tests usually involve changes tofactors.
New TestsNew Dr. Lange Tests that are not yet installed on your instrument can also be downloaded.
4.1.1 Requesting data and updates from the LangeNET/Dr. Lange Call Centre
a) Updating and installing Dr. Lange Cuvette Tests with barcode
The barcode reader reads the coding on the cuvette label asthe cuvette rotates. The instrument uses the barcoded information to automatically select the wavelengths and factors needed for the measurement. If the instrument findsthat the barcoded data differ from its own data or that thetest is not installed, the message shown on the right is displayed.
Data can be requested (for data exchange see chapter 4.1.2,pages 4 ff.).
� Tip:The data request can be terminated by pressing the menu key .
Prompt to dial the Call Centreand download new test data
Info
Data
Please contactCall Centre!
2_HB_GB_BDA451 10.02.2003 8:48 Uhr Seite 1

4.1 LangeNET/Dr. Lange Call Centre
Edition: 3/2001 Chapter 4 Update / Page 2 of 8
4. U
pd
ate
b) Updating or installing a Dr. Lange Test (Pipette Test, Trace Analysis, ”beta“ test)
When you open a new test package, compare the controlnumber on the package leaflet with the control numbershown in the result display. If the control numbers are notidentical, update the test by selecting the following menu options.
Starting in the main menu, press the andselection keys.
Press the selection key. Enter the test number, e.g. 032 (see chapter 1.6.2, page 9).The previous menu is then displayed again automatically,with the test number shown in larger type in the menu option
.
Press the selection key. Enter the control number, e.g. 8 (see chapter 1.6.2, page 9).The previous menu is then displayed again automatically,with the control number shown in larger type in the menu option .8 No.
No.
032 Test number
Test number
LangeNET
Update
LangeNET menu for updating andinstalling Dr. Lange Tests
Input window for the number ofthe test to be updated/installed
Input window for the control number of the current working procedure
Test number
Call
Test number
No.
Call
Test number
max 3 charactersԤ characters| @ Move cursor
032‘
032Test number
Call
Control number
max 1 charactersԤ characters| @ Move cursor
8‘
No.
No.
23.02.0109:26
23.02.0109:26
23.02.0109:26
2_HB_GB_BDA451 10.02.2003 8:48 Uhr Seite 2

4.1 LangeNET/Dr. Lange Call Centre
Edition: 3/2001 Chapter 4 Update / Page 3 of 8
4. U
pd
ate
Press the selection key to request the data (for data exchange see chapter 4.1.2, page 4).
�Tip:The data request can be terminated by pressing the menu key .
�NB:If the test is already present, the following message is displayed:
Test data exist!
Call anyway?
Press the selection key (call) or the selection key (Return to menu options to call another test).
NoYes
Call
Prompt to dial the Call Centre to download new test data
032Test number
Call
8No.
Please contactCall Centre!
23.02.0109:26
2_HB_GB_BDA451 10.02.2003 8:48 Uhr Seite 3

4.1 LangeNET/Dr. Lange Call Centre
Edition: 3/2001 Chapter 4 Update / Page 4 of 8
4. U
pd
ate
4.1.2 Exchanging data with a data handset after a data request
Take the data handset from its compartment in the XION 500.
The 2nd and 3rd LEDs of the data handset flash yellow.
Dial the Call Centre.0800/52643638
Welcome to ...
LangeNET
D00800/52643638
Display during the dataexchange
032Test number
Call
8No.
Please insertdata handset! ........
23.02.0109:26
2_HB_GB_BDA451 10.02.2003 8:48 Uhr Seite 4

4.1 LangeNET/Dr. Lange Call Centre
Edition: 3/2001 Chapter 4 Update / Page 5 of 8
4. U
pd
ate
After the welcome message 3 tones are heard, signallingreadiness to receive the data request. Hold the data handset to the mouthpiece of the telephoneand press the blue key of the data handset once.
The data request is transmitted to the Dr. Lange Call Centre.
Position the rubber ring on the mouthpiece of the telephone insuch a way that the slits in the mouthpiece are exactly overthe slits in the loudspeaker of the data handset (see diagram).
During transmission the colour of the 3rd LED above thesymbol is yellow. Hold the data handset to the mouthpiece until a melody isemitted from the earpiece, signalling that the data requesthas been successful and transmission is complete. From now on the 4th LED above the symbol is yellow.
Microphone(transmission area)
Loudspeaker(reception area)
EarpieceMouthpiece
3x
1x
2_HB_GB_BDA451 10.02.2003 8:48 Uhr Seite 5

4.1 LangeNET/Dr. Lange Call Centre
Edition: 3/2001 Chapter 4 Update / Page 6 of 8
4. U
pd
ate
When the melody ceases the data handset must be held tothe earpiece to receive the requested data. Position the rubber ring on the earpiece of the telephone insuch a way that the slits in the earpiece are exactly overthe microphone of the data handset (see figure on page 5).When all the data have been received the 5th LED above thesymbol is green.
Return the data handset to its compartment.
�NB:A mobile phone cannot be used to request data.
� Tip:If data reception is interrupted, simply put the telephone on the hook and press the blue key to go back to the start situation (2nd and 3rd LEDs are yellow) and start the data exchange again.
Short description of the LangeNET
032Test number
Call
8
Data transfer occurs automaticallyDownloading
Data request completeLED above isgreen
Requested data are being receivedLED above is yellow
Data request is being transmittedLED above is yellow
Send data request to Dr. Lange Call Centre
Press blue key
Ready to transmitLED 2 and 3 are yellow
Test has been updated or the test data arenot present
Contact Call Centre
Meaning
No.
Loadingdata! ........
23.02.0109:26
2_HB_GB_BDA451 10.02.2003 8:48 Uhr Seite 6

4.1 LangeNET/Dr. Lange Call Centre
Edition: 3/2001 Chapter 4 Update / Page 7 of 8
4. U
pd
ate
4.1.3 Recycling the battery of the data handset
We wish to draw your attention to the fact that the data handsetcontains batteries. There is usually no need to replace thesebatteries. Should you no longer wish to use the data handset,please return it to your local Dr. Lange agency to ensure thatthe batteries are disposed of in an environmentally compatiblemanner.
2_HB_GB_BDA451 10.02.2003 8:48 Uhr Seite 7

Edition: 3/2001 Chapter 4 Update / Page 8 of 8
4.2 Updating from a diskette
You can update your software and test data from a diskette.
Insert a 3.5 inch diskette and, starting in the main menu,press the and selection keys.
Press the (program only) or (test dataonly) or (test data and program) selection key.The data transfer starts automatically.
�Note:A time bar is shown in the window while the data are being transferred. This shows the progress of the transfer operation. After the program has been updated the XION 500 automatically restarts it.
Complete
Test dataProgram
DisketteUpdate
4.2 Updating from a diskette
4. U
pd
ate
Update, Diskette menu
Test data update menu
Complete
Program
Test dataLoading testdata. ........
Complete
Program
Test data
23.02.0109:26
23.02.0109:26
2_HB_GB_BDA451 10.02.2003 8:48 Uhr Seite 8
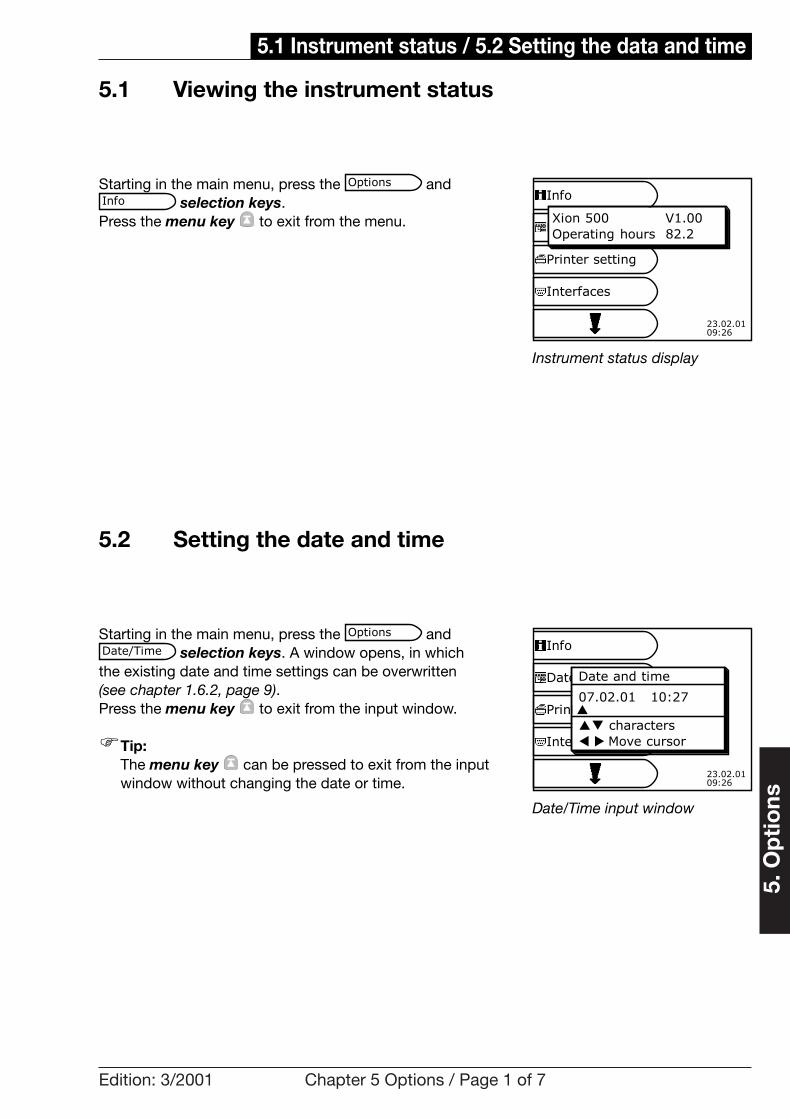
Edition: 3/2001 Chapter 5 Options / Page 1 of 7
5. O
pti
ons
5.1 Viewing the instrument status
Starting in the main menu, press the andselection keys.
Press the menu key to exit from the menu.
5.2 Setting the date and time
Starting in the main menu, press the andselection keys. A window opens, in which
the existing date and time settings can be overwritten (see chapter 1.6.2, page 9). Press the menu key to exit from the input window.
�Tip:The menu key can be pressed to exit from the input window without changing the date or time.
Date/Time
Options
Info
Options
Instrument status display
5.1 Instrument status / 5.2 Setting the data and time
Info
Datum/Uhrzeit
Printer setting
Interfaces
Xion 500 V1.00Operating hours 82.2
Date/Time input window
Info
Date/Time
Printer setting
Interfaces
Date and time
Ԥ characters| @ Move cursor
07.02.01 10:27‘
23.02.0109:26
23.02.0109:26
2_HB_GB_BDA451 10.02.2003 8:48 Uhr Seite 1

Edition: 3/2001 Chapter 5 Options / Page 2 of 7
5. O
pti
ons
5.3 Printer setting
This function is used to select printers and set them to the required output form.
Starting in the main menu, press the andselection keys.
Description of the menu options
To conform to GLP (good laboratory practice), each printedanalysis result must be accompanied by the time of the measurement, the sampling date and time, the sample nameand a space for the operator's signature. The display windowtherefore shows a selection list of additional information,each item of which is marked in the control field to indicatethat it should be printed.
To obtain a less detailed printout, use the cursor keysto select the required additional information in the displayfield. Pressing the enter key removes the mark in the controlfield (the control field is then blank). This additional informationwill then not be printed. Pressing the enter key again causes the mark to be restored to the control field and the additional information will then be printed again.
A printer with a parallel port, such as an Epson or HP printer,is selected by pressing the appropriate selection key. Thechosen printer is shown in larger type in the menu option.
Epsonhp
Printer setting
Options
Options, Printer setting menu
5.3 Printer setting
Epsonhp
Print nowInteractive
Meas. date ‚Sampling date ‚Dilution ‚Sample ‚User ‚Note ‚Signature ‚
23.02.0109:26
Meas. date ‚Sampling date ‚Dilution ‚Sample ‚User ‚Note ‚Signature ‚
2_HB_GB_BDA451 10.02.2003 8:48 Uhr Seite 2
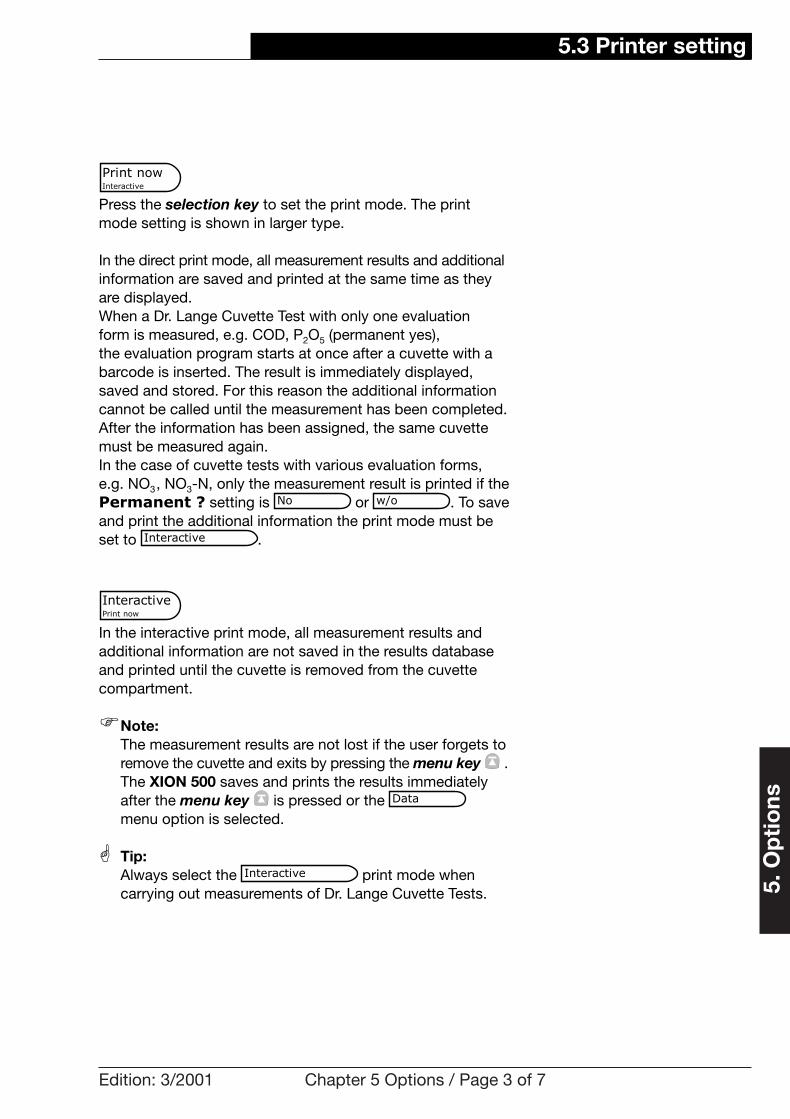
Edition: 3/2001 Chapter 5 Options / Page 3 of 7
5. O
pti
ons
Press the selection key to set the print mode. The printmode setting is shown in larger type.
In the direct print mode, all measurement results and additionalinformation are saved and printed at the same time as theyare displayed.When a Dr. Lange Cuvette Test with only one evaluation form is measured, e.g. COD, P2O5 (permanent yes), the evaluation program starts at once after a cuvette with abarcode is inserted. The result is immediately displayed,saved and stored. For this reason the additional informationcannot be called until the measurement has been completed.After the information has been assigned, the same cuvettemust be measured again.In the case of cuvette tests with various evaluation forms,e.g. NO3, NO3-N, only the measurement result is printed if thePermanent ? setting is or . To saveand print the additional information the print mode must beset to .
In the interactive print mode, all measurement results and additional information are not saved in the results databaseand printed until the cuvette is removed from the cuvettecompartment.
�Note:The measurement results are not lost if the user forgets to remove the cuvette and exits by pressing the menu key .The XION 500 saves and prints the results immediately after the menu key is pressed or the menu option is selected.
� Tip:Always select the print mode when carrying out measurements of Dr. Lange Cuvette Tests.
Interactive
Data
InteractivePrint now
Interactive
w/oNo
Print nowInteractive
5.3 Printer setting
2_HB_GB_BDA451 10.02.2003 8:48 Uhr Seite 3

Hardware description of the parallel interface
5.3 Printer setting
Edition: 3/2001 Chapter 5 Options / Page 4 of 7
5. O
pti
ons
ACK - 10D79D68D57D46D35D24D13D02Strobe -1
SignalPIN
GND25GND24GND23GND22GND21GND20GND19GND18
SignalPIN
SELECT INPUT (connected to GND)
17
INITIALIZE PRINTER16ERROR15
AUTOFEED (connected to GND)
14
SELECT (connected to GND)
13
P.END12BUSY (not active)11
SignalPIN
2_HB_GB_BDA451 10.02.2003 8:48 Uhr Seite 4

Edition: 3/2001 Chapter 5 Options / Page 5 of 7
5. O
pti
ons
5.4 Interfaces, setting the serial interface
This function sets the serial interface for the Dr. Lange LD 500or a PC provided with measurement data transfer software.
Hardware description of the serial interface
Starting in the main menu, press the andselection keys.
Press the appropriate selection keys to select the interfacesettings. The selected settings are shown in larger type in themenu options.
If is selected, another menu opens to enable the parameters to be set for the measurement data transfersoftware. Press the appropriate selection key and use the cursor keys to select the appropriate interface parameters.Press the enter key to confirm. The selected parameteris shown in larger type in the menu option.
�NB:Non-settable interface parameters are 8 data bits and 2 stop bits.
�Note:To use the Dr. Lange DATAtrans software, set the interface parameters as follows:
Baud rate: 9600Parity: None
XON/XOFF
Interfaces
Options
LD 500 menu
5.4 Interfaces
5. O
pti
ons
NC9NC8NC7NC6Gnd5NC4TxD3RxD2NC1
SignalPIN
LD500XON/XOFF
XON/XOFF menu
XON/XOFFLD500
9600Baud rate
NoneParity
23.02.0109:26
23.02.0109:26
2_HB_GB_BDA451 10.02.2003 8:48 Uhr Seite 5

Edition: 3/2001 Chapter 5 Options / Page 6 of 7
5.5 Password
A password can be defined in order to provide certain functions of the XION 500 with password protection.
Starting in the main menu, press the andselection keys.
A display window opens, showing the functions that can beprovided with password protection.
Use the cursor keys to select the required function.Press the enter key to confirm. A mark appears in thecontrol field. Pressing the enter key again removes themark (control field is blank). When the menu options that areto be password-protected have been marked, press the
selection key. A window opens, in which a password can be entered (see chapter 1.6.1, page 8 and chapter 1.6.2, page 9). Pressthe enter key to activate password protection.
In the menu option , will now be displayed in larger type. Exit from this menu by pressing themenu key .
�NB:After a password has been defined, the password-protected functions can only be used when the password has been entered. Similarly, the password also has to be entered before the menu option can be used.
To change the selected password-protected functions, press the selection key. This toggles the setting so that is shown in larger type.The functions can be released again by using the cursorkeys to select them and pressing the enter keyto confirm (the control field is blank). Then activate them by pressing the selection key and entering the password (see chapter 1.6.1, page 8 and chapter 1.6.2, page 9). From then on will again be shown auto-matically in larger type. Exit from this menu by pressing themenu key .
Active
Password
Inactive
ActiveInactive
Password
ActiveInactiveActive
Password
Password
Options
Functions that can be protectedwith a password
5.5 Password
5. O
pti
ons
InactiveActive
Program ƒDelete (all) ƒVary ƒDate/Time ƒPrinter set. ƒInterfaces ƒUpdate ƒ
Password
Functions with activated password protection
ActiveInactive
Program ‚Delete (all) ‚Vary ‚Date/Time ‚Printer set. ‚Interfaces ‚Update ƒ
Password
Changing the password-protected functions
Program ƒDelete (all) ‚Vary ƒDate/Time ƒPrinter set. ƒInterfaces ‚Update ‚
23.02.0109:26
23.02.0109:26
23.02.0109:26
InactiveActive
Password
2_HB_GB_BDA451 10.02.2003 8:48 Uhr Seite 6

23.02.0109:26
23.02.0109:26
Edition: 1/2003 Chapter 5 Options / Page 7 of 7
5. O
pti
ons
5.6 Display contrast
The setting of the XION 500 display can be changed with this function.Starting in the main menu, press the and
selection keys. Press the or selection keyrepeatedly until the contrast between text and background issatisfactory. Press the menu key to exit from this menuoption.
5.7 Language
This function can be used to set the language of the XION 500.A total of 9 languages are available. Starting in the mainmenu, press the and selection keys. Use the cursor keys to select the required languageand confirm by pressing the enter key . Press the menu key to exit from the menu option.
5.8 List function
This function can be used to print the test data of all usertests and all Dr. Lange Tests from a selection list.
Starting in the main menu, press the andselection keys.
Use the cursor keys to select the test to be printedfrom the selection list and press the enter key to confirm.Press the menu key to exit from the menu option.
List
Options
LanguageOptions
DarkerLighter
Contrast
Options
Language menu
5.6 Display contrast / 5.7 Language / 5.8 List
Contrast
Password
Language
List
DGBFSENLIPLDK
Selection list
Contrast
Password
Language
List
Contrast menu
Lighter
Darker 23.02.0109:26
010 Chloride 49014 COD 49014 HT-COD 49025 Hydrazine 49028 Silicic acid 49028 Silicon 49032 Manganese 10 49032 Manganese 50 49049 P2O5 49049 Phosph.-phosphorus 49049 Phosphate 49053 Sulphide 49054 Sulphite 49058 Hydrogen Peroxide 49114 COD 49 §
2_HB_GB_BDA451 10.02.2003 8:48 Uhr Seite 7

Edition: 3/2001 Chapter 6 Appendix / Page 1 of 13
6. A
pp
end
ix
6.1 Error messages and display message
6.1 Error messages and display message
Test data are being loaded intothe XION 500
Loading test data.
Test data are being transferred fromthe data handset to the XION 500
Loading data!
Enter a character combinationA blank character was entered instead of a password
Invalid password
Insert empty disketteDiskette already holds data, or the volume of data exceeds thestorage capacity of the diskette
Insufficient space available on the diskette!
Remove zero cuvette and insertsample cuvette
Zero cuvette was inserted insteadof sample cuvette
Insert sample cuvette!
Respond with Yes or NoThe menu option Delete was selected to delete user tests
Delete test?
Respond with Yes or NoThe menu option Delete was selected in order to delete markedor all measurement results
Delete data?
Insert new diskette or overwritethe data
Saved data are already present on the diskette
Data present on diskette.Overwrite?
Check all entriesThe standard concentrations were not entered in ascendingorder or standard concentrationswere entered twice
Curve is not steady.
Data are being copied to the diskette
Copying data.
Dilute the sample and repeat themeasurement
Calculated concentration is higherthan 999999
Concentration too high!
Clean the cuvette; allow the particles to settle
The cuvette is soiled or there areundissolved particles in the cuvette
Clean cuvette!
No blank value correction is possible for the selected test
Blank value corr. not possible!
Select the test manually from theselection list
The barcode label could not be read
Barcode label was not read!
A blank value correction was carried out with LCW919
After blank value corr.
Dilute the sample and repeat themeasurement
The measured absorbance exceeds 3.5
Absorbance > 3.5!
Result cannot be represented;take note of other error messages
******
ResponseCauseError message
2_HB_GB_BDA451 10.02.2003 8:48 Uhr Seite 1

Edition: 3/2001 Chapter 6 Appendix / Page 2 of 13
6. A
pp
end
ix
6.1 Error messages and display message
Remove the cuvetteA cuvette is in the cuvette compartment
Please remove cuvette!
Insert test data diskette The diskette in the drive is not atest data diskette
Please insert test data diskette
Insert program disketteThe diskette in the drive is not aprogram diskette
Please insert program diskette
Insert disketteThere is no diskette in the drivePlease insert diskette.
Comply with the requestDisplayed during data transfer by telephone, or request after thedecision to call a test
Please insert data handset!
Dial the Call Centre and carry outan update
Dr. Lange has changed a test and the control number of the testin the XION does not agree withthat of the working procedure, or the EPROM version of the Dr. Lange Cuvette Test in the XIONdoes not agree with that of the inserted barcode cuvette
Please contact Call Centre!
Check the lamp and replace it if necessary
The lamp output is too lowPlease check lamp
Dilute the sample and repeat themeasurement
The measured absorbance is above the calibration range of the test
Over measuring range!
Dilute the sample and repeat themeasurement
During a polygonal interpolation,the measured absorbance exceeds the calibration range of the test
Over calibration range!
Load paperPrinter has no paperNo paper
Contact your local Dr. Langeagency
Error in the Dr. Lange Test database
No evaluation!
Insert cuvette with barcodeThe cuvette has no barcodeNo barcode!
Check the concentration of the sample
The calculated result is negativeNegative result!
Respond with Yes or NoA moved Dr. Lange Test was selected for deleting under themenu option User
Move test back to Dr. Lange?
Contact your local Dr. Langeagency
The instrument terminated the calibration
Memory error
Enter another wavelengthLower wavelength is greater thanupper wavelength
Lower wavelength must be lower than upper wavelength!
ResponseCauseError message
2_HB_GB_BDA451 10.02.2003 8:48 Uhr Seite 2

Edition: 3/2001 Chapter 6 Appendix / Page 3 of 13
6. A
pp
end
ix
6.1 Error messages and display message
Delete a redundant user nameunder menu options Edit, User and Delete
No space left in user name memory
Too many users!
Delete a redundant test undermenu options Edit, and Delete
Too many user tests have beenprogrammed
Too many tests!
Delete a redundant sample name under menu options Edit,Sample and Delete
No space left in user samplenames memory
Too many samples!
Delete a redundant dilution undermenu options Edit, Dilutionand Delete
No space left in user dilutions memory
Too many dilutions!
Check that all entries are presentOne or more programming entriesare missing
The entries are incomplete.
Contact your local Dr. Langeagency
Error in the test databaseTest not ok!
No moved, programmed or copied tests are present in the selection list under the Usermenu option
The selection list under the menuoptions Edit and Permanentcontains no tests whose per-manent setting can be reversed
Test not found!
Select another test numberAn already assigned number hasbeen entered during programming
Test no. already assigned!
Remove sample cuvette and insert zero solution cuvette
A sample cuvette has been insertedinstead of a zero solution cuvette
Test needs zero solution. Insert zero solution cuvette!
Respond with Yes or NoAn existing test has been requested again from the Dr. Lange Call Centre
Test data exist! Call anyway?
A Dr. Lange Test is already presentas a copy under the menu optionUser and was also moved
Test already exists!
Respond with Yes or NoThe menu key was pressed during or after vary
Terminate vary?
Respond with Yes or NoThe menu key was pressed during or after programming
Terminate programming?
Test data are being transferred to a PC with DATAtrans software
Sending data.
Respond with Yes or NoA test that is to be copied is already present under the menuoption User
Renew the copy?
ResponseCauseError message
2_HB_GB_BDA451 10.02.2003 8:48 Uhr Seite 3
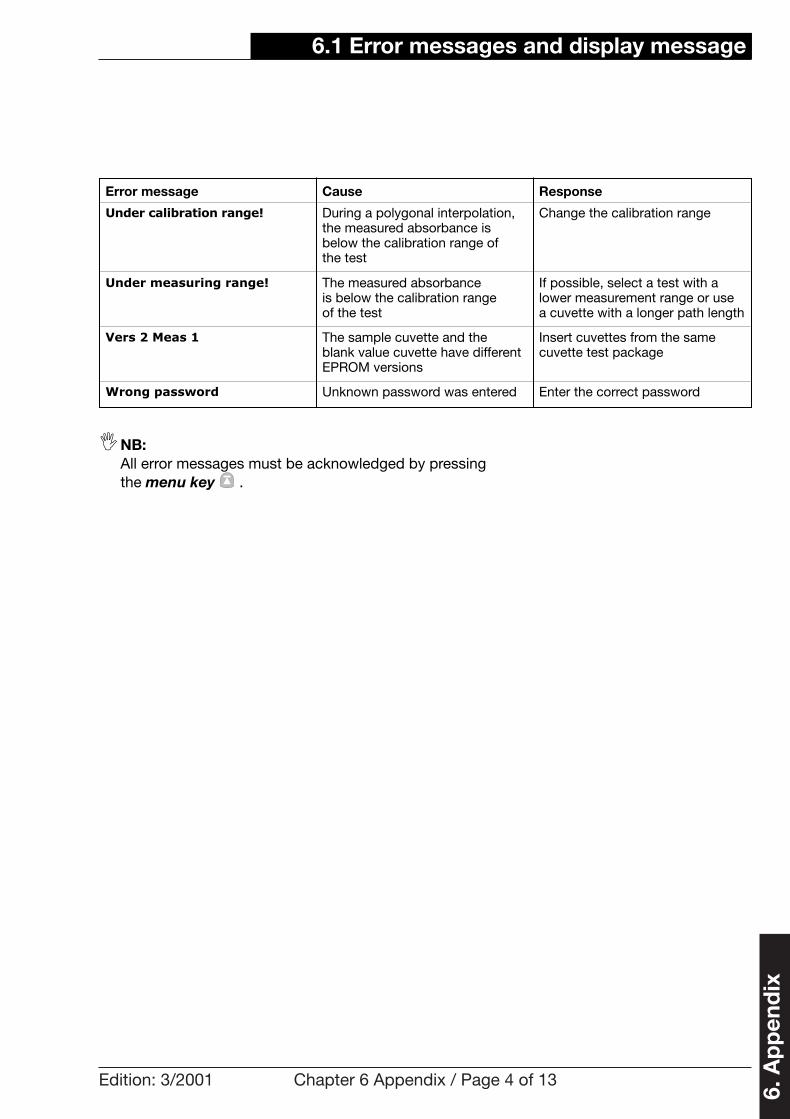
Edition: 3/2001 Chapter 6 Appendix / Page 4 of 13
6. A
pp
end
ix
�NB:All error messages must be acknowledged by pressing the menu key .
6.1 Error messages and display message
Enter the correct passwordUnknown password was enteredWrong password
Insert cuvettes from the same cuvette test package
The sample cuvette and the blank value cuvette have differentEPROM versions
Vers 2 Meas 1
If possible, select a test with alower measurement range or usea cuvette with a longer path length
The measured absorbance is below the calibration range of the test
Under measuring range!
Change the calibration range During a polygonal interpolation,the measured absorbance isbelow the calibration range of the test
Under calibration range!
ResponseCauseError message
2_HB_GB_BDA451 10.02.2003 8:48 Uhr Seite 4

Edition: 3/2001 Chapter 6 Appendix / Page 5 of 13
6. A
pp
end
ix
6.2 Inspection and service
Malfunctions that are not attributable to defects or wear canonly be eliminated by servicing.
Please contact one of our service centres and describe themalfunctioning of your XION 500. Our service department willprovide prompt assistance.
We advise users to sign a contract with our Service departmentimmediately after purchase for an annual inspection of theirXION 500 (either in-house or at a Dr. Lange inspection centre). As well as ensuring the operational readiness of the instrument, this has the advantage that the guarantee is extended to 3 or 5 years. The only maintenance that the user is expected to perform is changing the lamp.
6.2.1 Cleaning the instrument
The XION 500 can be cleaned with a dry cloth or a mild household cleanser. Under no circumstances should solventssuch as petroleum spirit, acetone or similar be used.
The optical parts should only be cleaned by the Dr. Langeservice department.
6.2 Inspection and service
2_HB_GB_BDA451 10.02.2003 8:48 Uhr Seite 5

Edition: 3/2001 Chapter 6 Appendix / Page 6 of 13
6. A
pp
end
ix
6.3 Technical data
6.3 Technical data
8 nm Spectral band width
< 0,16 % (at 340 nm, with Schott glass GG 435/3)< 0,1 % (at 500 nm, with Schott glass OG 570/3)
Stray light
+/- 0,0034 A / 12 hours Stability of thezero point
+/- 0,001 A at A = 1,0Photometric reproducibility
0,5 % at A = 1,0 (filter VAA 360, set 0277, PTB-certified on 29.11.00)Photometric accuracy
5 nm/sec.Scanning rate
< 0,3 nm Wavelength reproducibility
+/- 2 nm (holmium oxide filter at 361 nm)Wavelength accuracy
Rectangular cuvette compartment for 10 to 50 mm rectangular cuvettesand flow-through cuvettes; closable round cuvette compartment for automatic evaluation of Dr. Lange round cuvettes via barcode reader, 10-point measurement of the cuvettes, average value calculation after elimination of outliers with a specific program
Cuvette compartments
C 167 computer (16-bit processor)2 MB program memory, 2 MB data memory
Operating system
Concave grating with 1200 lines/mmMonochromator
Halogen lamp: 340 – 900 nm Light sources
≥ 1 nm Wavelength resolution
340 to 900 nm with fully automatic wavelength calibration and storage ofzero value and base line.
Wavelengthrange
Absorbance spectra: Absorbance: -3 A to +3 A, transmittance: 0 to 100%Concentration calculation with the help of factor, linear and nonlinear calibration curves, time-controlled measurements, Dr. Lange Cuvette Testevaluation
Operatingmodes
Scanning grating spectrophotometer with reference beam path, open measurement in round and rectangular cuvette compartments, integratedprocessor for data management and data processing via diskette drive,measured value output to backlit graphic display
Type
2_HB_GB_BDA451 10.02.2003 8:48 Uhr Seite 6
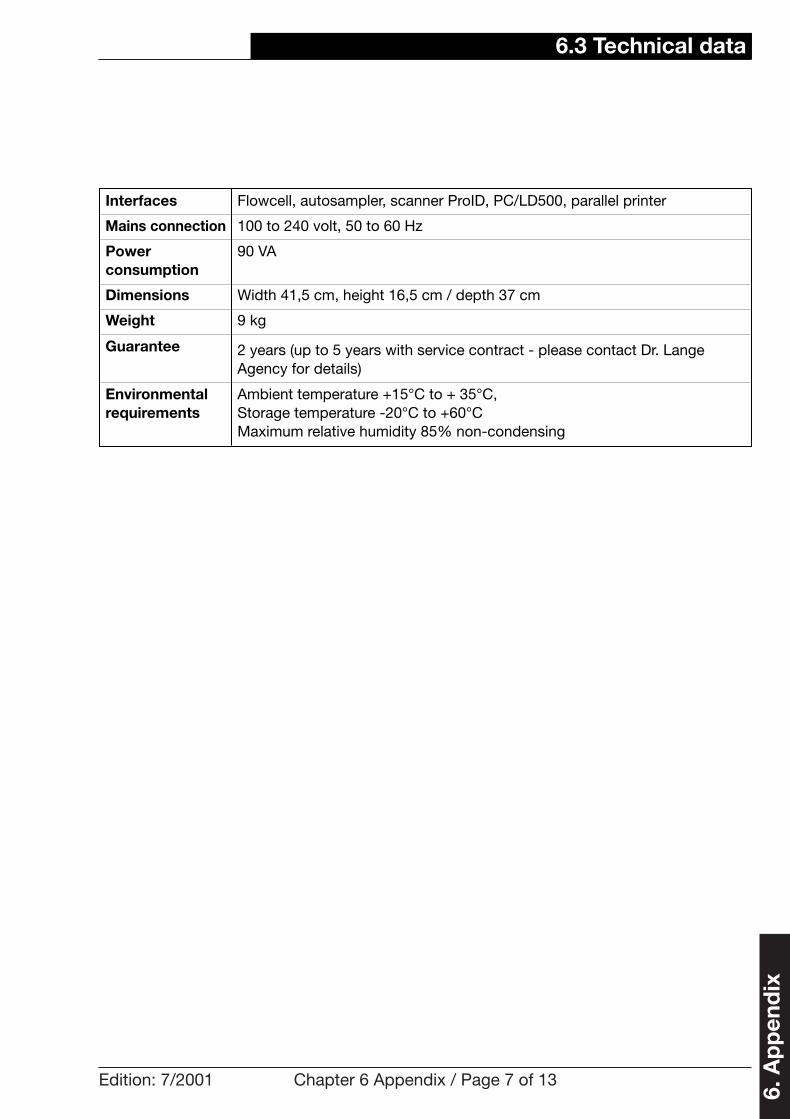
Edition: 7/2001 Chapter 6 Appendix / Page 7 of 13
6. A
pp
end
ix
6.3 Technical data
Ambient temperature +15°C to + 35°C,Storage temperature -20°C to +60°CMaximum relative humidity 85% non-condensing
Environmentalrequirements
2 years (up to 5 years with service contract - please contact Dr. LangeAgency for details)
Guarantee
9 kg Weight
Width 41,5 cm, height 16,5 cm / depth 37 cmDimensions
90 VA Power consumption
100 to 240 volt, 50 to 60 HzMains connection
Flowcell, autosampler, scanner ProID, PC/LD500, parallel printerInterfaces
2_HB_GB_BDA451 10.02.2003 8:48 Uhr Seite 7

Edition: 3/2001 Chapter 6 Appendix / Page 8 of 13
6. A
pp
end
ix
6.4 Glossary
6.4 Glossary
Starting in the main menu, press the Edit and Data selection keys, orafter each measurement press the Data selection key, in order to edit, delete and print measurement results (see chapter 3.1).
DATA
Compartment into which the cuvette is inserted.Cuvette compartment
Measurement vessel that is inserted in the photometer.Cuvette
Starting in the main menu, press the Edit, Copy selection keys to copyDr. Lange Tests to User (see chapter 3.5).
COPY
Bar showing the relationship of the measured value to the measurement range.
Control bar
Starting in the main menu, press the Options, Contrast selection keysto set the contrast between background and text (see chapter 5.6).
CONTRAST
Standard protocol for parallel data transmission. Centronics interface
Plot of absorbance (or transmittance) against concentration.Calibration curve
Automatic self-test by the XION 500 with wavelength adjustment.Calibration
Cuvette containing reagents, distilled water, etc. .Blank value cuvette
Law that describes the proportional relationship between absorbance andconcentration (see chapter 2.5.1).
Beer-Lambert law
Device that automatically reads round cuvettes with barcode label (Dr. Lange Cuvette Tests).
Barcode reader
Label on the Dr. Lange cuvettes, which is read by the barcode reader.Barcode label
Option in main menu (see chapter 2). ANALYSIS
Predefined sample name when addista standard solutions are used. Addista
Plot of absorbance against wavelength. Usually an analysis procedure iscalibrated at the absorbance maximum (see chapter 3.2.2).
Absorbance spectrum
Parameter that increases in proportion to the concentration of a sample inaccordance with the Beer-Lambert law.
Absorbance
Starting in the main menu, press the Analysis, Abs/Trans selection keysto carry out absorbance and transmittance measurements (see chapter 2.5).
ABS/TRANS
Appears in display or selection list when no further information about measurement result is required (see chapter 2.3).
_ _ _ _ _
Starting in the main menu, press the Analysis, ¬-scan selection keysto plot absorbance and transmittance spectra (see chapter 2.6).
¬-scan
MeaningTerm
2_HB_GB_BDA451 10.02.2003 8:48 Uhr Seite 8

Edition: 3/2001 Chapter 6 Appendix / Page 9 of 13
6. A
pp
end
ix
6.4 Glossary
System for mix-up-free identification of sample and cuvette. It consists of a Dr. Lange hand-held barcode scanner, a holder and differently coloured ProID clips.
Dr. Lange ProID system
Dr. Lange round cuvettes with a barcode label, containing precisequantities of reagents.
Dr. Lange cuvette tests
Central data transmission station for updating or installing Dr. Lange Cuvette Tests, Pipette Tests, Trace Analyses and ”beta“ tests (see chapter 4).
Dr. Lange Call Centre
Starting in the main menu, press the Analysis and Dr. Langeselection keys to measure Dr. Lange Tests (Pipette Tests, Trace Analysesand ”beta“ tests) (see chapter 2.1).
DR. LANGE
Display of the actual values, data, graphics, submenus and input zones ofthe individual menu items.
Display zone
Backlit graphic display on which results and menus are shown.Display
Diskette drive, opening at the front of the XION 500, which can accommodate a 3.5" diskette.
Diskette drive
Starting in the main menu, press the Edit, Data, Tests or Abs/Trans,Output and Diskette selection keys to save measurement data (seechapter 3.1.1.4) or, starting in the main menu, press the Update and Disketteselection keys to update the program and/or test data (see chapter 4.2).
DISKETTE
3.5" disk on which data can be stored, e.g. measurement data or updates.The storage capacity is 1.44 MB.
Diskette
Value with which the measurement result is multiplied. A dilution factor of 10 is necessary if 1 part of the sample is diluted with 9 parts of distilledwater.
Dilution factor
Starting in the main menu, press the Edit and Dilution selection keysto extend the selection list by entering user-defined dilution factors (see chapter 2.3.3).
DILUTION
The XION 500 has 4 results databases, to which the measurement data areautomatically saved. The saved data can be recalled for viewing or editing(see chapter 1.9 and chapter 3.1).
Database
Display message indicating that the data for updating or installing Dr. Lange Cuvette Tests, Pipette Tests, Trace Analyses and ”beta“ tests must be requested (see chapter 4.1.1).
Data request
Instrument for transferring data by telephone.Data handset
Data exchange through the Dr. LangeNet (see chapter 4.1) or by diskette(see chapter 4.2).
Data exchange
MeaningTerm
2_HB_GB_BDA451 10.02.2003 8:48 Uhr Seite 9

Edition: 3/2001 Chapter 6 Appendix / Page 10 of 13
6. A
pp
end
ix
6.4 Glossary
Lowest wavelength of an absorbance/transmittance spectrum (see chapter 2.6).
Lower wavelength
Detail of programming and variation of tests. Defines the lower measurement range limit (see chapter 3.2.3.1).
Lower limit
Dr. Lange laboratory printer with continuous thermal paper.LD 500
Starting in the main menu, press the Options and Languageselection keys to set the XION 500 to one of the 9 available languages (see chapter 5.7).
LANGUAGE
Data exchange with data handset and Dr. Lange Call Centre.LangeNET
Cover on the top of the housing of the XION 500 for the purpose of ventilating the lamp compartment.
Lamp cover
Contains the lamp (see chapter 1.7).Lamp compartment
Separation of two successive measurement points on plots of absorbanceand transmittance spectra.
Interval
Starting in the main menu, press the Options and Interfacesselection keys to configure the serial interfaces.
INTERFACES
The input zone is represented on the display screen by a window with aninput prompt and input markings (see chapter 1.6.1 and chapter 1.6.2).
Input zone
Used to call up and assign information about the measurement result (see chapter 2.4).
INFO
Dr. Lange guarantees a newly purchased XION 500 for 2 years. This can be extended to up to 5 years with a service contract (see chapter 6.2).
Guarantee
Good laboratory practice. International standard that defines the output ofmeasurement results (see chapter 5.3).
GLP
Used to enable large numbers of samples to be measured in flow-throughmode without changing cuvettes.
Flow-through cuvettes
Mathematical element of an evaluation formula. Usually the reciprocal valueof the gradient of the calibration curve.
Factor
Also evaluation options. Some cuvette tests allow a choice between different evaluation forms, e.g. NO3 or NO3-N (see chapter 2.2.2).
Evaluation form
Messages displayed automatically by the XION 500 to indicate operatingerrors or instrument malfunctions (see chapter 6.1).
Error messages
Option in main menu (see chapter 3).EDIT
MeaningTerm
2_HB_GB_BDA451 10.02.2003 8:48 Uhr Seite 10

Edition: 3/2001 Chapter 6 Appendix / Page 11 of 13
6. A
pp
end
ix
6.4 Glossary
Window in which the determined result, etc. is shown.Result window
High-precision glass, quartz or plastic cuvette as evaluation vessel for inserting in the cuvette compartment. 10 mm wide with specific length (up to 50 mm).
Rectangular cuvettes
Eight differently coloured clips, which represent up to eight different sampleidentifiers, e.g. different sampling locations, and are attached to the tops ofthe cuvettes.
ProID clips
Starting in the main menu, press the Edit and Program selection keysto program user tests (see chapter 3.2).
PROGRAM
Length of the path taken by the light in a cuvette. The longer the pathlength of a cuvette, the higher the measured absorbance.
Path length
Starting in the main menu, press the Options and Passwordselection keys to provide certain XION 500 functions with password protection (see chapter 5.5).
PASSWORD
Interface that enables a commercial DOS-compatible printer with a parallel(Centronics) input to be connected.
Parallel interface
Main menu item (see chapter 5).OPTIONS
Option in the selection list of units – indicates no unit is required (see chapter 2.3.4).
None
Control number which depends on the definition of the variables. Calculated automatically by the XION 500.
No.
Starting in the main menu, press the Edit and Move selection keys tomove Dr. Lange Tests (Pipette Tests, Trace Analyses and ”beta“ tests) toUser (see chapter 3.6).
MOVE
Main menu and submenu items. The individual menu options can be selected by pressing the appropriate selection key.
Menu options
Concentration range with exactly defined upper and lower limits. If a sample concentration exceeds the upper limit the sample can be dilutedwith distilled water. If a sample concentration is below the lower limit, a longer path length or a concentration method must be used.
Measuring range
Wavelength at which the procedure was calibrated, usually the absorbance maximum.
Measurement wavelength
A red LED indicates when the key should be pressed to measure a sample cuvette.
Measurement key(green)
Start menu with menu options: Analysis, Edit, Update, Options
Main menu
MeaningTerm
2_HB_GB_BDA451 10.02.2003 8:48 Uhr Seite 11

Edition: 3/2001 Chapter 6 Appendix / Page 12 of 13
6. A
pp
end
ix
6.4 Glossary
Plot of transmittance against wavelength (see chapter 3.2.2).Transmittancespectrum
Transmittance is the percentage of light of a certain wavelength that passesthrough a solution (see chapter 2.5.1).
Transmittance
Plot of absorbance or transmittance measurements at a given wavelengthagainst time (see chapter 2.7).
Time-dependentabsorbance ortransmittance measurement
Specific number of a procedure (1 – 3 characters), which appears in the selection lists (see chapter 1.6.4 and chapter 3.2).
Test number
Menu that opens when a main menu item is selected by pressing a selection key.
Submenu
Solution of known concentration in a cuvette.Standard cuvette
Contract with the Dr. Lange Service department under which the XION 500is regularly inspected, cleaned and calibrated. Causes the guarantee to beextended to 3 or 5 years (see chapter 6.2).
Service contract
Interface for connecting the Dr. Lange LD 500 printer or a PC to which the measured values can be transferred with the DATAtrans software (see chapter 5.4).
Serial interface
Display of all available tests, data, names, etc.Selection list
Variable blank value with which the XION 500 is set to zero before eachsample is measured.
Sample-specificblank value
Cuvette in which the sample has already reacted with the test reagents,causing coloration of the contents.
Sample cuvette
Starting in the main menu, press the Edit and Sample selection keysto enter sample names as part of the process of creating a selection list(see chapter 2.3.1).
SAMPLE
High-precision glass cuvette of the Dr. Lange Cuvette Tests. Serves as reaction and evaluation vessel.
Round cuvettes
Measurement results of absorbance measurements. Up to 3 scans can beaccommodated.
Results database -¬-scan
Measurement results of time-dependent absorbance and transmittancemeasurements. Up to 3 scans can be accommodated.
Results database -t-scan
Measurement results of Dr. Lange Cuvette Tests, Pipette Tests, Trace Analyses,”beta“ tests and user tests. Up to 2500 records can be accommodated.
Results database -TESTS
Measurement results of absorbance and transmittance measurements. Up to 500 records can be accommodated.
Results database -ABS/TRANS
MeaningTerm
2_HB_GB_BDA451 10.02.2003 8:48 Uhr Seite 12

Edition: 3/2001 Chapter 6 Appendix / Page 13 of 13
6. A
pp
end
ix
6.4 Glossary
A red LED indicates when the key should be pressed to measure a zero cuvette.
Zero key (blue)
Cuvette with which the XION 500 is set to zero. Contains blank solution,reagents, distilled water, solvent, etc.
Zero solution cuvette
Procedure and evaluation of a test.Working procedure
Starting in the main menu, press the Edit and Vary selection keys tocarry out specific changes to programmed tests (see chapter 3.3).
VARY
Test developed by the user or taken from the literature, which can be evaluated by the XION 500. The measurement wavelengths, factors, etc.must be determined by the user (see chapter 3.2.2).
User test
Starting in the main menu, press the Edit and User selection keys to enter the user name as part of the process of creating a selection list (see chapter 2.3.2).
USER
Starting in the main menu, press the Analysis and User selection keysto display the list of user-programmed tests or user-modified Dr. Lange Tests (moved Pipette Tests, Trace Analyses and ”beta“ tests and copied Dr. Lange Cuvette Tests and Dr. Lange Tests) in order to carryout measurements (see chapter 2.1).
USER
Highest wavelength of an absorbance or transmittance spectrum (see chapter 2.6).
Upper wavelength
Detail of programming and variation of tests. Defines the upper measuringrange limit (see chapter 3.2.3.1 and chapter 3.3).
Upper limit
In the main menu, press the Update selection key to load new softwareversions, upgraded software packages, test data from a diskette or data forindividual tests through the Dr. LangeNET (see chapter 4.1 and 4.2).
UPDATE
Starting in the main menu, press the Edit and Units selection keysto enter the units as part of the process of creating a selection list (see chapter 2.3.4).
UNITS
Detail of the programming and variation of formulas for tests. Defines theunit of the interim result.
Unit
Starting in the main menu, press the Analysis and t-scanselection keys to carry out a time-dependent absorbance or transmittancemeasurement (see chapter 2.7).
t-scan
MeaningTerm
2_HB_GB_BDA451 10.02.2003 8:49 Uhr Seite 13