Embed Size (px)
Citation preview

Marketing Science Institute Working Paper Series 2012 Report No. 12-109 To Launch or not to Launch in Recessions? Evidence from over 60 Years of the Automobile Industry M. Berk Talay, Koen Pauwels, and Steven H. Seggie “To Launch or not to Launch in Recessions? Evidence from over 60 Years of the Automobile Industry,” M. Berk Talay, Koen Pauwels, and Steven H. Seggie © 2012; Report Summary © 2012 Marketing Science Institute MSI working papers are distributed for the benefit of MSI corporate and academic members and the general public. Reports are not to be reproduced or published in any form or by any means, electronic or mechanical, without written permission.
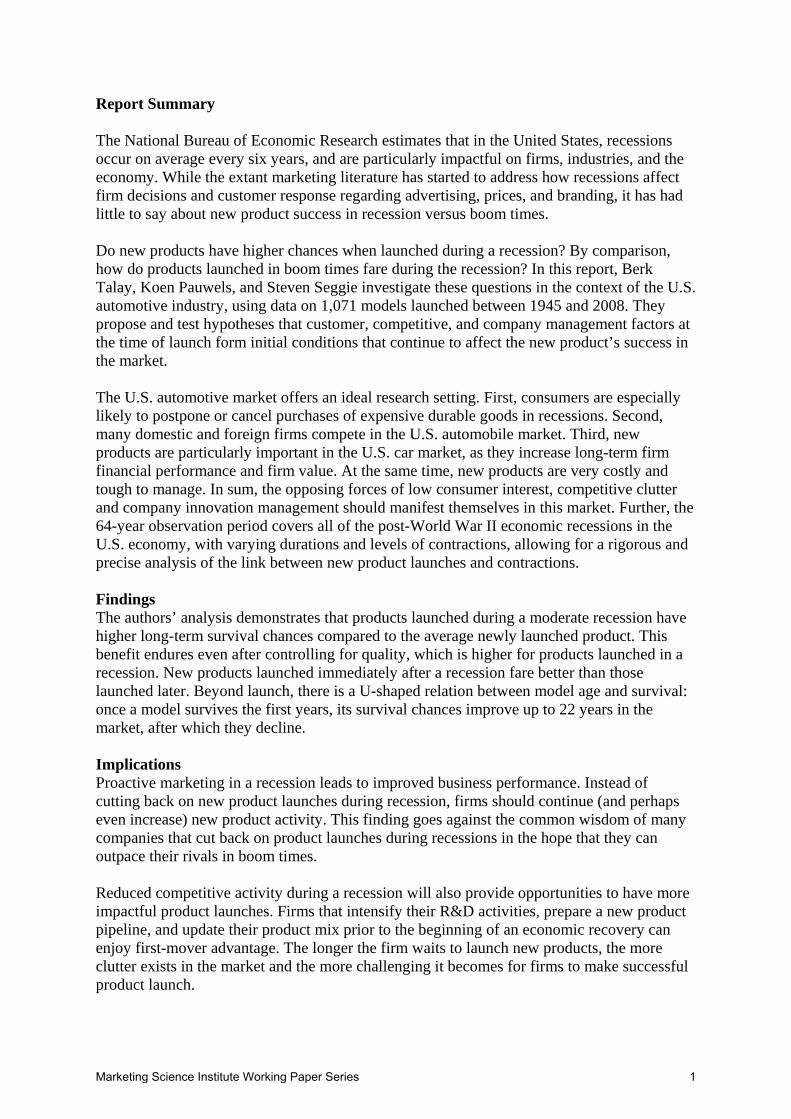
Report Summary The National Bureau of Economic Research estimates that in the United States, recessions occur on average every six years, and are particularly impactful on firms, industries, and the economy. While the extant marketing literature has started to address how recessions affect firm decisions and customer response regarding advertising, prices, and branding, it has had little to say about new product success in recession versus boom times. Do new products have higher chances when launched during a recession? By comparison, how do products launched in boom times fare during the recession? In this report, Berk Talay, Koen Pauwels, and Steven Seggie investigate these questions in the context of the U.S. automotive industry, using data on 1,071 models launched between 1945 and 2008. They propose and test hypotheses that customer, competitive, and company management factors at the time of launch form initial conditions that continue to affect the new product’s success in the market. The U.S. automotive market offers an ideal research setting. First, consumers are especially likely to postpone or cancel purchases of expensive durable goods in recessions. Second, many domestic and foreign firms compete in the U.S. automobile market. Third, new products are particularly important in the U.S. car market, as they increase long-term firm financial performance and firm value. At the same time, new products are very costly and tough to manage. In sum, the opposing forces of low consumer interest, competitive clutter and company innovation management should manifest themselves in this market. Further, the 64-year observation period covers all of the post-World War II economic recessions in the U.S. economy, with varying durations and levels of contractions, allowing for a rigorous and precise analysis of the link between new product launches and contractions. Findings The authors’ analysis demonstrates that products launched during a moderate recession have higher long-term survival chances compared to the average newly launched product. This benefit endures even after controlling for quality, which is higher for products launched in a recession. New products launched immediately after a recession fare better than those launched later. Beyond launch, there is a U-shaped relation between model age and survival: once a model survives the first years, its survival chances improve up to 22 years in the market, after which they decline. Implications Proactive marketing in a recession leads to improved business performance. Instead of cutting back on new product launches during recession, firms should continue (and perhaps even increase) new product activity. This finding goes against the common wisdom of many companies that cut back on product launches during recessions in the hope that they can outpace their rivals in boom times. Reduced competitive activity during a recession will also provide opportunities to have more impactful product launches. Firms that intensify their R&D activities, prepare a new product pipeline, and update their product mix prior to the beginning of an economic recovery can enjoy first-mover advantage. The longer the firm waits to launch new products, the more clutter exists in the market and the more challenging it becomes for firms to make successful product launch.
Marketing Science Institute Working Paper Series 1

The severity of the recession presents a boundary condition to the benefits of increasing marketing activity during a recession. Product survival chances are substantially lower when it is launched in a severe recession. This implies that managers should carefully monitor macro-level economic activity and integrate existing and prospective conditions into new product launch strategies. Interest rates, oil prices, inflation, rising bankruptcies, consumer spending, treasury spread, and yield curve might be used as indicators of an imminent recession and its depth. When these indicators start to presage a downturn, managers should carefully consider which new development projects are likely to be relevant to consumers in the upcoming recession. M. Berk Talay is Assistant Professor of Marketing, University of Massachusetts, Lowell. Koen Pauwels is Professor of Marketing and Steven H. Seggie is Assistant Professor of Marketing, both at the Graduate School of Business, Ozyegin University, Istanbul, Turkey.
Marketing Science Institute Working Paper Series 2

To Launch or not to Launch in Recessions?
Evidence from over 60 years of the Automobile Industry
“We are living through a tremendous bust. The auto industry is on pace to sell 28 percent fewer new vehicles this year than it did 10 years ago — and 10 years ago was 2001, when the country was in recession. Consumers are coping with a sharp loss of wealth and an uncertain future (and many have discovered that they don’t need to buy a new car or stove every few years).” Leonhart (2011)
“Ford is reporting bumper profits, Audi recorded its fastest growth ever and GM’s earnings reached a record $ 7.6bn in 2011” Financial Times, The Future of the Car, March 6, 2012.
The recession beginning in 2009 served as a potent reminder of how cyclical
contractions can have a substantial detrimental effect on national economies throughout the
world. The National Bureau of Economic Research estimates that in the United States,
recessions occur on average every six years (www.nber.org), and are particularly impactful
on firms, industries and the economy (Zarnowitz 1985). The extant marketing literature has
started to address how recessions affect firm decisions and customer response regarding
advertising, prices and branding (e.g. Deleersnyder, Dekimpe, Steenkamp and Leeflang 2009;
Srinivasan, Rangaswamy and Lilien 2005) and R&D spending (Steenkamp and Fang 2011),
but has little to say about new product success in recession versus boom times (Srinivasan,
Lilien and Sridhar 2011). Do new products have higher chances when launched during a
recession? By comparison, how do products launched in boom times fare during the
recession? Nigel Hollis, the Chief Global Analyst at Millward Brown, claims higher
opportunities for impactful product launches in recessions due to reduced “noise” in
competitor media spending and response (Hollis 2009). Yet little empirical evidence exists to
either support or refute this claim. Answering such questions is key for managers who need to
decide when to launch an innovation into the market.
Marketing Science Institute Working Paper Series 3

In this paper, we examine the survival and success of automotive product launches
depending on their timing in the business cycle. Our hypotheses specify the net effect of the
opposing forces of tight customer budgets, lack of competitive clutter, and company
innovation management. In particular, we propose and find that products launched during a
recession have a higher likelihood of survival than products launched in boom times, unless
the recession is very deep. As for ‘boom launched’ products, they are more likely to succeed
(a) the earlier they are launched after a recession ends, and (b) the earlier they are launched
before a recession starts. These findings yield actionable advice for product launch timing.
Our contribution to the extant literature is twofold. First, we integrate the important
areas of new product innovation and recession marketing. Each area has received plenty of
research attention, but their intersection has not. To the best of our knowledge, only
Srinivasan, Lilien and Sridhar (2011) and Steenkamp and Fang (2011) investigate whether
firms should spend more on R&D during a recession – Srinivasan and colleagues find that
firms with large market shares should, while Steenkamp and Fang find that firms on average
should. However, the authors do not analyze when the new product based on such R&D
should be launched, nor do they differentiate between specific new products launched in
boom and recession times. Second, we uncover boundary conditions regarding consistent
academic advice that managers of top brands should innovate themselves out of a recession
(Lamey, Deleersnyder, Dekimpe and Steenkamp 2007). Such ‘counter-cyclical spending’
advice remains contentious among practitioners: while most UK finance directors believe that
recessions require firms to increase marketing spending (Anon 2009), other managers believe
it is key for companies to “manage their business downward when sales shrink (even if only
temporarily)” (Pudles 2006).
Our empirical application concerns the US automotive industry; an industry in which
several firms have struggled so much in the most recent recession that they have received
Marketing Science Institute Working Paper Series 4

been relatively under-researched in the marketing literature until recently (for some
exceptions see Droge, Calantone and Harmancioglu 2008; Harvey and Griffith 2007; Talay,
Seggie and Cavusgil 2009). Understanding success factors of product launch is important
given the high probability that the launched product fails to generate sufficient demand for its
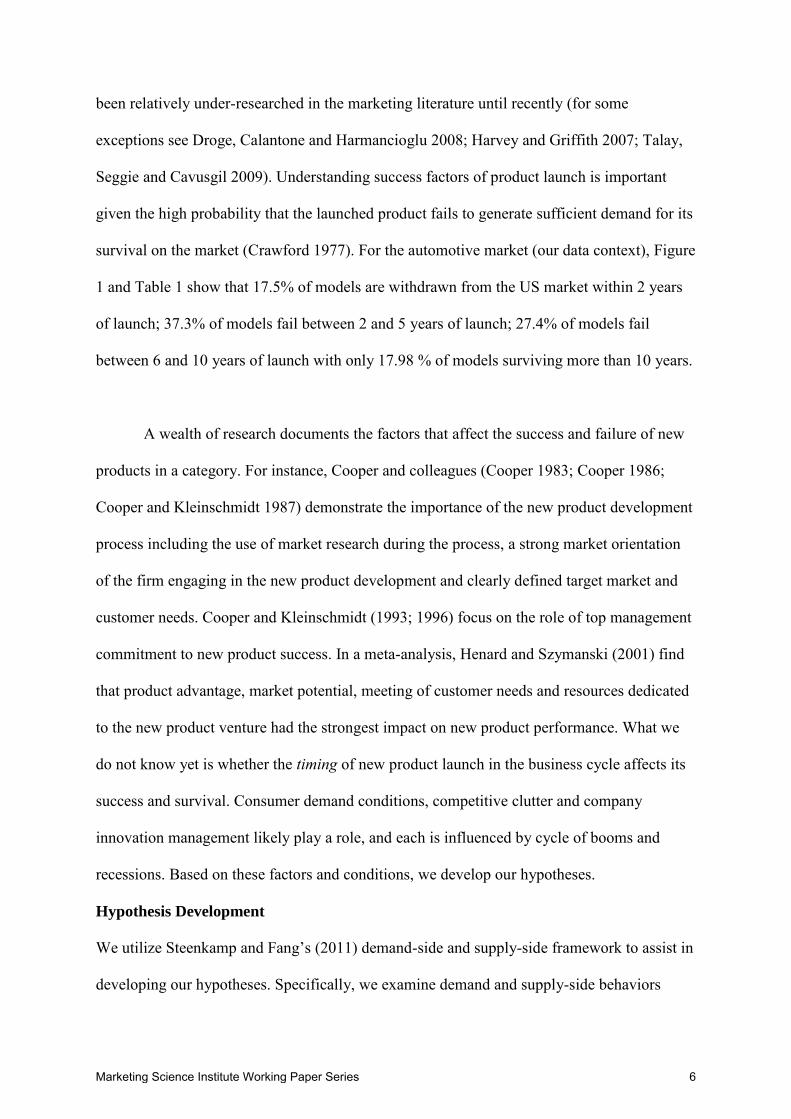
survival on the market (Crawford 1977). For the automotive market (our data context), Figure
1 and Table 1 show that 17.5% of models are withdrawn from the US market within 2 years
of launch; 37.3% of models fail between 2 and 5 years of launch; 27.4% of models fail
between 6 and 10 years of launch with only 17.98 % of models surviving more than 10 years.
(Figures and tables follow References.)
A wealth of research documents the factors that affect the success and failure of new
products in a category. For instance, Cooper and colleagues (Cooper 1983; Cooper 1986;
Cooper and Kleinschmidt 1987) demonstrate the importance of the new product development
process including the use of market research during the process, a strong market orientation
of the firm engaging in the new product development and clearly defined target market and
customer needs. Cooper and Kleinschmidt (1993; 1996) focus on the role of top management
commitment to new product success. In a meta-analysis, Henard and Szymanski (2001) find
that product advantage, market potential, meeting of customer needs and resources dedicated
to the new product venture had the strongest impact on new product performance. What we
do not know yet is whether the timing of new product launch in the business cycle affects its
success and survival. Consumer demand conditions, competitive clutter and company
innovation management likely play a role, and each is influenced by cycle of booms and
recessions. Based on these factors and conditions, we develop our hypotheses.
Hypothesis Development
We utilize Steenkamp and Fang’s (2011) demand-side and supply-side framework to assist in
developing our hypotheses. Specifically, we examine demand and supply-side behaviors
Marketing Science Institute Working Paper Series 5
been relatively under-researched in the marketing literature until recently (for some
exceptions see Droge, Calantone and Harmancioglu 2008; Harvey and Griffith 2007; Talay,
Seggie and Cavusgil 2009). Understanding success factors of product launch is important
given the high probability that the launched product fails to generate sufficient demand for its
survival on the market (Crawford 1977). For the automotive market (our data context), Figure
1 and Table 1 show that 17.5% of models are withdrawn from the US market within 2 years
of launch; 37.3% of models fail between 2 and 5 years of launch; 27.4% of models fail
between 6 and 10 years of launch with only 17.98 % of models surviving more than 10 years.
A wealth of research documents the factors that affect the success and failure of new
products in a category. For instance, Cooper and colleagues (Cooper 1983; Cooper 1986;
Cooper and Kleinschmidt 1987) demonstrate the importance of the new product development
process including the use of market research during the process, a strong market orientation
of the firm engaging in the new product development and clearly defined target market and
customer needs. Cooper and Kleinschmidt (1993; 1996) focus on the role of top management
commitment to new product success. In a meta-analysis, Henard and Szymanski (2001) find
that product advantage, market potential, meeting of customer needs and resources dedicated
to the new product venture had the strongest impact on new product performance. What we
do not know yet is whether the timing of new product launch in the business cycle affects its
success and survival. Consumer demand conditions, competitive clutter and company
innovation management likely play a role, and each is influenced by cycle of booms and
recessions. Based on these factors and conditions, we develop our hypotheses.
Hypothesis Development
We utilize Steenkamp and Fang’s (2011) demand-side and supply-side framework to assist in
developing our hypotheses. Specifically, we examine demand and supply-side behaviors
Marketing Science Institute Working Paper Series 6

during a recession, at the start of the boom cycle and at the end of the boom cycle. On the
demand-side, we discuss customer behavior, while on the supply-side we discuss the
behaviors of firms and their competitors. Integrating these arguments, we develop our
hypotheses for the survival of new products under different recession/boom conditions.
Recessions
During a recession there is a contraction in the overall demand for firms’ goods as customers
become less inclined and less able to buy products. For durable goods, consumers are
especially likely to postpone or cancel purchases (Deleersnyder et al. 2004) due to lack of
available credit (Petersen and Strongin 1996) and because they are not as essential as e.g.
food (Cook 1999). Furthermore, recessions make people more risk averse (Bollerslev, Gibson
and Zhou 2011) thus likely to engage in more research before buying products, less likely to
borrow money to buy goods, more demanding of higher quality for the goods that they do
buy and generally more cautious in their purchasing behaviors.
On the supply-side, firms generally respond to recessions by reducing marketing
spending (Andras and Srinivasan 2003; Barwise and Styler 2002; Tellis and Tellis 2009).
Advertising expenditure is often procyclical (Tellis and Tellis 2009), i.e. firms cut back on
advertising during a recession. Likewise, firms are reluctant to launch new products in a
recession (Roberts 2003). As a result of this clutter reduction in the market, companies that
do engage in product launch during recessions are better able to reach potential customers.
How does company innovation management and resulting quality of launched
products differ in recessions versus booms? The key consideration is the context in which
new product development took place. Researchers don’t know the development time for each
new product (Boulding and Staelin 1995; Ravenscraft and Sharer 1982), but recent studies
have put the average development time in the car industry between 18 months and about 3
years (Kafouros 2008; Steenkamp and Fang 2011). This suggest that the lion share of new
Marketing Science Institute Working Paper Series 7

product development took place (1) during the boom for products launched at the end of the
boom, (2) during the recession for products launched at the start of the boom and (3) mostly
during the recession for products launched in recessions.
The quality of new product development should be higher during recessions and at the
end of booms versus the start and the peak of booms for several reasons. First, the labor
market for engineers and the like turns in favor of employers when the recession is looming
and remains so throughout the recession (Tabrizi and Chaudhuri, 1999). Those firms that are
conducting R&D during these times will be able to attract exceptional employees from
competing firms. Second, given the pressure of losing contracts and jobs, the firm’s suppliers,
channel partners and employees tend to offer the firm the best value when the economy turns
and stays sour. Third, the recession induces many managers to become more prevention-
focused and thus careful about launching new projects (Gulati, Nohria and Wohlgezogen
2010). These three factors imply a higher quality of products launched in recessions, which
we verify in our empirical analysis. The higher quality will lead to more repurchases of the
product in the future, thus contributing to greater survival of products launched in recessions.
In sum, we observe three competing forces impacting upon the success of the product
launched in a recession. On the one hand we see a reduction in consumer demand but at the
same time we see counterforces from the lack of a clutter in the marketplace (which gives a
higher share of voice for those firms that choose to launch their products during the
recession), and higher quality products being launched. While the forces of low consumer
demand and low competitive clutter may cancel each other out, the better quality of
recession-launched products should prevail in time. Therefore, we propose that:
H1: Products launched during a recession have higher survival chances compared to
products launched anytime.
Start of the boom
Marketing Science Institute Working Paper Series 8

Post-recession, customers begin to regain their confidence in the economy and thus become
more willing to take the risk of buying large durable products like automobiles. Furthermore,
as many customers have held off from buying during the recession, there is likely to be pent-
up demand that will manifest itself once the boom begins.
On the supply-side, the quality of launched products should still be high, given that
they have been developed mostly during the recession – lag times range between 18 months
and about 3 years (Kafouros 2008; Steenkamp and Fang 2011). However, competitors also
start to produce more at the start of the boom (Francois and Lloyd-Ellis, 2003), leading to
greater clutter in the market places in terms of advertising and promotion.
In sum, the start of the economic boom offers firms increased consumer demand
countered to some extent by competitive clutter, but also the ability to launch higher quality
products in the market place. Therefore, we propose that
H2: The sooner after a recession a product is launched, the greater its chance of
survival.
End of Boom
Toward the end of the economic boom, we begin to witness the shadow of the future
recession. As this shadow looms, there is much anecdotal evidence1 to suggest that consumer
confidence begins to decline and customer start to adjust their consumption behaviors in light
of the oncoming recession vis-à-vis their behaviors during the boom. As such, we see a
decline in customer demand from its peak of the boom. Products launched at this time may
fail to gain the necessary traction to become successful in the marketplace.
On the supply-side, the growth in output that occurred during the initial stages of the
boom slows down as we approach recession (Emery and Koenig, 1992; Sichel, 1993) though
not to the extent of recession-level outputs. As such, we still see some competitive clutter in
1 e.g., http://www.nytimes.com/2008/01/14/business/14spend.html accessed 5th July 2011
Marketing Science Institute Working Paper Series 9

the marketplace. Finally, products launched at the end of the boom are developed almost
entirely during a boom. Their relative quality should be low given our rationale for H1.
In sum, the deck is stacked against products launched at the end of the boom. They
face declining consumer demand, which is only compensated slightly by declining
competitive clutter. More problematic are their lower-than-average quality and also the
forthcoming recession that will prevent the product gaining traction in the market. Therefore,
H3: The nearer to the beginning of a recession a product is launched, the lower its
chance of survival.
RESEARCH DESIGN
Hazard Model
Standard regression approaches are not suitable for the analysis of survival times since such
data are right-censored i.e., not all models in the dataset have failed by the end of the
observation period. Therefore, we test our hypotheses using a parametric hazard model not
only because it can address the right-censoring problem, but also because it is possible to
analyze the effects of time-varying and time–constant covariates on a model’s probability of
failure (Helsen and Schmittlein 1993, p. 397). Hazard models have been extensively utilized
to analyze likelihood of failure in different areas including biostatistics (Karapetis et al.
2008), economics (Hurd, Smith and Zissimopoulos 2004), management (Barnett and Hansen,
1996), and marketing (Aboulnasr, Narasimhan, Blair and Chandy 2008; Srinivasan, Lilien
and Rangaswamy 2004). Using STATA 11.0, we estimate a hazard-model with log-logistic
distribution using time-varying and –constant covariates and inverse Gaussian shared frailty.
The survivor and density function of the generalized log-logistic model are:
( ) { ( ) }
and
Marketing Science Institute Working Paper Series 10

( )
{ ( ) }
This model is implemented by parameterizing λj=exp(-xjβ) and treating γ, the scale
parameter, as ancillary to be estimated from the data.
To analyze the robustness of our findings to model specification, we also estimated
our model using three other commonly used baseline distributions (Wang et al. 2010):
weibull, log-normal, and generalized gamma distributions. Finally, we perform a
bootstrapping analysis with 50 repetitions (Aboulnasr et al. 2008).
DATA
We test our hypotheses using population data from the U.S. automotive industry for the
period of 1946-2008. Thus, our analyses are based on a dataset comprising all automobile
manufacturers known to compete in the U.S. automobile market from 1946 to 2008. We use
1946 as the starting point for our data as it is the year that production in the U.S. automobile
industry resumed after World War II. Complete coverage of the 63 year period enables us to
conduct a more robust analysis of the impact of economic recessions on the survival of new
product introductions. Moreover, it allows testing of hypotheses without assuming temporal
equilibrium (Carroll and Teo 1996).
Whenever possible, we used multiple sources to increase the reliability of our data.
Data for the car models are derived mainly from two sources: the Standard Catalog of
American Cars (Flammang and Kowalke 1999; Gunnell et al. 1982), and the Standard
Catalog of Imported Cars (Covello 2002). We supplement these major data sources with the
New Encyclopedia of Motor Cars (Georgano and Andersen 1982), World Guide to
Automobile Manufacturers and Automotive News. The National Bureau for Economic
Research (NBER) features the recession data on its website. Our final dataset contains 8,203
Marketing Science Institute Working Paper Series 11

model-year pairs with information on 1071 models from 146 different brands for our
observation period (i.e., 1946-2008), during which there were 11 recessions.
Dependent Variable
The dependent variable in our model is the failure (i.e., exit) probability of a car model i at
time t. Car manufacturers spend considerable resources building car model brands and aim to
sustain them as long as possible, e.g. by introducing new generations. For instance, the
Toyota Corolla has been sold in the United States market since the summer of 1968 and is
still on the market. Likewise, Lincoln Town Car was launched in 1981, after three
generations, and withdrawn in 2011, so its lifespan was 20 years. Low consumer interest and
tough competition are key culprits for model exists, 913 of which are observed in our dataset.
Since the observation period in our dataset starts with the resumption of production in the
U.S. automotive industry post-WWII, the data are not left-censored.
Recession-Related Covariates
This study examines the link between the survival probabilities of innovations and the market
conditions during their launch. In particular, we analyze how the timing of launches vis-à-vis
recessions affects hazard rates. As such, we incorporate various time-varying covariates
which temporally pinpoint the precedence and subsequence of model launches with regard to
recession periods. Launch before recession (BEFOREit) is a time-varying covariate
operationalized as the years-to-next-recession (up to 3 years2) since the launch of model i.
Likewise, launch after recession (AFTERit) is the years-since-previous-recession (with the
same three-year cap as the BEFORE variable) from the launch of the model i. Launch during
recession (DURINGit) is a dummy variable coded as 1 if a model i was launched during a
2 Giving each product a value for ‘BEFORE’ and ‘AFTER’ variables would yield extensive overlap (e.g. the same product is launched 1 year before the next recession and 5 years after the previous recession). We choose the 3-year cap as half of the average boom period, and ran separate estimations with 2- and 4-year caps. Results for these estimations have the same directionality of main and interaction effects, and similar significance levels.
Marketing Science Institute Working Paper Series 12

recession period and 0 otherwise3. GDP decline during the recession operationalizes the
magnitude of the recession (DURING-MAGit) during which a model i was launched. We also
account for the quadratic effects of the recession magnitude (DURING-MAG2it) since we
expect its effects on failure probability of a model to be non-monotonic.
Besides the economic conditions at product launch, current conditions may influence
whether a car model fails in a given year t. We account for the effects of economic recessions
with a dummy variable (RECESSIONt) which equals 1 for the years of recessions, and 0
otherwise. Moreover, extant literature suggests that periods immediately preceding or
following a recession have different market conditions and consumption patterns. Right
before a recession, consumers like to indulge, but they often aim to be more frugal and less
wasteful right after the recession (Flatters and Willmott, 2009).. Therefore, we include two
dummy variables YEARBEFOREt and YEARAFTERt, which denote the years immediately
before and after recessions, respectively, in our analyses.
Control Covariates
We also control for a variety of model-, brand-, and competition-related covariates, which
account for alternative explanations and provide an ‘acid’ test for our hypotheses. Model
variables include yearly sales (firms are more likely to redraw models that have low sales),
age, quality reputation and whether a new generation was launched that year. Brand variables
include parent company market share (large firms may have more resources that allow them
to keep models in the market), whether the brand is luxury and from the US, and the range of
engine capacity. Competition variables include the number of models and new generations
3 It was not possible to accurately pinpoint the exact month of the launch for models in earlier years in the observation period (e.g., 1950s). Therefore, our data have been coded yearly. We assumed model launches at the midpoint of the year (July 1st) and have coded the recession-related covariates accordingly. We ran separate estimations for the 1946-1970 period, 1971-2008 (coded monthly), and the entire observation period. Results for these estimations are similar: the significance and directionality of main and interaction effects are the same between the analyses conducted on the separate (earlier vs. later periods) and combined datasets.
Marketing Science Institute Working Paper Series 13
introduced in the market. Finally, we include dummies for each decade, capturing unobserved
factors changing over our long data period. Table 2 summarizes these control variables.
Model-related Covariates
Model-specific sales (SALESit) should matter as high sales indicate an established reputation,
customer base, competitive advantages due to “network externalities, etc. We operationalize
SALESit as the total sales of the model i in year t. To control for the effects of skewness in
distribution and the outliers in the data, we used the natural logarithm of this variable.
The extant literature in organizational ecology posits a U-shaped relation between age
and probability of failure. The “liability of newness” perspective posits that the failure
probability is higher in the initiation, but it declines over time, whereas the “liability of
aging” approach suggests that the risk of failure increases with age. In order to capture this
relation, we first operationalize the age of a model in the market (AGEit) in decimal years4,
following Hannan et al. (1998). To capture the U-shaped relationship between model age and
probability of failure, we also included the quadratic term (AGE2it).
Similar to many other industries, incremental innovations are routinely introduced in
the automotive industry as adaptations of existing models or line extensions, incorporating
new features that offer additional benefits. Therefore, we also account for the effects of
incremental innovations in our study with the dummy variable (NEWGENit) which is coded
as 1 if a new generation of a model i was launched in year t, and 0 otherwise.
Quality ratings provided by third parties affect consumer perceptions of quality and
reputation/status orderings (Chen and Xie 2005; Rhee and Haunschild 2006). Consumer
Reports is a trusted third-party provider of such ratings. Consistent with our rationale for
higher quality of products launched in recessions (H1), Consumer Reports quality ratings
4 When only the year of model launch could be identified, the launch was coded at the midpoint of the year.
Marketing Science Institute Working Paper Series 14

show the worst score for products launched at the end of the boom (73.1/100 compared to
the average of 74.9), followed by products launched at the start of the boom (75.8/100) and
finally products launched during a recession (76.8/100). Each of these differences is
significant at the 5% level in Scheffe (1953), Bonferroni (1936) and Šidàk (1967) tests.
To operationalize our variable (REPUTATIONit) for model i in year t, we use the 5-
point scale “trouble indexes” in Consumer Reports. Specifically, we calculate the mean of
the overall-problem-rate scores of each model for the most recent three years of ownership.
This procedure alleviates potential random errors in the ratings and/or consumer awareness of
them (e.g. a given consumer may look at an older version of Consumer Reports).
Brand-related Covariates
The scope of activities of a brand or a firm (i.e., its niche width) has been regarded as an
important driver of survival. A closely related line of research in organizational ecology
examines whether firms should draw on a wide range of resources (generalists) or focus their
activities (specialists). Niche width theory predicts that specialists perform better in stable
and fine grained environments, while generalists can outlast specialists during long
unfavorable periods (Hannan and Freeman 1977). Following Dobrev, Kim, and Hannan
(2001), we defined technological niche width (RANGEit) as the range of engine capacity in
terms of horsepower across all models produced by each brand at any given point in time (a
realized niche). While specialists offer products with a small range of variation on this
dimension; generalists display a broad range. For example, in 1959 Toyota was a specialist
brand with an engine range of 0 horsepower, since it offered a single model with one type of
engine (Toyota Crown, 1.5L), whereas Dodge in 2008 was a generalist brand in with an
engine range of 452 horsepower.
Marketing Science Institute Working Paper Series 15

We also distinguish between luxury brands and non-luxury brands, as they may be
subject to different demand characteristics (Dhar and Wertenbroch 2000). We use a dummy
variable (LUXURYi) coded as 1 if a model i had a luxury brand and 0 otherwise.
US brands may sometimes benefit from consumer ethnocentrism, but have often
suffered from low quality perceptions. For all intents and purposes, we believe that US
brands should have different survival trajectories than foreign brands. Therefore, we use a
dummy variable (USi) coded as 1 if a model i had a US brand and 0 otherwise.
Market share of the brand’s parent company may help its models survive. Higher
market share is associated with more a) efficient R&D spending due to economies of scale
and ability to leverage the innovations and b) effective advertising due to superior market
penetration and consumer awareness (Srinivasan et al. 2011). Moreover, higher market share
implies higher brand equity, an already established reputation, customer base, or distribution
network, and competitive advantages due to bandwagon effects and network externalities
(Dubé and Manchanda 2005). We operationalize PARENT_SHAREit, as the ratio total unit
sales of the parent company of brand i to the unit sales of all firms in the market in year t.
Competition-related Covariates
Competitive product launch in a particular segment might decrease the survival probability of
other models in that segment. Therefore, we account for the new entrants to the segment with
two dummy variables. First, we use a dummy variable (TOTNEWMODELSit) coded as 1 if a
new model was introduced to the segment of model i in year t. Second, we also account for
the effects of introduction of new generations with the dummy variable TOTNEWGENSij
coded as 1 if a new generation of an existing model was introduced to the segment of model i
in year t. These covariates help us account for the evolution of the competitive forces in the
U.S. market. For instance, new model and generation launches per year increased
dramatically since 1946, which in turn, intensifies the competition in the market.
Marketing Science Institute Working Paper Series 16

RESULTS
Descriptive Statistics
Table 3 and Table 4 present the descriptive statistics for our dataset and the pairwise Pearson
correlations for the key variables, respectively. Of the 1071 models in our dataset, 336 were
launched during a recession period. Median lifespan for models introduced both during and
out of a recession period is 6 years. Annual sales figures of models vary from a low of 3
vehicles (Mohs Ostentatienne in 1968), to approximately 923,000 vehicles (Chevrolet
Styleline in 1949) throughout the observation period.
The highest correlation among variables (=.482) is between the total numbers of new
models (TOTNEWMODELSit) and new generations (TOTNEWGENSij) in the segment of
model i in year t. Both numbers steadily increase during our observation period. Testing for
multicollinearity, we found that the average and maximum Variance Inflation Factor values
are 1.76 and 4.08; both well below the common cutoff value of 10 (Koutsoyiannis 1977).
Nonparametric Analyses of Hazard
Before final model estimation, we obtain key insights with non-parametric hazard functions
that do not account for covariates. First, we present failure probabilities of models launched 1
year before, during, and 1 year after economic recessions. Figure 2 shows the U-shaped
pattern in the hazard rates for all models in our dataset, irrespective of their launch timing.
After a high hazard in the early years, the hazard rate steadily declines till about 35 years
after launch. The hazard rate increases monotonically as model age exceeds 35.
Marketing Science Institute Working Paper Series 17

Directly relevant to our hypotheses, Figure 3 compares the hazard functions of models
launched before, during, and after the recession to other models. First, we find that models
launched 1 year before always have higher hazard rates throughout their lifespan when
compared to the models launched during or after recessions. Besides, as indicated by their
relatively shorter hazard rate curve, they tend to live shorter, too. Second, models launched
during a recession have lower hazard rates than models launched both before and after
recessions, which indicate support for the main premise of the paper. Lastly, our analyses
reveal that models that are launched the year following the end of an economic recession,
maintain lower hazard rates than those launched before a recession.
In sum, the hazard patterns are consistent with our hypotheses. However, these patterns are
virtually unconditional (i.e., they do not account for the effects of any covariates), and
therefore we proceed with the results of the parametric analyses.
Parametric Analyses of Survival
Figure 4 presents the hazard rates based on our parametric analysis (final model with
covariates), showing that models launched during recessions have the lowest hazard rates,
whereas models launched before recessions have the highest hazard rates.
For a straightforward assessment of our hypotheses, Table 5 presents the estimated effects of
covariates on survival (the opposite of hazard). Model fit is significant (χ2 = 423.75; degrees
of freedom = 19, p<0.01), along with the likelihood ratio test for unobserved heterogeneity
(χ2 = 10.48; degrees of freedom = 1, p< 0.01) indicating the need to incorporate the effects of
unobserved heterogeneity in the model. The value of the scale parameter of the log-logistic
distribution (i.e., γ) is 0.141 indicating that the hazard rate increases sharply in the initial
years of the model launch and decreases over time.
Marketing Science Institute Working Paper Series 18
In our first hypothesis, we argued that products launched during a recession have
higher long-term survival chances compared to average new products. The results of our
analysis support this. Models launched during recessions have higher predicted survival times
(β= 0.175, p<0.01) and we see this decline is proportional to the contraction in the GDP, (β=
0.049, p<0.01). Interestingly we see that this effect reverses over time since its quadratic
effect is positive and significant (β= -0.040, p<0.01). This suggests that survival rates are
lower in very deep recessions. Furthermore, a current recession increases model survival (β=
0.131, p<0.01), which suggest that inclement economic conditions strengthen the products
that can survive them. These results suggest that it is a good idea to launch a new product
during all but very severe recessions providing support for hypothesis 1.
In hypothesis 2 we argued that products launched immediately after a recession have
higher survival chances than typical new products. Thus, we expect a negative coefficient for
AFTERit , denoting lower survival likelihood the further after a recession the product is
launched. Our results indicate that expected survival times decrease after a recession (β= -
0.085, p<0.01), therefore, it is better to launch a new product sooner rather than later after the
recession has ended. This result supports our second hypothesis.
In hypothesis 3 we argued that products launched at the end of an economic boom
have lower survival rates than average new products. Indeed, the earlier before a recession a
product is launched, the higher its survival: the coefficient for BEFOREit (β= 0.064, p<0.05)
is positive and significant. We thus find support for our third hypothesis. The year right
before the recession appears especially inappropriate to launch a new product, given the
negative and significant effect of the YEARBEFORE dummy variable (β=-0.087, p<0.05).
Control Variables
Marketing Science Institute Working Paper Series 19

The results for our control variables are in the expected direction. Model-specific
sales, new generation and reputation increase a model’s survival, while model age has a U-
shaped effect: once a model survives the first years, its survival chances improve up to 22
years in the market, after which they decline. Survival chances are improved for models from
brands with broad nice width and from luxury and foreign brands. Finally, both new models
and new generations introduced by competitors, reduce survival chances of the focal model.
Marketing Science Institute Working Paper Series 20

Robustness Checks
We conducted several robustness checks to examine the sensitivity and validity of our
estimations. First, following Aboulnasr and colleagues (2008) and Srinivasan and colleagues
(2009), we analyzed the sensitivity of our results to the censoring date in the sample (2007 in
our case). We estimated our model with three different censoring rates: 1980, 1990 and
2000. The results are consistent with the findings presented in Table 5 indicating that our
findings are robust to censoring date. Second, following Wang and colleagues (2010), we
also estimated our model using three other commonly used baseline distributions: weibull,
log-normal, log-logistic, and generalized gamma distributions. The results of the models with
alternative specifications are consistent with the results presented in Table 5. Third, following
Aboulnasr and colleagues (2008), we examined the robustness of our results to our sample by
bootstrapping analysis with 50 repetitions and we found that the same support for our
hypotheses.
CONCLUSION
Successful new product launch is key to company fortune, and our paper is the first to study
how launch timing in the business cycle affects new product survival. This study thus fills a
gap in research on the impact of recessions on the success of marketing actions, which
focused on advertising, pricing and branding (e.g. Deleersnyder, Dekimpe, Steenkamp and
Leeflang 2009; Srinivasan, Rangaswamy and Lilien 2005; Steenkamp and Fang 2011).
Specifically, we develop a conceptual framework based on multiple demand-side and
supply-side factors to explain how firms can align their new product launch strategies with
economic cycles. We test our hypotheses in the context of the U.S. automotive industry using
data on all of the 1071 models launched between 1945 and 2008. Our 64-year observation
period covers all of the post-World War II economic recessions in the U.S. economy, with
varying durations and levels of contractions, which allows us a more rigorous and precise
Marketing Science Institute Working Paper Series 21

analysis of the link between new product launches and contractions. In that, we respond to
calls by Srinivasan and colleagues (2011) to account for severity of recessions in the
analyses. Moreover, we incorporate a rich set of model-related, brand-related, and
competition-related factors into our estimations in order to more precisely understand the
performance implications of product launches during recessions.
Our results demonstrate three important points. First, we find that models launched
during an economic recession have higher chances of long-term survival than the average
product launched. Second, we find that if a company is going to launch a new model post-
recession, it is better to launch immediately after the recession rather than wait as the longer
after the recession you launch, the lower the chances of survival. Finally, survival chances are
slim for products launched when a recession is imminent. These results extend the previous
studies in several important ways and also entail various managerial implications.
Theoretical Implications
The extant marketing literature has recently started to examine how recessions affect firm
decisions and customer response regarding advertising, R&D, prices and branding (e.g.
Deleersnyder, Dekimpe, Steenkamp and Leeflang 2009; Srinivasan, Rangaswamy and Lilien
2005; Steenkamp and Fang 2011). Our results, for the most part, corroborate the findings of
those studies that countercyclical marketing investments may yield better outcomes than
procyclical activities. However, we also examine and find boundary conditions to this
countercyclical spending advice. The relations between new product survival chances and the
severity of the recession is inverted-U shaped, implying that severe recessions are typically
not the time to launch new products. Moreover, our study of a microlevel phenomenon
(product launch) complements previous studies analyzing aggregate macrolevel measures
(e.g., R&D expenditure); a research stream void noted by Steenkamp and Fang (2011).
Marketing Science Institute Working Paper Series 22

Research on economic cycles has shown that business activities in general, and new
product introductions, in particular, vary systematically with the cyclical movement of the
economy (Devinney 1990). As such, several studies argued that the use of counter-cyclical
strategies for various marketing activities might be very beneficial for firms. For instance, the
findings of Steenkamp and Fang (2011), and Srinivasan and colleagues (2005, 2011) suggest
that investments in R&D and advertising during contractions have stronger effects on market
share and profit than during expansions. Our findings advance this research stream by
showing that the performance implications of pro- or countercyclical marketing activities
might also differ with their temporal sequences vis-à-vis recessions. Specifically, we find that
launching a model before a recession has different performance implications than launching a
model after recession.
Managerial implications
In this study, we demonstrate that proactive marketing in a recession leads to improved
business performance. This suggests that instead of cutting back on new product launches
during recession, firms should continue (and perhaps even increase) new product activity.
Our finding goes against the common wisdom of many companies that cut back on product
launches during recessions in the hope that they can outpace their rivals in boom times. For
instance, Sony cut R&D spending by 12% during the 2000 downturn, and then tried to regain
momentum by developing and launching new products during the boom. However, Sony’s
new electronic book readers, game consoles and organic light-emitting diode TVs, found
themselves bested by Amazon, Microsoft and Nintendo, and Samsung, respectively (Gulati et
al. 2010). In contrast, a minority of companies follows the recession strategy of judiciously
increasing spending on R&D and marketing during the recession, which may produce only
modest gains in the short run, but substantial gains in the long run (ibid).
Marketing Science Institute Working Paper Series 23

The severity of the recession does present a boundary condition to this advice. We
find that product survival chances are substantially lower when it is launched in a severe
recession. We believe this nuanced advice is actionable to some extent, as managers going
through a recession typically can tell the difference between a mild and a severe recession
(BPI 2009). For instance, the 1969-70 recession was mild and expected after a lengthy
economic expansion during 1960s. In contrast, the 1973-75 recession was severe, fuelled by
high government (war) spending, high inflation rates, along with the general wage and price
control policies implemented in 1971 to mask inflationary pressures. This implies that
managers should carefully monitor the macro-level activity and integrate its existing and
prospective conditions into their marketing strategies in general and new product launch
strategies, in particular. Interest rates, oil prices, inflation, rising bankruptcies, consumer
spending, treasury spread, and yield curve might be used as telltale indicators of an imminent
recession and its depth. When these indicators start to presage a downturn, our results imply
that managers should carefully consider which new development projects are likely to be
relevant to consumers in the upcoming recession, and should suspend product launches until
the recession starts. This will help companies to act countercyclical to the recessions. That is,
managers should regard recessions as opportunities to bolster their businesses and to overtake
their weaker competitors, so they should refrain from cutting investments aggressively.
Reduced competitive activity during a recession will provide opportunities to have
more impactful product launches through the reduced ability of competitors to respond to
product launches and also the reduction in media costs allowing companies to get greater
return for their advertising expenditures. Moreover, firms that intensify their R&D activities,
prepare a new product pipeline, and update their product mix prior to the beginning of an
economic recovery can enjoy first mover advantage via meeting the increased demand with
the state-of-the-art products, features, and styles as consumer spending starts to increase.
Marketing Science Institute Working Paper Series 24

In a similar vein, companies should try to launch new products right after the
recession when the economic indicators augur a recovery beating the competition to the
punch. At the beginning of an economic recovery, firms resume producing higher degrees of
output than they did during the recession (Francois and Lloyd-Ellis 2003) and in addition
firms also engage in greater promotion and advertising efforts, start introducing new products
in order to get a bigger share of the pent-up consumer demand. As such, firms should focus
on beating the competition to launch in the window immediately after the recession when
advantages of launch can still be found. The longer the firm waits, the more clutter exists in
the market and the more challenging it becomes for firms to make successful product
launches.
LIMITATIONS AND FUTURE RESEARCH
Our research has several limitations that offer interesting opportunities for further research. In
this study we focused on product innovations, not process innovations. Managers are forced
to cut discretionary spending and improve efficiency of their firms. They also become more
risk averse while making business decisions. Product development projects are, by their very
nature, more costly and risky, and hence managers can be more inclined to scale back on
product development. Process innovations, on the other hand, are not only less costly and
risky, but also help firms decrease operational costs through increased efficiency. Therefore,
in the time of economic downturns, firms may focus on process innovations while
suspending, albeit until the end of recession, product innovations. Needless to say, firms will
exhibit different behaviors in their reallocation of resources from the former to the latter.
Therefore, future research could attempt to investigate resource allocation patterns
throughout economic cycles and their performance implications.
In order to increase the temporal span of our analyses, we study a single industry of a
relatively unique durable consumer product. Future research may examine whether the
Marketing Science Institute Working Paper Series 25

findings of this study are applicable, and if so to what extent, to other types of products and
services. Especially promising is the analysis of low involvement products like consumer
packaged goods (CPGs). While we observe around 30 new product launches yearly in the
U.S. automotive industry, thousands of new CPGs are launched every year. Similar to our
results, Lamey and colleagues (2007) report that sales of private-label CPGs exhibit
countercyclical patterns. Future studies may advance research on CPGs with regard to new
product introductions and economic cycles. Alternatively, the link between product
innovations and economic cycles may also be analyzed in the context of products of a more
complex nature or credence products, which will improve the external validity and
generalizations of the results.
Expanding the geographical coverage to include multiple countries can yield valuable
insights as well. Deleersnyder and colleagues (2009) report that elasticity of advertising
spending to business cycles systematically vary by national culture. In a similar vein,
sensitivity of innovative activity to economic expansions and downturns might also be
moderated by cultural factors. Innovative activities inherently involve risk and people in
high-uncertainty-avoidance cultures place more emphasis on reduction, and avoidance if
possible, of risk compared to people in low-uncertainty avoidance-cultures. Future research
might examine how such traits are reflected in the production and consumption of
innovations throughout the economic cycles. Manager- and consumer-based perceptual
measures would be interesting in this regard. This would allow the discernment of the
dynamics of innovative activity and macroeconomic fluctuations in a global environment,
and may provide mediation between new product strategies and market based performance.
In addition to cultural dimensions, socio-economic factors need to be taken into consideration
when developing marketing strategies with regard to economic cycles.
Marketing Science Institute Working Paper Series 26

Also, additional specifications of the model could provide further revelations. Future
research may incorporate other constructs and factors like organizational resources, core
competencies, strategic intent, and organizational culture. Incorporating cognitive factors
such as risk aversion and long-term orientation of the management might provide invaluable
insights both for the drivers and outcomes of sensitivity of product innovations to economic
recessions.
Its limitations notwithstanding, we believe this study provides an interesting and
relevant explanation about the performance implications of product launch with regard to
economic recessions. Specifically we show that 1) a countercyclical product launch strategy
may be valuable as product launched during recessions have high long-term survival chances,
2) there is an inverted-U shaped relationship between the severity of the recession and the
survival chances of a product launched during a recession, and 3) launching a product right
after a recession, rather than stalling a launch to wait for the economy recovery to ramp up,
significantly decreases the failure likelihood. We hope that the findings of this study will
stimulate further research in this important area study as managers continue to look for ways
to develop and execute recession-proof product strategies, and manage portfolios in the
global marketplace.
Marketing Science Institute Working Paper Series 27

REFERENCES
Aboulnasr, K., O. Narasimhan, E. Blair, and R. Chandy (2008), "Competitive Response to Radical Product Innovations," Journal of Marketing, 72 (3), 94-110.
Andras, Trina Larsen and Srini S. Srinivasan (2003), “Advertising Intensity and R&D
Intensity: Differences Across Industries and their Impact on Firm’s Performance”, International Journal of Business and Economics, 2 (August), 167-176.
Anonymous (2009), “Most UK Finance Directors Support Greater Marketing Investment
during a Recession,” (accessed 24th March, 2010) [available at http://www.utalkmarketing.com/Pages/Article.aspx?ArticleID=13406].
Barnett, W.P. and M.T. Hansen (1996), "The Red Queen in Organizational Evolution,"
Strategic Management Journal, 17 (S1), 139-57. Barwise, Patrick and Alan Styler (2002), Marketing Expenditure Trends, London: UK,
London Business School / Havas Marketing Report. Bollerslev, Tim, Michael Gibson, and Hao Zhou (2011), “Dynamic Estimation of Volatility
Risk Premia and Investor Risk Aversion from Option Implied and Realized Volatilities,” Journal of Econometrics, 160(1) 235–245.
Bonferroni CE (1936). Teoria statistica delle classi e calcolo delle probabilit. Pubblicazioni
del R Istituto Superiore di Scienze Economiche e Commerciali di Firenze, 8:3-62. Boulding, W. and R. Staelin (1995), “Identifying Generalizable Effects of Strategic Actions
on Firm Performance: The Case of Demand-Side Returns to R&D Spending,” Marketing Science, 14(3, supplement), G222-G236.
BPI (2009), Managers coping with the recession, BPI International Management Study
Carried out by BVA, January, accessed March 30, 2012 at: www.bpi-group.com/publications/pdf/enquete0902/SyntheseGB.pdf
Carroll, G.R. and A.C. Teo (1996), "Creative Self-Destruction among Organizations: an
Empirical Study of Technical Innovation and Organizational Failure in the American Automobile Industry, 1885-1981," Industrial and Corporate Change, 5 (2), 619-44.
Chen, Y. and J. Xie (2005), "Third-Party Product Review and Firm Marketing Strategy,"
Marketing Science, 218-40.
Cook, Steven (1999), “Cyclicality and Durability: Evidence from US Consumers’ Expenditure,” Journal of Applied Economics, 2 (2), 299-310.
Cooper, Robert G. (1983), “The Impact of New Product Strategies,” Industrial Marketing
Management, 12, 243-256. ---- (1986), “New Product Performance and Product Innovation Strategies,”
Research Management, May / June, 17-25.
Marketing Science Institute Working Paper Series 28

---- and Elko J. Kleinschmidt (1987), “Success Factors in Product Innovation,” Industrial Marketing Management, 16, 215-223.
---- and ---- (1993), “Uncovering the Keys to New Product Success,” Engineering Management Review, 11, 5-18. ---- and ---- (1996), “Winning Businesses in Product Development: the Critical Success Factors,” Research Technology Management, 39, 18-29.
Covello, M. (2002), Standard Catalog of Imported Cars: 1946-2002. Madison, WI: Krause
Publications. Crawford, C. Merle (1977), “Marketing Research and the New Product Failure Rate,”
Journal of Marketing, 2(2), 51-61. Deleersynder, Barbara, Marnik G. Dekimpe, Miklos Sarvary and Philip M. Parker (2004),
“Weathering Tight Economic Times: The Sales Evolution of Consumer Durables Over the Business Cycle,” Quantitative Marketing and Economics, 2, 347-383.
Deleersnyder, Barbara, Marnik G. Dekimpe, Jan-Benedict E.M. Steenkamp and Peter S.H.
Leeflang (2009), “The Role of National Culture in Advertising’s Sensitivity to Business Cycles: An Investigation Across Continents,” Journal of Marketing Research, 46 (October), 623-636.
Devinney, Timothy M. (1990), “New Products Over the Business Cycle,” Journal of Product Innovation Management, 7, 261-273.
Dhar, R and K Wertenbroch (2000), "Consumer Choice between Hedonic and Utilitarian
Goods," Journal of Marketing Research, 37 (1), 60-71 Di Benedetto, C. Anthony (1999), “Identifying the Key Success Factors in New Product
Launch,” Journal of Product Innovation Management, 16, 530–544. Dobrev, S.D., T.Y. Kim, and M.T. Hannan (2001), "Dynamics of Niche Width and Resource
Partitioning," The American Journal of Sociology, 106 (5), 1299-337. Droge, Cornelia, Roger J. Calantone and Nukhet Harmancioglu (2008), “New Product
Success: Is it Really Controllable by Managers in Highly Turbulent Environments?”, Journal of Product Innovation Management, 25 (3), 272-286.
Dubé, Jean-Pierre and Puneet Manchanda (2005), "Differences in Dynamic Brand Competition Across Markets: An Empirical Analysis," Marketing Science, 24 (1), 81-95.
Emery, Kenneth M. and Evan F. Koenig (1992), “Forecasting Turning Points: Is a Two-State
Characterization of the Business Cycle Appropriate?,” Economic Letters, 39 (4), 431- 435.
Financial Times (2012), The Future of the Car, Special Report, Tuesday March 6, p.1
Marketing Science Institute Working Paper Series 29

Flammang, J.M. and R. Kowalke (1999), Standard Catalog of American Cars, 1976-1999. Krause Publications.
Flatters, P. and M. Willmott (2009), "Understanding the Post-Recession Consumer," Harvard
Business Review, 87 (7/8), 106-12.. Francois, P. and H. Lloyd-Ellis (2003), “Animal Spirits through Creative Destruction,”
American Economic Review, 93(3), 530-550. Georgano, GN and T.R. Andersen (1982), The New Encyclopedia of Motorcars, 1885 to the
Present.EP Dutton. Gulati, Ranjay, Nitin Nohria and Franz Wohlgezogen (2010), “Roaring out of Recession”,
Harvard Business Review, 88 (3), March, 62-69. Gunnell, J., D. Schrimpf, and K. Buttolph (1982), Standard Catalog of American Cars, 1946-
1975. Krause Publications. Hannan, M.T. and J. Freeman (1977), "The Population Ecology of Organizations," The
American Journal of Sociology, 82 (5), 929-64. Hannan, M.T., G.R. Carroll, S.D. Dobrev, and J. Han (1998), "Organizational Mortality in
European and American Automobile industries Part I: Revisiting the Effects of Age and Size," European Sociological Review, 14 (3), 279.
Harvey, Michael G., and David A. Griffith (2007), “The Role of Globalization, Time
Acceleration, and Virtual Global Teams in Fostering Successful Global Product Launches,” Journal of Product Innovation Management,” 24, 486-501.
Helsen, K. and D.C. Schmittlein (1993), "Analyzing Duration Times in Marketing: Evidence
for the Effectiveness of Hazard Rate Models," Marketing Science, 12 (4), 395-414. Henard, David H. and David M. Szymanski (2001), “Why Some New Products Are More
Successful Than Others,” Journal of Marketing Research, 38(August), 362-375. Hollis, Nigel (2009), “Marketing during Recession: Planning on Recovery,” (accessed 7th
June 2011) [available at http://www.millwardbrown.com/Libraries/MB_POV_Downl oads/MillwardBrown_POV_MarketingDuringRecession.sflb.ashx]
Hurd, M.D., J.P. Smith, and J.M. Zissimopoulos (2004), "The Effects of Subjective Survival
on Retirement and Social Security Claiming," Journal of Applied Econometrics, 19 (6), 761-75.
Kafouros, M. I. (2008), Industrial innovation and firm performance: The impact of scientific knowledge on multinational corporations. Cheltenham: Edward Elgar. Karapetis, C.S., S. Khambata-Ford, D.J. Jonker, C.J. O'Callaghan, D. Tu, N.C. Tebbutt, R.J.
Simes, H. Chalchal, J.D. Shapiro, and S. Robitaille (2008), "K-ras Mutations and Benefit from Cetuximab in Advanced Colorectal Cancer," New England Journal of Medicine, 359 (17), 1757-65.
Marketing Science Institute Working Paper Series 30

Koutsoyiannis, A. (1977), Theory of Econometrics. Second edition, MacMillan, London. Lamey, Lien, Barbara Deleersnyder, Marnik G. Dekimpe and Jan-Benedict E.M. Steenkamp
(2007), “How Business Cycles Contribute to Private-Label Success: Evidence from the United States and Europe”, Journal of Marketing, 71 (1), 1-15.
Leonhardt, David (2011), “We’re Spent”, New York Times blog, July 16, accessed August27th http://www.nytimes.com/2011/07/17/sunday-review/17economic.html?pagewanted=all
Pauwels, Koen, Jorge Silva-Risso, Shuba Srinivasan and Dominque M. Hanssens (2004),
"New Products, Sales Promotions and Firm Value: The Case of the Automobile Industry", Journal of Marketing, 68 (October), 142-156.
Petersen, Bruce and Steven Strongin (1996), “Why are Some Industries More Cyclical than
Others?”, Journal of Business and Economic Statistics, 14 (2), 189-198. Pudles, Gary (2006), “How to Manage Through a Downturn. The First Step is to
Acknowledge it when Sales Shrink. The Second is to Make the Tough Calls on where to Cut”, Inc5000, accessed May 24, 2012 at http://www.inc.com/inc5000/articles/20061101/pudles.html
Ravenscraft, D. and F. M. Scherer (1982), “The Lag Structure of Returns to Research and
Development,” Applied Economics, 14 (6), 603-620.
Rhee, M. and P.R. Haunschild (2006), "The liability of good reputation: A study of product recalls in the US automobile industry," Organization Science, 17 (1), 101.
Roberts, Keith (2003), "What strategic investments should you make during a recession to
gain competitive advantage in the recovery?", Strategy & Leadership, 31 (4), 31 – 39 Scheffe, H. (1953), “A Method for Judging All Contrasts in the analysis of Variance,”
Biometrika 40: 87-104.
Sichel, Daniel E. (1993), “Business Cycle Asymmetry: A Deeper Look,” Economic Inquiry, 31 (2), 224-236.
Šidàk, Z. (1967). Rectangular confidence region for the means of multivariate normal
distributions. Journal of the American Statistical Association, 62, 626–633. Srinivasan, Raji, Gary L. Lilien, and Arvind Rangaswamy (2004), "First in, first out? The
effects of network externalities on pioneer survival," Journal of Marketing, 68 (1), 41-58.
----, ---- and Shrihari Sridhar (2011), “Should Firms Spend More on R&D and Advertising
during Recessions?,” Journal of Marketing, 75 (3), 49-65. ----, Arvind Rangaswamy and Gary L. Lilien (2005), “Turning Adversity into
Advantage: Does Proactive Marketing During a Recession Pay Off?”, International Journal of Research in Marketing, 22, 109-125.
Marketing Science Institute Working Paper Series 31

Srinivasan, Shuba, Koen Pauwels, Jorge Silva-Risso and Dominique M. Hanssens (2009),
“Product Innovations, Advertising and Stock Returns,” Journal of Marketing, 73(1), 24-43.
Steenkamp, Jan-Benedict E. M. and Eric (Er) Fang (2011), “The Impact of Economic
Contractions on the Effectiveness of R&D and Advertising: Evidence from U.S. Companies Spanning Three Decades,” Marketing Science, 30 (4), 628-645.
Tabrizi, B. and S. Chaudhuri (1999), “Capturing the Real Value in High-Tech Acquisitions,”
Harvard Business Review, 77(5), 123-130. Talay, M. Berk, Steven H. Seggie and Erin Cavusgil (2009), “Exploring Correlates of
Product Launch in Collaborative Ventures: An Empirical Investigation of Pharmaceutical Alliances”, Journal of Product and Innovation Management, 26 (4), 360-370.
Tellis, Gerard J. and Kethan Tellis (2009), “A Critical Review and Synthesis of Research on
Advertising in a Recession”, MSI Reports. Wang, Qi, Yubo Chen, and Jinhong Xie (2010), “Survival in Markets with Network Effects:
Product Compatibility and Order-of-Entry Effects,” Journal of Marketing, 74 (July), 1-14
Zarnowitz, Victor (1985), “Recent Work on Business Cycles in Historical Perspectives: A
Review of Theories and Evidence,” Journal of Economic Literature, 23 (June), 523-580.
Marketing Science Institute Working Paper Series 32

Figure 1: Distribution of car model life span in years
020
4060
8010
012
014
0
Freq
uenc
y
0 10 20 30 40 50 60Lifespan
Marketing Science Institute Working Paper Series 33

Figure 2: Smoothed Hazard Estimates for All Models in the Observation Period
.04
.06
.08
.1.1
2
0 20 40 60analysis time
Smoothed hazard estimate
Marketing Science Institute Working Paper Series 34
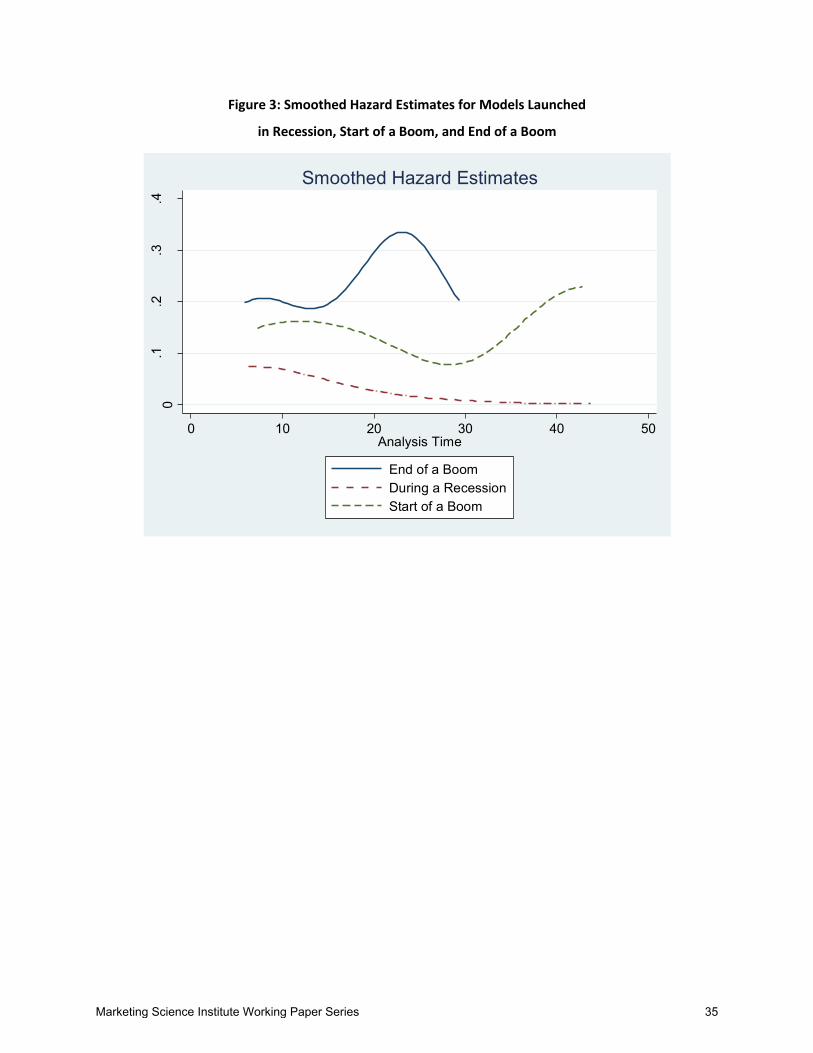
Figure 3: Smoothed Hazard Estimates for Models Launched
in Recession, Start of a Boom, and End of a Boom
0.1
.2.3
.4
0 10 20 30 40 50Analysis Time
End of a BoomDuring a RecessionStart of a Boom
Smoothed Hazard Estimates
Marketing Science Institute Working Paper Series 35

Figure 4: Estimated Log-logistic Hazard Function
0
.05
.1.1
5.2
h(t)
0 20 40 60Analysis Time
During a RecesisonEnd of a Boom
Start of a Boom
Estimated Log-logistic Hazard Function
Marketing Science Institute Working Paper Series 36

TABLE 1 DISTRIBUTION OF CAR MODEL LIFESPAN (FROM LAUNCH TILL WITHDRAWAL)
Number of models Percentage
Lifespan ≤ 2 years 159 17.5
2 years <Lifespan ≤ 5 years 339 37.3
6 years ≤Lifespan ≤ 10 years 249 27.4
Lifespan >10 years 163 17.9
TOTAL 910 100
Marketing Science Institute Working Paper Series 37

TABLE 2
CONTROL VARIABLES IN THE MODEL
Variable Definition
Model-Related Covariates
SALESit : Total sales of model i in year t
AGEit : Difference between time t and the year model launched
NEWGENit : 1 if a new generation of model i was launched in year t and 0 otherwise
REPUTATIONit : 5 point scale trouble indexes from Consumer Reports
Brand-Related Covariates
RANGEit : Range of engine capacity in terms of horsepower
LUXURYi : Coded as 1 if a model i is a luxury brand and 0 otherwise.
USi : Coded as 1 if a model i is a US-brand and 0 otherwise
PARENT_SHAREit : Ratio total unit sales of the parent company of brand i to the unit sales of all firms in the market in year t.
Competition-Related Covariates
TOTNEWMODELSit : Coded 1 if a new model was introduced to the segment of model i in year t and 0 otherwise.
TOTNEWGENSit : Coded 1 if a new generation of an existing model was introduced to the segment of model i in year t.
Decade dummies : Starting with 1946, each decade is represented with a dummy variable.
Marketing Science Institute Working Paper Series 38

TABLE 3
Descriptive Statistics
Models Launched During Non-Recession Periods (N=735)
Models Launched During Recession Periods (N=336)
Variable Mean Standard Deviation
Minimum Maximum Mean Standard Deviation
Minimum Maximum
1 BEFOREit 0.40 1.29 0.00 8.15
0.47 1.74 -0.96 10.15
2 DURING-MAGit 0.00 0.00 0.00 0.00
100.79 1.23 100.00 104.10
3 AFTERit 0.43 1.37 0.00 9.75
0.16 0.92 0.00 9.75
4 RECESSIONt 0.27 0.44 0.00 1.00
0.36 0.48 0.00 1.00
5 YEARBEFOREt 0.16 0.37 0.00 1.00
0.11 0.31 0.00 1.00
6 YEARAFTERt 0.15 0.36 0.00 1.00
0.18 0.39 0.00 1.00
7 SALESit 10.08 1.96 1.10 13.57
10.03 2.04 0.00 13.74
8 AGEit 8.25 8.66 1.00 51.00
7.61 8.09 1.00 56.00
9 NEWGENit 0.09 0.29 0.00 1.00
0.09 0.28 0.00 1.00
10 REPUTATIONit 65.87 14.31 23.53 100.00
65.68 13.99 31.25 100.00
11 RANGEit 89.54 87.99 0.00 762.00
86.31 82.64 0.00 762.00
12 LUXURYi 0.29 0.45 0.00 1.00
0.33 0.47 0.00 1.00
13 USi 0.52 0.50 0.00 1.00
0.48 0.50 0.00 1.00
14 PARENT_SHAREit 0.18 0.17 0.01 0.34
0.18 0.17 0.11 0.34
15 TOTNEWMODELSit 2.36 2.72 0.00 24.00
2.49 2.56 0.00 15.00
16 TOTNEWGENSij 4.28 3.51 0.00 24.00
4.33 3.53 0.00 20.00
Marketing Science Institute Working Paper Series 39
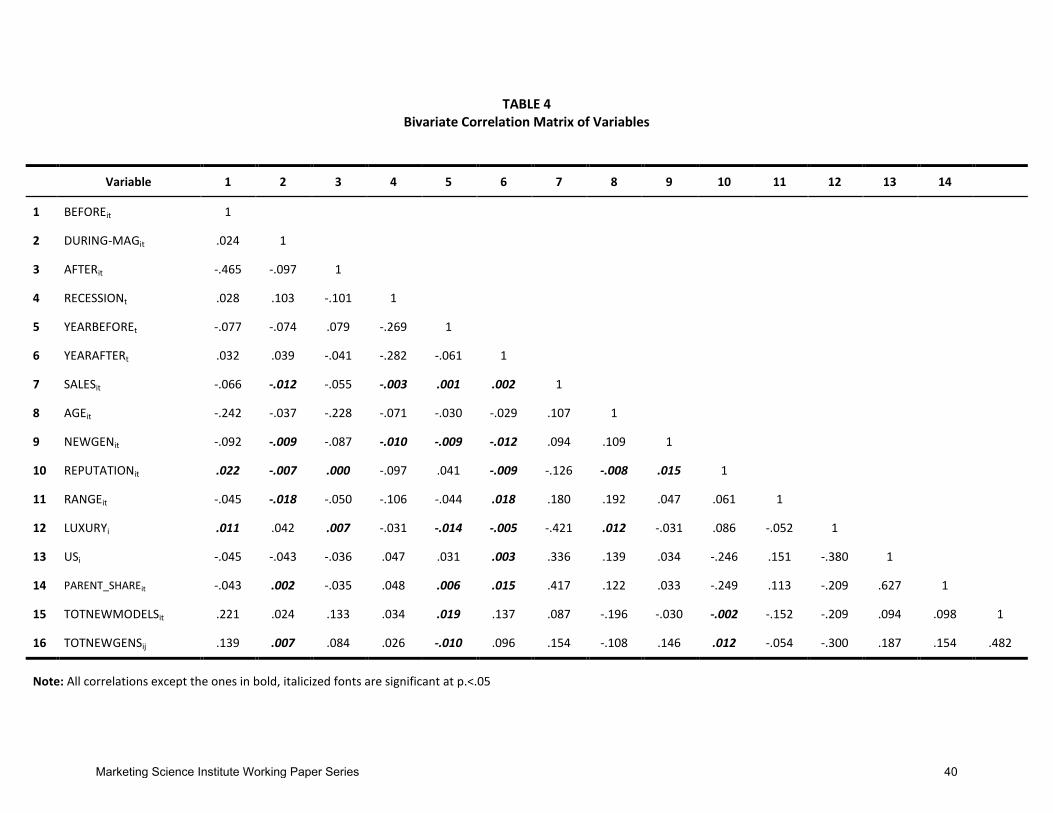
TABLE 4 Bivariate Correlation Matrix of Variables
Variable 1 2 3 4 5 6 7 8 9 10 11 12 13 14
1 BEFOREit 1
2 DURING-MAGit .024 1
3 AFTERit -.465 -.097 1
4 RECESSIONt .028 .103 -.101 1
5 YEARBEFOREt -.077 -.074 .079 -.269 1
6 YEARAFTERt .032 .039 -.041 -.282 -.061 1
7 SALESit -.066 -.012 -.055 -.003 .001 .002 1
8 AGEit -.242 -.037 -.228 -.071 -.030 -.029 .107 1
9 NEWGENit -.092 -.009 -.087 -.010 -.009 -.012 .094 .109 1
10 REPUTATIONit .022 -.007 .000 -.097 .041 -.009 -.126 -.008 .015 1
11 RANGEit -.045 -.018 -.050 -.106 -.044 .018 .180 .192 .047 .061 1
12 LUXURYi .011 .042 .007 -.031 -.014 -.005 -.421 .012 -.031 .086 -.052 1
13 USi -.045 -.043 -.036 .047 .031 .003 .336 .139 .034 -.246 .151 -.380 1
14 PARENT_SHAREit -.043 .002 -.035 .048 .006 .015 .417 .122 .033 -.249 .113 -.209 .627 1
15 TOTNEWMODELSit .221 .024 .133 .034 .019 .137 .087 -.196 -.030 -.002 -.152 -.209 .094 .098 1
16 TOTNEWGENSij .139 .007 .084 .026 -.010 .096 .154 -.108 .146 .012 -.054 -.300 .187 .154 .482
Note: All correlations except the ones in bold, italicized fonts are significant at p.<.05
Marketing Science Institute Working Paper Series 40

TABLE 5 New Product Launches and Economic Recessions: Estimation of the Survival Rates
Variables Coefficient Standard Error
z P > |z|
Recession-Related Covariates
BEFOREit 0.064 ** 0.030 2.12 0.034 DURINGit 0.175 *** 0.067 2.62 0.009 DURING-MAGit 0.049 *** 0.019 2.57 0.010 DURING-MAG^2it -0.040 *** 0.010 -4.00 0.000 AFTERit -0.085 *** 0.012 -7.22 0.000 RECESSIONt 0.131 ** 0.060 2.19 0.028 YEARBEFOREt -0.087 *** 0.032 -2.69 0.007 YEARAFTERt -0.037 0.033 -1.15 0.250
Model-Related Covariates
SALESit 0.095 *** 0.018 5.12 0.000 AGEit 0.130 *** 0.008 15.25 0.000 AGE^2it -0.003 *** 0.001 -3.10 0.002 NEWGENit 0.296 *** 0.080 3.72 0.000 REPUTATIONit 0.003 *** 0.001 3.17 0.002
Brand-Related Covariates
RANGEit 0.001 *** 0.000 2.71 0.007 LUXURYi 0.128 *** 0.044 2.94 0.003 USi -0.156 *** 0.044 -3.51 0.000 PARENT_SHAREit 0.124 0.148 0.84 0.400
Competition-Related Covariates
TOTNEWMODELSit -0.020 *** 0.008 -2.57 0.010 TOTNEWGENSij -0.012 ** 0.006 -2.11 0.034 Unobserved heterogeneity Inverse Gaussian Θ 0.430 0.372 Likelihood-ratio test of Θ = 0 10.48 ***
Log-likelihood value -334.446
γ 0.141 0.027 Wald χ
2 statistic 423.75
Prob >χ2 0.000
Notes: ***, **, * indicate a significance level of < 0.01, < 0.05 and <0.10, respectively
Marketing Science Institute Working Paper Series 41